retention heterogeneity in new york city schoolsal3045/retention_draft.pdf · retention...
TRANSCRIPT

Retention Heterogeneity in New York City Schools∗
Douglas Almond†, Ajin Lee,‡ and Amy Ellen Schwartz§
This version: November 2016
Abstract
Performance on proficiency exams can be a key determinant of whether studentsare retained or “held back” in their grade. In New York City, passing the statewideproficiency exam essentially guarantees promotion, while roughly 13% of those studentswho fail the exam are retained. Using regression discontinuity methods, we find thatfemale students are 25% more likely to be retained in their grade due to exam failurethan boys. Hispanic students are 60% more likely and Black students 120% more likelyto be retained due to exam failure (relative to White students). Poverty and previouspoor performance also increase the likelihood of retention, while being young for gradeor short does not. We conclude that “patterned discretion” exists in how standardizedtest results are utilized.
∗We thank the New York City Department of Education and Office of School Wellness Programs forproviding the microdata. Financial support from the National Institutes of Health, Award #5 R01 HD070739(Schwartz) and the National Science Foundation CAREER Award #SES-0847329 is gratefully acknowledged(Almond). We are grateful to Siddhartha Aneja and Meryle Weinstein for assistance with the data.†Columbia University and NBER: [email protected]‡Columbia University: [email protected]§Maxwell School of Syracuse University: [email protected]
1
1 Introduction
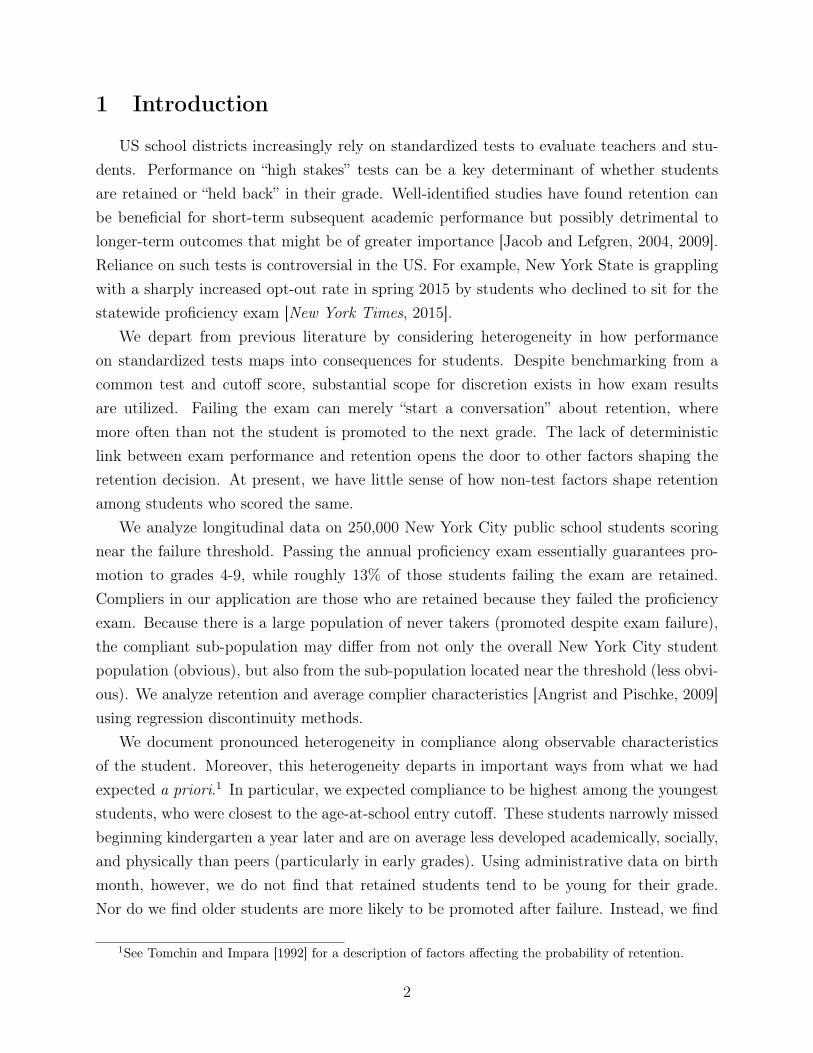
US school districts increasingly rely on standardized tests to evaluate teachers and stu-dents. Performance on “high stakes” tests can be a key determinant of whether studentsare retained or “held back” in their grade. Well-identified studies have found retention canbe beneficial for short-term subsequent academic performance but possibly detrimental tolonger-term outcomes that might be of greater importance [Jacob and Lefgren, 2004, 2009].Reliance on such tests is controversial in the US. For example, New York State is grapplingwith a sharply increased opt-out rate in spring 2015 by students who declined to sit for thestatewide proficiency exam [New York Times, 2015].
We depart from previous literature by considering heterogeneity in how performanceon standardized tests maps into consequences for students. Despite benchmarking from acommon test and cutoff score, substantial scope for discretion exists in how exam resultsare utilized. Failing the exam can merely “start a conversation” about retention, wheremore often than not the student is promoted to the next grade. The lack of deterministiclink between exam performance and retention opens the door to other factors shaping theretention decision. At present, we have little sense of how non-test factors shape retentionamong students who scored the same.
We analyze longitudinal data on 250,000 New York City public school students scoringnear the failure threshold. Passing the annual proficiency exam essentially guarantees pro-motion to grades 4-9, while roughly 13% of those students failing the exam are retained.Compliers in our application are those who are retained because they failed the proficiencyexam. Because there is a large population of never takers (promoted despite exam failure),the compliant sub-population may differ from not only the overall New York City studentpopulation (obvious), but also from the sub-population located near the threshold (less obvi-ous). We analyze retention and average complier characteristics [Angrist and Pischke, 2009]using regression discontinuity methods.
We document pronounced heterogeneity in compliance along observable characteristicsof the student. Moreover, this heterogeneity departs in important ways from what we hadexpected a priori.1 In particular, we expected compliance to be highest among the youngeststudents, who were closest to the age-at-school entry cutoff. These students narrowly missedbeginning kindergarten a year later and are on average less developed academically, socially,and physically than peers (particularly in early grades). Using administrative data on birthmonth, however, we do not find that retained students tend to be young for their grade.Nor do we find older students are more likely to be promoted after failure. Instead, we find
1See Tomchin and Impara [1992] for a description of factors affecting the probability of retention.
2

race and gender to be important. Hispanic students are 60% more likely and Black students120% more likely to be retained due to exam failure (relative to White students). Femalestudents are 25% more likely to be retained in their grade due to exam failure than boys.2
Poverty (free or reduced-price lunch eligibility3) and poor performance on previous examsalso increase the likelihood of retention. Like age for grade, biometric measures of studentheight and weight do not seem to play a large role beyond the exam score. Again, we hadexpected smaller-stature students might face a higher retention risk when they fail becausethey might “fit in” physically in their repeated grade. We also show these biometric anddemographic characteristics are smooth at the threshold. Thus it is not the case that, forexample, Black students have discontinuously worse characteristics just below the thresholdfor passing. Nor do we find any evidence of heaping near the threshold.
We discuss two classes of “explanations” for the retention heterogeneity we uncover:student-level differences and school-level differences. Regarding the former, it is not thecase that the predictive power of the baseline test score is different for girls or minoritiesthan for the rest of the student population (located near the failure threshold). Thus, we donot see evidence that, for example, girls are more likely to be retained when they fail becausefailure is a stronger predictor of future (poor) performance. On average, girls perform betterin subsequent periods than boys with identical baseline scores. Other factors equal, thiswould suggest that the compliance rate among girls should be lower than for boys. Highercompliance of girls’ retention with exam failure is puzzling. The unexplained gender gap iswidest among Whites: failing increases a girl’s retention rate to 5.9%, but when a White boyfails, only 0.9% are retained. Indeed, we cannot reject that exam failure has zero impact onretention for non-Hispanic White boys.
Turning to school-level characteristics, these are “balanced” by sex so disproportionateretention of girls who fail cannot be attributed to differential exposure to school charac-teristics. Race and ethnicity, in contrast, do vary with school-level characteristics. Amongthese school-level factors, “high retention” schools have more minority students on average.Furthermore, predominantly Black schools tend to be high compliance schools, i.e. schoolswhere retention rates jump more below the failure threshold. While school-level factorsthus appear important to racial heterogeneity in retention, so too do within-school factors.Blacks are substantially more likely to be retained than Whites (for identical baseline scores)at predominantly non-Black schools.
The existing literature has overlooked compliance heterogeneity: we know of no published
2Significant at the 1% level: see Section 5 and footnote 7.3Students are eligible for free lunch if their parents or guardians make less than 130% of the poverty line
and reduced lunch if their parents/guardians make less than 185% of the poverty line.
3

work on the subject.4 In addition to student composition of schools, we also consider faculty[Dee, 2005]. The final retention decision is made by the school principal. We find a strikingpattern whereby girls are substantially more likely to be retained due to exam failure atschools with a female principal. That said, because other (unobserved) characteristics of theschool presumably vary by principal’s characteristics (cf. student gender), we characterizethis pattern as descriptive. Furthermore, because girls perform better on average than boys,the unconditional retention rates remain lower for girls than boys: girls score better onaverage and fewer girls fail (overall). This and the fact that relatively few students areretained in a given school each year may have obscured higher retention rates among girlswho just fail.
2 Background
2.1 Literature Review
Previous papers have used regression discontinuity approaches to consider impacts ofretention on subsequent outcomes, beginning with Jacob and Lefgren [2004]. Among thirdgraders in Chicago public schools, Jacob and Lefgren [2004] found positive effects of retentionand more mixed impacts among sixth graders. Jacob and Lefgren [2009] found that retentionincreased subsequent high school dropout rates. These findings are noteworthy as longer-term endpoints (like high school completion) might be more important endpoints for parents,students, and policy makers than shorter-term achievement. Because compliance rates arean order of magnitude higher in Chicago than in New York,5 there is a different scope forheterogeneity in compliance in Chicago’s context compared to New York.
Mariano and Martorell [2013] follow Jacob and Lefgren [2004, 2009] and exploit test scorecutoffs used in assignment to summer school and retention in New York City. Specifically,they consider 2004-2008 data on fifth graders failing proficiency exam in 2004-2006. Theyfind modest positive effects of summer school on English achievement. They estimate cohort-over-cohort test score differences (“external drift”) and subtract it from the RD estimates ofretention (see 5.5 section). They find large and positive effects of grade retention on bothMath and English. As in Jacob and Lefgren [2004, 2009], heterogeneity in compliance is notconsidered.
Student characteristics, however, might conceivably play a role by shaping interactionsbetween teachers and students. Dee [2005] uses National Education Longitudinal Study
4Two recent working papers using Florida records are discussed in Section 2.1.541% of sixth-graders who failed to meet the promotion cutoff were retained in Chicago from 1993-1994
to 1998-1999 [Jacob and Lefgren, 2004].
4

of 1988 (NELS:88) to examine the role of demographic similarity between teachers andstudents on teachers’ perceptions of students. Dee [2005] makes within-student comparisonsof teachers’ perceptions, taking advantage of the structure of NELS:88 data, which surveyedteachers in two different academic subjects, on their perceptions of individual students. Dee[2005] finds that teachers are more likely to have negative perceptions towards students whodo not share the same race/ethnicity and gender. His findings suggest that demographiccharacteristics of students such as gender and race/ethnicity may potentially matter forretention decisions as well, as they are partly based on teachers’ evaluations of students.
Labelle and Figlio [2013] and Schwerdt et al. [2015] consider Florida’s test-based pro-motion policy and evaluate various future outcomes. Labelle and Figlio [2013] stands outas most similar to our approach (we discovered their conference draft after conducting ouranalysis). Labelle and Figlio [2013] examine whether Florida’s grade retention policy thatmandated promotion to the fourth grade conditional on meeting a minimum standard inthird grade reading was being implemented differently depending on maternal education(using matched educational data and birth records). They employ a regression discontinuitydesign, taking advantage of the score cutoff for determining retention, finding that studentswhose mothers have less than a high school degree are 20 percent more likely to be retainedthan students whose mothers have a bachelor’s degree or more. Factors besides parentaleducation, including eligibility for free school lunch and other dimensions of student perfor-mance, shape heterogeneity in compliance as well. They also estimate the effect of retentionon future test scores instrumenting for grade retention with scoring below the promotioncutoff. They find that retention leads to short-term gains in test scores but that the gainsfade out over time, consistent with Jacob and Lefgren [2009]. They find no evidence, how-ever, that differential retention by maternal education has differential impacts on students’future test scores.
Labelle and Figlio [2013] additionally show that students are more likely to be retained ifthey are Black (9 percent increase), male (13 percent increase), have a foreign born mother(13 percent increase), and qualify for free or reduced-price lunch (9 percent increase). Withinsubgroups categorized by student race, free or reduced-price lunch eligibility, and schoolcharacteristics, they still find a similar (but imprecise) pattern in retention probabilitiesby maternal education. Heterogeneity by student gender is not discussed. They attributedifferential retention by maternal education to systematic differences in parental behavior inresponse to retention risk, although they cannot directly test this hypothesis.
Schwerdt et al. [2015] emphasize the impacts of test failure on retention and futureoutcomes. They attempt to address the endogeneity of the subsequent exam to retentionand consider subsequent reading, Math test scores, and high school graduation. Short-term
5
gains in both Math and reading fade over time. They also find no clear impact on graduationand little evidence of systematic heterogeneity by student and school characteristics. Theyalso look at complier characteristics [Angrist and Pischke, 2009] and find that a complier ismore likely to score level 1 in Math. Their conclusion is that early grade retention might befavorable (e.g. short-term gains and no detrimental effects), although long-term benefits areuncertain.
At present, there is no published work using regression discontinuity methods to considerheterogeneity in compliance with exam failure/passing. The magnitude of heterogeneity wefind in New York City is substantially larger than that found in recent analyses of Floridastudents and manifests along additional dimensions, e.g. gender of student and principal.
2.2 Promotion Policy
In New York, students in grades 3-8 take the State Math and English Language Arts(ELA) tests each spring. The “scale score” is the number of correct answers converted intoa vertically comparable score (comparable across grades). Scale scores are categorized intofour performance levels separately for Math and ELA: level 1 - not meeting State learningstandards, level 2 - partially meeting State learning standards, level 3 - meeting State learningstandards, and level 4 - exceeding State learning standards.
Scoring level 2 (“partially meeting” standards) in both tests essentially guarantees pro-motion, whereas students who score level 1 (“not meeting” standards) in either subject areat risk of being retained. The failure threshold for each subject varies by year and grade.Retention procedures are less formalized in New York than Florida, with New York havingfew explicit exemptions. That said, English Language Learners and students with disabilitieswho receive special education services are exempt from New York’s stated promotion crite-ria.6 In our sample, 13% of students who failed to meet the promotion cutoff were retained.Thus, there is substantial scope for heterogeneity in compliance, driven predominantly bythe ”never takers”.
3 Data
We analyze administrative data from the New York City public school system for the2007-2008 to 2011-2012 academic years. Student-level panel data on New York State EnglishLanguage Arts (ELA) and Mathematics scale scores are merged to demographic character-
6Empirically, however, we find that these groups of students were also affected by the policy and thusdo not exclude them in our analysis. That said, our results are not sensitive to excluding them.
6

istics, including race, gender, free or reduced-price lunch eligibility, and age in months.Additionally, we observe students’ weight, height, and BMI, measures further described inAlmond, Lee, and Schwartz [2016]. Unique student identifiers allow us to track students overtime as long as they stay in the New York City public school system. When the student’sgrade level in year t + 1 is the same as that in year t, we code the student as retained.1,507,700 student records for grades 3-8 are available 2007-2012, and approximately 2% areretained. The retention rates in grades 3-8 have increased over time from 1% in 2007-2008to 3% in 2010-2011. Over our analysis period, roughly 4% of students are ever retained.
Table 1 reports mean student characteristics for the whole sample (column 1), those whopassed both tests but scored within 10 units of the cutoff (column 2), and those who failed tomeet the promotion cutoff in either test and within 10 scale score units (column 3). Relativeto the overall sample, students in this “retention window” are more likely to be Black orHispanic, and less likely to be Asian or White. The proportion of female students is lower,and the proportion of students who are eligible for free or reduced-price lunch higher nearthe cutoff. 13% of students below the failure threshold were retained while 0.7% of those“just above” the threshold were retained.
4 Estimation
To assess heterogeneity in how standardized test scores are utilized, we exploit the jump inretention rates at the failure threshold in a regression discontinuity framework. We estimatethe following equation both “pooled” and separately by student characteristics:
Yigs,t+1 = α0 + α1 · 1[Xigst < 0] + α2 ·Xigst + α3 · 1[Xigst < 0] ·Xigst + ηgst + εigst (1)
where i is individual, g is grade, s is subject, and t is year. Y is an indicator for whetherthe student is retained or not. Xigst is minimum of the Math and English test scores, re-centered to zero at their respective failure thresholds. We use this measure as the mainrunning variable, since students are at risk of grade retention when they score level 1 ineither Math or English test.
We fit a linear relationship between the scale score and the probability of retention,allowing for different slopes above and below the cutoff (consistent with our figures). Weinclude year×grade×subject fixed effects, ηgst, to control for year-, grade-, and subject-specific cutoffs. We estimate equation (1) by OLS and report robust standard errors.7 We
7We do not cluster our standard errors at the running variable level since we found out that clusteredstandard errors from separate regressions are inconsistent with clustered standard errors from pooled regres-sions. In addition, Kolesár and Rothe [2016] argue that the convention of clustering standard errors on the
7
focus on the roughly 250,000 student observations within 10 scale score (approximately onethird of a standard deviation for both Math and English) of the cutoff. In the tables,we report the RD estimate α1, which measures the size of the discontinuity at the failurethreshold.
4.1 Discontinuities in Baseline Covariates?
Figure 1 shows histograms of the running variable both in the full sample (panel (a))and within 10 scale score from the failure cutoff (panel (b)). We do not observe any heap-ing around the failure cutoff (normalized to 0).8 As there is no evidence of manipulationaround the cutoff, we expect students to have similar characteristics above and below thecutoff. We summarize covariates by predicting the probability of retention using studentgender, race/ethnicity, age in months, BMI, height, weight, free or reduced-price lunch eli-gibility, special education participation, and previous Math and English scale scores. Figure2 compares this predicted probability of retention around the cutoff. There is no evidenceof a discontinuity at the cutoff in the full sample (panel (a)) nor separately for females(panel (b)) or for Black students (panel (c)). The corresponding regression estimates of thediscontinuities are precisely estimated zeros.
5 Results
Figure 3 summarizes the mean probability of retention for students near the cutoff. Con-sistent with stated school policy, the probability of retention drops discontinuously at thecutoff. Moreover, the linear specification seems to fit the data well [Gelman and Imbens,2014]. Table 2 reports the RD estimates from estimating equation (1) “pooled” and sepa-rately by subgroup. Overall, failing to meet the promotion cutoff increases the probabilityof retention by 5 percentage points (column 1).
We are particularly interested in documenting whether exam failure has different retentionconsequences by baseline characteristics. Panel A of Table 2 shows that Black students are3.4 percentage points more likely to be retained than White students, more than doublethe White retention probability as induced by failure (2.9%). Hispanic students are around2 percentage points more likely to be retained than non-Hispanic Whites, a 60% increase.
running variable performs poorly in a regression discontinuity framework with a discrete running variable.8Dee et al. [2011] document evidence of manipulation of Regent’s exam scores among New York City
high school students, finding “roughly 3 to 5 percent of the exam scores that qualified for a high schooldiploma actually had performance below the state requirement”. Key for us, they do not find any evidenceof manipulation on the statewide Math and English exams given to students in grades 3-8. Likewise, wedetect no evidence of manipulation among the proficiency exams taken prior to high school (i.e. grades 3-8).
8

Asians are, if anything, are less likely to be retained than non-Hispanic White students whenthey fail to meet the cutoff.
Girls are 1.2 percentage points (or 27%) more likely to be retained than boys failingthe exam (panel B of Table 2). The gender difference is statistically significant at the 0.01level (p-value = 0.005). This is intriguing since the overall retention rate in grades 3-8 ishigher for boys (2.1%) than for girls (1.7%). But when we examine the retention rates in anarrow window near the failure threshold, we find the opposite: girls are more likely to beretained than boys. Additionally, we find that low performance on previous year’s Math testincreases the probability of retention (panel C in Table 2).9 Finally, those who are eligiblefor subsidized lunch are 1.3 percentage points more likely to be retained than those ineligible(panel D in Table 2).
Figure 4 presents these findings graphically. Panel (a) shows a large disparity in retentionbetween Black and White students below the cutoff. Likewise, panel (b) shows the meanprobability of retention is higher for Hispanics than for Whites, although the gap is smaller.Panel (c) shows that mean retention probabilities are similar between Asians and Whites.Panel (d) shows Blacks and Hispanics are roughly twice as likely to be retained than Asiansand Whites when they fail. Panel (e) shows that girls are more likely to be retained thanboys conditional on scoring identically below the cutoff. Below the threshold, the girl mean isabove the boy mean at each scale score, but means are indistinguishable above the threshold.Additionally, we examine whether the probability of retention differs by age for grade, heightfor grade, and weight status category. We might expect students who are younger or smallerthan their peers in the same grade are more likely to be retained, since they would potentiallyfit in better in their repeated grade (socially, physically, and academically). Parents mightalso be less likely to object to the retention decision if their child was a “close call” withrespect to age at school entry cutoff. We also test whether students who are “too big to fail”are in fact less likely to be retained. However, we find surprisingly little heterogeneity alongthese dimensions (Table 3).
Given the stark heterogeneity by ethnicity and gender, we consider interactions betweenthese dimensions. The gender gap is especially large among Whites (5.9 percentage pointsversus 0.9 percentage points). For all ethnicity groups, we find that girls are more likely tobe retained than boys.
9Additionally, we examine whether the demographic heterogeneity we find disappears once we conditionon previous test scores. We estimate separate regressions by student characteristics for each decile of previoustest scores. We find that ethnicity and gender heterogeneity in retention probability generally persist acrossthe distributions. This suggests that there are other factors driving the differential retention probabilitiesthat are independent of previous academic performance.
9

5.1 Racial Composition of Schools
Here we explore the role of school-level differences in explaining heterogeneity. Reten-tion policies and practices are shaped by principals and teachers, and thus may differ byschool. Given pronounced residential sorting within New York City, Black students mightdisproportionately attend schools that more strictly adhere to a test-based promotion policythan schools White students attend. We examine whether the probability of retention due toexam failure differs between schools with different Black shares, dividing schools into threeequal-sized groups by their proportion of Black students: low (mean 5%), middle (mean24%), and high (mean 60%). The overall mean retention rate in grades 3-8 is higher inhigh share schools (2.8%) than low share schools (0.8%). Furthermore, predominantly Blackschools tend to be high compliance schools, i.e. where discontinuity in retention rates islarger at the failure threshold.10 Thus school-level differences can “explain” (in a statisticalsense) some of the individual differences in retention by race.
However, panel A of Table 4 shows that the Black-White gap in the probability of re-tention is much larger in schools with low share of Black students. At predominantly Blackschools, we do not see a racial disparity in the effect of failing the exam. The difference inretention probability between Black and White students is only 0.7 percentage points, and itis not statistically significant. Panel B shows that these findings are not sensitive to includingschool fixed effects (nor would we expect them to be, as retention’s predictors are and shouldbe continuous at the cutoff). Thus, Black students are more likely to be retained within pre-dominantly non-Black schools. To summarize, higher black retention rates are attributableto both school-level differences and differential responses to failure within predominantlynon-Black schools. More generally, including school fixed effects indeed leaves our impactestimates essentially unchanged, including impact estimates by demographic subgroup.
5.2 Student-level Differences
Because students are not segregated by gender in New York City schools, gender het-erogeneity in compliance cannot be driven by differences in school-level characteristics. Weexamine other observable student-level differences which may explain the gender gap. Forinstance, students who are more likely to be retained conditional on identical test scoresmight perform worse in other performance measures. This exercise is necessarily imperfectbecause we do not observe everything observed by teachers, principals, and parents. On theother hand, as researchers we do observe some key information unobserved by schools and
10Exam failure increases retention probability by 3.6 percentage points in low share schools, by 4.4 per-centage points in middle share schools, and by 6.5 percentage points in high share schools.
10

parents: information on the future academic performance of students.We compare average performance of girls and boys in baseline test scores, baseline atten-
dance rate, and future test scores. (We depart from usual regression discontinuity analysesby not interpreting the jump scores at the failure threshold.11) As in previous studies, girlsperform better than or as well as boys on average along these dimensions. Conditional onscoring identically on the baseline Math test in our retention window, girls also score betterthan boys on baseline English test, future Math test, and future English test. Moreover, theyhave similar slopes in the relationship between other test scores and baseline Math score asboys, implying that the predictive power of baseline test score is not different by gender(panel (a) of Figure 5).12 Panel (b) shows that the slope of Black students above the cutoffis also similar to that of White students. It remains a puzzle that girls are about 25% morelikely to be retained when they fail compared to boys, and that this gender gap is especiallylarge for Whites.
Additionally, we examine whether heterogeneity in short-run benefits of retention canexplain higher retention of girls and minorities conditional on test score. As retained andpromoted students take different tests in subsequent years, it is fundamentally difficult tocompare future test scores below and above the threshold. We attempt to address thisissue by comparing same-grade test scores both in the baseline grade (i.e. test scores in thebaseline year for the promoted versus test scores in the following year for the retained) andone grade above (i.e. test scores in the following year for the promoted versus test scores twoyears later for the retained). We find no obvious and robust heterogeneity in these futuretest scores, suggesting that it is unlikely that larger potential benefits on future performancefor girls and minorities drive the differential retention decisions in the baseline.
5.3 Who Done It?
In this section, we focus on the role of principals. Teachers’ perceptions of students can bebased on their racial/ethnic and gender similarities to students [Dee, 2005]. Unfortunately,we do not observe the classroom to which students are assigned within grade and school(or the demographics of teachers). But according to the New York City Department ofEducation website:
Principals will review these portfolios in August and make a holistic promotion11The particular exam taken is determined by a student’s year in school, so the exam taken changes
discontinuously at the threshold due to retention. If one is willing to ignore that potential compositionaleffect, there is an apparent increase in short-run academic performance due to retention, as has been foundin previous literature. See Section 5.5.
12The relationship above the failure cutoff is easier to interpret because it is not affected by endogenousretention.
11

decision for each student. Superintendents will continue to review promotionappeals for cases in which a parent disagrees with the principal’s decision.
As the final retention decision is made by principals and superintendents, we utilize data onschool principal demographics, which come from a single 2008 cross-section of roughly 1,400schools. This yields a subsample of 19,421 student records within 10 scale score of the cutoff.We consider whether the gender gap in retention varies by principal’s gender.
Table 5 shows that the female-male difference in retention probability is pronouncedin schools with female principals, while it essentially disappears in male principal schools.This is consistent with the findings from Hanna and Linden [2012] (admittedly in a radicallydifferent context): “In fact, we observe the opposite, with discrimination against the low-castechildren being driven by low-caste graders, and graders from the high-caste groups appearingnot to discriminate at all even when controlling for the education and age of grader”. Ongender, we do not know of an economics of education paper with a similar finding to ours.Bagues et al. [2015] argue that having women on faculty review committees in Italy andSpain, if anything, leads to fewer female faculty being promoted.
Additionally, we find that the Black-White gap in retention probability is large (11.3percentage points versus 6.2 percentage points) in schools with White principals. The eth-nicity gap disappears and is imprecisely estimated in Black principal schools, although thisis partly due to the small number of White students in these schools. Because other (unob-served) characteristics of the school presumably vary by principal’s observed characteristics,however, we characterize this pattern as descriptive.
5.4 Statistical Discrimination
Can the canonical theory of statistical discrimination [Phelps 1972; Arrow 1973; Aignerand Cain 1977] explain the heterogeneity we find? Through this lens, principals make theretention decision based on the current test score, x, which is a noisy signal for the truelevel of academic success in the next grade, q. That is, x = q + u where u ∼ N(0, σ2
u). Inaddition, principals have formed expectations of academic success for different demographicgroups from experience: qs ∼ N(q̄s, σ
2q,s). Let s = {f,m} denote the gender group. Then,
the expected academic success of a student with test score x and gender s can be writtenas αsx + (1 − αs)q̄s, where αs =
σ2q,s
σ2q,s+σ
2u,s
. (Since the signal s may be more informative forone group than another, we let σ2
u to vary across groups and denote it as σ2u,s.) Intuitively,
if the observed signal is noisy, αs goes down and thus principals would put more weight ongroup mean and less weight weight on the observed signal. The female-male difference in theexpected academic success conditional on scoring identically x = k on the current test is:
12

E(q|x = k, s = f)− E(q|x = k, s = m) = (αfk + (1− αf )q̄f )− (αmk + (1− αm)q̄m)
If we assume that there is no difference in group mean, q̄f = q̄m = q̄, the above equationreduces to (αf −αm)(k− q̄). Therefore, if the current test score is a noisier measure for boysthan for girls (i.e. αf > αm), the female-male difference in the expected academic success isnegative for below average students (k < q̄).
Turning to our data, we assume that principals have formed expectations of group perfor-mance based on previous year’s Math test score and observe current year’s Math test score.In our full sample, previous year’s Math test score is slightly higher on average (q̄f = 681.7
and q̄m = 680.7) and more precise (σ2q,f = 33.52 and σ2
q,m = 34.62) for girls. In addition,the current Math test score is noisier for boys (σ2
u,f = 31.92 and σ2u,m = 32.82). Using these
estimates, E(q|x = k, s = f) − E(q|x = k, s = m) = −0.002k + 1.998. Evaluating this atthe mean current Math test score below the cutoff x = 637.4, we find that the female-maledifference is small and rather positive (−0.002(637.4) + 1.998 = 0.7). In this simple frame-work, the signal for boys is not noisy enough for our findings to be consistent with statisticaldiscrimination.
5.5 BMI Impacts?
As in previous econometric studies of retention, considering the causal effects on sub-sequent academic performance is not straight-forward even with a valid instrument for re-tention. This is because the grade level of the exam students take in subsequent year isendogenous to retention decision. Therefore, it is difficult to distinguish the endogenous“exam taken” effect from the effect of retention on academic performance. We do not havea “silver bullet” solution to this problem.13
However, BMI testing does not vary by grade, and thus its evaluation is not compromisedby endogenous retention. Moreover, as BMI percentiles vary by age in months and ageitself is unaffected by retention, BMI percentiles are comparable for retained versus non-retained students. Furthermore, we observe BMI for all students, and have sufficient powerto consider biometric impacts. Following a health economics literature on peer effects in BMI[Halliday and Kwak, 2009], timing of puberty and its responsiveness to social/environmentalfactors [Bharadwaj and Cullen, 2013], we test whether the higher probability of retentiondue to exam failure affects BMI in the following year. We instrument for retention with
13Mariano and Martorell [2013] address the endogeneity by estimating “external drift”, which we do notpursue here.
13
scoring below the failure threshold and estimate the effect of retention on next year BMIusing 2SLS. Table 6 shows that retention due to exam failure does not have a statisticallysignificant impact on next year BMI, although point estimates indicate that grade retentionmight lower BMI relative to promoted peers. We conclude the peer effect on BMI is not largein our compliant sub-population, although our 2SLS estimates are somewhat imprecise.
5.6 Complier Characteristics
In this section, we take a more systematic approach to describing heterogeneity in com-pliance to the retention policy. The LATE theorem states that if treatment effects areheterogeneous, an instrument captures the causal effect for the sub-population of compliers(in our application, those who are retained as a result of exam failure). While it is not pos-sible to identify individual compliers, it is possible to describe the distribution of compliercharacteristics. We estimate compliers’ mean observable characteristics following Angristand Pischke [2009], Almond and Doyle [2011].14
Table 7 shows that mean characteristics in fact vary substantially across different samples.Compliers are less likely to be Asian or White, while they are much more likely to be Black(49%) compared to those both in our retention window (38%) and in the full sample (31%).Insofar as race is concerned, compliance appears more selective than does scoring near thethreshold. Turning to income, scoring near the threshold increases the share receiving areduced-price lunch from 86 to 93%, while compliers are “only” 95% poor. Thus, performanceon the test is more strongly related to income rather than how the test is used. Turning togender, compliers are on average 48% female, versus 46% in our retention window (and 50%overall). The fraction obese is remarkably similar across these subgroups.
6 Discussion
The process by which retention decisions are made is often opaque despite utilizationof standardized test scores and common thresholds. There is little systematic evidence onthis “black box”. We find both the magnitude and nature of this heterogeneity surprising.Why are younger students not more likely to be retained conditional on their exam score?In contrast, both race and gender help predict retention conditional on the baseline testscore. Compliance with proficiency exams in New York City is thus selective. We find thesedescriptive patterns interesting per se and invite additional research on whether retention
14Curiously, seven years after Angrist and Pischke [2009] recounted a straight-forward approach to describecompliers, empirical economists seldom do. Recent methodological contributions in Angrist and Fernández-Val [2013], Dehejia et al. [2015], and Kowalski [2016] are notable exceptions.
14

decisions are “fair”. Are girls and minorities over-retained? The need for such work isunderscored by previous research (from other contexts where students can be tracked forlonger time periods) that there may be long-term impacts on marginally-retained students[Jacob and Lefgren, 2009]. Such outcomes may be more important than the shorter-termbenefits students show somewhat mechanically from repeating material they have seen inthe previous year. Thus, it is not merely the case that the retention decision is perceived atthe time as momentous by parents and students.
References
D. J. Aigner and G. G. Cain. Statistical theories of discrimination in labor markets. Industrialand Labor Relations Review, pages 175–187, 1977.
Douglas Almond and Joseph J. Doyle. After midnight: A regression discontinuity design inlength of postpartum hospital stays. American Economic Journal: Economic Policy, 3(3):1–34, 2011. doi: 10.1257/pol.3.3.1. URL http://www.aeaweb.org/articles.php?doi=
10.1257/pol.3.3.1.
Douglas Almond, Ajin Lee, and Amy Ellen Schwartz. Impacts of classifying new york citystudents as overweight. Proceedings of the National Academy of Sciences, 113(13), 2016.
Joshua D. Angrist and Iván Fernández-Val. Extrapolate-ing: External validity and overi-dentification in the late framework. In Daron Acemoglu, Manuel Arellano, and EddieDekel, editors, Advances in Economics and Econometrics, Tenth World Congress, vol-ume 3, chapter 11. Cambridge University Press, May 2013.
Joshua D. Angrist and Jörn-Steffen Pischke. Mostly Harmless Econometrics: An Empiricist’sCompanion. Princeton University Press, Princeton, New Jersey, 2009.
K.J. Arrow. The theory of discrimination. In O. Ashenfelter and A. Rees, editors, Discrim-ination in Labor Markets, pages 3–33. Princeton University Press, 1973.
Manuel Bagues, Mauro Sylos-Labini, and Natalia Zinovyeva. Does the gender compositionof scientific committees matter? IZA Discussion Paper Series, (9199), 2015.
Prashant Bharadwaj and Julie Berry Cullen. Coming of age: Timing of adolescence andgender identity formation. (Preliminary and incomplete. Do not cite without permission),September 2013.
15
Thomas S Dee. A teacher like me: Does race, ethnicity, or gender matter? AmericanEconomic Review, pages 158–165, 2005.
Thomas S. Dee, Brian A. Jacob, Jonah E. Rockoff, and Justin McCrary. Rules and discretionin the evaluation of students and schools: The case of the new york regents examinations.manuscript, Columbia Business School, 2011.
Rajeev Dehejia, Christian Pop-Eleches, and Cyrus Samii. From local to global: Externalvalidity in a fertility natural experiment. NBER Working Paper 21459, August 2015.
Andrew Gelman and Guido Imbens. Why high-order polynomials should not be used inregression discontinuity designs. Working Paper 20405, National Bureau of EconomicResearch, August 2014. URL http://www.nber.org/papers/w20405.pdf.
Timothy J. Halliday and Sally Kwak. Weight gain in adolescents and their peers. Economics& Human Biology, 7(2):181 – 190, 2009. ISSN 1570-677X. doi: DOI:10.1016/j.ehb.2009.05.002. URL http://www.sciencedirect.com/science/article/B73DX-4W91PW9-2/2/
3efb336fa8c00a962aa98d27ad9696d5.
Rema N. Hanna and Leigh L. Linden. Discrimination in grading. American EconomicJournal: Economic Policy, 4(4):146–68, 2012. doi: 10.1257/pol.4.4.146. URL http:
//www.aeaweb.org/articles.php?doi=10.1257/pol.4.4.146.
Elizabeth A. Harris and Ford Fessenden. ’opt out’ becomes anti-test rallying cry in new york state. The New York Times,May 2015. URL http://www.nytimes.com/2015/05/21/nyregion/
opt-out-movement-against-common-core-testing-grows-in-new-york-state.
html?_r=0.
Brian A. Jacob and Lars Lefgren. Remedial Education and Student Achieve-ment: A Regression-Discontinuity Analysis. The Review of Economics and Statis-tics, 86(1):226–244, February 2004. URL http://ideas.repec.org/a/tpr/restat/
v86y2004i1p226-244.html.
Brian A. Jacob and Lars Lefgren. The Effect of Grade Retention on High School Completion.American Economic Journal: Applied Economics, 1(3):33–58, July 2009. URL http:
//ideas.repec.org/a/aea/aejapp/v1y2009i3p33-58.html.
Michal Kolesár and Christoph Rothe. Inference in regression discontinuity designs with adiscrete running variable. manuscript, arXiv:1606.04086 [stat.AP], 2016.
16

Amanda E. Kowalski. Doing more when you’re running late: Applying marginal treatmenteffect methods to examine treatment effect heterogeneity in experiments. NBER WorkingPaper 22363, June 2016.
Christina LiCalsi Labelle and David N. Figlio. The uneven implementation of universalschool policies: Maternal education and florida’s mandatory grade retention policy. Con-ference draft, Association for Education Finance and Policy (accessed 9/2015), September2013. URL http://www.aefpweb.org/sites/default/files/webform/39th/Uneven%
20Implementation%20of%20Universal%20School%20Policies.pdf.
Louis T. Mariano and Paco Martorell. The academic effects of summer instruction andretention in new york city. Educational Evaluation and Policy Analysis, 35(1):96–117,2013. doi: 10.3102/0162373712454327. URL http://epa.sagepub.com/content/35/1/
96.abstract.
Edmund S. Phelps. The statistical theory of racism and sexism. American Economic Review,62(4):659–661, September 1972.
Guido Schwerdt, Martin R. West, and Marcus A. Winters. The effects of test-based retentionon student outcomes over time: Regression discontinuity evidence from florida. WorkingPaper 21509, National Bureau of Economic Research, August 2015. URL http://www.
nber.org/papers/w21509.
Ellen M. Tomchin and James C. Impara. Unraveling teachers’ beliefs about grade retention.American Educational Research Journal, 29(1):199–223, 1992.
17

7 Figures10
000
2000
030
000
4000
0
-200 -100 0 100 200
Scale score relative to the cutoff
(a) All
1000
020
000
3000
040
000
-10 -5 0 5 10
Scale score relative to the cutoff
(b) Retention Window
Figure 1: Distribution of the running variableNotes: The running variable is minimum of the Math and English test scores re-centered to zero at theirown failure thresholds.
.035
.04
.045
.05
-10 -5 0 5 10
Scale score relative to the cutoff
(a) All
.035
.04
.045
.05
.055
-10 -5 0 5 10
Scale score relative to the cutoff
(b) Female only
.045
.05
.055
.06
-10 -5 0 5 10
Scale score relative to the cutoff
(c) Black only
Figure 2: Predicted probability of retentionNotes: We estimate the predicted probability of retention using gender, race/ethnicity, age in months, BMI,height, weight, free or reduced-price lunch eligibility, special education participation, and previous Math andEnglish scale scores. Each circle plots mean predicted probability of retention within each one scale scorebin. The size of the circle depends on the number of observations in each bin. Lines are the fitted values froma regressions of the predicted probability on the exam failure dummy, allowing for different slopes above andbelow the cutoff.
18

0.0
5.1
.15
.2
-10 -5 0 5 10
Scale score relative to the cutoff
Figure 3: Probability of retentionNotes: Each circle plots mean probability of retention within each one scale score bin. The size of thecircle depends on the number of observations in each bin. Lines are the fitted values from a regressions of aretention dummy on the exam failure dummy, allowing for different slopes above and below the cutoff.
19

0.0
5.1
.15
.2.2
5
-10 -5 0 5 10
Black White
Scale score relative to the cutoff
(a) Black vs. White
0.0
5.1
.15
.2
-10 -5 0 5 10
Hispanic White
Scale score relative to the cutoff
(b) Hispanic vs. White
0.0
5.1
.15
-10 -5 0 5 10
Asian White
Scale score relative to the cutoff
(c) Asian vs. White
0.0
5.1
.15
.2
-10 -5 0 5 10
Black or Hispanic Asian or White
Scale score relative to the cutoff
(d) Black or Hispanic vs. Asian or White
0.0
5.1
.15
.2
-10 -5 0 5 10
Female Male
Scale score relative to the cutoff
(e) Female vs. male
0.0
5.1
.15
.2
-10 -5 0 5 10
Young Old
Scale score relative to the cutoff
(f) Young vs. old
Figure 4: Heterogeneity in complianceNotes: Each circle (or triangle) plots mean probability of retention within each one scale score bin. The sizeof the circle (or triangle) depends on the number of observations in each bin. Lines are the fitted values froma regression of a retention dummy on the exam failure dummy, allowing for different slopes above and belowthe cutoff. We divide each grade into three equal-sized groups based on age in months for grade. Panel (f)compares the youngest group with the oldest group.
20

635
640
645
650
655
-10 -5 0 5 10
Female Male
Scale score relative to the cutoff
(a) Female vs. male
640
645
650
655
660
-10 -5 0 5 10
Black White
Scale score relative to the cutoff
(b) Black vs. White
Figure 5: Next year Math scale scoreNotes: We use the re-centered baseline Math test score conditional on passing English as the running variable.Each circle (or triangle) plots mean Math test scores in the subsequent year within each one scale score bin.The size of the circle (or triangle) depends on the number of observations in each bin. Lines are the fittedvalues from a regressions of next year Math test score on the exam failure dummy, allowing for differentslopes above and below the cutoff.
21

8 Tables
Table 1: Summary statistics
Retention window
All Above Below
Asian 0.154 0.079 0.069Black 0.307 0.376 0.388Hispanic 0.394 0.469 0.485White 0.142 0.073 0.054Female 0.500 0.467 0.448Free or reduced-price lunch 0.860 0.930 0.941Age in months 133.1 134.5 135.7Weight (lbs) 101.2 104.7 105.4Height (inches) 58.2 58.4 58.5Math level 1 0.049 0.000 0.376Math level 2 0.245 0.712 0.482Math level 3 0.461 0.261 0.132Math level 4 0.245 0.027 0.010English level 1 0.074 0.000 0.723English level 2 0.370 0.957 0.256English level 3 0.504 0.042 0.021English level 4 0.053 0.001 0.000Retention 0.018 0.007 0.128
N 1,507,700 77,543 168,047Notes: Retention window indicates 10 scale score above and below the failure threshold.
22
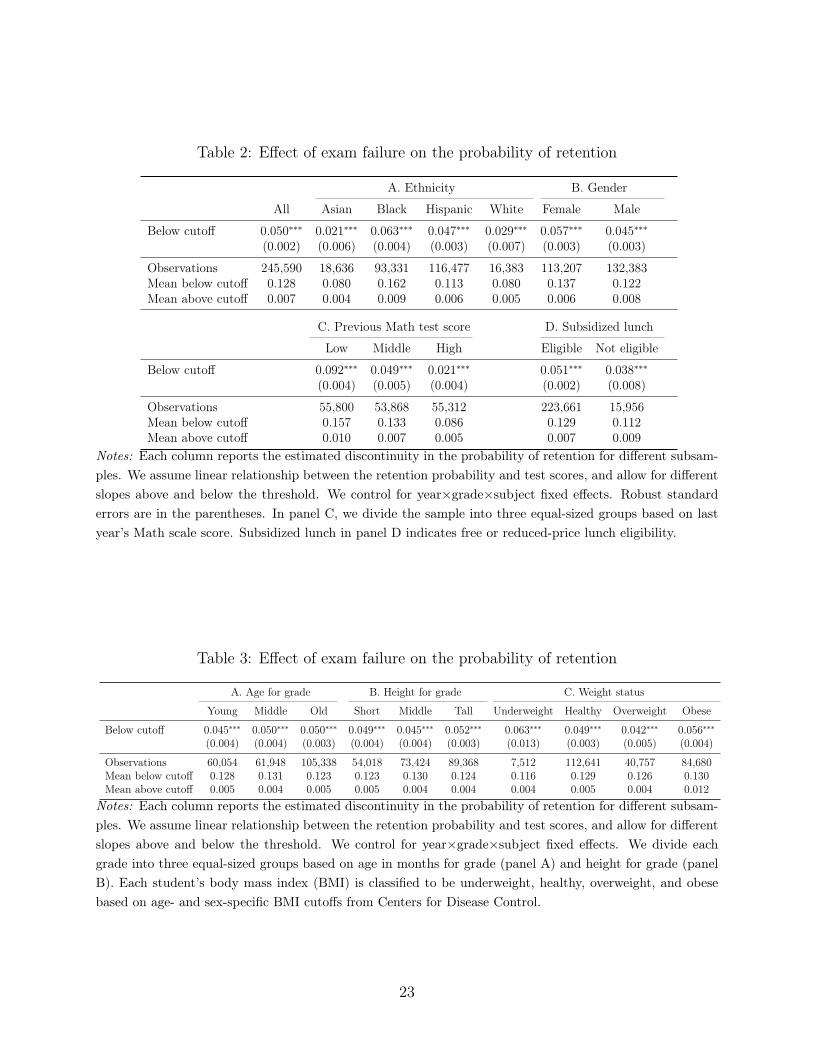
Table 2: Effect of exam failure on the probability of retention
A. Ethnicity B. Gender
All Asian Black Hispanic White Female Male
Below cutoff 0.050∗∗∗ 0.021∗∗∗ 0.063∗∗∗ 0.047∗∗∗ 0.029∗∗∗ 0.057∗∗∗ 0.045∗∗∗(0.002) (0.006) (0.004) (0.003) (0.007) (0.003) (0.003)
Observations 245,590 18,636 93,331 116,477 16,383 113,207 132,383Mean below cutoff 0.128 0.080 0.162 0.113 0.080 0.137 0.122Mean above cutoff 0.007 0.004 0.009 0.006 0.005 0.006 0.008
C. Previous Math test score D. Subsidized lunch
Low Middle High Eligible Not eligible
Below cutoff 0.092∗∗∗ 0.049∗∗∗ 0.021∗∗∗ 0.051∗∗∗ 0.038∗∗∗(0.004) (0.005) (0.004) (0.002) (0.008)
Observations 55,800 53,868 55,312 223,661 15,956Mean below cutoff 0.157 0.133 0.086 0.129 0.112Mean above cutoff 0.010 0.007 0.005 0.007 0.009
Notes: Each column reports the estimated discontinuity in the probability of retention for different subsam-ples. We assume linear relationship between the retention probability and test scores, and allow for differentslopes above and below the threshold. We control for year×grade×subject fixed effects. Robust standarderrors are in the parentheses. In panel C, we divide the sample into three equal-sized groups based on lastyear’s Math scale score. Subsidized lunch in panel D indicates free or reduced-price lunch eligibility.
Table 3: Effect of exam failure on the probability of retention
A. Age for grade B. Height for grade C. Weight status
Young Middle Old Short Middle Tall Underweight Healthy Overweight Obese
Below cutoff 0.045∗∗∗ 0.050∗∗∗ 0.050∗∗∗ 0.049∗∗∗ 0.045∗∗∗ 0.052∗∗∗ 0.063∗∗∗ 0.049∗∗∗ 0.042∗∗∗ 0.056∗∗∗(0.004) (0.004) (0.003) (0.004) (0.004) (0.003) (0.013) (0.003) (0.005) (0.004)
Observations 60,054 61,948 105,338 54,018 73,424 89,368 7,512 112,641 40,757 84,680Mean below cutoff 0.128 0.131 0.123 0.123 0.130 0.124 0.116 0.129 0.126 0.130Mean above cutoff 0.005 0.004 0.005 0.005 0.004 0.004 0.004 0.005 0.004 0.012
Notes: Each column reports the estimated discontinuity in the probability of retention for different subsam-ples. We assume linear relationship between the retention probability and test scores, and allow for differentslopes above and below the threshold. We control for year×grade×subject fixed effects. We divide eachgrade into three equal-sized groups based on age in months for grade (panel A) and height for grade (panelB). Each student’s body mass index (BMI) is classified to be underweight, healthy, overweight, and obesebased on age- and sex-specific BMI cutoffs from Centers for Disease Control.
23

Table 4: Heterogeneity by school’s proportion of Black students
Low (mean=5%) High (mean=60%)
Asian Black Hispanic White Asian Black Hispanic White
A. Without school fixed effectsBelow cutoff 0.027∗∗∗ 0.055∗∗∗ 0.039∗∗∗ 0.017∗∗ 0.023 0.066∗∗∗ 0.064∗∗∗ 0.059∗∗
(0.008) (0.017) (0.005) (0.008) (0.017) (0.005) (0.007) (0.024)
B. With school fixed effectsBelow cutoff 0.026∗∗∗ 0.058∗∗∗ 0.040∗∗∗ 0.017∗∗ 0.022 0.067∗∗∗ 0.063∗∗∗ 0.065∗∗
(0.008) (0.017) (0.005) (0.008) (0.019) (0.004) (0.007) (0.028)
Observations 11,475 4,133 40,165 10,612 2,988 68,828 26,948 1,797Mean below cutoff 0.069 0.123 0.094 0.070 0.102 0.167 0.132 0.105Mean above cutoff 0.003 0.008 0.004 0.004 0.005 0.010 0.010 0.009
Notes: We divide schools into three equal-sized groups by schools’ proportion of Black students. The meanproportion of Black students is 5% in low share schools. It is 60% in high share schools. Each column reportsthe estimated discontinuity in the probability of retention for different race/ethnicity groups. We assumelinear relationship between the retention probability and test scores, and allow for different slopes above andbelow the threshold. We control for year×grade×subject fixed effects. Robust standard errors are in theparentheses.
Table 5: Gender heterogeneity in retention probability by principal’s gender
Female principal Male principal
Student: Female Male Female Male
Below cutoff 0.135∗∗∗ 0.081∗∗∗ 0.070∗∗∗ 0.083∗∗∗(0.017) (0.015) (0.024) (0.022)
Observations 6,481 7,188 2,689 3,063Mean below cutoff 0.133 0.123 0.101 0.120Mean above cutoff 0.005 0.006 0.005 0.011
Notes: We utilize data on principal gender from 2007-2008. First two columns compare the estimateddiscontinuity in the probability of retention by student gender in schools with a female principal. Lasttwo columns examine heterogeneity by student gender in schools with a male principal. We assume linearrelationship between the retention probability and test scores, and allow for different slopes above andbelow the threshold. We control for year×grade×subject fixed effects. Robust standard errors are in theparentheses.
24

Table 6: Effect of retention on next year BMI
By ethnicity By gender
All Asian Black Hispanic White Female Male
Retention -0.413 4.773 -0.143 -0.981 3.275 -1.019 0.321(0.958) (7.809) (1.283) (1.435) (6.366) (1.273) (1.450)
Observations 208,916 17,171 76,138 100,075 14,841 96,119 112,797Mean below cutoff 21.9 20.1 21.9 22.2 21.3 22.0 21.7Mean above cutoff 21.8 20.0 21.9 22.1 21.1 21.9 21.6
Notes: Each column reports the estimated effect of retention on next year BMI for different subsamples.We instrument for retention with scoring below the failure threshold and estimate the effect of retention onnext year BMI using 2SLS. We assume linear relationship between next year BMI and test scores, and allowfor different slopes above and below the threshold. We control for year×grade×subject fixed effects. Robuststandard errors are in the parentheses.
Table 7: Mean characteristics
Complier Retention window AllCharacteristic E(X|D1 = 1, D0 = 0) (N=245,590) (N=1,507,700)
Asian 0.043 0.076 0.154Black 0.492 0.380 0.307Hispanic 0.428 0.474 0.394White 0.033 0.067 0.142Female 0.482 0.461 0.501Free or reduced-price lunch 0.950 0.933 0.860Age in months 135.2 134.9 133.1Weight (lbs) 105.1 104.9 101.2Height (inches) 58.5 58.5 58.2Obese 0.338 0.345 0.332
N 245,590 1,507,700Notes: First column summarizes mean characteristics of compliers following Angrist and Pischke [2009],Almond and Doyle [2011].
25