retaining minority students in higher · pdf fileretaining minority students in higher...
TRANSCRIPT

ASHE-ERIC Higher Education Report: Volume 30, Number 2Adrianna J. Kezar, Series Editor
Retaining Minority Students inHigher Education
A Framework for Success
Watson Scott Swail,with Kenneth E. Redd and Laura W. Perna
ash302fm.qxp 11/14/03 12:50 PM Page i

Retaining Minority Students in Higher Education: A Framework for SuccessWatson Scott Swail, with Kenneth E. Redd and Laura W. PernaASHE-ERIC Higher Education Report: Volume 30, Number 2Adrianna J. Kezar, Series Editor
This publication was prepared partially with funding from the Office ofEducational Research and Improvement, U.S. Department of Education, undercontract no. ED-99-00-0036. The opinions expressed in this report do notnecessarily reflect the positions or policies of OERI or the Department.
Copyright © 2003 Wiley Periodicals, Inc., A Wiley Company. All rights reserved.Reproduction or translation of any part of this work beyond that permitted bySections 107 or 108 of the 1976 United States Copyright Act without permissionof the copyright owner is unlawful. Requests for permission or further informationshould be addressed to the Permissions Department, c/o John Wiley & Sons,Inc., 111 River St., Hoboken, NJ 07030; (201) 748-8789, fax (201) 748-6326,www.wiley.com/go/permissions.
ISSN 0884-0040 electronic ISSN 1536-0709 ISBN 0-7879-7247-9
The ASHE-ERIC Higher Education Report is part of the Jossey-Bass Higherand Adult Education Series and is published six times a year by Wiley SubscriptionServices, Inc., A Wiley Company, at Jossey-Bass, 989 Market Street, San Francisco,California 94103-1741.
For subscription information, see the Back Issue/Subscription Order Formin the back of this journal.
CALL FOR PROPOSALS: Prospective authors are strongly encouraged to contactAdrianna Kezar at the University of Southern California, Waite Phillips Hall 703C,Los Angeles, CA 90089, or [email protected]. See “About the ASHE-ERIC HigherEducation Report Series” in the back of this volume.
Visit the Jossey-Bass Web site at www.josseybass.com.
Printed in the United States of America on acid-free recycled paper.
ash302fm.qxp 11/14/03 12:50 PM Page ii
iiiRetaining Minority Students in Higher Education
Advisory Board
The ASHE-ERIC Higher Education Report Series is sponsored by theAssociation for the Study of Higher Education (ASHE), which provides aneditorial advisory board of ASHE members.
Kenneth FeldmanSUNY at Stony Brook
Anna OrtizMichigan State University
James FairweatherMichigan State University
Jerlando JacksonUniversity of Wisconsin
Elaine El-KhawasGeorge Washington University
Melissa AndersonUniversity of Minnesota
Doug TomaUniversity of Pennsylvania
Amy MetcalfeUniversity of Arizona
Carol ColbeckPennsylvania State University
This Issue’s Consulting Editorsand Review Panelists
Pamela BalchBethany College
William G. TierneyUniversity of Southern California
Christopher C. MorphewUniversity of Kansas
James T. MinorUniversity of Southern California
Susan FrostEmory University
Linda K. JohnsrudUniversity of Hawaii at Manoa
Edward HinesIllinois State University
ash302fm.qxp 11/14/03 12:50 PM Page iii

ash302fm.qxp 11/14/03 12:50 PM Page iv

Executive Summary
vRetaining Minority Students in Higher Education
Today about half of students with dreams and aspirations based on their futurereceipt of an earned certificate or degree leave with that dream either stalledor ended. Access and completion rates for African American, Hispanic, andNative American students have always lagged behind white and Asian stu-dents, as have those for low-income students and students with disabilities.Although postsecondary enrollment rates for students of color are at levelssimilar to white and Asian students, access to four-year colleges, especially ournation’s most selective institutions, remains inequitable. Beyond access, stu-dents of color have not earned degrees at the same rates as other students.
This ASHE-ERIC monograph is intended as a reference for key stake-holders regarding the realities of and strategies for student retention. It is ourhope that it will serve as a “compass” for those with the complex task ofimproving retention.
Part One: Postsecondary OpportunityEducation has a profound impact on both the individual and society. Indi-viduals with a bachelor’s degree earn, on average, twice that of high schoolgraduates, and those with a professional degree earn twice what individualswith a bachelor’s earn. Thus, the demand for postsecondary education hasincreased greatly over the past several decades, with enrollments up ten-foldsince the mid-1900s to approximately 14 million.
Educational attainment levels continue to be substantially lower for AfricanAmericans, Hispanics, and American Indians than for whites and Asians. In
ash302fm.qxp 11/14/03 12:50 PM Page v

vi
2000, only 11 percent of Hispanics and 17 percent of blacks in the U.S. pop-ulation age 25 and older had attained at least a bachelor’s degree, comparedwith 28 percent of whites and 44 percent of Asians. A review of available datasuggests that increasing the share of students of color who attain a bachelor’sdegree requires attention to four critical junctures.
Critical Juncture 1: Academic Preparation for CollegeResearch shows that the level of academic preparation in high school is posi-tively related to high school graduation rates, college entrance examinationscores, predisposition toward college, college enrollment, representation atmore selective colleges and universities, rates of transfer from a two-year to afour-year institution, progress toward earning a bachelor’s degree by age 30,college persistence rates, and college completion rates. Completing a rigorouscurricular program during high school appears to be a more importantpredictor of college persistence than test scores, particularly for AfricanAmerican and Hispanic students.
Critical Juncture 2: Graduation from High SchoolIn 2000, 43 percent of Hispanics in the U.S. population age 25 and older hadnot completed high school, compared with 21 percent of blacks, 14 percentof Asians, and 12 percent of whites. These and other data suggest that onesource of observed racial and ethnic group differences in educational attain-ment is lower rates of high school graduation, especially among Hispanic menand women.
Critical Juncture 3: Enrollment in CollegeAnnual college enrollment rates have generally increased among high schoolgraduates between the ages of 18 and 24 for blacks, Hispanics, and whitessince the late 1980s. However, the share of black high school graduatesenrolled in a degree-granting institution remained virtually unchangedbetween 1979 and 1989 but increased through the 1990s. Similarly, the sharesof Hispanic high school graduates were comparable in 1979 and 1989 buthigher in 1999. In contrast, the share of white high school graduates enrolledin college increased across both decades.
ash302fm.qxp 11/14/03 12:50 PM Page vi
Critical Juncture 4: Persistence in College to Bachelor’sDegree CompletionOnly 46 percent of African Americans and 47 percent of Hispanics who firstenrolled in a four-year institution in 1995–96 with the goal of completing abachelor’s degree actually completed a bachelor’s degree within six years, com-pared to 67 percent of whites and 72 percent of Asians. Six-year bachelor’sdegree completion rates are also lower for African Americans and Hispanicsthan for whites and Asians at both types of institutions.
The Affirmative Action DebateThe recent decision by the U.S. Supreme Court allowing the University of Michi-gan to continue considering race as a factor in student admissions has once againbrought affirmative action to the forefront of American higher education. How-ever, while the Court’s five-to-four ruling in Grutter v. Bollinger allows selectivecolleges and universities to continue using affirmative action plans to recruit andretain a “critical mass” of African American, Hispanic, and Native Americanstudents, it also urges college officials to prepare to dismantle racial diversity planswithin twenty-five years (Lane, 2003). On the same day, the Supreme Court’sruling in Gratz v. Bollinger struck down the University of Michigan’s undergrad-uate affirmative action admissions plan, which used a point system to rankprospective student applications.The two rulings mean that selective institutionsare allowed to use affirmative action programs as long as institutions’ admissionsofficers consider each prospective student’s individual characteristics and aca-demic records without using a point or ranking system. That is, race may be a“plus factor” in admissions decisions (Lane, 2003, p. A1). While the SupremeCourt’s decision has clarified the legality of affirmative action plans for collegesand universities, it has not ended the contentious debate on this issue.
Part Two: Why Students Leave CollegeTinto’s Student Integration Model (1975), based in part on Durkheim’s theoryof suicide, theorizes that the social integration of students increases their insti-tutional commitment, ultimately reducing the likelihood of student attrition.Several researchers have used important aspects of Tinto’s academic and social
viiRetaining Minority Students in Higher Education
ash302fm.qxp 11/14/03 12:50 PM Page vii

integration theory in the development of a psychological, rather than socio-logical, model. A number of researchers have found shortcomings in persis-tence and integration models. However, the complexity of the humancondition makes it difficult to definitely prove the validity of one psycholog-ical or sociological theoretical model over another.
Factors Related to RetentionThere are a number of factors related to retention, and researchers have founddifferences, as well as similarities, between white students and students of color.
Academic Preparedness. Research shows that between 30 and 40 percent ofall entering freshmen are unprepared for college-level reading and writing andapproximately 44 percent of all college students who complete a two- or four-year degree had enrolled in at least one remedial or developmental course inmath, writing, or reading.
Campus Climate. While researchers agree that “institutional fit” and campusintegration are important to retaining college students to degree completion,campus climate mediates undergraduates’ academic and social experiences incollege. Minority students inadequately prepared for non-academic challengescan experience culture shock. Lack of diversity in the student population,faculty, staff, and curriculum often restrict the nature and quality of minoritystudents’ interactions within and out of the classroom, threatening theiracademic performance and social experiences.
Commitment to Educational Goals and the Institution. The stronger theeducational goal and institutional commitment, the more likely the student willgraduate (Tinto, 1993). Research shows that congruence between student goalsand institutional mission is mediated by academic and social components, andthat increased integration into academic and social campus communities causesgreater institutional commitment and student persistence.
Social and Academic Integration. The process of becoming sociallyintegrated into the fabric of the university has also been found to be both acumulative and compounding process, and the level of social integrationwithin a given year of study is part of a cumulative experience that continues
viii
ash302fm.qxp 11/14/03 12:50 PM Page viii
to build throughout one’s college experience. The establishment of peerrelations and the development of role models and mentors have been definedin the literature as important factors in student integration, both academicallyand socially.
Financial Aid. For many low-income and minority students, enrollmentand persistence decisions are driven by the availability of financial aid. In1999–2000, 77 percent of financially dependent students from familieswith less than $20,000 in family income received some financial aid, withan average award of $6,727. In contrast, 44 percent of those from familieswith income of $100,000 or more received aid, with an average award of$7,838.
Low-income and minority students who receive grants generally aremore likely to persist than those who receive loans. However, given therising costs of attending college, it is unlikely that low-income studentswill be able to receive bachelor’s degrees without any loan aid. At the sametime, the research also suggests that the shifts in aid from grants to loansand from need-based to merit-based programs adversely affects both enroll-ment and persistence for minority students. Reversing these shifts may beneeded to increase college access and success for low-income and minoritystudents.
Part Three: A Framework for RetentionWhile student persistence models remain useful in illustrating the problemsand processes relating to student persistence, the relationship between collegeand student is lost between the simplicity and complexity of the various mod-els. The Geometric Model of Student Persistence and Achievement providesa user-friendly method to discuss and focus on the cognitive and social attrib-utes that the student brings to campus, plus the institutional role in the stu-dent experience. The geometric model also allows us to discuss the dynamicsbetween cognitive, social, and institutional factors, all of which take placewithin the student. These three forces must combine to provide a solid foun-dation for student growth, development, and persistence.
ixRetaining Minority Students in Higher Education
ash302fm.qxp 11/14/03 12:50 PM Page ix

This campus-wide retention model was designed to provide administra-tors with a strategy and framework to build a student retention plan thatincorporates the individual needs of their students and institution. From anadministrative perspective, the model’s strategies are not prescriptive. They arealternatives and institutional practices that are consistent with both currentthinking within the various communities and what we have been able to ascer-tain through the research literature. The retention framework is classified intofive components based upon an extensive review of current literature: finan-cial aid, recruitment and admissions, academic services, student services, andcurriculum and instruction. The framework components are further brokendown into categories based on areas of specialization, and subsequently intospecific objectives.
Part Four: Implementation and LeadershipThe development of any program at any university requires a multifacetedprocess incorporating all campus officials, including administration, faculty,staff, and especially students. Leadership and faculty ownership are key vari-ables in a successful retention program, and the message communicated fromtop management is critical to the support of the campus staff.
To implement retention programs, senior campus leadership must play twoimportant roles: monitoring institutional progress toward clearly stated cam-pus retention goals, and coordinating and leading all stakeholders—students,parents, other campus administrators, faculty, and staff—toward stated goals.Through our discussions with stakeholders, as well as our review of relatedresearch, we were able to come up with a short list of essential factors in estab-lishing such a program. A comprehensive student retention program must
• rely on proven research• suit the particular needs of the campus• be institutionalized and become a regular part of campus service • involve all campus departments and all campus personnel• take into consideration the dynamics of the change process and provide
extensive and appropriate retraining of staff
x
ash302fm.qxp 11/14/03 12:50 PM Page x
• be student-centered• operate in a cost-effective way, and not tied to soft monies• have the support of a comprehensive student monitoring system that will
become the foundation of all institutional research on campus and supportevery department
• be sensitive to student needs and to diverse populations
The development of a campus-wide retention program requires supportiveleadership, the willingness to evoke change on campus, and a careful planningeffort. If any of these factors are missing, the chances for success are limited.Ultimate success of a student retention effort depends on the unequivocal sup-port from the office of the president or provost, the involvement of the entirecampus in shaping program operations, and the important practice of keep-ing ideology focused on the student.
xiRetaining Minority Students in Higher Education
ash302fm.qxp 11/14/03 12:50 PM Page xi
Foreword xv
Acknowledgments xvii
Postsecondary Opportunity 1The Growing Importance of a College Degree 04
Moving from Access to Success 09
Diagnosis by the Numbers: The Education Pipeline for Racial 11and Ethnic Minorities
Diversity 101: Affirmative Action in America 30
Why Students Leave College 43Models of Student Progression 43
Factors Related to Retention 51
A Framework for Retention 75A New Perspective on Student Integration 75
Three Forces Affecting Student Persistence and Achievement 77
The Model in Practice 79
Practical Implications of the Geometric Model 86
A Framework for Student Retention 88
Monitoring Students’ Progress 110
Implementation and Leadership 113Important Organizational Considerations in Developing an 114
Institution-Wide Retention Program
xiiiRetaining Minority Students in Higher Education
Contents
ash302fm.qxp 11/14/03 12:50 PM Page xiii
Implementing Campus-Wide Programs 116
The Importance of Leadership on Student Retention 120
Final Thoughts 125
Appendix A: Promising College Student Retention Programs 129
Appendix B: Annotated Bibliography 143
References 159
Name Index 175
Subject Index 181
xiv
ash302fm.qxp 11/14/03 12:50 PM Page xiv
Foreword
In the last decade, the rates of enrollment and retention of certain students ofcolor have declined. Although attention to the need to diversify the studentbody and create a welcoming climate has increased, success has been limited.In a social and political climate where affirmative action is under attack andthe means for ensuring diversity are becoming narrower, we need strategies forretaining students who are able to enter higher education. Over the last fewdecades, professionals have searched for generalized strategies and techniquesto retain students, but often studies have not examined the specific needs ofstudents of color. Because students of color often make up a much smaller per-centage of students in studies, their experiences and needs are often lost andgo undetected. As Swail, Redd, and Perna describe, the United Stateswill become significantly less white over the next fifty years, so these issues arebecoming more urgent.
Retaining Minority Students in Higher Education: A Framework for Successby Watson Scott Swail, with Kenneth E. Redd and Laura W. Perna, is beingpublished at a crucial time: campuses realize they need to make changes yethave few if any strategies to move forward. This monograph, which providesa framework that can fundamentally alter retention and success of all students,begins with a description of the context for students of color, retrenchment ofaffirmative action, and the reduction in the pipeline of students of color. Theauthors highlight the need to move from a focus on access, the main thrust offederal policy the last three decades, to success. In the following chapters, themonograph shifts the discussion to what happens once students of color cometo college campuses. The heart of the book outlines why students leave college,
xvRetaining Minority Students in Higher Education
ash302fm.qxp 11/14/03 12:50 PM Page xv

exploring Tinto’s attrition model, Bean’s synthetic model, and Anderson’s forcefield analysis. The authors focus on a host of issues such as academic prepara-tion, campus climate, and social integration, presenting a complex picturefrom the breadth of literature produced in the last thirty years. The frameworkfor retention developed by the authors responds to the host of social, cogni-tive, and institutional factors identified as issues in the research and are tiedto specific support units and services on campuses. Moreover, the frameworkplaces the student at the center of the model and focuses on the institutionalrole in shaping students’ experiences, an area where professionals have somelevel of control. As the authors note, “The strength in the model and theframework that follows is in its ability to help institutions work proactively tosupport student persistence and achievement.”
Programs and services are not enough to ensure success; monitoring stu-dent progress is critical. Data and evidence (both quantitative and qualitative)on the success of students must be collected and reviewed on a systemic andongoing basis. The monograph also underscores the importance of thinkingacross the entire institution to successfully implement and lead a retentioneffort. Tinto’s seven action principles serve as a helpful strategy. A wealth ofpromising programs and practices is listed in the appendix. I invite readers toshare this monograph with others who care about the success of students ofcolor.
Adrianna J. KezarSeries Editor
xvi
ash302fm.qxp 11/14/03 12:50 PM Page xvi
Acknowledgments
This volume is the culmination of several years of research and work, and itwould not have happened without the assistance of a number of individuals.I wish to thank the following persons for their hard work and support duringthis period and this project, in particular the late Dennis Holmes, the GeorgeWashington University, for general guidance; Bernard Charles, the McKenzieGroup, for helping develop the original research project; Nancy Adelman, SRIInternational, for her leadership; and Manya Walton, consultant, for her assis-tance on the literature review.
Special thanks to Ken Redd of NASFAA and Laura Perna of the Univer-sity of Maryland for their continual goodwill and expert support. They madethis volume a much better reference for readers.
A special thanks is due Jorge Balan of the Ford Foundation for sponsoringthis project and SRI International for project management. All of us in theeducation community appreciate the continued support of research and prac-tice with respect to educational opportunity.
xviiRetaining Minority Students in Higher Education
ash302fm.qxp 11/14/03 12:50 PM Page xvii
Postsecondary Opportunity
A1975 RESEARCH ARTICLE by Vincent Tinto, “Dropout from HigherEducation: A Theoretical Synthesis of Recent Research,” spurred more
than twenty-five years of dialogue on student retention and persistence inhigher education. Though it has been attacked by some and revised by Tintohimself, his work has remained the dominant sociological theory of howstudents navigate through our postsecondary system.
More than a quarter century later, the issues of student retention and per-sistence are as pertinent as they were when Tinto first published his studentintegration model. In the 1970s and 1980s, public policy was focused pri-marily on access, with federal and state legislation aimed at reducing barriersto higher education. By the mid-1990s, the discussion moved from access toissues of choice, affordability, and persistence. Although gaining entry to col-lege is still a dramatic accomplishment for some, persisting to degree is whatreally matters in the postcollege world. Unfulfilled academic goals often resultin unfulfilled career realities: lower pay, less security, fewer opportunities, anddreams deferred—if not abandoned.
The issue of retention is a persistent problem in higher education. For thepast 100 years, the institutional graduation rate has stubbornly held atthe 50 percent mark: half of all students entering higher education fail to real-ize their dreams and aspirations based on earning a certificate or degree. AsTinto remarks, “The consequences of this massive and continuing exodus fromhigher education are not trivial, either for the individuals who leave or for theirinstitutions” (1993, p. 1).
1Retaining Minority Students in Higher Education

For students of color in particular, the stakes have never been trivial. Accessand completion rates for African American, Hispanic, and Native Americanstudents have always lagged behind those for white and Asian students. Thesame is true for low-income students and students with disabilities (Gladieuxand Swail, 1998). But great strides have been made since the War on Povertyof the 1960s. Postsecondary enrollment rates for students of color are at lev-els similar to those for white and Asian students, although equal access to four-year colleges remains an area of concern, especially at our nation’s mostselective institutions. But even if access rates for minority students were on alevel with majority white students, students of color have not been able to real-ize the degree production rates of other students. In fact, they earn degrees ata ratio between 1:2 and 1:3 compared with white and Asian students.
Given that the United States will become significantly “less white” over thecourse of the next fifty years, issues of color cannot be ignored. California isalready a “majority minority” state, but its flagship public institutions of highereducation have embarrassing low participation rates among African Americanand Hispanic students. Texas, Florida, and several other states host similarproblems. If such issues are not urgently addressed, today’s retention and diver-sity problems will seem like child’s play in a few, short decades.
In 2004, the Congress is expected to reauthorize the Higher Education Actof 1965. Congress will likely tinker with Pell Grant authorizations, loan lim-its and rules, and other important issues such as teacher training and distanceeducation. Another goal of reauthorization may be to pressure institutions toimprove student retention and completion, in view of Congress’s limited abil-ity to force colleges to curb spiraling tuitions. Beyond such measures, con-certed action will be required to spur U.S. colleges, on a large scale, to getmore serious about retention and persistence and move faster to become morediversity friendly.
This publication is intended as a reference for key stakeholders regardingthe realities of, and strategies for, student retention. It is our hope that it willserve as a compass for those charged with the complex task of improving reten-tion at their campus. More specifically, it details the findings of three levels ofresearch. The first is an exhaustive review of the literature on issues that affectthe retention of minority and underrepresented students in postsecondary
2

3Retaining Minority Students in Higher Education
education. Updating a previous study of minority student retention inthe mid-1990s (Swail, 1995), this review looks at more recent issues facingunderrepresented students in the college pipeline.
Second, our team analyzed a number of databases to look for enrollment,persistence, and completion trends of students of color at U.S. colleges anduniversities. We also examined pre- and postcollege issues such as preparationand employment.
Finally, investigators conducted a series of focus groups and interviews withcampus leaders and practitioners about current practice and their perspectiveson how our nation’s campuses are dealing with the problem of student retention.
The analysis and discussion in this monograph focus primarily on the roadto and through the four-year college and university. Thus, we have not pro-vided data or discussion on the community college sector, still a vitally impor-tant sector of the public postsecondary system in the United States. Becausethe community college is much different from the four-year college, webelieve that a separate publication would do justice to the peculiarities andspecificities accorded to the community college and the type of students whoattend those institutions. As well, we strongly advise readers not to take ourobservations of earning power or other returns to a bachelor’s degree as thecardinal rule of the economy. The community college likewise provides stu-dents with a distinct advantage over those whose highest academic credentialis a high school diploma. Still, because the BA is the standard-bearer of post-secondary education and because our research has been focused primarily onthat constituency, we believe our discussion is better targeted at that oneparticular level.
To aid readers, this publication is divided into four sections. This first chap-ter introduces the key policy issues and presents data on the retention ofminority students in the United States. We begin with a discussion of thegrowing importance of a college degree in America, followed by an analysis ofthe cost of student attrition to students, colleges, and society. The chapter alsopresents data on the educational pipeline for minority students and concludeswith a synopsis of recent affirmative action legislation.
The second chapter focuses on why students leave college and presentstheoretical models that describe student persistence, and the next one introduces
4
a comprehensive framework and geometric model that provides a new perspec-tive on student persistence and achievement.
Finally, the fourth chapter reviews key factors in implementing programs forimproving retention on college campuses, including the major role of leadership.Two appendices contain useful collections of information. Appendix A providesinformation on twenty-five programs and strategies of interest to administratorsand practitioners, and Appendix B is an annotated bibliography of studies thatwe deem important resources.
As stated, the major purpose of the report is to engage higher educationpersonnel in the complex area of student retention through a discussion ofimportant concepts, issues, and practices. We hope that better understandingwill lead to increases in diversity and opportunity for all attending postsec-ondary campuses.
The Growing Importance of a College DegreeHigher education has an enormous responsibility for our society’s well-being. . . . Education determines not only earning capacity but also thevery quality of human life. Even longevity is correlated with educationalachievement. In the broad sense of how well we live our lives—both indi-vidually and collectively—higher education is a public-health issue.
[Davies, 2001]
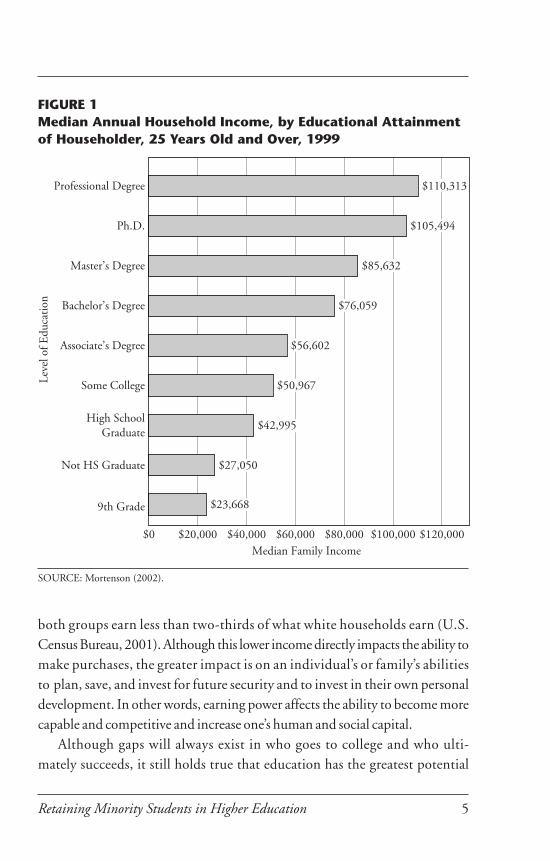
Education has a profound impact on both the individual and society at large,and it is one of the surest ways to increase one’s social and economic levels andovercome the barriers of poverty and deprived social conditions (Swail, 2000).According to the U.S. Census Bureau, individuals with a bachelor’s degreeearn about 77 percent more than that of high school graduates, and those witha professional degree earn 50 percent more than those with a bachelor’s degree(Figure 1). On an annual basis, these variances are considerable. Over a life-time, they are tremendous. The earning differential between each level isapproximately $1 million, not counting investment opportunities and capitalgains for those with high levels of disposable income, afforded mostly to thosewith advanced and professional degrees.
Socioeconomic status is closely related to race and ethnicity. African Ameri-cans and Latinos earn considerably less, on average, than white families. In fact,
5Retaining Minority Students in Higher Education
both groups earn less than two-thirds of what white households earn (U.S.Census Bureau, 2001). Although this lower income directly impacts the ability tomake purchases, the greater impact is on an individual’s or family’s abilitiesto plan, save, and invest for future security and to invest in their own personaldevelopment. In other words, earning power affects the ability to become morecapable and competitive and increase one’s human and social capital.
Although gaps will always exist in who goes to college and who ulti-mately succeeds, it still holds true that education has the greatest potential
$0 $20,000
Professional Degree
Ph.D.
Master’s Degree
Bachelor’s Degree
Associate’s Degree
Some College
High SchoolGraduate
Not HS Graduate
9th Grade
$40,000 $60,000Median Family Income
$80,000 $100,000 $120,000
Leve
l of E
duca
tion
$110,313
$105,494
$85,632
$76,059
$56,602
$50,967
$42,995
$27,050
$23,668
FIGURE 1Median Annual Household Income, by Educational Attainmentof Householder, 25 Years Old and Over, 1999
SOURCE: Mortenson (2002).

6
to benefit all. “There are no guarantees in life with or without a collegediploma . . . but . . . the odds are increasingly stacked against those with theleast education and training. The more education one has, the more—onaverage—one earns . . . And this relationship has become conventionalwisdom. People understand: who goes to college—and often which college—determines more than ever who has entrée to the best jobs and the best lifechances” (Gladieux and Swail, 1998, p. 101).
A recent report by RAND suggests that the social/societal benefits of edu-cation may exceed the private—or individual—benefits (Vernez, Krop, andRydell, 1999). This in-depth analysis of national data sets found that increasesin education level resulted in improvements in social cohesion, technologicalinnovations, and tangible intergenerational benefits that affect the entire soci-ety. In addition, reductions in crime and recidivism, Medicaid and Medicarecosts, and other social costs are tied to education levels. The study providesthis example of education’s benefits:
For every native-born Mexican woman who graduates from highschool instead of dropping out, the nation would save $2,438 in socialprograms and would add $1,843 in public revenues in her 30th year.Similar savings and increases in public revenues would accrue annu-ally over her lifetime. In addition, this woman would enjoy $2,588more in disposable income during her 30th year. If this woman wereto attend some college instead of stopping at high school, the resultwould be $956 more in program savings, $1,398 more in publicrevenues, and $2,401 more in disposable income at age 30. Andgraduating from college would add another $411 in program savings,$2,551 in public revenues, and $3,722 in disposable income [Vernez,Krop, and Rydell, 1999, p. 30].
The fact that Americans in all walks of life understand the importance ofeducation affects educational institutions in two distinct ways. First, thedemand for postsecondary studies has increased greatly over the past severaldecades. Enrollments are up more than tenfold since the mid-1900s to approx-imately 14 million students each year, with four-year enrollments attracting

7Retaining Minority Students in Higher Education
almost 4 million full-time equivalent students annually. The United States hasthe largest and broadest postsecondary system in the world, and certainly themost open system (Gladieux, 2001), allowing a full spectrum of individualsfrom all levels of society to participate. From a purely market standpoint,higher education institutions have done well. Although colleges and universi-ties continue to raise tuition and fees at rates two to three times that of infla-tion to meet their budgets (College Board, 2002), higher education has donewell to meet the market demand.
It is important to note that this increase in demand for education has aneconomic relationship to academic persistence and completion rates in theUnited States. For example:
There is a linear relationship between enrollment and income. If aninstitution has a break-even point of one thousand students, main-taining an enrollment of eleven hundred students represents an enor-mous cushion, since most classes can be 10 percent larger withoutadditional cost to the institution. If the enrollment drops to nine hun-dred, however, the instructional costs remain the same, but facultyand other institutional employees may be faced with the loss of 10 per-cent of their income or 10 percent of their colleagues. Given a typicaltuition of $5,000 at an institution enrolling eight hundred full-timefreshmen where the freshman to sophomore year attrition rate is25 percent, the loss of two hundred students would cost the school$1 million. Across the country, the tuition loss due to full-time fresh-man attrition alone would be $3 billion [Bean, 1986, p. 47].
Bean’s example resonates as well today as it did in 1986. The ability of aninstitution to retain its students relates directly to its budget. The argumenthas been made that low retention rates (or high attrition rates) drive up thecost of education through inflated tuition and fee charges and increased con-sumption of public subsidies (at least for public institutions). Tuition, fees,and subsidies are already inflated, however, because the cost of attrition hasbeen packaged into those charges that are passed off to the student, family,and taxpayer.

8
Thus, our inability to reduce attrition during the past fifty years of post-secondary expansion has had—and continues to have—serious implicationsfor the inflationary pressures on tuition and fees at public and private univer-sities across the country. Each fall when the College Board releases its Trends inCollege Pricing report at the National Press Club, members of the media askwhy tuition and fees continue to escalate. Typical answers include the costs oftechnology infrastructure, new housing units, and enhancing the qualityof education, but a main driver of these price increases that is rarely discussedis the enormous cost of losing students.
This reality is not lost on managers of educational institutions. During themid-1990s, one of this report’s authors had a discussion with a vice presidentof student services at one of the more exclusive private universities in theWashington, D.C., area. The vice president calculated that each enrolled stu-dent cost the institution about $750 to attract and enroll, including the costsof recruitment, outreach, and admissions. He was concerned about the sizableinvestment the institution would lose if it let that student fall out of thesystem—an investment that would not or could not be recouped.
Beyond the sheer financial impact, the implications of retention and attri-tion are felt in the culture of the institution. Bean (1986) references a con-nection between high attrition and low faculty morale as well as a sense offailure among students, administrators, and staff. Just as institutions are val-ued on the basis of their selectivity, students, parents, and policymakers rankinstitutions in light of their graduation rates. A main indicator in the infa-mous U.S. News & World Report survey is the institutional graduation rate.People want to know whether an institution gets students through. Regard-less of an institution’s mission and selectivity, schools with low retention andgraduation rates carry a burden that has a direct impact on the college’s abilityto recruit and retain future students. It is a difficult and vicious cycle to break.
Institutions also have an ethical obligation to retain students. By admittinga student, an institution not only makes a contractual commitment to that stu-dent but also incurs a moral obligation to provide him or her with an appropri-ate level of education and support. Through admissions, the institutionessentially states, “You belong here, and we’re here to help you.” Institutions thatadmit students without providing adequate resources or support are not doing
themselves or their students any favors. In fact, in many cases, they could be caus-ing more harm than good. Students who leave before graduation—especiallylow-income and disadvantaged students—often do so with a sizable loan bur-den and poor prospects for employment without the degree they originallysought. As a further complication, these students have a high propensity todefault on their student loans, affecting their credit rating and digging them-selves into a deep financial hole.
Moving from Access to SuccessSince World War II, the primary focus of federal support for higher educationhas been on postsecondary access. The G.I. Bill (the Serviceman’s Readjust-ment Act of 1944) was introduced to help military servicemen reintegrateinto the economy and society after the war (as well as to ward off a recession bythe influx of hundreds of thousands of workers into the U.S. economy). Anastonishing 40 percent of military veterans took advantage of the G.I. Bill,ushering higher education into a new era (Levine and Nidiffer, 1996).
The 1960s brought the War on Poverty and two major legislative pack-ages: The Civil Rights Act of 1964 and the Higher Education Act of 1965.These bills established the tenet for future federal involvement in education,which historically had been a state responsibility. The federal government hadalready laid the groundwork for access to postsecondary education throughthe G.I. Bill and through increased focus on math and science education afterSputnik in 1957. But the legislation of the mid-1960s expanded the federalrole through new student financial aid programs and academic support pro-grams, such as the TRIO programs (Upward Bound, Student Support Ser-vices, and Talent Search). As President Johnson said upon signing the HigherEducation Act of 1965, “We need to do more . . . to extend the opportunityfor higher education more broadly among lower and middle income families.”And they did.
The 1970s continued the federal government’s expansion into supportfor educational opportunity, resulting in the Pell Grant (originally known asthe Basic Educational Opportunity Grant, or BEOG, before being renamedfor Rhode Island Senator Claiborne Pell in 1980). In the words of President
9Retaining Minority Students in Higher Education

Nixon, this measure was intended to ensure that “no qualified student whowants to go to college should be barred by lack of money” (Gladieux andWolanin, 1976, p. 70). Later reauthorizations of the Higher Education Actestablished more programs, with the greatest expansion of aid coming in1992 through the introduction of the unsubsidized loan programs (Wolanin,1998).
Federal expansion into education was founded on the generally agreedprinciple that federal responsibility lay in opening the doors of higher educa-tion. A huge expansion of access occurred in the 1990s, driven partially by aneconomy that needed highly skilled individuals. At the same time, higher edu-cation grew considerably more complicated. College was not just about the“traditional” 18- to 24-year-old set anymore; scores of adults began to comeback to college or started attending for the first time. In addition, the rise ofdistance education, proprietary schools, and corporate universities beganchanging the face of higher education. Education became a market, and evenWall Street took interest.
These changes invariably made the definition of a college student diffi-cult. And it also made the compartmentalization of dropouts, stopouts,repeaters, and transfers more difficult. For instance, of the 67 percent of stu-dents who “accessed” postsecondary education in 1982 directly from highschool, only 55 percent received some type of degree (BA: 40 percent; AA:9 percent; certificate: 6 percent). But what happened to the other 45 percentunderlines the significance of the persistence issue (Adelman, 1997). Thirteenpercent were incidental students with fewer than ten earned credits. Of thisgroup, 60 percent were gone by the end of their freshman year. Twenty-fourpercent earned fewer than two years’ worth of credits, with large percentagesof them attending multiple institutions. And 8 percent earned more than 60credits but received no degree. That’s a lot of earned credits with no bank-able result.
In 1997, the National Postsecondary Education Cooperative held a con-ference to “reconceptualize” access in postsecondary education. Vincent Tinto,in his conference white paper, said, “The point of providing students accessto higher education is to give them a reasonable opportunity to participate incollege and attain a college degree” (Tinto, 1997, p. 1). But that is not always
10

11Retaining Minority Students in Higher Education
the case, and success and responsibility continue to be defined in terms ofaccess.
As we begin to close in on four centuries of higher education in America,it is perhaps a good opportunity for institutions to reconceptualize their role insociety. While our colleges and universities have never been as accessible to thegeneral public as they are now, that openness has, in the words of Levine andNidiffer, been “passive” (1996, p. 52). Throughout our history, governmenthas intervened at various times to further open access to underrepresentedgroups. The Morrill Act of 1862 created the land-grant public institution, andthirty years later Morrill Act II provided for historically black colleges and uni-versities (HBCUs) to provide access for the black population, who were notprovided access at many land-grant institutions. Given Tinto’s commentsabout access, perhaps now is the time for government to intervene andtalk about success rather than open doors. Future public policy needs to focuson prying open the exit doors to our institutions while continuing to openthose at the entrance.
Diagnosis by the Numbers: The EducationPipeline for Racial and Ethnic MinoritiesEducational opportunity and success are uneven in the United States byincome and by race/ethnicity, and African American, Hispanic, and NativeAmerican students continue to earn degrees at substantially lower rates thanwhites and Asians. In 2000, only 11 percent of Hispanics and 17 percent ofAfrican Americans in the United States age 25 and older had attained at least abachelor’s degree, compared with 28 percent of whites and 44 percent of Asians(Chronicle of Higher Education Almanac 2001–02, August 31, 2001).
A review of available data suggests that increasing the share of students ofcolor who attain a bachelor’s degree requires attention to four critical junc-tures: academic preparation for college, graduation from high school, enroll-ment in college, and persistence in college to completion of the bachelor’sdegree. This section describes the racial and ethnic group differences at eachof these four junctures and concludes by describing the importance of raisingeducational attainment levels for both individuals and society.
12
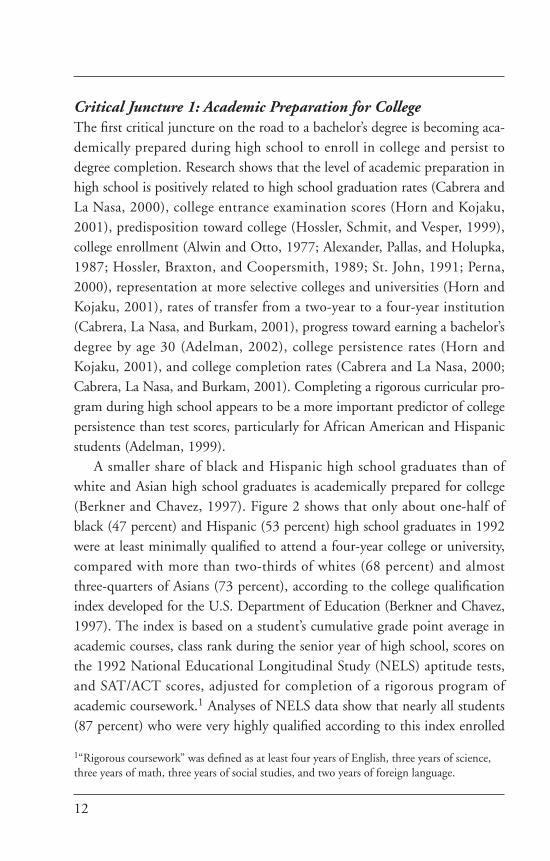
Critical Juncture 1: Academic Preparation for CollegeThe first critical juncture on the road to a bachelor’s degree is becoming aca-demically prepared during high school to enroll in college and persist todegree completion. Research shows that the level of academic preparation inhigh school is positively related to high school graduation rates (Cabrera andLa Nasa, 2000), college entrance examination scores (Horn and Kojaku,2001), predisposition toward college (Hossler, Schmit, and Vesper, 1999),college enrollment (Alwin and Otto, 1977; Alexander, Pallas, and Holupka,1987; Hossler, Braxton, and Coopersmith, 1989; St. John, 1991; Perna,2000), representation at more selective colleges and universities (Horn andKojaku, 2001), rates of transfer from a two-year to a four-year institution(Cabrera, La Nasa, and Burkam, 2001), progress toward earning a bachelor’sdegree by age 30 (Adelman, 2002), college persistence rates (Horn andKojaku, 2001), and college completion rates (Cabrera and La Nasa, 2000;Cabrera, La Nasa, and Burkam, 2001). Completing a rigorous curricular pro-gram during high school appears to be a more important predictor of collegepersistence than test scores, particularly for African American and Hispanicstudents (Adelman, 1999).
A smaller share of black and Hispanic high school graduates than ofwhite and Asian high school graduates is academically prepared for college(Berkner and Chavez, 1997). Figure 2 shows that only about one-half ofblack (47 percent) and Hispanic (53 percent) high school graduates in 1992were at least minimally qualified to attend a four-year college or university,compared with more than two-thirds of whites (68 percent) and almostthree-quarters of Asians (73 percent), according to the college qualificationindex developed for the U.S. Department of Education (Berkner and Chavez,1997). The index is based on a student’s cumulative grade point average inacademic courses, class rank during the senior year of high school, scores onthe 1992 National Educational Longitudinal Study (NELS) aptitude tests,and SAT/ACT scores, adjusted for completion of a rigorous program ofacademic coursework.1 Analyses of NELS data show that nearly all students(87 percent) who were very highly qualified according to this index enrolled
1“Rigorous coursework” was defined as at least four years of English, three years of science,three years of math, three years of social studies, and two years of foreign language.

13Retaining Minority Students in Higher Education
in a four-year college or university within two years of graduating from highschool, compared with only 15 percent of those who were marginally or notqualified and 36 percent who were minimally qualified (Berkner and Chavez,1997).
A rigorous program of academic coursework in high school, including pre-calculus and at least one honors or advanced placement course, also appears toincrease the likelihood of college persistence indirectly, as students with a rig-orous high school curriculum transfer less frequently to another college or uni-versity, attend more selective four-year colleges and universities, and have highergrade point averages during the first year of college (Horn and Kojaku, 2001).
Critical Juncture 2: Graduation from High SchoolThe second critical juncture on the road to a bachelor’s degree is graduatingfrom high school. Figure 3 shows that in 2000, 43 percent of Hispanics in theU.S. population age 25 and older had not completed high school, comparedwith 21 percent of blacks, 14 percent of Asians, and 12 percent of whites.
Perc
ent Q
ualif
ied
0%
25%
50%
75%65
47
73
53
68
100%
Total AfricanAmerican
Asian Hispanic White
FIGURE 2Percentage of 1992 High School Graduates Who WereQualified to Attend a Four-Year College or University, by Raceor Ethnicity
SOURCE: Berkner and Chavez, 1997.

14
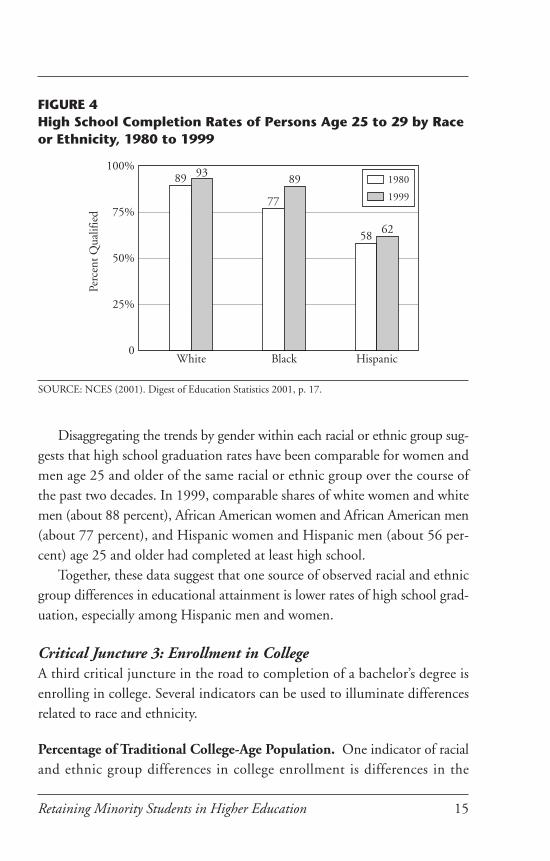
While useful, examining racial or ethnic group differences in educationalattainment among the entire U.S. population age 25 and older may obscurethe progress that has been made among younger segments of the population.Figure 4 illustrates the share of the U.S. population between the ages of 25 and29 that completed at least high school in 1980 and 1999. Among individualsbetween the ages of 25 and 29, the largest increase in high school graduationrates over the period was among African Americans: from 76.7 percent in 1980to 88.7 percent in 1999. High school graduation rates also increased amongwhites, from 89.2 percent to 93 percent. Among Hispanics, high school gradu-ation rates increased only slightly over this twenty-year period, from 58 percentto 61.6 percent. Consequently, although the gap in high school graduation ratesbetween African Americans and whites has narrowed over the past twenty years,the gap between Hispanics and whites has remained virtually unchanged.
14%21%
35%
20%
7%
12%
5%
22%
13%
7%
29%
15%
43%
28%
13%
5%
7%3%
12%
34%
18%
8%
19%
10%
0%
25%
50%
75%
100%
Black,Non-Hispanic
Asian Hispanic White,Non-Hispanic
Advanced Degree
Bachelor’s
Associate
Some College
High School Graduate
Not High School Graduate
FIGURE 3Educational Attainment of U.S. Population Age 25 and Olderby Race or Ethnicity, 2000
SOURCE: Chronicle of Higher Education Almanac, August 31, 2001.
15Retaining Minority Students in Higher Education
Disaggregating the trends by gender within each racial or ethnic group sug-gests that high school graduation rates have been comparable for women andmen age 25 and older of the same racial or ethnic group over the course ofthe past two decades. In 1999, comparable shares of white women and whitemen (about 88 percent), African American women and African American men(about 77 percent), and Hispanic women and Hispanic men (about 56 per-cent) age 25 and older had completed at least high school.
Together, these data suggest that one source of observed racial and ethnicgroup differences in educational attainment is lower rates of high school grad-uation, especially among Hispanic men and women.
Critical Juncture 3: Enrollment in CollegeA third critical juncture in the road to completion of a bachelor’s degree isenrolling in college. Several indicators can be used to illuminate differencesrelated to race and ethnicity.
Percentage of Traditional College-Age Population. One indicator of racialand ethnic group differences in college enrollment is differences in the
Perc
ent Q
ualif
ied
0
25%
50%
75%
100%
HispanicBlackWhite
1980
1999
89 93
77
89
58 62
FIGURE 4High School Completion Rates of Persons Age 25 to 29 by Raceor Ethnicity, 1980 to 1999
SOURCE: NCES (2001). Digest of Education Statistics 2001, p. 17.

16
percentage of the traditional (18- to 24-year-old) college-age population thatgraduated from high school and enrolled in college. Figure 5 shows that annualcollege enrollment rates have generally increased among high school graduatesbetween the ages of 18 and 24 for blacks, Hispanics, and whites since the late1980s (U.S. Department of Education, 2001b). The share of black high schoolgraduates between the ages of 18 and 24 who were enrolled in a degree-granting institution remained virtually unchanged between 1979 and 1989(28.9 percent versus 29.4 percent) but increased through the 1990s to39.6 percent in 1999. Similarly, the shares of Hispanic high school graduatesbetween the ages of 18 and 24 who were enrolled in college were comparablein 1979 and 1989 (29.1 percent versus 29.4 percent) but higher in 1999(32.8 percent). In contrast, the share of white high school graduates enrolledin college increased between both 1979 and 1989, from 31.6 percent to39.6 percent, and 1989 and 1999, to 46.1 percent (U.S. Department ofEducation, 2001b).
20
25
30
35
40
45
50
1974 1979 1984 1989 1994 1999
Perc
ent E
nrol
led
White Black Hispanic
FIGURE 5Enrollment Rates of 18- to 24-Year-Old High School Graduatesin Degree-Granting Institutions by Race or Ethnicity, 1972 to1999
Note: Data adjusted using a three-year rolling average.SOURCE: NCES (2001). Digest of Education Statistics 2000.

17Retaining Minority Students in Higher Education
As can be seen in Figure 5, by 1999, large gaps still existed in the enroll-ment rates of students by race and ethnicity. Black students lagged 6 percentbehind white students, and Hispanic students lagged 13 percent behind whitestudents. It is disconcerting that this gap has not been reduced in the pasttwenty years. More disconcerting is the fact that it appears to be broadeningbetween some groups (U.S. Department of Education, 2001b).
Representation Among Undergraduate Enrollments. A second indicatorof racial and ethnic group differences in college enrollment rates is differencesin the representation of various racial and ethnic groups among undergraduateenrollments. At four-year colleges and universities, the representation ofAfrican Americans and Hispanics attending full time for the first timeincreased between 1986 and 1997.
Figure 6 shows an increase in representation from 9.4 percent to 11 per-cent for African Americans and an increase from 3.2 percent to 8.3 percentfor Hispanics. Despite this progress, the representation of African Americansand Hispanics among first-time, full-time freshmen at four-year institutionscontinues to be lower than their representation in the traditional college-age
Perc
ent
0
10%
20%
30%
10.2 9.4 11.0
2.1 3.2
8.31.4
5.9
3.3
1976 1986 1997
African American
Hispanic
Asian
FIGURE 6Trends in the Representation of First-Time, Full-Time Freshmenat Four-Year Institutions, 1976, 1986, and 1997
SOURCE: Analyses of Integrated Postsecondary Data Systems, Fall Enrollment Surveys.

18
population. In 1995, of the traditional college-age population (18 to 24 yearsold), 14.3 percent was African American and 13.7 percent was Hispanic(Nettles and Perna, 1997).
In addition to being less likely than whites to enroll in a four-year college,African Americans, Hispanics, and Native Americans appear to be more likelyto enroll in a two-year institution. Table 1 shows that, unlike whites andAsians, African Americans, Hispanics, and Native Americans represented ahigher share of first-time, full-time freshmen attending two-year institutionsthan of first-time, full-time freshmen attending four-year institutions in fall1997.
The higher rate of enrollment in public two-year institutions comparedwith a four-year college or university is problematic for those interested inincreasing bachelor’s degree completion rates for traditionally underrepresentedpopulations. The reason is the low rates of transfer from public two-year col-leges to four-year institutions. Research shows that only 32 percent of whites,33 percent of African Americans, and 25 percent of Hispanics who firstenrolled in a public two-year college in 1995–96 had transferred to a four-year college or university within six years (Berkner, He, Cataldi, and Knepper,2002).
TABLE 1Number and Distribution of First-Time Full-Time FreshmenEnrolled in Four-Year and Two-Year Institutions, by Raceor Ethnicity, Fall 1997
Four-year Public two-year
N % N %
Total 1,154,229 100.0% 546,427 100.0%African American 126,442 11.0% 69,163 12.7%Native American 9,008 0.8% 8,145 1.5%Asian 67,893 5.9% 25,817 4.7%Hispanic 95,600 8.3% 52,342 9.6%White 831,006 72.0% 381,231 69.8%Nonresident 24,280 2.1% 9729 1.8%
Source: Analyses of Integrated Postsecondary Education Data Systems, Fall Enrollment Survey, 1997.

19Retaining Minority Students in Higher Education
Postsecondary Enrollment Within Two Years of Graduation. A thirdindicator of racial or ethnic group differences in college enrollment rates isprovided by data from the National Educational Longitudinal Study of 1988eighth graders (NELS:88). NELS:88 tracks the educational and occupationalexperiences of a cohort of students every two years beginning in the eighth gradeand into postsecondary education. Analyses of data from the third follow-upstudy (1994) show that, among individuals who graduated in high school in1992, a smaller share of Hispanics than of whites and Asians enrolled in sometype of postsecondary educational institution within two years of graduatingfrom high school (Berkner and Chavez, 1997). Public two-year collegeenrollment appeared to be more common among Hispanics than among whitesor blacks (Berkner and Chavez, 1997). Figure 7 shows that 34 percent ofHispanics enrolled in a public two-year college within two years of graduatingfrom high school, compared with 25 percent of whites and 23 percent of blacks.More than one-half (54 percent) of Asian high school graduates in 1992attended a four-year college or university by 1994, compared with only30.5 percent of Hispanic high school graduates (Berkner and Chavez, 1997).
Perc
ent
0
25%
50%
75%
100%
HispanicAsianAfricanAmerican
White
42.4
22.7
6.2
28.7
54.2
28.4
3.6
13.8
30.5
34.3
5.7
29.4
47.1
24.8
4.0
24.1
None
Other
Public 2-year
4-year
FIGURE 7Postsecondary Enrollment by 1994 of 1992 High SchoolGraduates by Race or Ethnicity
SOURCE: Berkner & Chavez, 1998, p. 7.
20
Racial and Ethnic Composition of College Attended. A fourth indicatorof racial and ethnic group differences in college enrollment is the racial andethnic composition of the college attended. Understanding the racialand ethnic composition of the undergraduate institution students attend isimportant, given that racial and ethnic minorities enrolled at predomi-nantly white campuses can face such additional obstacles to persistenceas racism, hostility, prejudice, discrimination, a “chilly” climate, institutionalbias, negative stereotypes, self-doubt, alienation, isolation, and culturalinsensitivity.
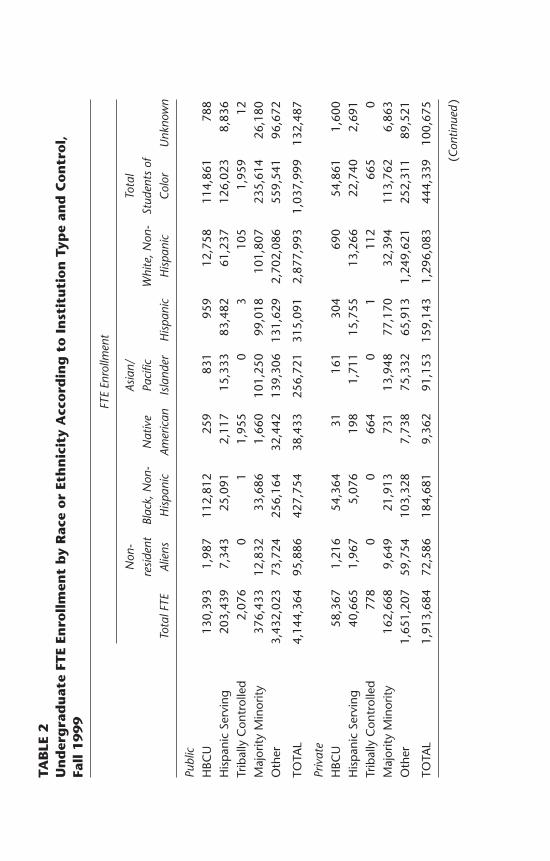
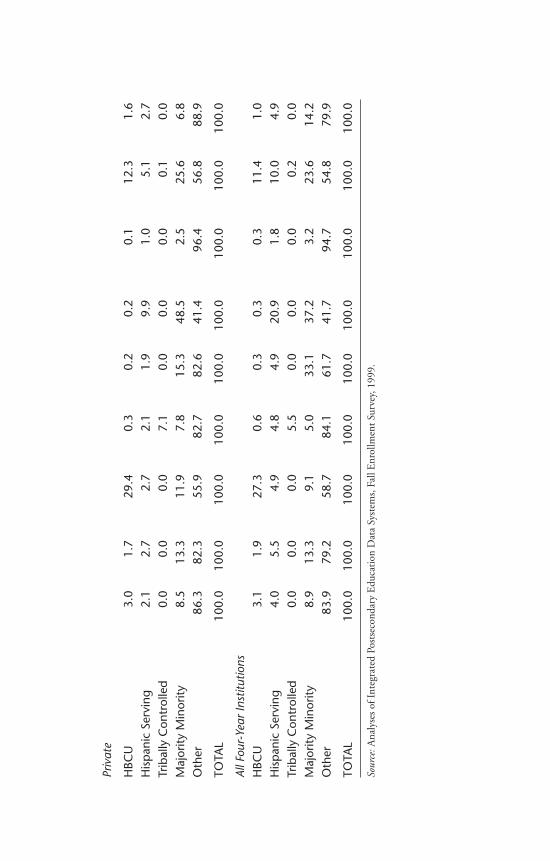
As a group, about one-half (53 percent) of African American, Hispanic,and Native American undergraduates attending four-year colleges and uni-versities full-time in fall 1999 were enrolled in a predominantly white four-year college or university, equivalent to about 600,000 students. Analyses ofdata from the Integrated Postsecondary Education Data System (IPEDS)1999 Fall Enrollment Survey show that the proportion of full-time under-graduates enrolled in a predominantly white four-year institution ranged from84 percent of Native American undergraduates to 60 percent of AfricanAmericans to 42 percent of Hispanics (see Table 2).
The label for these institutions reflects the racial and ethnic compositionof the undergraduate student body. In fall 1999, 92 percent of undergradu-ates who attended tribally controlled four-year institutions full time wereNative American, 89 percent of undergraduates who attended HBCUs fulltime were African American, and 41 percent of undergraduates who attendedfour-year Hispanic-serving institutions (HSIs) full time were Hispanic.
Nonetheless, these minority-serving institutions account for only a frac-tion of the nation’s undergraduate enrollments. Fewer than 1 percent of allfull-time undergraduates attending four-year colleges and universities nation-wide in fall 1999 were enrolled at a tribal institution, 3 percent at an HBCU,and 4 percent at an HSI. Although racial or ethnic minorities are more likelythan other undergraduates to attend these institutions, these institutions serveonly a relatively small share of racial and ethnic minorities. Only 5.5 percentof Native American full-time undergraduates were enrolled at a tribally con-trolled institution, 27 percent of African Americans were enrolled in anHBCU, and 21 percent of Hispanics were enrolled at an HSI.
TAB
LE 2
Un
der
gra
du
ate
FTE
Enro
llm
ent
by
Rac
e o
r Et
hn
icit
y A
cco
rdin
g t
o I
nst
itu
tio
n T
ype
and
Co
ntr
ol,
Fall
1999
FTE
Enro
llmen
t
Non
-As
ian/
Tota
lre
side
ntBl
ack,
Non
-N
ativ
ePa
cific
Whi
te, N
on-
Stud
ents
of
Tota
l FTE
Alie
nsH
ispa
nic
Amer
ican
Isla
nder
His
pani
cH
ispa
nic
Col
orU
nkno
wn
Publ
icH
BCU
130,
393
1,98
711
2,81
225
983
195
912
,758
114,
861
788
His
pan
ic S
ervi
ng20
3,43
97,
343
25,0
912,
117
15,3
3383
,482
61,2
3712
6,02
38,
836
Trib
ally
Con
trol
led
2,07
60
11,
955
03
105
1,95
912
Maj
ority
Min
ority
376,
433
12,8
3233
,686
1,66
010
1,25
099
,018
101,
807
235,
614
26,1
80O
ther
3,43
2,02
373
,724
256,
164
32,4
4213
9,30
613
1,62
92,
702,
086
559,
541
96,6
72
TOTA
L4,
144,
364
95,8
8642
7,75
438
,433
256,
721
315,
091
2,87
7,99
31,
037,
999
132,
487
Priv
ate
HBC
U58
,367
1,21
654
,364
3116
130
469
054
,861
1,60
0H
isp
anic
Ser
ving
40,6
651,
967
5,07
619
81,
711
15,7
5513
,266
22,7
402,
691
Trib
ally
Con
trol
led
778
00
664
01
112
665
0M
ajor
ity M
inor
ity16
2,66
89,
649
21,9
1373
113
,948
77,1
7032
,394
113,
762
6,86
3O
ther
1,65
1,20
759
,754
103,
328
7,73
875
,332
65,9
131,
249,
621
252,
311
89,5
21
TOTA
L1,
913,
684
72,5
8618
4,68
19,
362
91,1
5315
9,14
31,
296,
083
444,
339
100,
675
(Con
tinue
d)

TAB
LE 2
Un
der
gra
du
ate
FTE
Enro
llm
ent
by
Rac
e o
r Et
hn
icit
y A
cco
rdin
g t
o I
nst
itu
tio
n T
ype
and
Co
ntr
ol,
Fall
1999 (
Co
nti
nu
ed)
FTE
Enro
llmen
t
Non
-As
ian/
Tota
lre
side
ntBl
ack,
Non
-N
ativ
ePa
cific
Whi
te, N
on-
Stud
ents
of
Tota
l FTE
Alie
nsH
ispa
nic
Amer
ican
Isla
nder
His
pani
cH
ispa
nic
Col
orU
nkno
wn
All F
our-
Year
Inst
itutio
nsH
BCU
188,
760
3,20
316
7,17
629
099
31,
263
13,4
4716
9,72
12,
388
His
pan
ic S
ervi
ng24
4,10
49,
311
30,1
672,
314
17,0
4599
,237
74,5
0314
8,76
411
,527
Trib
ally
Con
trol
led
2,85
30
12,
619
05
217
2,62
512
Maj
ority
Min
ority
539,
101
22,4
8155
,599
2,39
211
5,19
917
6,18
713
4,20
234
9,37
633
,043
Oth
er5,
083,
230
133,
478
359,
492
40,1
8021
4,63
819
7,54
13,
951,
707
811,
852
186,
193
TOTA
L6,
058,
048
168,
472
612,
436
47,7
9434
7,87
447
4,23
44,
174,
076
1,48
2,33
823
3,16
2
Perc
enta
ge o
f FTE
Enr
ollm
ent
Publ
ic
HBC
U3.
12.
126
.40.
70.
30.
30.
411
.10.
6H
isp
anic
Ser
ving
4.9
7.7
5.9
5.5
6.0
26.5
2.1
12.1
6.7
Trib
ally
Con
trol
led
0.1
0.0
0.0
5.1
0.0
0.0
0.0
0.2
0.0
Maj
ority
Min
ority
9.1
13.4
7.9
4.3
39.4
31.4
3.5
22.7
19.8
Oth
er82
.876
.959
.984
.454
.341
.893
.953
.973
.0
TOTA
L10
0.0
100.
010
0.0
100.
010
0.0
100.
010
0.0
100.
010
0.0
Priv
ate
HBC
U3.
01.
729
.40.
30.
20.
20.
112
.31.
6H
isp
anic
Ser
ving
2.1
2.7
2.7
2.1
1.9
9.9
1.0
5.1
2.7
Trib
ally
Con
trol
led
0.0
0.0
0.0
7.1
0.0
0.0
0.0
0.1
0.0
Maj
ority
Min
ority
8.5
13.3
11.9
7.8
15.3
48.5
2.5
25.6
6.8
Oth
er86
.382
.355
.982
.782
.641
.496
.456
.888
.9
TOTA
L10
0.0
100.
010
0.0
100.
010
0.0
100.
010
0.0
100.
010
0.0
All F
our-
Year
Inst
itutio
nsH
BCU
3.1
1.9
27.3
0.6
0.3
0.3
0.3
11.4
1.0
His
pan
ic S
ervi
ng4.
05.
54.
94.
84.
920
.91.
810
.04.
9Tr
ibal
ly C
ontr
olle
d0.
00.
00.
05.
50.
00.
00.
00.
20.
0M
ajor
ity M
inor
ity8.
913
.39.
15.
033
.137
.23.
223
.614
.2O
ther
83.9
79.2
58.7
84.1
61.7
41.7
94.7
54.8
79.9
TOTA
L10
0.0
100.
010
0.0
100.
010
0.0
100.
010
0.0
100.
010
0.0
Sour
ce:A
naly
ses
of I
nteg
rate
d Po
stse
cond
ary
Edu
cati
on D
ata
Syst
ems,
Fal
l Enr
ollm
ent S
urve
y, 1
999.
24
Although about 7 percent of full-time undergraduates nationwide attendeda four-year institution that was officially designated a tribal college, HBCU,or HSI in fall 1999, 9 percent of full-time undergraduates attended collegesand universities with a student body that may be characterized as “majorityminority.” These institutions appear to be relatively more popular withHispanic and Asian American or Pacific Islander undergraduates; 37 percent ofHispanics and 33 percent of Asians were enrolled in majority minorityinstitutions in fall 1999, compared with 9 percent of African Americans and5 percent of Native Americans.
Critical Juncture 4: Persistence in College to Bachelor’sDegree CompletionThe fourth critical juncture on the road to a bachelor’s degree is persistencein the selected four-year college or university until the degree program iscompleted. The lower representation of African Americans, Hispanics, andNative Americans among bachelor’s degree recipients than among under-graduate enrollments is one indicator of lower persistence rates for thesegroups. Figure 8 shows that African Americans received only 9 percent of thebachelor’s degrees awarded to U.S. citizens in 1999–00, even though they rep-resented 12.1 percent of U.S. citizen first-time, full-time freshmen enroll-ments in fall 1999. Similarly, Hispanics accounted for 6.3 percent of bachelor’sdegree recipients in 1999–00 but 8.1 percent of first-time, full-time freshmenenrollments in fall 1999. Native Americans represented 0.7 percent of bach-elor’s degree recipients but 1 percent of first-time, full-time freshmen.
Comparisons between the representation among bachelor’s degree recipi-ents and undergraduate enrollments are limited because they compare twodifferent groups of students at one point in time. A better indicator of racialand ethnic group differences in undergraduate persistence rates is provided bystudies that track the experiences of one group of students over a period of time.The Beginning Postsecondary Student Survey is a nationally representative sur-vey sponsored by the U.S. Department of Education’s National Center for Edu-cation Statistics (NCES). Figure 9 shows that only 46 percent of AfricanAmericans and 47 percent of Hispanics who first enrolled in a four-year insti-tution in 1995–96 with the goal of completing a bachelor’s degree actually

25Retaining Minority Students in Higher Education
completed a bachelor’s degree within six years, compared with 67 percent ofwhites and 72 percent of Asians (Berkner, He, Cataldi, and Knepper, 2002).
The rate of completing a bachelor’s degree at the institution in which a stu-dent first enrolled within six years is higher for students who first enrolled in aprivate than a public four-year institution, regardless of race and ethnicity. Butsix-year bachelor’s degree completion rates are lower for African Americans andHispanics than for whites and Asians at both types of institutions. Table 3shows that only one-third of African Americans (33.6 percent) and Hispanics(34.1 percent) who first enrolled at a public four-year institution completed abachelor’s degree at that institution within six years, compared with nearly half(48.1 percent) of whites and more than half (57.5 percent) of Asians (Berkner,He, Cataldi, and Knepper, 2002).
10.9
1.2
9.39.0
0.7
6.5 6.3
9.0
0.6
5.8
4.8
7.1
0.7
11.0
4.9
6.6
0.5
7.1
3.8
5.0
0
3
6
9
12
African American American Indian Asian Hispanic
Dotted Line � Percent of Population
Associate
Bachelor’s
Master’s
First-Professional
Doctorate
FIGURE 8Distribution of Enrollments and Degree Recipients by Raceor Ethnicity, 1999–2000
Note: Percentages represent share of U.S. citizens (excludes nonresident aliens from the totals).SOURCE: Digest of Education Statistics 2001. National Center for Education Statistics 2002.

26
TABLE 3Percentage of Students Who First Entered a Public orPrivate Not-for-Profit Four-Year Institution in 1995–96 WhoCompleted a Bachelor’s Degree at That Institution Within SixYears, by Race or Ethnicity
Private, Not-For-Race or Ethnicity Total* Public Four-Year Profit Four-year
Total 55.3% 45.5% 61.0%African American 40.9 33.6 46.6Asian 63.8 57.5 69.7Hispanic 41.3 34.1 48.7White 59.0 48.1 64.0
Note: Total includes only students who reported that earning a bachelor’s degree was a goal.Source: Berkner, He, Cataldi, and Knepper, 2002.
Perc
ent Q
ualif
ied
0%
25%
50%
75%
100%
37
63
42
25
41
67
Total AfricanAmerican
Asian Hispanic White
Within four years Within six years
21
46
72
47
FIGURE 9Bachelor’s Degree Attainment Rates for Students Who FirstEnrolled in a Four-Year Institution in 1995–96 with the Goalof Completing a Bachelor’s Degree, by Race or Ethnicity
SOURCE: Berkner and Chavez, 1997.
Importance of Raising Bachelor’s Degree Completion RatesThe continued racial or ethnic group differences in bachelor’s degreecompletion have at least three types of implications: (1) differences ineconomic and noneconomic benefits for different racial and ethnic groups;

27Retaining Minority Students in Higher Education
(2) less than optimal economic and noneconomic benefits to society;and (3) reduced racial and ethnic group access to advanced degrees andcareers.
Differences in Economic Benefits. Continued racial and ethnic groupdifferences in bachelor’s degree attainment suggest that a substantially smallershare of Hispanics and blacks than of whites and Asians are able to take advan-tage of the economic and social benefits associated with earning a collegedegree. Research shows that individuals who attend and graduate from col-lege realize a number of short-term and long-term economic and non-economic benefits (Adelman, 1999; Pascarella and Terenzini, 1991). Theshort-term benefits include enjoyment of the learning experience, involvementin extracurricular activities, participation in social and cultural events, andenhancement of social status. Long-term or future benefits include higherlifetime earnings, a more fulfilling work environment, better health, longer life,more informed purchases, and lower probability of unemployment (Bowen,1980; Leslie and Brinkman, 1988; McPherson, 1993).
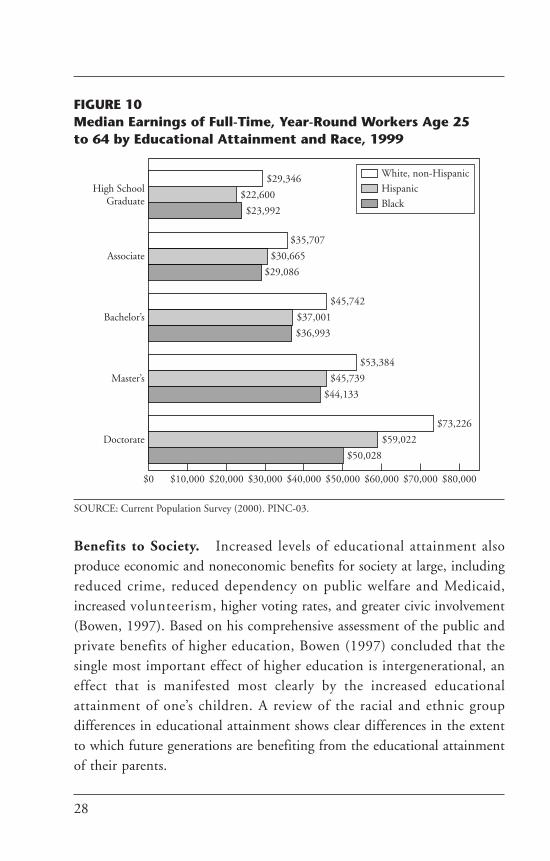
The economic benefits of graduating from college are most clearly evi-denced by comparing individual incomes with levels of educational attainment.Figure 10 shows that median earnings increase with the level of educationattained, regardless of race or ethnicity. For blacks, median earnings for full-time, year-round workers age 25 to 64 increased from about $24,000 for thosewhose highest level of education is high school to about $37,000 forthose whose highest level of education is a bachelor’s degree. For Hispanics,the increase is from $22,600 to about $37,000.
The economic benefits of earning at least a bachelor’s degree are alsoreflected by the substantial decline in poverty rates associated with higher levelsof educational attainment. Figure 11 shows that, regardless of race, the share ofadults living below the poverty level declines as the level of education attainedincreases. The benefits to increasing levels of education appear to be particu-larly dramatic for African Americans. About 34 percent of blacks age 25 andolder who have not completed high school are living below the poverty level,compared with only 3 percent of blacks age 25 and older who have completedat least a bachelor’s degree.
28
Benefits to Society. Increased levels of educational attainment alsoproduce economic and noneconomic benefits for society at large, includingreduced crime, reduced dependency on public welfare and Medicaid,increased volunteerism, higher voting rates, and greater civic involvement(Bowen, 1997). Based on his comprehensive assessment of the public andprivate benefits of higher education, Bowen (1997) concluded that thesingle most important effect of higher education is intergenerational, aneffect that is manifested most clearly by the increased educationalattainment of one’s children. A review of the racial and ethnic groupdifferences in educational attainment shows clear differences in the extentto which future generations are benefiting from the educational attainmentof their parents.
$50,028
$44,133
$36,993
$29,086
$23,992
$59,022
$45,739
$37,001
$30,665
$22,600
$73,226
$53,384
$45,742
$35,707
$29,346
$0 $10,000 $20,000 $30,000 $40,000 $50,000 $60,000 $70,000 $80,000
Doctorate
Master’s
Bachelor’s
Associate
High SchoolGraduate
White, non-Hispanic
Hispanic
Black
FIGURE 10Median Earnings of Full-Time, Year-Round Workers Age 25to 64 by Educational Attainment and Race, 1999
SOURCE: Current Population Survey (2000). PINC-03.

Access to Advanced Degrees and Careers. Third, because a bachelor’s degreeis a prerequisite for enrollment in a professional, master’s, or doctoraldegree program, continued racial or ethnic group differences in completion of abachelor’s degree mean that the share of African Americans, Hispanics, and NativeAmericans eligible to enroll in an advanced degree program is necessarily smallerthan the share of whites and Asians. The representation of African Americans,Hispanics, and Native Americans declines as the degree level increases. Forexample, African Americans received 9.6 percent of associate’s degrees and7.8 percent of bachelor’s degrees awarded in 1996–97 but only 6.4 percent ofmaster’s degrees, 6.5 percent of first professional degrees, and 3.9 percentof doctoral degrees. Hispanics received 8.1 percent of associate’s degrees and6.3 percent of bachelor’s degrees awarded but only 3.9 percent of master’s degrees,5.3 percent of first professional degrees, and 2.5 percent of doctoral degrees.
Possession of an advanced degree typically provides access to the highest pay-ing, highest status, most influential careers and occupations (Figure 12). Indi-viduals who complete no more than high school dominate service occupations;
29Retaining Minority Students in Higher Education
17 17
89
22
34
26
20
9
18
14
86
119
53 3
7
3
0
10%
20%
30%
40%
Total Less thanHS
HighSchool
SomeCollege
Bachelor’sor More
Perc
ent
Total
Black
Hispanic
White (incl. Hispanic)
FIGURE 11Percent of People Age 25 and Older Below the Poverty Levelby Race and Educational Attainment, 1999
SOURCE: Current Population Survey (2000). Detailed Poverty Package.
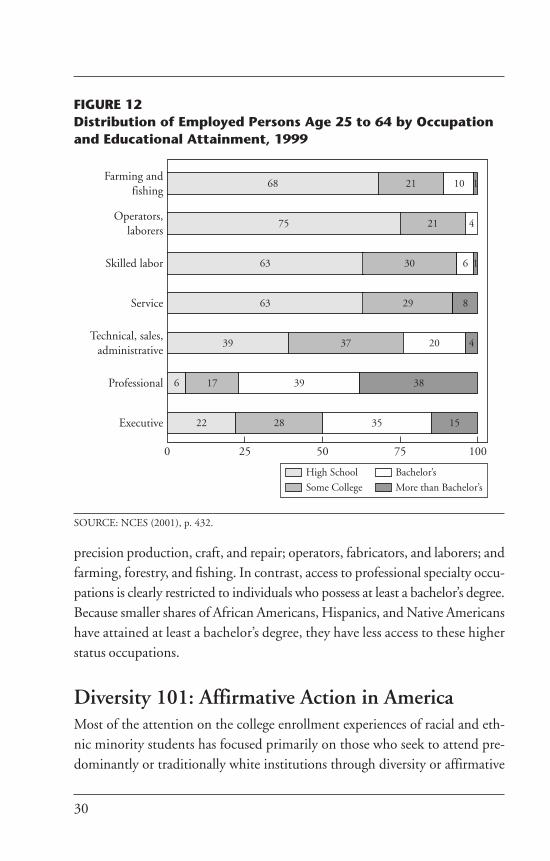
precision production, craft, and repair; operators, fabricators, and laborers; andfarming, forestry, and fishing. In contrast, access to professional specialty occu-pations is clearly restricted to individuals who possess at least a bachelor’s degree.Because smaller shares of African Americans, Hispanics, and Native Americanshave attained at least a bachelor’s degree, they have less access to these higherstatus occupations.
Diversity 101: Affirmative Action in AmericaMost of the attention on the college enrollment experiences of racial and eth-nic minority students has focused primarily on those who seek to attend pre-dominantly or traditionally white institutions through diversity or affirmative
30
High School
Some College More than Bachelor’s
Bachelor’s
0 25 50 75 100
22
6
39
63
63
75
68
28
17
37
29
30
21
21
35
39
20
8
6
4
10
15
38
4
1
1
Executive
Professional
Technical, sales,administrative
Service
Skilled labor
Operators,laborers
Farming andfishing
FIGURE 12Distribution of Employed Persons Age 25 to 64 by Occupationand Educational Attainment, 1999
SOURCE: NCES (2001), p. 432.
action programs (Redd, 2001; Reisberg, 2000). Several recent federal courtrulings and voter initiatives have eliminated the use of affirmative action pro-grams at a number of public colleges and universities, however, and the sub-stitutes to racial preference programs thus far offered by policymakers may notprovide minority students with similar opportunities to attend selective highereducation institutions. And although enrollment of minority students hasreceived much of the general public’s attention, retention rates of students ofcolor at predominantly white institutions may be a much bigger concern.Thus, the role that minority-serving institutions, particularly HBCUs andHSIs, play in providing educational opportunities may become increasinglymore important in the years ahead. But will these institutions have theresources needed to educate an increasing number of minority students?
Affirmative Action, Minority Student Access to College,and College Retention: What Does the Future Hold?The recent decision by the U.S. Supreme Court allowing the University ofMichigan to continue considering race as a factor in student admissions has onceagain brought affirmative action to the forefront of American higher education.However, while the court’s five-to-four ruling in Grutter v. Bollinger allows selec-tive colleges and universities to continue to use affirmative action plans to recruitand retain a “critical mass” of African American, Hispanic, and Native Ameri-can students, it also urges college officials to prepare to dismantle racial diver-sity plans within twenty-five years (Lane, 2003). On the same day, the SupremeCourt’s ruling in Gratz v. Bollinger struck down the University of Michigan’sundergraduate affirmative action admissions plan, which used a point systemto rank prospective student applications. The two rulings mean that selectiveinstitutions are allowed to use affirmative action programs as long as institu-tions’ admissions officers consider each prospective student’s individual charac-teristics and academic records without using a point or ranking system. That is,race may be a “plus factor” in admissions decisions (Lane, 2003, p. A1).
While proponents of affirmative action hailed the court’s decisions as avictory for higher education, opponents believe they will lower standards forgraduation, increase dropout and flunk rates, and stigmatize qualified minor-ity students with the presumption that their matriculation is attributable to
31Retaining Minority Students in Higher Education
their race rather than their academic abilities (Levey, 2003). While theSupreme Court’s decision has clarified the legality of affirmative action plansfor colleges and universities, it has not ended the contentious debate on thisissue.
The Supreme Court’s recent ruling is just one in a series of legal challengesto the use of racial preferences to diversify college campuses. Prior to theGrutter decision, federal court rulings and voter initiatives eliminated the useof affirmative action programs at a number of public colleges and universities,and it was not clear if the substitutes to racial preference programs offered bypolicy makers would have provided minority students with similar opportu-nities to attend selective higher education institutions.
Most attention on the college enrollment experiences of racial and eth-nic minority students has focused on those who seek to attend predomi-nantly or traditionally white institutions through diversity or affirmativeaction programs (Redd, 2001; Reisberg, 2000). However, while enrollmentof minority students has received much of the general public’s attention,retention rates of students of color at predominantly white institutions maybe a much bigger concern. Thus, even with the Supreme Court’s endorse-ment of racial preference programs at predominantly white colleges anduniversities, the role that minority-serving institutions, particularly histor-ically black colleges and universities (HBCUs) and Hispanic-serving insti-tutions (HSIs), play in providing educational opportunities may becomeincreasingly more important in the years ahead. But will these institutionshave the resources needed to educate an increasing number of minoritystudents?
This chapter provides a brief history of the use of affirmative action pro-grams in higher education and the legal challenges to diversity initiatives thatemerged during the 1980s and 1990s and culminated in the Grutter v.Bollinger decision. The study also looks at the alternative policies that stateshave attempted to use to diversify their college campuses. However, thesestrategies have not dealt with low minority student retention. Given the con-troversy surrounding affirmative action, the study also examines the roleminority-serving institutions may play in providing educational opportuni-ties to minority students in the years ahead.
32
A Brief History of Affirmative Action in Higher Education. The term“affirmative action” originates with the administration of President John F.Kennedy. In 1961, he issued Executive Order 10925, which created theCommittee on Equal Employment Opportunity (later renamed the EqualEmployment Opportunity Commission) and mandated that all projectsfinanced with federal funds take “affirmative action” to “ensure that hiring andemployment practices are free of racial bias” (Brunner, 2002). Later, beginningin the administration of President Lyndon B. Johnson, the concept ofaffirmative action was expanded to include “active measures . . . taken toensure that blacks and other minorities enjoyed the same opportunities forpromotions, salary increases, career advancement, school admissions, scholarships,and financial aid that had been the nearly exclusive province of whites. Fromthe outset, affirmative action was envisioned as a temporary remedy that wouldend once there was a ‘level playing field’ for all Americans” (Brunner, 2002,emphasis added).
There has never been a complete consensus on exactly what strategiescolleges and universities were to use to achieve this “level playing field” inhigher educational opportunity. However, eventually affirmative action andracial/ethnic diversity programs in college admissions and financial aid pro-grams were generally accepted by most selective higher education institu-tions under criteria established by Justice Lewis F. Powell’s opinion in theU.S. Supreme Court’s 1978 decision Regents of the University of Californiav. Bakke. In Bakke, Powell wrote that “[w]hile the goal of achieving adiverse student body is sufficiently compelling to justify consideration ofrace in admissions decisions under some circumstances” (438 U.S. 265),schools could not use inflexible quotas or numerical goals to reach theirdiversity targets (Brunner, 2002). For practically the next twenty years, pub-lic and private colleges and universities generally considered Powell’s opin-ion in Bakke the “law of the land” (Bakst, 2000) and used the Powellstandards to implement affirmative action plans in admissions and finan-cial aid to help achieve diversity on campus (Bakst, 2000). However, dur-ing the 1990s, a series of decisions by federal appeals courts and voterinitiatives challenged the legality of affirmative action programs establishedunder Bakke.
33Retaining Minority Students in Higher Education

Challenges to the Bakke Standard. One of the most important recent legalactions that began to limit the scope of affirmative action plans under Bakkewas the Hopwood v. Texas decision of 1996 (78 F.3d 932), in which the U.S.Fifth Circuit Court of Appeals ruled that the goal of racial diversity was not a“compelling interest” for higher education institutions to use affirmative actionin admissions (Bakst, 2000; Pine, 2001). Many observers initially believedthat, for all intents and purposes, this decision made it illegal for public highereducation institutions in Texas and the other states covered by the Fifth Circuit(Louisiana and Mississippi) to use “race as a factor in admissions, financial aid,or retention programs” (Lum, 1997).
In the fall of 1996, soon after the Hopwood decision, California votersapproved Proposition 209, which outlawed the use of race in determiningadmissions to any of the state’s public colleges and universities, and in stategovernmental hiring or contracting (Lynch, 2001). Two years later, voters inWashington state passed Initiative 200 (I-200), which, like Proposition 209,ended the use of racial preferences in state college admissions, hiring, and con-tracts (Bakst, 2000; Pine, 2001).
In addition, the Florida Board of Regents unanimously approved the“One Florida” plan, which, beginning in the fall of 2001, abolished the useof affirmative action in state college and university admissions and replacedthe racial preference programs with a plan that would guarantee admissionto the state’s four-year public colleges and universities to any Florida highschool senior who graduated in the top 20 percent of his or her class (Redd,2001). And in Georgia, the U.S. Eleventh Circuit Court of Appeals,in Johnson v. Board of Regents of the University of Georgia, outlawed anaffirmative action plan the university used to recruit minority students.Observers of the Johnson decision believed that “even a narrowly tailoredrace-based admissions process violates the Constitution” (Bean, 2001). Andin 1997, Barbara Grutter filed suit against the University of Michigan LawSchool, claiming that its affirmative action policy allowed minority studentswith lower grades and test scores to be admitted while she was denied admis-sion. A similar suit against Michigan’s undergraduate program was filed thatsame year by Jennifer Gratz and Patrick Hamacher (Lane, 2003; Williams,2003).
34

Two key reasons help explain the push by the federal courts and voters toeliminate affirmative action in higher education. First, some whites believe thepolicies unfairly keep them out of the most selective undergraduate and grad-uate school programs. As Cheryl Hopwood, lead plaintiff in the Hopwood case,argued, “the [University of Texas Law School] discriminated against me. It gavemy spot to a minority student because I happen to be white” (Hentoff, 1997).Such claims of “reverse discrimination” by whites apparently have had somesaliency with voters and federal judges in several jurisdictions. Richard Cohen,a columnist for the Washington Post, eloquently expresses the frustrations andresentment many whites feel about affirmative action in college admissions:“There is a growing, smoldering anger at a system of perceived racialfavoritism. Away from university administrative offices . . . it is widely believedthat the undeserving are being admitted, promoted, hired or whatever. Some-times that happens to be the case” (Cohen, 2002).
Second, some believe affirmative action programs have outlived theirusefulness and do not accurately reflect our nation’s current racial climate andthe gains made by persons of color, particularly African Americans. Theybelieve our country has now reached the “level playing field” envisioned whenaffirmative action plans were developed forty years ago. This view is bestsummarized by Cohen (2002):
Of course, we all know the reasons for affirmative action. But aprogram devised to overcome the harmful effects of slavery and JimCrow cannot persist as if racial discrimination has not abated. Thesecretary of state [Colin Powell] is black. The national securityadvisor [Condoleezza Rice] is black. Leaders at AOL-Time Warner[Richard Parsons], American Express [Kenneth Chenault] andMerrill Lynch [E. Stanley O’Neal] are black. So is the president ofBrown University [Ruth Simmons]. America has changed. Affir-mative action seems more like a patronage system than a way ofachieving justice.
It is almost fifty years since the Supreme Court struck down school segre-gation in the landmark Brown v. Board of Education of Topeka decision of 1954,
35Retaining Minority Students in Higher Education

36
yet we persist in seeing blacks as victims. The immediate victims of racism arequickly passing, but succeeding generations are considered just as victimized,regardless of circumstances of their birth. Paradoxically, though, the efforts torectify that discrimination not only uses its methods—preferences based onrace—but certifies its reasoning: On account of race, this person cannotcompete on his or her own.
The “X Percent” Solution. Despite the gains made by African Americansand other groups over the past four decades, evidence shows very clearly that,in general, racial/ethnic minorities still are less likely to attend a postsecondaryeducation institution, particularly an institution with selective admissionscriteria. From 1997 to 2000, the average college participation rates forfinancially dependent eighteen-to-twenty-four-year-old African American andHispanic high school graduates were 46 percent and 40 percent, respectively,compared with 64 percent for white non-Hispanics (Mortenson, 2001b).Further, according to preliminary data from the National Center for EducationStatistics, just 36 percent of the African American undergraduates and31 percent of Latinos at four-year colleges and universities in 1999–2000attended schools classified under the Carnegie Classification system as researchor doctoral (generally, these are the institutions with the most selectiveadmissions criteria). Conversely, about 44 percent of white non-Hispanicundergraduates attended research or doctoral institutions (U.S. Departmentof Education, 2001a).
The gaps between enrollment rates for minority and white students con-tinue to persuade state higher education leaders to seek ways to diversifytheir college campuses, particularly those with selective admissions criteria,without using affirmative action plans that might be challenged in court.In addition to Florida, education leaders in California and Texas haveinitiated so-called “x percent solutions,” whereby some percentage of eachof the respective state’s high school graduating class is automatically eligi-ble for admission to a public state university. For example, in California,the top 4 percent of the high school class is now automatically eligible foradmission to a campus within the University of California system; in Texas,it is 10 percent (Selingo, 2000). Policy makers hope these plans will

attract more students from high schools with large minority populations.California recently went one step further by establishing a “comprehensivereview” system that seeks to look beyond traditional measures of high schoolacademic performance, such as grade point averages and scores on theScholastic Aptitude Test, when determining which students to admit (Pine,2001).
But the success of these alternatives to affirmative action may be limited.X percent solutions have been criticized for exploiting students at raciallysegregated high schools without improving the students’ educational programs.The plans may also hurt minority students who do well academically atpredominantly white high schools, but do not graduate in the required toppercentile (Selingo, 2000). Ironically, the x percent solutions may prove to offera greater benefit to white students. In Florida, for example, white studentsaccounted for 59 percent of the total number of high school seniors in 2000,but made up about two-thirds of the top fifth of the graduating classes. AfricanAmericans, on the other hand, accounted for 23 percent of the graduatingseniors but constituted just 14 percent of the top fifth (Selingo, 2000). In Texas,enrollments at the University of Texas at Austin and Texas A&M Universitydeclined from 1997 to 2003 (Flores, 2003). Soon after the Grutter decisionwas announced, officials at the University of Texas System Board of Regentsannounced that they were abandoning the state x percent plan in favor of anaffirmative action plan that complied with the Supreme Court’s Grutterstandards.
An Expanded Role for Minority-Serving Institutions? Despite therecent Supreme Court decision, there are still potential problems ahead forthe future of affirmative action. Opponents of the Grutter decision havelaunched a plan to place anti–affirmative action initiatives similar to those inCalifornia and Washington on the ballots of Michigan, Colorado, Missouri,and other localities in time for the 2004 presidential election (Milbank,2003). Further, some believe the court’s ruling is temporary at best, as itleaves diversity plans open to court challenges (McClinton, 2003). Further,neither traditional affirmative action plans nor the x percent solutionsaddress the concerns about minority student retention at traditionally white
37Retaining Minority Students in Higher Education

schools. While these programs are designed to increase enrollment of studentsof color at majority-white institutions, some observers are now beginning toquestion the programs’ ability to retain these students toward degreecompletion. Research by Pascarella and Terenzini (1991) has suggested thatAfrican Americans at predominantly white institutions are more likely thanthose at HBCUs to experience high levels of social isolation, alienation,personal dissatisfaction, and overt racism. Because of these factors, it ispossible that minority students at predominantly white schools may be atgreater risk of leaving their institutions before completing their degreeprograms.
Indeed, while college enrollments have received much of the attention ofthe popular media and the courts, the gap in retention rates between whiteand minority students is often a greater concern. The most recent graduationreport from the National Collegiate Athletic Association (NCAA) shows thatthe six-year graduation rate for African American undergraduates (athletesand nonathletes) at the 321 schools that are members of Division I of theNCAA was just 38 percent. That is, only 38 percent of the blacks who enteredDivision I colleges in academic year 1993–1994 as full-time, full-year, degree-seeking freshmen had received a bachelor’s degree from their original institutionsby August 2000. The rest had either transferred to a new school, droppedbelow full-time attendance status, took longer than six years to graduate, ordropped out of higher education altogether. The graduation rate for whitestudents was 59 percent, and for Hispanics the rate was 46 percent (NCAA2001a). At the 295 institutions that are members of NCAA Division II,which tends to have less selective undergraduate admissions criteria, the grad-uation rate for degree-seeking African American undergraduates was just32 percent, versus 45 percent for white students and 39 percent for Hispanic(NCAA, 2001b).
The situation for policy makers who seek to increase minority enrollmentsat traditionally white schools therefore still appears to be precarious, despitethe Grutter decision. They still face potential legal and voter challenges to theuse of affirmative action programs and policies, perceived inadequacy ofthe alternative diversity strategies, perceptions of white institutions as beinginhospitable to students from different racial/ethic groups, and low graduation
38

rates among Latino and African American undergraduates. In the face of thesechallenges, minority-serving institutions—particularly HBCUs and HSIs—could play an even more important role in providing higher educationalopportunities to minority students.
Minority-serving institutions have a history of successfully educating anumber of African American and Latino students who otherwise could nothave received a college degree (Merisotis and O’Brien, 1998). HBCUs accountfor just 4 percent of all the four-year colleges and universities in the UnitedStates, but they enroll 26 percent of all African American students and pro-duce 28 percent of the black bachelor’s degree recipients (Redd, 2001). Simi-larly, HSIs account for 52 percent of the total Latino postsecondary educationstudent enrollment and 41 percent of the baccalaureate recipients (U.S.Department of Education, 2001b).
While minority-serving institutions have a demonstrated record of success(Merisotis and O’Brien, 1998), they still face two daunting challenges. First,when compared with many predominantly white institutions, many HBCUsand HSIs have fewer financial and other resources. In 1996, the most recentyear of available data, the average endowment at historically black colleges was$4 million (equivalent to $2,960 per full-time equivalent student). The aver-age endowment at all other four-year colleges and universities was $67.4 mil-lion, equivalent to $15,329 per full-time equivalent student (Sallie Mae,1999). Additionally, many of the students at HBCUs and other minority-serving institutions come from low-income backgrounds and are the first intheir families to enter postsecondary education. These students often needadditional financial aid, tutoring, and mentoring programs in order to suc-ceed. A number of HBCUs and HSIs simply do not have these additionalresources, and as a result some have higher-than-average attrition rates (SallieMae, 1999).
Where Do We Go from Here?The limits to affirmative action and x percent plans could not have come at amore challenging time for all higher education institutions generally andminority-serving institutions particularly. Demographic projections show thatthe number of Latino high school graduates will jump 67 percent over the
39Retaining Minority Students in Higher Education

next ten years, and the number of African American graduates will grow17 percent (WICHE, 1998). Many of these students will want to attend post-secondary education after their high school years. Will the HBCUs and HSIsbe able to expand their course offerings and facilities to meet the increasedneed? Given the relatively small number of HBCUs and HSIs, it does notappear very likely that they, by themselves, can meet this coming tide of newstudents. At the same time, data from the National Center for Education Sta-tistics (U.S. Department of Education, 2001a) show that African Americanand Latino high school graduates enroll in postsecondary education at lowerrates than whites. What role can minority-serving institutions play in revers-ing this trend?
Two recent shifts in student financial aid may also adversely affect futurepostsecondary education enrollments among minority groups. First, over thepast twenty years, more financial aid has been provided in the form of loansinstead of grants. According to the College Board (2001), in 1980–1981,55 percent of all student financial assistance was provided in the form ofgrants, and 43 percent was in loans (the remainder was work-study). By2000–2001, the share of aid from grants had fallen to just 41 percent, withthe percentage from loans rising to 58 percent. This trend may harm collegeaccess for prospective students from low-income families generally and peopleof color specifically because they tend to be more averse to borrowing studentloans than white students and those from higher income families (St. John,2001).
Additionally, more and more of the available grant aid has been deliveredin the form of merit scholarships, which base awards on students’ high schoolgrade point averages and other criteria instead of demonstrated financialneed. Since 1990, the total amount of state merit-based scholarships grew206 percent, but the amount of state need-based grants increased only41 percent (National Association of State Student Grant and Aid Programs,2001), and total spending for institutional merit scholarships and other “non-need” grants nearly doubled from 1989 to 1995 (Heller, 2001b). AfricanAmerican and Hispanic students are much less likely to meet the criteria nec-essary to benefit from the additional state merit-aid programs (Heller andRasmussen, 2001).
40
These challenges may limit the ability of the HBCUs, HSIs, and otherminority-serving institutions to support the larger number of students hop-ing to enter higher education. While most institutions, especially private col-leges and universities, still can now use the Grutter decision standards to designand implement affirmative action programs to diversify their campuses, it maybe only a matter of time before new challenges to diversity programs will forceinstitutions to come up with a new standard to close the gaps in college enroll-ment and retention.
41Retaining Minority Students in Higher Education

Why Students Leave College
THE LITERATURE REGARDING MINORITY STUDENTS’ droppingout abounds with details of why and when students leave college. Many of
the studies and literature reviews summarize similar sources and thus supply sim-ilar conclusions. Landmark studies by Tinto (1975), Pantages and Creedon(1978), Cope and Hannah (1975), Lenning, Beal, and Sauer (1980), and, morerecently, Tierney (1992), Cabrera, Nora, and Castaneda (1993), and Cabreraand La Nasa (2000), have shaped how researchers and practitioners view the issueof student retention and departure. In particular, Tinto’s attrition model hasbecome a foundation for most research regarding student departure.
Models of Student ProgressionThere are several models that depict how students flow through postsecondaryeducation. To provide a foundation for our discussion, we will showcase threeleading models here.
Tinto’s Student Integration ModelTinto’s theoretical model (1975) was derived from previous work by Spady(1970). Spady, like Tinto a sociologist, presented one of the early conceptualmodels of the student attrition process in higher education. Based onDurkheim’s theory of suicide, Spady suggested that suicide is more probablewhen individuals are poorly integrated into the shared structure and theorizedthat the social integration of students (shared group values, academic perfor-mance, normative congruence, and support of friends) increases that student’s
43Retaining Minority Students in Higher Education

institutional commitment, ultimately reducing the likelihood of studentattrition. Tinto (1975) expanded Spady’s theory to the process of student inte-gration into the academic and social systems of a higher education institution.His aim was to clarify the effect of multifaceted interactions within the systemon student persistence. “It is the interplay between the individual’s commit-ment to the goal of college completion and his commitment to the institutionthat determines whether or not the individual decides to drop out” (Tinto,1975, p. 96).
Briefly, Tinto’s student integration model consists of six characteristics (seeFigure 13). Before matriculation to postsecondary education, students developcertain attributes that are shaped by their familial upbringing. They alsodevelop academic and social skills and abilities in both formal and informalsettings. These skills and abilities in turn help form students’ goals and com-mitments regarding college, the workforce, and their place in society as awhole. During college, formal and informal college experiences influence thestudent’s level of integration into the college, academically and socially. Accord-ing to Tinto, this level of integration has an impact on the student’s develop-ment of goals and commitments, resulting in either a decision to persist in ordepart from college. Essentially, the match between student characteristics andinstitution shapes students’ goal commitments, which in turn influence per-sistence (Allen, 1994).
Tinto’s model refocused the higher education community’s understandingthat persistence is the outcome of the interaction between students and theirexperiences in the campus environment (Brower, 1992). Although Tinto’smodel accounted for student characteristics and campus experiences, it failedto include the interactions of students’ off-campus academic and social sys-tems (Tinto, 1982). Tinto acknowledged that these external, not-related-to-college variables might force students to reassess educational goals andcommitment to the institution. He failed, however, to address in detail theimpact of external campus factors such as finances, family obligations, andexternal peer groups in his student dropout model (Cabrera, Castaneda, Nora,and Hengstler, 1992; Tinto, 1982). Tinto also recognized that finances mighthave both long- and short-term and direct and indirect effects on collegepersistence.
44

Fam
ilyB
ackg
roun
d
Pre-
Ent
ryA
ttri
bute
sG
oals
/Com
mit
men
tsG
oals
/Com
mit
men
tsO
utco
me
Inst
itut
iona
lE
xper
ienc
esIn
tegr
atio
n
Inte
ntio
nsA
cade
mic
Inte
grat
ion
Soci
alIn
tegr
atio
n
Goa
l and
Inst
itut
iona
lC
omm
itm
ents
Ext
erna
lC
omm
itm
ents
Dep
artu
reD
ecis
ion
Skill
s an
dA
bilit
ies
Prio
rSc
hool
ing
Aca
dem
icPe
rfor
man
ce
Aca
dem
ic S
yste
m
Facu
lty/S
taff
Inte
ract
ions
Ext
racu
rric
ular
Act
ivit
ies
Form
al
Info
rmal
Soci
al S
yste
m
Ext
erna
l Com
mun
ity
Peer
Gro
upIn
tera
ctio
ns
Form
al
Info
rmal
Inte
ntio
ns
Goa
l and
Inst
itut
iona
lC
omm
itm
ent
Ext
erna
lC
omm
itm
ents
FIG
UR
E 13
Tin
to’s
Lo
ng
itu
din
al M
od
el o
f In
stit
uti
on
al D
epar
ture
(St
ud
ent
Inte
gra
tio
n M
od
el)
SOU
RC
E:T
into
, 199
3, p
. 114
.

In 1988, Tinto expanded his view of student dropouts to include a three-stage process: separation, transition, and incorporation. This model wasadapted from Van Gennep’s social anthropology theory, drawing a parallelbetween the movement of an individual from one group to another in tribalsocieties with the departure of a student from home and his or her incorpo-ration into the new college community (Fernandez, Whitlock, Maring, andVanEarden, 1998; Tinto, 1988). The separation stage refers to the student’sparting from past habits and patterns of associations. Tinto suggests that forstudents to consider themselves part of the college community, they must ina sense leave their former communities. During the transition stage, studentscope with stresses of departing from the familiar while not completely under-standing or integrating into the new college environment. The incorporationstage reflects students’ competency as an institutional member. After incorpo-ration, the student is no longer the person he or she once was; he has in effectbecome a new individual. This expanded view adds a time dimension in theform of longitudinal stages of the integration process (Figure 13) that specif-ically addresses the early stages of separation and transition and the sorts ofdifficulties students typically face academically and socially before their incor-poration into campus life. Lack of integration into the college campus mayalso result from students’ inability to separate themselves from past associa-tions to make the transition to the new community (Tinto, 1988).
Bean and Eaton’s Psychological ModelTinto’s model has been revised or enhanced by a number of researchers (Bean,1982; Stage, 1989; Brower, 1992; and Peterson, 1993). Bean (1982, 1986;Eaton and Bean, 1995; Bean and Eaton, 2000) used important aspects ofTinto’s academic and social integration theory in the development of a psy-chological rather than sociological model (see Figure 14). The purpose, accord-ing to Bean, was to help others “visualize how individual psychologicalprocesses can be understood in the retention process” (Bean and Eaton,2000, p. 55).
Bean’s model is based on the organizational process models of turnover,which emphasize the significance of behavioral intentions. Intentions to per-sist are influenced by students’ attitudes, which are shaped by their experiences
46

Past
Beh
avio
r
Bur
eauc
rati
cIn
tera
ctio
ns
Aca
dem
icIn
tera
ctio
ns
Soci
alIn
tera
ctio
ns
Inte
ract
ions
Ext
erna
l to
Inst
itut
ion
Inte
rnal
Att
ribu
tion
& M
otiv
atio
n
Feed
back
Pers
onal
ity
Init
ial S
elf-
Eff
icac
ySe
lf-E
ffic
acy
Ass
essm
ents
Posi
tive
Self-
Eff
icac
y
Red
uced
Stre
ss;
Incr
ease
dC
onfid
ence
Aca
dem
icIn
tegr
atio
n&
Perf
orm
ance
Inst
itut
iona
l Env
iron
men
t
Ent
ryC
hara
cter
isti
csE
nvir
onm
enta
lIn
tera
ctio
nsPs
ycho
logi
cal
Proc
esse
sPs
ycho
logi
cal
Out
com
esIn
term
edia
teO
utco
mes
Att
itud
esIn
tent
ion
Beh
avio
r
Inst
itut
iona
lFi
t
Inte
nt to
Pers
ist
Pers
iste
nce
Inst
itut
iona
lC
omm
itm
ent
(Loy
alty
)
Soci
alIn
tegr
atio
n
Cop
ing
Proc
ess
App
roac
h/A
void
ance
Att
ribu
tion
s:Lo
cus
ofC
ontr
ol
Init
ial
Att
ribu
tion
s
Nor
mat
ive
Bel
iefs
Cop
ing
Stra
tegi
es
Mot
ivat
ion
to A
tten
d
Skill
s an
dA
bilit
ies
Dir
ect
Eff
ects
FIG
UR
E 14
Bea
n a
nd
Eat
on
’s P
sych
olo
gic
al M
od
el o
f C
oll
ege
Stu
den
t R
eten
tio
n
SOU
RC
E: B
ean
and
Eat
on, 2
000,
p. 5
7.
with the institution. Bean’s model incorporates background, organizational,environmental, attitudinal, and outcome variables.
Bean introduced students’ intention to stay or leave into the attritionmodel, derived from psychological theories of Ajzen and Fishbein (1972,1977) and further developed by Bentler and Speckart (1979, 1981). The the-orists argue that a strong correlation exists between attitudes, intentions, andbehavior in students and that behaviors and attitudes often reflect one’s inten-tions (Bean, 1986; Eaton and Bean, 1995). Thus, a student’s attitude regard-ing college tends to influence the intent to persist or drop out.
Eaton and Bean (1995) injected coping behavior into previous attritionmodels to help explain a student’s adaptation to the campus structure. Theability to adapt to the campus environment is a reflection of the student’s abil-ity to cope, which is directly related to the repertoire of coping skills learnedfrom his or her experiences. “Coping is also dependent upon the situation,timing, and the behaviors with which the individual is familiar and comfort-able” (p. 619). Both Bean and Tinto note the level of academic and social inte-gration into the campus structure as indicators of an individual’s adaptationto college life. “Adaptation, as measured by social and academic integration,should be an attitudinal reflection of a student’s intention to stay or leavethe institution . . . ultimately linked to the student’s actual persistence ordeparture” (p. 620).
Shortcomings of the ModelsIn 1992, Cabrera, Castaneda, Nora, and Hengstler looked at both Tinto’s stu-dent integration model and Bean’s model of student departure and found thata blend of the two models provided a more comprehensive understanding ofpersistence than either theory alone. As well, they incorporated finances intothe student retention model. Although they found no significant direct effectof finances on student attrition, they found an indirect effect through inter-vening variables like students’ academic integration, socialization, and resolveto persist in college.
As Cabrera, Castaneda, Nora, and Hengstler’s study suggested (1992),Tinto’s and Bean’s models are not mutually exclusive and have more similar-ities than differences. Both models argue that precollege characteristics are
48
determinants of college behaviors and actions, that the student/institutionfit are important issues, and that persistence is a result of a complex set ofinteractions (Hossler, 1984). But the research community, while embracingthese theoretical models, has limited its enthusiasm because of the lack ofempirical evidence to substantiate their effectiveness in describing the processof student integration and departure from college. A recent review of empir-ical analysis of Tinto’s theory (Braxton and Lien, 2000) sorted publishedstudies into two categories: supportive or unsupportive. Although therewas evident support for the theory in several areas, the authors concludedthat there was not enough empirical support to substantiate much of Tinto’stheory.
A number of authors suggest that Tinto’s theory, and specifically his use ofVan Gennep’s social anthropology theory, is severely limited when applied tominority students (Tierney, 1992; Rendón, Jalomo, and Nora, 2000). To thinkthat students, especially students of color, must or will disassociate from theirculture, belief system, and familial support network to become integrated andaccepted into their new life on a college campus is difficult to swallow; thereality is more complex. “Nontraditional students often have to negotiate anew landscape, learn how to step in and out of multiple contexts, engage indouble readings of social reality and move back and forth between their nativeworld and the new world of college—all at an accelerated pace. Nontraditionalstudents live in multiple realities and lead cyclical lives that demand a highdegree of biculturalism” (Rendón, 1996, p. 19).
Rendón, Jalomo, and Nora (2000) suggest that minority and other under-represented student populations live in a process of biculturation (Valentine,1971), where individuals live simultaneous lives in two cultures, two realities.Duster calls it “dual competency,” where students must be competent in theirown culture plus the culture of the institution (Rodarmor, 1991). Troy Duster,a former University of California sociologist, saw it not only as a minority issuebut also one that affects white students. “For the first time, our White stu-dents are having to navigate their way through cultural mine fields. They’reencountering new terrain, and they don’t know what it’s all about. They’re get-ting their hands slapped, metaphorically. They’re getting a dose of wake-upreality. But in a remarkably important way . . . they’re getting an education.
49Retaining Minority Students in Higher Education

And it may be a more important one than they’re getting in some of ourclassrooms” (Duster, quoted in Rodarmor, 1991, p. 44).
Anderson’s force field analysis of college persistence (1985) illustratesthe many and various factors that researchers, including those just men-tioned, identified (see Figure 15). Anderson’s model integrates factors thatare both external and internal to the student. Although other studies(Lenning, 1982; Bean, 1986) are more comprehensive in identifying factors,Anderson’s model provides a representation of the factors in an easy-to-graspmodel.
As a final observation, it is important to keep in mind that the human con-dition is far too complex—as is our system of postsecondary education—todefinitely prove the validity of one psychological or sociological theoreticalmodel over another. The theories reviewed in this chapter are useful in describ-ing retention and attrition for students, but they always do so with the fullknowledge and understanding that one size does not fit all.
50
External Influences to Go to College
STUDENTInternal Forces
Negative
Lack of Money
Housing/RoommateProblems
TransportationProblems
Work Demandsand Conf licts
SocialDemands
Discrimination
Rejection
FamilyObligations
Positive
Positive
Academic Skills
Achievement Motives
Personal Interests
Identificationwith College-
Educated Persons
Parents
Peers/Friends
Cultural Values
Informationon Benefits
of AttendingCollege
CommunityExposure to
College-EducatedPersons
Teachers
Counselors
Informationon College
Opportunities,Financial Aid,
and so on
Procrastination
Negative
Loneliness
Not Asserting Needsand Problems
Self-Doubt
Fears of Failure
Fears of Success
Fears of Rejection
Value Conflicts
Career Indecision
Boredom
College-OrientedValues
Enjoymentof Learning
Self-Confidence
Career Aspirations
FIGURE 15Anderson’s Force Field Analysis of College Persistence
SOURCE: Anderson, 1985.
Factors Related to RetentionAs the previous discussion pointed out, there are a number of factors relatedto retention, and researchers have found differences, as well as similarities,between white students and students of color.
Academic PreparednessAcademic integration and preparation are primary features of many modelsof retention. Research shows that between 30 and 40 percent of all enteringfreshman are unprepared for college-level reading and writing (Moore andCarpenter, 1985) and that approximately 44 percent of all college studentswho complete a two- or four-year degree enrolled in at least one remedialcourse in math, writing, or reading (U.S. Department of Education, 2001a,p. 49). Without the prerequisite skills needed to survive the rigorous curric-ula of most college campuses, many students underachieve and leave collegeduring their freshman year or before their sophomore year begins (Astin, 1975;Tinto, 1975; Richardson and Skinner, 1992).
The educational community often defines academic preparedness on the basisof students’ precollege academic performance as measured by one or more ofhigh school GPA, high school rank, college entrance test scores (specifically mathscores), high school college preparatory courses, advanced placement courses,the quality of high school attended, and quality and intensity of high schoolcurriculum. A number of research studies have correlated academic prepared-ness of minority and nonminority students with their persistence and collegecompletion rates (Adelman, 1999; Borman, Stringfield, and Rachuba, 2000;Fiske, 1988; Parker, 1997; Richardson, Simmons, and de los Santos, 1987), butonce the variables related to academic preparedness were controlled, the effects ofethnicity on college persistence disappeared (St. John, Kirshstein, and Noel,1991). Still, high school GPAs accounted for only 9 percent of the variation incollege GPAs for African American students, compared with 25 percent forwhite students, suggesting that factors other than academic preparedness influ-ence students’ college achievement and persistence (Hall, 1999). Other studiesalso found significant correlations between academic preparation and persistencefor low achievers (Porter, 1989) and Hispanic students (Astin, 1982), furthersupporting Tinto’s theory of academic integration and college persistence.
51Retaining Minority Students in Higher Education

The following survey of major research studies illustrating gaps in academicpreparedness by ethnicity focuses on the two key indicators of academic pro-ficiency and college readiness.
The SAT Comparison. The SAT-I is the mainstay of high-stakes tests inAmerica. More than 2 million students sit for the SAT-I each year, while anothermillion-plus take the ACT test. These tests have been highly discussed over thepast few years, and the recent passage of President Bush’s education plan willsubject the nation’s children to even more high-stakes testing. A number ofresearchers and experts have argued the efficacy of these tests (Steele, 1999;Jencks and Phillips, 1998; Guinier, 2001). The University of California, thelargest user of the SAT-I, announced that it will stop using the test and willreplace it with a subject-based test by 2006. Considering that California is thelargest user of SATs in the United States, this move ultimately forced the CollegeBoard to announce the development of the “SAT05” in 2002, to be preparedfor use in 2005. Nevertheless, the SAT-I is still the prime gatekeeper for ournation’s selective and moderately selective four-year colleges.
Consistent findings on the SAT-I show that ethnic minority and low-income students score well below white and Asian students. The most recentdata available on the SAT from the 2001 college-bound seniors database ver-ify this long-standing finding. Table 4 provides a comparison, by ethnicity, onthe relative scoring on the SAT-I verbal and mathematics tests. As can be seenin the table, ethnic minorities, with the occasional exception of Asian students,score considerably lower on both the verbal and math portions of the test.African American and Mexican American students, respectively, averaged 96and 78 points lower than white students on the verbal portion of the SAT, and105 and 73 points lower on the math portion.
The SAT-I instrument has a statistical mean of 500 (standard deviation �
100), which means that approximately half of the total SAT population willscore above 500 and half below 500 in any given year or test sitting. A secondlook at the 2001 scores (not illustrated in Table 4) finds that approximately two-thirds of white students score above 500 on both verbal and math tests, whileonly a quarter of African American students, a third of Mexican American stu-dents, and slightly less than half of Native American students do the same.
52

As shown in Table 4, raising the standard higher reveals more dramaticfindings. Approximately 25 percent of white students register a score above600 on the SAT (theoretically, about 16 percent of all students wouldscore above that level given a normal curve). With the exception of AsianAmericans and Pacific Islanders, who either equal or surpass these marks onthe verbal and math tests, only a low percentage of ethnic minority studentsreach this higher level.
National Assessment of Educational Progress. More commonly referredto as the “nation’s report card,” the National Assessment of EducationalProgress (NAEP) reports every two years in the areas of reading, math, andscience.2 Since 1969, reading, mathematics, science, writing, U.S. history,civics, geography, and the arts have been assessed periodically.
As Table 5 illustrates, very small percentages of black, Hispanic, and NativeAmerican students score at proficient levels in reading, math, and science.Only one in twenty-five African American students and one in seventeen
53Retaining Minority Students in Higher Education
TABLE 4SAT Verbal and Math Scores by Ethnic Group, 2001
Verbal Scores Math Scores
��� Percent ��� PercentVerbal Versus above Math Versus above
Ethnic Group Score White 600* Score White 600*
White 529 — 25% 531 — 27%African American 433 �96 6 426 �105% 5Native American/ 481 �48 15 479 �52 14
Alaskan NativeAsian/Pacific Islander 501 �28 23 566 �35 43Hispanic 451 �78 8 458 �73 9
*Note: Out of 800 possible points.Source: College Board, 2001.
2Although NAEP testing occurs on a two-year basis, the reading, math, and science tests arerotated so that each test is conducted on a six-year rotation.
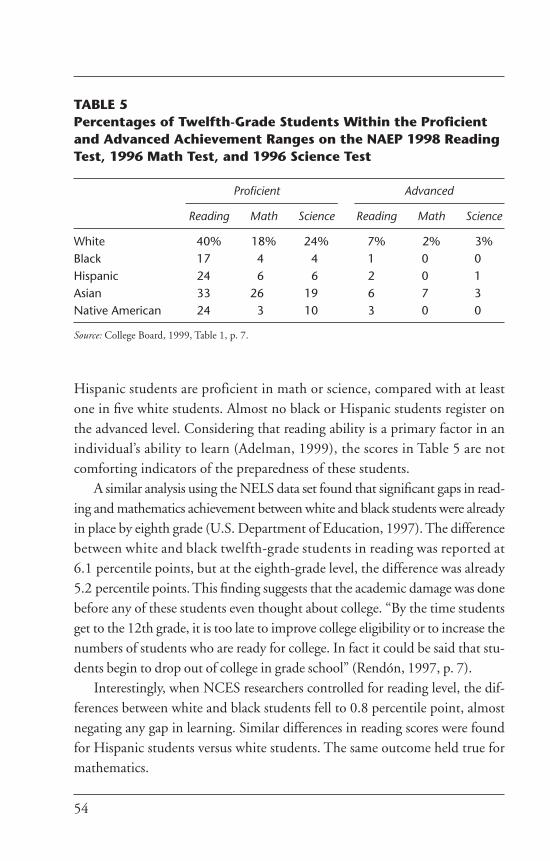
Hispanic students are proficient in math or science, compared with at leastone in five white students. Almost no black or Hispanic students register onthe advanced level. Considering that reading ability is a primary factor in anindividual’s ability to learn (Adelman, 1999), the scores in Table 5 are notcomforting indicators of the preparedness of these students.
A similar analysis using the NELS data set found that significant gaps in read-ing and mathematics achievement between white and black students were alreadyin place by eighth grade (U.S. Department of Education, 1997). The differencebetween white and black twelfth-grade students in reading was reported at6.1 percentile points, but at the eighth-grade level, the difference was already5.2 percentile points. This finding suggests that the academic damage was donebefore any of these students even thought about college. “By the time studentsget to the 12th grade, it is too late to improve college eligibility or to increase thenumbers of students who are ready for college. In fact it could be said that stu-dents begin to drop out of college in grade school” (Rendón, 1997, p. 7).
Interestingly, when NCES researchers controlled for reading level, the dif-ferences between white and black students fell to 0.8 percentile point, almostnegating any gap in learning. Similar differences in reading scores were foundfor Hispanic students versus white students. The same outcome held true formathematics.
54
TABLE 5Percentages of Twelfth-Grade Students Within the Proficientand Advanced Achievement Ranges on the NAEP 1998 ReadingTest, 1996 Math Test, and 1996 Science Test
Proficient Advanced
Reading Math Science Reading Math Science
White 40% 18% 24% 7% 2% 3%Black 17 4 4 1 0 0Hispanic 24 6 6 2 0 1Asian 33 26 19 6 7 3Native American 24 3 10 3 0 0
Source: College Board, 1999, Table 1, p. 7.

Course Selection and Integrity. In an attempt to further understand theeffect of academic preparation on college persistence, Adelman (1999)developed a composite measure for precollege academic content andperformance. Using transcript information in the High School and Beyonddatabase (1982–1993), Adelman verified and accurately mapped high schooland college courses. This unique and rich analysis has many implications forpolicymakers and practitioners, the most significant of which is that a rigorous(or as Adelman asserts, “intensive”) mathematics curriculum path taken inhigh school results in high achievement levels for all students, regardless ofrace or ethnicity.
Several studies point to the academic deficiencies among many minoritystudents, particularly the inability of the school system to better serve under-represented students (McDermott, Piternick, and Rosenquist, 1980; Fulliloveand Treisman, 1990; Berryman, 1983; Astin, 1982; Quality Education forMinorities, 1990). Astin (1982) has attributed much of the poor preparationof minority students to the poor quality of elementary and secondary educa-tion, while Berryman (1983) suggests that the public schools do not seem toserve any students particularly well in mathematics and science. Exposureto higher-order skill development is also a concern. As a result of lack of suchexposure, students have not “developed the reasoning skills that are necessaryfor acquiring science concepts, for organizing them into a conceptual frame-work, and for applying them in appropriate situations” (McDermott,Piternick, and Rosenquist, 1980, p. 136).
A study of NAEP science scores of seventeen-year-olds emphasized thislack of higher-order skills. The study found that although 9 percent of whitestudents had the ability to integrate specialized scientific information, only0.5 percent of African Americans and 1 percent of Hispanic students demon-strated this ability (Association of American Medical Colleges, 1992). Furtherexacerbating this issue is the perception that minority students cannot succeedin these higher-order disciplines. Bean (1986) found that teachers who thoughtthis way were more likely to send negative messages to their students regardingtheir ability in math or science.
Aside from the development of higher-order thinking skills, many minoritystudents lack other critical skills essential to their success in college (Association
55Retaining Minority Students in Higher Education

of American Medical Colleges, 1992; Epps, 1979; Halpern, 1992). Reading,writing, test-taking, vocabulary, and study skills are often barriers to minoritypersistence in college. The underdevelopment of these skills severely hampers astudent’s ability to persevere through the onslaught of new information on a dailybasis in college.
High school students’ course selection is a key variable in both the desireof a student to pursue study in the sciences and the preparedness of the stu-dent to persevere in postsecondary study. Studies by Fullilove and Treisman(1990) and Anderson (1989) found that African American students were lesslikely than their white counterparts to take advanced courses, especially inphysics and chemistry. Additionally, Anderson found that African Americanstudents scored nearly 70 points below the national norm on achievement testsin physics, biology, and chemistry, and were underrepresented in collegepreparatory courses, based on their representation in the population. The lim-ited access of these “gatekeeper” courses to minority students severely ham-pers their chances of achievement in the sciences, or even the likelihood thatthey will select or persist in such courses.
Many of the minority students who make it over the college admissionshurdle arrive on campus only to find they do not possess the requisite aca-demic skills to succeed. Thus, a high percentage of these students end up onthe remedial (developmental) track. As mentioned previously, almost half ofall college graduates take at least one remedial class during their college expe-rience. That alone is not a negative finding. In fact, as Figure 16 illustrates,the difference in completion rates between students who took one remedialcourse (not in math or reading) and those who did not take any remediationwas only 1 percent. The problem is deficiencies in reading. “Deficiencies inreading skills are indicators of comprehensive literacy problems, and they sig-nificantly lower the odds of a student’s completing any degree” (Adelman,1996). When the remedial college course happens to be reading, completionrates drop to 34 percent.
The data examined here are not an indictment of our nation’s children.Rather, they are an indictment of a system that has been unable to rectifyinequities in how it educates all students, not just those from the higher rungsof the economic ladder or those with an educational legacy that opens up their
56
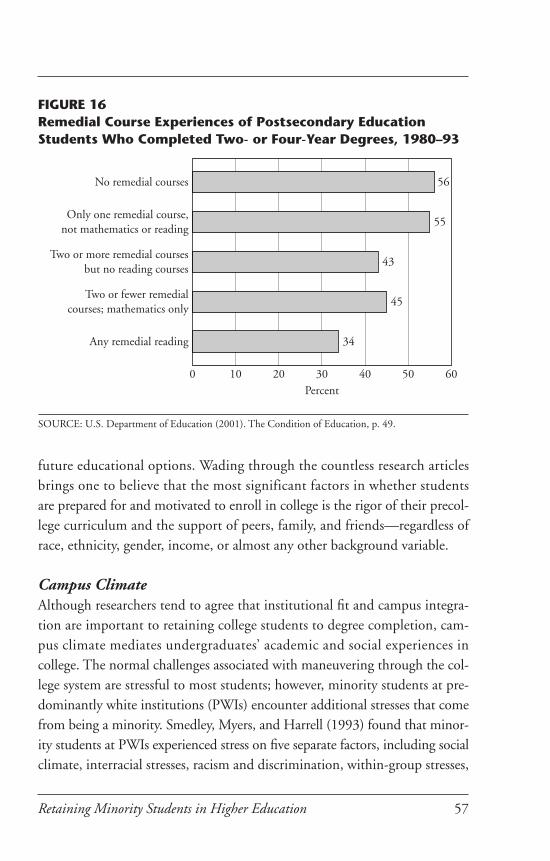
future educational options. Wading through the countless research articlesbrings one to believe that the most significant factors in whether studentsare prepared for and motivated to enroll in college is the rigor of their precol-lege curriculum and the support of peers, family, and friends—regardless ofrace, ethnicity, gender, income, or almost any other background variable.
Campus ClimateAlthough researchers tend to agree that institutional fit and campus integra-tion are important to retaining college students to degree completion, cam-pus climate mediates undergraduates’ academic and social experiences incollege. The normal challenges associated with maneuvering through the col-lege system are stressful to most students; however, minority students at pre-dominantly white institutions (PWIs) encounter additional stresses that comefrom being a minority. Smedley, Myers, and Harrell (1993) found that minor-ity students at PWIs experienced stress on five separate factors, including socialclimate, interracial stresses, racism and discrimination, within-group stresses,
57Retaining Minority Students in Higher Education
0 10 20 30Percent
40 50 60
34
45
43
55
56No remedial courses
Only one remedial course,not mathematics or reading
Two or more remedial coursesbut no reading courses
Two or fewer remedialcourses; mathematics only
Any remedial reading
FIGURE 16Remedial Course Experiences of Postsecondary EducationStudents Who Completed Two- or Four-Year Degrees, 1980–93
SOURCE: U.S. Department of Education (2001). The Condition of Education, p. 49.
and achievement stresses. Students identified several major issues:
• Not enough professors of my race• Few students of my race• Racist institutional policies and practices• Difficulty having friendships with nonminorities• Rude and unfair treatment because of race• Discrimination• People close to me thinking I’m acting “white”• Doubts about my ability to succeed in college
Minority students who are inadequately prepared for such nonacademicchallenges can experience culture shock. Lack of diversity in the student pop-ulation, faculty, staff, and curriculum often restricts the nature and quality ofminority students’ interactions inside and outside the classroom, threateningtheir academic performance and social experiences. Qualitative data on AfricanAmericans who attend PWIs suggest the availability of ethnic and culturalorganizations and a “critical mass” of African American students help reducethe isolation and alienation often found on predominantly white campuses(Hall, 1999). At the same time, Tracey and Sedlacek (1985) argue thatnoncognitive factors like self-concept, an understanding of racism, and theability to use coping mechanisms can have a positive effect on students’ aca-demic performance and persistence in college.
The research literature shows that HBCUs support campus climates thatfoster students’ self-pride and confidence and lead to academic and social suc-cess. Although most African Americans at HBCUs do not experience cultureshock associated with race, they do experience the culture shock of transi-tioning from a secondary educational system to a higher educational one.These institutions traditionally have used holistic approaches for developingstudents intellectually and socially. Activities have ranged from precollege out-reach programs to extensive academic and career counseling (Reyes, 1997).One characteristic of many HBCUs that has remained constant throughoutthe institutions’ history is the personal academic relationships that faculty atHBCUs establish with their students. This characteristic partially explains the
58
tendency of HBCU students—despite any academic and economicdifficulties—to demonstrate higher levels of psychosocial adjustment, aca-demic gains, and greater cultural awareness than do their African Americancounterparts at PWIs (Himelhock, Nichols, Ball, and Black, 1997). As thenon–African American student population at HBCUs continues to increase,however, they also must ensure that a nurturing campus climate exists for allstudents, regardless of race and ethnicity (Swail, 1995).
Unfortunately, the biased practices of many PWIs inadvertently contributeto minority students’ cultural shock and alienation. Just (1999) argues thatracial climate influences almost every aspect of minority students’ college expe-rience, leading to academic and social marginalization. Gonzalez (1999)reported that two Chicano males attending a western PWI felt that the insti-tutional members at large trivialized their culture by not accepting their stylesof bilingual communication, dress, and music, and by excluding physical andacademic representations of their culture. In addition to marginalizing minor-ity cultures, pervasive racial remarks demean ethnic minorities on campus.Tolerence.org, a Web site operated by the Southern Poverty Law Center tomonitor and promote racial and cultural tolerance, estimated 1 million inci-dents of bias occur every year on our national campuses, with the majority ofthem unreported to the authorities. Liu and Liu (2000) characterize the alien-ation of minority students on campus as a structural rather than an individ-ual issue, making colleges and society in general partially responsible for thesestudents’ lack of college persistence.
Empirical studies investigating students’ perceptions of and satisfactionwith campus climate are ambiguous. Ancis, Sedlacek, and Mohr (2000) foundthat African Americans and Asians perceived and experienced greater pressureto conform to stereotypes and had less favorable interactions with faculty andstaff. Other studies indicate that students satisfied with campus life often per-sisted. Bennett and Okinaka (1990) found that Hispanic and white college stu-dents’ attrition behavior and satisfaction with campus experiences correlatedclosely but differed for African Americans and Asian Americans. Their studyrevealed that as African American and Asian American students persisted tothe fourth year of college, they appeared more dissatisfied with campus life thanthose African American and Asian American students who left prematurely.
59Retaining Minority Students in Higher Education
Feagin and Sikes (1995) also found that greater social integration at a promi-nent PWI increased the probability of attrition for students of color. Con-versely, Liu and Liu (2000) found that minority students did not have anygreater tendency to be dissatisfied with the college environment than theirwhite counterparts.
What the research suggests, therefore, is that although campus climate andcampus satisfaction are important to many ethnic minority students’ collegeretention, campus climate alone will not sustain high graduation and reten-tion rates at colleges (Arrington 1994).
Special programmatic efforts, including bridge programs, structured cam-pus residences, mentoring, and other ethnic and cultural programs designedto support ethnic minorities’ academic and social integration, have eased somestudents’ transition to college. These structured programs, however, tend tolimit participating students’ social and cultural networks to program experi-ences, which alienate them even further (Feagin and Sikes, 1995; Fiske, 1988;Himelhoch, Nichols, Ball, and Black, 1997).
Many PWIs want to create inclusive and safe learning environments thatmeet the needs of every student, but most higher education institutions mustalso adhere to constitutional law protecting freedom of speech. Althoughhigher education institutions consider freedom of speech central to scholarlyinquiry, they also recognize that this law and others inadvertently allow manyperpetrators of biased and racist acts to go unpunished. According to a researchreport on campus codes of conduct, “As student populations become morediverse, it becomes more critical that administrators develop policies and pro-grams conducive to campus learning environments where safety and civilitywill predominate” (Palmer, Penney, and Gehring, 1997, p. 118).
Actively supportive, nondiscriminatory campus environments are associ-ated with greater college satisfaction, adjustment, and persistence. PWIs withsuccessful minority graduation rates:
• Shift from tolerance to acceptance when minority enrollments reach acertain threshold
• Provide opportunities for cultural, social, and educational development tomaintain a “comfortability factor”
60
• Examine and improve the institution’s relationships with communityminority organizations
• Commit institutional resources, such as visible leadership (including minor-ity leadership) funds for educational intervention
• Employ a comprehensive and systemic approach• Are supported by state legislation (Richardson, Simmons, and de los Santos,
1987)
PWIs have approached campus climate from programmatic and legal per-spectives designed to ease ethnic minorities’ college transition and protect theirlegal integrity. Yet Richardson and Skinner (1990) point out that althoughmany PWIs address campus climate issues, they are hesitant about advocatingsystemic change because of the belief that campus diversity diminishes aca-demic quality. The authors offer a model for diversity that harmoniously inte-grates access and achievement into the organizational culture throughappropriate institutional goals and strategies. Ultimately, institutions that suc-cessfully support minority access and achievement focus on learning environ-ment rather than race or ethnicity. Institutions that support diverse learningexperiences are those that emphasize quality instruction and learning.
Commitment to Educational Goals and the InstitutionTinto (1993) hypothesized that commitment to occupational and educationalgoals (goal commitment) and commitment to the institution in which oneenrolls (institutional commitment) significantly influence college perfor-mance and persistence (Okun, Benin, and Brandt-Williams, 1996). Thestronger the goal commitment and institutional commitment, the more likelythe student will graduate (Cabrera, Nora, and Castaneda, 1993). Tinto (1993)claims the scope of students’ educational or occupational goals correlatespositively with the probability of degree completion.
Astin’s study investigating the relationship between career goals and stu-dent persistence (1977) found that students whose academic majors corre-sponded closely with their career goals were more likely to achieve their goalsthan were students with no identifiable career goal. In a subsequent study(1982), Astin concluded that career goals and intended academic majors were
61Retaining Minority Students in Higher Education
the strongest predictors of students’ plans, suggesting that “the student’s ini-tial choice of a career or major is not a random event, and that it has consid-erable influence on the student’s long-range career development” (p. 96).Pantages and Creedon (1978) also concluded that when students’ values, goals,and attitudes correspond with those of their institution, the probability ofgraduation increases. In addition, the authors indicated that integration of aspecific occupational goal into students’ educational goals also increases theirmotivation and persistence.
The level of institutional commitment exhibited by a student depends onthe congruence between the students’ educational goals and the institution’smission. Although individuals may enter college with educational goals thatare not commensurate with those of the institution, the level of congruencebetween student and institution is a primary factor influencing students’ per-sistence. When undergraduates’ educational goals are incongruent with thoseof the institution, the students are less likely to persist. Tinto (1975) notes thatover time, goal and institutional commitment generally intensify as studentsclarify goals and focus on getting a degree.
Although literature examining goal and institutional commitment has beenequivocal (Okun, Benin, and Brandt-Williams, 1996), research has shownthat congruence between students’ goals and institutional mission is mediatedby academic and social components (Cabrera, Nora, and Castaneda, 1993).Tinto (1993) suggests that increased integration into academic and social cam-pus communities causes greater institutional commitment and student per-sistence. One study (Beil, Resien, and Zea, 1999) confirmed that institutionalcommitment mediated the impact of students’ first-semester academic andsocial integration on their persistence. The data seem to contradict previousfindings indicating that academic and social integration have a direct impacton student retention. A student’s integration into the campus determines thatstudent’s level of commitment to the institution, which directly influencesdecisions to persist. Kennedy, Sheckley, and Kehrhahn (2000) identified per-sisters as students who either improved their grade point averages over thecourse of the year, found their grade point averages to be consistent with theirexpectations, or adjusted academically to college. This research supports pre-vious findings that students who integrate into the academic campus culture
62

are more likely to persist. The research indicates that institutional practicesshould integrate students into the campus culture early and help them clarifycareer and academic goals through extensive and collaborative academic andcareer counseling.
Social and Academic IntegrationMuch of the literature regarding retention issues focuses on the social and aca-demic integration of students with the university. Tinto’s longitudinal modelof student dropout (1975) posits that students’ level of academic and socialintegration with the university (and their goal and institutional commitment)are the major factors in their ability to persist in college. Building onDurkheim’s suicide theory, Tinto posits that, like suicide victims who weretotally removed from the social fabric of society, students who are likewiseremoved from the social fabric of the college community are more likely toleave college than persist. “In Durkheim’s view, individual integration into thesocial and intellectual life of society and the social and intellectual member-ship . . . that integration promotes are essential elements of social existence inhuman society. Societies with high rates of suicide are those whose social con-ditions are such as to constrain such membership” (Tinto, 1993, p. 102).
Tinto’s theory suggests that students’ ability to conform to or integrate intothe social and intellectual membership of the university is pivotal to their abil-ity to persevere through graduation. Griffen (1992), summarizing the attri-tion theories of Terenzini and Wright (1987), Spady (1970), Terenzini andPascarella (1984), and Tinto (1975), further theorized that early integrationinto the social and academic fabric of the institution not only is correlatedwith persistence in college but also is conducive to the academic and socialgrowth of the student. Rootman (1972) and Astin (1987) also subscribe tothe theory of social and academic integration but suggest that the importantissue to be considered is the student’s environmental fit into the social con-fines of the institution. How a student’s values fit in with the institutional val-ues and those of the faculty and student population will affect the quality ofthat relationship.
Students actually fit into the college environment in a variety of ways, andthe college can assist in that integration in a number of ways. The development
63Retaining Minority Students in Higher Education

of new friendships and peer interaction are perhaps the most recognized meth-ods of social integration. This development can help students bridge the oftentraumatic first weeks of the freshman year and offer other areas of personal andacademic support. Several studies, including those conducted by Tinto (1975),Pantages and Creedon (1978), and Astin (1977), have found that friendshipsupport is directly related to persistence in college and that college dropoutsperceive themselves as having less social interaction than those students whopersist in college. For African American students, students who engage in socialactivities become a part of the social environment and are more likely to persist(Griffen, 1992).
The process of becoming socially integrated into the fabric of the univer-sity has also been found to be both a cumulative and compounding process.Terenzini and Wright (1987) suggest that the level of social integration dur-ing a given year of study is part of a cumulative experience that continues tobuild throughout one’s college experience. Therefore, the experiences that astudent encounters in his freshman year will influence and support integra-tion in subsequent years.
HBCUs have also been found to provide more positive social support forAfrican American students than PWIs offer. Berg and Peplau (1982) con-cluded that African American students on black campuses exhibited feweradjustment problems, engaged in more social activities through their studentnetworking, had higher GPAs, exhibited greater satisfaction in their collegeexperience, and had higher occupational expectations than their counterpartsat PWIs.
The establishment of peer relations during college also supports a student’sacademic integration into the university. Capella, Hetzler, and MacKenzie(1983) found that a positive peer influence favorably influenced the studyhabits of college students. Several studies, including a 1983 study of exem-plary precollege science, engineering, mathematics, and computer scienceintervention programs for female and minority students, concluded that peerrelationships were important in keeping students interested in the sciences(Matyas, 1991; Malcom, 1983). Many intervention programs build upon thistheory of peer support, including the University of California, Berkeley’sMathematics Workshop Program, Xavier’s Project SOAR, and the University
64
of California, San Diego’s Summer Bridge Program, all of which encouragegroup interaction and peer integration.
The development of role models and mentors has also been defined in theliterature as important factors in student integration, both academically andsocially. A positive role model provides students with a number of equally pos-itive experiences. The availability of role models extends beyond the socialintegration of the student: “It is not surprising that a number of studies havefound that social interaction with the college’s faculty is related to persis-tence in college. Spady (1971) suggested that these findings arise from the factthat interaction with the faculty not only increases social integration and there-fore institutional commitment but also increases the individual’s academicintegration” (Tinto, 1993, p. 109).
On the college campus, faculty members are often role models. The inter-action between faculty and students has been identified as a major factor inthe ability of students to persist in college while also increasing their level ofsatisfaction (Astin, 1977; Beal and Noel, 1980; Pascarella and Terenzini,1979). Positive role models provide guidance, direction, and, most impor-tant, a good example for students to learn from. Interaction between facultyand students outside class is even more beneficial to students. Informal con-tact between students and faculty members has been found to increase thepersistence of the student (Ugbah and Williams, 1989; Griffen, 1992; Astin,1982). Endo and Harpel (1982) concluded that informal contact with fac-ulty was a foundation for the development of friendly relationships betweenstudents and faculty that had a positive influence on students in terms oftheir personal, social, and intellectual development (Griffen, 1992). Terenziniand Pascarella (1977, 1980) had similar findings but were unable to dupli-cate the outcomes at another campus, concluding that each individualcampus may react differently to the interactions of variables (Pascarella,1984).
With regard to underrepresented minorities in universities, contact withpositive role models is even more significant than it is for majority students.A study of a mentoring program at Ohio University in Athens, Ohio, foundthat 91 percent of the African American protégés felt more confident as a resultof their mentor (Ugbah and Williams, 1989).
65Retaining Minority Students in Higher Education

National statistics confirm the scarcity of minority role models on cam-pus. African Americans, Hispanics, and American Indians are substantiallyunderrepresented among faculty at colleges and universities relative to theirrepresentation among students. Analyses of data from the IPEDS Fall StaffSurvey show that only 8 percent of all full-time faculty at four-year collegesand universities nationwide in fall 1997 were black, Hispanic, or AmericanIndian/Alaskan Native. Moreover, a substantial share of minority faculty areemployed at minority-serving institutions. For example, African Americansrepresent 59 percent of all full-time faculty at HBCUs but only 3 percent ofall full-time faculty at four-year non-HBCUs.
Minorities are even more severely underrepresented among tenured fac-ulty. Only 7 percent of full-time tenured faculty who were employed at four-year colleges and universities in 1997 were African American, Hispanic, orAmerican Indian (analyses of IPEDS 1997 Fall Staff Survey). Again, includ-ing minority-serving institutions in the analyses masks the magnitude of theunderrpresentation of minorities among faculty at PWIs. African Americansheld only 2 percent of the full-time, tenured faculty positions at four-year,non-HBCUs nationwide in fall 1997.
Even among administrators, deficient minority representation is evi-dent. Analyses of data from the IPEDS Fall Staff Survey show that AfricanAmericans, Hispanics, and American Indians held 12 percent of all full-timeexecutive, administrative, and managerial positions at four-year colleges anduniversities in fall 1997. Excluding employment at HBCUs reduces the rep-resentation of African Americans, Hispanics, and American Indians amongtop administrators at four-year institutions to 10 percent.
As Franklin (1988) notes, the lack of positive role models, advocates, andmentors has an impact on students and their ability to do well in elementaryand secondary schools. Moreover, the risk of minority students leaving schoolis much higher. Therefore, informal contact between faculty and students ismore critical than ever, and institutions must work diligently to providepositive faculty role models for their students (Justiz, 1994). Successfulacademic and social integration is also more likely for students who live oncampus. Several studies have shown the positive effects of on-campus residence(Pascarella, 1984; Chickering, 1974; Astin, 1977; Pantages and Creedon,
66
1978). Pascarella (1984) found that even when background traits and insti-tutional controls were held constant, on-campus living was positively corre-lated with higher student interaction, although he was not able to significantlydetermine the academic affects. Astin (1977) also found a greater interactionwith faculty and peers and that students were more satisfied with college, hadmore focused career and educational goals, and in turn were more likely topersist to graduation.
Financial AidEconomic theory and educational research suggest that for students to persistto a college degree, the returns for receiving the degree must outweigh the costs(over time) of attaining it. Because attending college has direct, indirect, andopportunity costs for students, financing decisions have both short- and long-term effects on college persistence.
For most students, decisions about enrollment and persistence are drivenby labor market returns for receiving a degree. Most research suggests thatattending college and persisting to degree completion will be rewarded withhigher annual and lifetime earnings. In 1998, for instance, the median annualearnings for men age 25 and older and employed full time was $31,477 forthose with a high school diploma, $40,274 for an associate’s degree, $51,405for a bachelor’s degree, $64,244 for a master’s degree, $75,078 for a doctoraldegree, and $94,737 for a first professional degree (U.S. Department of Edu-cation, 2001b). Persisting in college has other rewards, of course; for example,degree holders participate to a greater extent in voting and other civic respon-sibilities (Institute for Higher Education Policy, 1998). But for most studentsto persist—particularly low-income and minority students—the benefits ofattaining a degree usually must be greater than the direct, indirect, and oppor-tunity costs required to attend an institution.
For many low-income and minority students, enrollment and persistenceare driven by the availability of financial aid. In 2001, the median householdincome of African American families headed by a householder age 45 to 54(the families most likely to have traditional college-age children) was $36,824,and $41,652 for Hispanics. By comparison, white households had a combinedincome of $61,643 (U.S. Census Bureau, 2001). Thus, by definition, more
67Retaining Minority Students in Higher Education

African American and Latino families will require financial assistance to attendand persist in college.
Students from low-income families were more likely to receive grant aidto attend college. In 1999–00, 77 percent of financially dependent studentsfrom families with less than $20,000 in family income received some finan-cial aid, with an average award of $6,727. In contrast, 44 percent of those fromfamilies with income of $100,000 or more received aid, with an average awardof $7,838 (higher-income students received higher average awards becausethey tended to be enrolled at higher-cost institutions). Once in college, three-quarters of the low-income undergraduates received grant aid, with an aver-age award of $4,309, compared with 29 percent of higher-income studentswho received grants, with an average award of $5,100 (U.S. Department ofEducation, 2001c).
Even with the availability of financial aid, however, students from racialand ethnic minorities and low-income families are less likely than whites andthose from higher-income families to enroll in a four-year college and earnbachelor’s degree (Advisory Committee on Student Financial Assistance, 2001;Gladieux and Swail, 1998; Thayer, 2000). More than one-half of AfricanAmerican, Hispanic, and Native American dependent students come fromfamilies with incomes of less than $30,000 (King, 1999). In 1999, the mostrecent year of available data, about 57 percent of high school graduates fromfamilies in the lowest-income quartile entered college, compared with nearly86 percent of those from the highest-income quartile. Even more troubling isthe fact that the percentage of low-income students who completed college byage 24 has remained at less than 10 percent for the past thirty years, while thepercentage of students from the highest-income families who received bache-lor’s degrees rose from 40 percent to about 60 percent (Mortenson, 2001a,2001c).
Recent Financial Aid Policy Developments. Recent financial aid policydevelopments have led to disparities between the availability of grant and loanaid (Advisory Committee on Student Financial Assistance, 2001; Christman,2000; Mortenson, 2001b; Thayer, 2000). According to the College Board, theproportion of financial aid from grants has declined from about 50 percent in
68

1990–91 to 40 percent in 2000–01 (College Board, 2001b). A series of federalfinancial aid policies created during the 1980s and 1990s led to this shift ingrant and loan aid availability:
The reduced purchasing power of need-based grants, relative to increases in collegecosts. In inflation-adjusted value, appropriations for federal Pell Grants grewby 23 percent over the last decade, but tuition and fee charges at four-yearpublic colleges and universities rose by 40 percent (College Board, 2001b;American Council on Education, 2000; Cunningham and O’Brien, 1999).
More grant aid has come from state and institutional sources than the federalgovernment (Cunningham and O’Brien, 1999). In recent years, funding forinstitutional and state grants has grown by more than 90 percent, whilefederal grant aid grew just 31 percent.
The shift in federal aid to student loans and tax credits. Federal student loan vol-ume grew from $17.1 billion in 1990–91 to $37.1 billion in 2000–01.Much of this growth occurred in the federal Stafford Unsubsidized Loanprogram, which jumped 50 percent since 1995–96. Additionally, underthe Taxpayer Relief Act of 1997, students will be eligible for more than$40 billion in tax credits (through the Hope Scholarship Tax Credit andthe Lifetime Learning Tax Credit) over the next decade to pay for college(Reindl and Redd, 1998). Because low-income students are less likely tohave tax liability, they are less likely to benefit from these new federal taxcredits (Reindl and Redd, 1998).
Shift of institutional and state grant aid from need-based to merit-based criteria.During the 1990s, more states and institutions began to use more of theirgrant funds to award merit and other nonneed-based aid (Heller, 1999;Reindl and Redd, 1998). Institutions used more merit aid to entice morestudents with high SAT scores and other characteristics to enroll on theircampuses. Some states, particularly those in the South, reacted to the con-cerns of middle- and upper-income families who did not qualify for PellGrants and other awards that are distributed based on families’ demon-strated financial need but wanted additional funds to send their childrento college. Institutional and state funding for merit and other nonneedgrants nearly doubled during the early and mid-1990s, while need-based
69Retaining Minority Students in Higher Education
aid grew by 30 percent and 41 percent in the same periods. These nonneedawards tend to favor students from middle- and upper-income families;during the 1990s, Heller (1999) points out, the number of low-income stu-dents who received nonneed grants at private colleges and universities fell10 percent, while the number of awards to high-income students grew24 percent.
Fundamentally, these policy shifts mean that relatively more low-incomestudents will have to borrow to enroll in college and persist to a degree. Priorresearch and anecdotal evidence has suggested that low-income students andminority students are much less willing to borrow to attend college than whitesor students from higher-income families (Olivas, 1985; Mortenson and Wu,1990). Recent data indicate that Pell Grant recipients, who are often low-income, first-generation students, are more likely to borrow than are studentswho do not receive Pell Grants. These students tend to graduate with an aver-age debt 30 percent greater than students receiving other types of financial aid(American Council on Education, 2000). Thus, the shift from grants to loansmay have implications for persistence levels of low-income and minoritystudents.
Financial Aid and Persistence. In light of these recent policy developments,it is important to understand the linkages between financial aid, enrollment,and persistence for students in general and racial and ethnic minority studentsin particular. Fortunately, research on these questions is abundant. Some ofthese prior researchers (Bean, 1986; Metzner and Bean, 1987; Cabrera,Castaneda, Nora, and Hengstler, 1992; Cabrera, Nora, and Castaneda, 1992)suggest that students’ ability to pay for college consists of two dimensions: anobjective component, reflecting students’ availability of resources, and asubjective component, reflecting students’ perceptions of their capacity to ordifficulty in financing a college education. It is likely that these factors alsoinfluence students’ decisions about college choice and persistence.
Further research (Mumper, 1996; St. John, Paulsen, and Starkey, 1996;St. John and Starkey, 1995) measures students’ response to a set of prices ratherthan a single price; it found that students with different needs respond to
70

tuition and financial aid quite differently. Therefore, different combinationsof tuition and student aid yield different levels of enrollment and persistence.Price choices are influenced by type of institution, attendance status, and res-idence status. Students are also influenced by type of aid (grants, loans, work-study, other) in their aid packages. Further, low-income students have beenfound to be more responsive to tuition increases than are middle- and upper-income students (Heller, 2001a).
Yet the research investigating the effects of the types, amounts, and com-binations of financial aid on college persistence is, at best, ambivalent. Thisambivalence shows direct and indirect influences on persistence and reflectsthe financial aid policies of the period studied (Fenske, Porter, and DuBrock,2000; Heller, 2001b; Murdock, 1990; Perna, 1998). Earlier research in thisarea found financial aid to be unrelated to college students’ persistence(Moline, 1987; Peng and Fetters, 1978), but more recent findings indicate itsimportance to the recruitment and retention of low-income students(Murdock, 1990; St. John, Kirshstein, and Noel (1991)). Recent path analy-ses, on the other hand, have indicated that the receipt of financial aid has onlymarginal effects on students’ persistence and completion. Receiving financialaid and the amount received ranked eighth among total effects on persistence(Perna, 1998).
Persistence by Race or Ethnicity and Grants Versus Loans. Such findingsvary by type of aid received and the time period under study. Need-basedinstitutional grants tend to facilitate persistence (Fenske, Porter, and DuBrock,2000; Murdock, 1990; Pantages and Creedon, 1978; Porter, 1989). Porter(1989), for instance, found that 90 percent of students who received grants intheir first year, regardless of race or ethnicity or type of institution, were stillenrolled in the second semester. Meanwhile, the persistence rate of studentswho did not receive grant aid was 75 percent overall and 60 percent forAfrican American students. Further, the highest completion rates wereassociated with aid limited to grants and packages consisting of grants, loans,and work-study. Completion rates were lower for students whose packagesemphasized loans (Murdock, 1990; Perna, 1998, St. John, Kirshstein, andNoel, 1991). These disparities were even more evident in the 1970s, when a
71Retaining Minority Students in Higher Education

higher proportion of aid came from grants and persistence rates betweennonwhite and white students were equal after controlling for receipt of aidand other factors (St. John, Kirshstein, and Noel, 1991). Blanchette (1994)used the High School and Beyond data set to conclude that additional grantaid increased graduation rates for some minority students.
Loans, however, may not be as effective in retaining low-income or minor-ity students. Some studies have concluded loan aid is unrelated to persistence,while others have found students who receive loan aid are less likely to persist.Student background tends to influence the effect of loan aid on persistence.For example, loans have been found to be less consistent in facilitatingaccess for minority students than for white students (St. John, 1991). Otherresearch (Blanchette, 1994) found that a $1,000 increase in loan aid wouldincrease the probability of dropping out for African American students butthat for Hispanic students the probability is slightly lower. Although Ekstrom(1991) found that students who were willing to accumulate debt to financecollege enrollments were more likely to persist, other research (Olivas, 1985;Mortenson and Wu, 1990) demonstrated that African American and Hispanicstudents were less willing to finance their education with loans than were theirwhite counterparts.
College employment also appears to have an influence on persistence (Horn,1998; Pascarella and others, 1994). The type and extent of influence of employ-ment on student outcomes depend on the number of employment hours, loca-tion of employment, and the degree to which the student’s job is related to hisor her academic or career goals. Horn and Maw (1994) found that althoughreceipt of financial aid had little effect on whether students worked or did notwork, it did influence the number of hours that students decided to work.Undergraduates who received higher amounts of student aid were less likely towork full time than those who received lesser amounts of student aid. Likewise,students with higher net education costs were more likely to work and workfull time than undergraduates with lower net costs. Students who worked fifteenhours or fewer per week were more likely to have high academic grade pointaverages than were those who worked more hours.
The federal work-study program, which provides part-time jobs to finan-cially needy postsecondary education students, has been found to increase
72
student persistence, but external employment (non-work-study) through full-time and off-campus employment tends to decrease students’ persistence,unless related to area of study (Horn and Maw, 1994).
These research findings suggest that a link exists between receipt of finan-cial aid—particularly grant aid—and persistence. Low-income and minoritystudents who receive grants generally are more likely to persist than those whoreceive loans. Given the rising costs of attending college, however, it is unlikelythat low-income students will be able to receive bachelor’s degrees without anyloan aid. The key may be in educating these students in strategies for bor-rowing wisely, that is, borrowing only what is truly needed to persist in col-lege. Many of the students who have trouble with debt are those who borrowbeyond their financial need (King 1999). At the same time, the research alsosuggests that the shifts in aid from grants to loans and from need- to merit-based programs adversely affect both enrollment and persistence for minoritystudents. Reversing these shifts may be necessary to increase college access andsuccess for low-income and minority students.
73Retaining Minority Students in Higher Education
A Framework for Retention
AS DISCUSSED IN THE PREVIOUS CHAPTER, a number of theo-ries and models have been developed to explain student attrition in
higher education. In particular, Tinto’s attrition model (1975), Bean’s syn-thetic model (1982), and Anderson’s force field analysis (1985) are amongthose theories that attempt to describe and categorize the attrition process.Like all theories, however, these models are open for interpretation and,depending on a number of variables and constructs, cannot be used to describeall peoples, organizations, and situations.
A New Perspective on Student IntegrationAlthough these models are very useful in illustrating the problems andprocesses relating to student persistence, lost between the simplicity and com-plexity of the different models is the relationship between college and student.Without a clear explanation of what the model represents, it is difficult foradministrators and practitioners to fully comprehend the significance ofthe model and how it relates to campus policy. Introduced here is a geomet-ric model of student persistence and achievement that focuses on students’attributes and institutional practice. The model simultaneously describes per-sistence and achievement because of the inextricable relationship between thetwo variables. For example, the intervention of a motivational instructor maynot only prompt certain students to persist but also cause them to study moreand likely score better on exams and assignments.
75Retaining Minority Students in Higher Education

76
The geometric model differs from others by placing the student at the cen-ter of the model rather than making him or her an indifferent element in a flowchart or structural equation model. As Tinto (2000) commented, none of themodels discuss the connection between classroom and retention, the one placewhere the institution has the closest connection to the student. The same canbe said for how the models address students.
The purpose of this model is to provide a user-friendly method for dis-cussion and to focus on the cognitive and social attributes that the studentbrings to campus, and the institutional role in the student experience. Theultimate question is simple: What can an institution do to help each studentget through college? And how can institutions help integrate students aca-demically and socially into the campus, as well as support their cognitive andsocial development? The three sides of the model shown in Figure 17 eachrepresent a particular force on a student, represented by the area inside thetriangle. Similar to Anderson’s force field analysis, the triangle representsthe complex set of internal processes within each student that foster his orher ability to persist and achieve. The area external to the triangle representsall outside variables impacting on the student’s development and decisionmaking.
Institutional Factors
The StudentExperience
Social Factors
Cog
nitiv
e Fac
tors
FIGURE 17Swail’s Geometric Model of Student Persistenceand Achievement

Three Forces Affecting Student Persistenceand AchievementIn terms of college persistence and achievement, three particular forces accountfor the entire spectrum of student outcomes: cognitive, social, and institutionalfactors (see Figure 18). Briefly stated, the cognitive factors form the academicability—the strengths and weaknesses—of the student, such as the level of pro-ficiency in reading, writing, and mathematics. Social factors, such as the abilityto interact effectively with other persons, personal attitudes, and culturalhistory, form a second set of external factors that characterize the individual.The third set of factors, institutional, refers to the practices, strategies, and cul-ture of the college or university that, in either an intended or unintended way,impact student persistence and achievement. Examples include faculty teach-ing ability, academic support programming, financial aid, student services,recruitment and admissions, academic services, and curriculum and instruc-tion. (They are described more completely later in this section.)
77Retaining Minority Students in Higher Education
Academic rigor •
Quality of learning • Aptitude •
Content knowledge •
Critical-thinking ability •
Technology ability •Study skills •
Learning skills •
Time management •
Academic-related •
extracurricular activities
• Financial
issues
• Educati
onal legacy
• Attit
ude toward
learning
• Relig
ious background
• Matu
rity
• Social
coping skills
• Communicat
ion skills
• Attit
ude toward
others
• Cultural
values
• Expecta
tions
• Goal c
ommitment
• Fam
ily influence
• Peer
influence
• Social
lifestyle
The StudentExperience
Institutional Factors
Social Factors
Cog
nitiv
e Fac
tors
Curriculum andInstruction
AcademicServices
Financial Aid Student Services Recruitment andAdmissions
FIGURE 18Forces Acting on the Geometric Model of Student Persistenceand Achievement

Cognitive FactorsThe cognitive factors relate to the intelligence,3 knowledge, and academic abil-ity a student brings with him or her to the college environment. These factorsmay be measured by such variables as course selection and completion in highschool, aptitude, or extracurricular involvement in academic-related areas. Cog-nitive factors are important because they directly relate to the student’s ability tocomprehend and complete the academic portion of the college curriculum.
An important element of the cognitive factors relating to student persis-tence and achievement is the student’s decision-making and problem-solvingability. The decision-making process is an important part of the modelsdescribed earlier. Tinto (1975, 1993) describes the decision-making processregarding goal commitment and dropout, Bean (1982) describes an intent toleave, and Anderson (1985) identifies value conflicts and career indecisionamong the important variables that a student controls through the set of socialand cultural values instilled in him or her. The student’s decision-makingprocess occurs within the confines of the geometric shape represented in themodel presented above. It is here that the social and cognitive factors inter-connect to form the decision-making process.
Social FactorsThe second factor related to student persistence and performance is the set ofsocial factors impacting on students. Such factors include parental and peer sup-port, the development or existence of career goals, educational legacy, and theability to cope in social situations. The social issues facing college students are ofever-increasing interest to higher education personnel. The research field gener-ally agrees about the importance of social integration with regard to studentretention and the fact that students have a difficult time persisting when they arenot socially integrated into campus life. Thus, the factors identified on the socialside of the geometric model are uniquely important to students’ stability.
A student’s social underpinning and opportunities have obviously crossoverimpact on his or her cognitive development. A student who is brought up in
78
3Intelligence is meant in the form akin to Gardner’s multiple intelligence theory, where it isnot just an academic sense of intelligence but the intellectual ability of an individual to workthrough many different mediums, such as music.

a culturally and educationally rich environment will develop skills critical topostsecondary, career, and personal success. Students hailing from less sup-portive environments may bring with them deficiencies in their self-esteemand efficacy, especially as they relate to academics when compared with stu-dents from more advantaged backgrounds.
Institutional FactorsCollege is undoubtedly the biggest social change a traditional-age student hasever undertaken. College presents stresses, at some level, to all students. Sub-stantial research exists on the stresses of freshman year, especially on minorityand low-income students. Regardless of one’s subscription to either Gennep’ssocial anthropology theory (Tinto, 1988) or to Valentine’s biculturation theory(Rendón, Jalomo, and Nora, 2000; Valentine, 1971), how the institution reactsto students is of primary importance to retention, persistence, and completion.
The institutional side of the triangle relates to the ability of the institutionto provide appropriate support to students during the college years, both aca-demically and socially. Issues related to course availability, content, and instruc-tion affect a student’s ability to persist, as do support mechanisms such astutoring, mentoring, and career counseling. Although this axis has a directeffect on a student’s stability during college, it also can be seen as a flexible setof programs or conditions that the college can mold to meet the diverse needsand attributes of individual students.
The significance of setting institutional factors on equal ground with cog-nitive and social factors is to illustrate the importance of campus participationand knowledge in students’ social and academic development. The geometricmodel places this set of factors at the base of the triangle because it is thecollege that forms the foundation for college success. It is here that the insti-tution can identify and match the needs of individual students, a studentcohort group, or the student body as a whole.
The Model in PracticeThe strength of the geometric model is that it allows users to move from a theo-retical conversation to a study of practice in the present and over time. On thetheoretical level, using the geometric nature of this model helps us understand
79Retaining Minority Students in Higher Education
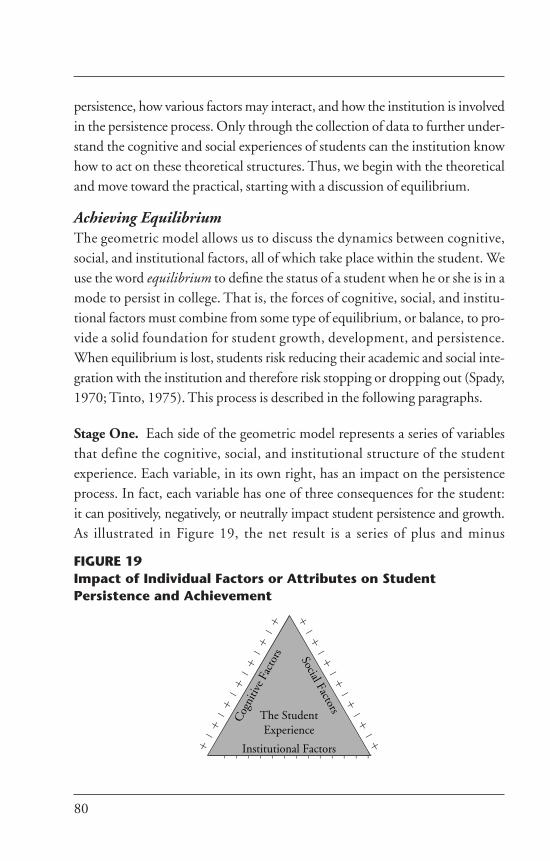
persistence, how various factors may interact, and how the institution is involvedin the persistence process. Only through the collection of data to further under-stand the cognitive and social experiences of students can the institution knowhow to act on these theoretical structures. Thus, we begin with the theoreticaland move toward the practical, starting with a discussion of equilibrium.
Achieving EquilibriumThe geometric model allows us to discuss the dynamics between cognitive,social, and institutional factors, all of which take place within the student. Weuse the word equilibrium to define the status of a student when he or she is in amode to persist in college. That is, the forces of cognitive, social, and institu-tional factors must combine from some type of equilibrium, or balance, to pro-vide a solid foundation for student growth, development, and persistence.When equilibrium is lost, students risk reducing their academic and social inte-gration with the institution and therefore risk stopping or dropping out (Spady,1970; Tinto, 1975). This process is described in the following paragraphs.
Stage One. Each side of the geometric model represents a series of variablesthat define the cognitive, social, and institutional structure of the studentexperience. Each variable, in its own right, has an impact on the persistenceprocess. In fact, each variable has one of three consequences for the student:it can positively, negatively, or neutrally impact student persistence and growth.As illustrated in Figure 19, the net result is a series of plus and minus
80
�������������
��
��
��
��
��
��
�� � � � � � � � � � � � �
Institutional Factors
The StudentExperience
Social Factors
Cog
nitiv
e Fac
tors
FIGURE 19Impact of Individual Factors or Attributes on StudentPersistence and Achievement

experiences that mold the behavior and characteristics of the student. It isimportant to note that each force or impact on the student is distinct anddifferent. Thus, one should not infer that the effect of one variable can beequally neutralized by another. It is reasonable to assume, however, that certainvariables can alter the effect of other variables. Thus, the individual impactof variables can combine and work with or against other variables, known asreciprocity. If we could algebraically calculate the impact of these variables, wewould end up with a beta value to describe the cognitive, social, andinstitutional value. Although theoretically possible, it would be a massivelychallenging practice to equate all inputs to a singular coefficient.
An example of reciprocity is the combination of academic motivation,appropriate learning environments, and academic support. The net effect ofthese three variables (and surely dozens of others) could have a dramatic effecton student achievement and ultimately persistence in college. This combina-tion of forces—the reciprocity of variables effect—gives us a net effect for eachof the three planes of the geometric model.
Stage Two. The second stage refers to the continuation of our reciprocitytheory to the entire spectrum of variable interaction, that is, betweencognitive, social, and institutional variables. The force generated by allvariables—either individually or across axes—accounts for the stability orinstability of student persistence and achievement and ultimately theachievement of equilibrium.
Although balance may be achieved on each axis of the triangle (as shown inthe prior figures), it is naive to suggest that an equal balance exists among thethree sides of the model, even if we could define what that balance would looklike. In other words, rarely would the triangle be truly equilateral. The com-plexity of human behavior and learning theory suggests that there is an infi-nite combination of variables from each of the three axes that can result in anoutcome measurable through student persistence and achievement. As previ-ously stated, however, we use the word equilibrium to define the status whenthe cognitive, social, and institutional forces combine in a manner that sup-ports student persistence and achievement—that is, the model is stable andsupports persistence and achievement.
81Retaining Minority Students in Higher Education
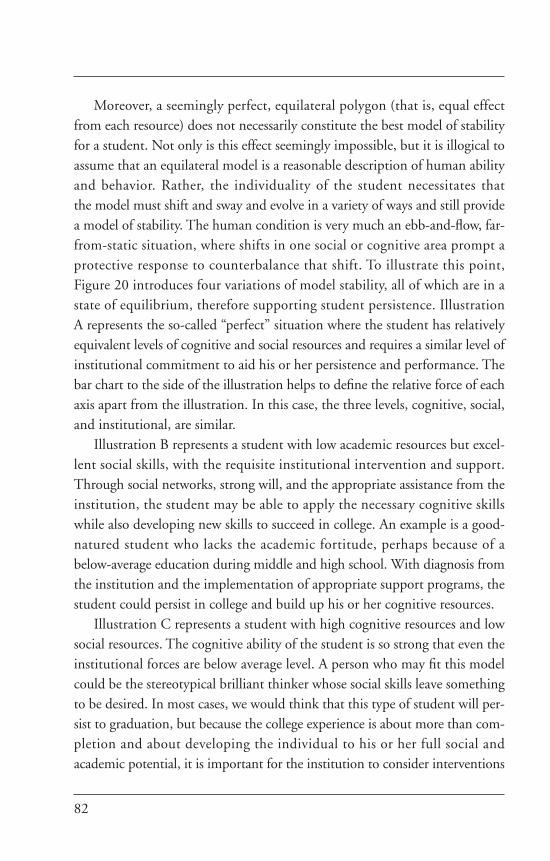
Moreover, a seemingly perfect, equilateral polygon (that is, equal effectfrom each resource) does not necessarily constitute the best model of stabilityfor a student. Not only is this effect seemingly impossible, but it is illogical toassume that an equilateral model is a reasonable description of human abilityand behavior. Rather, the individuality of the student necessitates thatthe model must shift and sway and evolve in a variety of ways and still providea model of stability. The human condition is very much an ebb-and-flow, far-from-static situation, where shifts in one social or cognitive area prompt aprotective response to counterbalance that shift. To illustrate this point,Figure 20 introduces four variations of model stability, all of which are in astate of equilibrium, therefore supporting student persistence. IllustrationA represents the so-called “perfect” situation where the student has relativelyequivalent levels of cognitive and social resources and requires a similar level ofinstitutional commitment to aid his or her persistence and performance. Thebar chart to the side of the illustration helps to define the relative force of eachaxis apart from the illustration. In this case, the three levels, cognitive, social,and institutional, are similar.
Illustration B represents a student with low academic resources but excel-lent social skills, with the requisite institutional intervention and support.Through social networks, strong will, and the appropriate assistance from theinstitution, the student may be able to apply the necessary cognitive skillswhile also developing new skills to succeed in college. An example is a good-natured student who lacks the academic fortitude, perhaps because of abelow-average education during middle and high school. With diagnosis fromthe institution and the implementation of appropriate support programs, thestudent could persist in college and build up his or her cognitive resources.
Illustration C represents a student with high cognitive resources and lowsocial resources. The cognitive ability of the student is so strong that even theinstitutional forces are below average level. A person who may fit this modelcould be the stereotypical brilliant thinker whose social skills leave somethingto be desired. In most cases, we would think that this type of student will per-sist to graduation, but because the college experience is about more than com-pletion and about developing the individual to his or her full social andacademic potential, it is important for the institution to consider interventions
82
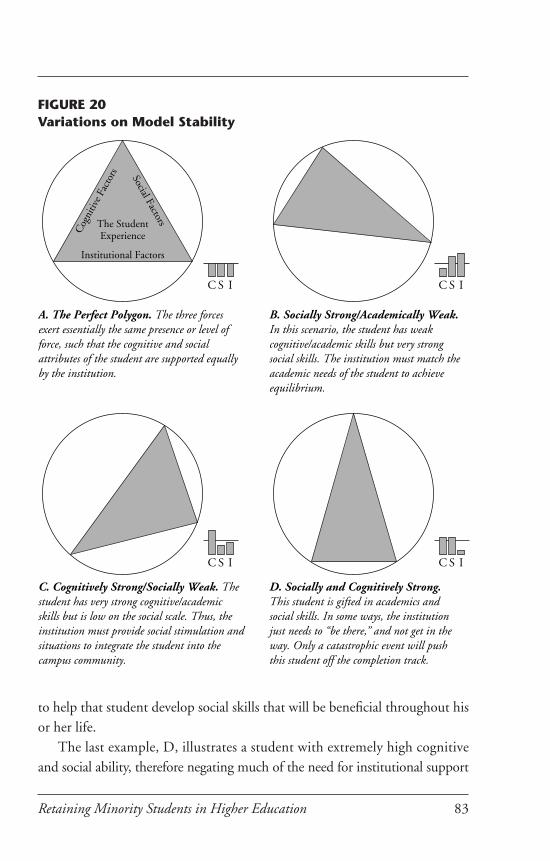
83Retaining Minority Students in Higher Education
C S I
A. The Perfect Polygon. The three forcesexert essentially the same presence or level of force, such that the cognitive and socialattributes of the student are supported equallyby the institution.
B. Socially Strong/Academically Weak.In this scenario, the student has weakcognitive/academic skills but very strongsocial skills. The institution must match theacademic needs of the student to achieveequilibrium.
C. Cognitively Strong/Socially Weak. Thestudent has very strong cognitive/academicskills but is low on the social scale. Thus, theinstitution must provide social stimulation andsituations to integrate the student into thecampus community.
D. Socially and Cognitively Strong.This student is gifted in academics andsocial skills. In some ways, the institutionjust needs to “be there,” and not get in theway. Only a catastrophic event will pushthis student off the completion track.
C S I
C S I C S I
Institutional Factors
The StudentExperience
Social Factors
Cog
nitiv
e Fac
tors
FIGURE 20Variations on Model Stability
to help that student develop social skills that will be beneficial throughout hisor her life.
The last example, D, illustrates a student with extremely high cognitiveand social ability, therefore negating much of the need for institutional support

beyond those related to basic instruction. In fact, it is likely that the institu-tion acts more as a barrier than a conduit to goal attainment for students fit-ting this mold. With such strong academic and social skills plus relatedresources, these students probably tear through the curriculum (the classic dis-tance education student).
As described, the graphic representations in Figure 20 illustrate four dif-ferent student models; all are considered in equilibrium because of the abilityof the institution to deliver the appropriate level of support services to counterthe strengths and weaknesses of the student. If one component of the model isforced to overcompensate for too many negative factors attributed to the othertwo sides of the triangle, then the student is likely to run into problems. Thus,a student with low net cognitive resources and low net social resources isunlikely to persist in college, regardless of what the institution may provide interms of support services.
A Chronological MetricThe model can also be used to represent the cognitive and social growth of stu-dents over time. Figure 21 illustrates the time element, where the trianglerepresents the present and the area beyond the triangle represents all prior influ-ences and experiences, as recent as yesterday, as far back as preschool, if neces-sary. This concept is especially important at the time of college matriculation,for it can provide college administrators, faculty, and staff a snapshot of astudent’s cognitive and social attributes at the entry point into college. Giventhat the triangle sides represent the present, the institution must have a processfor identifying the impacts and abilities of the student beyond the triangle, thatis, measuring their capabilities based on their progress during the K–12 years.Colleges typically use standardized test scores, GPAs, course transcripts, andeven support letters and interviews to gauge a student’s past.
For the institution, the ability to learn about a student’s history is morethan about testing and analysis. It is an opportunity to connect with thestudent and become cognizant of his or her goals and aspirations. With thisinformation, the institution can modify individual programs to meet specificneeds of the student. The entire admissions process allows an institution theopportunity to match its goals with those of the student.
84
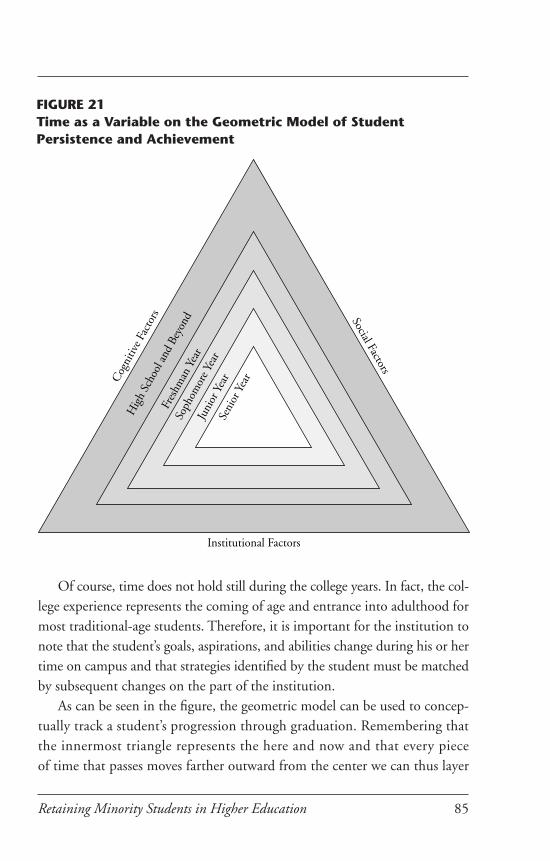
Of course, time does not hold still during the college years. In fact, the col-lege experience represents the coming of age and entrance into adulthood formost traditional-age students. Therefore, it is important for the institution tonote that the student’s goals, aspirations, and abilities change during his or hertime on campus and that strategies identified by the student must be matchedby subsequent changes on the part of the institution.
As can be seen in the figure, the geometric model can be used to concep-tually track a student’s progression through graduation. Remembering thatthe innermost triangle represents the here and now and that every pieceof time that passes moves farther outward from the center we can thus layer
85Retaining Minority Students in Higher Education
Social Factors
Institutional Factors
Cog
nitiv
e Fac
tors
Seni
or Y
ear
Juni
or Y
ear
Hig
h Sc
hool
and
Bey
ond
Fres
hman
Yea
r
Soph
omor
e Yea
r
FIGURE 21Time as a Variable on the Geometric Model of StudentPersistence and Achievement
each progressive period of time as it occurs. From a theoretical point of view,the model has the ability to consider all prior history, including high schooland beyond. From a practical point of view, it can help us gather and use infor-mation chronologically to chart or track students’ progress before matricula-tion and during college. This observation is significant, because it gives us aphilosophical picture of how students progress and change over time. For aninstitution, it can provide the necessary knowledge and information to gaugeinstitutional practices and alter the individual learning plans associated witheach student. For example, on the social side of the model, an institution canand should track the student’s social development, as measured through appro-priate inventories administered biannually or annually. Likewise, the academicprogression of the student can be measured through credits earned, coursegrades, and course examinations.
Practical Implications of the Geometric ModelThe strength of the geometric model introduced in this paper lies in the snap-shot it can provide administrators and practitioners regarding the relationshipbetween institutional practice and the academic and social needs of the cam-pus population. If the institution is to support these needs, it is necessary thatthey identify and understand them. Just because a particular student popula-tion has previously exhibited certain tendencies through its academic abilitydoes not assure an institution that all students will represent that behavior.Therefore, the institution must base its policy decision making on a contin-ual assessment of individual student needs.
Tinto (1993), Pantages and Creedon (1978), and others have suggested theimportance of institutional and student fit with regard to persistence. It is oftenthe incongruence between institutional goals and student goals that leads tostudents’ dropping out (Tinto, 1975). The nature of the person-environmentfit theory also explains these phenomena. Differences between the commit-ment of students to the institution and the institution to the student may welldefine the comfort level of the student in terms of persistence. Part of thehuman condition is the need to comfort and be comforted, and institutionsmust provide a culture that supports these values. It is through the matching
86

of student goals and attributes and institutional mission that a positive state ofequilibrium can be developed.
This model works to help describe the persistence process and the delicatebalance between student resources (for example, what the student brings tocampus) and institutional resources (for example, what the institution pro-vides for the student). But the strength in the model and the framework thatfollows is in its ability to help institutions work proactively to support studentpersistence and achievement. For instance, if the institution has requisiteknowledge of individual student background and goals, it can then provide amenu of programs and support opportunities to make up for any social or aca-demic deficiencies. Most college diagnosis is limited to the collection of SATscores, high school GPA, and course grades, which is far from exhaustive interms of understanding the student persona. In fact, they provide a unidi-mensional perspective of the student. Very little is done to observe students’affective and social talents or challenges, which are important components ofthe persistence puzzle. Furthermore, the standard diagnostics do not accountfor any “intelligences” other than the mathematical-rational. Institutionsshould collect data to provide administrators and faculty with a more concisepicture of the student body. The more understanding the institution is of stu-dents’ needs, the better prepared it is to design and implement programs andsupport services to meet those needs. Many colleges are now using diagnosticassessments before matriculation to ascertain students’ level of academic abil-ity. The next step would be to begin to ask questions regarding students’ socialdevelopment and preparedness.
Let us first ask what type of data is representative of our needs. Beyondthat of academic scores or ranking, institutions could develop an entirely dif-ferent process for recruiting and admitting students (Guinier, 2001). Theprocess might include the development of a portfolio of student work thatcovers his or her entire high school experience, including art, music, physics,languages, and even extracurricular activities. The interest and involvement ofa student in the Young Astronauts Club or the Technology Student Associa-tion may be just as compelling as a physics grade, because they illustrate thestudent’s desire, motivation, and development of knowledge within a partic-ular discipline.
87Retaining Minority Students in Higher Education

The institution might also require statements from teachers about the natureof the student, much like a letter of reference for a job application. At a certainstage, colleges should interview students and get to know them on a personallevel, where appropriate. Although some colleges do so, it is not a widespreadpractice, especially at large campuses. The formation of precollege outreach pro-grams can bring students closer to the college, metaphorically speaking. Alumniclubs, recent graduates, and undergraduate and graduate students can all beused as intermediaries in recruiting students.
Diagnostic and supplementary knowledge of the student is a vital com-ponent of the geometric model. Without this knowledge, the institution isincapable of making prudent decisions about whom to admit. In fact, thisprocess is bidirectional, because the initial phase of getting to know the stu-dent is also the stage where the student gets to know the institution, and onlythrough this information sharing can either party effectively assess the fitbetween them.
It is also reasonable to assume that through the college experience, studentschange, both cognitively and socially. As Tinto (1982) states, “We have rea-sons to believe that the forces that lead to dropout in the early stages of theacademic career can be quite different from those that influence dropout later”(p. 693). Therefore, institutions must provide support at each step of theprocess, not just during the freshman year.
A Framework for Student RetentionMost frameworks or “models” focus on departure and the paths through post-secondary education. In this chapter, we introduce a framework focused onstudent retention and success.
Purpose of the FrameworkThe campus-wide retention framework that follows was designed to provideadministrators with a strategy and framework to build a student retention pro-gram that incorporates the individual needs of its students and the institution.It was designed with the hope that this framework will allow administratorsand planners to devote more of their time to planning and management rather
88
than to the uncovering of research to support their actions. It is a most impor-tant provision, as the literature is often equivocal. That is, the sheer complex-ity of student retention and the plethora of factors that impact students beforeand during college make it difficult to assess the final meaning of the aggre-gate research available on retention. We hope this framework helps amelioratethat problem.
With respect to program development and operation, an important aspectof the framework is the identification of organizational strategies that best sup-port the planning and implementation of the student retention program.Regardless of the knowledge acquired and assessed by the institution, the needto follow a practical course of planning and implementation is essential to theultimate success of any endeavor. Thus, the identification of successful organi-zational and planning strategies is imperative to this study and to institutionsinterested in fostering systemic change. They are discussed in the next chapter.
From an administrative perspective, the strategies introduced in the frame-work are not prescriptive. They are applied as examples of institutional prac-tices that are consistent with current thinking within the various communitiesas well as what we have been able to ascertain through research.
Finally, this framework will be particularly significant in providing anunderstanding of the various roles that will be expected and required of admin-istrators, faculty members, and staff members on campus if the effort is to besuccessful.
The genesis of this research framework was a doctoral research study bySwail (1995), which focused on minority student retention in science, engi-neering, and mathematics. Swail’s study was based on an extensive review ofpertinent literature, which resulted in the development of a series of research-based institutional practices that had been shown to effectively increase minor-ity student persistence. They were placed into five categories: student services,academic services, curriculum and instruction, recruitment and admissions,and financial aid.
The second stage of Swail’s research (1995) involved the formation of anational panel of experts and scholars in the area of minority student persistence.Based on nominations from established scholars and practitioners, sixteenexperts—including vice presidents of educational foundations, senior scholars
89Retaining Minority Students in Higher Education

at national associations, and nationally recognized researchers and professors—were selected to participate. Participating in a two-stage Delphi technique, thepanel responded to the five-category framework.
The first Delphi round formed the foundation of the study by allowingpanelists to comment on the five-category framework. Panelists were asked torate individual objectives of the framework on a four-point Likert-type scaleand add comments regarding each objective. After the responses were ana-lyzed, a second round focused on ranking and clarifying the objectives withinthe framework.
Panelists were asked to comment on and modify the framework based ontheir specific expertise and experience. The result of this two-stage Delphi inquirywas a research-based framework that outlines a series of practices that may helpreduce student attrition in science, engineering, and mathematics.
Since that study, a number of pertinent research studies have been con-ducted and the importance of student retention has once again been recog-nized. Based on subsequent literature reviews and research, it was believed thatthe framework could easily be modified to encompass other disciplines beyondscience, engineering, and mathematics.
A Research-Based FrameworkStudies and issues regarding minority student persistence are not new, andmany of the practices identified and outlined in this research-based frameworkhave been presented before. Two main differences between this framework andprevious efforts include the broad scope of coverage across a variety of campusissues and the specific recommendations for institutional practice. The frame-work provides administrators and practitioners with a menu of activities, poli-cies, and practices to consider during the planning and implementation of acomprehensive campus-based retention program. It should be noted that noth-ing here is completely prescriptive. Readers should remember that it is indeeda “framework” and that the following ideas and strategies are guidelines to beginthe design and implementation process on your college campus. In the end,each institution must develop its own strategy to be successful, as no one-size-fits-all approach exists. What lies beyond are strategies from the research liter-ature to help in planning and development. The retention framework is
90

91Retaining Minority Students in Higher Education
classified into five components based on an extensive review of current literature(Figure 22). Four of the five components—financial aid, recruitment andadmissions, academic services, and student services—are generally majordepartments in most four-year institutions. The fifth component, curriculumand instruction, is receiving more attention and consideration at colleges andwas added to this study because of the direct impact it has on student reten-tion. The framework components are further broken down into categoriesbased on areas of specialization and subsequently into specific objectives.
It is important that practitioners understand the relationship between theframework’s components. Most notable is the ability of campus departmentsto work together toward common goals and focus on students’ needs (Noel,Levitze, and Saluri, 1985; Smith, Lippitt, and Sprandel, 1985). From an orga-nizational perspective, it is difficult to imagine how any of the componentscould work effectively without links to other areas. For instance, financial aidoffices work closely with recruitment and admissions offices, while academicservices must work in tandem with departmental efforts in curriculum andinstruction. The framework attempts to develop additional links, such asthose between student services and academic services, where the notion ofTinto’s theory of academic and social integration (1975, 1993) is most
Recruitmentand Admissions
StudentMonitoring
System
StudentServices
Financial Aid
Curriculum andInstruction
AcademicServices
FIGURE 22Five Components of the Student Retention Framework
SOURCE: Swail, 1995.
relevant. The link of recruitment practices with precollege academic supportprograms is a good example of how a campus-wide support network can helpstudents persist toward graduation. Thus, interrelation of the five componentswithin the framework should be a major consideration for practitioners anddevelopers.
As shown in Figure 22, the research-based framework is supported by astudent monitoring system. The system, identified from literature and paneldiscussion as an important component of a campus-wide retention program,is a resource that supports the linkage of campus components or services. Sucha system, when developed to capture data that reflect the true nature of stu-dent and faculty life, provides institutions with a snapshot of student experi-ence in terms of academic and social development (Tinto, 1993). It is withthis knowledge that campus offices and personnel can generate more appro-priate methods of supporting students’ needs. To make this system useful,institutions must ask the appropriate questions and be willing to enact sys-tems to collect data that can answer those questions. It can be a huge amountof work, but it is undoubtedly the only way of answering the difficult butimportant questions that relate to student persistence.
Component One: Financial AidFinancial aid is a critical part of the persistence puzzle. For students from low-income backgrounds, many of whom are students of color, finances are a make-it or break-it issue. A strong financial aid office is often the sign of a well-oiledcampus, where latitude is given to students who have special financial needs.
Four categories were used to describe financial aid (see Figure 23).Grants and scholarships, student loans, financial counseling, and assistantships/work-study programs were all identified in the literature and supported by thepanel to be important factors in student retention.
Although research has shown that grants are a much better predictor of stu-dents’ persistence than loans (Astin, 1982; U.S. General Accounting Office,1995), the finite limitations on the availability of grants and scholarships suggestthat loans and work-study options must remain open avenues for students togain access to the nation’s postsecondary institutions. Princeton, Stanford, anda host of other Ivy League campuses have made news in recent years by making
92

93Retaining Minority Students in Higher Education
FIGURE 23Financial Aid Component
1 Financial Aid
1.1 Financial Aid Counseling/Training
1.1.1 Improve the flow and ease of infor-mation to students and familiesregarding college financingoptions.
1.1.2 Ensure that prospective studentsand families receive aid and othercollege information early.
1.1.3 Collaborate with financialmanagement professionals to offerfinancial management seminars tostudents and families.
1.1.4 Provide financial aid counselorswith cultural diversity/sensitivitytraining.
1.2 Grants and Scholarships1.2.1 Maximize availability of grant and
scholarship aid compared withstudent loans.
1.2.2. Create additional sources of grantand scholarship aid through theprivate sector.
1.2.3 Ensure that funds are available toprovide emergency grants to stu-dents as required.
1.3 Loans1.3.1 Educate students and family members
about student loan obligations.1.3.2 Streamline bureaucracy and forms to
simplify loan application process. 1.3.3 Integrate mandatory career develop-
ment with student borrowing.1.3.4 Provide emergency loans to students
in need.
1.4 Assistantships and Work-study1.4.1 Expand assistantships and
work-study programs forundergraduates.
1.4.2. Restrict assistantships and work-studyto 15–25 hours per week for full-timeundergraduates.
1.4.3 Partner with area businesses in closeproximity to campus to forge assist-antships and research opportunitiesfor undergraduates.
1.4.4 Create opportunities with public andprivate businesses that lead to employ-ment after graduation with “loan for-giveness” compensation plans.
large commitments to need-based aid,4 but the reality outside of a handful ofinstitutions in our entire postsecondary system suggests that colleges mustdevelop increasingly creative and alternative ways to increase institutional aidfor needy students, especially at moderately priced private institutions.
4In early 1998, Princeton University made public that it would spend an additional $6 mil-lion a year providing aid to low-income students. Within a month, both Yale and Stanfordfollowed suit with similar promises. Although most financial aid experts applauded the news,the underlying comment from the majority was that these institutions “could afford it.”

Although some ethnic groups historically are averse to financial debt(Thomas, 1986), loans are nonetheless a standard component of most financialaid packages. Institutions must consistently review their packaging proceduresand ensure that students and families are educated about the loan process andthat the loan represents a long-term investment against future returns. Thedelivery of accurate and easy-to-follow information regarding loan availabil-ity and regulations is an important factor for families.
A major barrier to access and persistence is the lack of information for par-ents and students regarding grants, loans, and scholarship opportunities. Col-leges must be proactive in advising families of the price of college,5 selectioncriteria, and availability of financial aid opportunities. The application processmust also be designed such that it does not deter families from applying forfinancial aid (Astin, 1982; Collison, 1988). In the late 1990s, the U.S. Depart-ment of Education conducted focus groups and video profiles of parents andfamilies completing the Free Application for Federal Student Aid (FAFSA)form, which must be completed by all students applying for federal aid in theUnited States. The department found that most families, from all income lev-els, had trouble completing the form. Although the Student Financial Aidoffice within the U.S. Department of Education has made strides in this area,the financial aid process is still a maze and deterrent for many families.
One other area for consideration is the availability of emergency loans andgrants for students who occasionally require additional financial supportmidway through a semester as a result of unanticipated costs associated withbooks, health care, and travel. The availability of quick turnaround funds forstudents can help students focus on their studies and persist through thesemester.
Assistantships and work-study programs can be an important part of a stu-dent’s college education, especially for science majors. Astin (1975), for exam-ple, found that work-study programs could increase student persistence by15 percent. These opportunities provide students with money, experience inthe field, and, perhaps most important, networking capabilities for future
94
5Much of the discussion of the “cost” of college has been confusing to those in higher educa-tion, let alone parents and students. To this end, and in accordance with the recent report fromthe National Commission on the Cost of Higher Education (1998), the amount that studentsand parents pay as “price” and “cost” refers to the cost associated with supplying education.
employment and research possibilities. Recent research by NCES (Horn,1998), however, supports Astin’s finding a threshold exists where the amountof work per week distracts students from their studies and lowers thechances of a student’s persisting.6
Financial counseling is the foundation for grants, loans, and work-studyprograms. Counseling allows campuses to reach out to families and studentsand offer a variety of avenues to finance college attendance. College financingis arguably one of the most important and costly endeavors a family maymake, and financial aid staff must be cognizant of the burden these decisionsplace on families and provide excellent support for them during the decision-making process. Additionally, families need information early. Colleges canwork with school systems to develop financial aid nights.7
The financial aid portion of the framework has three major objectives:
1. Disseminate information. To make informed decisions, appropriate infor-mation must get to students and families regarding student financial aid.The use of new technologies to deliver this information, such as computernetworks and computer-interactive systems, can help families plan for col-lege and learn more about the college environment and requirements. Anumber of college cost calculators are on the Web, and institutions can linkinto them. They are useful, however, only if the targeted constituencies usethem. Institutions must devise efficient and coherent communication pathsto interested families in a method that is both informative and supportive.Yet access to these new technologies, especially computers and the Inter-net, is heavily influenced by family income. Thus, traditional informationor access to computer-aided information must also be made available.
2. Increase availability of need-based aid. Colleges should attempt to revisecurrent lending practices to increase the availability of grants, scholarships,work-study programs, and loans to needy families. Much of the avail-ability is based on federal authority, but institutions still make key
95Retaining Minority Students in Higher Education
6Both Astin’s and NCES’s research found that students who worked about fifteen hoursgenerally persisted more than other students. Those who worked more hours tended to havehigher rates of departure.7The National Association of Student Financial Aid Administrators (NASFAA) helps coordi-nate financial aid nights around the country. For more information, see http://www.nasfaa.org.
decisions on institutional and other aid. A case in point is the trend tomove toward merit-based aid on campus. Colleges should consider theimpact of those decisions and maximize aid to needy students. The revi-sion of current national financial aid policies, although beyond the con-trol of individual colleges, must be watched carefully by collegeadministrators and national collegiate association representatives.
3. Reconsider aid packaging. Steady increases of tuition and fees requirecreative packaging, especially for students from low-income backgroundsbut also for all students. The packaging of federal aid is legislativelycontrolled, and some private aid, such as the “last dollar” programs, hascertain restrictions on how they are packaged with other aid components.Institutions have more flexibility with their institutional aid, however, andcan use it in a variety of ways (for example, merit, supplementary need-based grants). Some research shows that front-loading student aid pack-ages (that is, coordinating financial disbursement so that students receivemore money during the freshman year and diminished amounts in sub-sequent years) results in a more efficient use of loan money (U.S. GeneralAccounting Office, 1995) and can help students get over the hump oftheir college experience. Many financial aid practitioners are wary of thatpractice, however, and would rather use it in other ways.
Component Two: Recruitment and AdmissionsThe development of enrollment management programs in recent years hasempowered the recruitment and admissions staff on many campuses. Froman institutional perspective, how an institution “chooses” its prospective stu-dents and what financial aid it offers is the crux of institutional business. Insti-tutions must be cognizant of the issue of institution-student fit, and at somepoint the business side must regress to allow for the personal side of the col-lege connection. Ultimately, college is a service industry, and the student isthe client.
The three categories under the classification of recruitment and admissionsinclude student identification, admissions, and orientation (see Figure 24).
Tinto (1993) and other researchers (Astin, 1975; Cope and Hannah, 1975)discuss the importance of matching students’ goals and expectations to a
96
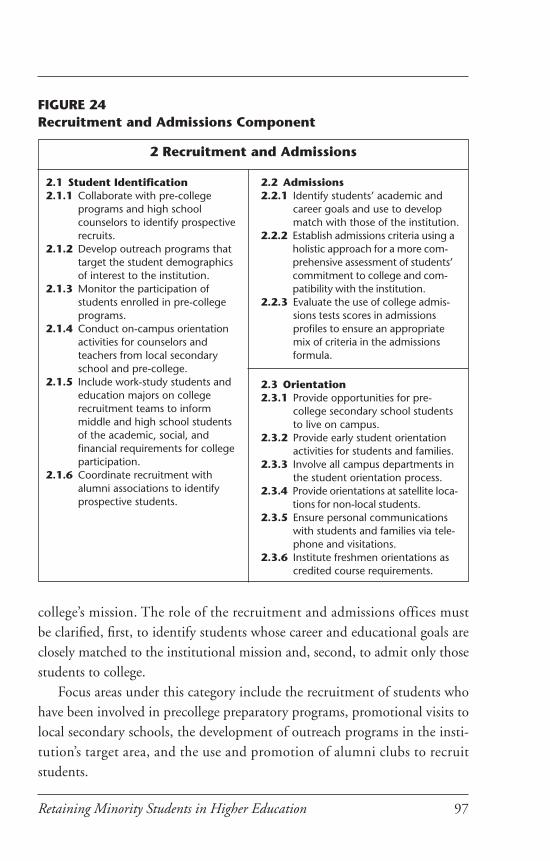
97Retaining Minority Students in Higher Education
FIGURE 24Recruitment and Admissions Component
2 Recruitment and Admissions
2.1 Student Identification2.1.1 Collaborate with pre-college
programs and high schoolcounselors to identify prospectiverecruits.
2.1.2 Develop outreach programs thattarget the student demographicsof interest to the institution.
2.1.3 Monitor the participation ofstudents enrolled in pre-collegeprograms.
2.1.4 Conduct on-campus orientationactivities for counselors andteachers from local secondaryschool and pre-college.
2.1.5 Include work-study students andeducation majors on collegerecruitment teams to informmiddle and high school studentsof the academic, social, andfinancial requirements for collegeparticipation.
2.1.6 Coordinate recruitment withalumni associations to identifyprospective students.
2.2 Admissions2.2.1 Identify students’ academic and
career goals and use to developmatch with those of the institution.
2.2.2 Establish admissions criteria using aholistic approach for a more com-prehensive assessment of students’commitment to college and com-patibility with the institution.
2.2.3 Evaluate the use of college admis-sions tests scores in admissionsprofiles to ensure an appropriatemix of criteria in the admissionsformula.
2.3 Orientation2.3.1 Provide opportunities for pre-
college secondary school studentsto live on campus.
2.3.2 Provide early student orientationactivities for students and families.
2.3.3 Involve all campus departments inthe student orientation process.
2.3.4 Provide orientations at satellite loca-tions for non-local students.
2.3.5 Ensure personal communicationswith students and families via tele-phone and visitations.
2.3.6 Institute freshmen orientations ascredited course requirements.
college’s mission. The role of the recruitment and admissions offices mustbe clarified, first, to identify students whose career and educational goals areclosely matched to the institutional mission and, second, to admit only thosestudents to college.
Focus areas under this category include the recruitment of students whohave been involved in precollege preparatory programs, promotional visits tolocal secondary schools, the development of outreach programs in the insti-tution’s target area, and the use and promotion of alumni clubs to recruitstudents.
Although traditional admissions practice incorporates some level of stu-dent assessment to verify institutional fit, the process is not as sophisticated asit could be. Colleges should use a number of assessment and evaluation prac-tices in the admissions office to determine the extent of student-institutioncongruence. Although the majority of four-year colleges widely use SATs andother norm-referenced tests for gatekeeping, they are by no means the onlymeasures of students’ ability or aptitude. Even the College Board stronglyadvises that the SAT should be used only in conjunction with other measures,such as GPA, class rank, and other noncognitive measures, including essaysand interviews.8 Additionally, colleges should consider that the admissionsprocess is also an opportunity to accept the reciprocal responsibility of ensur-ing that the institution fits the student. The admissions process is primarilyabout service to students, not gatekeeping, even though gatekeeping is a defin-itive role in the admissions process.
Finally, the campus orientation aspect of this component is an importantpart of student integration on campus, both socially and academically. Ori-entation should look beyond the student and offer opportunities to familiesand significant others, as the college experience is truly an experience for theentire family and not just the person in attendance. The Lubin House expe-rience at Syracuse University (Elam, 1989) remains an exemplary model ofsatellite orientation practice that other colleges should study carefully. Addi-tionally, on-site orientation and extensive communications with familiesshould become standard practice for any college.
The recruitment and admissions segment of the framework has five majorobjectives:
1. Precollege programs. To ensure the efficiency of campus offices related tostudent recruitment, coordinators should capitalize on student data andinvolvement in precollege programs offered by the institution. Studentsin these programs generally have already shown college aspirations and
98
8The College Board, in its annual press release about college-bound seniors each September(the release of SAT and advanced placement data), prominently makes note of the limitationsof standardized test scores and the dangers of using them without other indicators. Furtherinformation on this issues may be found at http://www.collegeboard.org.

academic potential, and have been oriented to the college. Therefore, pre-college programs offer institutions an opportunity to recruit and assessstudent ability based on previous contact with students and schools.
2. Alternative assessment methods. Colleges can revise current selection crite-ria to include a variety of assessment techniques, including portfolios,interviews, and perhaps other nontraditional methods of pretesting.Although there is concern over the cultural bias of SAT testing(Kalechstein and others, 1981; Dreisbach and Keogh, 1982; Steele, 1999;Jencks and Phillips, 1998; Guinier, 2001), most empirical research findsSATs and the academic rigor and selection of high school courses to bethe best predictors of student persistence and success (Sedlacek and Prieto,1990; Adelman, 1999).
3. School visitations. The use of work-study students, graduate assistants, andother student personnel to make visits to local high schools (especiallytheir alma maters) in the capacity of recruiter is a cost-effective way ofreaching out to the community. This practice is appealing because of theclose connection between college students and high school students asopposed to trying to bridge the gap with recruitment personnel. Theseinteractions also help generate a peer relationship between the college andhigh school that may be an important part of a student’s decision to attendcollege or a particular campus.
4. On-campus living orientation. Providing high school students enrolled inprecollege programs with on-campus experiences, especially living oppor-tunities, can have long-term positive impacts on their aspiration for post-secondary studies. This practice has practical applications for both studentsand colleges: it gives students opportunities to test the college environ-ment and become more familiar and comfortable with the college, and itallows colleges a much better chance of recruiting students who have hadextended visits to the campus.
5. Freshman orientation. Linking freshman orientation programs with coursecredit generally increases students’ interest and attention and justifies theirimportance to students in relation to their academic pursuits. Some uni-versities have designed one–, two–, or three–credit hour programs for first-semester students. Although the establishment of mandatory orientation
99Retaining Minority Students in Higher Education
without credit is a standard practice on many campuses, students oftenresent this use of their time, particularly when orientations are poorlyplanned and offer students little in terms of increased knowledge regard-ing university services and regulations or useful skills.
Component Three: Academic ServicesThe academic services component is the most diversified and expansive com-ponent in the framework (see Figure 25). The focus of academic services interms of student retention and persistence is on providing supplementarysupport to students in addition to practice with classroom lectures. This com-ponent is divided into six categories: academic advising, supplementaryinstruction, tutoring and mentoring, research opportunities, precollegeprogramming, and bridging programs.
Effective academic advising is important to laying out an appropriatecourse map for students (Forrest, 1982; Beal and Noel, 1980). To be effective,it is important that students receive guidance that reflects their needs andincorporates the knowledge of campus programming and bureaucratic prac-tices. Prospective advisers need to be trained accordingly to handle a varietyof issues during advising sessions.
Many campuses have initiated computer-based advising systems. Althoughthese systems are cost-effective, they do not allow for the development ofrelationships or the interaction between adviser and student, an importantopportunity to talk with the student about his or her progress.
Beal and Noel (1980) also noted the importance of using faculty as studentadvisers. This practice has many potential benefits in addition to the academicguidance that may be offered, including role modeling and mentoring. Facultymembers must be appropriately briefed and trained on the institution’s variousissues and policies, however. This practice is not often followed at institutions.
Supplementary instruction programs are prominent on many colleges anduniversity campuses. The supplementary instruction program developed atthe University of Missouri–Kansas City is perhaps the most widespread programin use. In addition to providing remedial activities and supplementary support,however, departments must also continue to develop better strategies that increaseknowledge acquisition and improve the learning process for all students.
100

101Retaining Minority Students in Higher Education
FIGURE 25Academic Services Component
3 Academic Services
3.1 Academic Advising3.1.1 Provide ongoing professional
development opportunities forcounseling staff.
3.1.2 Provide appropriate academicadvising and counseling tostudents throughout the collegeexperience.
3.1.3 If faculty members act asacademic advisors, ensure thatthey are properly trained and arecognizant of specific policies,course structures, and creditrequirements within theinstitution.
3.2 Supplementary Instruction3.2.1 Encourage the development of
peer study groups to fosterlearning.
3.2.2 Incorporate more practicalapplication exercises with classassignments.
3.2.3 Integrate a variety of Instructionalmethods to support studentlearning.
3.2.4 Employ peer instructors forsupplementary instruction, whenpossible.
3.2.5 Develop academic learningcenters to provide supplementarysupport for students.
3.2.6 Provide non-classroom opportu-nities for student-facultyinteraction.
3.4 Research Opportunities3.4.1 Support the development of
faculty-student research projects.3.4.2 Integrate regular research activities
into curricula.3.4.3 Develop partnerships with industry
for research opportunities.3.4.4 Collaborate with business and
industry on in-class presentationsand experiments.
3.5 Pre-College Programs3.5.1 Develop pre-college programs at
elementary and secondary educa-tion levels.
3.5.2 Offer pre-college programs on andoff campus.
3.5.3 Monitor students’ progress in pre-college programs.
3.6 Bridging Programs3.6.1 Provide summer academic and
social support for students requir-ing additional support during thesummer before matriculation.
3.6.2 Provide on-campus residency tostudents during bridge programparticipation.
3.6.3 Monitor all students’ progress inbridging programs.
3.3 Tutoring/Mentoring3.3.1 Provide regularly scheduled, easy access tutoring to students for all courses.3.3.2 Use Teaching Assistants (TAs), Research Assistants (RAs), and exemplary under-
graduates as tutors.3.3.3 Encourage peer tutoring and group studying within class population.3.3.4 Encourage faculty members to support the academic development of students
outside of class time.3.3.5 Create incentives for faculty participation in mentoring programs.3.3.6 Recruit a diverse mentoring staff of students, faculty, and staff.

Tutoring and mentoring practices form another support network for stu-dents. Colleges must make tutoring support available and affordable to studentswith such need. Faculty members should also make themselves available foracademic assistance. Many researchers have substantiated this out-of-classroomcontact between students and faculty members as an important factor in studentpersistence (Ugbah and Williams, 1989; Griffen, 1992), with ramifications forthe student’s personal, social, and intellectual development (Griffen, 1992).
Students in science-based disciplines (social and physical) can benefitgreatly from research opportunities. The link between classroom theory andreal-world practice has positive implications for a student’s retention of knowl-edge while also making him or her more marketable after graduation. Thedevelopment of local business partnerships and encouragement of on-campusresearch can create excellent opportunities for students.
Precollege programs provide an opportunity for the campus to workactively with elementary and secondary students (Swail and Perna, 2002). Thefederally funded TRIO programs have provided support to low-income andother students for more than thirty years. As well, partnerships through thefederal GEARUP (Gaining Early Awareness and Readiness for Undergradu-ate Programs) initiative have heightened awareness and interest among manycolleges. Other regional programs such as MESA (Mathematics, Engineering,and Science Achievement) and MSEN (Mathematics and Science EducationNetwork) are examples of how precollege programs can help motivate studentstoward those areas. Colleges can benefit greatly from the establishment of theseand other programs and the ensuing partnerships with K–12 schools andcommunity organizations.
Bridging programs are an offshoot of precollege programs but are morespecific. Colleges can effectively use a high school student’s senior year or sum-mer before matriculation to help further develop and orient the student’sknowledge and ability to meet freshman program requirements. Study skills,time management, and course-related study are popular content offerings.
The academic services portion of the framework has five major objectives:
1. Academic advising. Colleges should implement a regular and standard prac-tice of academic advising for students. Students’ attitudes are also directly
102
related to persistence, and a proactive advising system of checks and bal-ances would require scheduled meetings to catch problems before theyoccur. Such meetings should be face to face, not moderated by computer.
2. Diverse instruction. Supplementary instruction programs should use acombination of successful instructional techniques that support learningpreferences of the entire student audience. Online and distance educationhas helped raise the bar for teaching and learning on campus, and facultyneed to be more aware of the interaction of teaching styles and pedagogywith student learning styles (Whimbey and others, 1980; Hyman, 1988).
3. Bridging programs. Colleges should focus on developing academic bridgeprograms between senior year in high school and the freshman year in col-lege. On-campus intervention programs afford students a number ofpotential benefits, including opportunities to become acclimated to thecampus, work through some freshman problems before the fall semesterbegins, receive academic support in areas of weakness, and become accus-tomed to the pace associated with college-level academic learning.
4. Precollege programs. To help develop the pipeline of students interested inattending college, institutions should place considerable resources into thedevelopment of precollege programs wherever possible and practical.These programs, provided at levels as early as elementary school, helpmotivate students, get them thinking about the possibility of college, andprovide important academic support and college knowledge to studentsand their families (Swail, 2000).
5. Informal faculty-student contact. Colleges should try to promote informalcontact between faculty members and students to build trust, support, andmotivation during the college experience. Out-of-class contact with a stu-dent can create a bond and a sense of self-worth that can positively affect astudent’s locus of control and impact future decisions regarding college.Extra assistance on projects, informal discussions on academic subjects,and special social gatherings can encourage this type of interaction.
Component Four: Curriculum and InstructionThe continued development of curricula and pedagogical practice is perhaps themost important and fundamental need that colleges must address in terms of
103Retaining Minority Students in Higher Education

student retention (see Figure 26). The need to revise current practices, especiallyin gatekeeper courses, stems from what Tobias (1990) acknowledges as the prac-tice of designing courses that are “unapologetically competitive, selective andintimidating, [and] designed to winnow out all but the ‘top tier’” (p. 9).
Of primary importance to academic offices should be the continuousprocess of curriculum review and revision. This process should in fact becomea mainstream component of curriculum development. Especially in terms ofscience, engineering, and mathematics, academic content must reflect the
104
FIGURE 26Curriculum and Instruction Component
4 Curriculum and Instruction
4.1 Curriculum Review and Revision4.1.1 Design curricula with
interdisciplinary and real-worldemphasis to stimulate interestand profound understanding onbehalf of students.
4.1.2 Develop a continuous reviewprocess of curricula utilizingfaculty, student, and outsideconsultation.
4.1.3 Incorporate current andinnovative technologies into thecurriculum.
4.2 Instructional Strategies4.2.1 Incorporate interactive, relevant,
hands-on, exploratory instruc-tional practices.
4.2.2 Establish learning communities.4.2.3 Integrate Supplemental Instruc-
tion into the curriculum.4.2.4 Provide students with short- and
long-term research and applica-tion assignments.
4.2.5 Utilize educational technologiesto complement instruction.
4.3 Assessment Strategies4.3.1 Develop assessment instruments
that require students to utilizediverse cognitive skills.
4.3.2 Perform regular student testingand assessment to monitor studentprogress (standard question/answer tests, lab assignments,out-of-class assignments,observation, portfolios, etc.)
4.3.3 Employ early interventionprograms to identify and assiststudents experiencing academicdifficulty in each semester.
4.3.4 Develop digital monitoring systemfor instant trend analyses ofstudent’s achievement as deter-mined by assessment tools.
4.4 Faculty Development/Resources4.4.1 Provide appropriate in-service
development opportunities forteaching faculty.
4.4.2 Establish teaching faculty rewardsystem.
4.4.3 Create a center for teachingexcellence to support facultydevelopment.
4.4.4 Identify and/or provide grantopportunities for classroomresearch.

current dynamics of industry practice to be worthwhile and effective. There-fore, to prepare students for employment in science, engineering, and math-ematics in the near future, it follows that science, engineering, andmathematics curricula must relate not only to current industry trends andpractices but also to anticipated practices and procedures (for example, cutting-edge technology and research). Colleges should attempt to gain access to newequipment and provide instruction that uses state-of-the-art instructional tech-nologies to ensure that materials are presented in a fashion that is commen-surate with students’ learning preferences. The communication age hasradically altered traditional learning and teaching styles, especially for studentscurrently in elementary and secondary classrooms. Computers are secondnature to new students matriculating to college or attending precollege pro-grams. Within a few years, virtual reality, a technology embodied as the ulti-mate in applied scientific and medical training, may also be second nature toundergraduates. Thus, colleges must allocate resources to the development ofnew teaching strategies that incorporate the latest in educational and indus-trial technology. Without these considerations, students may find upon grad-uation that their knowledge is not aligned with the needs of society, when theyshould be on the cutting edge.
With the revision of curricular and instructional approaches comes theneed for a revision of assessment practices on campus. If new curricular prac-tices focus on a higher level of knowledge and understanding for learners,assessment practices must be able to document this higher learning. Thus, tra-ditional methods of student evaluation are not appropriate to meet the needsof emerging teaching practice. The incorporation of instruments that measurestudents’ comprehension rather than memorization and use a variety of assess-ment methods may offer a more accurate picture of student development andcomprehension.
Faculty members’ ability to deliver materials in an exciting, interesting,and motivating manner is also essential to the quality of education deliveredby an institution. Research has shown that student achievement is higher whensmaller classes and groups are used. The hands-on and group collaborativeapproach made popular by the Emerging Scholars Program at Berkeley(Fullilove and Treisman, 1990) has shown that students, with specific reference
105Retaining Minority Students in Higher Education

to African Americans, are more likely to increase their academic performancethan students not involved in these programs. In effect, instructors mustbegin to employ practices more popularly related to K–12 education to reachstudents effectively.
If these areas are to become standard practice, faculty must receive appro-priate training and support. Faculty development activities, with specific focuson teaching and assessment strategies, must become a basic foundation forinstructional practice at colleges. The possible implementation or restructur-ing of faculty reward systems could provide incentives for teaching on campus.
The curriculum and instruction portion of the framework has four majorobjectives:
1. Instructional practices. Colleges should attempt to use various methods ofdelivering content to students, focusing on comprehension rather than rotememorization. The use of hands-on, exploratory, and peer learning groupsare a few methods of motivating students to learn. A good balance is theuse of a variety of instructional methods rather than one dominant method.
2. Curricular review. Colleges should develop an integrated process of cur-riculum review to ensure that all pieces of the curriculum are up to dateand relevant to society’s needs. At many universities, individual facultymembers are left in isolation to decide what to include in a coursesyllabus, leaving much to be desired in terms of quality control. This issueis of great relevance, considering that most faculty have little or no back-ground in learning theory or educational practice. Therefore, a systemicand cyclical review process that allows for faculty to review all curriculaon a rotating basis helps control the content delivered in classes. It alsoserves to keep curricula current.
3. Professional development. Colleges need to provide extensive and ongoingprofessional development to faculty and staff to incorporate new teach-ing strategies and assessment techniques. Faculty cannot be expected toteach specific, if not more standard, courses without opportunities to shareand learn from others with different experiences. If colleges and universi-ties are serious about teaching as a focus of their mission, then it isincumbent upon them to provide support for their instructional staff.
106
4. Assessment. Campuses should design and implement new multifacetedassessment techniques that regard the integrity of human learning andunderstanding. Teaching and learning practices that require students toevaluate, synthesize, analyze, and create also require new methods ofassessing students’ progress (Ryan and Kuhs, 1993; Bird, 1990).
Component Five: Student ServicesAs Tinto (1993) and others have suggested, students’ “social integration” withthe institution is an important factor in their ability to persist. The role of thestudent services office has evolved to deal with many of the issues facing studentson campus. The atmosphere and climate of the university, reflected by how theinstitution treats and supports students and by the positive nature of peer rela-tions on campus, is important to the self-esteem and confidence a student gen-erates. Neisler (1992) concluded that personal, emotional, and family problems,in addition to feelings of isolation and adjustment to college life, are strong bar-riers to retention for African American students. Therefore, the campus mustfocus on developing an atmosphere that is supportive, safe, and pluralistic. Theoutcomes of this study found that campus climate, accessibility to campus, cam-pus housing, and career and personal counseling are areas that should be con-sidered in terms of their effect on student retention (see Figure 27).
Campus climate is not some intangible, abstract concept that just happens.More accurately stated, campus climate is the development of the beliefs andpractices of the administration, faculty, staff, and students belonging to thatinstitution. Therefore, it can be created and, to some degree, controlled. Todevelop a positive campus climate supportive of learning and human devel-opment, campuses should promote diversity on campus and extol the virtuesof shared culture (Justiz, 1994). This practice allows colleges and universitiesto better reflect the changes in society and promote pluralism. Ensuring safetyfor students and providing social opportunities for students to forge newfriendships and build trust with their fellow classmates are examples. The exis-tence of student groups and organizations can also support a positive climateby integrating students into the campus environment.
Accessibility to campus is also an important concept for institutions toconsider. Administrators must consider the use of flexible scheduling to allow
107Retaining Minority Students in Higher Education
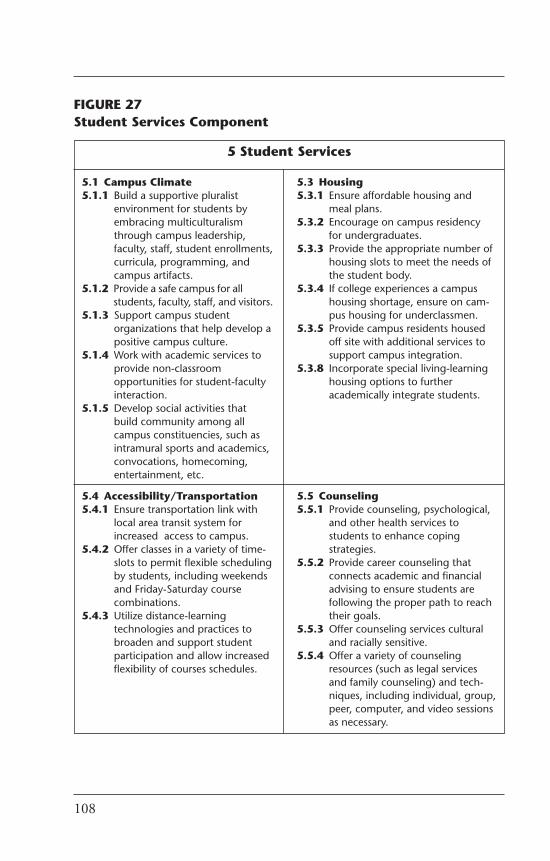
108
FIGURE 27Student Services Component
5 Student Services
5.1 Campus Climate5.1.1 Build a supportive pluralist
environment for students byembracing multiculturalismthrough campus leadership,faculty, staff, student enrollments,curricula, programming, andcampus artifacts.
5.1.2 Provide a safe campus for allstudents, faculty, staff, and visitors.
5.1.3 Support campus studentorganizations that help develop apositive campus culture.
5.1.4 Work with academic services toprovide non-classroomopportunities for student-facultyinteraction.
5.1.5 Develop social activities thatbuild community among allcampus constituencies, such asintramural sports and academics,convocations, homecoming,entertainment, etc.
5.4 Accessibility/Transportation5.4.1 Ensure transportation link with
local area transit system forincreased access to campus.
5.4.2 Offer classes in a variety of time-slots to permit flexible schedulingby students, including weekendsand Friday-Saturday coursecombinations.
5.4.3 Utilize distance-learningtechnologies and practices tobroaden and support studentparticipation and allow increasedflexibility of courses schedules.
5.3 Housing5.3.1 Ensure affordable housing and
meal plans.5.3.2 Encourage on campus residency
for undergraduates.5.3.3 Provide the appropriate number of
housing slots to meet the needs ofthe student body.
5.3.4 If college experiences a campushousing shortage, ensure on cam-pus housing for underclassmen.
5.3.5 Provide campus residents housedoff site with additional services tosupport campus integration.
5.3.8 Incorporate special living-learninghousing options to furtheracademically integrate students.
5.5 Counseling5.5.1 Provide counseling, psychological,
and other health services tostudents to enhance copingstrategies.
5.5.2 Provide career counseling thatconnects academic and financialadvising to ensure students arefollowing the proper path to reachtheir goals.
5.5.3 Offer counseling services culturaland racially sensitive.
5.5.4 Offer a variety of counselingresources (such as legal servicesand family counseling) and tech-niques, including individual, group,peer, computer, and video sessionsas necessary.

students with different schedules to be able to enroll in classes required forgraduation. Classes on weekends and evenings and online courses are alterna-tives. An additional consideration is the access of public transportation sys-tems to campus. Students who have difficulty reaching the campus are lesslikely to persist, although the use of distance learning technologies may helpalleviate these problems.
On-campus housing that integrates students with the campus is an impor-tant element directly related to students’ persistence (Pascarella, 1984;Chickering, 1974; Astin, 1977; Pantages and Creedon, 1978). Colleges mustensure, however, that housing is accessible and affordable for students andoffer choices in types of housing. Poor housing options can be a major deter-rent to persistence.
Studies of the effects of counseling for at-risk (Steinmiller and Steinmiller,1991), African American (Trippi and Cheatham, 1989), and first-generationstudents (Richardson and Skinner, 1992) confirm that counseling services areimportant components of student retention programs. Colleges must deal withthe added stress and burden that today’s students bring with them to campus.Counseling services must provide support for students in terms of social needsand career counseling and be accessible to students.
The student services portion of the framework has five major objectives:
1. Diversity and multiculturalism. Colleges can build a pluralistic environ-ment by promoting diversity and multiculturalism through special pro-gramming and activities. Studies by Astin (1993a) and Justiz (1994) foundthat campuses embracing diversity and multiculturalism attracted studentpopulations that were very positive, capable of change, and academicallyskilled.
2. Flexible scheduling. Allowing the scheduling of classes in a variety of timeslots allows a broader constituency of students to attend classes. Manyuniversities have fixed schedules that allow little flexibility in course selec-tion. Although inflexibility is mostly because of budgetary reasons, thereare instances when it occurs because faculty are too inflexible to try dif-ferent schedules. Adding Saturday courses or moving courses around theschedule may allow students to enroll in more of the classes they need
109Retaining Minority Students in Higher Education

during a semester rather than wait for a rotation when they have no con-flict. The targeted use of distance education can also provide flexibility inscheduling.
3. Career counseling. Colleges must ensure that students are sent on an aca-demic track that will direct them toward their career destination. Occa-sionally, students are advised to take certain courses that in reality are poorchoices and may extend their attendance. Career and academic counselorsmust be well versed in the requirements, schedules, and policies regard-ing graduation and have a keen knowledge of what business and industryare looking for. This aim can be accomplished only through qualifiedcounselors’ expansive knowledge of individual students.
4. Faculty-student interaction. Informal contact between faculty membersand students is part of a rich atmosphere of sharing and caring at col-lege campuses. Students feel much more relaxed and cared for when fac-ulty are committed to their success. As stated, the social integration ofstudents is paramount to their persistence, enjoyment, and achievementin college. The willingness and acceptance of staff to rub shoulders withstudents beyond the confines of the classroom can have long-lastingeffects.
5. Room and board. Comfortable housing and affordable meals are impor-tant considerations for students. Campuses should look at numerous plansallowing students to choose the type of housing that best meets theirfinancial ability and living requirements. This decision impacts maturestudents with families, economically disadvantaged students, and studentsliving far from home.
Monitoring Students’ ProgressAt the center of the framework is the student monitoring system. It is animportant aspect of retaining students and, from an organizational perspec-tive, is a critical part of a continuous-improvement process. Simply put, with-out data, there is no normative relationship with an organization’s past, letalone with its future. The use of a monitoring system allows several events totake place. First, it allows university personnel to follow a student’s progress
110

and anticipate an expected need on his or her behalf. For example, a student’sdownward spiral of grades in physics, if identified by a faculty member orother staff member, can issue a warning that the student requires tutorial assis-tance and support to get back on track. Unless someone or some departmentis privy to the appropriate information, however, this student, like countlessothers, is likely to fall through the cracks.
A student monitoring system is also necessary to assess the impacts ofinterventions and other retention strategies. Tinto (1993) suggests that thedevelopment of such a system must first be student centered. That is, itmust collect information on every aspect of student development and focuson that progress. The collection of information provides the institutionwith a snapshot of students’ progress; according to Tinto, it should detail astudent’s social and academic experiences “as understood by students”(p. 214).
Tinto’s description (1993) of a retention assessment system emphasizesthree main requirements for success: the system must be comprehensive, lon-gitudinal, and recursive:
The process must be comprehensive. The system must incorporate both quanti-tative and qualitative methods of data collection to ensure that a repre-sentative portrait is developed of each student. Surveys and otherinstruments can collect important information on student progress but aresusceptible to low response rates. The use of qualitative methods, in theform of focus groups, interviews, and other designs, helps fill informationgaps and triangulate the information.
The process must be longitudinal. Because the process of student withdrawalfrom higher education is longitudinal in nature, student assessment mustalso be longitudinal. Therefore, collection and monitoring of studentprogress must involve more than the freshman experience and prefer-ably begin before students are officially admitted to the college. Theadvantage of this practice is that school officials can become aware ofpotential needs before the student comes to the campus. Thus, thecollege can prepare in advance for each student’s social and academicneeds.
111Retaining Minority Students in Higher Education

The process must be recursive. Recursive refers to the continuing process of datacollection to develop university-wide trends among the student body. Onlythrough an ongoing collection and analysis of student and organizationaldata can trends be developed; analysis of these trends provides the norma-tive reflection to identify successes and remaining challenges on campus.This data analysis, by nature, is an important component of continuousimprovement.
112
Implementation and Leadership
It’s impossible to really innovate unless you can deal with all aspects ofa problem. If you can only deal with yolks or whites, it’s pretty hard tomake an omelet.
[Gene Amdahl, cited in Levitze and Noel, 1985, p. 351].
AMDAHL’S PHILOSOPHY is key to any success that a retention pro-gram may have at any university. The look at the big picture is an impor-
tant need, as much of the literature suggests. Martin (1985) suggests that toomany schools have focused on admission exercises and recruitment programsinstead of focusing resources on an institution-wide program to reduce attri-tion. To put things in the right perspective, Astin (1993b) states that educa-tors must look at issues from a system perspective rather than an institutionalperspective and view educational institutions in the same light as other pub-lic service providers such as hospitals and clinics. Higher education is now ata stage where it must begin to look at the big picture and anticipate the needsof society as a whole and match them with the needs of students.
Tinto (1993) developed three principles of an effective retention program.First is that any program must be committed to the students it serves. A pro-gram should be focused on the targeted population and not to other factorsthat may cause the direction of the program to go out of focus. Second, aneffective retention program must be committed to the education of all stu-dents, not just to some. Thus, although it may incorporate special interven-tions for special populations, a retention program must address the needs ofall students for the institution to meet its mission of providing quality educa-tion to all. Third, an effective retention program must be committed to the
113Retaining Minority Students in Higher Education

development of supportive social and educational communities on campus.Again, ensuring the social and academic integration of students is, accordingto Tinto, the most important issue to contend with in terms of studentpersistence.
Important Organizational Considerationsin Developing an Institution-WideRetention ProgramThe development of any program at any university requires a multifacetedprocess incorporating all individuals involved. In terms of an institution-wideproject, the advice of Flannery and others (1973) must be remembered: theentire institution must take part. From an institutional point of view, manythings must happen on campus to ensure that positive change can take place.
In an examination of effective institutional practices at four-year institu-tions, Clewell and Ficklen (1986) identified several characteristics ofinstitutions employing effective practice: the presence of stated policy; a highlevel of institutional commitment; institutionalization of the program; com-prehensive services, dedicated staff, and strong faculty support; an atmospherethat allows students to participate without feeling stigmatized; and collectionof data to monitor students’ progress. Institutional focus is the key ingre-dient of this set of characteristics. Stated policy, institutional commitment,comprehensive service, supportive atmosphere, and the ability to assessprogress all point to the importance of a collective vision and ownership onthe part of the entire campus, including administration, faculty, staff, andespecially students. Leadership and faculty ownership are key variables in asuccessful equation, and messages sent down from the top are critical tosupport from underneath.
Tinto (1993) offers a very useful set of action principles for implementa-tion of a retention program:
1. Institutions should provide resources for program development andincentives for program participation that reach out to faculty and staffalike.
114

2. Institutions should commit themselves to a long-term process of programdevelopment.
3. Institutions should place ownership for institutional change in the handsof those across the campus who have to implement that change.
4. Institutional actions should be coordinated in a collaborative fashion toinsure a systematic, campus-wide approach to student retention.
5. Institutions should act to insure that faculty and staff possess the skillsneeded to assist and educate their students.
6. Institutions should front-load their efforts on behalf of student retention.7. Institutions and programs should continually assess their actions with an
eye toward improvement.
As other models have established, the importance of assessment, owner-ship, collaboration, institution-wide coverage, and commitment are essentialto Tinto’s principles. In addition, the development of appropriate skills by thefaculty and staff and the principle of front-loading the program for freshmanstudents are acknowledged. Institution-wide change and the coordination ofeffort across all departments and levels are essential to real change. As Kanter(1983) notes, however, any change at the institutional or individual level is acomplex phenomenon. In describing the interdependent nature of campuschange, Smith, Lippitt, and Sprandel (1985) discuss the organizational natureof the college institution. In their discussion, the authors describe a set of fourinterdependent parts of the higher education structure that must interact tosupport change. First is a vertical set of relations between system levels, suchas trustees, administrators, and faculty members. Second is a set of horizontalrelations between departments, administrators, student organizations, and oth-ers. The third part is the element of time: past, present, and future. Smith,Lippitt, and Sprandel claim that the tradition of the past, the practice of thepresent, and the goals and perspectives of the future all are important per-spectives to consider. The relation of the system and the environment, includ-ing political, physical, and economic, provides the final interdependentcomponent.
The pursuit of institutional change, according to Smith, Lippitt, andSprandel (1985), depends on the ability of those leading the change to
115Retaining Minority Students in Higher Education
orchestrate all of these parts, a process that often takes too much of theproject’s energy. These different interdependent parts of the organization arebarriers to change. In addition, they also become barriers to communicationsbetween colleagues and levels.
In fact, the energy required to push through a large-scale retention programcan often derail the entire process. Although it is true that much effort must bespent on coordination and team building to ensure acceptance across campus,the leadership of the effort must carefully weigh how much energy goes into plan-ning and operation as it does into the actual interventions that make up the pro-gram. Team members that are burned out by the time the actual interventioncomes to fruition will tend to bow out of the project when it truly counts.
Regardless of the structure of institutional change, Smith, Lippitt, andSprandel (1985) also acknowledge the process of change. In particular, fourlevels of readiness must be attained to produce the desired results and mustinvolve each of the four parts already acknowledged. Level One is a stage oflatency. As suggested, there is no action at this point, no leadership or sanc-tion. Not until the institution has reached Level Two, awareness, is there muchacknowledgment of the project. At this level, the need for systemwide actionis realized, but rarely without the aid of an internal or external consultant orexpert. Level Three is the intent to act stage. Leadership lends its support pub-licly at this point, sending out supportive and formal messages. Finally, LevelFour, energy, is where the project is put into action.
Implementing Campus-Wide ProgramsDeveloping and implementing a comprehensive student retention programrequires a commitment from leaders, faculty, and staff. Through our discus-sion with some of these individuals and our review of related research, we wereable to come up with a short list of essential factors in establishing such a pro-gram. According to our research, a comprehensive student retention programmust:
Rely on proven research. Given the resources and effort that must go into acampus-wide retention program, the final plan must be based on solid,
116

proven evidence of success. It is a long way to travel with no idea of theoutcome. If such an effort fails, the task of putting the pieces back togetherwould be daunting, to say the least. Spend time looking at what works, andborrow from the best.
Suit the particular needs of the campus. Not all campuses are equal. That said, no“boxed” retention program works the same on any two campuses. All effortsmust be shaped to meet the specific needs of each campus.
Institutionalize and become a regular part of campus service. Any program at thebeginning is usually a special project supported by outside funds. Inthe end, however, any successful effort must be institutionalized with respectto funding, policy, and practice. Outside funding does not last forever, andstated policy ensures that any interventions can become a mainstay incampus-based practices.
Involve all campus departments and all campus personnel. Everyone must beinvolved at some level. The most successful practices engage the entire cam-pus, while the least successful strategies are very compartmentalized. Wehave seen “campus-wide” programs that individuals in certain parts of cam-pus never knew about. Of course, they failed. But those institutions thathad a broad outreach among faculty and staff, with clearly stated policy andpractical objectives, tended to be successful.
Take into consideration the dynamics of the change process and provide extensiveand appropriate retraining of staff. Change is difficult and uncomfortable.Do not underestimate the impact of change on one’s ability to pushthrough policy changes on campus. Team members must be brought alongand be given all opportunities to learn about the interventions and developappropriate skills as necessary.
Focus on students. Although this statement sounds like a given, many programsend up making the effort about themselves and not the clients. Everythingshould point to how it affects students and persistence on campus. Thismind-set is a good one for all institutional practice that often gets lost inthe “career” mind-set of board members, administrators, faculty members,and staff. Students are central to all operations on a campus.
Ensure that the program is fiscally responsible. Soft monies (grants, for example)provide a good foundation for start-up, but they are not a long-term
117Retaining Minority Students in Higher Education
solution to persistence at any institution. An important component of astrategic plan for retention is to build in a long-term fiscal plan to ensurethat the program can operate without external support.
Support institutional research in the monitoring of programs and students. Dataand analysis on all interventions, programs, and, ultimately, students arethe saving grace of any campus change model. One must have the numbersto show whether movement has been made, either positive or negative.
Be patient. All change takes time, and change theory tells us that change usu-ally takes a negative tack before the eventual positive change occurs. Under-stand that this trend is a normal mode and that some negative changes willhappen before the positive yield will be seen. Therefore, leaders and otherteam members must be patient and understand that this long-term effortwill have its rough spots.
Be sensitive to students’ needs and target the most needy student populations. Allstudents can benefit from a retention effort on campus, whether throughimproved tutoring programs or increased need-based aid. Any programshould target the neediest students on campus, however, knowing thatothers will benefit from any changes made.
The development of a campus-wide retention program requires support-ive leadership, the willingness to evoke change on campus, and careful plan-ning. If any of these essential factors is missing, the chances for success arelimited. Once institutions have ensured that the climate for change exists andthat the support and guidance of campus leadership is present, several stepsor stages must take place: preplanning, planning, implementation, and pro-gram monitoring. This strategic process can be developed in line with an insti-tution’s strategic planning schedule.
Stage One: PreplanningThe preplanning stage provides campus leadership with the information nec-essary to identify challenges and issues that the campus must face. During thisinitial stage, the institution must:
• Analyze the size and scope of retention issues on campus• Identify students’ needs
118

• Assess the status and effectiveness of current retention strategies and pro-grams on campus
• Identify institutional resources that could be used or redirected• Identify successful retention strategies at other campuses
This information-collecting stage can be done internally, but it sometimes car-ries more weight when handled through an outside consultant in partnershipwith the leadership team. With a solid foundation of evidence, the projectteam stands a much better chance of other institutional partners’ buying intothe project. As well, this information will allow the committee to make pru-dent decisions about what direction to follow in Stage Two.
Stage Two: PlanningThe planning stage is the longest stage of the developmental process, as spe-cial care must be taken to involve the entire campus in the creation of the pro-gram. This is where buy-in occurs across campus. The planning stage mustcarefully assess the research conducted in Stage One, develop a redefined senseof purpose and goals, and develop an appropriate retention plan that meetsthose goals. The main activities of Stage Two include:
• Refinement or enhancement of the college mission statement and goals• Development of organizational strategies• Identification of key stakeholders on or off campus and their roles in the
retention process• Assessment, presentation, and discussion of preplanning data• Development of the retention program’s components and operation
strategies• Development of an implementation plan
Stage Three: ImplementationThe implementation of the retention program should be according to the plandevised during Stage Two. It is critical for the administration to provide sup-port, both political and financial, during the implementation stage for anyunforeseen circumstances and difficulties encountered.
119Retaining Minority Students in Higher Education

Stage Four: Program MonitoringThe monitoring of the retention program is an essential practice that must beentrenched in the design of the system. Without the careful planning of anassessment strategy, the true value and effect of the program components cannever be measured. The monitoring system should provide ongoing data toall campus personnel involved in the operation of the retention effort. Themain practices include:
• Collecting data and analyzing program components and student perfor-mance
• Disseminating data to stakeholders• Ensuring that conclusions based on program monitoring are incorporated
in program revisions
Strategic TimingWith regard to the framework introduced in the previous chapter, Figure 28provides a look at the timing of particular strategies. This chart helps us under-stand the scope of involvement and outreach by the institution. As can be seen,some of these strategies begin in elementary school, while others last through-out the college experience.
The Importance of Leadership on StudentRetentionMany campuses have launched recruitment and retention programs gearedtoward improving the success rates of low-income and other disadvantagedstudents. These programs often use several strategies, such as faculty and stu-dent mentoring, peer advising, and academic and social counseling to encour-age at-risk students to remain enrolled (Sallie Mae, 1999).
Less discussed, however, is the role of the president and other campus lead-ers in developing, designing, and implementing successful retention efforts.Yet prior research has demonstrated that senior leadership on campus is oftenthe key ingredient needed to implement these programs. For example, Reddand Scott (1997) used data from the AASCU/Sallie Mae National Retention
120

121Retaining Minority Students in Higher Education
TIMELINE OFINTERVENTION
School Year
FINANCIAL AID
1.1 Grants & Scholarships
1.2 Loans
1.3 Assistantships & WorkStudies
1.4 Financial Counseling
RECRUITMENT ANDADMISSIONS
2.1 Student identification
2.2 Admissions
2.3 Orientation
ACADEMIC SERVICES
3.1 Academic Advising
3.2 Supplementary Instruction
3.3 Tutoring/Mentoring
3.4 Research Opportunities
3.5 Pre-College Programs
3.6 Bridging Programs
CURRICULUM ANDINSTRUCTION
4.1 Curriculum Review &Revision
4.2 Instructional Strategies
4.3 Assessment Strategies
SOCIAL SERVICES
5.1 Campus Climate
5.2 Accessibility/Transportation
5.3 Housing
5.4 Counseling
STUDENT MONITORING
Elem
5 8 12 13 14 15 16
MS HS Summer Fresh Soph Junior Sr.�
ONGOING
ONGOING
ONGOING
FIGURE 28Timeline of Interventions Relative to the Frameworkfor Student Retention

Project to illustrate the effects of senior leadership on retention. On successfulcampus efforts, senior leadership plays two important roles. First, the presi-dent and his or her key cabinet officers regularly monitor their institution’sprogress toward clearly stated campus retention goals. Redd and Scott (1997)noted, “Nearly 90 percent of the high-rate colleges said that ‘senior adminis-trators regularly monitor information about progress in increasing retention andgraduation rates of students’ was descriptive or very descriptive of their institu-tions, compared [with] 69.3 percent of the low-rate colleges” (pp. 19, 21).
Second, the campus chief executive officer is usually the one person at theinstitution who can bring all the interested parties—students, parents, othercampus administrators, faculty, and staff—together toward the goals ofretention. Sallie Mae, in its Supporting the Historically Black College andUniversity Mission: The Sallie Mae–HBCU Default Management Project(1999), noted that the president must coordinate “strategies [that] can bedeveloped to help increase student success. . . . The president must remainfully informed of the [campus’s] activities and help each of these units con-tribute to the goal of raising student achievement. Only leadership from thepresident or chancellor can bring [campus] units together” for the purposesof raising retention rates (Sallie Mae, 1999, p. 10).
Presidents can play other roles as well in their institutions’ efforts toimprove retention. According to Earl S. Richardson, president of Morgan StateUniversity, an HBCU in Baltimore, the president should emphasize four areason his or her campus to improve retention (E. S. Richardson, personal com-munication, December 2001):
• Increase need-based financial aid for low-income, at-risk students• Require attention in classroom advising• Use the campus’s social and cultural activities to keep students focused• Encourage academic advising outside the classroom
According to Richardson, however, presidents “need to deal with all four areastogether. . . . Campuses must become a community for students” for retentionefforts to succeed (E. S. Richardson, personal communication, December2001). In many instances, the president is the one person on campus who can
122

integrate all four areas and strategies to work cohesively and simultaneouslyfor students (E. S. Richardson, personal communication, December 2001).
James Shanley, president of Fort Peck Community College, a tribal collegein Poplar, Montana, adds that chief executives also “need to engage students andfamilies. Students are driven by family issues. However, student services areoften designed for working with students but not for working with families”( J. Shanley, personal communication, December 2001). Older, nontraditionalstudents are particularly affected by “day care and other family issues that hin-der retention” ( J. Sain, personal communication, 2001). Senior administratorsare best able to use their influence on campus to deal with these issues effectively.
Chief administrators’ attitudes about retention can also influence its impor-tance on campus. For example, one institution reported that its senior admin-istrators use retention goals as part of the staff evaluation system. All facultyand other staff are evaluated on what efforts they have made to improve therecruitment and retention of minority students (P. Hladio, personal commu-nication, 2001).
Lack of Presidential Engagement in Retention IssuesDespite the possible influence of presidents on retention, most presidents do notappear to be engaged in these issues. One former college president says that “fewpresidents understand retention, and fewer still have the courage to make thesystematic changes necessary to improve retention” (R. C. Dickerson, personalcommunication, November 11, 2001). Another campus official adds that insti-tutional leaders sometimes give only lip service to retention ( J. Taylor, personalcommunication, 2001), partly because of the other pressures presidents face suchas fundraising and faculty issues. For this reason, “[most] retention efforts usu-ally emanate from other sources on campus—student affairs, academic affairs,or [the] student service office, where they understand and value . . . retention”(R. C. Dickerson, personal communication, November 11, 2001).
The financial aid office is another area that can fill the void on retentionthat presidents may leave (P. Hladio, personal communication, 2001). Often,“aid administrators need to be the ones to make contacts with students to gothe extra mile” in achieving their degree goals (P. Hladio, personal communi-cation, 2001). Aid administrators at some institutions have set up programs
123Retaining Minority Students in Higher Education

on their own volition to attract and retain students of color such as earlyawareness programs, campus visits, freshmen class seminars, and academicadvising (P. Hladio, personal communication, 2001). Aid administrators andother campus officials have tried to make a “more proactive effort on retain-ing students” (T. Ross, personal communication, 2001).
Policy QuestionsAlthough financial aid, alumni relations, and other administrators and depart-ments on campus play an important role in retention, the major thrust forimproving success for students—particularly students of color—must comefrom the president. The chief executive is the one person who can bring togetherother senior staff, faculty, and financial aid for the common purpose of improv-ing retention. Unfortunately, presidents also have many other burdens to carry,particularly fundraising, relations with faculty, and other pressing needs of stu-dents and alumni (R. C. Dickerson, personal communication, 2001). For thisreason, retention for minority students on many campuses may get little atten-tion or few resources from the president’s office. This situation may lead to sev-eral important questions for campus officials and policymakers interested inincreasing the success of students of color on college campuses:
What incentives can be developed that will encourage campus leaders tobecome more directly involved with retention efforts? Should states beginto tie increases in allocations to public colleges and university systems withincreases in retention rates? Or should trustees on individual campuses baseincreases in presidents’ salaries and other benefits on the share of studentswho complete a degree successfully?
What models of successful campus leadership exist, and can these models bereplicated? Can successful leadership strategies that are developed for whitestudents also be used for students of color at HBCUs and other minority-serving institutions?
If senior administrators cannot or will not become more involved with reten-tion issues, can other groups outside the campus community (for example,state policymakers, community service organizations, potential outsidedonors) increase their involvement?
124

These and other questions may help determine the extent to which col-lege presidents and other senior campus leaders are willing and able to usetheir positions, expertise, and resources to increase retention. Although thefuture changes presidents may make seem cloudy at best, it is clear that, at anumber of higher education institutions, presidents have not done enough toincrease the number of underrepresented students on their campuses who leaveschool with degrees.
Final ThoughtsThis report contains an enormous amount of information: background infor-mation and data analysis related to the retention of minority students, theo-retical underpinnings of student retention and persistence, the illustration ofconcrete resources and activities for consideration and implementationof retention programs on college campuses. We close with some finalperspectives related to student retention:
Institutional leadership. The ultimate success of a campus-wide retention effortdepends on a number of leadership issues. First, retention programs musthave unequivocal support from the office of the president or provost,involve the entire campus in shaping program operations, and keep ideol-ogy focused on the student. Increasing student retention rates is a complexissue requiring the involvement of the entire campus. Although depart-ments and offices may conduct their own programs, it is not until the entirecampus directs a unified effort at reducing attrition that large-scale changescan be seen. The development of a cross-university retention task forcesends a message of urgency as well as a sign of support from the adminis-tration. This task force can help plan across departmental differences inher-ent in most university systems.
Funding priorities. Retention costs money, but the savings are easilyrecouped. If increased student persistence is the goal, appropriate fund-ing must be made available in the general budget. Funding sends animportant leadership message to all faculty and helps crystallize campuspriorities.
125Retaining Minority Students in Higher Education

Faculty reward systems. If faculty members are to turn more of their attention tostudent needs and teaching as a whole, the institution must incorporate theseactions into the tenure structure. Current reward structures at most institu-tions deter faculty members from focusing on teaching. Tenure andpromotion decisions are by and large based on a history of research and schol-arship, which includes a candidate’s record of academic publishing andsuccess in obtaining sponsored-research funds.
Student-teacher interaction. Faculty support is not just a tenure issue. Class-room instruction requires time to develop the student-teacher interactionsthat can make a difference. Most faculty believe they are overburdenedwith advisees, faculty and dissertation committees, and bureaucratic affairs.To make real differences in these interactions, such burdens must bereduced.
Flexible planning. Student retention programs must be designed to match thecharacteristics and conditions at each campus. Programs that work well onone campus do not necessarily work well on another campus. The students,faculty, and institutional mission bring different aspects to the campus thatmakes it special, and these characteristics must be considered in the plan-ning cycle.
Institutional research. Feedback is perhaps the most important aspect of pro-gram development, implementation, and sustainability. The campus insti-tutional research office is potentially the greatest resource for campusleadership and faculty. With appropriate fiscal and material support, insti-tutional research offices can provide responsive feedback regarding theimpact of major initiatives or programs, down to students. Empirical infor-mation should be the foundation of any retention effort, and careful plan-ning is necessary to ensure that appropriate indicators are selected andhigh-quality data collected. Additionally, systems must be put in place toensure that this information is disseminated systematically to inform keystakeholders about progress toward goals.
Academic preparation and admissions. Recent affirmative action litigation hasforced campuses to rethink their admissions practices. One brief year afterProposition 209, California institutions showed dramatic decreases in theadmission rates of black and Latino students. One answer to this problem
126
for colleges is to further encourage and develop the academic preparationof minority students. The divisions between preK–12 and postsecondaryeducation are becoming more blurred all the time. Colleges and universi-ties are coming to understand that they need to play a stronger role duringthe precollege years. Short of radical educational reform, institutions inter-ested in admitting students of greater academic capacity must wade intothe pool themselves. Precollege outreach programs have enjoyed great suc-cess in increasing the academic ability and motivation of young students atthe elementary, middle, and high school levels.
College affordability. College pricing is a major factor in whether or not stu-dents go to college as well as where they go. Since 1980, tuition and fees atfour-year public and private institutions have risen about 90 percent afteradjusting for inflation and student aid has increased around 40 percent,while median family income9 has increased only 9 percent (College Board,2001b). Thus, for many low-income students, many of whom are non-Asian minorities, the affordability of postsecondary education has becomea crisis. Colleges and state systems must continue to address price as a majordisincentive for needy students.
Technology. Recent developments in Web-based technologies have begun toimpact how colleges and universities can deliver instruction and how stu-dents and professors can communicate. The birth of the virtual universityand proliferation of distance education courseware is forcing institutionsto rethink how they do business. But the ability to benefit from technol-ogy is a product of technological access. Although technology has thepotential to remove barriers of time and distance, it simultaneously maywiden gaps in access between low- and high-income students—betweenthe technological haves and have-nots. Technology is clearly a double-edgedsword. It is difficult to imagine the collegiate experience without computerassistance in this day and age. Colleges and universities must take specialcare to ensure that students from all backgrounds enjoy access to and arecomfortable with technology.
127Retaining Minority Students in Higher Education
9For families with parents aged 45–54, the approximate age of families with college-agedependents.
Appendix A: Promising CollegeStudent Retention Programs
American River CollegeBeacon Program: Peer Assistant Learning (PAL) Program Goal: Help studentsmaster course materials and skills to improve academic success and retention.
Program Description: Trained learning assistants (students who successfullycompleted the class) work with groups of currently enrolled students for twohours each week outside the classroom. Collaborative activities that encour-age participants to interact are the focus of group work.
Key Components: Faculty identify students who have people skills and whodid well (grade A or B) or are doing well in a course, and ask students to par-ticipate. They must be willing to go through a one-semester group tutoringtraining program (one unit), meet with their learning group for two hours perweek outside the classroom, and meet with the instructor one hour each week.They are paid $6.00 per hour for some of their training time and for all thehours of meeting time.
Evidence of Effectiveness: Data gathered over the last seven semesters showsuccess rates (achieving an A, B, or C) average 85 percent, while that of non-participants in the same class is 57 percent. Fewer Beacon students drop classes(7 percent) when compared with their non-Beacon counterparts (27 percent).The program received exemplary program awards sponsored by the CaliforniaCommunity Colleges Board of Governors (American River College, 2001).
Contact: Kathie Read or Marsha Reske, Beacon Program, American RiverCollege, 4700 College Oak Drive, Sacramento, CA 95841, Telephone:916-484-8693
129Retaining Minority Students in Higher Education
Saint Xavier UniversityStudent Success Program Program Goal: Provide academic and personal supportservices for academically, economically, and physically challenged studentsuntil the participating students complete a baccalaureate degree.
Program Description: The Student Success Program (SSP) is one of eighthundred student support service programs on college campuses across thenation that receive Title IV TRIO grant funds. Counselors, advisers, and aca-demic instructors work as a team to promote academic success. Students receiveclass advising, counseling (academic, career, and personal), freshman orienta-tion, advocacy, peer mentoring cultural programming, and service-learning.
Key Components: The program consists of four full-time professional staff—a director, an academic adviser, a personal counselor, and a mathematicsspecialist—and twenty to thirty employed peer tutors or mentors. Althoughprogram staff invite all incoming students to apply to the program, they selectapplicants based on socioeconomic and academic need as well as their level ofgoal commitment. Peer mentors meet with student participants weekly andare responsible for their academic and social integration into the campus bymodeling appropriate student behaviors and providing referrals to programservices. The mathematics specialist teaches semester-long math workshopsthat include technology use, problem solving, and critical thinking. The staffmonitor students’ academic performance continuously and provide specialinterventions for students experiencing academic difficulties.
Evidence of Effectiveness: Although SSP and non-SSP 1997 graduatingcohorts had comparable ACT composite scores, high school grade point aver-ages, and college semester course loads, data showed the SSP cohort had ahigher total persistence rate after seven semesters than the total persistence rateof the non-SSP cohort (58.9 percent versus 53.7 percent). In addition, theprogram appears to have a greater impact on the persistence rates of minoritystudents who participate in the program than the rates of those who do not(Murphy and Fath, 1996).
Contact: Iraetta Lacey, director, Saint Xavier University, 3700 West 103rdStreet, Room L111, Chicago, IL 60655, Telephone: 773-298-3330, E-mail:[email protected]
130
The University of Texas at San AntonioThe Risk-Point Intervention Program Program Goal: Provide interventional aca-demic support to first-year, first-time freshmen at a series of specified pointswhen academic risk becomes observable.
Program Description: Program consists of five interventions to address risksthat occur during the freshman year.
Key Components: The Risk Point 1 intervention consists of an academicdevelopment program (ADP), a five-week summer bridge program for fresh-men admitted on a provisional basis, and Risk Point 2 college success semi-nar (EDP 1702). New freshmen admitted on probation are required to enroll.The midterm checkpoint conference is a midsemester intervention programdeveloped for first-time freshmen who receive D’s or F’s on their midtermprogress reports. Academic counselors and freshmen meet to carefully reviewthe student’s performance to date and area(s) where academic difficulty hasbeen exhibited. Phoenix is a probation recovery workshop for small groups offirst-time freshmen who entered in good standing but have earned a GPAbelow 2.0 (placing them on academic probation at the end of their initialsemester) work out a highly structured recovery plan. This plan involves strate-gic advising recommendations, reduction of outside workload, future coursesequencing, and improved use of available institutional resource programs.Reentry provides academic assistance and guidance for specially readmitted,academically dismissed students. This program provides a careful evaluationof each student’s academic skill, attitudes, awareness, and previously exhibitedacademic behaviors. Reentry students are required to repeat failed courses,reduce work and course loads, and participate in a structured program ofsupport.
Evidence of Effectiveness: ADP participants have a one-year retention ratethat is twice that of nonparticipants. During its first semester of implementa-tion, probation students enrolled in the seminar were dismissed at a 15 per-cent lower rate than were nonparticipants. Checkpoint conference participantsgo on probation at a 7 to 15 percent lower rate than do nonparticipants.Phoenix participants are dismissed at a rate that is 8 to 12 percent lower thanother first probation students who do not attend.
131Retaining Minority Students in Higher Education
Contact: Tomás Rivera Center for Student Success, University of Texasat San Antonio, 6900 North Loop 1604 West, San Antonio, TX 78249,Telephone: 210-458-5170, Fax: 210-458-4695
William Paterson CollegeSponsored Student Program Program Goal: Improve retention rates of special-admit students, who are 10 percent of the student population.
Program Description: The program allows the college to admit and supporta limited number of students whose academic credentials fall below the insti-tution’s standard admissions criteria. Although special-admit students do notpossess the college’s academic requirements, they do indicate that they can besuccessful in college. The program combines developmental advising, manda-tory personal academic counseling, and referrals to tutoring and other aca-demic support services.
Key Components: Program participants take college placement exams andreceive special academic advising for selection of courses and tutorial assis-tance. In addition, students with more demanding schedules or responsibili-ties are limited to taking thirteen credit hours per semester. Once a studentachieves an acceptable grade point average and completes all prerequisites,he/she can declare a major.
Evidence of Effectiveness: Since 1990, sponsored student program partici-pants consistently have had higher retention rates after one year than regular-admit students, educational opportunity program students, and nontraditionalstudent cohorts (Spatz, 1995).
Contact: Mary Ann Spatz, Academic Support Center, Hunziker Wing 218William Paterson University, 300 Pompton Road, Wayne, NJ 07470,Telephone: 973-720-3324, E-mail: [email protected]
Wayne State UniversityWayne State University Retention Program (Excel) Program Goal: Increase rateof student reenrollment; facilitate academic success and undergraduate achieve-ment; enhance graduation rates.
132

Program Description: The program served as a pilot for offering high-leveladvising and academic support services to regular-admit undergraduates whoexhibit academic and demographic risk for college persistence.
Key Components: The program uses qualified staff to provide mandatoryorientation sessions, developmental student advising, an early academic warn-ing system, personal tutoring, weekly supplemental instruction, and, ifrecommended, enrollment in developmental reading, learning theory, orvocabulary building courses.
Evidence of Effectiveness: Students participating in Wayne Excel had lowerstopout and dropout rates than did students with similar risk factors who didnot participate. Excel students entered probation status at a lower rate thandid comparison groups. The institution expanded undergraduate retentionservices to all students, because the pilot program was effective in retainingstudents (Wilhelm and Wallace, 1997).
Contact: Academic Success Center, Wayne State University, 2100David Adamany Undergraduate Library, Detroit, MI 48202, Telephone313-577-3165
Southeast Missouri State UniversityFirst-year Learning Team (FLighT) Program Program Goal: Offer a top-qualitycurriculum, enhance student success and retention, and optimize and stabi-lize enrollment.
Program Description: The program provides freshmen with one of six holis-tic learning and living community experiences that assist them in the academicand social transition to college life.
Key Components: A FLighT consists of twenty-five students who are enrolledin two courses centered around a particular theme or area of interest. EachFLighT has a peer mentor, a veteran student who works closely with the group.
Evidence of Effectiveness: The fall 1998 to spring 1999 retention ratefor FLighT students was 89 percent. The institution is tracking retentionrates for subsequent semesters (Myers and Birk, 1998).
Contact: New Student Programs, 308 Academic Hall, Mail Stop 3850,One University Plaza, Cape Girardeau, MO 63701, Telephone: 573-651-5166, Fax: 573-651-5168
133Retaining Minority Students in Higher Education

Fayetteville State UniversityFreshman Year Initiative (FYI) Program Goal: To ensure students’ successfultransition to college by identifying those students who experience difficultiesin their first year of college and providing them with remedial help.
Program Description: The comprehensive retention program provides agamut of academic and personal support services.
Key Components: Newly admitted students receive information about FYIand encouragement for participation. Students complete profiles and registerin a block of courses based on intended major. Some students must completemath laboratory and/or reading/writing center assignments. All students enrollin Freshman Seminar I and II, where a peer academic leader is available.
Evidence of Effectiveness: Assessment data of freshman cohorts receiving FYIservices reflect improved retention rates and increased student satisfaction(Young, 1999).
Contact: Olivia D. Chavis, vice-chancellor for student affairs, FayettevilleState University, W. R. Collins Building, Room 224, 1200 Murchison Road,Fayetteville, NC 28301-4298, Telephone: 910-672-1201, Fax: 910-672-1456
Loyola University New OrleansCampus-wide Student Success Initiative Program Goal: Develop and provide ser-vices to assist students and faculty with improving student writing skills tosuccessfully complete coursework.
Program Description: Help faculty design writing assignments for theircourses and help students develop the skills they need to make the most oftheir learning experiences.
Key Components: Writing Across the Curriculum (WAC) services include full-class tutoring services through the advise/revise program; workshops in writing,grammar, documentation, and research; writing resource library and facultyresource bank, and WAC Works, a student newsletter on writing-related issues.
Evidence of Effectiveness: None found.Contact: Melanie McKay, director, Bobet 100, Campus Box 40, Loyola
University New Orleans, 6363 St. Charles Avenue, New Orleans, LA 70118,Telephone: 504-865-2297, E-mail: [email protected]
134
Northern Illinois UniversityOffice of Retention Programs Program Goal: Develop, coordinate, andimplement programs and services to assist students with successful degreecompletion.
Program Description: The Office of Retention Programs fosters interactionamong students, faculty, and staff to provide the academic and personal sup-port necessary for students to complete degree requirements.
Key Components: This holistic university retention model includes academicsupport services, orientation programs and courses, and innovative learningopportunities and initiative by each college. Programs include educational ser-vices and programs, learning assistance and study skills lab, academic infor-mation and referral services, tutoring, new student welcome days, passport tosuccess, undergraduate research apprenticeship program, academic residentialprograms, university honors program, and smart classrooms.
Evidence of Effectiveness: None found.Contact: Don Bramlett, director, Office of Retention Programs, Northern
Illinois University, Adams Hall, Lucinda Avenue, Telephone: 815-753-7822,Fax: 815-753-7830, URL: http://www.niu.edu/retention/
Long Beach City CollegeStudent and Teacher Achieving Results (STAR) Program Goal: Increase successand retention rates of underrepresented students.
Program Description: STAR creates a learning community by developingcommunities of student cohorts and linking courses through a theme.
Key Components: STAR students participate in linked courses that developcommunication skills, use interdisciplinary curricula and cooperative learning,facilitate student involvement with faculty, build self-esteem, and provideacademic and social support.
Evidence of Effectiveness: Data indicate that STAR significantlyimproved participants’ reading and writing skills, advanced increased num-bers of underrepresented students to higher-level courses, reduced the numberof underrepresented students on probation, and increased retention and com-pletion rates for underrepresented students (Couch and Holmes, 1997).
135Retaining Minority Students in Higher Education
Contact: Long Beach City College, 4901 E. Carson Street Long Beach,CA, 90806–5797. URL: http://t3.lbcc.cc.ca.us/star.html
Glendale Community CollegeStudent Pal Program Program Goal: Target and identify characteristics of at-risk students to improve the retention and success of minority students.
Program Description: The system provides data on specific student groupsto fulfill the needs of administrators, faculty, student support staff, andresearchers.
Key Components: Readily available data allow for analyses of studentstopout and dropout patterns, GPAs, and other data relevant to students’ suc-cess and retention.
Evidence of Effectiveness: The system has enhanced the multicultural affairsprogram’s ability to fulfill goals and initiatives. The program also helped theinstitution initiate an early warning retention system for at-risk students(Mendoza and Corzo, 1996).
Contact: Jose Mendoza, director, Multicultural Affairs Program, 6000 WestOlive Avenue, Glendale, AZ 85302, Telephone: 623-845-3565
Bronx Community CollegeFreshman Year Initiative Program (FYIP) Program Goal: Promote studentgrowth, academic achievement, and retention.
Program Description: The program is a comprehensive academic and coun-seling program for a selective group of first-semester students who require atleast three remedial courses.
Key Components: This program consists of five major components offeringintensive counseling: (1) the Freshman Outreach, Caring, Understanding, andSupport (FOCUS) Center, a holistic counseling center that offers personaland confidential counseling services; (2) psychoeducational testing; (3) peercounseling; (4) rapid contact counseling for early intervention; and (5) revisedorientation and career development courses for personal development andimproved coping skills.
136
Evidence of Effectiveness: Data show 76.5 percent of FYIP students contin-ued enrollment from fall 1993 to fall 1997, compared with 59.3 percent ofnonparticipants.
Contact: Jason Finkelsein, Freshman Year Initiative Program, UniversityAvenue at West 181 Street, Bronx, NY 10453, Telephone: 718-289-5138
University of South CarolinaUniversity 101 Program Goal: Support first-year students’ college success.
Program Description: The three–credit hour elective course consists of amaximum of twenty-five students who interact with instructors to developnote-taking, study, time-management, and coping skills. The Freshman YearExperience and the First-Year Experience are trademarks of the University ofSouth Carolina. A license to use these terms in educational programs may begranted upon written request.
Key Components: Students are able to develop these skills through frequentwriting assignments, midterm and final exams, a library research project, andthe use of course textbooks.
Evidence of Effectiveness: Studies show that students who take University101 tend to graduate and exceed their predicted GPAs at higher levels thanstudents who do not take the course (National Resource Center for the First-Year Experience and Students in Transition, 1999; Stanley and Witten, 1990).
Contact: Dan Berman, director of instruction and faculty development,National Resource Center for the First-Year Experience and Students inTransition, 1629 Pendleton Street, University of South Carolina, Columbia,SC 29208, Telephone: 803-777-6029, Fax: 803-777-4699, URL: http://www.sc.edu/fye/101/u101.htm
University 401 Program Goal: Support student’s transition out of the uni-versity and document learning outcomes of institution’s core curriculum.
Program Description: The program integrates seniors’ major programs ofstudy and general education into a larger context, provides opportunities foradvance research, and transitions seniors for graduate school and employment.
Key Components: The program requires reading, writing, computing,and research that include a class team project; a portfolio; a liberal arts
137Retaining Minority Students in Higher Education
interdisciplinary exercise or project; and self-assessment and career planningexercises.
Evidence of Effectiveness: None found.Contact: URL: http://www.sc.edu/fye/401/401infopiece/content.htm
Indiana Wesleyan UniversityProgram Goal: Improve student retention.
Program Description: The program adopted a team approach to assess andcounsel students regarding academic performance and financial aid.
Key Components: The institution developed regular academic and financialcheckpoints to monitor academic performance of student borrowers and iden-tify warning signs. The team adjusts financial aid and course-taking strategiesto facilitate student program completion.
Evidence of effectiveness: None found.Contact: Lois Kelly, assistant vice president for financial aid, Indiana
Wesleyan University, 4201 South Washington Street, Marion, Indiana 46953-4974, Telephone: 765-677-2116, E-mail: [email protected]
West Virginia UniversityStructured Academic Year (STAY) Program
Program Goal: Retain students on academic probation by providingsupport to succeed academically.
Program Description: The two-semester program requires students to livein a structured campus environment with two resident assistants so they canimprove their study skills and raise their grades.
Key Components: Students adhere to rigorous program requirements such ascurfews, structured study periods and tutoring, group meetings, biweeklymeetings with assigned academic advisers, career exploration, and regular inter-actions with mentors. Parental involvement is a critical component of theprogram.
Evidence of Effectiveness: Program participants raise their cumulative GPAsan average half a letter grade after one semester and one whole letter grade
138
after two semesters. Most students complete the programs successfully andremain at West Virginia University.
Contact: Maria Watson, senior program coordinator, Academic ServicesCenter, P.O. Box 6212, West Virginia University, Morgantown, WV 26506-6212, Telephone: 304-293-5805, ext. 320
EXCEL Program Goal: Improve students’ academic success and retention.Program Description: The structured voluntary program supports freshmen
with high school GPA of 2.0 to 2.6.Key Components: Students attend a special orientation class, receive assis-
tance with academic skills, and participate in Orientation 101, facilitated bythe assigned academic adviser.
Evidence of Effectiveness: EXCEL students achieved a quarter point higherGPA than WVU freshmen with comparable high school GPAs who were notin the program (2.15 versus 1.88); retention was 96 percent for EXCEL stu-dents as opposed to 84.5 percent for the control group.
Contact: Maria Watson, senior program coordinator, Academic ServicesCenter, P.O. Box 6212, West Virginia University, Morgantown, WV 26506-6212, Telephone: 304-293-5805, ext. 320
University of Colorado at BoulderBuilding Community Model Program goal: Recruit, retain, and graduate under-represented students.
Program Description: The integrated model consists of five primary com-ponents for student development and retention.
Key Components: The integrated program consists of the Summer BridgeProgram, SEED Freshman Leadership Course, Academic Clustering, Aca-demic Excellence Workshops, and Financial Aid Tutoring; counseling andmentoring are integral parts of the program.
Evidence of Effectiveness: Approximately 85 percent of the forty new Mul-ticultural Engineering Program (MEP) students registered for fall 1996returned for the following academic year.
Contact: URL: http://www.colorado.edu/UCB/AcademicAffairs/ArtsSciences/masp/
139Retaining Minority Students in Higher Education
Bowie State UniversityModel Institutions for Excellence (MIE) Program Goal: Serve as a model for thesuccessful recruitment, education, and production of quality trained science,engineering, and mathematics baccalaureates.
Program Description: The MIE program provides support for institutionaldevelopment and student support activities that contribute to the success-ful recruitment and retention of science, engineering, and mathematicsundergraduates throughout the pipeline. Conceived by Walter Massey, then-director of the National Science Foundation, MIE is an eleven-year collab-orative program. The National Aeronautics and Space Administrationsponsors the Bowie MIE program in collaboration with the National ScienceFoundation. Other institutions with MIE programs are Oglala LakotaCollege (South Dakota), Spelman College (Georgia), UniversidadMetropolitana (Puerto Rico), University of Texas at El Paso, and XavierUniversity of Louisiana.
Key Components: Students receive financial aid and participate in academicenrichment activities, early research, mentoring, counseling, and orientationto science, engineering, and mathematics graduate school.
Evidence of Effectiveness: Statistical data for fall 1995 to fall 2000 showedan increase in the institution’s science, engineering, and mathematicsundergraduate enrollment by 115 percent, from 340 to 733. Data also indi-cated an increase in retention of science, engineering, and mathematics first-year students by 28 points, from 52 percent to 80 percent, and by 39 pointsfor second-year students, from 26 percent to 62 percent. Science, engi-neering, and mathematics student graduation rates increased 62 percent,from 56 to 91.
Contact: Thurgood Marshall Library, Suite 272, 14000 Jericho Park Road,Bowie, MD 20715, Telephone: 301-860-3875, Fax: 301-860-3887, E-mail:[email protected]
Lewis-Clark State CollegeStudent Support Services TRIO Program Program Goal: Help students achieveacademically and integrate into campus culture.
140

Program Description: The student support services TRIO program is a fed-erally funded, student-oriented program designed to provide free academicand developmental support to enrolled students who are eligible.
Key Components: Participants enroll in four courses: English composition,public speaking, introduction to psychology, and an introductory social sci-ence course. The learning community is supported by a credited course thatprovides advising and develops students’ writing, study, and computer skills.Participants are required to attend the student support services learning lab.
Evidence of Effectiveness: Data show a one-semester retention rate of 84 per-cent for degree-seeking provisional students accepted into the student supportservices program, compared with 76 percent for all provisionally acceptedstudents.
Contact: Patricia Clyde, director, Lewis-Clark State College, StudentSupport Services TRIO Program, 500 8th Avenue, Lewiston, ID 83501,Telephone: 208-792-2300, FAX: 208-792-2057, E-mail: [email protected]
University of AlabamaStudent Support Services Program Program Goal: Increase retention and gradu-ation rates of eligible students.
Program Description: The comprehensive federally funded TRIO programoffers academic assistance to two hundred undergraduate students at theUniversity of Alabama.
Key Components: Students receive individualized support services, includ-ing academic, career, financial, and personal counseling, advising, tutoring,and peer mentoring.
Evidence of Effectiveness: None found.Contact: Student Support Services, 225 Osband Hall, Box 870304,
Tuscaloosa, AL 35487-0304, Telephone: 205-348-7087, FAX: 205-348-5585
Arkansas State UniversityUpward Bound Program Program Goal: Ensure that high school students fromlow-income families or potential first-generation college students participatein and are successful in postsecondary education.
141Retaining Minority Students in Higher Education
Program Description: The program serves seventy-five students in grades10 to 12 who are on campus on Saturdays during the academic year andparticipate in a six-week summer residential program.
Key Components: The program offers secondary education studentscareer assessment and planning, college preparation and planning, bridgeprograms, cultural enrichment activities, tutoring, counseling, guidance, andan on-campus residential program.
Evidence of Effectiveness: None found.Contact: Tony Thomas, associate director of Upward Bound, P.O.
Box 1390, State University, AR 72467, Telephone: 870-972-2080, Fax: 870-972-2520
Keene State CollegeAspire Program Program Goal: Encourage and empower students to be self-advocates and play an active part in developing a personal academic supportstrategy.
Program Description: The federally funded TRIO program works closelywith academic and career advising to assist students in attaining academicsuccess.
Key Components: The program offers individualized peer tutoring, work-shops in study skills, skill building, academic and financial counseling, a com-puter lab, and supplemental instruction.
Evidence of Effectiveness: None found.Contact: Maria Dintino, associate director, the Elliot Center, 229
Main Street, Keene, NH 03435, Telephone: 603-358-2390, E-mail:[email protected]
142

Appendix B: AnnotatedBibliography
Adelman, C. (1999). Answers in the tool box: Academic intensity, attendance patterns, and bachelor’sdegree attainment. Washington, DC: Office of Education Research and Improvement, U.S.Department of Education.
This study, based on the High School and Beyond/Sophomore longitudinaldatabase, uses both linear and logistic regression to explore the power oftwenty-four variables in explaining long-term (eleven-year) bachelor’s degreecompletion for students who attended a four-year college at any time duringthat period. Adelman identifies academic resources—intensity and quality ofa secondary education—and continuous college enrollment as powerful pre-dictors of degree attainment, which the author identifies as the bottom lineof all postsecondary retention and persistence discussions. The comprehen-sive analyses of college retention literature and of an integrated national dataset produced significant results for college retention policy. Adelman concludesthat the true challenge of degree attainment for the higher education com-munity requires remedying its ailing pipeline at the elementary and secondarylevels.
Beil, C., Resien, C. A., and others. (1999). A longitudinal study of the effects of academic andsocial integration and commitment on retention. NASPA Journal, 37(1), 376–385.
The researchers explored the effects of academic and social integration andcommitment on the persistence of first-year undergraduates at a midsizeuniversity. Empirical analysis indicated that first-semester commitmentmediated the effect of early academic and social integration on persistenceover time. Students’ level of commitment rather than academic and social
143Retaining Minority Students in Higher Education

integration has a direct impact on retention. Results support the premise thatearly institutional adjustment is central to influencing long-term retention.
Bennett, C., and Okinaka, A. M. (1990). Factors related to persistence among Asian, black,Hispanic, and white undergraduates at a predominately white university: Comparisonsbetween first and fourth year cohorts. Urban Review, 23, 33–60.
Bennett and Okinaka examined the attrition of minority and nonminoritycollege students at Indiana University. The researchers used a revised modelof black student attrition to focus on student campus life. Study findingsshowed white and Hispanic students who complete college are more satisfiedand less alienated than African American and Asian American students whograduate. Persistence and satisfaction with campus life appear to be separateissues for African Americans and Asian Americans, however, as African Amer-icans and Asian Americans who persisted to their fourth year of collegeappeared more dissatisfied with campus life than those who left the institu-tion. These findings suggest some ethnic students who persist in college expe-rience more trauma over time than those who drop out.
Gladieux, L. E., and Swail, W. S. (2000, May). Beyond access: Increasing the odds of collegesuccess. Phi Delta Kappan, pp. 688–692.
Gladieux and Swail, formerly with the College Board’s policy analysis unit,briefly describe the preparation, access, and completion rates of students ofvarious economic and racial backgrounds. They follow with a discussionof why we have not done better in opening the doors of higher educa-tion and, more important, why we have not been able to improve retentionand completion rates at the postsecondary level. In the end, the authors findthat improving opportunities for poor and minority students is a sharedresponsibility of higher education and the public sector and warn that, regard-less of public policy, the solution requires hands-on, one-on-one interventions.
Gonzalez, K. P. (1999). Campus culture and the experiences of Chicano students in predominantlywhite colleges and universities. Paper prepared for the annual meeting of the Association forthe Study of Higher Education, November 18–21, San Antonio, TX.
Gonzalez explored campus culture of a predominantly white metropolitanuniversity in the Southwest to determine whether the community supported
144

or hindered Chicano students’ persistence. After observing two Chicano malesfor a two-year period, the researcher interpreted the study findings using threeasymmetrical systems of representation: social world, physical world, and epis-temological world. Research findings indicate that the two students studiedfelt this particular institution marginalized their culture by not completelyaccepting their bilingual communication styles, dress, and music, and throughthe absence of physical representations of their culture. In addition, the stu-dents felt the institution failed to incorporate Mexican American history andculture into educational programs. In contrast, the two students seemed toappreciate and even expand the relationships with their families and commu-nities. Ethnic and cultural campus organizations, including Chicano faculty,Chicano literature and studies, and physical symbols, provided these studentswith a sense of community and pride.
Hall, C. (1999). African American college students at a predominantly white institution: Patternsof success. Paper prepared for an annual meeting of the Association for Institutional Research,May 30–June 2, Seattle, WA.
The study examined the interactions between students, the institution, and theexternal environment of successful African American students enrolled at anurban Catholic commuter university. The study used a combination of qual-itative and quantitative data collection and analysis methodologies to deter-mine how students perceived campus climate, environmental factors impedingand contributing to success, the effect of students’ perceptions and expecta-tions of the university on their experiences and knowledge, and the actionsthese students take to succeed academically. Research findings suggest thereare more quantifiable differences between white college students and AfricanAmerican students who persist than between African Americans who persistand those who do not, which supports previous findings that institutional cli-mate and other noncognitive factors are more important determinants of theacademic success of African Americans than whites. Qualitative data suggestthat the availability of ethnic and cultural organizations and a “critical mass”of African American students helped reduce the isolation and alienation oftenfound on predominantly white campuses. African American coping strategiesinclude high self-esteem, high aspirations, parental support and expectations,
145Retaining Minority Students in Higher Education
on-campus support (African American mentors), and involvement in culturaland ethnic organizations.
Himelhoch, C. R., Nichols, A., and others. (1997). A comparative study of the factors whichpredict persistence for African American students at historically black institutions and predom-inantly white institutions. Paper prepared for an annual meeting of the Association for theStudy of Higher Education, November 6–9, Albuquerque, NM.
The researchers tested Bean’s synthetic retention model (1982) as an accu-rate predictor of African American student persistence. Regression analysesof a stratified sample of the cooperative institutional research program dataset for a cohort of 1986 entering freshmen and 1990 follow-up showedfaculty mentoring as a predictor of African American persistence at bothfour-year HBCUs and predominantly white institutions. In contrast, datashowed changing majors and careers as a predictor of African Americanspersistence at HBCUs only. Implications for policy suggest heighteningfaculty-student mentoring programs at both institutional types and height-ening academic and career counseling at HBCUs to affect student persis-tence. Further research findings are presented, and study implications areoutlined.
Horn, L. J. (1998). Undergraduates who work. A Postsecondary Education Data Analysis Reportusing data from the National Postsecondary Student Aid Study (NPSAS:96). Washington,DC: National Center for Education Statistics, U.S. Department of Education.
Horn uses data from the 1996 National Postsecondary Student Aid Study toprofile undergraduates who were enrolled in postsecondary institutions in theacademic year 1995–96. Data analyses show that 50 percent of undergraduatesin the research sample reported working to help pay for their education. Work-ing students were employed an average of 25 hours per week, with 20 percent offull-time students also working full time. In addition, students who workedindicated that their class schedules were limited by their work schedules, andabout 25 percent reported that work adversely affected their academic perfor-mance. A negative effect was found between work and one-year persistence. Inaddition, the data showed that students who worked a few hours per week weremore likely to borrow to pay for their education than those who maintained arigorous work schedule.
146
House, J. D. (1998). High school achievement and admissions test scores as predictors of courseperformance of Native American and Alaska native students. Journal of Psychology, 132(6),680–682.
House examined the predictive relationships between admission test scores,high school achievement, and grades in specific college courses to identify fac-tors that are predictors of Native Americans’ postsecondary achievement. Usingthe two predictor variables of ACT composite scores and high school class per-centile rank, House tracked students’ grades during their first year of college.Data analyses showed significant correlations between ACT and certaincourses, including chemistry, introduction to philosophy, introduction to soci-ology, and introduction to psychology. None of the correlations for mathe-matics, however, were significant. In addition, significant correlations werefound for introduction to geology, introduction to sociology, and rhetoric andcomposition. Additional research findings are presented.
Just, H. D. (1999). Minority retention in predominantly white universities and colleges: The impor-tance of creating a good “fit.” (ERIC Document Reproduction Service No. ED 439 641)
Just examines retention theories and approaches for integrating students ofcolor into predominantly white college environments. Students of color facesimilar college adjustment difficulties as other students. A hostile campus cli-mate, however, further complicates their ability to integrate and adjust to cam-pus life, ultimately influencing their college persistence. The study suggeststhat connection to home significantly helps students adjust to college. Just alsodiscusses policy for aggressively recruiting culturally diverse students to createlarger communities of diverse student subgroups. Similarly, recruiting minor-ity college personnel will provide role models for students and create an envi-ronment that embraces diversity.
Kennedy, P. W., Sheckley, B. G., and others. (2000). The dynamic nature of student persistence:Influence of interactions between student attachment, academic adaptation, and social adapta-tion. Paper prepared for the annual meeting of the Association for International Research,May 21–24, Cincinnati, OH.
The researchers investigated a series of variables to determine which combina-tion would discriminate persisters from nonpersisters after a year of college.Research findings suggest persistence is related to dynamic interactions that
147Retaining Minority Students in Higher Education
occur over the course of an academic year and involve students’ self-evaluations.These findings are consistent with Tinto’s research, which depicted persisters asstudents who adapted academically, improved academically over the course ofthe year, or achieved within their own expectations. In addition, the results sup-port Pascarella and Terenzini’s research findings that students will persist despitetheir academic predictions if they have successfully integrated into the campusorganization. Thus, faculty should provide students with academic feedback tohelp them gauge academic success within a reasonable contextual frameworkdefined by faculty; moreover, colleges and universities should provide studentswith continuous experiences for academic and social adaptation.
Martin, D. C., and Arendale, D. R. (1994). Supplemental instruction: Increasing achievementand retention. San Francisco: Jossey-Bass.
The authors describe the supplemental instruction program of the Universityof Missouri–Kansas City and its program development, specific goals andobjectives, student and institutional outcomes, and potential for adaptationby other institutions. The program contains a number of innovative features,including identifying high-risk courses instead of high-risk students, offeringassistance to every student in the high-risk courses, using leaders to conductsupplemental instruction in small group sessions, and incorporating studentand faculty satisfaction surveys into measurable institutional change. The sup-plemental instruction program has been certified as an exemplary educationalprogram by the U.S. Department of Education and has received nationaldiffusion network funding.
Mortenson, T. (1998). Freshman-to-sophomore persistence rates by institutional control, aca-demic selectivity, and degree level, 1983 to 1998. Postsecondary Education Opportunity, 74.
Mortenson reports on the trends and patterns of freshman-to-sophomore per-sistence between 1986 and 1998. Analyses of ACT data evidenced an overalldecline in persistence rates, yet the results also supported previous studyfindings that selective private colleges enroll academically prepared high-income students who are more likely to earn degrees and open public institu-tions serve less academically prepared lower-income students. Although privatecolleges maintain higher persistence rates than public colleges, the gap is
148

closing. This trend is attributable partly to public four-year colleges’ increasedacademic selectivity. Enrollment persistence continues to be a challenge oncestudents graduate from high school and enroll in college, yet the deviationsfor the average persistence rates, regardless of institutional type, indicate someschools are more successful at getting their freshmen to persist to the sopho-more year.
Mortenson, T. (1999). Refocusing student financial aid: From grants to loans, from need tomerit, from poor to affluent. Postsecondary Education Opportunity, 82, 1–4.
Mortenson presents a critique of federal, state, and institutional financial aidpolicies. Over the past two decades, policies have reversed student financialaid’s original purpose of providing low-income citizens with access and equityto higher education. During the 1980s and 1990s, the federal governmentcontinued to provide middle- and high-income citizens with access to morestudent financial aid while restricting the financial aid specifically created tofacilitate low-income citizens’ college access and persistence. Mortenson con-tends the policy decisions were solely based on capitalism and politics anddescribes the practices as the “plantation economics” of higher education,where the rich get richer and the poor get poorer. Likewise, states reducedgrant aid and institutions reduced need-based aid in favor of merit-based aidto attract strong academic students who would improve their college rankings.It is evident that educational opportunity is the key to private and socialwelfare and that society has clearly compromised the public interest by failingto help those in need.
Murdock, T. (1990). Financial aid and persistence: An integrative review of the literature.NASPA Journal, 27(3), 213–221.
Murdock uses meta-analysis to explore the effect of financial aid on studentpersistence among different student groups and across types of institutions.Data analyses indicated that financial aid was an important factor affectingand promoting persistence among minority groups. In addition, the dollaramount of financial aid had a significant positive effect on persistence.The researcher also found a stronger effect for private institutions than forpublic ones.
149Retaining Minority Students in Higher Education
Nagda, B. A., Gregerman, S. R., and others. (1998). Undergraduate student-faculty researchpartnerships affect student retention. Review of Higher Education, 22(1), 55–72.
This study assessed the effect of the University of Michigan’s UndergraduateResearch Opportunity Program, which brokered intellectual relationshipsbetween faculty and first-year students and sophomores as a step in studentretention. Based on retention frameworks, which advocate student college inte-gration, the researchers used a participant–control group research design.Research findings indicated partnerships (student-faculty and student-student)are successful in promoting retention of some students. Specifically, the pro-gram increased the retention of participating African American students andAfrican American students with lower academic achievement. These findingsare consistent with previous research that showed integration is critical tounderrepresented minority students at PWIs, specifically African Americans.The effects were less significant for white and Hispanic students. The authorssuggest the challenge of integration may be different for Hispanic students thanfor African American students, particularly as most Hispanic students attend-ing the institution resided out of state and may have experienced deeper feelingsof isolation as a result of the absence of immediate family support.
Native American Higher Education Consortium. (2000). Creating role models for change: Asurvey of tribal college graduates. Alexandria, VA: Native American Higher EducationConsortium.
This study surveyed tribal college graduates to assess their fundamental char-acteristics. Descriptive analyses indicate average tribal college graduates arenontraditional female, first-generation Native Americans who receive associ-ate degrees and certificates and remain in the local community upon gradua-tion. Many of these graduates also have dependents under the age of 18. Theaverage graduate majored in more vocational and technical fields such as busi-ness, health care, computer technology, education, and human services. Manytribal college graduates are employed in or continue to enroll in postsecondarycourses, and some even transition to predominantly white institutions. Becausetribal colleges enroll only about 600 students, on average, the classes are small,allowing faculty more time to cultivate and mentor students. Althoughtribal college graduates clearly earned higher salaries as a result of attaining a
150
postsecondary degree, these graduates still earned much less than the nationalaverage of those in similar fields. Approximately 80 percent of tribal collegegraduates were satisfied with their academic higher educational experiences;however, they were less satisfied with the institutions’ facilities and equipment.Like HBCUs, tribal colleges seem to have a distinct role in the higher educa-tion community of successfully providing Native Americans with postsec-ondary education.
Pavel, D. M., Skinner, R. R., and others. (1999, Spring). Native Americans and Alaska Nativesin postsecondary education. Education Statistics Quarterly, 1(1), 67–74.
Statistical analyses compare data of Native Americans involved in postsec-ondary education with the general population of postsecondary students. TheNative American population has significantly increased from about two hun-dred thirty-seven thousand recorded in 1970 to slightly under two million in1990. Proportionally, Native Americans make up 0.08 percent of the popula-tion. Some of the growth is attributable to the self-identification by individ-uals as Native Americans. Research indicates that although Native Americanshave made substantial gains since the 1970s, they still lag behind the generalpopulation in college attendance, persistence, and completion. NativeAmerican students are more likely to be first-generation, low-income students;62 percent of students enrolled depend on student financial aid to pay for col-lege. They are also less likely to receive academic preparation for college thanthe overall students. The majority of Native Americans attending college,87 percent, attend two-year and public institutions, compared with 78 per-cent of all students. The number of Native American females attending col-lege has increased noticeably (52 percent) since 1970. College enrollments areconcentrated in areas with high Native American populations, principallywestern states such as New Mexico, Oklahoma, and Arizona.
Redd, K. E. (2000). Discounting toward disaster: Tuition discounting, college finances, and enroll-ments of low-income undergraduates. Indianapolis: USA Group Foundation.
To examine the effects of college tuition discounting, Redd compared datafrom annual institutional student aid surveys of private colleges and universi-ties with enrollment and Pell Grant data from the U.S. Department of
151Retaining Minority Students in Higher Education
Education. Data analyses indicated that (1) at least one-fourth of the collegesand universities used discounting strategies that resulted in large losses oftuition revenue; (2) institutions with the greatest increases in discount ratesraised their spending on institutional grants by $3,375 per undergraduate, buttheir tuition and fee revenue grew by just $3,069; (3) discounting strategiesdo not appear to have significantly improved the academic profiles of admit-ted undergraduates when measured by changes in median admission test scoresof entering first-year students; (4) tuition discounting does appear to havehelped institutions increase their numbers of low-income undergraduates; and(5) the increased use of tuition discounting does appear to have made it pos-sible for more students from all income levels to enter higher education.
Rodriguez, A. L., Guido-DiBrito, F., and others. (2000). Latina college students: Issues andchallenges for the 21st century. NASPA Journal, 37(3), 511–527.
This article discusses the barriers to Latina participation in higher education,factors contributing to the success of high-achieving Latinas, and strategies forstudent and academic affairs administrators to promote the success of Latinastudents. The Latino population remains one of the most underrepresentedgroups in the higher education system, which can be traced to Latinos’ lowsocioeconomic status. Barriers facing Latinas in postsecondary educationinclude cultural stereotyping; financial, academic, and social stresses; and insti-tutional marginalization. To support the success of Latinas in higher educa-tion, institutions should provide adequate and realistic financial aid thatincludes more grants and scholarships than loans, offer more academic sup-port to integrate students academically, provide more social and culturalsupport systems that value the Latina culture, and create a campus thatembraces diversity.
St. John, E. P., Paulsen, M. B., and others. (1996). The nexus between college choice andpersistence. Research in Higher Education, 37(2), 175–220.
Initial college choices are considered an influence on persistence, but theimpact of students’ choices has seldom been considered in studying their per-sistence and student outcomes. According to these researchers, two distinctsets of theories and research have evolved regarding college choice and
152
persistence as a result of considering them as two separate managerial func-tions in higher education. College choice research often supports marketingand recruitment, while persistence research supports student retention andcompletion. Using data from the national postsecondary student aid study,this study examined the influence of finance-related reasons for college choiceon persistence decisions. Data showed that finance-related choices had directand indirect influences on college persistence and that market-based mone-tary measures of financial aid, tuition, housing costs, and other living costshad substantial direct effects on persistence.
Smedley, B. D., Myers, H. F., and others. (1993). Minority-status stresses and the collegeadjustment of ethnic minority freshmen. Journal of Higher Education, 64(4), 434–452.
Nonwhite students attending PWIs are likely to view these campuses as hostile,alienating, socially isolating, and less responsive to their needs and interests.This study confirmed the hypothesis that minority status stress confers anadditional risk to the academic adjustment of nonwhite students beyond thosenormally experienced by white students. The researchers proposed a multidi-mensional stress-coping model of individual characteristics that moderate orenhance a student’s vulnerability to academic failure, psychological and cul-tural stresses students encounter during their academic careers, and students’coping strategies, all important in nonwhite college students’ adjustment andachievement. Chronic strains associated with being a student and life eventsare important correlates of psychological distress in nonwhite freshmen, andminority status stresses make a substantial additional contribution to this cor-relation. Research also supported previous findings that regardless of thesources of stress, they are not as important as academic preparation whenaccounting for present academic achievement.
Stewart, G. L., Russell, R. B., and others. (1997). The comprehensive role of student affairs inAfrican American student retention. Journal of College Admission, 154, 6–11.
The authors contend that student affairs personnel and professionals con-cerned with the matriculation and retention of minority students must beaware of the need to create an accepting and supportive atmosphere for AfricanAmerican students at PWIs. They discuss developing a supportive campus
153Retaining Minority Students in Higher Education

using a series of concepts and interventions, including precollegiate outreach,orientation, academic advising, tutoring, career planning and placement, finan-cial aid, residential life, and structured student activities
Strage, A. A. (1999). Social and academic integration and college success: Similarities anddifferences as a function of ethnicity and family educational background. College StudentJournal, 33(2), 198–205.
Strage examined college students’ social and academic integration and collegepersistence to discern similarities and differences among cultural and educationalsubgroups of the “new” college-going population—more students of color, part-part-timers, and older students. Data analyses of psychosocial survey responsesshow differences in students’ social and academic integration by cultural sub-groups. White and Hispanic students were slightly more confident in their aca-demic abilities and much more socially confident than Asian American students.They felt that they had better rapport with instructors, and they reported moreinternal locus of control. No significant differences were found between first-and later-generation students for academic and social integration. The relation-ship between grades and academic and social integration was much weaker thanthe relationship between achievement and motivation and integration. Academicconfidence, leadership, and teacher rapport were positively correlated with per-sistence for whites. Academic confidence and teacher rapport were predictive ofpersistence for Asian Americans. Academic confidence and locus of control weresignificantly correlated with persistence for Hispanics.
Swail, W. S. (2000). Preparing America’s disadvantaged for college: Programs that increase col-lege opportunity. In Cabrera and S. M. La Nasa (Eds.), Understanding the college choice ofdisadvantaged students. New Directions for Institutional Research, No. 107. San Francisco:Jossey-Bass.
This chapter uses selected indicators from the national survey of precollege out-reach programs to describe how these programs work within the scheme ofpublic schooling in America. The author describes the importance of educa-tion to lifting the minds, spirits, and opportunities of our less-advantaged youthand how early intervention programs can be a primary tool to make it happen.The chapter concludes with four points on how to alter public policy toimprove the practice of early outreach efforts.
154

Swail, W. S., and Perna, L. W. (2002). Pre-college outreach programs: A national perspective. InW. Tierney and L. Hagedorn (Eds.), Increasing access to college. Albany: State University ofNew York Press.
This chapter uses data from the national survey of precollege outreach pro-grams to describe the landscape of programs in operation around the UnitedStates. Included in this review are discussions of funding, location, types ofinterventions, staffing, and size of programs. The chapter begins with a briefdiscussion of federal and nongovernmental programs to increase access forunderrepresented students and concludes with ten viewpoints collected duringfocus groups with program directors from around the country for improv-ing program services and stability.
Terenzini, P. T., Cabrera, A. F., and others. (2001). Swimming against the tide: The poor in Amer-ican higher education. New York: College Entrance Examination Board.
This report presents profiles of low-income college students and the nature oftheir collegiate experience. Low-income students are likely to be nonwhite,have parents with high school diplomas or less, come from single-familyhomes, make decisions to attend college without parental guidance, attendpublic two-year institutions, and have limited academic resources. Low-incomestudents are equally involved in academics as high-income students but sig-nificantly less involved in out-of-class campus activities. Although financialconsiderations are important to facilitate students’ enrollment and persistencein college, they do not fully explain why low-income students attend andpersist in higher education.
Terenzini, P. T., Springer, L., and others. (1996). First-generation college students: Character-istics, experiences, and cognitive development. Research in Higher Education, 37(1), 1–22.
This study compares the characteristics and college experiences of first-generation students with those of traditional students to determine any dif-ferences between the groups and the educational impacts of the differences toaddress the increasing numbers enrolling in higher education. The conceptualmodel posits six sets of constructs defining a causal sequence that begins whenstudents enter college with an array of academic resources. The precollegecharacteristics are presumed to influence students’ course-taking patterns,
155Retaining Minority Students in Higher Education
formal classroom experiences, and out-of-class experiences during college,which ultimately influence educational outcomes. The researchers used first-year student data collected as part of a three-year longitudinal national surveyof precollege characteristics, a cognitive assessment instrument, and a collegeexperience questionnaire. Research findings of precollege characteristics showedfirst-generation students were more likely to come from low-income families,to be Hispanic, to have weaker cognitive skills (reading, math, and criticalthinking), to have lower degree aspirations, and to have been less involved withpeers and teachers while in high school. Research findings also indicated thathours spent studying positively impacted first-generation students’ gains inreading skills during their first year, which suggests a need to increase thesestudents’ study time, possibly through study groups, peer tutoring, and finan-cial assistance to reduce students’ off-campus work hours.
Thayer, P. B. (2000). Retention of students from first generation and low income back-grounds. Opportunity Outlook.
Based on theoretical models of retention, Thayer presents critical analysesof the characteristics of first-generation and low-income students, their chal-lenges to higher education, and programming that supports their postsec-ondary participation. Thayer offers a dual strategic approach for facilitatingthe attainment of a college degree, which consists of admissions selection andstudent support components. His discussion of student support servicescenters on integrating students into the academic and social structures of insti-tutions. Thayer expects these strategies to provide increased higher educationopportunities for low-income and first-generation students. Although therecommended strategies are targeted to at-risk students, they are applicable toall college student populations.
Tinto, V. (1975). Dropout from higher education: A theoretical synthesis of recent research.Review of Higher Education, 45(1), 89–125.
Tinto’s landmark theoretical model provides the framework for numerouscollege student retention studies. It posits that student-institution fitshapes students’ goal commitment and commitment to the institution,which ultimately influences student persistence. The model explores the
156

multifaceted functioning of interactions between the student and the collegeacademic and social systems on student persistence. Although the modelfailed to address in detail the effect of external campus factors, such asfinances, family obligations, and external peer groups on students’ persis-tence, it has remained the foundation of student retention studies andpractice for more than twenty-five years.
Volle, K., and Federico, A. (1997). Missed opportunities: A look at disadvantaged college aspirants.Boston: Education Resource Institute.
Volle and Federico examined three factors that significantly influence collegeaccess, persistence, and degree attainment of some first-generation anddivorced students on welfare. Although students in these subgroups face bar-riers unique to each subgroup, financial and academic limitations hinderdegree attainment across subgroups. The authors recommend investing in earlyintervention and precollege programs, increasing availability of college aware-ness information, increasing availability of support services, promoting greaterconsistency and clarity in financial aid policies regarding parental contribu-tions to college, and lessening restrictions prohibiting welfare recipients fromparticipating in college.
Wallace, D., Abel, R., and others. (2000). Clearing a path for success: Deconstructing bordersthrough undergraduate mentoring. Review of Educational Research, 24(1), 87–102.
The researchers use qualitative research methodology to examine the effec-tiveness of formal mentoring programs for high-risk undergraduates at asouthern comprehensive, four-year regional university. Formal mentoringwas defined as a deliberate matching of university personnel with high-riskstudents, a group that may include nonwhite, female, low-income, physi-cally challenged, and first-generation college students. Study findings indi-cate that formal mentoring appeared to positively affect studentparticipation, retention, and success in college. Students who had beeninvolved with student support services, Veterans Upward Bound, and theeducational opportunity center reported commitment to continuingtheir education as a result of support personnel’s counseling, tutoring, andguidance.
157Retaining Minority Students in Higher Education
References
Adelman, C. (1996, Oct. 4). The truth about remedial work. Chronicle of Higher Education.Adelman, C. (1997, Oct. 22). Turn college “access” into “participation.” Education Week on
the Web. [http://www.edweek.org].Adelman, C. (1999). Answers in the tool box: Academic intensity, attendance patterns, and bach-
elor’s degree attainment. Jessup, MD: Office of Educational Research and Improvement,U.S. Department of Education.
Adelman, C. (2002). The relationship between urbanicity and educational outcomes. InW. G. Tierney and L. S. Hagedorn (Eds.), Increasing access to college: Extending possibilitiesfor all students (pp. 35–64). Albany, NY: State University of New York Press.
Advisory Committee on Student Financial Assistance. (2001). Access denied: Restoring thenation’s commitment to equal education opportunity. Washington, DC: Advisory Committeeon Student Financial Assistance.
Ajzen, I., and Fishbein, M. (1972). Attitudes and normative beliefs as factors influencingbehavioral intentions. Journal of Personality and Social Psychology, 21(2), 1–9.
Ajzen, I., and Fishbein, M. (1977). Attitude-behavior relations: A theoretical analysis andreview of empirical research. Psychological Bulletin, 84(5), 888–918.
Alexander, K. L., Pallas, A. M., and Holupka, S. (1987). Consistency and change in educa-tional stratification: Recent trends regarding social background and college access.Research in Social Stratification and Mobility, 6, 161–185.
Allen, D. (1994). The Iliad and the Odyssey of student attrition. Paper presented at the Associ-ation for Institutional Research, May 30, New Orleans, LA.
Alliance for Equity in Higher Education (2001). Remarks at the meeting of the LuminaFoundation for Education regarding the status of minorities in higher education, Oct.
Alwin, W. F., and Otto, L. B. (1977). High school context effects on aspirations. Sociology ofEducation, 50, 259–273.
American Council on Education. (2000). 2000 status report on the Pell Grant program.Washington, DC: American Council on Education.
American River College. (2001). Beacon program: Peer-assisted learning. Retrieved Dec. 18,2001. [http://www.arc.losrios.cc.ca.us/learnres/beacon.html].
159Retaining Minority Students in Higher Education

Ancis, J. R., Sedlacek, W. E., and Mohr, J. J. (2000). Student perceptions of campus culturalclimate by race. Journal of Counseling and Development, 78(2), 180–185.
Anderson, B. T. (1989). Black participation and performance in high school. In W. Pearson,Jr., and H. K. Bechtel (Eds.) Blacks, Science, and American Education. New Brunswick,NJ: Rutgers University Press.
Anderson, E. (1985). Forces influencing student persistence and achievement. In L. Noel,R. S. Levitze, and D. Saluri (Eds.), Increasing student retention (pp. 44–61). SanFrancisco: Jossey-Bass.
Arrington, P. G. (1994). AASCU/Sallie Mae national retention project. Washington, DC:American Association of State Colleges and Universities.
Association of American Medical Colleges (1992). Project 3000 by 2000. Technical assistancemanual: Guidelines for action. Washington, DC: AAMC.
Astin, A. W. (1975). Preventing students from dropping out. San Francisco: Jossey-Bass.Astin, A. W. (1977). Four critical years. San Francisco: Jossey-Bass.Astin, A. W. (1982). Minorities in American higher education: Recent trends, current prospects,
and recommendations. San Francisco: Jossey-Bass.Astin, A. W. (1987). Competition or cooperation? Teaching teamwork as a basic skill.
Change, 19(5), 12–19.Astin, A. W. (1993a). What matters in college: Four critical years revisited (1st ed.). San
Francisco, CA: Jossey-Bass.Astin, A. W. (1993b). Diversity and multiculturalism on campus: How are students affected?
Change, 25(2), Mar–Apr, 44–49.Bakst, D. (2000). Race-targeted financial aid: Untangling the legal web. Student Aid Tran-
script, 11(2), 4–8.Beal, P. E., and Noel, L. (1980). What works in student retention. Iowa City, IA: American
College Testing Program.Bean, J. P. (1982). Student attrition, intentions, and confidence. New Directions for Higher
Education, no. 17, pp. 291–320. San Francisco: Jossey-Bass.Bean, J. P. (1986). Assessing and reducing attrition. In D. Hossler (Ed.), Managing college
enrollment (pp. 47–61). San Francisco: Jossey-Bass.Bean, J. P., and Eaton, S. B. (2000). A psychological model of college student retention. In J. M.
Braxton (Ed.), Reworking the student departure puzzle. Nashville: Vanderbilt University Press.Bean, L. (2001). Court rules against affirmative action at University of Georgia. Diversity Inc.
[http://www.diversityinc.com/public/1301.cfm]. Accessed Oct. 29, 2003.Beil, C., Resien, C. A., and Zea, M. C. (1999). A longitudinal study of the effects of academic
and social integration and commitment on retention. NASPA Journal, 37(1), 376–385.Bennett, C., and Okinaka, A. M. (1990). Factors related to persistence among Asian, black,
Hispanic, and white undergraduates as a predominately white university: Comparisonsbetween first and fourth year cohorts. Urban Review, 23, 33–60.
Bentler, P. M., and Speckart, G. (1979). Models of attitude-behavior relations. PsychologicalReview, 86(5), 452–464.
160
Bentler, P. M., and Speckart, G. (1981). Attitudes “cause” behaviors: A structural equationanalysis. Journal of Personality and Social Psychology, 40(2), 226–238.
Berg, J. H., and Peplau, L. A. (1982). Loneliness: The relationship of self-disclosure andandrogyny. Personality and Social Psychology Bulletin, 8, 524–630.
Berkner, L., and Chavez, L. (1997). Access to postsecondary education for the 1992 high schoolgraduates (NCES 98–105). Washington, DC: National Center for Education Statistics,U.S. Department of Education.
Berkner, L., He, S., Cataldi, E. F., and Knepper, P. (2002). Descriptive summary of 1995–96beginning postsecondary students: Six years later. Washington, DC: U.S. Department ofEducation, Institute of Education Sciences. (NCES 2003-151)
Berryman, S. E. (1983). Who will do science? Trends, and their causes in minority and femalerepresentation among holders of advanced degrees in science and mathematics. A special report.ERIC Document Reproduction Service No. ED245052.
Bird, T. (1990). The school teacher’s portfolio: An essay on possibilities. In J. Millman andL. Darling-Hammond (Eds.), The new handbook of teacher evaluation (pp. 241–256).Newbury Park, CA: Sage.
Blanchette, C. M. (1994). Higher education grants effective at increasing minorities’ chances ofgraduating. Washington, DC: Health, Education, and Human Services Division, GeneralAccounting Office.
Borman, G. D., Stringfield, S., and Rachuba, L. (2000). Advancing minority high achieve-ment: National trends and promising practices. New York: College Board.
Bowen, H. R. (1980). Adult learning, higher education, and the economics of unused capacity.Direction Papers in Lifelong Learning. Princeton, NJ: College Board.
Bowen, H. R. (1997). Investment in learning: The individual and social value of Americanhigher education. Baltimore: Johns Hopkins University Press.
Bowie State University. (1995). Model institutions for excellence initiative: Bowie State Univer-sity science, engineering, and mathematics education reform. Retrieved from the World WideWeb Jan. 5, 2002.
Braxton, J. M., and Lien, L. A. (2000). The viability of academic integration as a centralconstruct in Tinto’s interactionalist theory of college student departure. In J. M. Braxton(Ed.), Reworking the student departure puzzle (pp. 11–28). Nashville, TN: VanderbiltUniversity Press.
Brower, A. M. (1992). The “second half ” of student integration: The effects of life taskpredominance on student persistence. Journal of Higher Education, 63(4), 441–462.
Brunner, B. (2002). Timeline of affirmative action milestones. Learning Network Web site.Retrieved Aug. 13, 2003. [http://www.infoplease.com/spot/affirmativetimeline1.html].
Cabrera, A. F., Castaneda, M. B., Nora, A., and Hengstler, D. (1992). The convergencebetween two theories of college persistence. Journal of Higher Education, 63(2),143–164.
Cabrera, A. F., Nora, A., and Castaneda, M. B. (1992). The role of finances in the persistenceprocess: A structural model. Research in Higher Education, 33(5), 571–593.
161Retaining Minority Students in Higher Education

Cabrera, A. F., Nora, A., and Castaneda, M. B. (1993). College persistence: Structuredequation modeling test of an integrated model of student retention. Journal of HigherEducation, 64(2), 123–139.
Cabrera, A. F., and La Nasa, S. M. (2000). Three critical tasks America’s disadvantaged faceon their path to college. In A. F. Cabrera and S. M. La Nasa (Eds.), Understanding thecollege choice of disadvantaged students. New Directions for Institutional Research, no. 107.San Francisco, CA: Jossey-Bass.
Cabrera, A. F., La Nasa, S. M., and Burkam, K. R. (2001). Pathways to a four-year degree: Thehigher education story of one generation. Unpublished report.
Capella, B., Hetzler, J., and MacKenzie, C. (1983). The effects of positive peer influence onstudy habits. Reading Improvements, 20(4), 229–302.
Chickering, A. W. (1974). Commuting versus resident students: Overcoming the educationalinequities of living off campus. San Francisco: Jossey-Bass.
Christman, D. E. (2000). Multiple realities: Characteristics of loan defaulters at a two-yearpublic institution. Community College Review, 27(4), 16–32.
Clayton, M. (2001). Michigan affirmative action case will reverberate widely. Christian Sci-ence Monitor. Retrieved Aug. 13, 2003. [http://www.csmonitor.com/2001/1023/p14s1-leca.html].
Clewell, B., and Ficklen, M. (1986). Improving minority retention in higher education: Asearch for effective institutional practices. Princeton, NJ: Educational Testing Service.
Cohen, R. (2002, Jan. 17). A negative impression on affirmative action. Washington Post,p. A23.
College Board. (2001a). Data from 2001 college-bound seniors cohort. Retrieved Aug. 13,2003. [http://www.collegeboard.com]
College Board. (2001b). Trends in student aid 2001. Washington, DC: College Board.College Board. (2002). Trends in student aid 2002. Washington, DC: College Board.Collison, M. (1988). Complex application form discourages many students from applying
for federal financial aid. Chronicle of Higher Education, A19, A30.Cope, R., and Hannah, W. (1975). Revolving college doors: The causes and consequences of
dropping out, stopping out, and transferring. New York: Wiley.Couch, R., and Holmes, B. (1997, Fall). Seamless collaboration for student success: Effective
strategies for retaining minority students. Michigan Community College Journal: Researchand Practice, 3(2), 43–51.
Cunningham, A. F., and O’Brien, C. (1999). Do grants matter? Student grant aid and afford-ability. Washington, DC: Institute for Higher Education Policy.
Davies, G. (2001, Nov. 30). Higher education is a public health issue. Chronicle of HigherEducation, p. B16.
Dreisbach, M., and Keogh, B. K. (1982). Testwiseness as a factor in readiness: Test perfor-mance of young Mexican-American children. Journal of Educational Psychology, 74(2),224–229.
Eaton, S. B., and Bean, J. P. (1995). An approach/avoidance behavioral model of collegestudent attrition. Research in Higher Education, 36(6), 617–645.
162

Ekstrom, R. B. (1991). Attitudes toward borrowing and participation in post-secondary educa-tion. Paper presented at the annual meeting of the Association for the Study of HigherEducation, Oct. 31–Nov. 3, Boston, MA.
Elam, J. C. (1989). Blacks in higher education: Overcoming the odds. Lanham, MD: UniversityPress of America.
Endo, J., and Harpel, R. (1982). The effects of student-faculty interaction on students’ edu-cational outcomes. Research in Higher Education, 16, 115–135.
Epps, A. C. (1979). Summer programs for undergraduates in a professional medical educa-tional environment. In Medical Education: Responses to a Challenge. Mount Kisco, NY:Futura.
Feagin, J. R., and Sikes, M. P. (1995, summer). How black students cope with racism onwhite campuses. Journal of Blacks in Higher Education, 8, 91–97.
Fenske, R. H., Porter, J. D., and DuBrock, C. P. (2000). Tracking financial aid and persis-tence of women, minority, and needy students in science, engineering and mathematics.Research in Higher Education, 41(1), 67–94.
Fernandez, Y. M., Whitlock, E. R., Maring, C., and VanEarden, K. (1998). Evaluation of afirst-year pilot program for academically underrepresented students at a private liberal artscollege. Amherst: University of Massachusetts.
Fiske, E. B. (1988). The undergraduate Hispanic experience: A case of juggling two cultures.Change, 20(3), 29–33.
Flannery, J., and others. (1973). Final report from the ad hoc committee to study attrition atMiami-Dade Community College, North Campus. Miami: Miami-Dade Junior College.
Flores, M. (2003, Aug. 8). UT get ready to wade into affirmative action: School system givengo-ahead for new policies. San Antonio Epress-News, p. 1A.
Forrest, A. (1982). Increasing student competence and persistence: The best case for general edu-cation. Iowa City: American College Testing Program, National Center for Advancementof Educational Practices.
Franklin, J. (1988). The desperate need for black teachers. Educational Digest, 53(7),14–15.
Fullilove, R. E., and Treisman, P. U. (1990). Mathematics achievement among AfricanAmerican undergraduates at the University of California, Berkeley: An evaluation of themathematics workshop program. Journal of Negro Education, 59(3), 463–478.
Gladieux, L. E. (2001). Unpublished paper. Toronto: Canada Millennium ScholarshipFoundation.
Gladieux, L. E., and Swail, W. S. (1998). Postsecondary education: Student success, notjust access. In S. Halperin (Ed.), The forgotten half revisited—1998 (pp. 101–114).Washington, DC: American Youth Policy Forum.
Gladieux, L. E., and Wolanin, T. (1976). Congress and the colleges: The national politics ofhigher education. Lexington, MA: D. C. Heath.
Gonzalez, K. P. (1999). Campus culture and the experiences of Chicano students in predomi-nantly white colleges and universities. Paper presented at the annual meeting of the Associa-tion for the Study of Higher Education, Nov. 18–21, San Antonio, TX.
163Retaining Minority Students in Higher Education
Griffen, O. T. (1992). The impacts of academic and social integration for black students inhigher education. In M. Lang and C. Ford (Eds.), Strategies for retaining minority studentsin higher education. Springfield, IL: Charles C. Thomas Publishers.
Guinier, L. (2001, Dec. 14). Colleges should take “confirmative action” in admissions.Chronicle of Higher Education.
Hall, C. (1999). African American college students at a predominantly white institution: Patternsof success. Paper presented at the annual meeting of the Association for InstitutionalResearch, May 30–June 2, Seattle, WA.
Halpern, D. (1992). A cognitive approach to improving thinking skills in the sciences andmathematics. In D. Halpern, D. (Ed.), Enhancing thinking skills in the sciences and mathe-matics (pp. 1–14). Hillsdale, NY: Lawrence Erlbaum Associates.
Heller, D. E. (1999). Institutional need-based and non-need grants: Trends and differencesamong college and university sectors. Journal of Student Financial Aid, 29(3), 7–24.
Heller, D. E. (2001a). The effects of tuition process and financial aid on enrollment in highereducation. Rancho Cordova, CA: EdFund.
Heller, D. E. (2001b). Race, gender, and institutional financial aid awards. Journal of StudentFinancial Aid, 31(1), 7–24.
Heller, D. E., and Rasmussen, C. J. (2001). Merit scholarships and college access: Evidence fromtwo states. Paper presented to the State Merit Aid Programs: College Access and EquityConference sponsored by the Civil Rights Project, Dec., Harvard University.
Hentoff, N. (1997). Cheryl Hopwood v. State of Texas. Retrieved Aug. 13, 2003.[http://www.villagevoice.com/issues/9747/hentoff.php].
Himelhoch, C. R., Nichols, A., Ball, S. R., and Black, L. C. (1997). A comparative study ofthe factors which predict persistence for African American students at historically black institu-tions and predominantly white institutions. Paper presented at the annual meeting of theAssociation for the Study of Higher Education, Nov. 6–9, Albuquerque, NM.
Horn, L. (1998). Undergraduates who work. Postsecondary Education Descriptive AnalysisReports. Statistical Analysis Report. Washington, DC: National Center for EducationStatistics, U.S. Department of Education.
Horn, L., and Kojaku, L. (2001). High school academic curriculum and the persistence paththrough college. (Report No. NCES 2001-163). Washington, DC: U.S. Department ofEducation, Office of Educational Research and Improvement.
Horn, L., and Maw, C. (1994). Undergraduates who work while enrolled in postsecondary edu-cation: 1989–90. Postsecondary Education Descriptive Analysis Reports. Statistical Analy-sis Report. Washington, DC: National Center for Education Statistics, U.S. Departmentof Education.
Hossler, D. (1984). Enrollment management. New York: College Entrance Examination Board.Hossler, D., Braxton, J., and Coopersmith, G. (1989). Understanding student college
choice. In John Smart (Ed.), Higher education: Handbook of theory and research (vol. V,pp. 231–288). New York: Agathon Press.
Hossler, D., Schmit, J., and Vesper, N. (1999). Going to college: How social, economic, and educa-tional factors influence the decisions students make. Baltimore: Johns Hopkins University Press.
164
Hyman, A. K. (1988). Group work as a teaching strategy in black student retention in highereducation. In M. Lang and C. Ford (Eds.), Black student retention in higher education.Springfield, IL: Charles C. Thomas Publishers.
Institute for Higher Education Policy (1998). Reaping the benefits: Defining the public andprivate value of going to college. Washington, DC: IHEP.
Jencks, C., and Phillips, M. (1998). The black-white test score gap. Washington, DC:Brookings Institution.
Just, H. D. (1999). Minority retention in predominantly white universities and colleges: Theimportance of creating a good “fit.” (ED 439 641)
Justiz, Manuel (1994). Demographic trends and the challenges to American higher educa-tion. In Justiz, Wilson, and Bjork (Eds.), Minorities in Higher Education (pp. 1–21).Phoenix, AZ: Oryz Press and ACE.
Kalechstein, P., and others (1981). The effects of instruction on test-taking skills in secondgrade children. Measurement and evaluation in guidance, 13(4), 198–201.
Kanter, R. M. (1983). The change masters: Innovation for productivity in the American corpora-tion. New York: Simon & Schuster.
Kennedy, P. W., Sheckley, B. G., and Kehrhahn, M. T. (2000). The dynamic nature of studentpersistence: Influence of interactions between student attachment, academic adaptation, andsocial adaptation. Paper presented at the annual meeting of the Association for Interna-tional Research, May 21–24, Cincinnati, OH.
King, J. E. (1999). Money matters: The impact of race/ethnicity and gender on how students payfor college. Washington, DC: American Council on Education.
Lane, C. (2003, June 24). Affirmative action for diversity is upheld in 5 to 4 vote: Justicesapprove U. Mich. Law School Plan. Washington Post, p. A1.
Lenning, O. T. (1982). Variable-selection and measurement concerns. In E. T. Pascarella(Ed.), Studying student attrition. San Francisco: Jossey-Bass.
Lenning, O. T., Beal, P. E., and Sauer, K. (1980). Retention and attrition: Evidence for actionand research. Boulder, CO: National Center for Higher Education Management Systems.
Leslie, L. L., and Brinkman, P. T. (1988). The economic value of higher education. New York:Macmillan.
Levey, R. A. (2003). Discriminate but obfuscate: The court’s message to universities.National Review Online. [http://www.nationalreview.com/comment/comment-levy062703.asp]. Accessed Oct. 29, 2003.
Levine, A., and Nidiffer, J. (1996). Beating the odds: How the poor get to college. San Francisco:Jossey-Bass.
Levitze, R. S., and Noel, L. (1985). Using a systematic approach to assessing retention needs.In L. Noel, R. S. Levitze, D. Saluri, and Associates (Eds.), Increasing student retention. SanFrancisco: Jossey-Bass.
Liu, R., and Liu, E. (2000). Institutional integration: An analysis of Tinto’s theory. Paper pre-sented at the AIR Forum, Cincinnati, OH.
Lum, L. (1997). Difference of opinion about Hopwood. Houston Chronicle.[http://www.chron.com/content/chronicle/page1/97/03/26/hopwood.2–0.html]
165Retaining Minority Students in Higher Education

Lynch, M. W. (2001). Ward Connerly’s new cause: The man who ended affirmative action inCalifornia is pushing for a colorblind government. Retrieved Aug. 13, 2003.[http://www.reason.com/ml/ml053101.shtml].
Malcom, S. M. (1983). Equity and excellence: Compatible goals. Washington, DC: AmericanAssociation for the Advancement of Science.
Martin, A.D.J. (1985). Financial aid. In L. Noel, R. S. Levitze, D. Saluri, and Associates(Eds.), Increasing student retention. San Francisco: Jossey-Bass.
Matyas, M. L. (1991). Women, minorities, and persons with physical disabilities in scienceand engineering: Contributing factors and study methodology. In M. L. Matyas (Ed.),Investing in human potential: Science and engineering at the crossroads (pp. 13–36).Washington, DC: American Association for the Advancement of Science.
McDermott, L. C., Piternick, L. K., and Rosenquist, M. (1980, Jan.). Helping minoritystudents succeed in science. Journal of College Science Teaching, 9(3), 135–140.
McPherson, M. S. (1993). How can we tell if financial aid is working? In M. S. McPherson,M. O. Schapiro, and G. C. Winston (Eds.), Paying the piper: Productivity, incentives, andfinancing in U.S. higher education. Ann Arbor: University of Michigan Press.
Mendoza, J., and Corzo, M. (1996). Tracking/monitoring program to enhance multiculturalstudent retention. Paper presented at the Consortium for Community College Develop-ment’s Annual Summer Institute, June 23–26, Charleston, SC.
Merisotis, J., and O’Brien, C. T. (1998). Minority-serving institutions: Distinct purposes,common goals. New Directions for Higher Education, no. 102. San Francisco: Jossey-Bass.
Metzner, B. S., and Bean, J. P. (1987). The estimation of a conceptual model of nontraditionalundergraduate student attrition. Research in Higher Education, 27(1), 15–38.
Moline, A. E. (1987). Financial aid and student persistence: An application of causalmodeling. Research in Higher Education, 26(2), 130–147.
Mooney, C. (1988). The college president. Chronicle of Higher Education, 34(29), 14–16.Moore, W. J., and Carpenter, L. C. (1985). Academically underprepared students. In
L. Noel, R. S. Levitze, D. Saluri, and Associates (Eds.), Increasing student retention(pp. 95–115). San Francisco: Jossey-Bass.
Mortenson, T. G. (2001a). College continuation rates for recent high school graduates, 1959to 2000. Postsecondary Education Opportunity, 107, 1–10.
Mortenson, T. G. (2001b). College participation by family income, gender, and race/ethnicity for dependent 18 to 24 year olds, 1996 to 2000. Postsecondary EducationOpportunity, 114, 1–8.
Mortenson, T. G. (2001c). Trends in college participation by family income, 1970 to 1999.Postsecondary Education Opportunity, 106, 1–8.
Mortenson, T. (2002). Higher education as private and social investment. Presentation to theKey Bank Financing Conference, Feb. 15, Orlando, FL.
Mortenson, T. G., and Wu, Z. (1990). High school graduation and college participation ofyoung adults by family income backgrounds, 1970 to 1989. ACT Student Financial AidResearch Report No. 90–3. Iowa City: ACT Educational and Social Research.
166

Mumper, M. (1996). Beyond financial aid: Alternative approaches to improving collegeparticipation. Review of Educational Research, 22, 83–97.
Murdock, T. (1990). Financial aid and persistence: An integrative review of the literature.NASPA Journal, 27(3), 213–221.
Murphy, S. J., and Fath, K. Q. (1996). Successful implementation of comprehensive supportservices and its effect on student retention. Consortium for Student Retention DataExchange. Retrieved Dec. 18, 2001. [http://www.occe.ou.edu/CSRDE/1996.htm].
Myers, K. A., and Birk, N. A. (1998). First-year learning team (FLighT) program. Consortiumfor Student Retention Data Exchange. Retrieved Dec. 18, 2001.[http://www.occe.ou.edu/CSRDE/1998.htm]
National Association of State Student Grant and Aid Programs. (2001). 31st annual surveyreport, 1999–2000 academic year. Albany: National Association of State Student Grantand Aid Programs.
National Resource Center for the First-Year Experience and Students in Transition. (1999).Research on University 101: Assessment of outcome. Retrieved from the World Wide WebJan. 3, 2002.
National Collegiate Athletic Association. (2000). Graduation-rates report, all divisions.Indianapolis: National Collegiate Athletic Association.
National Collegiate Athletic Association. (2001a). 2000 Division I graduation-rates report.Indianapolis: National Collegiate Athletic Association.
National Collegiate Athletic Association. (2001b). 2000 Divisions II and III graduation-ratesreport. Indianapolis: National Collegiate Athletic Association.
National Commission on the Cost of Higher Education (1998). Straight talk about collegecosts and prices. Report of the National Commission on the Cost of Higher Education, Jan. 21,1998. Washington, DC: Oryx Press.
Nettles, M. T., and Perna, L. W. (1997). The African American education data book: Higherand adult education (vol. I). Fairfax, VA: Frederick D. Patterson Research Institute of theCollege Fund/UNCF.
Neisler, O. J. (1992). Access and retention strategies in higher education: An introductoryoverview. In M. Lang and C. Ford (Eds.), Strategies for retaining minority students inhigher education. Springfield: Charles C. Thomas Publisher.
Noel, L., Levitze, R. S., and Saluri, D. (1985). Increasing student retention. San Francisco:Jossey-Bass.
Okun, M., Benin, M., and Brandt-Williams, A. (1996). Staying in college: Moderatorsof the relation between intention and institutional departure. Journal of Higher Education,67(5), 577–596.
Olivas, M. A. (1985). Latino college students. New York: Teachers College Press.Palmer, C. J., Penney, S. W., and Gehring, D. D. (1997). Hate speech and hate crimes:
Campus conduct codes and Supreme Court rulings. NASPA Journal, 34, 112–122.Pantages, T. J., and Creedon, C. F. (1978). Studies of college attrition, 1950–1975. Review
of Educational Research, 48(1), 49–101.Parker, C. E. (1997). Making retention work. Black Issues in Higher Education, 13, 120.
167Retaining Minority Students in Higher Education
Pascarella, E. (1984). College environmental influences on students’ educational aspirations.Journal of Higher Education, 55(6), 751–771.
Pascarella, E., and others. (1994). Impacts of on-campus and off-campus work on first-yearcognitive outcomes. Journal of College Student Development, 35(5), 364–370.
Pascarella, E., and Terenzini, P. (1979). Student-faculty informal contact and collegepersistence: A further investigation. Journal of Educational Research, 72(4), 214–218.
Pascarella, E., and Terenzini, P. (1991). How college affects students. San Francisco: Jossey-Bass.
Pavel, D. M., Skinner, R. R., and others (1999, Spring). Native Americans and AlaskaNatives in postsecondary education. Education Statistics Quarterly, 1(1), 67–74.
Peng, S. S., and Fetters, W. B. (1978). Variables involved in withdrawal during the first twoyears of college: Preliminary findings from the national longitudinal study of the highschool class of 1972. American Educational Research Journal, 15(3), 361–372.
Perna, L. W. (1998). The contribution of financial aid to student persistence. Journal ofStudent Financial Aid, 28(3), 25–40.
Perna, L. W. (2000). Differences in the decision to attend college among African Americans,Hispanics, and whites. Journal of Higher Education, 71(2), 117–141.
Peterson, S. L. (1993). Career decision-making self-efficacy and institutional integration ofunderprepared college students. Research in Higher Education, 34(6), 659–685.
Pine, J. T. (2001). After affirmative action: Univ. of Calif. alters policies to improve diversity.Retrieved Apr. 2003. [http://www.diversityinc.com/public/1753.cfm].
Porter, O. F. (1989). Undergraduate completion and persistence at four-year colleges and univer-sities: Completers, persisters, stopouts, and dropouts. Washington, DC: National Institute ofIndependent Colleges and Universities.
Quality Education for Minorities. (1990). Education that works: An action plan for the educa-tion of minorities. Cambridge, MA: Massachusetts Institute of Technology.
Redd, K. E. (2001). HBCU graduates: Employment, earnings and success after college.Indianapolis: USA Group Foundation.
Redd, K. E., and Scott, J. A. (1997). AASCU/Sallie Mae National Retention Project, inG. G. Clyburn (ed.) Policies and practices: A focus on higher education retention (pp. 7–24).Washington, DC: American Association of State Colleges and Universities.
Reindl, T., and Redd, K. E. (1998). Institutional aid in the 1990s: The consequences of policyconnections. Washington, DC: American Association of State Colleges and Universities.
Reisberg, L. (2000, April 28). A top university wonders why it has no black freshmen.Chronicle of Higher Education, A52–A54.
Rendón, L. I. (1996). Life on the border. About Campus, 14–19.Rendón, L. I. (1997). Access in a democracy: Narrowing the opportunity gap. Unpublished
paper presented at the Policy Panel on Access, National Postsecondary Education Cooper-ative, Sept. 9, 1997.
Rendón, L. I., Jalomo, R., Jr., and Nora, A. (2000). Theoretical considerations in the studyof minority student retention in higher education. In J. M. Braxton (Ed.), Reworking thestudent departure puzzle (pp. 127–156). Nashville: Vanderbilt University Press.
168
Reyes, N. (1997). Holding on to what they’ve got. Black Issues in Higher Education, 13, 36–41.Richardson, R.C.J., Simmons, H. L., and de los Santos, A.G.J. (1987). Graduating minority
students. Change, 19(3), 20–27.Richardson, R.C.J., and Skinner, E. F. (1990). Adapting to diversity: Organizational influ-
ences on student achievement. Journal of Higher Education, 61(5), 485–511.Richardson, R.C.J., and Skinner, E. F. (1992, Winter). Helping first-generation minority
students achieve degrees. New Directions for Community Colleges, no. 80. San Francisco:Jossey-Bass.
Rodarmor, W. (1991, Sept.). California Q&A: A conversation with Troy Duster. CaliforniaMonthly.
Rootman, I. (1972). Voluntary withdrawal from a total adult socializing organization: Amodel. Sociology of Education, 45, 258–270.
Ryan, J. M., and Kuhs, T. M. (1993, Spring). Assessment of preservice teachers and the useof portfolios. Theory into Practice, 32(2), 75–81.
St. John, E. P. (1991). What really influences minority attendance? Sequential analysis of theHigh School and Beyond sophomore cohort. Research in Higher Education, 32(2),141–158.
St. John, E. P. (2001). The impact of aid packages on educational choices: High tuition–highloan and educational opportunity. Journal of Student Financial Aid, (31)2: 35–54.
St. John, E. P., Kirshstein, J. R., and Noel, L. (1991). The effects of financial aid on persis-tence: A sequential analysis. Review of Higher Education, 14(3), 383–406.
St. John, E. P., Paulsen, M. B., and Starkey, J. B. (1996). The nexus between college choiceand persistence. Research in Higher Education, 37(2), 175–220.
St. John, E. P., and Starkey, J. B. (1995). An alternative to net price: Assessing the influenceof prices and subsidies on within-year persistence. Journal of Higher Education, 66(2),156–186.
Sallie Mae. (1999). Supporting the historically black college and university mission: The SallieMae/HBCU Default Management Project. Reston, VA: Sallie Mae.
Sedlacek, W. E., and Prieto, D. O. (1990). Predicting minority students’ success in medicalschool. Academic Medicine, 65(3), 161–166.
Selingo, J. (2000). What states aren’t saying about the “x-percent solution.” Chronicle ofHigher Education. Retrieved June 2, 2000. [http://www.chronicle.com].
Smedley, B. D., Myers, H. F., and Harrell, S. P. (1993). Minority-status stresses and thecollege adjustment of ethnic minority freshmen. Journal of Higher Education, 64(4),434–452.
Smith, L., Lippitt, R., and Sprandel, D. (1985). Building support for a campuswide reten-tion program. In L. Noel, R. S. Levitze, D. Saluri, and Associates (Eds.), Increasingstudent retention (pp. 366–382). San Francisco: Jossey-Bass.
Spady, W. G. (1970). Dropouts from higher education: An interdisciplinary review andsynthesis. Interchange, 1(1), 64–85.
Spady, W. G. (1971). Dropouts from higher education: Toward an empirical model. Inter-change, 2(3), 38–62.
169Retaining Minority Students in Higher Education
Spatz, M. A. (1995, Dec. 6). From high risk to high retention: A look at strategies that transformspecial admit students into successful collegians. The Consortium for Student RetentionData Exchange. Retrieved Dec. 18, 2001. [http://www.occe.ou.edu/CSRDE/1995.htm].
Stage, F. K. (1989). Motivation, academic and social integration, and the early dropout.American Educational Research Journal, 26(3), 385–402.
Stanley, M. G., and Witten, C. H. (1990). University 101 freshman seminar course: A longi-tudinal study of persistence, retention, and graduation rates. NASPA Journal, 27,344–352.
Steele, C. (1999). The compelling need for diversity in higher education. ERIC documentreproduction service no. ED435367.
Steinmiller, R., and Steinmiller, G. (1991). Retention of at-risk students in higher education.In Reaching our potential: Rural education in the 90s, conference proceedings, RuralEducation Symposium, March 17–20, 1991, Nashville, TN.
Swail, W. S. (1995). A conceptual framework for student retention in science, engineering, and math-ematics. Dissertation conducted at the George Washington University, Washington, DC.
Swail, W. S. (2000). Preparing America’s disadvantaged for college: Programs that increasecollege opportunity. In A. F. Cabrera and S. M. La Nasa (Eds.), Understanding the collegechoice of disadvantaged student (pp. 85–101). San Francisco: Jossey-Bass.
Swail, W. S., and Perna, L. W. (2002). Pre-college outreach programs: A national perspective.In Tierney and Hagedorn (Eds.), Increasing access to college. Albany, NY: State Universityof New York Press.
Terenzini, P. T., and Pascarella, E. T. (1977). Voluntary freshman attrition and patterns ofsocial and academic integration in a university: A test of a conceptual model. Research inHigher Education, 6(1), 25–43.
Terenzini, P. T., and Pascarella, E. T. (1980). Toward the validation of Tinto’s model of col-lege student attrition: A review of recent studies. Research in Higher Education, 12(3),271–280.
Terenzini, P. T., and Pascarella, E. T. (1984). Freshman attrition and the residential context.Review of Higher Education, 7(2), 111–124.
Terenzini, P. T., and Wright, T. M. (1987). The influence of academic and social integration onstudents’ personal development during four years of college. Paper presented at the annualforum of AIR, May 3–6, 1987, Kansas City, MO.
Thayer, P. (2000, May). Retaining first generation and low income students. OpportunityOutlook, pp. 2–8.
Thomas, G. E. (1986). The access and success of blacks and Latinos in U.S. graduate and profes-sional education. Working paper. Washington, DC: National Research Council.
Tierney, W. G. (1992). An anthropological analysis of student participation in college. Jour-nal of Higher Education, 63(6), 603–618.
Tinto, V. (1975). Dropout from higher education: A theoretical synthesis of recent research.Review of Higher Education, 45(1), 89–125.
Tinto, V. (1982). Limits of theory and practice in student attrition. Journal of Higher Educa-tion, 53(6), 687–700.
170

Tinto, V. (1988). Stages of student departure: Reflections on the longitudinal character ofstudent leaving. Journal of Higher Education, 59(4), 438–455.
Tinto, V. (1993). Leaving college: Rethinking the causes and cures of student attrition (2nd ed.).Chicago: University of Chicago Press.
Tinto, V. (1997). From access to participation. Washington, DC: National PostsecondaryEducation Cooperative.
Tinto, V. (2000). Linking learning and leaving. In J. M. Braxton (Ed.), Reworking the studentdeparture puzzle. Nashville: Vanderbilt University Press.
Tobias, S. (1990). They’re not dumb. They’re different. Tucson, AZ: Research Corporation.Tracey, T. J., and Sedlacek, W. E. (1985). The relationship of noncognitive variables to
academic success: A longitudinal comparison by race. Journal of College Student Personnel,405–410.
Trippi, J., and Cheatham, H. E. (1989). Effects of special counseling programs for blackfreshmen on a predominately white campus. Journal of College Student Development, 30,144–151.
Ugbah, S., and Williams, S. A. (1989). The mentor-protégé relationship: Its impact onblacks in predominantly white institutions. In J. Elam (Ed.), Blacks in higher educationovercoming the odds (pp. 29–42). Lanham, MD: University Press of America.
U.S. Census Bureau. (2001). Household income data from current population survey.Retrieved Aug. 13, 2003. [http://www.census.gov/hhes/income/income01/inctab1.html].
U.S. Department of Education. (1996). National education longitudinal study 1988/94.Washington, DC: National Center for Education Statistics.
U.S. Department of Education. (1997). Reading and mathematics achievement: Growth inhigh school. An issue brief. Washington, DC: U.S. Department of Education.
U.S. Department of Education. (2001a). The condition of education. Washington, DC:National Center for Education Statistics.
U.S. Department of Education. (2001b). Digest of education statistics, 2000 (Report No.2001–034). Washington, DC: National Center for Education Statistics.
U.S. Department of Education. (2001c). 2000 national postsecondary student aid studydataset. Washington, DC: National Center for Education Statistics.
U.S. General Accounting Office. (1995). Higher education: Restructuring student aid couldreduce low-income student dropout rate. Report to Congressional Requesters, March1995. GAO/HEHS-95-48. Washington, DC: U.S. General Accounting Office.
Valentine, C. A. (1971). Deficit, difference, and bicultural models of Afro-Americanbehavior. Harvard Educational Review, 41(2), 137–157.
Vernez, G., Krop, R. A., and Rydell, C. P. (1999). Closing the education gap: Benefits and costs.Santa Monica, CA: RAND.
Western Interstate Commission for Higher Education. (1998). Knocking at the college door:Projections of high school graduates by state and race/ethnicity, 1996–2016. Boulder, CO:Western Interstate Commission for Higher Education.
Whimbey, A., and others. (1980). Teaching critical reading and analytical reasoning inproject SOAR. Journal of Reading, 24(1), 5–10.
171Retaining Minority Students in Higher Education

Wilhelm, T. J., and Wallace, K. M. (1997). Wayne State University undergraduate retentionprogram. Consortium for Student Retention Data Exchange. Retrieved Dec. 18, 2001.[http://www.occe.ou.edu/CSRDE/1997.htm].
Williams, P. (2003). Gratz v. Michigan: Undergraduate affirmative action program struckdown. MSNBC News Online. [http://www.msnbc.com/news/893295.asp]. Accessed Oct.29, 2003.
Wolanin, T. (1998). Pell Grants: A 25-year history. In L. E. Gladieux, B. Astor, and W. S.Swail (Eds.), Memory, reason, imagination: A quarter century of Pell Grants (pp. 13–31).New York: College Board.
Young, J. (1999). The freshman year initiative at Fayetteville State University: A comprehensiveapproach to student success. Consortium for Student Retention Data Exchange.
172
173Retaining Minority Students in Higher Education
Watson Scott Swail, Ed.D., is president of the Educational Policy Institute,a Washington, D.C.–based nonprofit organization dedicated to policy researchon educational opportunity. His most recent publications include “HigherEducation and the New Demographics” (Change, 2002), “Precollege OutreachPrograms: A National Perspective” in Tierney and Hagedorn’s Increasing Accessto College, and “Beyond Access: Increasing the Odds of College Success” (PhiDelta Kappan, May 2000). Swail also serves on a number of national advisorycommittees, including technical review panels for the major U.S. longitudi-nal and cross-sectional surveys sponsored by the U.S. Department of Educa-tion. Swail received his doctorate in educational policy from GeorgeWashington University.
Kenneth E. Redd is director of research and policy analysis for the NationalAssociation of Student Financial Aid Administrators in Washington, D.C. Heprovides research and data analysis on numerous issues in higher education,particularly in trends in the financing of undergraduate and graduate educa-tion, student enrollments, access, and degree completion. Before joiningNASFAA, Redd was director of higher education research for the USA GroupFoundation and served in research positions for the National Association forIndependent Colleges and Universities and the American Association of StateColleges and Universities. Redd is the author or coauthor of numerousresearch reports, book chapters, and journal articles on a wide variety of issuesin higher education.
Laura W. Perna is an assistant professor in the Department of Education Pol-icy and Leadership at the University of Maryland. Her research focuses onpolicies and practices related to college access and choice as well as equityin faculty reward systems. Findings of her research have been published innumerous journals and edited books. She has received funding for her researchfrom the Lumina Foundation for Education, the Association for InstitutionalResearch, and the American Educational Research Association.
The Educational Policy Institute, Inc., is a nonprofit, nonpartisan, and non-governmental organization dedicated to policy-based research on educational
ash302bio.qxp 6/22/04 11:05 AM Page 173
opportunity for all students. With offices in Washington, D.C., Los Angeles,and Toronto, EPI is a collective association of researchers and policy analystsfrom around the world dedicated to the mission of enhancing our knowledgeof critical barriers facing students and families throughout the educationalpipeline. In addition, EPI has developed extensive partnerships and collabo-rative arrangements with other leading research and educational organizations,further supporting its mission and ability to conduct policy-relevant researchfor practical use.
The mission of EPI is to expand educational opportunity for low-incomeand other historically underrepresented students through high-levelresearch and analysis. By providing educational leaders and policymakerswith the information required to make prudent programmatic and policy deci-sions, the doors of opportunity can be further opened for all students, result-ing in an increase in the number of students prepared for, enrolled in, andcompleting postsecondary education.
For more information about EPI, please visit our Web site,http://www.educationalpolicy.org.
174
ash302bio.qxp 6/22/04 11:05 AM Page 174
Name Index
AAbel, R., 159Adamany, D., 135Adelman, C., 10, 12, 27, 51, 54–56,
99, 145Ajzen, I., 48Alexander, K. L., 12Allen, D., 44Alwin, W. F., 12Amdahl, G., 113Ancis, J. R., 59Anderson, B. T., 56Anderson, E., 50, 75, 76, 78Arendale, D. R., 150Arrington, P. G., 60Astin, A. W., 51, 55, 61–67, 92, 94–96,
109, 113
BBakst, D., 34, 35Ball, S. R., 59, 60Beal, P. E., 43, 65, 100Bean, J. P., 7, 8, 46–48, 50, 55, 70, 75,
78, 148Bean, L., 35Beil, C., 62, 145, 146Bell, C., 9Benin, M., 61, 62Bennett, C., 59, 146Bentler, P. M., 448Berg, J. H., 64Berkner, L., 12, 13, 18, 20, 26, 27Berman, D., 139
Berryman, S. E., 55Birk, N. A., 135Black, L. C., 0, 59Blanchette, C. M., 72Borman, G. D., 51Bowen, H. R., 28, 30Bramlett, D., 137Brandt-Williams, A., 61, 62Braxton, J. M., 12, 49Brinkman, P. T., 28Brower, A. M., 44, 46Brunner, B., 33, 34Burkam, K. R., 12Bush, G. W., 52
CCabrera, A. F., 12, 43, 44, 48, 61, 62,
70, 157Capella, B., 64Carpenter, L. C., 51Castaneda, M. B., 43, 44, 48, 61, 62, 70Cataldi, E. F., 18, 26, 27Chanault, K., 36Chavez, L., 12, 13, 18, 20, 26Chavis, O. D., 136Cheatham, H. E., 109Chickering, A. W., 66, 67, 109Christman, D. E., 68Clayton, M., rClewell, B., 114Clyde, P., 143Cohen, R., 35, 36Collison, M., 94
175Retaining Minority Students in Higher Education

Coopersmith, G., 12Cope, R., 43, 96Couch, R., 137Creedon, C. F., 43, 62, 64, 66, 67, 71,
86, 109Cunningham, A. F., 69
DDavies, G., 4de los Santos, A.G.J., 51, 61Dickerson, R. C., 123, 124Dintino, M., 144Dreisback, M., 99DuBrock, C. P., 71Durkheim, E., 43, 63Duster, T., 49
EEaton, S. B., 46–48Ekstrom, R. B., 72Elam, J. C., 98Endo, J., 65Epps, A. C., 55, 56
FFath, K. Q., 132Feagin, J. R., 59, 60Federico, A., 159Fenske, R. H., 71Fernandez, Y. M., 46Fetters, W. B., 71Ficklen, M., 114Finkelstein, J., 139Fishbein, M., 48Fiske, E. B., 51, 60Flannery, J., 114Flores, M., 38Forrest, A. K., 100Franklin, J., 66Fullilove, R. E., 55, 56, 105, 106
GGardner, H., 78Gehring, D. D., 60Gennep, A. van, 46, 49, 79
Gladieux, L. E., 2, 6, 7, 10, 68, 146Gonzalez, K. P., 59, 146, 147Gratz, J., 35Gregerman, S. R., 152Griffen, O. T., 63–65, 100Grutter, B., 35, 41Guido-DiBrito, F., 154Guiner, L., 52, 87, 99
HHall, C., 51, 58, 147, 148Halpern, D., 56Hamacher, P., 35Hannah, W., 43, 96Harpel, R., 65Harrell, S. P., 57He, S., 18, 26, 27Heller, D. E., 41, 69–71Hengstler, D., 44, 48, 70Hentoff, N., 35Hetzler, J., 64Himelhoch, C. R., 59, 60, 148Hladio, P., 123, 124Holmes, B., 137Holupka, S., 12Hopwood, C., 35Horn, L. J., 12, 13, 72, 73, 95, 148Hossler, D., 12, 49House, J. D., 149Hyman, A. K., 101
JJalomo, R., Jr., 49, 79Jencks, C., 52, 99Johnson, L. B., 9, 33Just, H. D., 59, 149Justiz, M., 66, 107, 109
KKalechstein, P., 99Kanter, R. M., 115Kehrhahn, M. T., 62Kelly, L., 140Kennedy, J. F., 33Kennedy, P. W., 62, 149, 150
176
Keogh, B. K., 99King, J. E., 68, 73Kirshstein, J. R., 51, 71, 72Knepper, P., 18, 20, 27Kojaku, L., 12, 13Krop, R. A., 6Kuhs, T. M., 107
LLa Nasa, S. M., 12, 43Lacey, I., 132Lane, C., viii, 32, 36Lenning, O. T., 43, 50Leslie, L. L., 28Levey, R. A., 32Levine, A., 9, 11Levitze, R. S., 91, 113Lien, L. A., 49Lippitt, R., 91, 115, 116Liu, E., 59Liu, R., 59Lum, L., 34, 35Lynch, M. W., 35
MMacKenzie, C., 64, 135Malcom, S. M., 64Maring, C., 46Martin, A.D.J., 113Martin, D. C., 150Massey, W., 142Matyas, M. L., 64Maw, C., 72, 73McDermott, L. C., 55McKay, M., 136McPherson, M. S., 28Mendoza, C., 138Merisotis, J., 39, 40Metzner, B. S., 70Mohr, J. J., 59Moline, A. E., 71Moore, W. J., 51Mortenson, T. G., 5, 37, 68, 70, 72,
150, 151Mumper, M., 70
Murdock, T., 71, 151Murphy, S. J., 132Myers, H. F., 57, 155Myers, K. A., 135
NNagda, B. A., 152Neisler, O. J., 107Nettles, M. T., 18Nichols, A., 59, 60, 148Nidiffer, J., 9, 11Nixon, R. M., 9, 10Noel, L., 51, 65, 71, 72, 91, 100, 113Nora, A., 43, 44, 48, 49, 61, 62, 70, 79
OO’Brien, C. T., 39, 40, 69Okinaka, A. M., 59, 146Okun, M., 61, 62Olivas, M. A., 70, 72O’Neal, E. S., 36Otto, L. B., 12
PPallas, A. M., 12Palmer, C. J., 60Pantages, T. J., 43, 62, 64, 66, 67,
86, 109Parker, C. E., 51Parsons, R., 36Pascarella, E. T., 27, 38, 63, 65–67, 72,
109, 150Paulsen, M. B., 70, 154, 155Pavel, D. M., 153Peng, S. S., 71Penney, S. W., 60Peplau, L. A., 64Perna, L. W., 12, 18, 71, 100, 157Peterson, S. L., 46Phillips, M., 52, 99Pine, J. T., 34, 35, 37Piternick, L. K., 55Porter, J. D., 71Porter, O. F., 51Powell, C., 36
177Retaining Minority Students in Higher Education

Powell, L. F., 34Prieto, D. O., 99
RRachuba, L., 51Rasmussen, C. J., 41Read, K., 131Redd, K. E., 31, 33, 35, 39, 69, 120, 122,
153, 154Reindl, T., 69Reisberg, L., 31, 33Rendón, L. I., 49, 54, 79Resien, C. A., 62, 145, 146Reske, M., 131Reyes, N., 58Rice, C., 36Richardson, E. S., 122, 123Richardson, R.C.J., 51, 61, 109Rivera, T., 134Rodarmor, W., 49, 50Rodriguez, A. L., 154Rootman, I., 63Rosenquist, M., 55Ross, T., 124Russell, R. B., 155, 156Ryan, J. M., 107Rydell, C. P., 6
SSain, J., 123Saluri, D., 91Sauer, K., 43Schmidt, J., 12Scott, J. A., 120, 122Sedlacek, W. E., 58, 59, 99Selingo, J., 37, 38Shanley, J., 123Sheckley, B. G., 62, 149, 150Sikes, M. P., 59, 60Simmons, H. L., 51, 61Simmons, R., 36Skinner, E. F., 51, 61Skinner, R. R., 153Smedley, B. D., 57, 155Smith, L., 91, 115, 116
Spady, W. G., 43, 44, 63, 65, 80Spatz, M. A., 134Speckart, G., 48Sprandel, D., 91, 115, 116Springer, L., 157, 158St. John, E. P., 12, 51, 70–72, 154, 155Stage, F. K., 46Stanley, M. G., 139Starkey, J. B., 70Steele, C., 52, 99Steinmiller, G., 109Steinmiller, R., 109Stewart, G. L., 155, 156Strage, A. A., 156Stringfield, S., 51Swail, W. S., 2–4, 6, 59, 68, 76, 89, 91,
100, 101, 146, 156, 157
TTaylor, J., 123Terenzini, P. T., 27, 38, 63–65, 148,
150, 157Thayer, P., 68, 158Thomas, G. E., 94Thomas, T., 144Tierney, W. G., 43, 49Tinto, V., 1, 10, 11, 43–46, 48, 49, 51,
61–65, 75, 76, 78–80, 86, 88, 91,92, 96, 107, 111, 113, 114, 150,158, 159
Tobias, S., 102Tracey, T. J., 58Treisman, P. U., 55, 56, 105, 106Trippi, J., 109
UUgbah, S., 65, 100
VValentine, C. A., 49, 79van Gennep. See Gennep, A. vanVanEarden, K., 46Vernez, G., 6Vesper, N., 12Volle, K., 159
178
WWallace, D., 159Wallace, K. M., 135Watson, M., 141Whimbey, A., 101Whitlock, E. R., 46Wilhem, T. J., 135Williams, P., 35Williams, S. A., 35, 65, 100Witten, C. H., 139
Wolanin, T., 10Wright, T. M., 63, 64Wu, Z., 70, 72
YYoung, J., 136
ZZea, M. C., 62
179Retaining Minority Students in Higher Education

Subject Index
AAASCU/Sallie Mae National Retention
Project, 120, 122Academic advising, 100–103Academic preparation, 51–57, 127
and commitment to educational goalsand institution, 61–63
campus climate and, 57–61and course selection and integrity,
55–57financial aid and, 67–68and National Assessment of
Educational Progress (NAEP),53–54
recent financial aid policydevelopments and, 68–70
SAT comparison and, 52–53social and academic integration
and, 63–67Academic services component, 100–103,
101fig.25Access, 9–11Accessibility, 107, 108ACT, 52, 132, 149, 150Advisory Committee on Student
Financial Assistance, 68Affirmative Action
brief history of, in higher education,33–34
and challenges to Bakke standard,34–36
direction of, 40–41and expanded role for
minority-serving institutions,38–40
in future, 32–33and “X percent” solution, 36–38
Affordability, 127American Council on Education, 69, 70American River College
(Sacramento, CA), 131Application process, 94Arizona, 152Arkansas State University, 143, 144Assessment methods, alternative, 99, 105Assessment strategies, 104, 107Association for Institutional
Research, 147Association for International
Research, 149Association for the Study of Higher
Education, 146, 148Association of Medical Colleges, 55, 56Attrition theories, 75
BBachelor’s degree
and access to advanced degrees andcareers, 30–31
attainment rates, 26–27and benefits to society, 29–30and differences in economic benefits,
27–29and distribution of enrollments and
degree recipients by race orethnicity, 25
181Retaining Minority Students in Higher Education
Bachelor’s degree (Continued )and importance of raising completion
rates, 27–31persistence in college to completion of,
21–30Bakke, Regents of the University of California
v., 34–36Basic Educational Opportunity Grant
(BEOG), 9Beacon Program, 131Beginning Postsecondary Student Survey
(National Center for EducationStatistics), 26
Biculturation, 50, 79Board of Education of Topeka, Brown v., 36Board of Regents of the University of Georgia,
Johnson v., 35Bollinger, Gratz v., 32Bollinger, Grutter v., 32, 38, 39, 41Bowie State University (Bowie, MD), 142Bridging programs, 101–103Bronx Community College, 138, 139Brown v. Board of Education of Topeka, 36Building Community Model Program
(University of Colorado–Boulder), 141
CCalifornia, 2, 35, 37, 38, 52
Proposition 209, 35California Community Colleges Board
of Governors, 131Campus climate, 57–61, 107, 108Career counseling, 108, 110Carnegie Classification system, 37Chief administrator, 123Chief executive officer, 122Civil Rights Act of 1964, 9College Board, 7, 8, 41, 52–54, 68, 69, 98,
127, 146College degree, growing importance
of, 4College employment, 72College enrollment
full-time, by race or ethnicity accordingto institution type and control,22–24
and percentage of traditional college-agepopulation, 15–17
and postsecondary enrollment withintwo years of graduation, 18–20
and racial and ethnic composition ofcollege attended, 20–21
and representation amongundergraduate enrollments, 17–18
College Student Journal, 156Colorado, 38Committee on Equal Employment
Opportunity, 33Communication age, 105Corporate universities, 10Cost, 127Course selection, 55–57Cross-university retention task
force, 125Culture, shared, 107Current Population Survey (2000), 28Curriculum and instruction component,
103–107, 104fig.26major objectives of, 106–107
Curriculum review and revision,104, 106
DDecision-making process, students, 78Delphi technique, 90Digest of Education Statistics (NCES), 15,
25, 16Distance education, 10, 127Diverse instruction, 103Diversity, 107, 109Dual competency, 49
EEmerging Scholars Program (University of
California–Berkeley), 105–106Equal Employment Opportunity
Commission, 33Equilibrium, 80–84
models of, 83fig.20Ethnic minorities, education pipeline for,
11–31
182
Excel Programat Wayne State University, 134, 135at West Virginia University, 141
Executive Order 10925 (Kennedy), 33
FFaculty
development and resources, 104,106, 126
reward systems, 126informal contact of, with student
103, 110Fayetteville State University
(Fayetteville, NC), 135Financial aid, 67–68
availability of need-based, 95–96office, 123, 124packaging of, 96and persistence, 70–71recent policy developments in, 68–70
Financial counseling, 95First-year Learning Team (FLighT) Program
(Southeast Missouri State University), 135Flexible planning, 126Florida, 2, 35, 37Force field analysis of college persistence
(Anderson), 50fig.15, 76Fort Peck Community College
(Poplar, MT), 123Free Application for Federal Student Aid
(FAFSA), 94Freshman Year Initiative Program
at Bronx Community College, 138, 139at Fayetteville State University, 136
Funding priorities, 126
GGatekeeping, 98
and gatekeeper courses, 56GEARUP (Gaining Early Awareness and
Readiness for Undergraduate Programs),102
G.I. Bill (Serviceman’s Readjustment Actof 1944), 9
Glendale Community College(Glendale, AZ), 138
Goal commitment, 61, 62, 78Grade point averages (GPA), 64, 87,
98, 141Grants, 95
versus loans, 71–73Gratz v. Bollinger, 32Group collaborative approach, 105–106Grutter v. Bollinger, 32, 33, 38, 39, 41
HHands-on approach, 105–106HBCUs (Historically Black Colleges and
Universities), 11, 21–24, 32, 33, 38–40,58, 59, 64, 66, 148
High School and Beyond database, 55,72, 145
Higher Education Act (1965), 2, 9, 10Hope Scholarship Tax Credit, 69Hopwood v. Texas, 34, 35Housing, 108, 110HSIs (Hispanic-Serving Institutions),
21, 22, 24, 32, 33, 39, 40
IIncome, median annual household,by educational attainment of
householder, 5Incorporation stage, 46Indiana University, 146Indiana Wesleyan University
(Marion, IN), 140Information
dissemination of, 95lack of, 94
Institute for Higher Education Policy, 67Institutional change, process of, 116Institutional commitment, 61, 62Institutional leadership, 125Instructional practices, 106Instructional strategies, 104Integrated Postsecondary Education
21, 20Integrated Postsecondary Education Data
System (IPEDS)1997 Fall Staff Survey, 661999 Fall Enrollment Survey, 20
183Retaining Minority Students in Higher Education
Integration, student. See Studentintegration
Integrity, 55–57
JJohnson v. Board of Regents of the University
of Georgia, 35Journal of Higher Education, 155Journal of Psychology, 148
KKeene State University (Keene, NH), 144
LLeadership
importance of, on student retention,120–125
institutional, 125Level playing field, 34Lewis-Clark State College (Lewiston, ID),
142, 143Lifetime Learning Tax Credit, 69Loans, grants versus, 71–73Long Beach City College (Long Beach, CA),
137, 138Loyola University (New Orleans), 136Lubin House (Syracuse University), 98
MMathematics Workshop Program
(University of California–Berkeley),64–65
Medicaid, 6, 28, 30Medicare, 6Mentoring, 101, 102Merrill Lynch, 36MESA (Mathematics, Engineering, and
Science Achievement), 102Michigan, 38Minorities
and academic preparation for college,12–13
and enrollment in college, 15–21and graduation from high school, 13–15
and persistence in college toand bachelor’s degree completion, 21
Missouri, 38Model Institutions for Excellence (MIE)
Program (Bowie State University), 142Morgan State University
(Baltimore, MD), 122Morrill Act (1862), 11Morrill Act II (1892), 11MSEN (Mathematics and Science
Education Network), 102Multiculturalism, 109Multiple intelligence theory (Gardner),
78n3, 87
NNational Aeronautics and Space
Administration, 142National Assessment of Educational
Progress (NAEP), 53–55National Association of State Student Grant
and Aid Programs, 41, 52–53National Association of Student Financial
Aid Administrators (ASFAA), 95n7National Center for Educational Statistics
(NCES), 25, 26, 31, 37, 40, 54,95, 148
National Collegiate Athletic Association(NCAA), 39
National Commission on the Cost ofHigher Education, 94n.5
National Educational LongitudinalStudy (NELS:1992), 12, 54
National Educational Longitudinal Study(NELS:1988), 18
National Postsecondary EducationCooperative, 10
National Postsecondary Student AidStudy, 148
National Press Club, 8National Resource Center for the First-Year
Experience and Students inTransition, 139
National Science Foundation, 142Native American Higher Education
Consortium, 152
184
NCES. See National Center for EducationalStatistics (NCES)
NELS. See National EducationalLongitudinal Study
New Mexico, 152Northern Illinois University, 137
OOffice of Retention Programs (Northern
Illinois University), 137Oglala Lakota College (South Dakota), 142Ohio University at Athens, 65Oklahoma, 152“One Florida” plan, 35Opportunity Outlook, 158Orientation
freshman, 99–100on-campus living, 99
PParental support, 78Peer support, 78Pell Grant, 2, 9, 69, 70, 153, 154Persistence, student. See Student persistencePhi Delta Kappan, 146Plantation economics, 151Pluralism, 107Postsecondary Education Opportunity,
150, 151Postsecondary opportunity
and Affirmative Action in America,31–41
and education pipeline for racial andethnic minorities, 11–31
and growing importance of collegedegree, 4–9
and moving from access to success,9–11
Pre-college programs, 98, 99, 101–103Preparedness, academic, 51–57Presidents, 122Princeton University, 92, 93Problem-solving ability, 78Professional development, 106Project SOAR (Xavier University), 64–65Proposition 209, 35, 127
Proprietary schools, 10Psychological model (Bean and Eaton),
46–48, 47fig.14shortcomings of, 48–50
PWIs (Predominantly White Institutions),57–61, 64, 66, 148, 152, 155, 156
QQuality Education for Minorities, 55
RRacial minorities, education pipeline for,
11–31RAND Corporation, 6Reciprocity, 81Regents of the University of California v.
Bakke, 34–36Research Assistants (RAs), 101Research in Higher Education, 154, 157Research
institutional, 126opportunities, 101, 102
Retention. See Student retention; Studentretention framework; Student retentionprogram, implementation of
Reverse discrimination, 35Review of Educational Research, 159Review of Higher Education, 158Rigorous coursework, 12n1Risk Point Intervention Program (University
of Texas, San Antonio), 133, 134Role models, 65–66
SSaint Xavier University (Chicago), 132Sallie Mae, 40, 120, 122SAT. See Scholastic Aptitude TestScheduling, flexible, 109, 110Scholastic Aptitude Test (SAT), 12, 37, 52,
69, 87, 98, 99Separation stage, 46Social anthropology theory, 46, 49, 79Socioeconomic status, 4, 5Southeast Missouri State University
(Cape Girardeau, MO), 135
185Retaining Minority Students in Higher Education
Southern Poverty Law Center, 59Spelman College (Georgia), 142Sponsored Student Program (William
Paterson College), 134Stafford Unsubsidized Loan program, 69Stanford University, 92, 93Stress, 79Structured Academic Year (STAY) Program
(West Virginia University), 140, 141Student and Teacher Achieving Results
(STAR) Program (Long Beach CityCollege), 137, 138
Student Financial Aid office (U.S.Department of Education), 94
Student integrationnew perspective on, 75–76Tinto’s model of, 43–46, 45fig.13,
48–50, 76, 150Student Pal Program (Glendale
Community College), 138Student persistence
and achieving equilibrium, 80–84as chronological metric, 84–86cognitive factors affecting, 78and financial aid, 70–71geometrical model of, 76fig.17, 77–79geometrical model of, in practice, 79–88institutional factors affecting, 79and practical implications of geometric
model of, 86–88in practice, 79–88by race or ethnicity and grants versus
loans, 71–73social factors affecting, 78–79three forces affecting, and achievement,
77–79Student progression, models of
and Anderson’s force field analysis,50fig.15, 76
and Bean and Eaton’s psychologicalmodel, 43–46, 75, 78, 148
shortcomings of, 48–50and Tinto’s student integration model,
43–46Student retention
and academic preparedness, 51–57and campus climate, 57–61
and commitment to educational goalsand institution, 61–63
and course selection and integrity,55–57
factors related to, 51–73and financial aid, 67–68and National Assessment of Educational
Process (NAEP), 53–54and SAT comparison, 52–53and social and academic integration,
63–67Student retention framework
academic services component of,100–103
campus-wide, 88–90curriculum and instruction component
of, 103–107financial aid component of, 92–96five components of, 91fig.22genesis of, 89–90and monitoring students’ progress,
110–112purpose of, 88–90recruitment and admissions component
of, 96–100research base of, 90–92student services component of, 107–110
Student retention programimplementation ofand campus-wide programs, 116–120importance of leadership in, 120–125lack of presidential engagement in,
123–124organizational considerations for,
114–116planning stage in, 119policy questions in, 124–125preplanning stage in, 118–119and program monitoring, 120and timing, 120, 121Tinto’s action principles for, 114–115
Student services component, 108–110,108fig.27major objectives of, 109–110
Student Success Program (Saint XavierUniversity), 132
Student Support Services, 9
186
Success, moving from access to, 9Suicide, Durkheim’s theory of, 63Summer Bridge Program (University of
California–San Diego), 64–65Supplemental Instruction: Increasing
Achievement and Retention Martin andArendale), 150
Supplementary instruction, 100–101Syracuse University, 98
TTalent Search, 9Taxpayer Relief Act (1997), 69Teaching assistants (TAs), 101Technology, 127, 128Texas, 2, 37Texas A&M University, 38Texas, Hopwood v., 34Tolerance.org, 59Transition stage, 46Transportation, 108Trends in College Pricing (College Board), 8Tribal colleges, 152, 153TRIO programs, 9, 102, 132, 142–144Tutoring, 101, 102
UUnited States Census Bureau, 4, 5, 67United States Department of Education,
12, 16, 17, 26, 37, 39, 40, 54, 57, 67,68, 94, 96, 148, 150, 153, 154Student Financial Aid office, 94
United States Eleventh Circuit Court ofAppeals (Georgia), 35
United States Fifth Circuit Court of Appeals(Louisiana and Mississippi), 34, 35
United States General Accounting Office,92, 96
United States Supreme Court, 32–34Universidad Metropolitana (Puerto Rico),
142University of Alabama–Tuscaloosa, 143University of California, 37, 49, 52
at Berkeley, 64at San Diego, 64–65
University of Colorado–Boulder, 141University of Georgia, 35University of Michigan, 32Law School, 35
Undergraduate Research OpportunityProgram, 152
University of Missouri–Kansas City,100, 150
University of South Carolina–Columbia,139, 140
University of Texasat Austin, 38Board of Regents, 38at El Paso, 142Law School, 35at San Antonio, 133, 134
Upward Bound Program, 9at Arkansas State University, 143–144
Urban Review, 146
VVeterans Upward Bound, 159Virtual university, 127Visitations, school, 99
WWar on Poverty, 2, 9Washington, DC, 8Washington (state), 35, 38Wayne State University (Detroit),
134, 135West Virginia University, Morgantown, 141WICHE, 40William Paterson College
(Wayne, NJ), 134World War II, 9Writing Across the Curriculum Program
(WAC; Loyola University), 136
XXavier University of Louisiana, 142
Project SOAR, 64–65
YYale University, 93n4
187Retaining Minority Students in Higher Education

Retaining Minority Students in Higher Education
About the ASHE-ERICHigher Education Reports Series
Since 1983, the ASHE-ERIC Higher Education Report Series has been pro-viding researchers, scholars, and practitioners with timely and substantiveinformation on the critical issues facing higher education. Each monographpresents a definitive analysis of a higher education problem or issue, basedon a thorough synthesis of significant literature and institutional experiences.Topics range from planning to diversity and multiculturalism, to performanceindicators, to curricular innovations. The mission of the Series is to link thebest of higher education research and practice to inform decision making andpolicy. The reports connect conventional wisdom with research and aredesigned to help busy individuals keep up with the higher education litera-ture. Authors are scholars and practitioners in the academic community. Eachreport includes an executive summary, review of the pertinent literature,descriptions of effective educational practices, and a summary of key issuesto keep in mind to improve educational policies and practice.
The Series is one of the most peer reviewed in higher education. ANational Advisory Board made up of ASHE members reviews proposals.A National Review Board of ASHE scholars and practitioners reviews completedmanuscripts. Six monographs are published each year and they are approximately120 pages in length. The reports are widely disseminated through Jossey-Bass andJohn Wiley & Sons, and they are available online to subscribing institutionsthrough Wiley InterScience (http://www.interscience.wiley.com).
Call for ProposalsThe ASHE-ERIC Higher Education Report Series is actively looking forproposals. We encourage you to contact the editor, Dr. Adrianna Kezar, [email protected] with your ideas. For detailed information about the Series,please visit http://www.eriche.org/publications/writing.html.
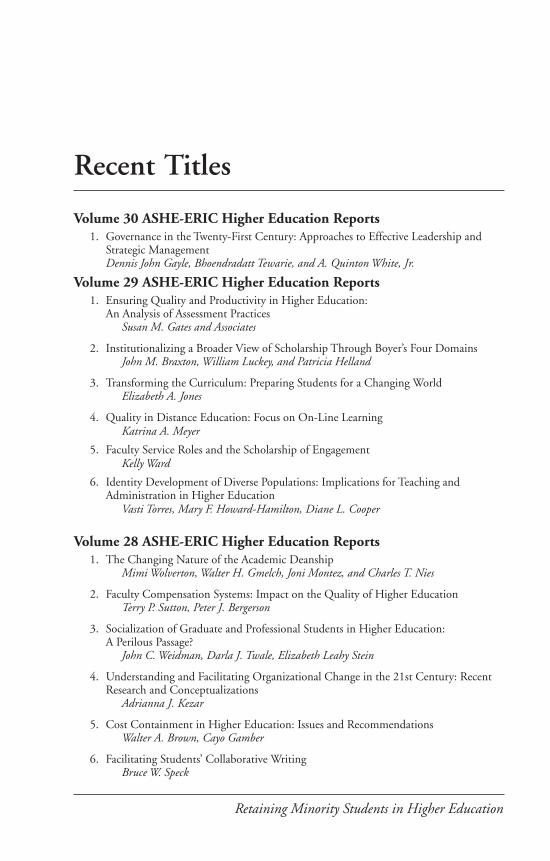
Retaining Minority Students in Higher Education
Recent Titles
Volume 30 ASHE-ERIC Higher Education Reports1. Governance in the Twenty-First Century: Approaches to Effective Leadership and
Strategic ManagementDennis John Gayle, Bhoendradatt Tewarie, and A. Quinton White, Jr.
Volume 29 ASHE-ERIC Higher Education Reports1. Ensuring Quality and Productivity in Higher Education:
An Analysis of Assessment PracticesSusan M. Gates and Associates
2. Institutionalizing a Broader View of Scholarship Through Boyer’s Four DomainsJohn M. Braxton, William Luckey, and Patricia Helland
3. Transforming the Curriculum: Preparing Students for a Changing WorldElizabeth A. Jones
4. Quality in Distance Education: Focus on On-Line LearningKatrina A. Meyer
5. Faculty Service Roles and the Scholarship of EngagementKelly Ward
6. Identity Development of Diverse Populations: Implications for Teaching andAdministration in Higher Education
Vasti Torres, Mary F. Howard-Hamilton, Diane L. Cooper
Volume 28 ASHE-ERIC Higher Education Reports1. The Changing Nature of the Academic Deanship
Mimi Wolverton, Walter H. Gmelch, Joni Montez, and Charles T. Nies
2. Faculty Compensation Systems: Impact on the Quality of Higher EducationTerry P. Sutton, Peter J. Bergerson
3. Socialization of Graduate and Professional Students in Higher Education:A Perilous Passage?
John C. Weidman, Darla J. Twale, Elizabeth Leahy Stein
4. Understanding and Facilitating Organizational Change in the 21st Century: RecentResearch and Conceptualizations
Adrianna J. Kezar
5. Cost Containment in Higher Education: Issues and RecommendationsWalter A. Brown, Cayo Gamber
6. Facilitating Students’ Collaborative WritingBruce W. Speck