results presentation fy 2016/17 - ceconomy startseite · pdf file(including all slides of this...
TRANSCRIPT

Results Presentation FY 2016/17
Dusseldorf, 19 December 2017
// 2 Date: 19 Dec 2017
the actions of public authorities and other third parties, many of which are beyond our control, that could cause actual results, performance or financial position to differ materially from any future results, performance or financial position expressed or implied in this presentation. Accordingly, no representation or warranty (express or implied) is given that such forward-looking statements, including the underlying estimates, expectations and assumptions, are correct or complete. Readers are cautioned not to place reliance on these forward-looking statements. See also "Risk and Opportunity Report" in CECONOMY's most recent Annual Report for risks as of the date of such Annual Report. We do not undertake any obligation to publicly update any forward-looking statements or to conform them to events or circumstances after the date of this presentation. This presentation is intended for information only, does not constitute a prospectus or similar document and should not be treated as investment advice. It is not intended as an offer for sale, or as a solicitation of an offer to purchase or subscribe to, any securities in any jurisdiction. Neither this presentation nor anything contained therein shall form the basis of, or be relied upon in connection with, any commitment or contract whatsoever. CECONOMY AG assumes no liability for any claim which may arise from the reproduction, distribution or publication of the presentation (in whole or in part). The third parties whose data is cited in this presentation are neither registered broker-dealers nor financial advisors and the permitted use of any data does not constitute financial advice or recommendations. Historical financial information contained in this presentation is mostly based on or derived from the consolidated (interim) financial statements for the respective period. Financial information with respect to the business of MediaMarktSaturn Retail Group is particularly based on or derived from the segment reporting contained in these financial statements.
Such financial information is not necessarily indicative for the operational results, the financial position and/or the cash flow of the CECONOMY business on a stand-alone basis neither in the past nor in the future and may, in particular, deviate from any historical financial information based on corresponding combined financial statements with respect to the CECONOMY business. Given the aforementioned uncertainties, (prospective) investors are cautioned not to place undue reliance on any of this information. No representation or warranty is given and no liability is assumed by CECONOMY AG, express or implied, as to the accuracy, correctness or completeness of the information contained in this presentation. This presentation contains certain supplemental financial or operative measures that are not calculated in accordance with IFRS and are therefore considered as non-IFRS measures. We believe that such non-IFRS measures used, when considered in conjunction with (but not in lieu of) other measures that are computed in accordance with IFRS, enhance the understanding of our business, results of operations, financial position or cash flows. There are, however, material limitations associated with the use of non-IFRS measures including (without limitation) the limitations inherent in the determination of relevant adjustments. The non-IFRS measures used by us may differ from, and not be comparable to, similarly-titled measures used by other companies. Detail information on this topic can be found in CECONOMY’s Annual Report 2016/17, pages 49-52. All numbers shown are before special items, unless otherwise stated. All amounts are stated in million euros (€ million) unless otherwise indicated. Amounts below €0.5 million are rounded and reported as 0. Rounding differences may occur.
This disclaimer shall apply in all respects to the entire presentation (including all slides of this document), the oral presentation of the slides by representatives of CECONOMY AG, any question-and-answer session that follows the oral presentation, hard copies of the slides as well as any additional materials distributed at, or in connection with this presentation. By attending the meeting (or conference call or video conference) at which the presentation is made, or by reading the written materials included in the presentation, you (i) acknowledge and agree to all of the following restrictions and undertakings, and (ii) acknowledge and confirm that you understand the legal and regulatory sanctions attached to the misuse, disclosure or improper circulation of the presentation. To the extent that statements in this presentation do not relate to historical or current facts, they constitute forward-looking statements. All forward-looking statements herein are based on certain estimates, expectations and assumptions at the time of publication of this presentation and there can be no assurance that these estimates, expectations and assumptions are or will prove to be accurate. Furthermore, the forward-looking statements are subject to risks and uncertainties including (without limitation) future market and economic conditions, the behaviour of other market participants, investments in innovative sales formats, expansion in online and multichannel sales activities, integration of acquired businesses and achievement of anticipated cost savings and productivity gains, and
DISCLAIMER AND NOTES
Public Results Presentation FY 2016/17
// 3 Date: 19 Dec 2017
Overview
Public Results Presentation FY 2016/17
Highlights
01 02 03 Performance
Outlook

// 4 Date: 19 Dec 2017
Highlights 01
Pieter Haas, CEO

// 5 Date: 19 Dec 2017 Public
Sales1
CECONOMY achieved all targets in FY 2016/17
FY 2015/16 Outlook (fx-adjusted)
€m
Total sales
Investments 1
LfL sales growth
EBIT before special items
21,870 Slight increase
+0.1% Slight increase
466 Slight increase
406 300 – 350
Results Presentation FY 2016/17
Achieved
Pay-out ratio (in % of EPS) n.a. 45 – 55%
FY 2016/17 (fx-adjusted)
+1.4%
+1.9%
+10
319
45%
1 Investments according to the segment report.
// 6 Date: 19 Dec 2017
+1.3%
FY 16/17
22,155
FY 15/16
21,870
-15
FY 16/17
704
FY 15/16
719
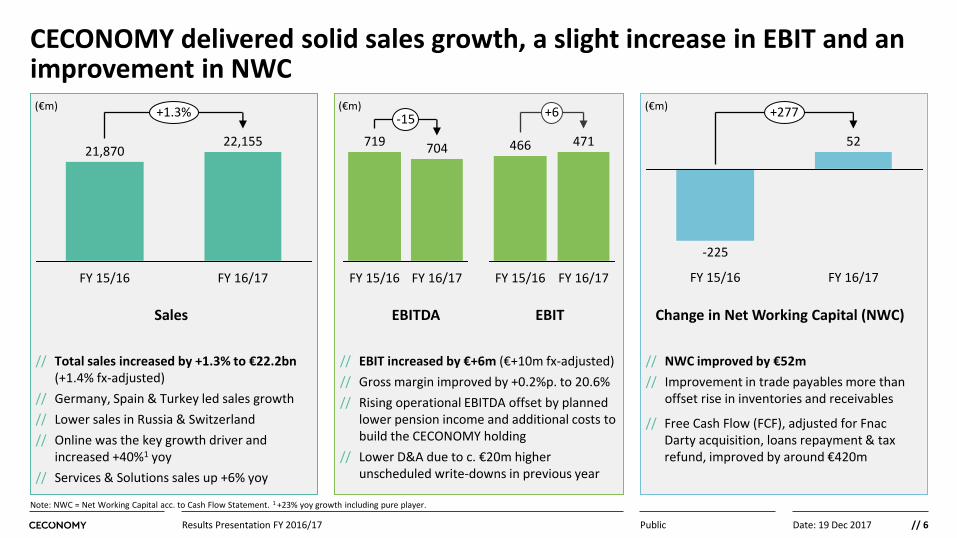
CECONOMY delivered solid sales growth, a slight increase in EBIT and an improvement in NWC (€m) (€m)
Sales
// Total sales increased by +1.3% to €22.2bn
(+1.4% fx-adjusted)
// Germany, Spain & Turkey led sales growth
// Lower sales in Russia & Switzerland
// Online was the key growth driver and increased +40%1 yoy
// Services & Solutions sales up +6% yoy
EBITDA EBIT
// EBIT increased by €+6m (€+10m fx-adjusted)
// Gross margin improved by +0.2%p. to 20.6%
// Rising operational EBITDA offset by planned lower pension income and additional costs to build the CECONOMY holding
// Lower D&A due to c. €20m higher unscheduled write-downs in previous year
Public Results Presentation FY 2016/17
466 471
FY 15/16
+6
FY 16/17
Change in Net Working Capital (NWC)
// NWC improved by €52m
// Improvement in trade payables more than offset rise in inventories and receivables
// Free Cash Flow (FCF), adjusted for Fnac Darty acquisition, loans repayment & tax refund, improved by around €420m
FY 16/17
-225
52
+277
FY 15/16
(€m)
Note: NWC = Net Working Capital acc. to Cash Flow Statement. 1 +23% yoy growth including pure player.

// 7 Date: 19 Dec 2017
Online/mobile sales > €2.4bn
Roll-out of smart bars and at home service via RTS and DTB
Opening of Shop-in-Shop Solutions in Belgium, Hungary and Russia
Largest shareholder of Fnac Darty following acquisition of our c. 24% stake
Successful turnaround to profitability in Turkey; restructuring of redcoon completed
>6m customer contacts daily; customer programmes with >14.5m members internationally
Public Results Presentation FY 2016/17
Strategic highlights in FY 2016/17
@

// 8 Date: 19 Dec 2017
CECONOMY was rewarded across all value drivers
Online/Mobile/Store // MediaMarkt -
Germany‘s best retailers (DE)
// MediaMarkt.de -
Germany’s best online retailers (DE)
Services & Solutions // Customer Service
Excellence Award – MAPIC (ES)
// Champions of Service
(IT)
Customer Data/CRM // E-Mail-Award 2017:
GOLD “Europe‘s first behavioural-based customer program. In real-time“ (AT)
Digital & technology leadership // MediaMarkt Germany-
“No. 3 in L2’s Digital IQ Index ranking: Retail Europe 2017“ (DE)
People transformation // Top Employer 2017
(AT) // HR Ambassador Award
(BE)
Public Results Presentation FY 2016/17

// 9 Date: 19 Dec 2017
Performance 02
Mark Frese, CFO

// 10 Date: 19 Dec 2017
Improved sales growth rates, primarily driven by DACH region
Total and LfL Sales Development (yoy change)
Q4 16/17
5.8% 4.6%
Q4 15/16
-2.0% -1.0%
Total sales growth in Q4 16/17 by segment (yoy change)
W. & S. Europe
6.3%
Others E. Europe
7.2%
-26.4%
-2.9%
DACH
Public Results Presentation FY 2016/17
Total LfL
FY 15/16 FY 16/17
1.3%
1.9%
0.1%
0.6%
// Strong sales growth in Q4 2016/17, supported by a favourable comparison base and investments to strengthen our position in selected markets
// Sales also supported by new product launches in the mobile phone and entertainment segment
// Strong sales growth particularly in Germany and first signs of recovery in Switzerland in Q4 2016/17
// Spain, Italy and the Netherlands led in terms of sales growth in Western & Southern Europe in Q4 2016/17
// Further sales decline in Russia, offset by continued sales growth in Turkey on an fx-adjusted basis
// Lower ‘Others’ mainly driven by the closure of redcoon country operations
Highlights

// 11 Date: 19 Dec 2017
Online was the key growth driver and represented 11% of total sales
Online Sales (in €m)
Public Results Presentation FY 2016/17
+21%
Q4 16/17 Q4 15/16
466 565
+23%
FY 16/17 FY 15/16
1,952 2,407
Online Sales (% of total sales)
Q4 16/17 Q4 15/16
9.3% 10.7%
FY 16/17 FY 15/16
8.9%
10.9%
1 Online incl. pure player visits per day based on 365 days per year.
// Online generated sales of MediaMarkt and Saturn grew by +39% in Q4 2016/17 or +21% including pure player (e.g. redcoon), respectively
// Online now represents 10.9% of total sales vs. 8.9% one year ago
// Pick-up rate slightly higher at 44% in Q4; for the full-year, pick-up rate remained high at 42%
// Online assortment further expanded to c. 350k SKUs from c. 280k SKUs one year ago
// Daily website visits1 increased by +0.4m to 3.6m daily website visits in FY 2016/17
Highlights

// 12 Date: 19 Dec 2017
Services & Solutions Sales (in €m)
Public Results Presentation FY 2016/17
Services & Solutions Sales (% of total sales)
Rising demand for Services & Solutions, accounting for 6.2% of total sales
+16%
Q4 16/17 Q4 15/16
340 395
FY 16/17 FY 15/16
1,301 1,379
+6%
Q4 16/17 Q4 15/16
6.8% 7.5%
FY 15/16
6.0%
FY 16/17
6.2%
// Services & Solutions sales increased +16% year-on-year in Q4 2016/17, largely driven by mobile and financing services
// Over the last 12 months, Services & Solutions were up +6%, accounting for 6.2% of total sales vs. 6.0% one year ago
// Continued roll-out of service “smart bars” to now 642 stores (+77 stores in Q4 2016/17)
// At home consultation and installation service of Deutsche Technikberatung (DTB) now already offered at more than 200 stores in Germany
Highlights

// 13 Date: 19 Dec 2017
MediaMarkt Club and Saturn Card continue to grow strongly
Customer Programme Members Germany (in k)
Public Results Presentation FY 2016/17
Sept ’17
3,805
609
3,196
Jun ’17
3,028
265
2,763
Mar ’17
2,366
65
2,301
Dec ’16
1,813
32
1,781
Sept ’16
1,235
+662 +777
+553 +578
*Nov 16-Apr 17: Saturn Card pilot running with 14 pilot stores; nation-wide roll-out of Saturn Card on 29 May 2017.
Q4 16/17
25%
Q3 16/17
25%
Q2 16/17
23%
Q1 16/17
18%
Q4 15/16
16%
Sales Penetration MediaMarkt Club Germany
Saturn Card* MM Club
// Linear growth of MediaMarkt Club Germany continues with around 1m new members every 6 months, now counting 3.2m members 18 months after launch
// Successful launch of Saturn Card in Germany with more than 600k members after 4 months; Austria launched the Saturn Card in September
// All customer programmes counted more than 14.5m members in total internationally
// Our customer programmes also allowed us to focus our advertising budget, which helped to lower marketing spend in FY 2016/17
Highlights

// 14 Date: 19 Dec 2017
Continued reduction in average store size
Average size of stores (in sqm)
-3.4%
Sept ’17
2,811
Closures
c. 2,140
Openings
c. 1,600
Sept ’16
2,909
Public Results Presentation FY 2016/17
Number of stores
Sept ’17
1,053
Closures
-10 -1
-9
Openings
+40
13 27
Sept ’16
1,023
Q4 16/17 9M 16/17
// Selective store expansion continued with 13 openings and 1 closure in Q4 2016/17
// Average store size further reduced by -3.4% over the last 12 months to now 2,811sqm due to openings of smaller formats and store rightsizings
// Low to mid double-digit number of net openings in FY 2017/18 planned, excluding Shop-in-Shop solutions
// 84 additional Shop-in-Shop solutions in Russian METRO Cash & Carry stores opened in October and November 2017; in total, 89 Shop-in-Shop solutions now live in Russia
Highlights

// 15 Date: 19 Dec 2017
Solid increase in profitability in Q4 2016/17
Public Results Presentation FY 2016/17
EBITDA & EBIT (in €m)
+14
Q4 16/17
302
Q4 15/16
288
+37
Q4 16/17
244
Q4 15/16
207
Segment EBITDA (in €m)
Others
9 27
E. Europe
15
-2
W. & S. Europe
76 90
DACH
201 173
Q4 16/17 Q4 15/16
EBITDA EBIT
// Substantial improvement in gross margin of +0.8%p. to 22.6% in Q4 2016/17
// Considerable earnings uplift in Germany supported by additional later income
// Positive development in the Netherlands helped by sales and margin improvements, but not sufficient to compensate lower earnings in Italy
// Improvements in Eastern Europe mainly driven by stabilisation in Russia
// Decline in ‘Others’ due to planned lower pension income and additional expenses for the formation of a listed holding company
Highlights
Note: All figures before special items with the exception of sales and gross profit.

// 16 Date: 19 Dec 2017
Rising operational EBITDA offset by planned lower pension income and additional expenses for the formation of a listed holding company
Public Results Presentation FY 2016/17
EBITDA & EBIT (in €m)
-32
704
Pension income
2016/17
HQ costs
Operational EBITDA
2015/16
18
718
719
-21
705
35
EBITDA
Rising operational EBITDA offset by planned lower
pension income & additional HQ costs
D&A and EBIT
466
253
471
233
2015/16
719
2016/17
704
EBIT
D&A
Includes c. €20m higher unscheduled
write-downs
+6
+12

// 17 Date: 19 Dec 2017
Special items broadly in line with prior year
Public Results Presentation FY 2016/17
EBITDA special items Q4 16/17 (in €m)
EBITDA special items FY 16/17 (in €m)
Others
21 37
Restructuring
85
58
Portfolio
1 5
Total
107 100
FY 16/17 FY 15/16
Others
28 19
Restructuring
40 46
Portfolio
3 5
Total
71 70
Q4 16/17 Q4 15/16
// EBITDA special items were broadly flat in Q4 2016/17
// In FY 2016/17, EBITDA special items amounted to €107m, equivalent to a slight increase of €7m yoy
// Main items: restructuring in Russia, completed restructuring of redcoon and charges for a group-wide efficiency improvement programme
// D&A special items amounted to €31m in FY 2016/17 as a result of restructuring measures and impairments, mainly in Russia and Germany
// No further exceptional restructurings planned in FY 2017/18, but mid double-digit m€ cash flow impact from FY 2016/17 special items
Highlights

// 18 Date: 19 Dec 2017
€m FY 15/16 FY 16/17 Change
EBITDA 719 704 -15
margin (%) 3.3% 3.2% -0.1%p.
EBIT 466 471 +6
margin (%) 2.1% 2.1% 0.0%p.
Net financial result -22 -26 -4
Earnings before taxes 444 446 +2
Income taxes -217 -197 -20
Tax rate (in %) 48.8% 44.1% -4.7%p.
Profit or loss for the period 227 249 +22
Non-controlling interest 75 60 -15
Net income 152 189 +37
Number of shares (m) 326.8 326.8 0.0%
EPS from cont. operations (€) 0.47 0.58 +0.11
Significant improvement in EPS
Public Results Presentation FY 2016/17
Dividend proposal (€ per ord. sh.) n.a. 0.26 n.a.
Pay-out ratio (in % of EPS) n.a. 45% n.a.
Minor decline in net financial result due to unscheduled impairment on financial assets, while interest expenses were slightly reduced
Income taxes reduced by €20m, mainly driven by lower actual taxes outside of Germany
Higher minorities in previous year due to one-off restructuring effects; this year’s minorities impacted by shifts in entities’ profit contributions
As a result, EPS improved strongly by €+0.11 to €0.58
Highlights
Dividend proposal of €0.26 per ordinary share, equivalent to a pay-out ratio of 45%
// 19 Date: 19 Dec 2017
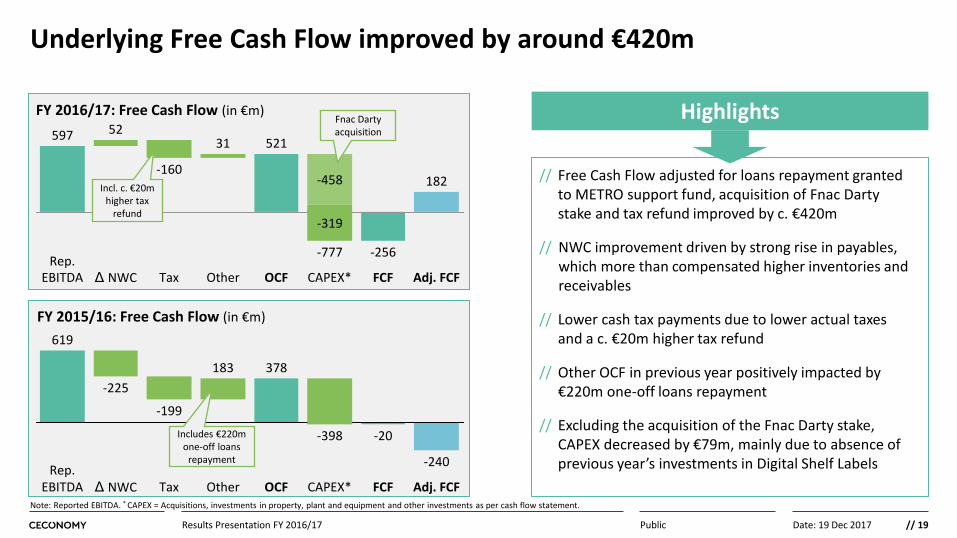
Underlying Free Cash Flow improved by around €420m
Public
FY 2016/17: Free Cash Flow (in €m)
FY 2015/16: Free Cash Flow (in €m)
EBITDA
-225
619
183
Tax
-199
378
Δ NWC Other OCF Adj. FCF
-398
-240
FCF
-20
CAPEX* Note: Reported EBITDA. * CAPEX = Acquisitions, investments in property, plant and equipment and other investments as per cash flow statement.
Results Presentation FY 2016/17
Includes €220m one-off loans
repayment
// Free Cash Flow adjusted for loans repayment granted to METRO support fund, acquisition of Fnac Darty stake and tax refund improved by c. €420m
// NWC improvement driven by strong rise in payables, which more than compensated higher inventories and receivables
// Lower cash tax payments due to lower actual taxes and a c. €20m higher tax refund
// Other OCF in previous year positively impacted by €220m one-off loans repayment
// Excluding the acquisition of the Fnac Darty stake, CAPEX decreased by €79m, mainly due to absence of previous year’s investments in Digital Shelf Labels
Highlights
Rep.
Rep.
182
FCF Adj. FCF CAPEX*
-319
-256
-458
-777
31 521
Tax OCF Other
-160
Δ NWC
52
EBITDA
597 Fnac Darty acquisition
Incl. c. €20m higher tax
refund

// 20 Date: 19 Dec 2017
Outlook 03
Pieter Haas, CEO Mark Frese, CFO

// 21 Date: 19 Dec 2017 Public
CECONOMY’s plans show a clear and strong value creation potential
Portfolio
V
alu
e
dri
ver
E
nab
ler
Competitive Cost Base
Online, Mobile,
Store
#1 Services &
Solutions
#2 Customer
Data / CRM
#3 Selective
Expansion
Category Management,
Pricing, Supply Chain
#5
Digital & Technology Leadership
People Transformation
#4
#6 #7
Net Working Capital #8
#9
#10
Results Presentation FY 2016/17

// 22 Date: 19 Dec 2017 Public Results Presentation FY 2016/17
What we plan to do in FY 2017/18
Milestones in FY 2017/18
Further develop store/online/mobile
experience
Roll-out service “smartbars” and
“@ home services”
Reach more than 2 million new members
in customer programmes
Further roll-out Shop-in-Shop concepts
Implement category management framework
Introduce multi-level logistics concepts (cross-docking, regional hubs)
Improve performance in Russia and Sweden
Leader of consolidation in the European CE sector

// 23 Date: 19 Dec 2017
Outlook
The outlook is adjusted for currency effects and portfolio changes.
Public Results Presentation FY 2016/17
FY 2016/17 1 FY 2017/18
€m
1 EBITDA & EBIT in FY 2016/17 before special items. EBITDA & EBIT in FY 2017/18 as reported. 2 Correspondingly, a slight improvement in NWC compared with the previous year is expected.
Sales1 Total sales
EBITDA (excl. Fnac Darty)
EBIT (excl. Fnac Darty)
22,155
704
471
Fnac Darty profit share (consensus) n.a.
Slight increase 2
At least mid single-digit % growth
Low to mid double-digit €m amount
At least mid single-digit % growth

// 24 Date: 19 Dec 2017
Independent and ready for the future
// CECONOMY became independent and is the largest Consumer Electronics platform in Europe
// CECONOMY achieved all targets in FY 2016/17
// CECONOMY’s plans show a clear and strong value creation potential
Public Results Presentation FY 2016/17

// 25 Date: 19 Dec 2017 Public
Q&A
Results Presentation FY 2016/17
Pieter Haas, CEO Mark Frese, CFO

// 26 Date: 19 Dec 2017
CECONOMY AG Investor Relations Benrather Strasse 18-20 40213 Dusseldorf Germany Tel.: +49 (211) 5408-7222 Email: [email protected] https://www.ceconomy.de/en/investor-relations/
CONTACT

// 27 Date: 19 Dec 2017
Sales & number of stores by country
Public Results Presentation FY 2016/17
Sales (€m) Number of Stores
FY 2015/16 FY 2016/17 FY 2015/16 Openings Closures FY 2016/17
Germany 10,273 10,556 424 5 - 429
Austria 1,139 1,169 49 1 - 50
Switzerland 674 635 28 - -1 27
Hungary 272 302 22 2 - 24
DACH 12,358 12,662 523 8 -1 530
Belgium 681 686 23 7 -2 28
Greece 189 187 11 1 - 12
Italy 2,096 2,087 111 5 - 116
Luxembourg 58 63 2 - - 2
Netherlands 1,567 1,590 49 - - 49
Portugal 124 133 9 1 - 10
Spain 1,894 1,967 79 4 - 83
Western & Southern Europe 6,609 6,714 284 18 -2 300
Poland 1,004 1,033 83 3 - 86
Russia 566 526 61 1 -5 57
Turkey 612 666 45 10 -2 53
Eastern Europe 2,181 2,226 189 14 -7 196
Sweden 503 474 27 - - 27
Others (incl. Sweden) 722 553 27 - - 27
CECONOMY 21,870 22,155 1,023 40 -10 1,053

// 28 Date: 19 Dec 2017
EBITDA to EPS
Public Results Presentation FY 2016/17
€m Q4 2015/16 Q4 2016/17 FY 2015/16 FY 2016/17
EBITDA 288 302 719 704
EBITDA margin (%) 5.7% 5.7% 3.3% 3.2%
DACH 173 201 493 539
Western & Southern Europe 90 76 230 169
Eastern Europe -2 15 9 34
Others 27 9 -12 -38
EBIT 207 244 466 471
EBIT margin (%) 4.1% 4.6% 2.1% 2.1%
DACH 127 169 359 421
Western & Southern Europe 72 57 158 91
Eastern Europe -21 9 -35 3
Others 28 8 -16 -44
Net financial result -10 -14 -22 -26
Earnings before taxes 197 229 444 446
Income taxes -109 -84 -217 -197
Tax rate (%) 55.3% 36.5% 48.8% 44.1%
Profit or loss for the period 88 146 227 249
attributable to non-controlling interest 36 27 75 60
attributable to shareholders of CECONOMY AG 52 119 152 189
EPS (in Euro) 0.16 0.36 0.47 0.58
// 29 Date: 19 Dec 2017
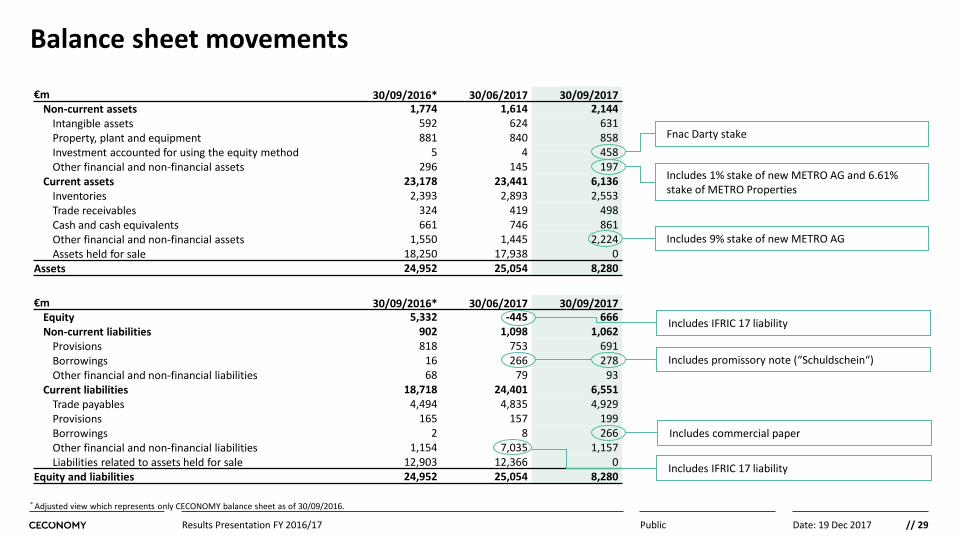
Balance sheet movements
Public Results Presentation FY 2016/17
€m 30/09/2016* 30/06/2017 30/09/2017 Non-current assets 1,774 1,614 2,144
Intangible assets 592 624 631 Property, plant and equipment 881 840 858 Investment accounted for using the equity method 5 4 458 Other financial and non-financial assets 296 145 197
Current assets 23,178 23,441 6,136 Inventories 2,393 2,893 2,553 Trade receivables 324 419 498 Cash and cash equivalents 661 746 861 Other financial and non-financial assets 1,550 1,445 2,224 Assets held for sale 18,250 17,938 0
Assets 24,952 25,054 8,280
€m 30/09/2016* 30/06/2017 30/09/2017 Equity 5,332 -445 666 Non-current liabilities 902 1,098 1,062
Provisions 818 753 691 Borrowings 16 266 278 Other financial and non-financial liabilities 68 79 93
Current liabilities 18,718 24,401 6,551 Trade payables 4,494 4,835 4,929 Provisions 165 157 199 Borrowings 2 8 266 Other financial and non-financial liabilities 1,154 7,035 1,157 Liabilities related to assets held for sale 12,903 12,366 0
Equity and liabilities 24,952 25,054 8,280
Fnac Darty stake
Includes 1% stake of new METRO AG and 6.61% stake of METRO Properties
Includes 9% stake of new METRO AG
Includes promissory note (“Schuldschein“)
Includes commercial paper
Includes IFRIC 17 liability
Includes IFRIC 17 liability
* Adjusted view which represents only CECONOMY balance sheet as of 30/09/2016.

// 30 Date: 19 Dec 2017
Fnac Darty consolidation
Public Results Presentation FY 2016/17
// Our 24.33% stake in Fnac Darty is accounted for as “Investment accounted for using the equity method” on the balance sheet
// The share of Fnac Darty’s net income will be reported in our EBITDA and EBIT
// Due to Fnac Darty’s semi-annual reporting of net income, we will report our earnings share semi-annually in Q2 and Q4
_First-time consolidation: in our Q2 17/18, we will recognize our earnings share of 4/6 x Fnac Darty’s full H2 net income (Sep-Dec), because 01 September 2017 is the date of first consolidation
// Our share of dividends, should there be any dividends, will be recognised earnings-neutral in our cash flow statement
FNAC H2 2018 FNAC H1 2018
CEC Q4 16/17 CEC Q1 17/18 CEC Q2 17/18 CEC Q3 17/18 CEC Q4 17/18 CEC Q1 18/19
30.06. 2017
30.09. 2017
31.12. 2017
31.03. 2018
30.06. 2018
30.09. 2018
01.09. 2017
31.12. 2018
FNAC H2 2017
4/6

// 31 Date: 19 Dec 2017 Public
Upcoming events
Results Presentation FY 2016/17
Sales1 Q1 2017/18 results
Q3/9M 2017/18 results
AGM 2018
Q2/H1 2017/18 results
Friday, 9 February 2018
Wednesday, 14 February 2018
Thursday, 17 May 2018
Tuesday, 14 August 2018
FY 2017/18 results Wednesday, 19 December 2018

// 32 Date: 31 Aug 2017