results overview q4 2019 - deltagalil.com · sales increased by 11% to a record level of $505m,...
TRANSCRIPT

RESULTS OVERVIEW
Q4 2019 F e b r u a r y 2 0 1 9

R E S U L T S O V E R V I E W Q 4 2 0 1 9 2
יש לעיין , ועל מנת לקבל תמונה מלאה של פעילות החברה ושל הסיכונים עימם מתמודדת החברה, האמור במצגת בכל הקשור לניתוח פעילותיה של החברה הינו תמצית בלבד
.2019דצמבר 31ביום בדיווחיה השוטפים של החברה לרבות בדוח הרבעוני לתקופה שהסתיימה
ובכלל זה נתונים שפורסמו על ידי גופים , העובדות והנתונים ששימשו בסיס למידע המפורט במצגת זו מבוססים על מידע כפי שידוע לחברה במועד הכנת מצגת זו, בין היתר
כהגדרתו בחוק , האמור במצגת זו כולל גם מידע צופה פני עתיד. אשר תוכנם לא נבדק על ידי החברה באופן עצמאי ולפיכך החברה אינה אחראית לנכונותם, חיצוניים לחברה
מידע צופה פני עתיד . שהתממשותם אינה ודאית ואינה בשליטת החברה, אומדנים ומידע אחר המתייחסים לאירועים ועניינים עתידיים, הערכות, מטרות, של תחזיות, ניירות ערך
.אינו מהווה עובדה מוכחת והוא מבוסס אך ורק על הערכה סובייקטיבית של החברה במועד הכנת המצגת
לרבות עקב השפעת גורמים שאינם בשליטת החברה ואשר לא , או להתממש באופן שונה מכפי שנצפה, כולו או חלקו, המידע הצופה פני עתיד הכלול במצגת עשוי שלא להתממש
החברה . וכן התפתחויות בסביבה הכלכלית ובגורמים החיצוניים המשפיעים על החברה, ובכלל זאת שינוי באיזה מגורמי הסיכון הרלוונטיים לפעילות החברה, ניתן להעריכם מראש
כי , קוראי מצגת זו מוזהרים, לפיכך. אינה מחויבת בעדכון או שינוי כל תחזית או הערכה הכלולים במצגת זו כאמור על מנת שישקפו אירועים או נסיבות שיחולו לאחר מועד המצגת
ויש לקחת בחשבון כי נתוני עבר אינם , התוצאות וההישגים בפועל של החברה בעתיד עלולים להיות שונים באופן מהותי מאלה שהוצגו במידע הצופה פני עתיד המוצג במצגת זו
.מצביעים בהכרח על ביצועים בעתיד
.2019דצמבר בחודש לרבעון רביעי המסתיים הנתונים הכספיים הנכללים במצגת זו מתייחסים , בהעדר אינדיקציה אחרת

SALES INCREASED BY 11% TO A RECORD LEVEL OF $505M, ORGANIC GROWTH -2%
EBIT INCREASED BY 22% TO $51M, REPORTED UP 36%
NET INCOME INCREASED 28% TO $35M, REPORTED UP 44%
OPERATING CASH FLOW AT A RECORD LEVEL OF $97M, UP $40M
NET DEBT/EBITDA REDUCED TO 2.5 FROM 3.2 IN Q3
BOGART PERFORMING BETTER THAN EXPECTED
VIETNAM FACTORY PROFITABLE
ACQUIRED BRAYOLA AS PART OF OUR ONLINE EXPANSION STRATEGY
DIVIDEND DECLARED of $6.5M
Q4 2019 Highlights
* EXCLUDING ONE TIME ITEMS
** EXCLUDING IFRS16 EFFECT; REPORTED OPERATING CASH FLOW IMPROVED BY $56M TO $112M
*
**
*
R E S U L T S O V E R V I E W Q 4 2 0 1 9 3

DGUSA
Q4 Sales down 7%, EBIT down 16%
FY EBIT down $10M, negatively impacted by:
Lower margins due to price pressure
One time product return and continued weakness in Avia active wear
business
Executing the strategic & operational plan presented in Q3
Exited $60M of basic business with low contribution to profitability
Focusing on higher margin product categories such as Bras, Seamless
Implementing efficiency and cost cutting measures
Q4 2019 Highlights
R E S U L T S O V E R V I E W Q 4 2 0 1 9 4

DELTA PREMIUM BRANDS
Sales down 3%, EBIT up 5% Finalized transition of Finance from LA to NJ offices Finalized transition of Splendid headquarter from LA to NY offices
FY EBIT down $11.5M, negatively impacted by:
Increased expenses of Splendid move to NY
Increased expenses of new store openings
Wholesale channel downtrend in the US
Strategic & operational plan improvements
Implementing efficiency and cost cutting measures
Improved RTW leading to increased sales
Celebrating 20th anniversary of 7FAM with new marketing campaign
Q4 2019 Highlights
R E S U L T S O V E R V I E W Q 4 2 0 1 9 5

GLOBAL UPPER MARKET
Positive momentum continues with EBIT doubling YoY
Bogart sales of $58M
Strong growth in our Socks and Seamless categories
Vietnam factory profitable in 4th quarter and into 2020
DELTA EUROPEAN BRANDS
Sales growth of 2% in original currency, EBIT up 18%
Initiated cross-selling of Eminence and Schiesser products
DELTA ISRAEL
Q4 Sales up 17%, EBIT up 44%
E-com strong double digit growth; new platform expected launch in Q2 2020
+8% annual growth in comparable sales and online channel
Q4 2019 Highlights
R E S U L T S O V E R V I E W Q 4 2 0 1 9 6

* Excluding IFRS16 Impact
Q4 & 2019 Financial Highlights
Q4.2019 Full Year 2019
$M % change vs
last year $M
% change vs last year
TOTAL SALES New Record level 504.8 11% 1,690.2 13%
OPERATING PROFIT New Record level (Excluding one-time items) 51.2 22% 106.0 8%
NET INCOME Quarter Record level (Excluding one-time items) 34.8 28% 60.2 (0.4%)
OPERATING CASH FLOW New Record level 96.9 71% 97.1 334%
EBITDA New Record level 60.7 21% 137.7 6%
CAPEX 10.9 (10%) 33.6 (26%)
NET DEBT/EBITDA 2.5 3.2 at 30/9 2.5 2.4 at 31/12
*
*
R E S U L T S O V E R V I E W Q 4 2 0 1 9 7

WE APPLIED IFRS16 STARTING Q1/2019
IFRS16 IMPACT
The numbers are rounded
($ million)
Q4.2019 YTD 2019
EXCLUDING IFRS16
REPORTED VAR EXCLUDING
IFRS16 REPORTED VAR
OPERATING PROFIT 49.9 52.2 2.3 95.6 103.7 8.1
OPERATING PROFIT (Excluding one-time items)
48.9 51.2 2.3 97.9 106.0 8.1
EBITDA 60.7 76.1 15.4 137.7 195.6 57.9
FINANCIAL EXPENSES 8.5 10.6 2.1 27.6 36.1 8.5
NET INCOME 35.4 35.6 0.2 58.0 57.7 0.3
NET INCOME (Excluding one-time items)
34.6 34.8 0.2 60.5 60.2 0.3
OPERATING CASH FLOW 96.9 112.3 15.4 97.1 155.0 57.9
OPERATING PROFIT Q4 2019 2019
DELTA USA 0.2 0.8
GLOBAL UPPER MARKET 0.4 1.1
DELTA EUROPEAN BRANDS 0.4 1.6
DELTA PREMIUM BRANDS 0.8 2.5
DELTA ISRAEL 0.4 1.6
OTHERS 0.1 0.3
IFRS16 - EBIT IMPACT 2.3 8.1
Segmental impact
R E S U L T S O V E R V I E W Q 4 2 0 1 9 8

Sales Sales in original currency +11% Sales excluding Bogart -2% Sales organic growth in original currency -2%
EBITDA Excluding IFRS16 +21%
+11%
+22%
+28%
Operating Profit excluding one-time items Reported OP +36%
Net income excluding one-time items Reported Net income +44%
+51%
($ million) Q4 2019 Results
The numbers are rounded
Q4 2019 Q4 2018% change
vs last year
SALES 504.8 454.3 11%
OPERATING PROFIT 52.2 38.4 36%
% from sales 10.3% 8.4%
OPERATING PROFIT
Excluding one-time items51.2 42.1 22%
% from sales 10.1% 9.3%
EBITDA 76.1 50.2 51%
% from sales 15.1% 11.1%
NET INCOME 35.6 24.7 44%
NET INCOME
Excluding one-time items34.8 27.2 28%
DILUTED EPS ($ per share) 1.40 0.97 45%
Diluted EPS ($ per share)
Excluding one-time items1.37 1.07 28%
OPERATING CASH FLOW 112.3 56.5 99%
R E S U L T S O V E R V I E W Q 4 2 0 1 9 9

Sales Sales in original currency +14% Sales excluding Bogart & Eminence H1 +2% Sales organic growth in original currency +3%
+13%
+8%
-0.4%
Operating Profit excluding one-time items Reported OP +29%
Net income excluding one-time items Reported Net income +20%
+51%
YTD 2019 Results 2019 2018
% change
vs last year
SALES 1,690.2 1,498.4 13%
OPERATING PROFIT 103.7 80.7 29%
% from sales 6.1% 5.4%
OPERATING PROFIT
Excluding one-time items106.0 98.0 8%
% from sales 6.3% 6.5%
EBITDA 195.6 129.8 51%
% from sales 11.6% 8.7%
NET INCOME 57.7 48.2 20%
NET INCOME
Excluding one-time items60.2 60.5 (0.4%)
DILUTED EPS ($ per share) 2.26 1.90 19%
Diluted EPS ($ per share)
Excluding one-time items2.36 2.37 (0.4%)
OPERATING CASH FLOW 155.0 22.4 592%
($ million)
The numbers are rounded
EBITDA Excluding IFRS16 +6%
R E S U L T S O V E R V I E W Q 4 2 0 1 9 10

($ thousands)
Q4 Sales and EBIT by Segment
The numbers are rounded
Q4 2019 Q4 2018 % change Q4 2019 Q4 2018
DELTA USA 128,630 139,019 (7%) (7%) 10,614 12,600
% from sales 8.3% 9.1%
GLOBAL UPPER MARKET 140,836 85,909 64% 64% 11,153 5,595
% from sales 7.9% 6.5%
DELTA EUROPEAN BRANDS 86,144 86,976 (1%) 2% 11,262 9,559
% from sales 13.1% 11.0%
DELTA PREMIUM BRANDS 83,427 86,181 (3%) (3%) 8,924 8,511
% from sales 10.7% 9.9%
DELTA ISRAEL 75,981 64,933 17% 10% 10,833 7,520
% from sales 14.3% 11.6%
INTERSEGMENT SALES (10,254) (8,754)
OTHERS (1,561) (1,642)
TOTAL SALES / EBIT before one-time items 504,764 454,264 11% 11% 51,225 42,144
% from sales 10.1% 9.3%
ONE-TIME ITEMS, NET 987 (3,776)
REPORTED EBIT 52,212 38,368
SALES EBIT% change in
original
currency
R E S U L T S O V E R V I E W Q 4 2 0 1 9 11

YTD Sales and EBIT by Segment ($ thousands)
The numbers are rounded
2019 2018 % change 2019 2018
DELTA USA 461,608 469,321 (2%) (2%) 23,166 32,988
% from sales 5.0% 7.0%
GLOBAL UPPER MARKET 460,682 308,365 49% 49% 40,333 21,023
% from sales 8.8% 6.8%
DELTA EUROPEAN BRANDS 308,526 273,253 13% 19% 25,683 21,073
% from sales 8.3% 7.7%
DELTA PREMIUM BRANDS 274,648 281,931 (3%) (1%) 5,405 16,952
% from sales 2.0% 6.0%
DELTA ISRAEL 214,836 194,198 11% 9% 15,922 10,962
% from sales 7.4% 5.6%
INTERSEGMENT SALES (30,136) (28,647)
OTHERS (4,543) (4,993)
TOTAL SALES / EBIT before one-time items 1,690,164 1,498,421 13% 14% 105,966 98,005
% from sales 6.3% 6.5%
ONE-TIME ITEMS, NET (2,286) (17,330)
REPORTED EBIT 103,680 80,675
SALES EBIT% change in
original
currency
R E S U L T S O V E R V I E W Q 4 2 0 1 9 12

($ thousands)
Sales Analysis by Geographic Area
2019% of
sales2018
% of
sales
%
change
% change
in original
currency2019
% of
sales2018
% of
sales
%
change
% change
in original
currency
U.S.A 251,032 50% 237,407 52% 6% 6% 846,061 50% 794,316 53% 7% 7%
EUROPE
(excluding Germany)84,685 17% 77,624 17% 9% 11% 312,093 18% 251,804 17% 24% 27%
GERMANY 56,732 11% 55,881 12% 1% 4% 198,194 12% 194,378 13% 2% 7%
ISRAEL 76,669 15% 64,935 14% 18% 11% 215,708 13% 194,239 13% 11% 10%
OTHERS 35,646 7% 18,417 4% 94% 94% 118,107 7% 63,684 4% 85% 85%
Total 504,764 100% 454,264 100% 11% 11% 1,690,164 100% 1,498,421 100% 13% 14%
Q4 YTD
The numbers are rounded
R E S U L T S O V E R V I E W Q 4 2 0 1 9 13
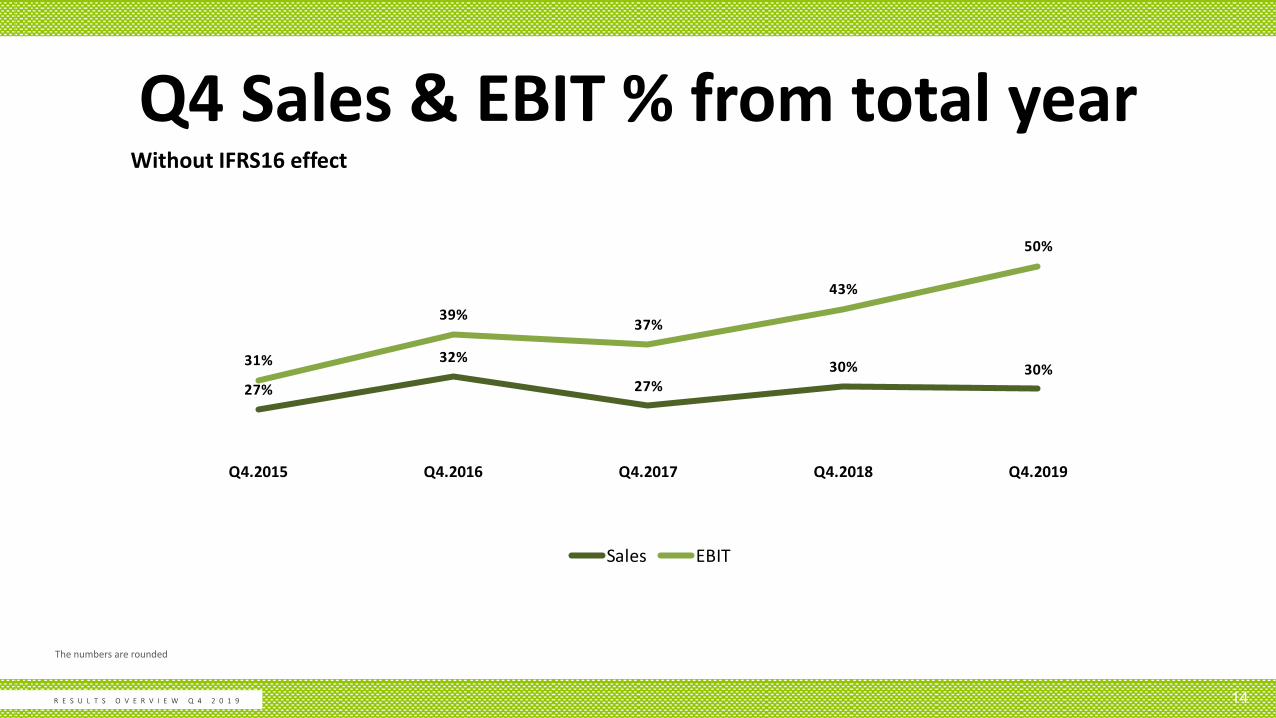
Q4 Sales & EBIT % from total year
The numbers are rounded
27%
32%
27%30% 30%
31%
39%37%
43%
50%
Q4.2015 Q4.2016 Q4.2017 Q4.2018 Q4.2019
Sales EBIT
R E S U L T S O V E R V I E W Q 4 2 0 1 9 14
Without IFRS16 effect

($ thousands)
Excluding one time items
Segmental Results on a Quarterly Basis
The numbers are rounded
EBIT SALES EBIT SALES EBIT SALES EBIT SALES EBIT SALES EBIT SALES
DELTA USA 12,600 139,019 4,815 111,775 1,115 107,332 6,623 113,871 10,614 128,630 23,166 461,608
% from sales 9.1% 4.3% 1.0% 5.8% 8.3% 5.0%
GLOBAL UPPER MARKET 5,595 85,909 5,197 79,548 11,459 95,573 12,523 144,725 11,153 140,836 40,333 460,681
% from sales 6.5% 6.5% 12.0% 8.7% 7.9% 8.8%
DELTA EUROPEAN BRANDS 9,559 86,976 2,092 74,761 2,228 66,000 10,101 81,621 11,262 86,144 25,682 308,526
% from sales 11.0% 2.8% 3.4% 12.4% 13.1% 8.3%
DELTA PREMIUM BRANDS 8,511 86,181 (922) 62,196 1,043 64,910 (3,640) 64,115 8,924 83,427 5,405 274,648
% from sales 9.9% -1.5% 1.6% -5.7% 10.7% 2.0%
DELTA ISRAEL 7,520 64,933 307 44,436 2,959 45,892 1,823 48,527 10,833 75,981 15,922 214,836
% from sales 11.6% 0.7% 6.4% 3.8% 14.3% 7.4%
INTERSEGMENT SALES & EBIT (1,642) (8,754) (1,045) (7,341) (1,647) (5,821) (290) (6,720) (1,561) (10,254) (4,542) (30,136)
TOTAL EBIT / SALES 42,144 454,264 10,444 365,375 17,157 373,886 27,140 446,139 51,225 504,764 105,966 1,690,164
% from sales 9.3% 2.9% 4.6% 6.1% 10.1% 6.3%
% OF 2019 10% 22% 16% 22% 26% 26% 48% 30%
TRAILING TWELVE
MONTHSQ3Q4 Q1 Q2 Q4
2018 2019
R E S U L T S O V E R V I E W Q 4 2 0 1 9 15

YTD 2018
YTD
2019
45.5
33.6
Global upper market .…..…....…..….. 9.4
Delta European brands ….….…..…… 5.2
DGPB ...……………………….…......... 9.8
Delta Israel ...………………….…….... 2.8
Others .….………………….…..…....... 6.4
Total .........……….….………....….… 33.6
($ million)
Capital Expenditures
R E S U L T S O V E R V I E W Q 4 2 0 1 9 16

($ million)
Cash on hand
Equity
Equity from total balance sheet
Proforma Net debt / EBITDA
$109M
$507M
32%
2.5
Balance Sheet Increased following Bogart acquisition and IFRS16 implementation
Dec. 31 2019% FROM
TOTALDec. 31 2018
% FROM
TOTAL
CASH AND CASH EQUIVALENTS 109.2 7% 74.0 6%
OTHER CURRENT ASSETS 579.5 36% 561.2 47%
TOTAL CURRENT ASSETS 688.7 43% 635.2 53%
NON CURRENT ASSETS 899.1 57% 570.7 47%
TOTAL ASSETS 1,587.8 100% 1,205.9 100%
CURRENT LIABILITIES 401.8 25% 372.8 31%
DEBENTURES 340.4 21% 223.0 18%
OTHER NON-CURRENT LIABILITIES 338.7 21% 142.3 12%
TOTAL LONG TERM LIABILITIES 679.0 43% 365.2 30%
EQUITY 506.9 32% 467.9 39%
TOTAL LIABILITIES AND EQUITY 1,587.8 100% 1,205.9 100%
R E S U L T S O V E R V I E W Q 4 2 0 1 9 17

Financial Indicators 31.12.2019 31.12.2018
Current ratio 1.71 1.70
Quick ratio 0.90 0.87
Days of Sales Outstanding 38 44
Days Payable Outstanding 40 45
Inventory Days 93 99
Operating cash flow - Q4 ($ million) 112.3 56.5
Operating cash flow - YTD ($ million) 155.0 22.4
EBITDA - Q4 ($ million) 76.1 50.2
EBITDA - YTD ($ million) 195.6 129.8
Net financial debt ($ million) 334.5 326.7
Net financial debt to EBITDA* (based on Last 4 Quarters) 2.5 2.4
Equity / Total balance sheet 31.9% 38.8%
Equity ($ million) 506.9 467.9
Net Debt / CAP 33.5% 36.5%
* This ratio excludes $57.9M positive impact on EBITDA due to IFRS16 & Proforma of Bogart EBITDA
R E S U L T S O V E R V I E W Q 4 2 0 1 9 18

BRANDED/ PRIVATE LABEL
GEOGRAPHIC AREA
PRODUCT CAREGORIES
64% BRANDED
36% PRIVATE
LABEL
50% USA
30% EUROPE
13% ISRAEL
7% OTHER 10%
KIDS
51% LADIES
26% MENS
13% SOCKS
MARKET SEGMENT
BUSINESS SEGMENTS PRODUCTION
73% OUTSORCING
27% IN HOUSE
27% DUSA
18% EUROPEAN
16% DGPB
26% GUM
13% DELTA ISRAEL
55% UPPER
26% MASS
19% MID
Enables Delta to effectively mitigate market risks % from sales (for 2019)
Diversified Portfolio
R E S U L T S O V E R V I E W Q 4 2 0 1 9 19

20
Actual Vs. 2019 Guidance Excluding one time items
($ million)
R E S U L T S O V E R V I E W Q 4 2 0 1 9
2019 ACTUAL 2019 GUIDANCE% INCREASE 2019 GUIDANCE
COMPARED TO 2019 ACTUAL
Sales 1,690 1,650 - 1,690 10% - 13%
EBIT 98 98 - 102 0% - 4%
EBITDA 138 132 - 136 2% - 5%
Net Income 60 60 - 62 0% - 3%
Diluted EPS ($) 2.36 2.37 - 2.44 0% - 3%
INCLUDING IFRS16 IMPACT
EBIT 106 106 - 111 8% - 13%
EBITDA 196 183 - 187 41% - 44%

Shipments delay effect: sales loss of approximately $15M in Q1.
$12M shifted to Q2. EBIT loss of $1M
Factory operational disruption: $3.5M loss in Q1
Air freight and additional misc. costs: $1-2M in Q1
Total: $5-$7M
Corona Impact
R E S U L T S O V E R V I E W Q 4 2 0 1 9 21

2019 ACTUAL 2020 GUIDANCE% INCREASE 2020 GUIDANCE
COMPARED TO 2019 ACTUAL
SALES 1,690 1,740 - 1,770 3% - 5%
EBIT EXCLUDING CORONA IMPACT 106 113 - 119 7% - 12%
CORONA IMPACT 6
EBIT 106 107 - 113 1% - 7%
EBITDA 196 197 - 203 1% - 4%
NET INCOME 60 57 - 62 (-5%) - 3%
DILUTED EPS ($) 2.36 2.23 - 2.42 ($-0.13) - $0.06
Actual Vs. 2020 Guidance Excluding one time items
($ million)
R E S U L T S O V E R V I E W Q 4 2 0 1 9 22
* Including Corona virus one time impact of $5-$7M
*
*
*
*

Future Growth
Leveraging Bogart relationships to sell Delta products
to major new customers and vice versa
Growing with Kim Kardashian intimate brand SKIMS
Leveraging BRAYOLA to continue our strong growth in E-com channel
Continuous growth in GUM in Seamless and Socks
Expanding Eminence Ladies & kids products
Growing with Splendid sales to clubs
Celebrating 20th anniversary of 7FAM with new marketing campaign
R E S U L T S O V E R V I E W Q 4 2 0 1 9 23

24

25


THANK YOU