results of a telephone survey of television station managers
TRANSCRIPT
May 2004
NASA/TM-2004-213029
Results of a Telephone Survey of TelevisionStation Managers Concerning the NASA SCIFiles and NASA CONNECT
Thomas E. PinelliLangley Research Center, Hampton, Virginia
Jeannine PerryContinental Research, Norfolk, Virginia

The NASA STI Program Office . . . in Profile
Since its founding, NASA has been dedicated to theadvancement of aeronautics and space science. TheNASA Scientific and Technical Information (STI)Program Office plays a key part in helping NASAmaintain this important role.
The NASA STI Program Office is operated byLangley Research Center, the lead center for NASA’sscientific and technical information. The NASA STIProgram Office provides access to the NASA STIDatabase, the largest collection of aeronautical andspace science STI in the world. The Program Office isalso NASA’s institutional mechanism fordisseminating the results of its research anddevelopment activities. These results are published byNASA in the NASA STI Report Series, whichincludes the following report types:
• TECHNICAL PUBLICATION. Reports of
completed research or a major significant phaseof research that present the results of NASAprograms and include extensive data ortheoretical analysis. Includes compilations ofsignificant scientific and technical data andinformation deemed to be of continuingreference value. NASA counterpart of peer-reviewed formal professional papers, but havingless stringent limitations on manuscript lengthand extent of graphic presentations.
• TECHNICAL MEMORANDUM. Scientific
and technical findings that are preliminary or ofspecialized interest, e.g., quick release reports,working papers, and bibliographies that containminimal annotation. Does not contain extensiveanalysis.
• CONTRACTOR REPORT. Scientific and
technical findings by NASA-sponsoredcontractors and grantees.
• CONFERENCE PUBLICATION. Collected
papers from scientific and technicalconferences, symposia, seminars, or othermeetings sponsored or co-sponsored by NASA.
• SPECIAL PUBLICATION. Scientific,
technical, or historical information from NASAprograms, projects, and missions, oftenconcerned with subjects having substantialpublic interest.
• TECHNICAL TRANSLATION. English-
language translations of foreign scientific andtechnical material pertinent to NASA’s mission.
Specialized services that complement the STIProgram Office’s diverse offerings include creatingcustom thesauri, building customized databases,organizing and publishing research results ... evenproviding videos.
For more information about the NASA STI ProgramOffice, see the following:
• Access the NASA STI Program Home Page athttp://www.sti.nasa.gov
• E-mail your question via the Internet to
[email protected] • Fax your question to the NASA STI Help Desk
at (301) 621-0134 • Phone the NASA STI Help Desk at
(301) 621-0390 • Write to:
NASA STI Help Desk NASA Center for AeroSpace Information 7121 Standard Drive Hanover, MD 21076-1320

National Aeronautics andSpace Administration
Langley Research Center Hampton, Virginia 23681-2199
May 2004
NASA/TM-2004-213029
Results of a Telephone Survey of TelevisionStation Managers Concerning the NASA SCIFiles and NASA CONNECT
Thomas E. PinelliLangley Research Center, Hampton, Virginia
Jeannine PerryContinental Research, Norfolk, Virginia

Available from:
NASA Center for AeroSpace Information (CASI) National Technical Information Service (NTIS)7121 Standard Drive 5285 Port Royal RoadHanover, MD 21076-1320 Springfield, VA 22161-2171(301) 621-0390 (703) 605-6000
The use of trademarks or names of manufacturers in the report is for accurate reporting and does notconstitute an official endorsement, either expressed or implied, of such products or manufacturers by theNational Aeronautics and Space Administration.

Summary
Continental Research—a marketing, research, and consulting firm located in Norfolk, Virginia—wascommissioned to conduct a telephone survey of television station managers concerning two instructionaltelevision programs offered by the NASA Langley Center for Distance Learning (CDL)<http://dlcenter.larc.nasa.gov>. The NASA Langley CDL is an organizational unit of NASA LangleyResearch Center’s Office of Education. The NASA CDL produces five award-winning distance learningprograms that span the educational horizon from K–12 through postsecondary education (13–18) toadult (lifelong) learners. The two Emmy-award-winning instructional television programs underconsideration are the NASA SCI Files <http://scifiles.larc.nasa.gov> and NASA CONNECT<http://connect.larc.nasa.gov>. About 500 000 educators in the United States are registered users of thesetwo programs. As of January 5, 2004, the combined number of (domestic) television stations airing thesetwo programs was 373. The survey instrument was pretested among a subset of 15 television stations.Computer-Assisted Telephone Interviewing (CATI) technology and protocols were used. (See Method-ology for additional information.) The telephone survey started on January 27, 2004 and ended onFebruary 27, 2004. The Office of Management and Budget (OMB) survey approval number is OMB2700-0012.
Reducing the number of television stations airing the 2 programs (373) by the number of stations usedin the pretest (15) left a balance of 358 television stations “eligible” to be surveyed. Dividing the numberof television stations that participated in the survey (280) by the number of television stations (358)eligible to participate resulted in a survey response rate of 78 percent. Almost half (47.5 percent) ofsurvey participants represented a cable television station, 29.3 percent represented instructional televisionstations, and 29.3 percent represented a Public Broadcasting System (PBS) station. Overall, surveyparticipants reported that they were either very satisfied (60.4 percent) or satisfied (31.8 percent) withtheir interactions with the NASA Langley Center for Distance Learning. Almost 100 percent of surveyparticipants indicated that they received NASA SCI Files and NASA CONNECT programming fromthe NASA Langley Center for Distance Learning.
In all, 280 station managers were surveyed during the time allotted for the study. About half(50.7 percent) of survey participants were male; the average age of the survey participants was 44.6 years;and the average number of years survey participants had worked at their current television stations was7.8 years. Seventy-five percent of the survey participants stated that their stations broadcast programs toschool districts. About 86 percent of individuals participating in the survey were personally responsiblefor deciding which programs were included in the station’s schedule (lineup).
Television station managers were asked to identify the single most important factor used to select aprogram to air on their stations. The top 3 factors reported by 280 station managers were (1) good educa-tional value (16.1 percent), (2) community interest (14.6 percent), and (3) the ability of the program to fitinto the educational curriculum (13.2 percent). Using a 10-point scale, with 10 being extremely impor-tant, television station managers were asked to rate the importance (influence) 7 factors have on selectingprograms for their television schedules (lineups).
The 3 factors rated highest (most important) on a 10-point scale were (1) the educational value of theprogram (8.85), (2) the cost of the program (8.25), and (3) the technical quality of the program (8.11).About 95 percent of survey participants indicated that they would recommend either the NASA SCIFiles or NASA CONNECT to a colleague at another television station.

2
Using a 4-point scale, with 4 being very satisfied, survey participants reported that they were eithervery satisfied (77.1 percent) or satisfied (19.9 percent) with the overall (educational and technical) qualityof the NASA SCI Files. Survey participants also rated the NASA SCI Files on 13 characteristics.The 3 characteristics receiving the highest ratings (scores) were (1) credibility of the programs (3.81),(2) educational value (3.80), and (3) technical quality (3.79). Participants gave the NASA SCI Filesan overall rating of 3.78 (out of 4.00). Almost 70 percent of survey participants reported having nosuggestions for improving the NASA SCI Files. The single, largest factor reported for improving theNASA SCI Files was to make more programs.
Using a 4-point scale, with 4 being very satisfied, survey participants reported that they were eithervery satisfied (77.9 percent) or satisfied (19.1 percent) with the overall (educational and technical) qualityof NASA CONNECT. Survey participants also rated NASA CONNECT on 13 characteristics byusing a 4-point scale. The 3 characteristics with the highest ratings were (1) credibility of the programs(3.79), (2) educational value (3.76), and (3) technical quality (3.76). Participants gave NASACONNECT an overall rating of 3.79. Almost 61 percent of survey participants reported having nosuggestions for improving NASA CONNECT . The largest factor reported for improving NASACONNECT was to make more programs.
About 36 percent of the survey participants indicated that state budget cuts have adversely affected theability to broadcast educational programming.
About 70 percent of the survey participants indicated that either they are already streaming video pro-gramming (20.7 percent) or are considering doing so in the immediate future (50.0 percent).
About 46 percent of the survey participants indicated that they have either entered into a businessagreement with a provider of video programming (14.3) or are considering doing so in the immediatefuture (32.1 percent).
About 43 percent of the survey participants indicated that they have either joined a consortium withother stations to provide access to educational programs through a dedicated hard drive (4.3 percent) orare considering doing so in the immediate future (38.9 percent).
Procedural Information
This telephone survey of TV station managers who had shown an interest in NASA CONNECTand/or NASA SCIence Files programs in the past year was conducted by Continental Research Associ-ates, Inc., a Norfolk-based marketing research firm. The study was commissioned by the EducationalTechnology and Distance Learning office at NASA Langley Research Center in Hampton, Virginia.Surveys were collected from January 28th through February 27th of 2004.
Methodology
The survey instrument was developed by Continental Research in consultation with representativesfrom NASA Langley Center for Distance Learning office. As is customary, the questionnaire waspretested by senior staff members on a subsample of respondents. Fifteen TV station managers wereincluded in the pretest. During the pretest, no problems with questionnaire wording, vocabulary,sequencing, or layout were identified. The final survey took approximately 12 minutes to complete. Acopy of the questionnaire is included in appendix B of this report.

3
Langley Research Center provided a list of 373 TV station managers in Excel spreadsheet format.Researchers attempted to contact everyone on the list; however, only 280 interviews were able to becompleted in the time frame. A breakout of the telephone contacts can be found on page 3 of this report.
Because the data collection phase is extremely important to research validity, professional interviewersconducted the surveys. Each had extensive training and several years experience with executive levelsurveys prior to working on this study.
A detailed briefing session was held prior to making calls to discuss the instructions for using thequestionnaire. Each interviewer participated in several role-playing exercises with the survey. Thisprovided an opportunity to practice administering the questionnaire, to discuss various types of probes,and to properly pace reading of the preformatted survey.
After the initial briefing session, the data collection phase began. Phone calls originated from ourcentral telephone facility in Norfolk, Virginia. Contacts were made between 8:30 a.m. and 9:00 p.m.(local time) Monday through Friday. Each station on the list was called up to 10 times on different daysand at different times. Some appointments were made to secure interviews with busy people.
The survey information was directly entered into the computer system using Computer-Assisted Tele-phone Interviewing (CATI) technology. This process allows for the rotation of survey items within agrid-style question, thereby eliminating any sequence bias. All open-ended responses were recordedverbatim. A supervisor was present at all times to electronically monitor the telephone conversations. Aportion of each interviewer’s work was “dual recorded” on the Novell-based computer network andchecked for consistency in recording of answers. Over 38 percent of all calls were fully monitored, andan additional 25 percent were partially monitored. This is far in excess of the 5-percent industry valida-tion standard.
At the end of each shift, a debriefing session was held to discuss the survey’s progress. While thesemeetings provide only anecdotal evidence, the information can be very useful when interpreting results.The primary reason why some stations were never reached had to do with a lack of staff to answerphones. Many stations (45) used recorded outgoing messages only or voice mail.
Once the fieldwork was completed, the open-ended responses were categorized into narrow subjectgroupings and numerically coded for computerization. The codes were then key entered twice to ensure100-percent accuracy, and a detailed computer program was written to tabulate the data. Using theStatistical Package for the Social Sciences (SPSS) software, the data were analyzed. The findings aredisplayed on the following pages.
Breakout of Telephone Contacts
Number of completed interviews 280Not able to be reached after multiple attempts/voice mail only 45Nonworking phone number/manual lookup failed 22Duplicate station/person 12Refused to participate/too busy 6Language barrier 1Didn’t know anything about the programs/no other contact 3Budget cuts/no longer involved with that/not on air 2Terminated interview due to time constraints 2
373

4
Highlights
• The single most important thing that impacts the decision to select a program to air:
Top 3 answersPercentage(n = 280)
Good educational value 16.1Community interest 14.6Fitting into curriculum 13.2
• Importance rating for: (10 = extremely important; 1 = not important)
Response Avg. rating(n = 280)
Educational value of program 8.85Cost of program 8.25Technical quality of program 8.11Having few restrictions on use of program 7.76How easily program is obtained 7.75Viewer recommendations 7.10
• 59.3 percent said they had received NASA SCI Files programs in the past year.
• Satisfaction with NASA SCI Files in terms of: (4 = very satisfied; 3 = satisfied; 2 = dissatisfied;1 = very dissatisfied)
ResponseAvg.rating
Numberresponding
How credible shows are 3.81 160Educational value 3.80 157
Technical quality 3.79 152Overall quality 3.78 162Being aligned with national math, science, and technology standards 3.74 140Enhancing integration of math, science, and technology 3.74 140
Being developmentally appropriate for children in that age group 3.72 145How interesting shows are 3.66 151Quality of educator guides 3.64 90Quality of Web-based activities 3.64 98
Showing women and minorities performing challenging engineering andscientific tasks 3.60 141Being easily incorporated into that grade level’s curriculum 3.53 131Feedback received from audience 3.43 132

5
• 83.9 percent said they had received NASA CONNECT programs in the past year.
• Satisfaction with NASA CONNECT in terms of: (4 = very satisfied; 3 = satisfied; 2 = dissatisfied;1 = very dissatisfied)
ResponseAvg.rating
Numberresponding
Overall quality 3.79 229How credible shows are 3.79 226Educational value 3.76 226Technical quality 3.76 217Enhancing integration of math, science, and technology 3.68 200How interesting shows are 3.67 218Being developmentally appropriate for children in that age group 3.66 208Being aligned with national math, science, and technology standards 3.63 198Quality of Web-based activities 3.61 132Showing women and minorities performing challenging engineeringand scientific tasks 3.57 202Being easily incorporated into that grade level’s curriculum 3.55 181Quality of educator guides 3.54 127Feedback received from audience 3.43 184
• Avg. rating of NASA’s Center for Distance Learning = 3.59 (4 = very satisfied; 3 = satisfied;2 = dissatisfied; 1 = very dissatisfied)
• Percent who said their stations receive NASA programs by:
Response Percentage(n = 280)
Downlink by KU 16.4Downlink by C-Band 9.3NASA sends them 58.6Satellite (not specific) 0.4KU and NASA send them 7.5C-Band and NASA send them 6.1Never received any 1.8

6
• 86.1 percent personally make decisions about which programs to include in their stations lineups.
• 94.6 percent would recommend NASA SCI Files or NASA CONNECT to a colleague.
• 75.0 percent said they broadcast educational programs to schools.
• 36.1 percent said state budget cuts have impacted the ability to broadcast educational programs toschools.
• 20.7 percent already stream video for educational programs, 50.0 percent said they have considered thisand may do it in the future, and 29.3 percent said this was not a consideration at the present time.
• 14.3 percent already have entered into a business agreement with a provider of video programming,32.1 percent said they have considered this and may do it in the future, and 53.6 percent said this wasnot a consideration at the present time.
• 4.3 percent already have joined a consortium with other stations to provide access to educational pro-grams through a dedicated hard drive, 38.9 percent said they have considered this and may do it in thefuture, and 56.8 percent said this was not a consideration at the present time.
• Average number of years worked at the TV station = 7.8 years.
• Occupational area:
36.1 percent work in production35.7 percent work in management19.6 percent work in operations 8.6 percent work in marketing/outreach(n = 280)
• Educational attainment:
3.9 percent high school or less15.0 percent some college56.8 percent 4-year college degree24.3 percent degree beyond 4 years of college(n = 280)
• Average age = 44.6 years
• 50.7 percent are male and 49.3 percent are female

7
Survey Results1
In general, what is the single most important thing that impacts your decision to select a programto air on your station?
Response Number Percentage
If it has good educational value 45 16.1
If it will be of community interest 41 14.6
If it fits our curriculum 37 13.2
If it has good production quality 21 7.5
It has to be free/affordable 20 7.1
If the content fits in our mission 17 6.1
If we have a community sponsor/request 15 5.4
If the content meets our state’s curriculum standards 13 4.6
If it has interesting content 13 4.6
If it has broad appeal (i.e., all ages) 10 3.6
If the content is appropriate for children 9 3.2
If the content is current/up to date 7 2.5
If it’s science-oriented 6 2.1
It must be noncommercial/commercial-free 4 1.4
If it’s produced by a government source/NASA 3 1.1
If it fits into my schedule 3 1.1
If the content is credible 2 0.7
If it will be good for filler 2 0.7
If it’s visually appealing 2 0.7
It must be Christian 2 0.7
If there are no copyright issues 2 0.7
If it’s available by satellite 1 0.4
If it’s geared to minorities 1 0.4
If it has fast-paced segments 1 0.4
If it covers multiple topics 1 0.4
If there’s easy access by downlink 1 0.4
If it aligns with an upcoming field trip 1 0.4
280 100.0
1NOTE: The questionnaire wording was slightly adapted for “in-house” school media representatives.

8
Let’s talk about how you decide whether or not to select a program to air on your station. Using a1 to 10 scale where 1 is Not Important and 10 is Extremely Important, how important is the cost ofthe program?
Response Number1 Percentage10 Extremely Important 136 48.6 9 29 10.4 8 38 13.6 7 22 7.9 6 6 2.1 5 32 11.4 4 3 1.1 3 3 1.1 2 3 1.1 1 Not Important 8 2.9
280 100.01Mean = 8.25 (n = 280)
How important is the technical quality of the program?
Response Number1 Percentage10 Extremely Important 82 29.3 9 43 15.4 8 71 25.4 7 31 11.1 6 20 7.1 5 28 10.0 4 4 1.4 3 1 0.4 2 0 0.0 1 Not Important 0 0.0
280 100.01Mean = 8.11 (n = 280)
How important is how easy it is to get the program?
Response Number1 Percentage10 Extremely Important 72 25.7 9 32 11.4 8 70 25.0 7 41 14.6 6 11 3.9 5 44 15.7 4 3 1.1 3 5 1.8 2 1 0.4 1 Not Important 1 0.4
280 100.01Mean = 7.75 (n = 280)
9
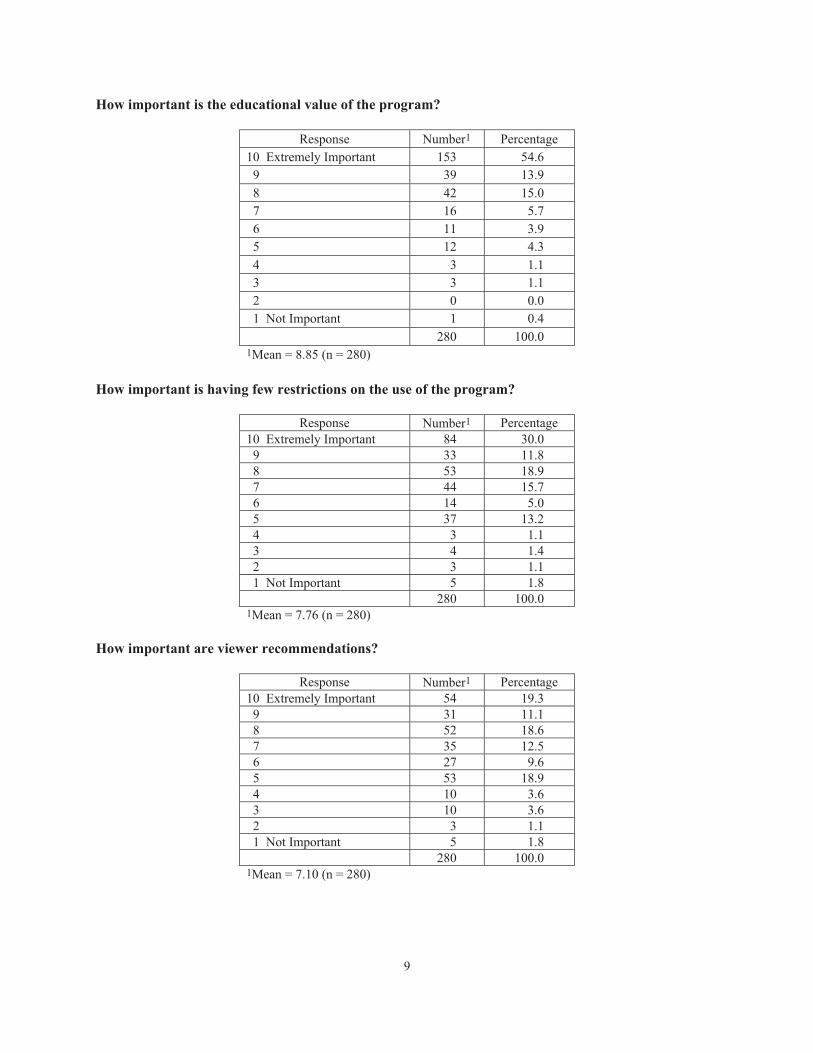
How important is the educational value of the program?
Response Number1 Percentage10 Extremely Important 153 54.6 9 39 13.9 8 42 15.0 7 16 5.7 6 11 3.9 5 12 4.3 4 3 1.1 3 3 1.1 2 0 0.0 1 Not Important 1 0.4
280 100.01Mean = 8.85 (n = 280)
How important is having few restrictions on the use of the program?
Response Number1 Percentage10 Extremely Important 84 30.0 9 33 11.8 8 53 18.9 7 44 15.7 6 14 5.0 5 37 13.2 4 3 1.1 3 4 1.4 2 3 1.1 1 Not Important 5 1.8
280 100.01Mean = 7.76 (n = 280)
How important are viewer recommendations?
Response Number1 Percentage10 Extremely Important 54 19.3 9 31 11.1 8 52 18.6 7 35 12.5 6 27 9.6 5 53 18.9 4 10 3.6 3 10 3.6 2 3 1.1 1 Not Important 5 1.8
280 100.01Mean = 7.10 (n = 280)

10
Summary Table
Q3 to Q7
Average Importance Ratings(in descending order)
How important (fill in) ?
Response Avg. rating(n = 280)
Is the educational value of the program 8.85Is the cost of the program 8.25Is the technical quality of the program 8.11Is having few restrictions on the use of the program 7.76Is how easy it is to get the program 7.75Are viewer recommendations 7.10Scale: 10 = extremely important; 1 = not important
NASA SCI FILES
In the past year, did you receive a program called NASA SCI Files?
Response Number PercentageYes 166 59.3No 114 40.7
280 100.0
(Of those who have received NASA SCI Files...) Are you Very Satisfied, Satisfied, Dissatisfied, orVery Dissatisfied with NASA SCI Files in terms of its overall quality?
Response Number1 PercentageVery satisfied 128 77.1Satisfied 33 19.9Dissatisfied 1 0.6Very dissatisfied 0 0.0Don’t know/no answer 4 2.4
166 100.01Mean = 3.78 (n = 162)NOTE: One-hundred fourteen people are not included in thistable because they did not receive any NASA SCI Filesprograms in the past year.Mean Scale: 4 = very satisfied; 3 = satisfied; 2 = dissatisfied;1 = very dissatisfied

11
(Of those who have received NASA SCI Files...) Are you Very Satisfied, Satisfied, Dissatisfied, orVery Dissatisfied with NASA SCI Files in terms of its educational value?
Response Number1 PercentageVery satisfied 126 75.9Satisfied 30 18.1Dissatisfied 1 0.6Very dissatisfied 0 0.0Don’t know/no answer 9 5.4
166 100.01Mean = 3.80 (n = 157)NOTE: One-hundred fourteen people are not included in this tablebecause they did not receive any NASA SCI Files programs in thepast year.Mean Scale: 4 = very satisfied; 3 = satisfied; 2 = dissatisfied;1 = very dissatisfied
(Of those who have received NASA SCI Files...) Are you Very Satisfied, Satisfied, Dissatisfied, orVery Dissatisfied with NASA SCI Files in terms of its technical quality?
Response Number1 PercentageVery satisfied 121 72.9Satisfied 30 18.1Dissatisfied 1 0.6Very dissatisfied 0 0.0Don’t know/no answer 14 8.4
166 100.01Mean = 3.79 (n = 152)NOTE: One-hundred fourteen people are not included in this tablebecause they did not receive any NASA SCI Files programs in thepast year.Mean Scale: 4 = very satisfied; 3 = satisfied; 2 = dissatisfied;1 = very dissatisfied
(Of those who have received NASA SCI Files...) Are you Very Satisfied, Satisfied, Dissatisfied, orVery Dissatisfied with NASA SCI Files in terms of being aligned with national math, science, andtechnology standards?
Response Number1 PercentageVery satisfied 103 62.0Satisfied 37 22.3Dissatisfied 0 0.0Very dissatisfied 0 0.0Don’t know/no answer 26 15.7
166 100.01Mean = 3.74 (n = 140)NOTE: One-hundred fourteen people are not included in this tablebecause they did not receive any NASA SCI Files programs in thepast year.Mean Scale: 4 = very satisfied; 3 = satisfied; 2 = dissatisfied;1 = very dissatisfied

12
(Of those who have received NASA SCI Files...) Are you Very Satisfied, Satisfied, Dissatisfied, orVery Dissatisfied with NASA SCI Files in terms of being developmentally appropriate forchildren in that age group?
Response Number1 PercentageVery satisfied 106 63.9Satisfied 38 22.9Dissatisfied 1 0.6Very dissatisfied 0 0.0Don’t know/no answer 21 12.7
166 100.01Mean = 3.72 (n = 145)NOTE: One-hundred fourteen people are not included in this tablebecause they did not receive any NASA SCI Files programs in thepast year.Mean Scale: 4 = very satisfied; 3 = satisfied; 2 = dissatisfied;1 = very dissatisfied
(Of those who have received NASA SCI Files...) Are you Very Satisfied, Satisfied, Dissatisfied, orVery Dissatisfied with NASA SCI Files in terms of being easily incorporated into that gradelevel’s curriculum?
Response Number1 PercentageVery satisfied 74 44.6Satisfied 52 31.3Dissatisfied 5 3.0Very dissatisfied 0 0.0Don’t know/no answer 35 21.1
166 100.01Mean = 3.53 (n = 131)NOTE: One-hundred fourteen people are not included in this tablebecause they did not receive any NASA SCI Files programs in thepast year.Mean Scale: 4 = very satisfied; 3 = satisfied; 2 = dissatisfied;1 = very dissatisfied

13
(Of those who have received NASA SCI Files...) Are you Very Satisfied, Satisfied, Dissatisfied, orVery Dissatisfied with NASA SCI Files in terms of enhancing the integration of math, science,and technology?
Response Number1 PercentageVery satisfied 103 62.0Satisfied 37 22.3Dissatisfied 0 0.0Very dissatisfied 0 0.0Don’t know/no answer 26 15.7
166 100.01Mean = 3.74 (n = 140)NOTE: One-hundred fourteen people are not included in this tablebecause they did not receive any NASA SCI Files programs in thepast year.Mean Scale: 4 = very satisfied; 3 = satisfied; 2 = dissatisfied;1 = very dissatisfied
(Of those who have received NASA SCI Files...) Are you Very Satisfied, Satisfied, Dissatisfied, orVery Dissatisfied with NASA SCI Files in terms of showing women and minorities performingchallenging engineering and scientific tasks?
Response Number1 PercentageVery satisfied 88 53.0Satisfied 50 30.1Dissatisfied 2 1.2Very dissatisfied 1 0.6Don’t know/no answer 25 15.1
166 100.01Mean = 3.60 (n = 141)NOTE: One-hundred fourteen people are not included in this tablebecause they did not receive any NASA SCI Files programs in thepast year.Mean Scale: 4 = very satisfied; 3 = satisfied; 2 = dissatisfied;1 = very dissatisfied
(Of those who have received NASA SCI Files...) Are you Very Satisfied, Satisfied, Dissatisfied, orVery Dissatisfied with NASA SCI Files in terms of quality of the educator guides?
Response Number1 PercentageVery satisfied 59 35.5Satisfied 30 18.1Dissatisfied 1 0.6Very dissatisfied 0 0.0Don’t know/no answer 76 45.8
166 100.01Mean = 3.64 (n = 90)NOTE: One-hundred fourteen people are not included in this tablebecause they did not receive any NASA SCI Files programs in thepast year.Mean Scale: 4 = very satisfied; 3 = satisfied; 2 = dissatisfied;1 = very dissatisfied

14
(Of those who have received NASA SCI Files...) Are you Very Satisfied, Satisfied, Dissatisfied, orVery Dissatisfied with NASA SCI Files in terms of quality of the Web-based activities?
Response Number1 PercentageVery satisfied 63 38.0Satisfied 35 21.1Dissatisfied 0 0.0Very dissatisfied 0 0.0Don’t know/no answer 68 41.0
166 100.01Mean = 3.64 (n = 98)NOTE: One-hundred fourteen people are not included in this tablebecause they did not receive any NASA SCI Files programs in thepast year.Mean Scale: 4 = very satisfied; 3 = satisfied; 2 = dissatisfied;1 = very dissatisfied
(Of those who have received NASA SCI Files...) Are you Very Satisfied, Satisfied, Dissatisfied, orVery Dissatisfied with NASA SCI Files in terms of the feedback you get from the audience?
Response Number1 PercentageVery Satisfied 60 36.1Satisfied 69 41.6Dissatisfied 3 1.8Very Dissatisfied 0 0.0Don’t know/no answer 34 20.5
166 100.01Mean = 3.43 (n = 132)NOTE: One-hundred fourteen people are not included in this tablebecause they did not receive any NASA SCI Files programs in thepast year.Mean Scale: 4 = very satisfied; 3 = satisfied; 2 = dissatisfied;1 = very dissatisfied
(Of those who have received NASA SCI Files...) Are you Very Satisfied, Satisfied, Dissatisfied, orVery Dissatisfied with NASA SCI Files in terms of how interesting the shows are?
Response Number1 PercentageVery satisfied 103 62.0Satisfied 45 27.1Dissatisfied 2 1.2Very dissatisfied 1 0.6Don’t know/no answer 15 9.0
166 100.01Mean = 3.66 (n = 151)NOTE: One-hundred fourteen people are not included in this tablebecause they did not receive any NASA SCI Files programs in thepast year.Mean Scale: 4 = very satisfied; 3 = satisfied; 2 = dissatisfied;1 = very dissatisfied

15
(Of those who have received NASA SCI Files...) Are you Very Satisfied, Satisfied, Dissatisfied, orVery Dissatisfied with NASA SCI Files in terms of how credible the shows are, being that they arefrom NASA?
Response Number1 PercentageVery satisfied 131 78.9Satisfied 28 16.9Dissatisfied 1 0.6Very dissatisfied 0 0.0Don’t know/no answer 6 3.6
166 100.01Mean = 3.81 (n = 160)NOTE: One-hundred fourteen people are not included in this tablebecause they did not receive any NASA SCI Files programs in thepast year.Mean Scale: 4 = very satisfied; 3 = satisfied; 2 = dissatisfied;1 = very dissatisfied
Summary Table
Q10 to Q22
Average Satisfaction Ratings(in descending order)
(Of those who have received NASA SCI Files ...) Are you Very Satisfied (4), Satisfied (3),Dissatisfied (2), or Very Dissatisfied (1) with NASA SCI Files in terms of (fill in) ?
Response Avg.rating
Numberresponding
How credible the shows are, being that they are from NASA 3.81 160Educational value 3.80 157Technical quality 3.79 152Overall quality 3.78 162Being aligned with national math, science, and technology standards 3.74 140Enhancing the integration of math, science, and technology 3.74 140Being developmentally appropriate for children in that age group 3.72 145How interesting the shows are 3.66 151Quality of the educator guides 3.64 90Quality of the Web-based activities 3.64 98Showing women and minorities performing challenging engineering andscientific tasks 3.60 141Being easily incorporated into that grade level’s curriculum 3.53 131Feedback from audience 3.43 132Scale: 4 = very satisfied; 3 = satisfied; 2 = dissatisfied; 1 = very dissatisfied.
16
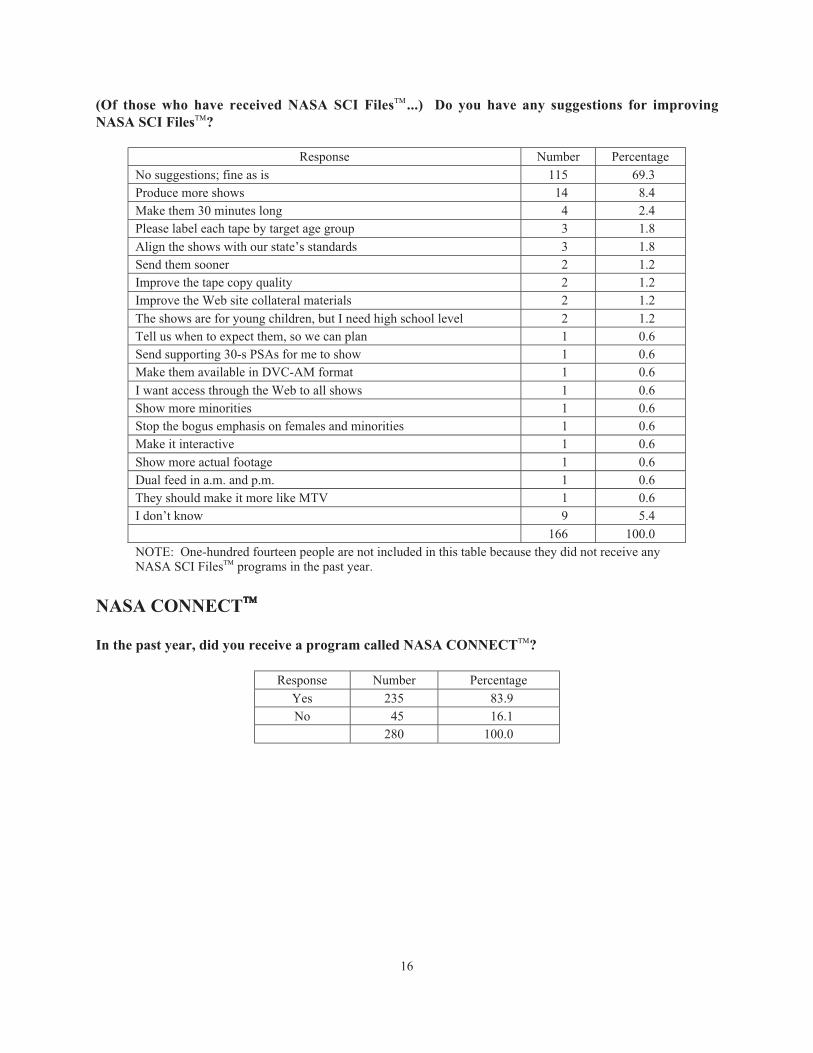
(Of those who have received NASA SCI Files...) Do you have any suggestions for improvingNASA SCI Files?
Response Number PercentageNo suggestions; fine as is 115 69.3Produce more shows 14 8.4Make them 30 minutes long 4 2.4Please label each tape by target age group 3 1.8Align the shows with our state’s standards 3 1.8Send them sooner 2 1.2Improve the tape copy quality 2 1.2Improve the Web site collateral materials 2 1.2The shows are for young children, but I need high school level 2 1.2Tell us when to expect them, so we can plan 1 0.6Send supporting 30-s PSAs for me to show 1 0.6Make them available in DVC-AM format 1 0.6I want access through the Web to all shows 1 0.6Show more minorities 1 0.6Stop the bogus emphasis on females and minorities 1 0.6Make it interactive 1 0.6Show more actual footage 1 0.6Dual feed in a.m. and p.m. 1 0.6They should make it more like MTV 1 0.6I don’t know 9 5.4
166 100.0NOTE: One-hundred fourteen people are not included in this table because they did not receive anyNASA SCI Files programs in the past year.
NASA CONNECT
In the past year, did you receive a program called NASA CONNECT?
Response Number PercentageYes 235 83.9No 45 16.1
280 100.0

17
(Of those who have received NASA CONNECT...) Are you Very Satisfied, Satisfied, Dissatisfied,or Very Dissatisfied with NASA CONNECT in terms of their overall quality?
Response Number1 Percentage
Very satisfied 183 77.9
Satisfied 45 19.1
Dissatisfied 1 0.4
Very dissatisfied 0 0.0
Don’t know/no answer 6 2.6
235 100.01Mean = 3.79 (n = 229)
NOTE: Forty-five people are not included in this table because theydid not receive any NASA CONNECT programs in the past year.
Mean Scale: 4 = very satisfied; 3 = satisfied; 2 = dissatisfied;1 = very dissatisfied
(Of those who have received NASA CONNECT...) Are you Very Satisfied, Satisfied, Dissatisfied,or Very Dissatisfied with NASA CONNECT in terms of its educational value?
Response Number1 PercentageVery satisfied 173 73.6Satisfied 52 22.1Dissatisfied 1 0.4Very dissatisfied 0 0.0Don’t know/no answer 9 3.8
235 100.01Mean = 3.76 (n = 226)NOTE: Forty-five people are not included in this table because theydid not receive any NASA CONNECT programs in the past year.Mean Scale: 4 = very satisfied; 3 = satisfied; 2 = dissatisfied;1 = very dissatisfied
(Of those who have received NASA CONNECT...) Are you Very Satisfied, Satisfied, Dissatisfied,or Very Dissatisfied with NASA CONNECT in terms of their technical quality?
Response Number1 PercentageVery satisfied 166 70.6Satisfied 49 20.9Dissatisfied 2 0.9Very dissatisfied 0 0.0Don’t know/no answer 18 7.7
235 100.01Mean = 3.76 (n = 217)NOTE: Forty-five people are not included in this table because theydid not receive any NASA CONNECT programs in the past year.Mean Scale: 4 = very satisfied; 3 = satisfied; 2 = dissatisfied;1 = very dissatisfied

18
(Of those who have received NASA CONNECT...) Are you Very Satisfied, Satisfied, Dissatisfied,or Very Dissatisfied with NASA CONNECT in terms of being aligned with national math, science,and technology standards?
Response Number1 PercentageVery satisfied 124 52.8Satisfied 74 31.5Dissatisfied 0 0.0Very dissatisfied 0 0.0Don’t know/no answer 37 15.7
235 100.01Mean = 3.63 (n = 198)NOTE: Forty-five people are not included in this table because theydid not receive any NASA CONNECT programs in the past year.Mean Scale: 4 = very satisfied; 3 = satisfied; 2 = dissatisfied;1 = very dissatisfied
(Of those who have received NASA CONNECT...) Are you Very Satisfied, Satisfied, Dissatisfied,or Very Dissatisfied with NASA CONNECT in terms of being developmentally appropriate forchildren in that age group?
Response Number1 PercentageVery satisfied 139 59.1Satisfied 68 28.9Dissatisfied 1 0.4Very dissatisfied 0 0.0Don’t know/no answer 27 11.5
235 100.01Mean = 3.66 (n = 208)NOTE: Forty-five people are not included in this table because theydid not receive any NASA CONNECT programs in the past year.Mean Scale: 4 = very satisfied; 3 = satisfied; 2 = dissatisfied;1 = very dissatisfied
(Of those who have received NASA CONNECT...) Are you Very Satisfied, Satisfied, Dissatisfied,or Very Dissatisfied with NASA CONNECT in terms of being easily incorporated into that gradelevel’s curriculum?
Response Number1 PercentageVery satisfied 104 44.3Satisfied 72 30.6Dissatisfied 5 2.1Very dissatisfied 0 0.0Don’t know/no answer 54 23.0
235 100.01Mean = 3.55 (n = 181)NOTE: Forty-five people are not included in this table because theydid not receive any NASA CONNECT programs in the past year.Mean Scale: 4 = very satisfied; 3 = satisfied; 2 = dissatisfied;1 = very dissatisfied

19
(Of those who have received NASA CONNECT...) Are you Very Satisfied, Satisfied, Dissatisfied,or Very Dissatisfied with NASA CONNECT in terms of enhancing the integration of math,science, and technology?
Response Number1 PercentageVery satisfied 136 57.9Satisfied 64 27.2Dissatisfied 0 0.0Very dissatisfied 0 0.0Don’t know/no answer 35 14.9
235 100.01Mean = 3.68 (n = 200)NOTE: Forty-five people are not included in this table because theydid not receive any NASA CONNECT programs in the past year.Mean Scale: 4 = very satisfied; 3 = satisfied; 2 = dissatisfied;1 = very dissatisfied
(Of those who have received NASA CONNECT...) Are you Very Satisfied, Satisfied, Dissatisfied,or Very Dissatisfied with NASA CONNECT in terms of showing women and minoritiesperforming challenging engineering and scientific tasks?
Response Number1 PercentageVery satisfied 120 51.1Satisfied 78 33.2Dissatisfied 4 1.7Very dissatisfied 0 0.0Don’t know/no answer 33 14.0
235 100.01Mean = 3.57 (n = 202)NOTE: Forty-five people are not included in this table because theydid not receive any NASA CONNECT programs in the past year.Mean Scale: 4 = very satisfied; 3 = satisfied; 2 = dissatisfied;1 = very dissatisfied
(Of those who have received NASA CONNECT...) Are you Very Satisfied, Satisfied, Dissatisfied,or Very Dissatisfied with NASA CONNECT in terms of the quality of the educator guides?
Response Number1 PercentageVery satisfied 70 29.8Satisfied 56 23.8Dissatisfied 1 0.4Very dissatisfied 0 0.0Don’t know/no answer 108 46.0
235 100.01Mean = 3.54 (n = 127)NOTE: Forty-five people are not included in this table because theydid not receive any NASA CONNECT programs in the past year.Mean Scale: 4 = very satisfied; 3 = satisfied; 2 = dissatisfied;1 = very dissatisfied

20
(Of those who have received NASA CONNECT...) Are you Very Satisfied, Satisfied, Dissatisfied,or Very Dissatisfied with NASA CONNECT in terms of the quality of the Web-based activities?
Response Number1 PercentageVery satisfied 81 34.5Satisfied 51 21.7Dissatisfied 0 0.0Very dissatisfied 0 0.0Don’t know/no answer 103 43.8
235 100.01Mean = 3.61 (n = 132)NOTE: Forty-five people are not included in this table because theydid not receive any NASA CONNECT programs in the past year.Mean Scale: 4 = very satisfied; 3 = satisfied; 2 = dissatisfied;1 = very dissatisfied
(Of those who have received NASA CONNECT...) Are you Very Satisfied, Satisfied, Dissatisfied,or Very Dissatisfied with NASA CONNECT in terms of the feedback you get from the audience?
Response Number1 PercentageVery satisfied 84 35.7Satisfied 95 40.4Dissatisfied 5 2.1Very dissatisfied 0 0.0Don’t know/no answer 51 21.7
235 100.01Mean = 3.43 (n = 184)NOTE: Forty-five people are not included in this table because theydid not receive any NASA CONNECT programs in the past year.Mean Scale: 4 = very satisfied; 3 = satisfied; 2 = dissatisfied;1 = very dissatisfied
(Of those who have received NASA CONNECT...) Are you Very Satisfied, Satisfied, Dissatisfied,or Very Dissatisfied with NASA CONNECT in terms of how interesting the shows are?
Response Number1 PercentageVery satisfied 149 63.4Satisfied 67 28.5Dissatisfied 2 0.9Very dissatisfied 0 0.0Don’t know/no answer 17 7.2
235 100.01Mean = 3.67 (n = 218)NOTE: Forty-five people are not included in this table because theydid not receive any NASA CONNECT programs in the past year.Mean Scale: 4 = very satisfied; 3 = satisfied; 2 = dissatisfied;1 = very dissatisfied
21
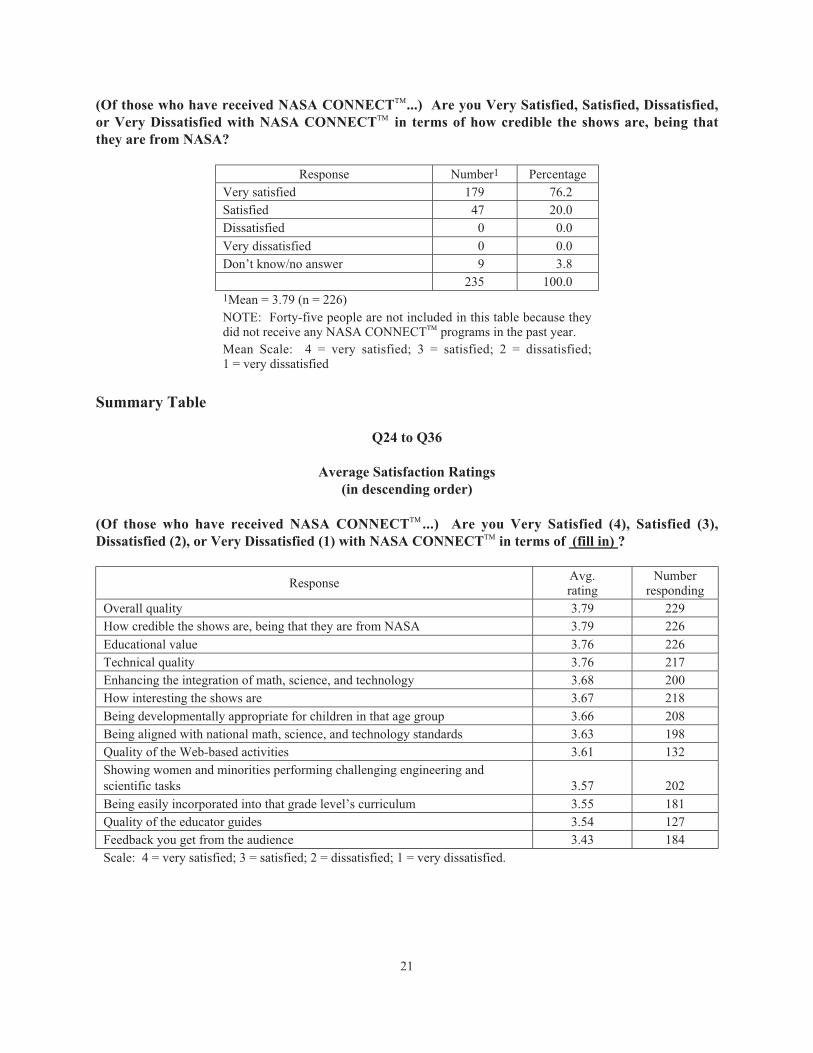
(Of those who have received NASA CONNECT...) Are you Very Satisfied, Satisfied, Dissatisfied,or Very Dissatisfied with NASA CONNECT in terms of how credible the shows are, being thatthey are from NASA?
Response Number1 PercentageVery satisfied 179 76.2Satisfied 47 20.0Dissatisfied 0 0.0Very dissatisfied 0 0.0Don’t know/no answer 9 3.8
235 100.01Mean = 3.79 (n = 226)NOTE: Forty-five people are not included in this table because theydid not receive any NASA CONNECT programs in the past year.Mean Scale: 4 = very satisfied; 3 = satisfied; 2 = dissatisfied;1 = very dissatisfied
Summary Table
Q24 to Q36
Average Satisfaction Ratings(in descending order)
(Of those who have received NASA CONNECT ...) Are you Very Satisfied (4), Satisfied (3),Dissatisfied (2), or Very Dissatisfied (1) with NASA CONNECT in terms of (fill in) ?
Response Avg.rating
Numberresponding
Overall quality 3.79 229How credible the shows are, being that they are from NASA 3.79 226Educational value 3.76 226Technical quality 3.76 217Enhancing the integration of math, science, and technology 3.68 200How interesting the shows are 3.67 218Being developmentally appropriate for children in that age group 3.66 208Being aligned with national math, science, and technology standards 3.63 198Quality of the Web-based activities 3.61 132Showing women and minorities performing challenging engineering andscientific tasks 3.57 202Being easily incorporated into that grade level’s curriculum 3.55 181Quality of the educator guides 3.54 127Feedback you get from the audience 3.43 184Scale: 4 = very satisfied; 3 = satisfied; 2 = dissatisfied; 1 = very dissatisfied.

22
(Of those who have received NASA CONNECT...) Do you have any suggestions for improvingNASA CONNECT?
Response Number PercentageNo suggestions; fine as is 142 60.4Produce more shows 21 8.9Tell us when to expect them, so we can plan 8 3.4Make them available in DVD format 5 2.1Align the shows with our state’s standards 5 2.1Send them sooner 4 1.7Make them 30 minutes long 4 1.7Improve the Web site collateral materials 3 1.3Improve the tape copy quality 2 0.9Make the tapes available in Spanish 2 0.9Keep them current 2 0.9Send out schedule by E-mail 2 0.9Make them available in digital format 2 0.9Make it interactive 2 0.9They should make it more like MTV 2 0.9Put a countdown up front to cue up material 1 0.4Make them more geared toward children 1 0.4Send supporting 30-s PSAs for me to show 1 0.4I don’t like the host 1 0.4Make them available in various formats 1 0.4The downlink signals are not good 1 0.4Make them available in DVC-AM format 1 0.4Make the shows available by streaming 1 0.4The shows are for young children, but I need high school level 1 0.4Please label each tape by target age group 1 0.4Offer local connection, not random access 1 0.4Stay with the same producer 1 0.4Have nice Web guides 1 0.4Dual feed in a.m. and p.m. 1 0.4Make it closed-captioned 1 0.4It’s hard to hear people sometimes 1 0.4Use more animation 1 0.4They should follow a progression—as a series 1 0.4I don’t know 11 4.7
235 100.0
NOTE: Forty-five people are not included in this table because they did not receive any NASA CONNECTprograms in the past year.

23
Additional Survey Results
Overall, have you been Very Satisfied, Satisfied, Dissatisfied, or Very Dissatisfied with the dealingsyou’ve had with NASA’s Center for Distance Learning?
Response Number1 PercentageVery satisfied 169 60.4Satisfied 89 31.8Dissatisfied 11 3.9Very dissatisfied 0 0.0Don’t know 11 3.9
280 100.01Mean = 3.59 (n = 269)Mean Scale: 4 = very satisfied; 3 = satisfied; 2 = dissatisfied;1 = very dissatisfied
(If not satisfied with NASA’s Center for Distance Learning...) What didn’t go well?
“My tapes have never arrived.” (3 people)“The tapes come too frequently.” (2 people)“They were nonresponsive to my phone calls and E-mails.” (2 people)“We have had trouble getting a signal from them.” (1 person)“They come in an unusable format.” (1 person)“They ignored my requests for the 1-minute kids science news.” (1 person)“Actors are too snappy and like MTV.” (1 person)
Does your station receive the NASA programs by downlink, or does NASA send them to you?
Response Number PercentageDownlink by KU 46 16.4Downlink by C-Band 26 9.3NASA sends them to us 164 58.6Satellite (not specific) 1 0.4KU and NASA sends them 21 7.5C-Band and NASA sends them 17 6.1I’ve never received any 5 1.8
280 100.0
Do you personally make decisions about which programs will be included in your station’s lineup?
Response Number PercentageYes 241 86.1No 39 13.9
280 100.0

24
Would you recommend NASA’s SCI Files or NASA CONNECT to a colleague at anotherstation?
Response Number PercentageYes 265 94.6No 15 5.4
280 100.0
Does your station broadcast educational programs to schools?
Response Number PercentageYes 210 75.0No/We no longer do 70 25.0
280 100.0
Have state budget cuts in the past two years impacted your ability to broadcast educationalprograms to schools?
Response Number PercentageYes 101 36.1No 148 52.9We never did broadcast to schools 31 11.1
280 100.0
Some stations have begun to stream video for educational programs instead of broadcasting it.Have you considered this, or perhaps are you already doing this?
Response Number PercentageNo, it’s not a consideration now 82 29.3We’ve considered it/We may do this in the future 140 50.0We already do that 58 20.7
280 100.0
Some stations have entered into a business agreement with a provider of video programming suchas “United Streaming.” Have you considered this, or perhaps are you already doing this?
Response Number PercentageNo, it’s not a consideration now 150 53.6We’ve considered it/We may do this in the future 90 32.1We already do that 40 14.3
280 100.0

25
Some stations have joined a consortium with other stations, such as “ChalkWave.Com,” to provideaccess to educational programs through a dedicated hard drive. Have you considered this, orperhaps are you already doing this?
Response Number PercentageNo, it’s not a consideration now 159 56.8We’ve considered it/We may do this in the future 109 38.9We already do that 12 4.3
280 100.0
Demographics
How many years have you been working at this TV station?
Averages1 Number2 PercentageOne year 22 7.9Two years 29 10.4Three years 37 13.2Four years 23 8.2Five years 29 10.4Six to ten years 68 24.3Eleven to fifteen years 37 13.2Sixteen or more years 35 12.5
280 100.01Based on nongrouped data.2Mean = 7.8 years; Median = 5.5 years
What is the occupational area of your position at the station?
Response Number PercentageManagement 100 35.7Production 101 36.1Marketing/Outreach 24 8.6Operations 55 19.6
280 100.0

26
What is the highest level of education you have completed?
Response Number PercentageHigh school or less 11 3.9One to three years of college 42 15.0A four-year college degree 159 56.8A Master’s degree 59 21.1A Doctorate 9 3.2
280 100.0
Age of Respondent
Mean1 = 44.6 years Number PercentageTwenties 22 7.9Thirties 69 24.6Forties 102 36.4Fifties 72 25.7Sixties or older 15 5.4
280 100.01Based on category midpoint interpolation. A value of 65 was usedfor the category “Sixties or older.”
Gender of Respondent
Response Number PercentageMale 142 50.7Female 138 49.3
280 100.0

27
State Where TV Station is Located (From Internal Records)
Location Number PercentageAlabama 2 0.7Alaska 3 1.1California 20 7.1Colorado 6 2.1Connecticut 4 1.4Delaware 1 0.4Florida 21 7.5Georgia 4 1.4Hawaii 3 1.1Idaho 2 0.7Illinois 7 2.5Indiana 6 2.1Iowa 4 1.4Kansas 1 0.4Kentucky 5 1.8Louisiana 4 1.4Maine 3 1.1Maryland 4 1.4Massachusetts 23 8.2Michigan 10 3.6Minnesota 7 2.5Mississippi 1 0.4Missouri 4 1.4Montana 2 0.7Nebraska 1 0.4Nevada 3 1.1New Hampshire 2 0.7New Jersey 3 1.1New Mexico 1 0.4New York 18 6.4North Carolina 8 2.9North Dakota 1 0.4Ohio 19 6.8Oklahoma 3 1.1Oregon 5 1.8Pennsylvania 5 1.8Rhode Island 1 0.4South Carolina 2 0.7South Dakota 1 0.4Tennessee 5 1.8Texas 20 7.1Utah 1 0.4Vermont 1 0.4Virginia 17 6.1Washington State 8 2.9West Virginia 1 0.4Wisconsin 3 1.1Wyoming 3 1.1Virgin Islands 1 0.4
280 100.0

28
Type of Station (From Internal Records)
Station type Number PercentageCable 133 47.5PBS 57 20.4ITV 82 29.3Commercial 8 2.9
280 100.0
Location of TV Station (Based on Time Zone) [This table was computer-generated.]
Station location Number PercentageEastern 154 55.0Central 64 22.9Mountain 19 6.8Pacific 36 12.9Alaska 3 1.1Hawaii 3 1.1Out of country 1 0.4
280 100.0
29
Appendix A
Participating Stations
TV 10BKATKWESST. TAMMANY PARISH SCHOOL BOARDWYCCINSTRUCTIONAL TV LAREDONEW HAMPSHIRE PTV/WENH 11WFGC/TV 61WGVU/WGVKBREVARD PUBLIC SCHOOLSSTARNETCHARLOTTE-MECKLENBURG PUBLIC SCHOOLS/CMS-TVHITV HERNANDO INSTRUCTIONAL TVREDDING COMMUNITY ACCESS CORP.MISSISSIPPI EDUCATIONAL TVKENTUCKY EDUCATIONAL TELEVISIONWSIU 8/WUSI 16WTCI TV 45IOWA PUBLIC TELEVISIONPITTSFIELD ETVGREENFIELD COMMUNITY TVDUCKBURY COMMUNITY TELEVISIONBAILEYVILLE CABLE TVPPTV-PRAIRIE PUBLIC TVKRMA-ROCKY MT. PUBLIC TVCABLE CHANNEL 10CHANNEL 20 CITY OF ST. CHARLESCAT COLUMBIA ACCESS TVTOWN SQUARE TVWATERLOO GOVT. ACCESSGRTVWBRK BERKLEY CH. 53 & 10CAMBRIDGE COMMUNITY TVGULF COUNTY PUBLIC SCHOOLSEL PASO INDEP. SCHOOL DISTRICTNETA-NAT’L. EDUCATIONAL TELECOMMUNICATIONS ASSN.WCTV/CATVIDAHO STATE DEPT. OF EDUCATIONOKLAHOMA STATE DEPT. OF EDUC.BROOKLYN CABLE TV-BCATFORSYTH COUNTY SCHOOLS/CH. 2SOLON COMMUNITY TVPUBLIC ACCESSCOMMUNITY TV NETWORK/CTN SAN DIEGOCHANNEL 14 DJUSDQUINCY ACCESS TV

30
CAPE COD COMMUNITY MEDIA CENTERCARROLL MIDDLE SCHOOLBRAINTREE COMMUNITY TELEVISION-CABLE CH. 31SETV-EDUCATIONAL ACCESS/SHREWSBURYTHE BOSTON CHANNELADELPHIA’S CH. 13FOXBORO CABLE ACCESS INC.AOTVMT. BLUE TVTHE EDUCATION CHANNEL/THE EXPLORER CHANNEL-TAMPADAYTON ACCESS TV/CH. 20 DATVMARION COUNTY SCHOOL BOARDWSKG/WSQX CH. 46STATEN ISLAND COMMUNITY TVNEW YORK NETWORKFACT FAIRPORT AREA COMMUNITY TVFAIRFAX COUNTY PUBLIC SCHOOLSCH. 36 HANOVER COUNTY PUBLIC SCHOOLSWSPF TV CITY OF ST. PETERSBURGMONTGOMERY COMMUNITY TV-ROCKVILLEHIGH SCHOOL EDUCATIONAL TVWGBY PUBLIC TV GREAT BLUE YONDERWYBE CH. 12 PHILADELPHIACOMMUNITY ACCESS TV-HANOVERWILLINETMARYLAND PUBLIC TVWIPB-TVWPBA CH. 30 ATLANTA PUBLIC BROADCASTINGCABLE-TAP/WLRN TVCUMBERLAND COUNTY PUBLIC SCHOOLSWVUT-TVWLX-TVHIGHLANDS COUNTY PUBLIC SCHOOLSCLAY COUNTYMEDIA CABLE ACCESS-36-MEDINATV MIDDELTOWNMIAMI VALLY CABLE COUNCIL-CENTERVILLELCTV-LOCKPORTLTC-LOWELLORION COMMUNITY CABLESCAT SOMERVILLE COMMUNITY ACCESS TVSWOCC-FARMINGTON HILLKERA/KDTN NORTH TEXAS PUBLIC BROADCASTINGKEDT TV-SOUTH TEXAS PUBLIC BROADCASTINGKWBU BRAZOS VALLEY-PUBLIC BROADCASTING FOUNDATION-WACOGWINNETT COUNTY PUBLIC SCHOOLS/GCPS TVNJN-NEW JERSEY NETWORK/PUBLIC TVWIWU-LPTV 51PEOPLE TV INC.-ATLANTARCTV-ROSWELL CITI TV CHARTER CABLE CH. 32KMBH-TV 60/RIO GRANDE VALLEY EDUCATIONAL TV

31
COOPERATING SCHOOL DISTRICTS/ST. LOUISBROWARD COUNTY SCHOOLSGATV-10BLUE RIDGE PUBLIC TVLAKE COUNTY PUBLIC SCHOOLSROANOKE COUNTY PUBLIC SCHOOLSNEW HANOVER COUNTY PUBLIC SCHOOLSKAWE/KAWBDHTVE2CC BOCESCOMCAST DELMARVA-DOVERNACEPF INC.WVPT-HARRISONBURGKJLA/KXLAPISCATAWAY HIGH SCHOOLKELM EL MONTECOMMUNITY ACCESS PARTNERS OF SAN BUENAVENTURABILLINGS COMMUNITY-CABLE CHANNEL 7COMMUNITY ACCESS TELEVISION-SALINAKCWC/CH. 4-WYOMING PUBLIC TELEVISIONKULC-TV-SALT LAKE CITYMONTANA PBS-MONTANA PUBLIC TELEVISIONKINGWOOD CABLEVISION KC 37COMMUNITY TELEVISIONWISCONSIN PUBLIC TVKRSCWCTE-TV/COOKEVILLE PUBLIC BROADCASTING SYSTEMWYAM TV 56WAND-TVMVTV 9-MIDVALLEY TELEVISION-TOPPENISHUNION PARISH SCHOOL BOARDEDUCATION TVDES MOINES INDEPENDENT COMMUNITY SCHOOL DISTRICTRICHARDSON INDEPENDENT SCHOOL DISTRICTKGEB-TVCLACKAMAS COUNTY CABLE COMMUNICATIONMCMINNVILLE COMMUN. MEDIA-CH. 11TUALATIN VALLEY TELEVISIONICTV INC.-GRAND RAPIDSWBKIWVIZWCET-TV 48WDCQAURORA COMMUNITY TVST. PAUL NEIGHBORHOOD NETWORKVALLEY ACCESS CHANNELS-STILLWATERSTRATFORD HIGH SCHOOLRICHARDSON INSTRUCTIONAL TVCITY OF GARLAND CGTV 16WLJT-CHANNEL 11-MARTINST. MARTIN PARISH-BREAUX BRIDGE

32
CITY 6 COA-TVBLOOMINGTON CATS-COMMUNITY ACCESS TV SERVICESWVPB-WEST VIRGINIA PUBLIC BROADCASTINGWITF TV-33M-PACTHAWAII DEPARTMENT OF EDUCATIONSEATTLE PUBLIC SCHOOLS TVKDOL TV 13-OAKLAND UNIFIED DISTRICTKCLV 2KNXT CH. 49KENW-TV 3 EASTERN NEW MEXICO UNIVERSITYIDPTV-IDAHO PUBLIC TELEVISIONNEW CASTLE COMMUNITY TV-CHAPPAQUACABARRUS COUNTY PUBLIC SCHOOLSANCHORAGE PUBLIC SCHOOLSKCNS-TV 38KOCE-TVICN5-INSIGHT PRODUCTIONSWHEATON COMMUNITY TVINDIANAPOLIS PUBLIC SCHOOLSGO CAT TV 3BROCKTON COMMUNITY ACCESSOHIO EDUCATIONAL TELECOMMUNICATIONSBALTIMORE CITY PUBLIC SCHOOLS CABLE CH. 7ACCESS OSCEOIAWCNY CH. 24-CENTRAL NEW YORK’S OWN-SYRACUSEGOVERNMENT CHANNELWESTERN RESERVE CABLE 9 MACEDONIAWTJX-TV CHANNEL 12PUBLIC ACCESS OF ANDOVER COUNTYFLORIDA KNOWLEDGE NETWORKDIXIE COUNTY HIGH SCHOOLSWAYCROSS COMMUNITY MEDIA-FORREST PARKCHARTER COMMUNICATIONS COMMUNITY VISION 21LMC-TV MAMARONECKCITIZENS TELEVISIONCITIZENS TELEVISION INC. NEW HAVENDENVER PUBLIC SCHOOLS DISTANCE LEARNING NETWORKDENVER PUBLIC SCHOOLSKATV CHANNEL 8 CITY OF ARVADABISD AND KBSDCHESAPEAKE COUNTY PUBLIC SCHOOLS WCTV 48NORFOLK CITY PUBLIC SCHOOLSVIRGINIA BEACH CITY PUBLIC SCHOOLSHAMPTON CITY SCHOOLSWPBS CH. 16WCVE-RICHMOND PUBLIC BROADCASTING SYSTEMLONG BEACH UNIFIED SCHOOL DISTRICTPORTLAND CABLE ACCESSTV ETC OF VANCOUVERACCESS SACRAMENTO

33
KTOP-OAKLANDKVPT-VALLEY PUBLIC TVCHESTERFIELD COUNTY PUBLIC SCHOOLSCITY TV 19ICAT/TOWN HALLNWOETBUFFALO TVTVW-36WFWA 39-FORT WAYNE AIRMANHATTAN NEIGHBORHOOD NETWORKHENRICO COUNTY PUBLIC SCHOOLSCLEVELAND MUNICIPAL SCHOOL DISTRICTPHILADELPHIA PUBLIC SCHOOLS-TV UTILIZATIONWEST PALM BEACH CHANNEL 20/WPY-38WNYE CHANNEL 25-NEW YORK CITY BOARD OF EDUCATIONWGTE BROADCASTING-GREATER TOLEDO EDUCATIONMETRO LOUISVILLE GOVERNMENTWHNSCITY OF COLUMBUS/TELECOMMUNICATIONSKUAC-THE ALASKA ONE NETWORKKTVD UPN 20FWISD-TV 33PLANO TELEVISION NETWORKCAMPBELL COUNTY CABLE BOARD AND COMMUNITY MEDIA CENTERTHE HEALTH TV CHANNELWHRO-CHANNEL 15ETSEONORWOOD COMMUNITY TELEVISIONMEDIA NETWORK OF WATERFORDCORALVISIONBAY COUNTY DISTRICT SCHOOLSNEWPORT NEWS CITY PUBLIC SCHOOLSCOMMUNITY ACCESS TELEVISIONPORTLAND PUBLIC SCHOOLS/CABLE CHANNEL 28SIERRA NEVADA COMMUNITY ACCESS TVCITY-TV OF SANTA BARBARA-CHANNEL 18WBRW 6-ROMEOTRAVERSE BAY AREA INTERMEDIATE SCHOOL DISTRICTALEXANDRIA CITY COUNTY PUBLIC SCHOOLSARLINGTON CABLE CHANNEL 32ACCESS BELLINGHAM INCORPORATED-ABMI CABLE 8MANASSAS CITY PUBLIC SCHOOLSMEAC 9NBTV 98-NEW BEDFORDECTV-ENUMCLAWKLVX-CHANNEL 10CYPRESS CITY CHANNELPADUCAH 2 COMMUNITY ACCESSWNET-NEW YORK THIRTEENMONTGOMERY COUNTY PUBLIC SCHOOLSCOX COMMUNICATIONS

34
WLVTGROTON CABLE ACCESSSTAR SCHOOLS-CHANNEL 57WPNEGILLETTE PUBLIC ACCESS TVCTV15DEPARTMENT OF EDUCATION/ATREL SEGUNDO COMMUNITY CABLEVILLAGE OF MOUNT PROSPECT II-MPTV 17SABINE PARISH SCHOOLSVAIL VALLEY COMMUNITY TELEVISIONSFA-TVNEBRASKA DEPARTMENT OF EDUCATIONWTVI CHARLOTTEOFFICE OF CAMBRIDGE CABLE TELEVISIONGCS21-THE EDUCATIONAL STATIONHOM-TV MERIDIAN GOVT. TV-OREMOSMOORE HAVEN JR./SR. PUBLIC SCHOOLAKAKU MAUI COMMUNITY TVFVTVSCCWLIW 21 LONG ISLANDPUENTE HILLS COMMUNITY PROGRAMMING CORP.-HACIENDA HEIGHTLA COUNTY OFFICE OF EDUCATIONSDPTV-SOUTH DAKOTA PUBLIC TELEVISIONKSPS PUBLIC TELEVISION-SPOKANE PUBLIC SCHOOLSCITY OF COPPELLPAC TV-PLYMOUTHKLRU TV CAPITAL OF TEXAS PUBLIC BROADCASTINGWGCU FLORIDA GULF COAST UNIVERSITY-FT. MEYERS

35
Appendix B
Follow-Up Survey: “NASA SCI Files” and “NASA CONNECT”
Ask to speak with Program Manager/name on list [If none, ask for Station Manager]. Hello, I am_______ with Continental Research and we’ve been asked to conduct a little follow-up survey about twoprograms produced by the NASA Center for Distance Learning. Your station registered to receive one ormore of these shows.
SECTION A
1) I am not speaking specifically about NASA shows, yet. In general, what is the single mostimportant thing that impacts your decision to select a program to air on your station?
_________________________________________________________________________
_________________________________________________________________________
2) Let’s talk about how you decide whether or not to select a program to air on your station. Using a1 to 10 scale where 1 is Not Important and 10 is Extremely Important, how important is the cost ofthe program?
Not Imp. 1 2 3 4 5 6 7 8 9 10 Ext. Imp.
3) On a 1 to 10 scale where 1 is Not Important and 10 is Extremely Important, how important is thetechnical quality of the program?
Not Imp. 1 2 3 4 5 6 7 8 9 10 Ext. Imp.
According to the Paperwork Reduction Act of 1995, no persons are required to respond to a collection ofinformation unless it displays a valid OMB control number. The valid OMB control number for thisinformation is (OMB 2700-0012).
The time required to complete this information collection should not exceed 45 minutes per responseincluding the time to review the instructions, search existing data resources, gather the data needed, andcomplete and review the information collected.
If you have concerns regarding the status of your individual submission of this survey, write directly to:The NASA Langley Center for Distance Learning, Attn: Dr. Thomas E. Pinelli, Mail Stop 400-DL, Officeof Education, NASA Langley Research Center, Hampton, VA 23681-2199.

36
4) On a 1 to 10 scale where 1 is Not Important and 10 is Extremely Important, how important is howeasy it is to get the program?
Not Imp. 1 2 3 4 5 6 7 8 9 10 Ext. Imp.
5) On a 1 to 10 scale where 1 is Not Important and 10 is Extremely Important, how important is theeducational value of the program?
Not Imp. 1 2 3 4 5 6 7 8 9 10 Ext. Imp.
6) On a 1 to 10 scale where 1 is Not Important and 10 is Extremely Important, how important ishaving few restrictions on the use of the program?
Not Imp. 1 2 3 4 5 6 7 8 9 10 Ext. Imp.
7) On a 1 to 10 scale where 1 is Not Important and 10 is Extremely Important, how important areviewer recommendations?
Not Imp. 1 2 3 4 5 6 7 8 9 10 Ext. Imp.
8) In the past year, did you receive a program called NASA SCI Files?
1- Yes (Ask Section B) 2- No
9) And, did you receive a program called NASA CONNECT?
1- Yes (Ask Section C) 2- No
SECTION B (Look at Q8)
10) Are you Very Satisfied, Satisfied, Dissatisfied, or Very Dissatisfied with NASA SCI Files interms of its overall quality?
4- Very Satisfied 3- Satisfied 2- Dissatisfied 1- Very Dissatisfied
11) Are you Very Satisfied, Satisfied, Dissatisfied, or Very Dissatisfied with NASA SCI Files interms of its educational value?
4- Very Satisfied 3- Satisfied 2- Dissatisfied 1- Very Dissatisfied

37
12) Are you Very Satisfied, Satisfied, Dissatisfied, or Very Dissatisfied with NASA SCI Files interms of its technical quality?
4- Very Satisfied 3- Satisfied 2- Dissatisfied 1- Very Dissatisfied
13) Are you Very Satisfied, Satisfied, Dissatisfied, or Very Dissatisfied with NASA SCI Files interms of being aligned with national math, science, and technology standards?
4- Very Satisfied 3- Satisfied 2- Dissatisfied 1- Very Dissatisfied
14) Are you Very Satisfied, Satisfied, Dissatisfied, or Very Dissatisfied with NASA SCI Files interms of being developmentally appropriate for children in that age group?
4- Very Satisfied 3- Satisfied 2- Dissatisfied 1- Very Dissatisfied
15) Are you Very Satisfied, Satisfied, Dissatisfied, or Very Dissatisfied with NASA SCI Files interms of being easily incorporated into that grade level’s curriculum?
4- Very Satisfied 3- Satisfied 2- Dissatisfied 1- Very Dissatisfied
16) Are you Very Satisfied, Satisfied, Dissatisfied, or Very Dissatisfied with NASA SCI Files interms of enhancing the integration of math, science, and technology?
4- Very Satisfied 3- Satisfied 2- Dissatisfied 1- Very Dissatisfied
17) Are you Very Satisfied, Satisfied, Dissatisfied, or Very Dissatisfied with NASA SCI Files interms of showing women and minorities performing challenging engineering and scientific tasks?
4- Very Satisfied 3- Satisfied 2- Dissatisfied 1- Very Dissatisfied
18) Are you Very Satisfied, Satisfied, Dissatisfied, or Very Dissatisfied with NASA SCI Files interms of the quality of the educator guides?
4- Very Satisfied 3- Satisfied 2- Dissatisfied 1- Very Dissatisfied
19) Are you Very Satisfied, Satisfied, Dissatisfied, or Very Dissatisfied with NASA SCI Files interms of the quality of the Web-based activities?
4- Very Satisfied 3- Satisfied 2- Dissatisfied 1- Very Dissatisfied

38
20) Are you Very Satisfied, Satisfied, Dissatisfied, or Very Dissatisfied with NASA SCI Files interms of the feedback you get from the audience?
4- Very Satisfied 3- Satisfied 2- Dissatisfied 1- Very Dissatisfied
21) Are you Very Satisfied, Satisfied, Dissatisfied, or Very Dissatisfied with NASA SCI Files interms of how interesting the shows are?
4- Very Satisfied 3- Satisfied 2- Dissatisfied 1- Very Dissatisfied
22) Are you Very Satisfied, Satisfied, Dissatisfied, or Very Dissatisfied with NASA SCI Files interms of how credible the shows are, being that they are from NASA?
4- Very Satisfied 3- Satisfied 2- Dissatisfied 1- Very Dissatisfied
23) Do you have any suggestions for improving NASA SCI Files? 9 None
_________________________________________________________________________
_________________________________________________________________________
SECTION C (Look at Q9)
24) Are you Very Satisfied, Satisfied, Dissatisfied, or Very Dissatisfied with NASA CONNECT interms of its overall quality?
4- Very Satisfied 3- Satisfied 2- Dissatisfied 1- Very Dissatisfied
25) Are you Very Satisfied, Satisfied, Dissatisfied, or Very Dissatisfied with NASA CONNECT interms of its educational value?
4- Very Satisfied 3- Satisfied 2- Dissatisfied 1- Very Dissatisfied
26) Are you Very Satisfied, Satisfied, Dissatisfied, or Very Dissatisfied with NASA CONNECT interms of its technical quality?
4- Very Satisfied 3- Satisfied 2- Dissatisfied 1- Very Dissatisfied
27) Are you Very Satisfied, Satisfied, Dissatisfied, or Very Dissatisfied with NASA CONNECT interms of being aligned with national math, science, and technology standards?
4- Very Satisfied 3- Satisfied 2- Dissatisfied 1- Very Dissatisfied

39
28) Are you Very Satisfied, Satisfied, Dissatisfied, or Very Dissatisfied with NASA CONNECT interms of being developmentally appropriate for children in that age group?
4- Very Satisfied 3- Satisfied 2- Dissatisfied 1- Very Dissatisfied
29) Are you Very Satisfied, Satisfied, Dissatisfied, or Very Dissatisfied with NASA CONNECT interms of being easily incorporated into that grade level’s curriculum?
4- Very Satisfied 3- Satisfied 2- Dissatisfied 1- Very Dissatisfied
30) Are you Very Satisfied, Satisfied, Dissatisfied, or Very Dissatisfied with NASA CONNECT interms of enhancing the integration of math, science, and technology?
4- Very Satisfied 3- Satisfied 2- Dissatisfied 1- Very Dissatisfied
31) Are you Very Satisfied, Satisfied, Dissatisfied, or Very Dissatisfied with NASA CONNECT interms of showing women and minorities performing challenging engineering and scientific tasks?
4- Very Satisfied 3- Satisfied 2- Dissatisfied 1- Very Dissatisfied
32) Are you Very Satisfied, Satisfied, Dissatisfied, or Very Dissatisfied with NASA CONNECT interms of the quality of the educator guides?
4- Very Satisfied 3- Satisfied 2- Dissatisfied 1- Very Dissatisfied
33) Are you Very Satisfied, Satisfied, Dissatisfied, or Very Dissatisfied with NASA CONNECT interms of the quality of the Web-based activities?
4- Very Satisfied 3- Satisfied 2- Dissatisfied 1- Very Dissatisfied
34) Are you Very Satisfied, Satisfied, Dissatisfied, or Very Dissatisfied with NASA CONNECT interms of the feedback you get from the audience?
4- Very Satisfied 3- Satisfied 2- Dissatisfied 1- Very Dissatisfied
35) Are you Very Satisfied, Satisfied, Dissatisfied, or Very Dissatisfied with NASA CONNECT interms of how interesting the shows are?
4- Very Satisfied 3- Satisfied 2- Dissatisfied 1- Very Dissatisfied

40
36) Are you Very Satisfied, Satisfied, Dissatisfied, or Very Dissatisfied with NASA CONNECT interms of how credible the shows are, being that they are from NASA?
4- Very Satisfied 3- Satisfied 2- Dissatisfied 1- Very Dissatisfied
37) Do you have any suggestions for improving NASA CONNECT? 9 None
_________________________________________________________________________
_________________________________________________________________________
SECTION D
38) Overall, have you been Very Satisfied, Satisfied, Dissatisfied, or Very Dissatisfied with thedealings you’ve had with NASA’s Center for Distance Learning?
4- Very Satisfied (Go to Q40) 2- Dissatisfied3- Satisfied (Go to Q40) 1- Very Dissatisfied
39) (If Q38 = 2 or 1) What didn’t go well?
________________________________________________________________________
________________________________________________________________________
40) Does your station receive the NASA programs by downlink, or does NASA send them to you?
We downlink them ≡ Is that by 1- KU or 2- C-Band?
3- NASA sends them to us
x- Other ______________________________________
41) Do you personally make decisions about which programs will be included in your station’slineup?
1- Yes 2- No
42) Would you recommend [NASA SCI Files or NASA CONNECT] to a colleague at anotherstation?
1- Yes 2- No

41
43) Does your station broadcast educational programs to schools?
1- Yes 2- No/No longer
44) Have state budget cuts in the past two years impacted your ability to broadcast educationalprograms to schools?
1- Yes 2- No 3- We never did broadcast to schools
45) Some stations have begun to stream video for educational programs instead of broadcasting it.Have you considered this, or perhaps are you already doing this?
1- No, it’s not a consideration now
2- We’ve considered it/We may do this in the future
3- We already do that
46) Some stations have entered into a business agreement with a provider of video programming suchas “United Streaming.” Have you considered this, or perhaps are you already doing this?
1- No, it’s not a consideration now
2- We’ve considered it/We may do this in the future
3- We already do that
47) Some stations have joined a consortium with other stations, such as “ChalkWave.Com”, toprovide access to educational programs through a dedicated hard drive. Have you considered this,or perhaps are you already doing this?
1- No, it’s not a consideration now
2- We’ve considered it/We may do this in the future
3- We already do that
48) How many years have you been working at this TV station? ______ Years
49) What is the occupational area of your position at the station?
___________________________________

42
50) What is the highest level of education you have completed?
1- High school or less 4- A Master’s degree2- One to three years of college 5- A Doctorate3- A four-year college degree
51) And, are you in your:
2- Twenties 3- Thirties 4- Forties 5- Fifties 6- Sixties or older?
THANKS SO MUCH FOR HELPING WITH OUR SURVEY!
RECORD:
52) Gender: 1- Male 2- Female
53) State: ______
54) Station Type: 1- Cable 2- PBS 3- ITV 4- Commercial
55) Time Zone: 0- Eastern 4- Alaska1- Central 5- Hawaii2- Mountain 9- Out of Country3- Pacific

REPORT DOCUMENTATION PAGE Form ApprovedOMB No. 0704-0188
2. REPORT TYPE
Technical Memorandum 4. TITLE AND SUBTITLE
Results of a Telephone Survey of Television Station Managers Concerning the NASA SCI Files™ and NASA CONNECT™
5a. CONTRACT NUMBER
6. AUTHOR(S)
Pinelli, Thomas E.; Perry, Jeannine
7. PERFORMING ORGANIZATION NAME(S) AND ADDRESS(ES)
NASA Langley Research CenterHampton, VA 23681-2199
9. SPONSORING/MONITORING AGENCY NAME(S) AND ADDRESS(ES)
National Aeronautics and Space AdministrationWashington, DC 20546-0001
8. PERFORMING ORGANIZATION REPORT NUMBER
L-18376
10. SPONSOR/MONITOR'S ACRONYM(S)
NASA
13. SUPPLEMENTARY NOTESPinelli, Langley Research Center; Perry, Continental Research, Norfolk.An electronic version can be found at http://techreports.larc.nasa.gov/ltrs/ or http://ntrs.nasa.gov
12. DISTRIBUTION/AVAILABILITY STATEMENTUnclassified - UnlimitedSubject Category 82Availability: NASA CASI (301) 621-0390 Distribution: Standard
19a. NAME OF RESPONSIBLE PERSON
STI Help Desk (email: [email protected])
14. ABSTRACT
A telephone survey of television station managers concerning 2 instructional television programs, the NASA SCI Files™ and NASA CONNECT™, offered by the NASA Langley Center for Distance Learning (CDL) was conducted. Using a 4-point scale, with 4 being very satisfied, survey participants reported that they were either very satisfied (77.1 percent) or satisfied (19.9 percent) with the overall (educational and technical) quality of the NASA SCI Files™. Using a 4-point scale, with 4 being very satisfied, survey participants reported that they were either very satisfied (77.9 percent) or satisfied (19.1 percent) with the overall (educational and technical) quality of NASA CONNECT™.
15. SUBJECT TERMS
Education; Survey; Evaluation; Television
18. NUMBER OF PAGES
47
19b. TELEPHONE NUMBER (Include area code)
(301) 621-0390
a. REPORT
U
c. THIS PAGE
U
b. ABSTRACT
U
17. LIMITATION OF ABSTRACT
UU
Prescribed by ANSI Std. Z39.18Standard Form 298 (Rev. 8-98)
3. DATES COVERED (From - To)
5b. GRANT NUMBER
5c. PROGRAM ELEMENT NUMBER
5d. PROJECT NUMBER
5e. TASK NUMBER
5f. WORK UNIT NUMBER
23-090-20-09
11. SPONSOR/MONITOR'S REPORT NUMBER(S)
NASA/TM-2004-213029
16. SECURITY CLASSIFICATION OF:
The public reporting burden for this collection of information is estimated to average 1 hour per response, including the time for reviewing instructions, searching existing data sources, gathering and maintaining the data needed, and completing and reviewing the collection of information. Send comments regarding this burden estimate or any other aspect of this collection of information, including suggestions for reducing this burden, to Department of Defense, Washington Headquarters Services, Directorate for Information Operations and Reports (0704-0188), 1215 Jefferson Davis Highway, Suite 1204, Arlington, VA 22202-4302. Respondents should be aware that notwithstanding any other provision of law, no person shall be subject to any penalty for failing to comply with a collection of information if it does not display a currently valid OMB control number.PLEASE DO NOT RETURN YOUR FORM TO THE ABOVE ADDRESS.
1. REPORT DATE (DD-MM-YYYY)
05 - 200401-