results interpretation - american weigh scalesamericanweigh.com/pdf/biospace/inbody520 results...
TRANSCRIPT

Results Interpretation
Res
ults
Inte
rpre
tatio
n

Glossary39
Bioelectrical Impedance AnalysisBIA (Bioelectrical Impedance Analysis) is a technique that measures body impedance,sending a low, safe electrical current through the body. The current only passes throughthe water fluids inside the body, and based on the impedance values obtained, the bodywater volume is calculated. As water fluids are usually inside muscle tissues, by usingthe water volume, the fat free mass (FFM) can be calculated.
The best advantage of impedance is its high precision, accuracy and the non-invasiveapplication of its method.
However, the volume of body water fluctuates to sustain homeostasis in the body thus,alters each measurement. To minimize measurement errors and ensure its high accura-cy, subjects must follow standard pretest guidelines under the same conditions.
ImpedanceImpedance, denoted Z, is an expression of the opposition to alternate and/or direct elec-tric current. This is a vector quantity consisting of a sum of electric resistance (R), induc-tive reactance (XL) and capacitive reactance (XC).
The resistor is a device used to control the current of an electrical circuit by providingresistance. In the human body, the water volume is the resistor. Body water is composedof both intracellular and extracellular water, and both resist the current.
The capacitor is an electrical element used to store charge temporarily, generally consist-ing of two metallic plates separated and insulated from each other by a dielectric. Theresistance of a capacitor is called reactance, and in the body, the cell membrane per-forms this function.
Simply, the human body has all the components of an electronic conductor. The imped-ance is expressed as a sum of the vectors:
Impedance2= Resistance
2+ Reactance
2
8-point Tactile Electrode MethodThe 8-point tactile electrodes easily contact the body at 2 points in each hand and foot, 8points in total. This method divides the body into 5 regions (left and right arm, trunk, left
and right leg) with a minimal error rate, enhancing measurement reproducibility. The com-mon method using 4 electrodes divides the body into only 2 regions (the upper and lower
body) leading to over-generalized inaccurate results. The 8-point tactile electrode methodmeasures the 5 segments of the body directly, giving pinpoint measurement of each sec-
Body Compositon Glossary

Glossary 40
www.biospaceamerica.com
tion. This method minimizes the error and detects the body water content and the level ofmuscle development in each segment. This helps patients and athletes that need pin-point accuracy of their muscle measurements, and is also extremely helpful in rehabilita-tive medicine and movement cure.
There are other methods such as pincers or ECGs, but this method is far easier to usefor testing. The natural placement of hands, feet and ankles yields consistent measure-ments, minimizing error.
The 8-point tactile electrode method is classified as a tetra-polar method because it uti-lizes 4 electrodes at a time selected automatically by an internal microprocessor.
Multi-Frequency AnalysisConventional BIA uses a single frequency and estimates the amount of intracellularwater from the extracellular impedance values. Low frequency current hardly travelsthrough the intracellular water resulting in inaccurate measurements. The proportion ofintra and extracellular water is consistent in a healthy body; however, in children, elderlypeople, obese people and patients, their amounts may be imbalanced. Generally, extra-cellular water is measured by low frequency currents (lower than 50kHz), and intracellularwater is measured by high frequency currents (higher than 200kHz) and it is important toknow both.
Multifrequency analysis utilizes a variety of frequencies from 1 kHz to 1 MHz, accuratelyassessing body water content, the principal component in BIA. It also compares theresults of the lower currents with the higher currents, and calculates water distribution inthe intracellular and extracellular compartments.
The body resistance increases with currents below 50 kHz, and the current loss is lowerwith higher frequencies. This technology is utilized with great reliability and precision.
Segmental AnalysisSegmental measurement involves breaking down the body into 5 segments (right arm, left
arm, trunk, right leg and left leg) and measuring the resistance for each segment separately.Thus, the amount of body water and fat free mass in each segment are provided.Furthermore, the analysis is highly accurate because the measured value of each partdoes not affect the measurements of the others. These results are not from estimationbut direct measurement.
Other body composition analyzers fail to measure body fat accurately and body shapecannot be determined. They use empirical references and estimated values to correctthe inaccurate measurements. The InBody examines segmental development of the sub-ject and gives exact measurements regardless of gender, age, disease and ethnicity.
The trunk impedance is the most important segmental measurement of all. The trunk,because of the larger circumference, contributes the least to impedance. Its impedance

Glossary41
ranges from 15 to 30 depending on the physical size of the subject.
Unlike in the limbs, 2-3 difference in the trunk is considered a significant error, capableof affecting the results. Therefore, the precise measurement of the trunk is the key toaccurate whole body analysis.
Empirical DataEmpirical estimation refers to the application of variables estimated from innumerouspersonal information inputted, such as gender or age, and from some general assump-tions, like that athletes usually have more muscle than general people. For example,body fat mass of females can be estimated based on the empirical fact that women usu-ally have more body fat mass than men. Thus, in order to adjust inaccurate results,empirical estimations refer to those variables that may affect the results of a body com-position analysis.
ObesityObesity is defined as an excessively high amount of body fat or adipose tissue in rela-tionship to lean body mass.
Until the 90’s, obesity was considered just one factor leading to disease, but the WHOdefined obesity as a disease in itself, requiring necessary control and treatment. Now,obesity is one of the world’s most common diseases, with several different types andtreatments.
Framingham’s studies show that 20% more weight than the standard level increases therisk of health injury, and 120% more weight is medically termed obese. National Instituteof Health (NIH) agreed with this
Methods to evaluate obesity are becoming more accurate and researchers have beenutilizing many different methods to identify obesity such as body mass index (BMI), sub-cutaneous skin fold measurement, WHR, waist circumference, underwater weighing den-sitometry, etc. After 1980, with the improvement in technology, the methods diagnosingobesity improved as well. These improved methods include BIA, CT, DEXA, MRI,infrared therapy, ultrasound, and more.
Muscular ObesityMuscular obesity type individuals have a high quantity of muscle compared to weight, butthey also have a high quantity of body fat. This frequently appears in overweight athleteswho have a lot of muscle as well as fat.

Glossary 42
www.biospaceamerica.com
Sarcopenic ObesitySarcopenic obese people have a standard weight, a low BMI, but a disproportional bodyfat percentage. It occurs frequently in young Asian women. Despite looking thin, theyhave a low level of lean body mass and a high percentage of body fat. It is hard to detectthis kind of obesity just by BMI or through general observations, so body compositionanalysis is a helpful tool to detect this state of obesity. The treatment focuses on increas-ing muscle content and decreasing body fat. Low fat diets and increased protein con-sumption are recommended in conjunction with weight training and physical activity.
Intracellular Water / Extracellular WaterBody Water are classified as intracellular and extracellular water. The fluid inside the cellmembrane is considered intracellular water (ICW), and the extracellular Water (ECW) isthe water in the space between the cells (interstitial fluid) as well as the plasma fluid. Theproportion between intracellular and extracellular water balanced in healthy, normal indi-viduals, and any disproportion is most likely caused by edema, due to an increased levelof interstitial water.
Total Body WaterAbout 99% of all molecules in the body are water, about 70% of total body weight. Thebody water supply is responsible for and involved in nearly all metabolism, includingdigestion, absorption, circulation, and excretion. It also helps maintain normal body tem-perature and is essential for carrying waste products out of the body.
Inside muscle, there is protein and water. Through body water composition, the musclequantity can be measured. The body water is distributed throughout the different com-partments in the body. Three-fifth of it is in the intracellular compartment, and anotherfifth is the extracellular compartment.
Body FatBody fat is the result of excess calorie intake. These calories are deposited as fat toreserve energy. Lipids yield 9 kcal of energy per gram while carbohydrates and proteinsyield only 4 kcal of energy per gram. Body fat serves as a protective cushion and pro-vides structural support to prevent injury of vital organs such as heart, liver, kidneys, andspleen. Body fat also insulates the body from heat loss and extreme temperaturechanges, and these deposits under the skin can be metabolized to generate heat inresponse to low skin temperatures.
Most of the fat in food is in the form of triglyceride. Fatty acids are classified according totheir degree of saturation as saturated, monounsaturated and polyunsaturated fattyacids. Because of hydrophobic property of fatty acids, they are transported through blood

Glossary43
as a lipoprotein. High-density lipoproteins (HDL), low-density lipoproteins (LDL) and verylow-density lipoproteins (VLDL) are used as parameters to determine hyperlipidemia.
Underwater weighing is considered one of the gold standards of body compositionassessment. In this procedure, body density is calculated through body volume accord-ing to the Archimedes principle of displacement, which states that an object submergedin water is buoyed up by the weight of the displaced water. Once body density has beendetermined, one can then convert this value into a body fat percentage through calculations.
In BIA method, the electric current flows through body water but not through body fat.Resistance increases with the level of fat content, and impedance values rise.
Fat is the most concentrated source of energy, and excess may be harmful. Excess bodyfat in relation to weight is considered obesity, and its distribution or accumulation in cer-tain parts of the body plays an important role in increasing the risk of many diseases andhealth conditions.
Subcutaneous FatThe subcutaneous fat layer cushions the dermis from underlying tissues, such as muscleand bone. This tissue is usually composed of fat cells as well as the structures that runthrough it, like blood vessels, nerves, etc. There are some differences in the quantity ofsubcutaneous fat by gender and age. Adult females are prone to have more subcuta-neous fat than juveniles when men have less than both of these groups. Fat helps main-tain body temperature and store excess energy. Visceral fat and subcutaneous fat areboth included in body fat, but subcutaneous fat is less of a threat for diseases.
Basal Metabolic RateBasal metabolic rate is the lowest rate of energy expenditure to sustain life. (i.e. neuro-
transmissions, blood circulation, respiration, digestion, body temperature maintenance, and
other cellular functions.) It is measured at rest (but not asleep) for minimum 12 hours withina thermally neutral body. This rate is directly related to lean body mass. Therefore, evenwith the same weight, individuals with less body fat and more muscle have a higherbasal metabolic rate.
There are three methods to expend energy: basal metabolism, the thermic effect of foodand activity. Energy expenditure by food consumption depends on digestion, distributionafter absorption, and storage and this method of expenditure cannot be increased. Inorder to lose weight, it is necessary to increase basal metabolism or/and activity, andappropriate exercises are recommended to increase muscle quantity and basal metabo-lism and to avoid the repercussions of extreme dieting.

Glossary 44
www.biospaceamerica.com
Balance between the Upper and Lower BodyThe InBody measures Impedance Index in four limbs and a trunk separately. Healthyindividuals who exercise regularly have a well-balanced upper and lower body. Bodiesthat are imbalanced are correlated with disease and lack of exercise.
Many middle-aged men have a weak and unbalanced lower body. On the other hands,young women and children show an insufficiency of muscle in their arms. A lack of exer-cise utilizing certain parts of the body causes imbalances in the muscle development.
Physical activityWeight training increases both muscle content and strength. This type of exercise iscalled anaerobic exercise and does not utilize oxygen for energy. Muscle stimulationfacilitates blood circulation and increase muscle fibers.
Activities must start with the bigger muscles and then utilize the smaller ones. For begin-ners, three sets of each exercise are recommended. One set of exercise is 10-12 timesof repeated movement.
Breathing is very important when doing physical activities; inhale with muscle tension,and exhale with muscle relaxation. Always breathe! In order to decrease injury and mus-cle fatigue by lactate accumulation, each exercise session should begin with a warm-upof aerobic exercise. Examples of weight-training exercises include dumbbells, push-ups,curl-ups or use of equipment such as shoulder press and the leg curl machine.
Importance of physical activity1. 90% of the body’s energy is consumed by muscle, making muscle the princi-
pal fat burner. Therefore, development of muscle and bone by physical activityincreases the body’s caloric consumption.
2. Steady physical activity maintains skin elasticity and balances body shape.
3. Stimulation of bone is necessary to prevent osteoporosis by increasing bonedensity.
4. Muscle has more density than fat so people with more muscle will look thinnerregardless of weight.
Aerobic ExerciseThe American College of Sports Medicine defines aerobic exercise as “any activity thatuses large muscle groups, can be maintained continuously, and is rhythmic in nature.”After 5 minutes of exercise, the volume of oxygen intake and expenditure producingenergy becomes equal.
There are many aerobic exercises like jogging, running, swimming, bicycling, etc.
The benefits include an efficient heart, weight loss, improved mental health, improvedimmune system, improved stamina, disease reduction, increased life span, improved

Glossary45
muscle health and others. For more improvements, the heart rate is kept at the lower endof the target heart rate zone, or in other words, at 40-50% of maximum exercise capacity.
The Institute of Medicine (IOM) issued a report recommending that adults should spendat least 60 minutes doing moderately intense physical activity every day of the week.Generally, normal adults should exercise 3 times a week to improve cardio respiratoryresistance and frequency should eventually increase to 5 times a week in order to contin-ue improvement. Beginners should start with 5 minutes of exercise 3-4 times a week.People who exercise more than 5 times a week should alternate body endurance exer-cises and other activities, like swimming or bicycling to utilize different muscle groupsand give others some rest.
Obese people need to do more aerobic exercise. After 30 minutes of exercise, thesource of energy shifts from carbohydrates to fat, helping burn fat reserves and decreasebody fat.
For example, bicyclists use their legs, but the fat utilized is not only the fat concentratedin legs, but rather all throughout their body. The fat is broken down and used as energy.So, running or jogging is better for weight loss than sit-ups.

www.biospaceamerica.com

INTRODUCTION
This manual provides a detailed explanation of the InBody520 Body CompositionAnalyzer and its functions. This manual makes use of actual examinees results to explainthe following:the meaning of various analyses, constituents of the standard range for aparticular test, required health management measures, and how to properly use this pieceof equipment. Please read this manual carefully before using our InBody520 BodyComposition Analyzer in your everyday life.

Body Composition Analysis1
Things to keep in mind for accurate measurement using the InBody520
The accuracy of a body composition analysis test depends on the examineeand on the environment in which the test is conducted. As such, certain pre-cautionary steps should be taken in order to assure accurate test results.Before conducting the test, please read the following rules carefully andmake sure that the examinees have taken all the factors capable of affectingits test results and accuracy into account.
Precautionary steps to be taken before conducting a test
BODY COMPOSITION ANALYSIS
BODY COMPOSITION ANALYSIS
1. Assure the test is conducted before a meal .
In cases where the examinee has already eaten, the test should beput off at least for two hours after the meal. This is because thefood mass is included in the subject’s weight and thus, may resultin measurement errors.
2. Make sure to use the bathroom.
Waste is not included in the body’s compositional elements, butthe volume of urine and excrement is included in the weight mea-surement. This can result in biological errors.
3. Do not exerciseright before conducting the test.Strenuous exercise or sharp movements can cause temporarychanges in body composition.
4. Stand still for about 5 minutes.
Conducting the test immediately after lying in bed or sitting for along period of time might result in a slight change in the testresults. This is because the body water tends to move to the lowerextremities of the body as soon as the person stands or gets up.
5. Do not conduct the test right after shower or sauna.
Sweating causes a temporary change in a person’s body composition.

Body Composition Analysis 2
www.biospaceamerica.com
Posture guide for body composition analysis
Weight measurement and how to step on the footpads
Please remember to remove your socks or stockingsbefore stepping onto the footpad. If at all possible wearlight clothing to ensure the accuracy of the test. Be sureto remove everything from your pockets and all acces-sories. When ready, place your feet on the footpad elec-trodes as the shapes guide you to do. A reading of yourweight will be conducted first. Do not hold on to thehandgrips while the body weight is being registered.Moreover, do not make any sudden movements duringthe weighing process.
Input of personal data and how to hold the hand grips
Please enter your exact height. If the height is incorrect,test results will be inaccurate. The gender of the exami-nee should also be entered. Once you have entered thepersonal data, take hold of the handgrips. Put yourthumb on the top of the handgrip, while holding the bot-tom of the handgrip with your other four fingers.Straighten out your elbows and leave some spacebetween your armpits and body. This will ensure properposture and alignment.
A proper posture increases the accuracy of the test results.
It is important to properly place
your feet on the footpads. Please
do not move during weighing
If the handgrips are not properly
held during the test, an incorrect
estimation of the examinee’s
body composition may occur.
Please assure that proper testing
methods are maintained until the
test is complete.
6. Do not take measurements during the menstrual cycle.Females experience increases in body water during their menstrual cycle.
7. Conduct the test at normal temperatures (68 ~77 ).
While the human body is stable at normal temperatures, body com-position is susceptible to change in hot or cold weather.
8. If a retest is carried out,make sure to conduct the test underconsistent conditions.Identical conditions (i.e. wearing the same clothes, testing before eat-ing or exercising etc.) should be maintained in order to assure the accu-racy of the test results.

Contents3
p.4
p.25
p.26p.4
p.9
p.10
p.12
p.27
RESULTS SHEET

Results interpretation 4
1. Name, Age, Height, Gender and Date
Once the body composition analysis of the examinee is completed, the results areautomatically printed. Appearing at the top of the results sheet you will see: thename (or ID), age, height and gender of the examinee and the date and time whenthe test was conducted. Personal data such as gender, age and height of the exami-nee should be entered on the LCD touch screen.
2. Body Composition Analysis
The horizontal bar graphs helpyou understand your body compo-sition when compared to standardvalues. The values next to the barsshow you the numerical valuesand the end of bars indicate your
position in the range given. If the length of the bars are similar, your body compositionis well balanced. If the length of the bars differ, it means your body composition isunbalanced. The InBody technology is able to measure weight, Lean Body Mass(LBM), and Body Fat Mass (BFM). The results sheet shows a comparative chart ofthe value of these body compositional elements using the bar graphs. Each composi-tional element has its own absolute value. The lengths of the bar graphs indicate thepercentage of the standard value for each compositional element. Therefore, a score of100% indicates the standard value calculated based on the standard weight for that par-ticular individual. When an individual controls his/her exercise levels and diet as partof a weight management program, the body composition of Body Fat Mass and LeanBody Mass (muscle) change. When a weight management program is followed, theprogram manager can verify if the body composition of the participants have properlychanged by monitoring LBM and BFM.
1) Weight
Standard weight indicates the ideal value in accordance with the examinee’sheight.The InBody520 provides the standard weight range, based on the BMI (BodyMass Index) Standard Weight Index.
BMI method
Standard Weight(kg)=ideal BMI Height2(m2)www.biospaceamerica.com
Under Normal OverUnder Normal Over
UNIT:%
Under Normal OverUnder Normal Over

Results interpretation5
The Obesity Index indicates the level of obesity. Generally, a BMI of 18.5~24.9 isused to determine the normal weight range. With the InBody520, the normal weightrange is 15% of standard value, very similar to one based on BMI (18.5~25).Standard weight is determined according to a BMI of 22 for males, a BMI of 21.5for females and a growth chart for those under 18 years of age.
2) Lean Body Mass
100% Lean Body Mass indicates that the examinee being measured has reachedhis/her standard weight and standard Lean Body Mass. The standard proportion ofLBM is 85% of the standard weight for males, and 77% of the standard weight forfemales. The normal range of LBM is 90-110% of the standard LBM. Change inmuscle is the most effective indicator of health improvements as a result of exercise.The UCLA definition of obesity is based on the level of muscle development. This def-inition is based on a proactive approach to obesity, one in which obesity is regarded asa problem involving the proportion of Lean Body Mass to Body Fat Mass.
Lean Body Mass refers to the entire body weight with the exception of Body FatMass. Athletes have a higher proportion of Lean Body Mass than regular people. Assuch, it is important for athletes to measure their Lean Body Mass. InBody520 pro-vides comprehensive data which can be used to evaluate the health of an examinee.
3) Body Fat Mass
Body Fat Mass indicates the total quantity of lipids that can be extracted from fatand other cells. Body Fat Mass is not directly measured using the BIA method, butcalculated by subtracting Lean Body Mass from the body weight. InBody520 usesthe following formula to measure Body Fat Mass:
Body Fat Mass = Body Weight - Lean Body Mass
Body Fat Mass is stored under the skin, in visceral areas and between muscles.When an examinee’s fat mass is higher than the standard range, he/she is diag-nosed as being obese (excess body fat). The range of diseases that can result fromobesity include hypertension, arteriosclerosis, hyperlipemia, fatty liver, cholelithia-sis, diabetes,obstetrical diseases, breast cancer, and endometritis

Results interpretation 6
www.biospaceamerica.com
The normal range of Body Fat Mass is ascertained by calculating an examinee’sbody fat mass as compared to the standard weight and standard Body Fat Mass.The InBody520 displays the percentage of the standard value of Body Fat Mass ina bar graph.
Table1. Standard body composition rangesMales Females
Weight 85~115% of standard weight 85~115% of standard weightLean Body Mass 90~110% of standard LBM 90~110% of standard LBMBody Fat Mass 80~160% of standard BFM 80~160% of standard BFM
Compared with Lean Body Mass, Body Fat Mass is various among people. Therefore, each bar has different scale.
HOW TO APPLY THESE RESULTS TO YOUR CLIENTS
The test results have been designed so the examinee can easily understand them,and that then facilitates his/her ability to follow the program designated. The testconductor can use alphabetical shapes that are based on the length of the graphsto provide explanations to the examinees regarding their overall health.
1) Relations among Weight, Lean Body Mass and Body Fat Mass
A person is identified as having an ideal body composition when the bodycomposition graphs form a ‘D’ shape. In such cases, the LBM bar graph islonger than the weight and Body Fat Mass bar graphs. On the other hand, ifthe LBM graph is shorter than the Body Fat Mass graph, the body composi-tion graph forms a ‘C’shape. Persons with such results should immediatelybegin taking weight control measures.
Let us now use the following examples to identify ways of using the test results.

Results interpretation7
8 different body types, based on a balanced body composition
This body composition graph forms a slightly curved‘D’ This is the ideal body composition. Of course, itgoes without saying that this healthy state should becontinuously maintained. As such, the person con-ducting the test should mention to the examinee that abdominal fat often increasesas a person gets older, and emphasize the necessity for continuously monitoringtheir body to ensure that the healthy state is maintained.
At the opposite end of the health spectrum, we findthe ‘C’ shaped graph. In this case, the examinee’sweight is within the normal range. Although theexaminee’s body weight might not be classified asobese, he/she does not have the ideal body shape.Theyare experiencing difficulties managing the shape of their bodies through simpleweight control measures. People who are in this category usually visit the obesityclinic. If a person who is diagnosed as this type change his/her body compositionthrough exercise, he/she can maintain a satisfactory body shape without actuallylosing any weight. The conductor of the test can recommend that the examinee canachieve a ‘D’ shape in his/her body composition graphs,by losing Body Fat Masswhile gaining LBM. Many adults who have a high level of Body Fat Mass areincluded in this category. Abdominal obesity is a factor in the development of car-diovascular diseases for those within the standard weight range, no different thanindividuals in the overweight range.
This type is a typical healthy body with well devel-oped LBM. However people in this category need tobe careful not to lose too much Body Fat Mass.
This type is exemplified by a person whose weight iswithin the standard range, but yet cannot be regardedas being in ideal health. For this type, the length of theLBM graph is shorter than the standard range, whilethe Body Fat Mass is within the standard range. Anexaminee of this type will also exhibit a ‘C’ shape on his/her body compositiongraphs. However, this type should be identified as a weak body type, and not as anobesity type. People who belong to this type have usually lost intestinal and mus-cular protein; a situation caused by such potential factors as a lack of exercise, lackof proper protein nutrition, or an increased.

metabolism as a result of injuries or disease. Symptoms of this include edema, thedecomposition of muscle cells, changes in nerve tissues, secondary infections, andstunted growth in children.
Obesity causes many diseases. People diagnosed asbeing obese run a higher risk of myocardial infarc-tion, congestion, cardiac failure, and hypertension. Inaddition, there exists a correlation between obesityand diabetes(NIDDM). Moreover, obese people alsorun a higher risk of contracting large intestine cancer, rectal cancer, and in the caseof males, prostatic carcinoma. Furthermore, other potential problems have beenidentified, such as a decrease in tolerance to exercise, osteoarthritis, as well as adecrease in lung function.
Athletes are usually included in the overweight muscletype. Such people can easily be included in the obesecategory when the BMI method is used. This type isdeemed to be overweight because of the weight oftheir skeletal muscle. This type of person does notneed to undertake weight control measures.
Most people who fall under the obesity type causedby excess weight are those that have been diagnosedas chronically obese. The LBM is measured to beover the standard range, not developed through exer-cise, but because the person has excessive body-composition mass compared to the standard weight. Those diagnosed as beingchronically obese need medical treatment. This type of patient should follow aweight reduction program that is designed to decrease their Body Fat Mass andtreat or prevent diseases that may accompany this condition, rather than focusingon improving the shape of their body.
Those people who are diagnosed as belonging to the-underweight weak body type, have a lower possibilityof developing adult diseases. However, should thispoor nutrition continue for a long period of time,many health problems can arise, such as a decrease inthe body’s ability to absorb nutrition, poor nutrition caused by a loss of appetite,imbalanced nutrition due to a loss of intestinal protein,metabolic disorders, as wellas other side effects.
Results interpretation 8
www.biospaceamerica.com

Results interpretation9
3. Body Water Balance
The InBody520 Analyzer mea-sures TBW by using a multi-frequency technique that sepa-rates TBW into ICW and ECW.Intracellular Water(ICW) indi-
cates the quantity of water within the cellular membrane. Extracellular Water(ECW)indicates the total quantity of water in the interstitial fluid and blood. In the case of ahealthy body, the proportion of ICW and ECW is maintained at about a 3:2 ratio.
Total Body Water (TBW) = Intracellular Water (ICW) + Extracellular Water (ECW)
Figure 1. Accuracy of Total Body Water analysis
The right graph displays the results of Total Body Water analysis, com-paring results from InBody520 with results from deuterium oxide dilu-tion method. The accuracy of Total Body Water analysis was found tobe R2adj=0.87. This confirms that InBody is capable of higher accuracywhen it comes to the analysis of Total Body Water.
Ref 1.G. Bedogni, Accuracy of an eight-point tactile electrode imped-ance method in the assessment of total body water, Eur. J. Clin. Nutr.56, 1143~1148, 2002.
Table2. Standard ranges of body composition
Males FemalesTotal Body Water 90 ~110% of standard TBW 90~110% of standard TBWIntracellular Water 90 ~110% of standard ICW 90~110% of standard ICWExtracellular Water 90 ~110% of standard ECW 90~110% of standard ECW
Under Normal OverUnder Normal Over
UNIT:%
Q1. How do you measure the amount of water in the intestines?
Microamperage current is limited in its ability to penetrate the walls of theintestines. It is impossible to measure the amount of water in the intestines usingbioelectrical impedance analysis(BIA). This is why examinees are recommendedto take the test before eating. For example, if an examinee uses InBody520 afterhaving taken in 1L of water, this water can cause an increase in body weight.Recent water addition is mistaken as fat cells, increasing the Fat Mass.
FAQ 1

Results interpretation 10
www.biospaceamerica.com
4. Obesity Diagnosis
InBody520’s obesity diagnosisfunction makes use of BMI(Body Mass Index) and PercentBody Fat to determine obesitylevels. By analyzing the exami-
nee’s weight using BMI and Percent Body Fat, InBody520 Analyzer makes it pos-sible to screen for sarcopenic obesity. People included in this sarcopenic obesitytype fall within the standard range when it comes to BMI and weight, but areregarded as obese when their percentage of body fat is calculated.
Table3. Standard ranges of body compositionStandard Range Males FemalesBMI 22 (Standard range: 18.5~24.9)21.5 (Standard range: 18.5~24.9)
Percent Body Fat 10~20% 18~28%
1) BMI(Body Mass Index)As we can see from the formula, BMI = Weight(kg) / height2(m2), BMI is used toapproximate obesity levels. The BMI method has been widely applied in the gen-eral medicine, dietary, and sports medicine fields as the main means of diagnosingobesity. However, this method is flawed in that it cannot be applied to adults with highlevels of LBM, children, those over the age of 65, or pregnant females. Nevertheless,as the BMI has been the most commonly used index, much research on using theBMI method to prevent adult diseases has been conducted. This is why InBody520also includes BMI based information. Differences have emerged amongresearchers as to which standards should be used to determine the BMI of exami-nees of different age and gender. InBody520 uses the WHO standards as the stan-dard ranges for BMI (1998, Table4).
InBody520 identifies the standard BMI as 22 for males, 21.5 for females and thestandard BMI ranges as 18.5-24.9 for both males and females.
Examinees are recommended to remove their clothes and accessories, to avoideating prior to the test, and to dispose of urine and excrement; all of which arenot part of the body’s composition, but affect body weight.
Ref 2. Vivian H. Heyward, Applied Body Composition Assessment, Human Kinetics, p44-55, 1996.
Under Normal OverUnder Normal Over

Results interpretation11
Table4. European weight classification based on the BMI method (WHO, 1998)
Classification BMI(kg/m2) Danger of onset of accompanying diseasesUnderweight 18.5 LowNorma 18.5~24.9 ModerateOverweight 25Dangerous weight level 25 ~29.9 Increased1st level obesity 30 ~34.9 Dangerous2nd level obesity 35 ~39.9 Advanced3rd level obesity 40 Very advanced
With regards to the BMI and Percent Body Fat of children, InBody520 applies children standards, not adult standards.
2) Percent Body Fat
Percent Body Fat indicates the percentage of Body Fat to Body Weight.
Percent Body Fat = Body Fat Mass / Body Weight100
The standard Percent Body Fat is 15% for males and 23% for females, while thestandard range of Body Fat Mass for males is 10-20% of the standard weight, and18-28% of the standard weight for females.3,4
When a person’s Percent Body Fat is calculated as being beyond the standardrange, he/she is regarded as being obese. When a person’s Percent Body Fat fallsbelow the standard range, he/she is regarded as having a low level of body fat.This low level of body fat can be separated into two types: The first is a personwhose muscle type is deemed to account for a desirable proportion of the bodycomposition. Such people’s weight is regarded as being within the standard rangeor falling within the overweight range. The second type, the poor nutrition type, isone in which a person’s body is deemed to be in an unhealthy state because of alack of Body Fat Mass and LBM. This type has a higher possibility of contractingclinical diseases.
In case of children less than 18 years old, different standards are applied as it is necessary to consider the differ-
ence in physical characteristics from adults.
Ref 3.Robert D. Lee, David C. Nieman, Nutritional Assessment 2th, McGraw-Hill, 1998
Ref 4.George A. Bray, MD. Contemporary Diagnosis and Management of Obesity, Handbooks in Health Care Co.,1998

Results interpretation 12
www.biospaceamerica.com
5. Segmental Lean Development
With the InBody520, you canmeasure the soft lean mass of yourbody parts. It is achieved throughthe use of one of the InBody520’smeasuring principles, bioelectricalimpedance measurements of bodyparts. The measurement of softlean mass for body parts is basedon the following theory.
Segmental Soft Lean Mass (Height) /(Segmental Resistance)
Ref 5.Henry C Lukaski, Phyllis E Johnson, William W Bolonchuk and Glenn I Lykken, Assessment of fat-free mass usingbioelectrical impedance measurements of the human body, The American J. of Clinical Nutrition, Vol. 41, pp810-817, 1985
There are two bar graphs for each body part in the Lean Balance graph. The twographs have different meanings, respectively. The numbers beside the upper bar graph indicates the actual soft lean mass of asubject. If the upper bar graph reaches 100%, it means that the subject has idealsoft lean mass for his or her ideal weight, which is derived from the subject’sheight. Therefore, the length of the upper bar graph shows the relative ratio of theideal soft lean mass for his or her ideal weight.
If the lower bar graph reaches 100%, it denotes the ideal soft lean mass for the sub-ject in relation to his or her actual weight. Therefore, the length of the lower bargraph indicates the relative ratio of the ideal soft lean mass for the actual weight,while the number beside the lower bar graph shows that ratio.
By displaying these two bar graphs, it makes it more effective to diagnose the actu-al soft lean mass of the subject. The upper bar graph is based on the soft lean massof the subject’s ideal weight, so that the 100% value will not vary unless there is achange in his or her height. Thus, it is easier to see the increase or decrease of thesoft lean mass while providing an enduring goal. Since the lower bar graph is onlybased on the soft lean mass of the actual weight, the 100% value will alter inaccordance with the weight change.
UnderUnder NormalNormal OverOverUnderUnder NormalNormal OverOver UNIT:%

Results interpretation13
Why are the standard ranges for arms and legs different?
The standard range for Soft Lean Mass in the arm is 80 ~ 120%, while that inthe trunk and legs is 90 ~ 110%. The difference in these standard ranges isbased on the fact that while the upper body tends to vary greatly from individ-ual to individual, very little variations are found in terms of people’s legs. Aspeople use their legs, this part of the body tends to be the first to benefit fromexercise; as such, the degree of Lean Mass in legs usually ranges somewherebetween 90 ~ 110% of the standard. However, one should also take the time toexercise his/her upper body. In this regards, it is difficult to develop Lean Massof arm when one does not partake in exercises designed to specifically developmuscle in that particular part of the body. This is the main reason why LeanMass of arm tends to vary greatly from the standard. Therefore, the standardrange for Lean Mass of arms is 80 ~ 120%, which is a wider range than thatapplied to Lean Mass of legs.
FAQ 2
Hence, though it is not possible to check the increase or decrease of the soft leanmass as with the upper graph, it will directly reflect changes in the subject’sweight, thereby allowing you to determine whether or not there is actual soft leanmass appropriate to his or her weight. In addition, you can also see if the subjecthas appropriate ratio between muscles and body fat in his or her body parts.
Throughout the lean balance muscle graph for body parts, you can see if upper•
lower• left • right muscle developments are balanced and if body parts’ soft leanmass is appropriate(muscle strength). The normal range of the graph is: for rightand left arms, 80~120%; for trunk, right and left legs, 90~110%.

Results interpretation 14
www.biospaceamerica.com
How precise is the soft lean mass for the body parts?
The precision data of the soft lean mass for the body parts can be obtained fromDEXA (Dual Energy X-ray Absorptiometry) and the InBody precision test.The following are the results of a comparative study that shows that the R_ isabove 0.86. This indicates that the precision of body part measurement is high.
* Ref 6. G. Bedogni et al, Cross-calibration of eight-polar bioelectrical impedance analysis versus dual-energy X-ray absorptiometry for the assessment of total and appendicular body composition in healthy subjects aged 21-82years, Annals of human biology, Vol. 30, No. 4, pp. 380-391, 2003
RMSE Y by DXA Y by BIA DY (BIA-DXA)Y X a0 a1 R2adj Kg (%) (kg) (kg) (kg)
FFM RIsum500 2.4 1.6 0.92 2.80(6) 48.010.1 48.0 9.7 0.0 2.8
LTMarm RIarm500 -0.6 0.03 0.93 0.18(8) 2.30.7 2.3 0.7 0.0 0.2
LTMleg RIleg500 -0.06 0.06 0.86 0.63(8) 7.51.7 7.5 1.6 0.0 0.6
Abbreviations : a0, intercept; a1, slope; R2adj, adjusted coefficient of determination; RMSE, root mean square error;
BIA, bioelectrical impedance analysis: DXA, dual-energy X-ray absorptiometry; FFM, fat-free mass; LTM, lean tissuemass; RIx, resistance index at x kHz; sum, sum of segmental resistances (arms, trunk and legs).
Prediction of fat-free mass and appendicular lean tissue mass from eight-polar
FAQ 3
80706050403020100
0 00 0
2
4
6
8
10
12
14
0.5
1.51
22.5
3.0
4.5
3
4
50 100 150 200 0 50 100 150 20010 20 30 40 50RIsum500
FFM(kg)
LTMarm(kg)
LTMleg(kg)
a b cRIarm500 RIleg500
(cm2/ ) (cm2/ ) (cm2/ )
80706050403020100
0 00 0
2
4
6
8
10
12
14
0.5
1.51
22.5
3.0
4.5
3
4
50 100 150 200 0 50 100 150 20010 20 30 40 50RIsum500
FFM(kg)
LTMarm(kg)
LTMleg(kg)
a b cRIarm500 RIleg500
(cm2/ ) (cm2/ ) (cm2/ )

Results interpretation15
1. Find out more about the lean balance and body strength.
By comparing the lengths of the body part graphs, see if each body part has pro-portionally developed. The lean balance of the comprehensive evaluation will bebased on the lower bar graph.
A. Compare the length of the soft lean mass graph for body parts to see if muscle distribu-tion is balanced.
Balanced development of the upper & lower body and of the left & right side of the bodyThe length of the arm, trunk and leg graphs aresimilar, thus indicating that the upper andlower parts of the body are well balanced. Inaddition, the left and right sides of body arealso in balance, as exhibited by the fact thatthe graphs for both arms and legs are of thesame length. All the graph bars for the upperand lower body fall within the standard range, indicating a proper muscle balance.
1. Find out more about the lean balance and body strength.
A. Compare the length of the soft lean mass graph for body parts to see ifmuscle distribution is balanced.
B. Evaluate the appropriateness of soft lean mass (muscle strength) by thelength of the below bar.
2. Find out the relationships among weight, upper and lower bar graphs in theSegmental Lean Development.
A. If the actual weight is close to the ideal one.B. If the actual weight is higher than the ideal one. C. If the actual weight is lower than the ideal one.
3. Observe the trend of Segmental Lean Development graph.
TIP2
Under Normal OverUnder Normal Over
Under Normal OverUnder Normal Over
Under Normal OverUnder Normal Over
Under Normal OverUnder Normal Over Under Normal OverUnder Normal Over
Under Normal OverUnder Normal Over
Under Normal OverUnder Normal Over
Under Normal OverUnder Normal Over
Under Normal OverUnder Normal Over
Under Normal OverUnder Normal Over
Comprehending two muscle bar graphs in the Segmental Lean Development.

Results interpretation 16
www.biospaceamerica.com
Left-right imbalance in the upper bodyThere is about one-cell difference in lengthbetween right and left arms in the upper body.This subject does not have proportionally-developed arms. He or she must have a habitof using the right arm more or a history of notusing his or her left arm due to some reasonsuch as injury.
Left-right imbalance in the lower bodyThe bar graph of the right leg is shorter thanthat of the left. This subject does not have pro-portionally-developed lower body. He or shemust have a habit of using the left leg more ora history of not using his or her right leg due tosome reason such as injury.
Upper & lower body imbalance – strong upper body typeThe length of the arm bar graph is longer thanthat of the leg and falls above the normalrange. In addition, although the bar graph forlegs is within the normal range, the differencein length of the upper and lower body graphsis more than one cell. Therefore, it can be cate-gorized as the strong upper body type, whichis marked by the better-developed lower body.
Upper & lower body imbalance – strong lower body typeThe length of the leg bar graph is longer thanthat of the arm and falls above the normalrange. In addition, although the arm’s bargraph is in the normal range, the difference inlength of the upper and lower body graph ismore than one cell. Therefore, it can be cate-gorized as the strong lower body type, whichis marked by the better-developed upper body.
Under Normal OverUnder Normal Over
Under Normal OverUnder Normal Over
Under Normal OverUnder Normal Over
Under Normal OverUnder Normal Over Under Normal OverUnder Normal Over
Under Normal OverUnder Normal Over
Under Normal OverUnder Normal Over
Under Normal OverUnder Normal Over
Under Normal OverUnder Normal Over
Under Normal OverUnder Normal Over
Under Normal OverUnder Normal Over
Under Normal OverUnder Normal Over
Under Normal OverUnder Normal Over
Under Normal OverUnder Normal Over Under Normal OverUnder Normal Over
Under Normal OverUnder Normal Over
Under Normal OverUnder Normal Over
Under Normal OverUnder Normal Over
Under Normal OverUnder Normal Over
Under Normal OverUnder Normal Over

Results interpretation17
Upper & lower body imbalance ; weak upper body typeAlthough the bar graph for the legs is beyondthe standard range, the bar graph for the armsfalls below the standard level. This case canbe referred to as a weak upper body type.This type is often exhibited among personswho seldom exercise.
Upper & lower body imbalance ; weak lower body typeAlthough the bar graph for the arms isbeyond the standard range, the bar graph forthe legs falls below the standard level. Thiscase can be referred to as a weak lower bodytype. As the lower body must support thebody weight, proper muscle development isessential. When the lower body muscles arenot sufficiently developed, diseases such asarthritis and osteoporosis become more likely.
B. Evaluate the appropriateness of soft lean mass(body strength) by the length of the lower bar.
The upper bar graph presents the ideal weight to which each subject should aspire.As the length of the upper bar graph encompasses the concepts of ideal weight andsoft lean mass, it provides the goal to keep the ideal soft lean mass, while consider-ing the ideal and actual weights. Since the lower bar graph compares the soft leanmass in relation to the actual weight, it checks if there is an appropriate, idealamount of soft lean mass for each body part in relation to the actual weight. At thattime, the body strength index item in the comprehensive evaluation is determinedaccording to whether or not the lower bar graph falls in each category: below aver-age, average, or above average. Thus the body strength will differ in accordancewith the range to which the length of bar graph belongs. It would be ideal for boththe upper and lower bar graphs to be in the normal or above average range, in par-ticular, both to be more than 100%.
In addition, depending on whether the lower bar graph is bigger or smaller than100%, it is possible to determine if soft lean mass and body fat amounts are appro-priate. In other words, if one has a soft lean mass ideal for the actual weight, itshould be near 100%. It can be seen that the soft lean mass and body fat in bodyparts are well balanced. On the other hand, if soft lean mass is smaller, it will be
Under Normal OverUnder Normal Over
Under Normal OverUnder Normal Over
Under Normal OverUnder Normal Over
Under Normal OverUnder Normal Over Under Normal OverUnder Normal Over
Under Normal OverUnder Normal Over
Under Normal OverUnder Normal Over
Under Normal OverUnder Normal Over
Under Normal OverUnder Normal Over
Under Normal OverUnder Normal Over
Under Normal OverUnder Normal Over
Under Normal OverUnder Normal Over
Under Normal OverUnder Normal Over
Under Normal OverUnder Normal Over Under Normal OverUnder Normal Over
Under Normal OverUnder Normal Over
Under Normal OverUnder Normal Over
Under Normal OverUnder Normal Over
Under Normal OverUnder Normal Over
Under Normal OverUnder Normal Over

Results interpretation 18
short of 100%. The smaller the bar graph is, it can be said that the person is either aweak type with low muscle or a type with more body fat and less lean muscle.Lastly, if there is more muscle, the lower body graph will exceed 100%. The high-er the bar graph is raised above 100%, the more muscles the person has developedthan body fat. Therefore, the length of the lower body graph allows you to see theratio between muscles and body fat.
Let’s look at the following examples.
Male, 25 years old, 5ft. 8.9in., 126.5lbs. (Ideal weight:148.8lbs.)
Currently, this man has yet to reach his theideal weight. If you look at the upper bargraphs in the Segmental Lean Development,you can see that they are all below the normalrange. The shortness of the graph may be causedby his actual weight falling behind the idealweight or just by an actual insufficiency of thesoft lean mass. If you see the lower bar graph, thearms are within the normal range while legs areabove 100%, indicating that he has an appropriate soft lean mass for the actual weight.
Female, 68 years old, 5ft. 4.2in., 152.3lbs. (Ideal weight:123.5lbs.)
This female’s actual weight is higher than theideal weight. If you look at the upper bargraphs in the Lean Balance, they all fall in thenormal range. So it seems that she has anappropriate soft lean mass. However, there aretwo possible explanations for that. It may becaused by her higher actual weight to the idealone. Or she may just be well muscled. At thattime, if you see the lower bar graph, the armsare about 90% while the legs are within the 79% range, indicating that it is below thenormal range. In other words, although she appears to have appropriate muscles dueto her higher actual weight than the ideal one, she lacks a certain amount of soft leanmass appropriate to her actual weight. In particular, in case of the legs, the lower bargraph is short of 100% so that she has more body fat and less soft lean mass.
www.biospaceamerica.com

Results interpretation19
2. Find out the relationships among weight, upper and lower bar
graphs in the Segmental Lean Development.
As the concepts of ideal weight and actual weight are included in the standards ofdetermining the lengths of upper and lower bar graphs in the lean balance, thelength type of upper and lower bar graphs will vary depending on the differencebetween subject’s actual and ideal weight.
A. If the actual and ideal weights are alike, the upper and lower bar graphs will not be
much different.
As the discrepancy between the actual and ideal weight is insignificant, the 100%standard value is similar to each other. Therefore the lengths of the graphs are similar.
a) If the lower bar graph exceeds 100%
It is a desirable health state in terms of both ideal weight and actual weight.
Male, 28 years old, 5ft. 8.9in., 150.1lbs.
Actual weight (150.3lbs.)÷ ideal weight (148.8lbs)As the discrepancy between the actual and idealweight is insignificant, the lengths of the twobar graphs are similar. As the lower bar graph ofthe lower body falls in the normal range, theupper and lower body strength is in the averagerange. Especially, as it exceeds 100%, the bal-ance between muscles and body fat is met.
b) If the lower bar graph does not exceed 100%
Based on the actual weight, the subject is weak in health with insufficient soft lean mass.
Female, 28 years old, 5ft. 3in., 119.7lbs.
Actual weight (119.9lbs.)÷ ideal weight (118.8lbs)Again, the lengths of the two bar graphs aresimilar. As the lower bar graph is below thenormal range, the upper and lower bodies areweak. Especially, as they fail to reach 100%, itcan be said that the subject has more body fatand less soft lean mass.

Results interpretation 20
www.biospaceamerica.com
B. If the actual weight is higher than the ideal weight, the lower bar graph is shorter thanthe upper bar graph.
If the actual weight is higher than the ideal weight, the soft lean mass required bythe actual weight is greater than that required by the ideal weight. Therefore, if theactual weight is higher than the ideal weight, the lower bar graph is always shorterthan the upper bar graph. So what is crucial here is whether or not the length of thelower bar graph is above 100%. To determine whether one is a well-muscled typeor body fat type, you can also refer to the length of the lower bar graph.
a) If the lower bar graph exceeds 100%
It is a desirable health state with sufficiently developed muscles in terms of the actual weight.
Male, 23 years old, 6ft. 0.05in., 176.4lbs.Actual weight (176.6lbs.) £æ ideal weight (162.7lbs.)The lower bar graph is shorter than the upperbar graph. This is a natural phenomenon aris-ing from the fact that the actual weight is high-er than the ideal one. If you look at the lowerbar graph, you can see that it is either in orabove the normal range with an average upperand lower body strength. As it is above 100%,he has a desirable health state with more mus-cles than body fat. This type is often found inthe sportsman figures.
b) If the lower bar graph does not exceed 100%
The muscles are insufficient in relation to the actual weight.
Female, 27 years old. 5ft. 5in., 171.1lbs.Actual weight (171.3lbs.)£æideal weight (126.3lbs.)The lower bar graph is shorter than the upperone. It is a natural phenomenon. Though sheappears to have sufficient muscle mass in theupper bar graph, it is solely because of herhigher actual weight than ideal weight. Inother words, if you look at the lower bar graph,the upper body is in the normal range, indicat-ing her upper body strength is average. On theother hand, her lower body falls below the normal range so that the lower bodystrength denotes a weak state. Especially with the lower body, the lower bar graphlags much behind 100%, showing that she has more body fat than muscles.

Results interpretation21
C. If the actual weight is lower than the ideal weight, the lower bar graph is longer than the upper one.If the actual weight is lower than the ideal weight, the subject’s soft lean massrequired by the actual weight is smaller than that required by the ideal weight.Therefore, if the actual weight is lower than the ideal weight, the lower bargraph is always longer than the upper bar graph. So what is crucial here iswhether or not the length of the lower bar graph exceeds 100%. To determineif the subject is a well-muscled type or body fat type, you can simply refer tothe length of the lower bar graph.
a) If the lower bar graph exceeds 100%
Based on the actual weight, it is a desirable health state with sufficient muscle mass.
Male, 32 years old, 5ft. 6.9in., 114.6lbs.Actual weight (114.8lbs.)ideal weight (140.4lbs.)The lower bar graph is longer than the upperone. It is a natural phenomenon arising fromthe fact that his actual weight is lower than theideal weight. In terms of the upper bar graph,he appears to have insufficient muscles as hisupper and lower bodies fall below the normalrange. However, it is due to the lower actualweight than the ideal weight. If you look at thelower bar graph, they are all in the normal range with average body strength.Especially in the case of the lower body, the lower bar graph exceeds 100%, indi-cating that he is in a desirable health state with a bit more muscle than body fat.
b) If the lower bar graph does not exceed 100%
Based on the actual weight, it is a weak state with a lack of muscles.
Female, 50 years old, 4ft. 9.1in., 77.2lbs.Actual weight (77.3lbs.) ideal weight (97.6lbs.)The lower bar graph is longer that the upperone and it is due to the lower actual weightthan ideal weight. In terms of the upper bargraph, her soft lean mass is scarce. If you lookat the lower bar graphs, they are all below the100%. Based on the actual weight, she is in aweak state with insufficient muscles.

Results interpretation 22
3. Observe the trend of lean balance graph with regular measuring.
If you carry out the InBody test not only once but on the regular basis, you can seehow the lean balance graph changes over time. Throughout the following exam-ples, let’s observe the trend.
1) Overweight obesity type
In this case, it is advisable to employ methods that can reduce the weight whilemaintaining the soft lean mass.
It falls in the category of overweightobesity type, which is characterizedby high weight that is above the nor-mal range with a lot of body fat. Interms of the upper bar graph, itappears to be well muscled, however,the lower bar graph is far below100%. It is the type that has morebody fat and less lean muscle in eachbody part.
As weight has been reduced, theremust be less body fat and the soft leanmass. As a result, the upper bar graphalso turns out to be a bit shorter.However, if you look at the lower bargraph, you actually can see that thelower bar graph is more extendedthan before due to the weight loss.
As the weight loss continues, there must be a bit of a decline in body fat and softlean mass. The upper bar graph becomes a bit shorter. At the same time the lowerbar graph is either close to 100% or longer owing to the weight loss accompaniedby the maintaining of soft lean mass.
During the above process, if there is no change in the lower bar graph even after treatment, it can be explained
by the incomplete manifestation of the effects of treatment.
www.biospaceamerica.com

Results interpretation23
2) Weight in the normal range but wants to have more firm body shape
If a person is not overweight but looks sluggish due to more body fat and less leanmuscle, it is recommended to apply methods to earn appropriate soft lean mass forthe weight.
Though the weight is in the normalrange, it is above the ideal weight andthe muscle strength for body parts fallsbelow the average. So the person mayappear sluggish due to less lean muscleand more body fat. If you look at the leanbalance graph, the upper bar graphexceeds 100%, whereas the lower bargraph is below the average, indicating thatthere is more body fat in each body part.
If you maintain soft lean mass with a decline in body fat and weight, the upper bargraph will either remain the same or be decreased a bit. As the weight becomeslower than the ideal weight with the loss of body fat, the lower bar graph will belonger than the upper one, approaching or exceeding 100%. Consequently, thephysical figure will be transformed into a firm-looking one as there is a properratio of lean muscle and body fat in each body part.
In the above result, if the lower bar graph does not show any changes or fails to exceed 100%, it cannot be con-
sidered a desirable result. If the lower bar graph exceeds 90%, it can be said to be a standard. Still, however, the
ideal ratio between lean muscle and body fat is achieved at 100%.

Results interpretation 2424
3) Weak physical state, wants to increase more lean muscle
As the weight is less than the ideal weight with insufficient lean muscle, it is nec-essary to introduce a process of increasing soft lean mass.
As the actual weight is lower than theideal one, the lower bar graph is longerthan the upper one. However, the upperand lower bar graphs are below the aver-age indicating a weak physical state withinsufficient muscle.
With the increase in soft lean mass, theupper bar graph is elongated. Also the lowerbar graph is elongated accordingly andexceeds 100%. That’s the desirable result.
4) Sportsman type but wants to increase more lean muscle.
If a person is well muscled and overweight and continues to build muscle, theincrease in soft lean mass can be observed.
Currently, the person is well muscled andoverweight, which is a type frequentlyfound in sportsmen. As the actual weightis higher than the ideal weight, the upperbar graph is longer than the lower one.However, both bar graphs exceed 100%,so that he or she is in ideal physical con-dition with more lean muscle in relationto the actual weight.
If soft lean mass is increased due to con-tinuous exercises, the upper bar graph will be elongated. As the actual weightincreased a bit with the rise in soft lean mass, the basic value of the lower bargraph will be increased. However, with the increase in soft lean mass, you can seethe length of the lower bar graph is increased accordingly.
www.biospaceamerica.com

Body Composition Analysis25
6. Body Composition
The InBody520 assigns a quantitative value to the select elements of the bodyscomposition. These values demonstrate the weight of each compositional elementwhich comprises the examinees total body weight.
1) 4-Compartment Model
The InBody520 Analyzers body composition analysis is based on the 4-Compartment Model. This 4-Compartment Model assumes that the body is com-posed of four different elements: total body water, protein, minerals, and body fat.The InBody520 Analyzer combines proteins and minerals and labels these DryLean Mass. The Total Body Water component is then separated into intracellularwater and extracellular water for further analysis.
Ref 7 .Vivian H. Heyward, Applied Body CompositionAssessment,Human Kinetics, p.9, 1996
Cf. In addition to the use of the 4-Compartment Model, the 2-Compartment Model is also widely used to analyze the-composition of the human body. The underwater weighing method of body composition analysis, which separates bodyweight into Lean Body Mass and Fat Mass, is based on this 2-Compartment Model.
2) Dry Lean MassDry Lean Mass is the sum of protein and minerals. Protein is solid in body cells, com-prised of polymers of organic compounds, including nitrogen, and is a majorcompo-nent of muscle. Protein is also the main component of Dry Lean Mass. Minerals, theother component of Dry Lean Mass, help preserve the body and play an importantrole in the human body. The quantity of minerals is closely related to the level of exer-cise of an examinee. When the muscle mass increases, the weight of the bone alsoincreases. InBody520 uses the following formula to measure Dry Lean Mass:
Dry Lean Mass = Lean Body Mass - TBW
Protein is directly related to intracellular water. A lack of protein indicates poor nutri-tion, but contrary to what one may think, this protein is not the same as the one foundin food. Dry Lean Mass is proportionate to the quantity of muscle. Protein and intra-cellular water are indications of the level of muscle content an individual has.

Body Composition Analysis 26
www.biospaceamerica.com
7. Muscle - Fat Control
InBody520 also offers a muscle – fatcontrol guide that is aimed at opti-mizing the examinees body compo-sition rather than simply increasingor decreasing his/her weight. It tellshow to control the weight especially
by gaining or losing muscle or fat. Here, + refers to the mass that must beincreased, and - refers to the mass which should be decreased.These numbers, a unique index offered only by the InBody520 indicating howmany pounds of Body Fat Mass should be lost and how many pounds of LBMshould be gained through exercise. Many people give up in the middle of the process of treating their obesity becausetheir weight has not changed. In many cases, the reason is that LBM has increasedas much as the amount of Body Fat Mass lost. However, as their actual weight hasnot changed at all, the effectiveness of the weight management program may bedifficult to ascertain. InBody520 makes it possible for the examinee to see howmuch Body Fat Mass has been lost and how much LBM gained during the weightmanagement program. Therefore, InBody520 is a very useful device in diagnosingobesity, monitoring the weight management process, and facilitating the formationof a trust based relationship between the conductor and their clients.
Basal Metabolic Rate
The Basal Metabolic Rate (BMR) indicates the minimum energy required to sustain vital functions while at rest.
InBody520 makes it possible to estimate BMR using a known regression equation based on LBM. LBM is known to
be closely related to BMR. BMR is usually calculated using indirect Calorimetry, which in turn, employs oxygen
demand. However, InBody520 calculates BMR, using LeanBody Mass.8,9 For example, if the examinee gained LBM
during the weight management program, BMR would also increase. This is a desirable result in any weight man-
agement program.
REE = 21.6 LBM(kg) + 370 (LBM = Lean Body Mass, kg)8,9
Ref 8.John J. Cunningham. Body composition as a determinant of energy expenditure: a synthetic review and proposed
general prediction equation. American Journal Clinical Nutrition, 54, 963~969, 1991.
Ref 9. Eric Ravussin and Clifton Bogardus. Relationship of genetics, age, and physical fitness to daily energy expendi-ture and fuel utilization. American Journal Clinical Nutrition, 49, 968~975, 1989
Under Normal OverUnder Normal Over
Body Composition Analysis27
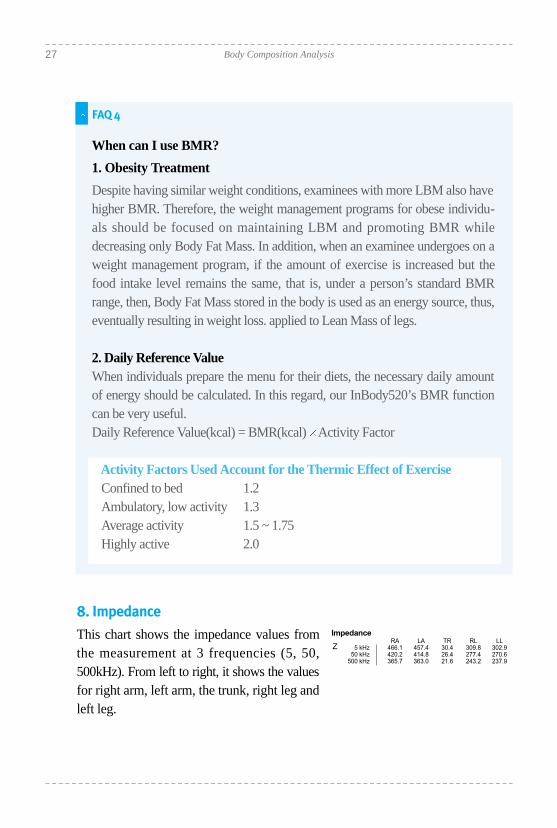
8. Impedance
This chart shows the impedance values fromthe measurement at 3 frequencies (5, 50,500kHz). From left to right, it shows the valuesfor right arm, left arm, the trunk, right leg and left leg.
When can I use BMR?
1. Obesity Treatment
Despite having similar weight conditions, examinees with more LBM also havehigher BMR. Therefore, the weight management programs for obese individu-als should be focused on maintaining LBM and promoting BMR whiledecreasing only Body Fat Mass. In addition, when an examinee undergoes on aweight management program, if the amount of exercise is increased but thefood intake level remains the same, that is, under a person’s standard BMRrange, then, Body Fat Mass stored in the body is used as an energy source, thus,eventually resulting in weight loss. applied to Lean Mass of legs.
2. Daily Reference ValueWhen individuals prepare the menu for their diets, the necessary daily amountof energy should be calculated. In this regard, our InBody520’s BMR functioncan be very useful.Daily Reference Value(kcal) = BMR(kcal)Activity Factor
Activity Factors Used Account for the Thermic Effect of ExerciseConfined to bed 1.2Ambulatory, low activity 1.3Average activity 1.5 ~ 1.75Highly active 2.0
FAQ 4
Under Normal OverUnder Normal Over

&Examples
Body Composition Glossary
BODY COMPOSITION ANALYZER

Examples29

Examples 30
www.biospaceamerica.com
Normal type
Subject 21-year-old university student, male
History He is currently majoring in Business. He lovessports and plays basketball with his friends everyday inthe gym. He also plays tennis and swims every weekend.He is also a member of the in-line skate club. His bodycomposition lies within all standard ranges and forms the‘D’ shape. Thus, he has a perfect body compositionbalancewith his BMI and Percent Body Fat in standard ranges.Moreover, his Segmantal Lean Development is well devel-oped. He is deemed to be in perfect condition, and do notneed to undertake a weight management program. Heneeds to exercise continuously in order to maintain hispresent health condition.
‘D’ shape
every result in normal range
does not need weight control

Examples31
You can find hidden obesity through body composition analysis!

Examples 32
www.biospaceamerica.com
Sarcopenic obesity type
Subject Underweight low muscular type femaleHeight : 5 ft. 7.3 in. Weight: 125.4 lbs.
History Sarcopenic obesity is due to a lack of exercise.She eats regular meals, but does not exercise enough, dueto her job as an office worker. Looking at her LBM andBody Fat Mass, she falls under the category of the typical‘C’ shape. Although she is underweight, her Body FatMass is very high. Therefore, it is necessary for her to bal-ance her body composition by increasing her LBMthrough exercise.
‘C’ shape

Examples33

Examples 34
www.biospaceamerica.com
Low muscle overweight type
While she is overweight and has a fatty liver, she mightfeel safe because using the BMI method, her weight fallswithin the standard range. However, she has a very highPercent Body Fat at 42.4%. Such a result places her in thechronic obesity type. Her obesity is confirmed by a simplecheck of the body composition graphs. Her LBM is belowthe standard range while her Body Fat Mass is waybeyond the standard range. Her test results look like acurved ‘C’ shape. She should strive to change this into aslight ‘D’ shape, by increasing her LBM and decreasingher Body Fat Mass. Once this has been achieved, all hergraphs will fall within the standard ranges. IncreasingLBM in the lower extremities helps middle-aged femalesprevent arthritis. This patient should be advised to contin-ue exercising and have her Segmantal Lean Developmentvalues monitored.
‘C’ shape
very low BMR

Examples35
Enjoy an accurate body composition analysis with our InBody520 Analyzer!

Examples 36
www.biospaceamerica.com
Geriatric disease patient
This patient’s LBM is very low.

Examples37
D
InBody520 analyzer also provides guidelines for exercising!

Examples 38
www.biospaceamerica.com
Athletic type
Subject 35-year-old, male
History Has been a bodybuilder for over 10 years, worksas a trainer in a gym.
Judging from his external appearance, his upper bodyLBM is remarkably developed. Having hurt his left leg inthe past, he is very careful not to do severe exercise. Histest results exhibit a severely curved ‘D’ shape, which isoften found in athletes. While his weight is beyond thestandard range, his Body Fat Mass is barely within thestandard range and his LBM is very well developed.Looking at the Segmantal Lean Development, as expect-ed, the graph of the left leg is smaller than the right leg’s.
‘D’ shape
higher BMRdoes not need weight control