results - galp energia...61,5/bbl, down 37% from usd 97,0/bbl in 2008. however, the price of crude...
TRANSCRIPT
RESULTS FOURTH QUARTER AND TWELVE MONTHS 2009
Extending success into new challenges
Fourth Quarter and Twelve Months 2009 Results 2
TABLE OF CONTENTS
EEXXEECCUUTTIIVVEE SSUUMMMMAARRYY................................................................................................................................................................ 33
KKEEYY FFIIGGUURREESS .......................................................................................................................................................................................... 44
BBAASSIISS OOFF PPRREESSEENNTTAATTIIOONN...................................................................................................................................................... 55
MMAARRKKEETT EENNVVIIRROONNMMEENNTT ........................................................................................................................................................ 66
FFIINNAANNCCIIAALL RREEVVIIEEWW........................................................................................................................................................................ 99 1. INCOME STATEMENT ......................................................................................... 9 2. ANALYSIS OF INCOME STATEMENT ITEMS........................................................ 10 3. FINANCIAL POSITION....................................................................................... 15 4. CASH FLOW..................................................................................................... 17 5. CAPITAL EXPENDITURE .................................................................................... 18
SSEEGGMMEENNTT RREEVVIIEEWW........................................................................................................................................................................ 1199 1. EXPLORATION & PRODUCTION ........................................................................ 19 2. REFINING & MARKETING ................................................................................. 22 3. GAS & POWER................................................................................................. 25
TTHHEE GGAALLPP EENNEERRGGIIAA SSHHAARREE ............................................................................................................................................ 2277
MMAATTEERRIIAALL EEVVEENNTTSS IINN TTHHEE FFOOUURRTTHH QQUUAARRTTEERR OOFF 22000099 ........................................................ 2288
EEVVEENNTTSS AAFFTTEERR TTHHEE CCLLOOSSEE OOFF TTHHEE FFOOUURRTTHH QQUUAARRTTEERR OOFF 22000099 .................................. 3300
AASSSSOOCCIIAATTEESS ........................................................................................................................................................................................ 3311 1. MAJOR ASSOCIATES......................................................................................... 31 2. RESULTS FROM ASSOCIATES ............................................................................ 31
RREECCOONNCCIILLIIAATTIIOONN OOFF RREEPPOORRTTEEDD AANNDD RREEPPLLAACCEEMMEENNTT CCOOSSTT AADDJJUUSSTTEEDD FFIIGGUURREESS .................................................................................................................................................................................................... 3322
1. REPLACEMENT COST ADJUSTED OPERATING PROFIT BY SEGMENT.................... 32 2. REPLACEMENT COST ADJUSTED EBITDA BY SEGMENT ...................................... 32 3. NON RECURRENT ITEMS .................................................................................. 33
CCOONNSSOOLLIIDDAATTEEDD FFIINNAANNCCIIAALL SSTTAATTEEMMEENNTTSS .................................................................................................. 3366 1. CONSOLIDATED INCOME STATEMENT............................................................... 36 2. CONSOLIDATED FINANCIAL POSITION.............................................................. 37
AADDDDIITTIIOONNAALL IINNFFOORRMMAATTIIOONN ........................................................................................................................................ 3388

Fourth Quarter and Twelve Months 2009 Results 3
EXECUTIVE SUMMARY Galp Energia’s replacement cost adjusted (RCA) net
profit in 2009 was €213 million, down 55% year on year (yoy) as the economic environment
impacted operating performance in all segments.
In the fourth quarter, RCA net profit was €34 million, primarily as a result of the weak
performance in Refining & Marketing.
Galp Energia’s operating performance in 2009 was
affected by the declining price of dated Brent, falling
refining margins and lower volumes of natural gas
sold, reflecting a weak economic backdrop that had an
adverse impact on the results of all segments.
However, the Refining & Marketing segment
benefited from the favourable contribution from the
acquisition of Agip’s and ExxonMobil’s Iberian
subsidiaries.
SUMMARY OF RESULTS – FOURTH QUARTER AND TWELVE MONTHS OF 2009
Working-interest production in 2009 of 14.7
thousand barrels per day benefited from the boost
in production from the Tômbua-Lândana and Tupi
fields, with the latter contributing 283 thousand
barrels to Galp Energia’s total production; in the
fourth quarter, working-interest production
increased 24% quarter on quarter (qoq) to 17.7
thousand barrels per day due to Tupi’s Extended
Well Test production;
In 2009, Galp Energia’s refining margin tumbled
67% yoy to Usd 1.5/bbl; in the fourth quarter, the
drop was even more pronounced as the refining
margin tumbled 84% to Usd 0.9/bbl;
In 2009, volumes of natural gas sold fell 17% yoy
to 4,680 million cubic metres following the drop in
volumes sold to the electrical and trading
segments; in the fourth quarter, 1,198 million
cubic metres were sold, down 2% yoy, which
pointed to a recovery in sales volumes;
RCA EBITDA for the twelve months dropped 37%
yoy to €619 million; fourth-quarter RCA EBITDA
was €147 million, down 40% yoy;
In 2009, RCA net profit of €213 million equated to
€0.26 per share, with the fourth quarter
contributing €0.04 per share;
Capital expenditure in 2009 of €730 million, of
which 40% in the fourth quarter, was primarily
channelled to the refinery conversion project.
CONFERENCE CALL Date: Thursday 25 February 2010 Time: 2:00 pm GMT (3:00 pm CET) Hosted by: Manuel Ferreira De Oliveira (CEO)
Claudio De Marco (CFO)
Tiago Villas-Boas (IRO)
Phones: UK:+44 (0) 207 750 99 08
Portugal: 707 785 662
Link: http://gaia.unit.net/galp/20100225/trunc Chairperson: Tiago Villas-Boas

Fourth Quarter and Twelve Months 2009 Results 4
KEY FIGURES
Financial data
Million eurosFourth quarter Twelve months
2008 2009 Chg. % Chg. 2008 2009 Chg. % Chg.
(557) 250 807 n.m. EBITDA 449 819 370 82.5%
242 155 (87) (35.9%) EBITDA RC1 966 608 (357) (37.0%)
244 147 (96) (39.6%) EBITDA RCA2 975 619 (356) (36.5%)
(628) 119 747 n.m. Operating profit 167 459 291 174.2%
170 23 (147) (86.3%) Operating profit RC1 684 248 (436) (63.7%)
179 51 (127) (71.3%) Operating profit RCA2 693 287 (407) (58.7%)
(451) 87 539 n.m. Net profit 117 347 230 196.9%
120 16 (104) (86.8%) Net profit RC1 472 186 (286) (60.6%)
125 34 (91) (72.7%) Net profit RCA2 478 213 (264) (55.3%)
1 Replacement cost figures exclude inventory effects 2 RCA figures exclude inventory effects and non recurrent items
Market indicators
Fourth quarter Twelve months
2008 2009 Chg. % Chg. 2008 2009 Chg. % Chg.
4.4 (0.3) (4.7) n.m. Rotterdam cracking refining margin1 (Usd/bbl) 2.6 1.0 (1.6) (62.0%)
4.8 (1.4) (6.2) n.m.
Rotterdam hydroskimming + aromatics + base oil
refining margin1 (Usd/bbl) 0.7 (0.0) (0.7) n.m.
55.8 27.7 (28.1) (50.4%) UK NBP natural gas price2 (GBp/term) 57.5 30.9 (26.6) (46.3%)
64.4 32.9 (31.6) (49.0%) Spanish pool price2 (€/MWh) 64.4 37.0 (27.5) (42.6%)
54.9 74.6 19.7 35.8% Average Brent dated price3 (Usd/bbl) 97.0 61.5 (35.5) (36.6%)
1.32 1.48 0.2 11.8% Average exChg. rate2 (Eur/Usd) 1.47 1.39 (0.1) (5.2%)
4.31 1.00 (3 p.p.) n.m. Euribor - six month2 (%) 4.73 1.43 (3 p.p.) n.m.
1 Source: Platts. For a complete description of the method for calculating Rotterdam margins see ”Definitions” 2 Source: Bloomberg 3 Source: Platts
Operating data
Fourth quarter Twelve months
2008 2009 Chg. % Chg. 2008 2009 Chg. % Chg.
15.5 17.7 2.1 13.9% Average working interest production (kbbl/day) 15.1 14.7 (0.4) (2.8%)
9.7 12.2 2.5 26.3% Average net entitlement production (kbbl/day) 10.0 9.7 (0.3) (2.7%)
5.8 0.9 (4.8) (83.8%) Galp Energia refining margin (Usd/bbl) 4.4 1.5 (3.0) (67.2%)
3.0 3.0 0.0 1.1% Raw materials processed (million tonnes) 13.1 11.5 (1.6) (12.0%)
2.7 2.8 0.0 1.8% Oil sales direct clients (million tonnes) 9.6 11.1 1.5 16.1%
1,225 1,198 (27) (2.2%) Natural gas sales (million m3) 5,638 4,680 (958) (17.0%)
104 289 185 178.0% Electric power generation1 (GWh) 489 721 232 47.4%
1 Includes unconsolidated companies where Galp Energia has a significant interest
Fourth Quarter and Twelve Months 2009 Results 5
BASIS OF PRESENTATION Galp Energia’s unaudited consolidated financial
statements for the twelve months ended 31
December 2009 and 2008 have been prepared in
accordance with IFRS. The financial information in the
consolidated income statement is reported for the
quarters ended 31 December 2009 and 31 December
2008 and for the twelve-month periods ended on
these dates. The financial information in the
consolidated balance sheet is reported at 31
December 2009, 30 September 2009 and 31
December 2008.
Galp Energia’s financial statements are prepared in
accordance with IFRS and the cost of goods sold is,
from 1 November 2008, valued at WAC (see a detailed
explanation of the change in accounting method in
this chapter’s Recent Changes section). The use of this
valuation method may cause volatility in results, when
goods and commodity prices fluctuate, owing to gains
or losses in inventories that do not reflect the
company’s operating performance. This effect is called
the inventory effect.
Another factor that may affect the company’s results
but is not an indicator of its true performance is the
set of non recurrent items such as gains or losses on
the disposal of assets, impairments or reinstatements
of fixed assets and environmental or restructuring
charges.
For the purpose of evaluating the operating
performance of Galp Energia’s businesses,
replacement cost adjusted (RCA) operating profit and
net profit exclude non recurrent items and the
inventory effect as they are calculated using the
replacement cost method.
RECENT CHANGES
In January 2009, Galp Energia changed the way of
accounting for its shareholdings in jointly controlled
companies to the equity method. These holdings had,
up to the end of 2008, been consolidated by using the
proportionate method. This change resulted from the
publication of the International Accounting Standards
Board’s Exposure Draft 9 recommending the use of the
equity method from the first quarter of 2009. This
change in accounting method was not applied to the
financial statements for the twelve months and fourth
quarter of 2008, the reason these are not directly
comparable with the financial statements of the
twelve months and fourth quarter of 2009.
The acquisitions of the Agip and ExxonMobil Iberian
subsidiaries, which closed on 1 October and 1
December 2008, respectively, altered the
comparability of results. Galp Energia has consolidated
the Agip operations since 1 October 2008 and
ExxonMobil’s since 1 January 2009.

Fourth Quarter and Twelve Months 2009 Results 6
MARKET ENVIRONMENT BRENT
The average price of dated Brent in 2009 was Usd
61,5/bbl, down 37% from Usd 97,0/bbl in 2008.
However, the price of crude oil staged a sustained
recovery in 2009, with the dated Brent closing the
year at Usd 77.7/bbl. This recovery was directly
related to a set of factors such as the positive
sentiment, based on favourable economic data,
towards an upturn in the world economy, which
fuelled the demand for oil, namely in China and the
United States.
The last quarter of 2009 confirmed the upward trend
in the price of crude oil since the beginning of the
year, with the dated Brent averaging Usd 74.6/bbl, up
9% qoq (quarter on quarter). This rise was driven by
the updated forecast by the International Energy
Agency (IEA), which raised the estimated annual
demand for oil to 86.2 million bbl per day as a result
of the prospects for economic recovery.
OIL PRODUCTS
In 2009, the gasoline crack spread averaged Usd
14.7/bbl, up 11% yoy. This favourable trend resulted
from the lower utilisation of refinery capacity, which
held back the supply of gasoline. In the last quarter of
2009, the gasoline crack spread corrected by 13% qoq
to an average of Usd 14.4/bbl as demand fell short of
initial estimates, prompting a rise in inventories.
In 2009, the diesel crack spread averaged Usd 9.9/bbl,
down 66% yoy. This drop followed from the shortfall
in world demand, namely from the industrial and
transportation sectors, which led to rising inventories
of diesel. However, as cold weather in the northern
hemisphere set in for the last quarter of the year,
inventories dropped, which drove the diesel crack
spread 10% higher in comparison with the third
quarter of the year, to an average of Usd 8.7/bbl,
which was still 67% short of the average in the fourth
quarter of 2008.
In 2009, the fuel oil crack spread averaged Usd -
14.6/bbl, up 52% yoy. This improvement was
primarily due to the increased competitiveness of fuel
oil relative to natural gas, mainly in the first half of
the year, and the cuts in the production of heavy
crude oil by OPEC. The last quarter of the year was the
only one when the fuel oil crack spread declined yoy,
4% lower than in 2008 to Usd -15.7/bbl, primarily in
the wake of the rise in the price of dated Brent.
REFINING MARGINS
In 2009, both the hydroskimming and cracking
margins moved lower yoy, with the latter evidencing
a steeper fall as the price difference between light
and heavy crude oil narrowed following OPEC’s cuts in
the production of heavy crude oil. The hydroskimming
margin shed Usd 0.1/bbl in the year to an average of
Usd -1.3/bbl. The cracking margin dropped Usd
1.6/bbl to Usd 1.0/bbl, which resulted primarily from
lower crack spreads for middle distillates as
inventories remained at high levels throughout the
year.
In the last quarter of 2009, both margins deteriorated
yoy and qoq. The hydroskimming margin dropped Usd
5.6/bbl yoy to Usd -2.4/bbl as the price of dated
Brent rose. At the end of the quarter, the cracking
margin benefited from the rising demand for middle
distillates as cold weather struck the northern
hemisphere. This was, however, not enough to offset
the fall in the crack spreads of gasoline or fuel oil. In
the fourth quarter of 2009, the average cracking
margin fell to Usd -0.3/bbl, or a drop of Usd 4.7/bbl
yoy and Usd 0.6/bbl qoq.
EUR/USD
The euro/dollar exchange rate averaged Usd 1.39 in
2009, meaning that the value of the euro against the
dollar declined 5% yoy. In the last quarter, however,
the euro appreciated 3% qoq against the dollar,
averaging Usd 1.48 and hitting a peak for the year at
Usd 1.51 in December. This appreciation followed

Fourth Quarter and Twelve Months 2009 Results 7
signaling from the European Central Bank towards a
normal monetary policy as it dropped its extraordinary
liquidity injections.
THE IBERIAN MARKET
In 2009, the Portuguese market for oil products
contracted 1% compared to a year earlier, to 10.6
million tonnes. Whereas the market for gasoline
decreased 1% relative to 2008, to 1.5 million tonnes,
the market for diesel grew 3% to 5.5 million tonnes.
The market for jet decreased the most, by 6% to 0.9
million tonnes.
In the fourth quarter of 2009, the Portuguese market
for oil products contracted 4% yoy to 2.6 million
tonnes. The trend for the year was also noticeable in
the quarter, with the market for diesel showing signs
of recovery as it expanded 3% yoy, to 1.4 million
tonnes. The market for gasoline declined 3% to 0.4
million tonnes and the market for jet dropped 2% to
0.2 million tonnes, which evidenced a recovery
against the 7% contraction in the first nine months of
the year.
In Spain, the market for oil products contracted 6% in
2009, to 59.6 million tonnes, as the economy slowed
down. The market for gasoline dropped 5% to 6.0
million tonnes and the market for diesel declined 6%
to 31.8 million tonnes. The markets for fuel oil and jet
contracted the most, 12% and 9% to 3.6 million
tonnes and 5.2 million tonnes, respectively.
In the fourth quarter, the Spanish market for oil
products contracted 9% to 14.6 million tonnes.
Whereas the market for jet expanded 3% yoy, the
markets for gasoline, diesel and fuel oil contracted
6%, 7% and 16% to 1.4 million tonnes, 8.1 million
tonnes and 0.8 million tonnes, respectively.
The Portuguese market for natural gas contracted 8%
in 2009 compared with 2008, to 4,235 million cubic
metres. This decline was primarily due to the lower
demand for natural gas by electricity producers, which
used hydro power to the detriment of natural gas
combustion as rainfall increased.
In the fourth quarter of 2009, the Portuguese market
for natural gas was, at 1,035 million cubic metres, in
line with a year earlier.
In Spain, the market for natural gas contracted 11% in
2009 to 34 billion cubic metres. This contraction was
influenced by the 14% drop yoy in the electrical
segment as power companies switched to hydro
sourcing and demand for power was hit by the
adverse economic environment. The faltering
economy also had an impact on the demand for gas
from the commercial and industrial segments, which
declined by 8%.
In the fourth quarter of 2009, the Spanish market for
natural gas contracted 6% yoy to 9 billion cubic
metres, with the electrical segment falling 8% yoy
and the commercial and industrial segments
contracting 6% yoy.
Fourth Quarter and Twelve Months 2009 Results 8
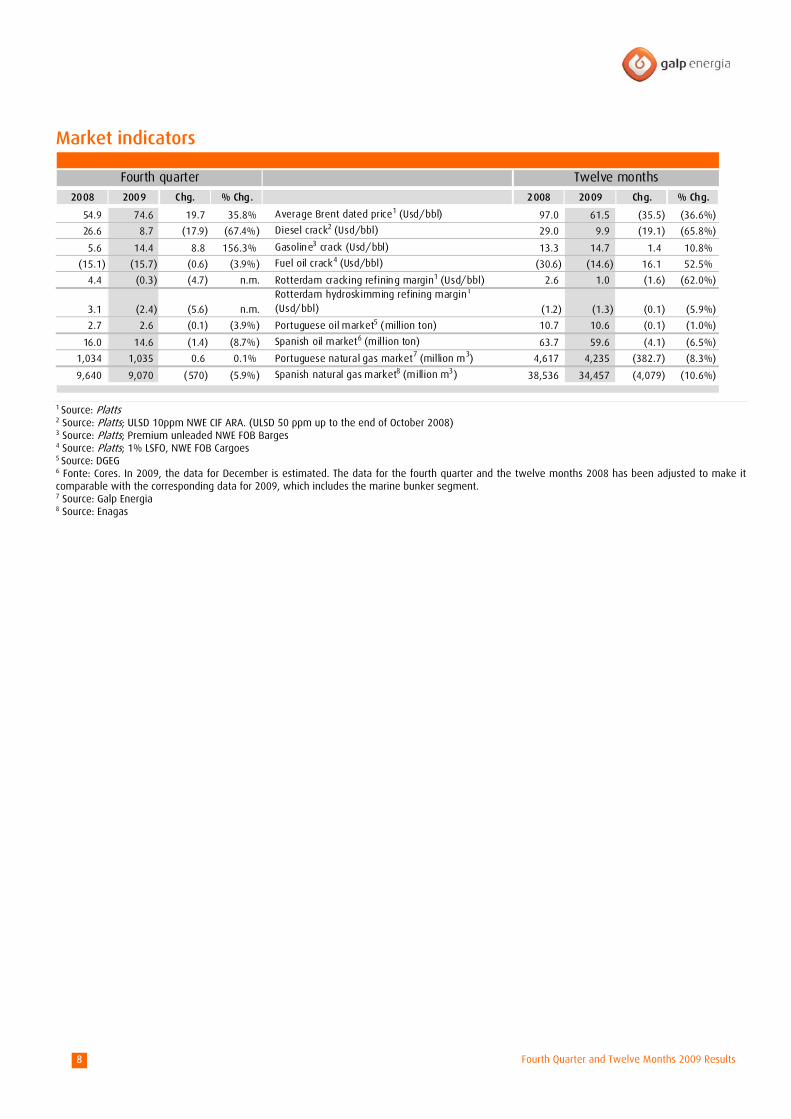
Market indicators
Fourth quarter Twelve months
2008 2009 Chg. % Chg. 2008 2009 Chg. % Chg.
54.9 74.6 19.7 35.8% Average Brent dated price1 (Usd/bbl) 97.0 61.5 (35.5) (36.6%)
26.6 8.7 (17.9) (67.4%) Diesel crack2 (Usd/bbl) 29.0 9.9 (19.1) (65.8%)
5.6 14.4 8.8 156.3% Gasoline3 crack (Usd/bbl) 13.3 14.7 1.4 10.8%
(15.1) (15.7) (0.6) (3.9%) Fuel oil crack4 (Usd/bbl) (30.6) (14.6) 16.1 52.5%
4.4 (0.3) (4.7) n.m. Rotterdam cracking refining margin1 (Usd/bbl) 2.6 1.0 (1.6) (62.0%)
3.1 (2.4) (5.6) n.m.
Rotterdam hydroskimming refining margin1
(Usd/bbl) (1.2) (1.3) (0.1) (5.9%)
2.7 2.6 (0.1) (3.9%) Portuguese oil market5 (million ton) 10.7 10.6 (0.1) (1.0%)
16.0 14.6 (1.4) (8.7%) Spanish oil market6 (million ton) 63.7 59.6 (4.1) (6.5%)
1,034 1,035 0.6 0.1% Portuguese natural gas market7 (million m3) 4,617 4,235 (382.7) (8.3%)
9,640 9,070 (570) (5.9%) Spanish natural gas market8 (million m3) 38,536 34,457 (4,079) (10.6%)
1 Source: Platts 2 Source: Platts; ULSD 10ppm NWE CIF ARA. (ULSD 50 ppm up to the end of October 2008) 3 Source: Platts; Premium unleaded NWE FOB Barges 4 Source: Platts; 1% LSFO, NWE FOB Cargoes 5 Source: DGEG 6 Fonte: Cores. In 2009, the data for December is estimated. The data for the fourth quarter and the twelve months 2008 has been adjusted to make it comparable with the corresponding data for 2009, which includes the marine bunker segment. 7 Source: Galp Energia 8 Source: Enagas
Fourth Quarter and Twelve Months 2009 Results 9
FINANCIAL REVIEW
1. INCOME STATEMENT
Million eurosFourth quarter Twelve months
2008 2009 Chg. % Chg. 2008 2009 Chg. % Chg.
3,579 2,959 (621) (17.3%) Turnover 15,086 12,008 (3,077) (20.4%)
(4,165) (2,752) (1,414) (33.9%) Operating expenses (14,698) (11,283) (3,415) (23.2%)
29 43 14 47.8% Other operating revenues (expenses) 61 94 33 53.9%
(557) 250 807 n.m. EBITDA 449 819 370 82.5%
(71) (131) (60) (83.8%) D&A and provisions (282) (360) 79 28.0%
(628) 119 747 n.m. Operating profit 167 459 291 174.2%
15 13 (2) (14.3%) Net profit from associated companies 48 70 21 43.7%
0 (0) (1) n.m. Net profit from investments 0 (1) (1) n.m.
(16) (23) (7) (41.4%) Net interest expenses (61) (76) (15) (24.6%)
(629) 108 738 n.m. Profit before tax and minority interests 155 451 297 191.8%
180 (19) 199 n.m. Income tax (33) (99) 66 199.7%
(1) (1) 0 8.2% Minority Interests (5) (6) 1 14.1%
(451) 87 539 n.m. Net profit 117 347 230 196.9%
(451) 87 539 n.m. Net profit 117 347 230 196.9%
571 (72) 643 n.m. Inventory effect 355 (161) (516) n.m.
120 16 (104) (86.8%) Net profit RC 472 186 (286) (60.6%)
5 18 13 n.m. Non recurrent items 6 27 22 n.m.
125 34 (91) (72.7%) Net profit RCA 478 213 (264) (55.3%)
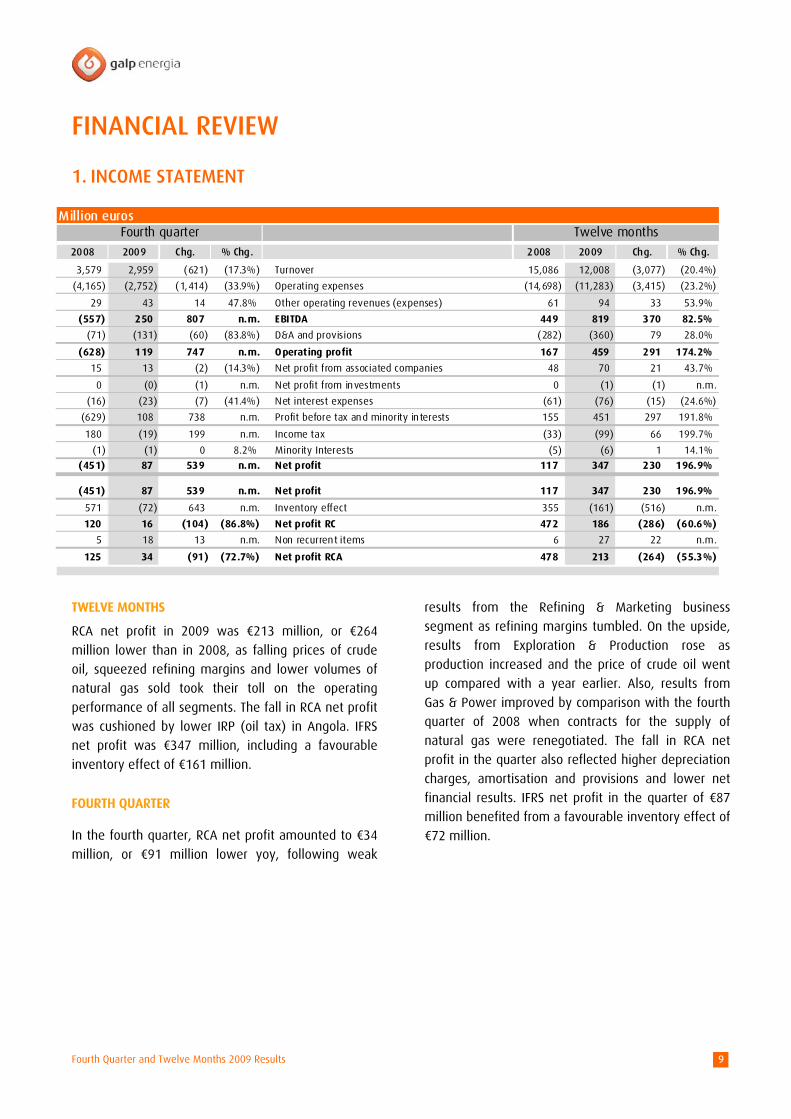
TWELVE MONTHS
RCA net profit in 2009 was €213 million, or €264
million lower than in 2008, as falling prices of crude
oil, squeezed refining margins and lower volumes of
natural gas sold took their toll on the operating
performance of all segments. The fall in RCA net profit
was cushioned by lower IRP (oil tax) in Angola. IFRS
net profit was €347 million, including a favourable
inventory effect of €161 million.
FOURTH QUARTER
In the fourth quarter, RCA net profit amounted to €34
million, or €91 million lower yoy, following weak
results from the Refining & Marketing business
segment as refining margins tumbled. On the upside,
results from Exploration & Production rose as
production increased and the price of crude oil went
up compared with a year earlier. Also, results from
Gas & Power improved by comparison with the fourth
quarter of 2008 when contracts for the supply of
natural gas were renegotiated. The fall in RCA net
profit in the quarter also reflected higher depreciation
charges, amortisation and provisions and lower net
financial results. IFRS net profit in the quarter of €87
million benefited from a favourable inventory effect of
€72 million.
Fourth Quarter and Twelve Months 2009 Results 10
2. ANALYSIS OF INCOME STATEMENT ITEMS
SALES AND SERVICES RENDERED
Million eurosFourth quarter Twelve months
2008 2009 Chg. % Chg. 2008 2009 Chg. % Chg.
3,579 2,959 (621) (17.3%) Sales and services rendered 15,086 12,008 (3,077) (20.4%)
- (48) (48) n.m. Non recurrent items (24) (48) (24) (99.0%)
3,579 2,911 (668) (18.7%) Sales and services rendered RCA 15,062 11,960 (3,101) (20.6%)
29 68 40 137.0% Exploration & Production 200 168 (33) (16.2%)
3,126 2,566 (559) (17.9%) Refining & Marketing 13,200 10,620 (2,580) (19.5%)
507 369 (137) (27.1%) Gas & Power 1,942 1,425 (518) (26.6%)
41 26 (14) (34.9%) Others 127 111 (16) (12.6%)
(122) (120) 3 2.1% Consolidation adjustments (408) (363) 45 11.0%
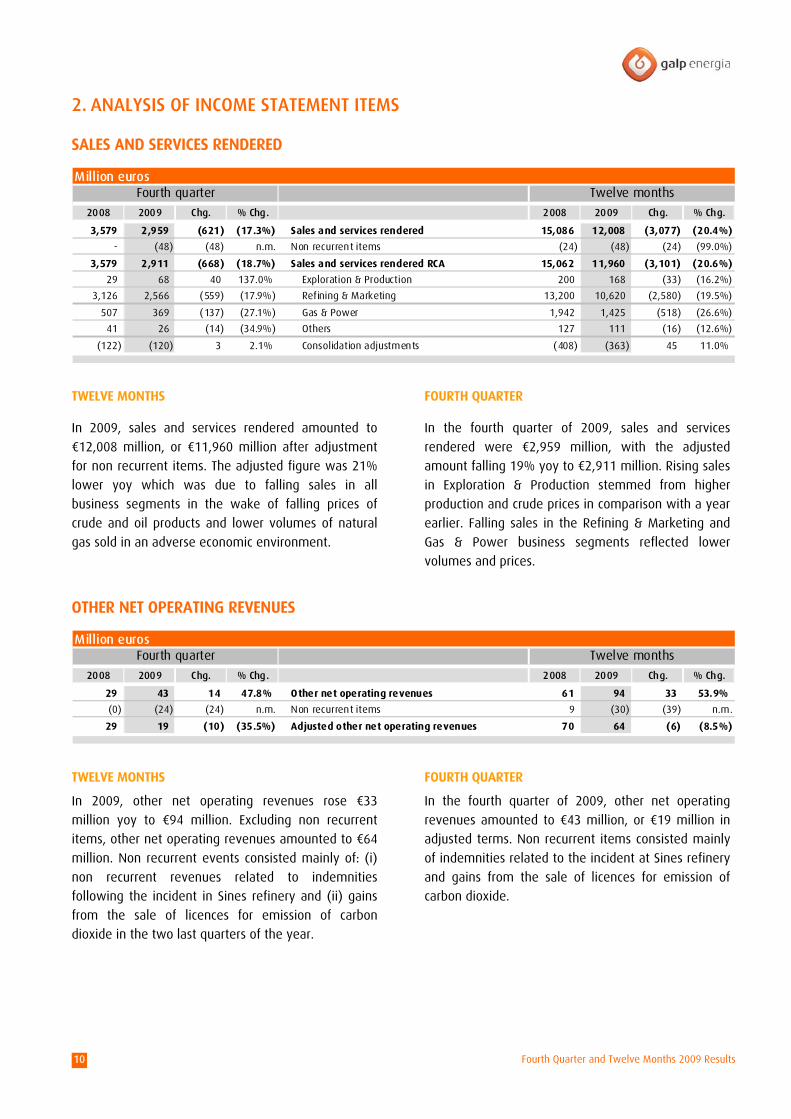
TWELVE MONTHS
In 2009, sales and services rendered amounted to
€12,008 million, or €11,960 million after adjustment
for non recurrent items. The adjusted figure was 21%
lower yoy which was due to falling sales in all
business segments in the wake of falling prices of
crude and oil products and lower volumes of natural
gas sold in an adverse economic environment.
FOURTH QUARTER
In the fourth quarter of 2009, sales and services
rendered were €2,959 million, with the adjusted
amount falling 19% yoy to €2,911 million. Rising sales
in Exploration & Production stemmed from higher
production and crude prices in comparison with a year
earlier. Falling sales in the Refining & Marketing and
Gas & Power business segments reflected lower
volumes and prices.
OTHER NET OPERATING REVENUES
Million eurosFourth quarter Twelve months
2008 2009 Chg. % Chg. 2008 2009 Chg. % Chg.
29 43 14 47.8% Other net operating revenues 61 94 33 53.9%
(0) (24) (24) n.m. Non recurrent items 9 (30) (39) n.m.
29 19 (10) (35.5%) Adjusted other net operating revenues 70 64 (6) (8.5%)
TWELVE MONTHS
In 2009, other net operating revenues rose €33
million yoy to €94 million. Excluding non recurrent
items, other net operating revenues amounted to €64
million. Non recurrent events consisted mainly of: (i)
non recurrent revenues related to indemnities
following the incident in Sines refinery and (ii) gains
from the sale of licences for emission of carbon
dioxide in the two last quarters of the year.
FOURTH QUARTER
In the fourth quarter of 2009, other net operating
revenues amounted to €43 million, or €19 million in
adjusted terms. Non recurrent items consisted mainly
of indemnities related to the incident at Sines refinery
and gains from the sale of licences for emission of
carbon dioxide.

Fourth Quarter and Twelve Months 2009 Results 11
OPERATING COSTS
Million eurosFourth quarter Twelve months
2008 2009 Chg. % Chg. 2008 2009 Chg. % Chg.
4,165 2,752 (1,414) (33.9%) Operational costs 14,698 11,283 (3,415) (23.2%)
(799) 95 894 n.m. Inventory effect (517) 211 728 n.m.
3,367 2,847 (520) (15.4%) Operational costs RC 14,181 11,494 (2,687) (18.9%)
(1) (17) (16) n.m. Non recurrent items (23) (40) (18) (78.6%)
3,366 2,830 (536) (15.9%) Operational costs RCA 14,158 11,454 (2,705) (19.1%)
3,366 2,830 (536) (15.9%) Operational costs RCA 14,158 11,454 (2,705) (19.1%)
3,068 2,554 (514) (16.7%) Cost of goods sold 13,189 10,404 (2,785) (21.1%)
213 187 (26) (12.3%) Supply and services 680 728 48 7.1%
85 89 5 5.4% Personnel costs 290 322 32 11.1%
TWELVE MONTHS
In 2009, operating costs amounted to €11,283 million
or €11,454 million in RCA terms. The drop of 19% in
the latter was due to the lower cost of goods sold as
the prices of crude, oil products and natural gas fell
and sales volumes contracted.
The 7% rise in supply and services cost reflected
primarily the consolidation of the former Agip and
ExxonMobil subsidiaries and the 11% rise in personnel
costs was also due to the consolidation of these
companies. Excluding the effect of these acquisitions,
personnel and supply and services costs combined
decreased by 5% relative to 2008.
FOURTH QUARTER
In the fourth quarter of the year, operating costs
amounted to €2,752 million. In RCA terms, the 16%
drop to €2,830 million was due to the lower cost of
goods sold against a backdrop of falling volumes sold
of natural gas and oil products in comparison with a
year earlier. The integration of Agip and ExxonMobil
operations led to an increase in supply and services
cost and personnel costs with an impact of €25 million
and €20 million, respectively. In adjusted terms and
on a comparable basis, the sum of personnel and
supply and services costs decreased by 15% yoy.
EMPLOYEES
December 31,2008
September 30, 2009
December 31, 2009
Change vs Dec 31, 2008
Change vs Sept 30, 2009
Exploration & Production 70 79 78 8 (1)
Refining & Marketing 6,686 6,537 6,340 (346) (197)
Gas & Power 476 478 468 (8) (10)
Corporte & Others 585 593 607 22 14
Total employees 7,817 7,687 7,493 (324) (194)
Service stations employees 3,918 3,878 3,761 (157) (117)
Total off site employees 3,899 3,809 3,732 (167) (77)
At the end of December 2009, Galp Energia had a
total of 7,493 employees, 3,761 of whom worked at
service stations. The change from September is
primarily explained by the Refining & Marketing

Fourth Quarter and Twelve Months 2009 Results 12
business segment, where the number of staff at
service stations fell as the distribution network was
rationalised.
DEPRECIATION AND AMORTISATION
Million eurosFourth quarter Twelve months
2008 2009 Chg. % Chg. 2008 2009 Chg. % Chg.
71 112 41 58.1% Depreciation & amortisation 240 297 57 23.8%
(10) (35) (26) n.m. Non recurrent items 2 (37) (38) n.m.
61 77 16 25.7% Adjusted depreciation & amortisation 241 260 19 7.7%
61 77 16 25.7% Adjusted depreciation & amortisation 241 260 19 7.7%
20 8 (12) (59.2%) Exploration & Production 69 41 (29) (41.3%)
36 60 24 68.5% Refining & Marketing 143 190 47 32.6%
5 9 3 58.5% Gas & Power 29 29 1 1.8%
0 0 0 n.m. Others 1 1 0 25.5%
TWELVE MONTHS
Depreciation and amortisation of €297 million in 2009
included charges for dry wells in Brazil, which
explained most non recurrent items in the year.
Adjusted depreciation and amortisation increased by
€19 million to €260 million mainly as a result of the
Refining & Marketing segment’s acquisition of the
Iberian Agip and ExxonMobil subsidiaries and the first
depreciation of the capital expenditure incurred during
the scheduled stop of the Sines refinery in 2008. The
Exploration & Production business segment benefited
from a lower depreciation rate following the upward
revision of net entitlement reserves due to a lower
reference price of crude oil. Depreciation charges in
the Gas & Power business segment remained stable in
comparison with 2008 as the start of operations at the
Sines cogeneration plant did not take place until the
fourth quarter of 2009.
FOURTH QUARTER
In the fourth quarter, adjusted depreciation and
amortisation increased by €16 million yoy to €77
million. This amount excluded non recurrent items of
€35 million, which were mostly related to charges for
dry wells in Brazil. Depreciation in Exploration &
Production fell as the lower price of crude oil led to an
upward revision of net entitlement reserves and,
consequently, to a lower depreciation rate. This
decrease was, however, more than offset by
increased depreciation in Refining & Marketing as a
result of capital spending during the scheduled stop of
the Sines refinery and the acquisition of the Agip and
ExxonMobil operations. In the Gas & Power business
segment, increased depreciation charges were
primarily influenced by the start of operations at the
Sines cogeneration plant in the fourth quarter of 2009.

Fourth Quarter and Twelve Months 2009 Results 13
PROVISIONS
Million eurosFourth quarter Twelve months
2008 2009 Chg. % Chg. 2008 2009 Chg. % Chg.
0 19 19 n.m. Provisions 42 64 22 52.1%
3 (0) (3) n.m. Non recurrent items (2) 8 10 n.m.
4 19 15 n.m. Adjusted provisions 40 72 32 80.6%
4 19 15 n.m. Adjusted provisions 40 72 32 80.6%
5 (0) (5) n.m. Exploration & Production 8 4 (3) (43.5%)
6 8 2 24.4% Refining & Marketing 13 23 11 n.m.
(8) 11 19 n.m. Gas & Power 20 43 24 121.4%
1 0 (1) n.m. Others 0 1 1 n.m.
TWELVE MONTHS
In 2009, provisions amounted to €64 million and
increased by €32 million yoy in adjusted terms to €72
million. This increase was primarily related to (i) the
renegotiation of natural gas contracts in the Gas &
Power business segment and (ii) doubtful debtors in
marketing of oil products and natural gas.
Non recurrent events of €8 million were explained by
reversed provisions for debtors and the environment.
FOURTH QUARTER
In the fourth quarter of 2009, provisions of €19 million
were in line with the adjusted amount, which rose by
€15 million yoy. The increase was primarily due to
provisions for the renegotiation of natural gas
contracts in the Gas & Power business segment.
OPERATING PROFIT
Million eurosFourth quarter Twelve months
2008 2009 Chg. % Chg. 2008 2009 Chg. % Chg.
(628) 119 747 n.m. Operating profit 167 459 291 174.2%
799 (95) (894) n.m. Inventory effect 517 (211) (728) n.m.
170 23 (147) (86.3%) Operating profit RC 684 248 (436) (63.7%)
8 28 19 n.m. Non recurrent items 9 39 29 n.m.
179 51 (127) (71.3%) Operating profit RCA 693 287 (407) (58.7%)
179 51 (127) (71.3%) Operating profit RCA 693 287 (407) (58.7%)
18 31 13 72.1% Exploration & Production 141 67 (74) (52.5%)
216 (6) (223) n.m. Refining & Marketing 373 79 (294) (78.7%)
(52) 30 82 n.m. Gas & Power 176 135 (41) (23.2%)
(3) (3) 1 n.m. Others 3 5 2 47.0%
TWELVE MONTHS
RCA operating profit fell 59% in 2009 relative to 2008,
to €287 million, which was due to a weak
performance by all business segments as crude prices,
crack spreads and the demand for natural gas
developed unfavourably. IFRS operating profit
amounted to €459 million and included a favourable
Fourth Quarter and Twelve Months 2009 Results 14
inventory effect of €211 million arising from higher
prices of crude and oil products in 2009.
FOURTH QUARTER
In the fourth quarter of 2009, RCA operating profit of
€51 million reflected the worse results in Refining &
Marketing as refining margins fell in comparison with
2008. On the upside, the results of the Exploration &
Production business segment rose as total production
and the price of crude oil increased yoy. Rising results
yoy in the Gas & Power business segment reflected
mainly the negative impact of the renegotiation of
natural gas contracts on the fourth quarter of 2008.
IFRS operating profit of €119 million included a
favourable inventory effect of €95 million as the
prices of crude and oil products developed favourably.
OTHER RESULTS
Million eurosFourth quarter Twelve months
2008 2009 Chg. % Chg. 2008 2009 Chg. % Chg.
15 13 (2) (14.3%) Net profit from associated companies 48 70 21 43.7%
0 (0) (1) n.m. Net profit from investments 0 (1) (1) n.m.
(16) (23) (7) (42.8%) Financial results (61) (76) (15) (24.9%)
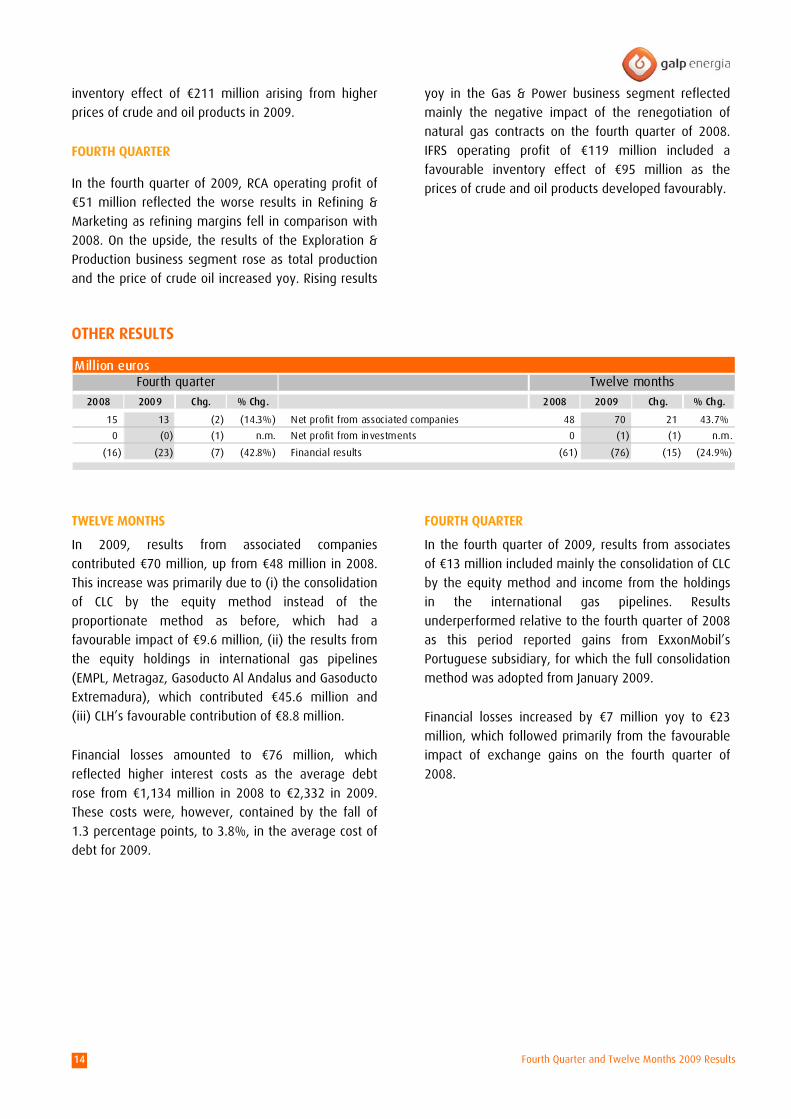
TWELVE MONTHS
In 2009, results from associated companies
contributed €70 million, up from €48 million in 2008.
This increase was primarily due to (i) the consolidation
of CLC by the equity method instead of the
proportionate method as before, which had a
favourable impact of €9.6 million, (ii) the results from
the equity holdings in international gas pipelines
(EMPL, Metragaz, Gasoducto Al Andalus and Gasoducto
Extremadura), which contributed €45.6 million and
(iii) CLH’s favourable contribution of €8.8 million.
Financial losses amounted to €76 million, which
reflected higher interest costs as the average debt
rose from €1,134 million in 2008 to €2,332 in 2009.
These costs were, however, contained by the fall of
1.3 percentage points, to 3.8%, in the average cost of
debt for 2009.
FOURTH QUARTER
In the fourth quarter of 2009, results from associates
of €13 million included mainly the consolidation of CLC
by the equity method and income from the holdings
in the international gas pipelines. Results
underperformed relative to the fourth quarter of 2008
as this period reported gains from ExxonMobil’s
Portuguese subsidiary, for which the full consolidation
method was adopted from January 2009.
Financial losses increased by €7 million yoy to €23
million, which followed primarily from the favourable
impact of exchange gains on the fourth quarter of
2008.

Fourth Quarter and Twelve Months 2009 Results 15
INCOME TAX
Million euros (except otherwise noted)Fourth quarter Twelve months
2008 2009 Chg. % Chg. 2008 2009 Chg. % Chg.
(180) 19 199 n.m. Income tax IFRS1 33 99 66 199.7%
n.m. 18% n.m. n.m. Effective income tax 21% 22% 1 p.p. n.m.
227 (24) 251 n.m. Inventory effect 162 (50) 211 n.m.
48 (5) (52) n.m. Income tax RC1 195 49 (146) (74.8%)
4 10 7 195.3% Non recurrent items 3 12 9 n.m.
51 6 (46) (89.2%) Income tax RCA1 198 61 (137) (69.1%)
29% 13% (15 p.p.) n.m. Effective income tax 29% 22% (7 p.p.) n.m.
1 Includes oil tax (IRP) payable in Angola
TWELVE MONTHS
In 2009, IFRS income tax amounted to €99 million,
which equated to an effective tax rate of 22%, in line
with 2008. In RCA terms, income tax decreased by
€137 million to €61 million as operating profit
declined and IRP fell from €59 million in 2008 to €17
million in 2009 following the reduction in target
production on which IRP is calculated and the lower
price of crude oil in the period. The effective RCA tax
rate fell from 29% in 2008 to 22% in 2009 as the IRP
decreased and companies that were consolidated by
the proportionate method that had been used up to
31 December 2008, started to be consolidated by the
equity method instead.
FOURTH QUARTER
IFRS income tax amounted to €19 million, which
equated to an effective tax rate of 18%. RCA income
tax fell by €46 million to €6 million following the
weak operating profit in the quarter and despite a rise
yoy in the IRP from €3 million to €6 million. The RCA
effective tax rate fell to 13% from 29% a year earlier
as operating profit fell and consolidation of selected
associates changed from the proportionate to the
equity method after 31 December 2008.
3. FINANCIAL POSITION
Million euros (except otherwise noted)
December 31, 2008September 30,
2009December 31,
2009Change vs Dec 31,
2008Change vs Sept 30,
2009
Fixed assets 3,881 3,941 4,154 273 213
Strategic stock 480 636 575 95 (62)
Other assets (liabilities) (29) (64) (24) 5 40
Working capital (249) (23) (389) (140) (367)
4,082 4,491 4,316 233 (176)
Short term debt 687 409 424 (263) 15
Long term debt 1,304 1,974 1,747 443 (227)
Total debt 1,991 2,383 2,171 180 (212)
Cash 127 184 244 117 60
Total net debt 1,864 2,198 1,927 63 (271)
Total shareholder's equity 2,219 2,293 2,389 170 96
Capital employed 4,082 4,491 4,316 233 (176)

Fourth Quarter and Twelve Months 2009 Results 16
At the end of December 2009, fixed assets of €4,154
million were €213 million higher than at the end of
September following capital spending in the fourth
quarter, an increase that was in line with the change
from the end of 2008. Yet it was below capital
expenditure in the year owing to (i) the consolidation
by the equity method of associates for which the
proportionate method had been used up to the end of
December 2008 and (ii) the re-booking of inventories
at the former Agip and ExxonMobil subsidiaries from
fixed assets to working capital.
The strategic stock of €575 million was €62 million
lower than at the end of September as volumes of oil
products fell, which was not offset by price rises
between the third and the fourth quarter of the year.
Working capital was reduced by €367 million at the
end of September to €389 million as a result of
efficient working capital management.
DEBT
Million euros (except otherwise noted)
Short term Long term Short term Long term Short term Long term Short term Long term Short term Long term
Bonds 2 - 1 700 1 700 (0) 700 - -
Bank debt 485 754 407 1,024 422 947 (63) 193 15 (77)
Commercial paper 200 550 - 250 - 100 (200) (450) - (150)
Cash (127) - (184) - (244) - (117) - (60) -
Net debt
Average life (years)
Net debt to equity (15.2 p.p.)
(0.19)
2,198 (271)
96%
Change vs Sept 30, 2009
December 31, 2008 September 30, 2009 December 31, 2009Change vs Dec 31,
2008
84% 81% (3.3 p.p.)
1,864 1,927 63
2.68 3.53 0.843.71
Net debt stood at the end of December 2009 at
€1,927 million, which was €271 million lower than at
the end of September 2009 despite capital spending
and the payment of dividends in the fourth quarter.
At 31 December 2009, 80% of the debt was long
term.
The net-debt-to-equity ratio of 81% on the same date
was, despite the amount of capital spending in 2009,
lower than 96% at the end of September 2009 and
84% at the end of December 2008.
The average life of debt was 3.53 years at the end of
December 2009 or 3.95 years if only long-term debt is
considered.
At the end of 2009, 39% of medium and long-term
debt was on a fixed-rate basis.
The average cost of debt for 2009 was 3.8% against
5.1% in 2008 as benchmark interest rates declined.
Net debt attributable to minority interests amounted
to €29.4 million at 31 December.
Fourth Quarter and Twelve Months 2009 Results 17
4. CASH FLOW
Million eurosFourth quarter Twelve months
2008 2009 2008 2009
(628) 119 Operating profit 167 459
71 112 Non cash costs 240 297
378 (47) Change in operational stock 354 (228)
514 62 Change in strategic stocks 214 96
335 246 Sub total 975 623
(21) (22) Interest expenses (51) (75)
(51) (19) Taxes (186) (101)
(40) 413 Change in working capital excluding operational stock (128) 409
222 618 Cash flow from operating activities 611 856
(1,113) (330) Net capital expenditures and disposals1 (1,535) (800)
(94) (6) Dividends paid / received (217) (127)
(3) (11) Others 12 7
(988) 271 Total (1,129) (63)
1 Net capital expenditure and disposals include financial investments
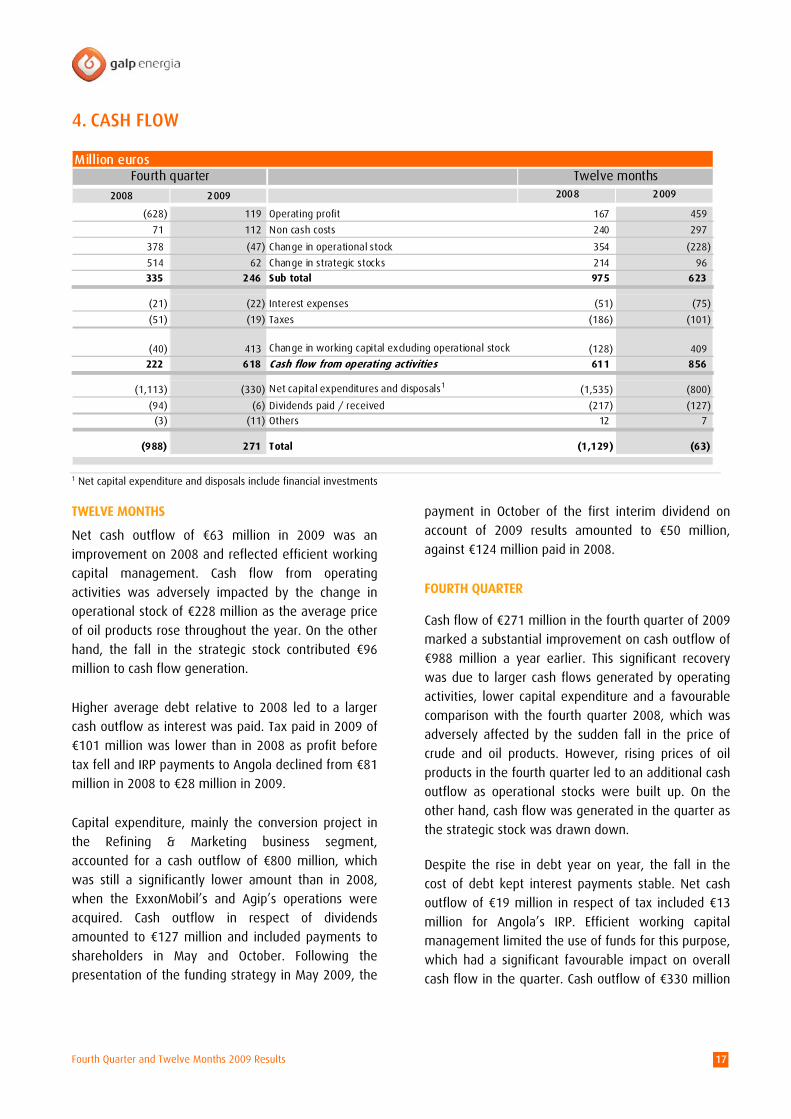
TWELVE MONTHS
Net cash outflow of €63 million in 2009 was an
improvement on 2008 and reflected efficient working
capital management. Cash flow from operating
activities was adversely impacted by the change in
operational stock of €228 million as the average price
of oil products rose throughout the year. On the other
hand, the fall in the strategic stock contributed €96
million to cash flow generation.
Higher average debt relative to 2008 led to a larger
cash outflow as interest was paid. Tax paid in 2009 of
€101 million was lower than in 2008 as profit before
tax fell and IRP payments to Angola declined from €81
million in 2008 to €28 million in 2009.
Capital expenditure, mainly the conversion project in
the Refining & Marketing business segment,
accounted for a cash outflow of €800 million, which
was still a significantly lower amount than in 2008,
when the ExxonMobil’s and Agip’s operations were
acquired. Cash outflow in respect of dividends
amounted to €127 million and included payments to
shareholders in May and October. Following the
presentation of the funding strategy in May 2009, the
payment in October of the first interim dividend on
account of 2009 results amounted to €50 million,
against €124 million paid in 2008.
FOURTH QUARTER
Cash flow of €271 million in the fourth quarter of 2009
marked a substantial improvement on cash outflow of
€988 million a year earlier. This significant recovery
was due to larger cash flows generated by operating
activities, lower capital expenditure and a favourable
comparison with the fourth quarter 2008, which was
adversely affected by the sudden fall in the price of
crude and oil products. However, rising prices of oil
products in the fourth quarter led to an additional cash
outflow as operational stocks were built up. On the
other hand, cash flow was generated in the quarter as
the strategic stock was drawn down.
Despite the rise in debt year on year, the fall in the
cost of debt kept interest payments stable. Net cash
outflow of €19 million in respect of tax included €13
million for Angola’s IRP. Efficient working capital
management limited the use of funds for this purpose,
which had a significant favourable impact on overall
cash flow in the quarter. Cash outflow of €330 million
Fourth Quarter and Twelve Months 2009 Results 18
from investing activities was a substantial
improvement on the outflow of €1,113 million in the
fourth quarter of 2008, when the Agip and ExxonMobil
operations were acquired. Despite the dividend
payment in October, the new dividend policy that
followed the revised funding strategy lessened the
impact of dividend payments on the overall cash flow
generation in the quarter.
5. CAPITAL EXPENDITURE
Million eurosFourth quarter Twelve months
2008 2009 Chg. % Chg. 2008 2009 Chg. % Chg.
44 38 (6) (14.3%) Exploration & Production 196 193 (3) (1.5%)
1,049 232 (818) (77.9%) Refining & Marketing 1,245 456 (789) (63.4%)
37 24 (13) (35.1%) Gas & Power 116 77 (39) (33.5%)
2 1 (1) (43.6%) Others 2 3 1 n.m.
1,132 295 (838) (74.0%) Investment 1,560 730 (830) (53.2%)
TWELVE MONTHS
Capital expenditure of €730 million in 2009 was
predominantly allocated to the Refining & Marketing
and Exploration & Production business segments,
which absorbed 62% and 26% of the total,
respectively.
Spending of €193 million in Exploration & Production
was mainly channelled to activities in the Santos
Basin, in the Brazilian offshore, and Angola’s Block 14.
In this country, €80 million was spent, of which €38
million on the Tômbua-Lândana field. Expenditure in
Brazil was predominantly channelled to the Santos
Basin offshore, where the Tupi field accounted for €81
million. In the Brazilian onshore, spending of €31
million included the signing bonus for the tenth round
of bidding for exploration licences in Brazil.
In the Refining & Marketing business segment, capital
expenditure of €456 million was mainly channelled to
the conversion project, which accounted for €248
million. Marketing of oil products in the Iberian
Peninsula absorbed €136 million, from which €40
million was allocated to Portugal and €85 million to
Spain, namely for the integration of the Agip and
ExxonMobil operations.
Capital expenditure of €77 million in the Gas & Power
business segment centred mainly on natural gas
activities following the connection of new and
converted clients and the expansion and renewal of
the distribution network by close to 529 km. In the
Power sector, expenditure was mainly channelled to
the cogeneration plants at the Sines and Porto
refineries.
FOURTH QUARTER
Capital expenditure in the fourth quarter amounted to
€295 million, of which Refining & Marketing
accounted for 79%, followed by Exploration &
Production, with 13% of the total.
In the Exploration & Production business segment,
expenditure in Angola focused on block 14, where €14
million was spent, predominantly on the development
of the Tômbua-Lândana field. Expenditure in Brazil
was mainly allocated to offshore fields in the Santos
Basin, particularly the Tupi, which accounted for €22
million.
Capital spending of €232 million in the Refining &
Marketing business segment was mainly allocated to
the conversion project, which accounted for €114
million. In marketing of oil products, Portugal
absorbed €24 million and Spain €61 million.
Expenditure of €24 million in the Gas & Power
business segment was primarily allocated to
expansion of the natural gas distribution network. In
the Power business, spending in the quarter was
mainly channelled to the cogeneration plants at the
Porto and Sines refineries.
Fourth Quarter and Twelve Months 2009 Results 19
SEGMENT REVIEW
1. EXPLORATION & PRODUCTION
RESERVES AND CONTINGENT RESOURCES
At the end of 2009, according to a report by DeGolyer
and MacNaughton (“DeMac”), Galp Energia’s proved
and probable reserves in Block 14 amounted to 35
million barrels against 28 million barrels of oil at the
end of 2008. Notwithstanding the 3.3 million barrels
of crude production in 2009, reserves increased due to
(i) the reclassification of Tômbua-Lândana’s resources
as reserves and (ii) the change in the reference price
of crude oil for the calculation of reserves on a net
entitlement basis from Usd 97.0/bbl in 2008 to Usd
61.5/bbl in 2009. According to the report, Galp
Energia’s contingent resources (3C) amounted to
3,065 million barrels of oil and natural gas, of which
206 million barrels consisted of resources in Angola’s
blocks 14, 14K, 32 and 33 whereas the remainder –
2,859 million barrels – was in Brazil’s Santos Basin
offshore, Potiguar Basin onshore and the
Sergipe/Alagoas Basin. At the end of 2008, Galp
Energia’s contingent resources (3C) amounted to
2,113 million barrels of oil and natural gas.
EXPLORATION AND PRODUCTION ACTIVITIES
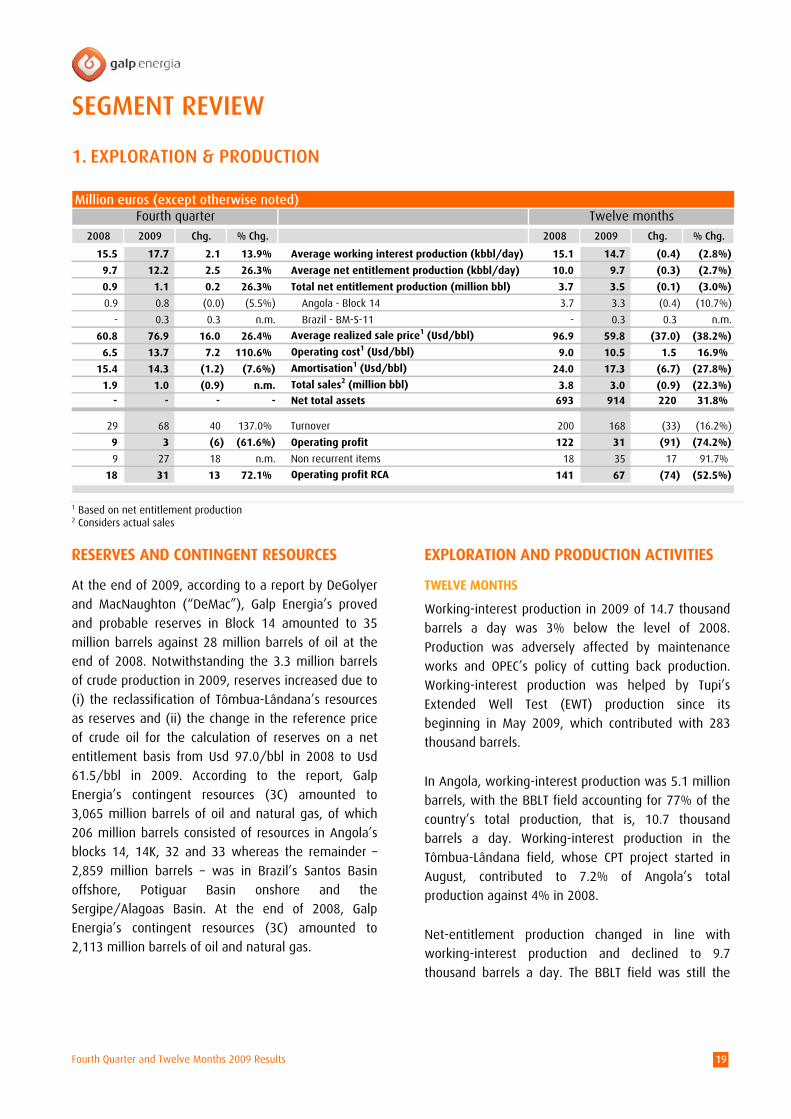
TWELVE MONTHS
Working-interest production in 2009 of 14.7 thousand
barrels a day was 3% below the level of 2008.
Production was adversely affected by maintenance
works and OPEC’s policy of cutting back production.
Working-interest production was helped by Tupi’s
Extended Well Test (EWT) production since its
beginning in May 2009, which contributed with 283
thousand barrels.
In Angola, working-interest production was 5.1 million
barrels, with the BBLT field accounting for 77% of the
country’s total production, that is, 10.7 thousand
barrels a day. Working-interest production in the
Tômbua-Lândana field, whose CPT project started in
August, contributed to 7.2% of Angola’s total
production against 4% in 2008.
Net-entitlement production changed in line with
working-interest production and declined to 9.7
thousand barrels a day. The BBLT field was still the
Million euros (except otherwise noted)Fourth quarter Twelve months
2008 2009 Chg. % Chg. 2008 2009 Chg. % Chg.
15.5 17.7 2.1 13.9% Average working interest production (kbbl/day) 15.1 14.7 (0.4) (2.8%)
9.7 12.2 2.5 26.3% Average net entitlement production (kbbl/day) 10.0 9.7 (0.3) (2.7%)
0.9 1.1 0.2 26.3% Total net entitlement production (million bbl) 3.7 3.5 (0.1) (3.0%)
0.9 0.8 (0.0) (5.5%) Angola - Block 14 3.7 3.3 (0.4) (10.7%)
- 0.3 0.3 n.m. Brazil - BM-S-11 - 0.3 0.3 n.m.
60.8 76.9 16.0 26.4% Average realized sale price1 (Usd/bbl) 96.9 59.8 (37.0) (38.2%)
6.5 13.7 7.2 110.6% Operating cost1 (Usd/bbl) 9.0 10.5 1.5 16.9%
15.4 14.3 (1.2) (7.6%) Amortisation1 (Usd/bbl) 24.0 17.3 (6.7) (27.8%)
1.9 1.0 (0.9) n.m. Total sales2 (million bbl) 3.8 3.0 (0.9) (22.3%)- - - - Net total assets 693 914 220 31.8%
29 68 40 137.0% Turnover 200 168 (33) (16.2%)
9 3 (6) (61.6%) Operating profit 122 31 (91) (74.2%)
9 27 18 n.m. Non recurrent items 18 35 17 91.7%
18 31 13 72.1% Operating profit RCA 141 67 (74) (52.5%)
1 Based on net entitlement production 2 Considers actual sales

Fourth Quarter and Twelve Months 2009 Results 20
highest-producing field, with 6.8 thousand barrels a
day, and accounted for 70% of total net-entitlement
production. The Tômbua-Lândana field contributed 9%
of total net-entitlement production, ahead of the 5%
in 2008. Net-entitlement production included Brazil’s
Extended Well Test production from the Tupi field,
which amounted to 283 thousand barrels from its
beginning.
In 2009, three cargoes – in June, September and
November – from the BBLT and Kuito fields for a total
of 3.0 million barrels were sold at an average discount
of Usd 1.2/bbl from dated Brent. Considering both
these effective cargoes and underlifting, the average
sales price was Usd 59.8/bbl.
FOURTH QUARTER
Working-interest production in the fourth quarter
reached 17.7 thousand barrels a day, up 14% from
2008. Production was adversely affected by OPEC’s
continued policy of production cutbacks, which led to
a fall of 6% in Angola’s working-interest production to
14.6 thousand barrels a day. The Tômbua-Lândana
field advanced 78% and reached a production of 1.6
thousand barrels a day, or 11% of Angola’s total
production against 6% a year earlier. Production of
283 thousand barrels from Brazil’s Extended Well Test,
which was booked in the fourth quarter, more than
offset the decline in Angola. Although the total
production from the Tupi’s Extended Well Test was
booked in the fourth quarter, the effective production
in the period was 183 thousand barrels. Working-
interest production rose by 24% qoq as all fields,
namely the Tômbua-Lândana and the Tupi, gave a
positive contribution.
Although Angola’s net-entitlement production fell in
line with working-interest production, total net-
entitlement production rose 26% yoy to 12.2
thousand barrels a day owing to the positive
contribution from Tupi’s production. Net-entitlement
production rose 37% qoq after the positive
contribution from (i) the Tômbua-Lândana production,
which rose 20% and (ii) the Tupi production in 2009,
which was booked in the fourth quarter.
In November 2009, a cargo of 997 thousand barrels
from the BBLT field was sold at a price in line with the
dated Brent as the quality of BBLT’s crude oil is similar
to the benchmark. Considering both this sale and
underlifting, the average sales price was Usd
76.9/bbl, up 26% from the price achieved in the third
quarter of the year.
OPERATING PROFIT
TWELVE MONTHS
RCA operating profit in 2009 was €67 million against
€141 million a year earlier. This decrease was
primarily due to the fall of 37% yoy in the price of
crude oil to Usd 61.5/bbl. The 3% fall in net-
entitlement production to 9.7 thousand barrels a day
also contributed to the weak operating performance
of this business segment.
Production costs in Angola went up by 10% to €25
million, which equated, on the basis of the net-
entitlement production, to a unit cost of Usd 10.5/bbl,
up 17% from 2008. This was due to lower production
in the country which provided a smaller base for
spreading fixed costs and scale squeeze maintenance
costs in the BBLT field in the fourth quarter of the
year.
Adjusted for non recurrent items, depreciation for the
period dropped €19 million yoy to €41 million. This fall
resulted from the downward revision of the dated
Brent reference price in comparison with 31 December
2008, which reduced the depreciation rate as net-
entitlement reserves were revised upwards. Based on
net-entitlement production, unit depreciation charges
fell 28% yoy to Usd 17.3/bbl from Usd 24.0/bbl a
year earlier.
Non recurrent items of €35 million consisted primarily
of charges for onshore dry wells in the Espírito Santo
and Sergipe-Alagoas basins.
FOURTH QUARTER
RCA operating profit in the fourth quarter of 2009 rose
to €31 million from €18 million a year earlier. This rise
came primarily in the wake of the 36% increase yoy
in the price of crude oil to Usd 74.6/bbl and the 26%

Fourth Quarter and Twelve Months 2009 Results 21
rise in net-entitlement production to 12.2 thousand
barrels a day, which was driven by production from
Tupi’s Extended Well Test. The 22% fall in depreciation
charges to €8 million also contributed to the rise in
RCA operating profit yoy.
Production costs in Angola amounted to €8 million,
which equated, on the basis of net-entitlement
production, to a unit cost of Usd 13.7/bbl, up from Usd
6.5/bbl a year earlier. This rise was explained by the
lower production that narrowed the base for
spreading fixed costs and by the scale squeeze
treatment works in the BBLT field.
Adjusted depreciation dropped to €8 million, after the
price of dated Brent was revised downwards in
comparison with 31 December 2008, which reduced
the depreciation rate after net-entitlement reserves
were revised upward. On the basis of net-entitlement
production, unit depreciation charges fell 8% yoy to
Usd 14.3/bbl from Usd 15.4/bbl a year earlier.
Non recurrent items of €27 million consisted primarily
of charges for onshore dry wells in the Espírito Santo
and Sergipe-Alagoas basins.
Fourth Quarter and Twelve Months 2009 Results 22
2. REFINING & MARKETING
Million euros (except otherwise noted)Fourth quarter Twelve months
2008 2009 Chg. % Chg. 2008 2009 Chg. % Chg.
4.4 (0.3) (4.7) n.m. Rotterdam cracking refining margin1 (Usd/bbl) 2.6 1.0 (1.6) (62.0%)
4.8 (1.4) (6.2) n.m.
Rotterdam hydroskimming + aromatics + base
oil refining margin1 (Usd/bbl) 0.7 (0.0) (0.7) n.m.
5.8 0.9 (4.8) (83.8%) Galp Energia refining margin (Usd/bbl) 4.4 1.5 (3.0) (67.2%)
2.8 2.1 (0.7) (24.3%) Refinery cash cost (Usd/bbl) 2.2 2.1 (0.1) (3.7%)
20,780 21,099 318 1.5% Crude processed (k bbl) 89,808 77,624 (12,184) (13.6%)3.0 3.0 0.0 1.1% Raw material processed (million tonnes) 13.1 11.5 (1.6) (12.0%)
4.3 4.2 (0.0) (0.3%) Total refined product sales (million tonnes) 16.0 16.7 0.7 4.3%
2.7 2.8 0.0 1.8% Sales to direct clients (million tonnes) 9.6 11.1 1.5 16.1%
1.4 1.5 0.1 4.9% Wholesale 4.6 5.8 1.1 23.9%
0.8 0.9 0.1 8.9% Retail 2.7 3.6 0.9 35.3%
0.1 0.1 (0.0) (6.7%) LPG 0.4 0.4 0.0 5.8%
0.4 0.3 (0.1) (19.8%) Others 1.9 1.4 (0.5) (27.5%)
0.6 0.7 0.0 6.5% Exports (million tonnes) 2.5 2.4 (0.1) (3.4%)
- - - - Number of service stations 1,509 1,451 (58) (3.8%)
- - - - Number of c-stores 428 467 39 9.1%- - - - Net total assets 4,619 4,800 181 3.9%
3,126 2,614 (511) (16.4%) Turnover 13,224 10,668 (2,556) (19.3%)
(605) 77 683 n.m. Operating profit (174) 316 490 n.m.
812 (85) (897) n.m. Inventory effect 552 (232) (784) n.m.
9 1 (8) n.m. Non recurrent items (4) (5) (0) 2.7%
216 (6) (223) n.m. Operating profit RCA 373 79 (294) (78.7%)
1 Source: Platts. For a complete description of the method for calculating Rotterdam margins, see “Definitions”
REFINING AND MARKETING ACTIVITIES
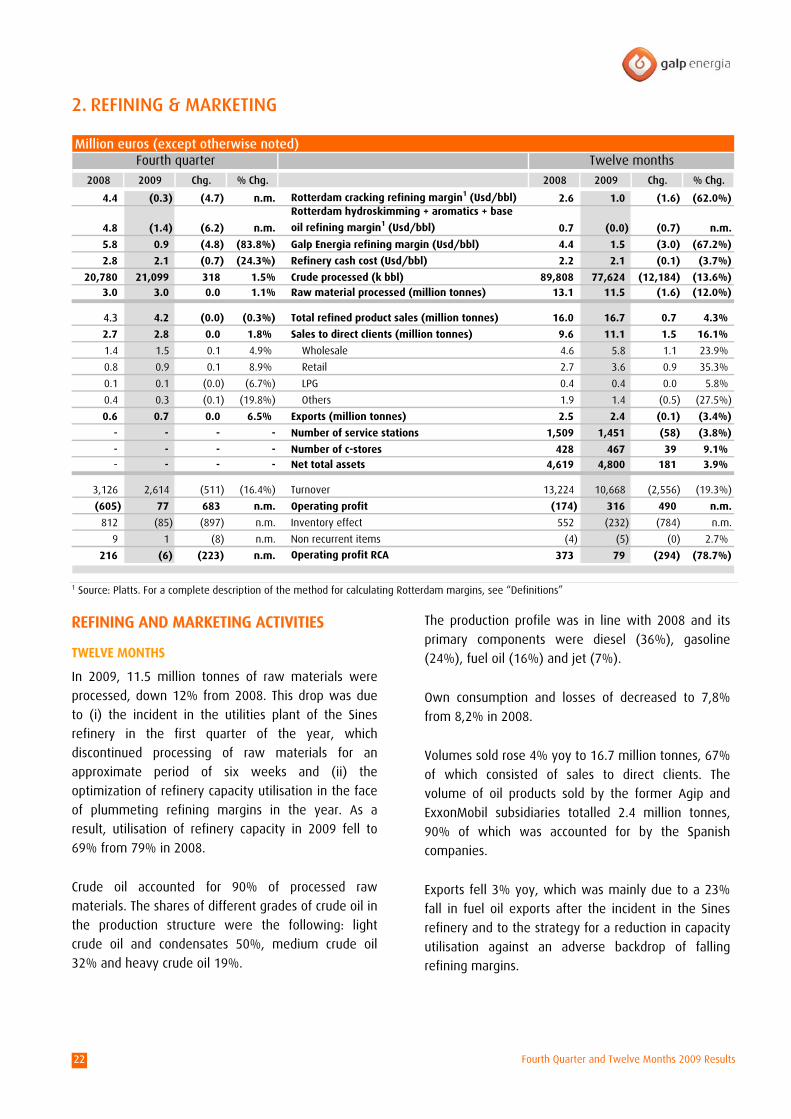
TWELVE MONTHS
In 2009, 11.5 million tonnes of raw materials were
processed, down 12% from 2008. This drop was due
to (i) the incident in the utilities plant of the Sines
refinery in the first quarter of the year, which
discontinued processing of raw materials for an
approximate period of six weeks and (ii) the
optimization of refinery capacity utilisation in the face
of plummeting refining margins in the year. As a
result, utilisation of refinery capacity in 2009 fell to
69% from 79% in 2008.
Crude oil accounted for 90% of processed raw
materials. The shares of different grades of crude oil in
the production structure were the following: light
crude oil and condensates 50%, medium crude oil
32% and heavy crude oil 19%.
The production profile was in line with 2008 and its
primary components were diesel (36%), gasoline
(24%), fuel oil (16%) and jet (7%).
Own consumption and losses of decreased to 7,8%
from 8,2% in 2008.
Volumes sold rose 4% yoy to 16.7 million tonnes, 67%
of which consisted of sales to direct clients. The
volume of oil products sold by the former Agip and
ExxonMobil subsidiaries totalled 2.4 million tonnes,
90% of which was accounted for by the Spanish
companies.
Exports fell 3% yoy, which was mainly due to a 23%
fall in fuel oil exports after the incident in the Sines
refinery and to the strategy for a reduction in capacity
utilisation against an adverse backdrop of falling
refining margins.
Fourth Quarter and Twelve Months 2009 Results 23
In 2009, the cover ratio of refining by marketing
activities soared to 95% from 75% in 2008. This rise
stemmed primarily from the increase in sales to direct
clients which followed from the acquisition of the Agip
and ExxonMobil operations and the lower utilisation of
refinery capacity.
Sales to direct clients rose 16% yoy, which was mainly
a result of added sales of oil products by the Agip and
ExxonMobil operations.
At the end of December 2009, Galp Energia had 1,451
service stations, 8 short qoq and 58 short yoy, as the
Portuguese and Spanish distribution networks were
rationalised following the acquisition of the Agip and
ExxonMobil operations.
The number of Galp Energia convenience stores rose
by 18 qoq and 39 yoy. At the end of December 2009,
around 50% of convenience stores were located in
Spain, which reflected the expanded marketing of oil
products in the country.
FOURTH QUARTER
In the fourth quarter of 2009, 3.0 million tonnes of
raw materials were processed, with crude oil
accounting for 93% of the total. The utilisation rate of
refinery capacity was, at 74%, in line with a year
earlier, when production was affected by the
scheduled stop for maintenance of the Sines refinery.
The refinery utilisation rate in the fourth quarter of
2009 is explained by the policy for rationalising
production in the face of level of refining margins.
Sales of oil products were, at 4.2 million tonnes, in
line with a year earlier. Sales by the former Agip and
ExxonMobil subsidiaries contributed 0.5 million tonnes
in the quarter and accounted for 19% of sales to direct
clients. These totalled 2.8 million tonnes, also in line
with the fourth quarter of 2008, a period that
reflected already the new sales of oil products by
Agip’s former Spanish subsidiary.
The cover of refining by marketing activities in the
fourth quarter was 101%, which reflected the
favourable effect of the new sales by the Agip and
ExxonMobil operations. In the fourth quarter of 2008,
which already included the sales by the former Agip
subsidiary in Spain, the cover ratio was 95%.
OPERATING PROFIT
TWELVE MONTHS
RCA operating profit of €79 million in 2009 was €294
million lower than in 2008. This unfavourable
development was partly due to the incident in the
Sines refinery, which led to the temporary stop of the
alkylation and FCC units until the end of the first
quarter. The economic environment in 2009, which
drove refining margins lower, was, however, the main
factor behind the fall in RCA operating profit.
Galp Energia’s refining margin in 2009 was Usd
1.5/bbl, down Usd 3.0/bbl from 2008. This
development was due to falling refining margins
internationally and the narrowing gap between light
and heavy crude oil, which had a negative impact on
the spread between Galp Energia’s own refining
margin and the benchmark refining margin.
Refining unit cash cost fell 4% yoy to €2.1/bbl despite
the 14% fall in crude processed in the year.
The time lag in 2009 had an unfavourable effect of
€56 million, against a favourable effect of €78 million
in 2008, meaning that it accounted for roughly half of
the fall in RCA operating profit in 2009 compared with
2008.
On the upside, the marketing of oil products affirmed
its stable profile and its additional contribution to
results through the sales generated by the former
Agip and ExxonMobil subsidiaries. In particular, the
synergies achieved by these acquisitions in
procurement and logistics clearly outstripped
expectations.
FOURTH QUARTER
The Refining & Marketing business segment posted an
RCA operating loss of €6 million in the fourth quarter
of 2009, against an operating profit of €216 million a
year earlier.

Fourth Quarter and Twelve Months 2009 Results 24
Galp Energia’s refining margin dropped to Usd 0.9/bbl
from Usd 5.8/bbl a year earlier, which reflected the
extended adverse international environment of
refining margins and the narrowing spread to the
benchmark following a reduction in the gap between
light and heavy crude oil compared with a year
earlier.
Refining unit cash cost dropped to Usd 2.1/bbl from
Usd 2.8/bbl a year earlier. This drop was due to the
scheduled stop of the Sines refinery in September
2008, which extended into the fourth quarter, thereby
adding to costs.
The time lag in the fourth quarter had an unfavourable
effect of €19 million, against a favourable effect of
€105 million a year earlier, meaning that it accounted
for roughly 55% of the fall in RCA operating profit in
2009 compared with 2008.
The worse results of the refining activities and the
time lag were partly offset by the results from
marketing of oil products both in Spain and Portugal
and by the contribution and captured synergies of the
acquisition of Agip and ExxonMobil operations.
Fourth Quarter and Twelve Months 2009 Results 25
3. GAS & POWER
Million euros (except otherwise noted)Fourth quarter Twelve months
2008 2009 Chg. % Chg. 2008 2009 Chg. % Chg.
1,225 1,198 (27) (2.2%) NG supply total sales volumes (million m3) 5,638 4,680 (958) (17.0%)
586 882 296 50.5% Liberalised market sales volumes (million m3) 3,219 3,208 (11) (0.3%)
392 392 0 0.1% Electrical 2,189 1,918 (271) (12.4%)
52 359 307 n.m. Industrial 123 1,010 887 n.m.
142 131 (11) (8.0%) Trading 907 280 (626) (69.1%)
638 316 (322) (50.5%) Regulated market sales volumes (million m3) 2,419 1,472 (947) (39.2%)
498 189 (309) (62.0%) Industrial 1,876 968 (908) (48.4%)
12 17 5 41.5% Commercial 89 94 5 6.2%
48 45 (3) (6.4%) Residential 201 197 (4) (2.0%)
74 65 (9) (12.1%) Other supply companies 253 212 (41) (16.1%)
- - - - NG distribution clients1 (thousands) 868 915 47 5.4%
104 289 185 178.0% Electric power generation2 (GWh) 489 721 232 47.4%
102 285 183 179.8% Sales of electricity to the grid2 478 706 228 47.6%
- - - - Natural gas net fixed assets3 755 779 23 3.1%- - - - Net total assets 1,659 1,669 10 0.6%
507 369 (137) (27.1%) Turnover 1,942 1,425 (518) (26.6%)
(29) 41 70 n.m. Operating profit 216 113 (103) (47.5%)
(13) (10) 3 (22.7%) Inventory effect (35) 21 56 n.m.
(10) (0) 9 n.m. Non recurrent items (5) 1 6 n.m.
(52) 30 82 n.m. Operating profit RCA 176 135 (41) (23.2%)
(79) 1 79 (100.8%) Supply 86 36 (50) (58.4%)
26 25 (1) (4.4%) Infrastructure 88 94 7 7.8%
1 5 4 n.m. Power 3 5 2 90.7%
1 Includes unconsolidated companies where Galp Energia has a significant interest
2 Includes Energin, which does not consolidate but where Galp Energia has a 35% holding. In 2009, the company generated power of 297 GWh and sold 288 GWh of electricity to the grid. In the fourth quarter, the company generated power of 76 GWh and sold 73 GWh of electricity to the grid
3 Excludes financial investments. Net fixed assets are on a consolidated basis
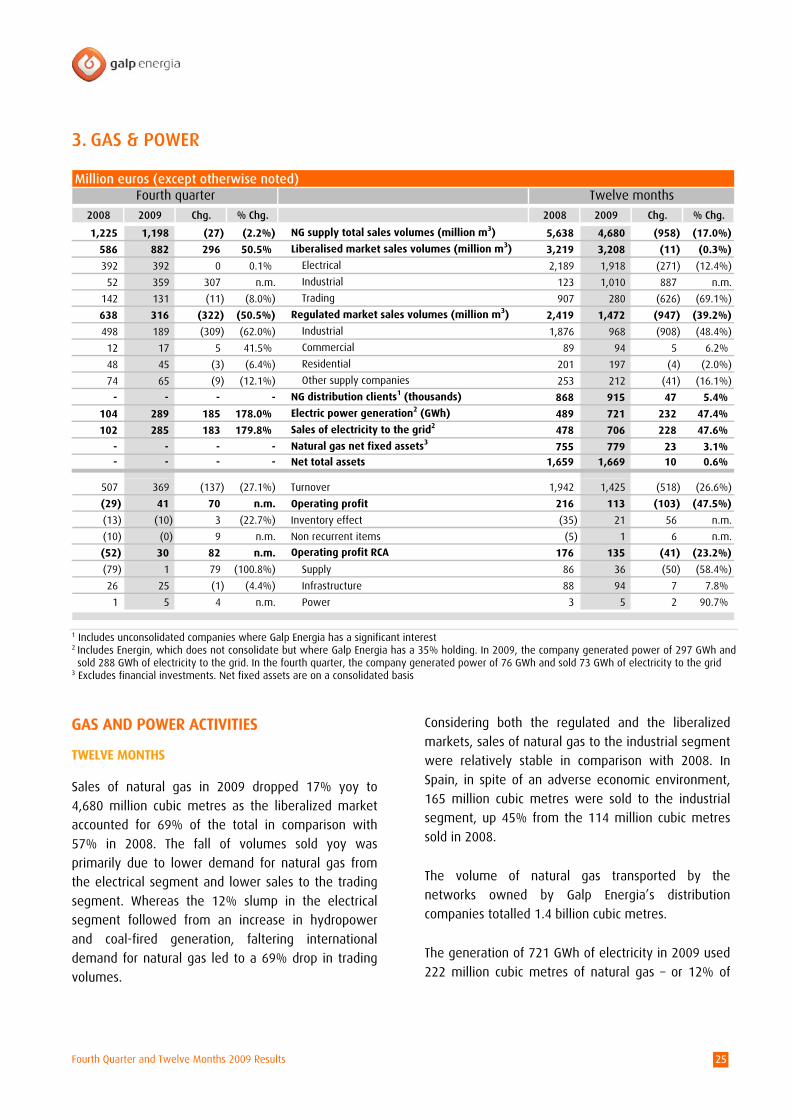
GAS AND POWER ACTIVITIES
TWELVE MONTHS
Sales of natural gas in 2009 dropped 17% yoy to
4,680 million cubic metres as the liberalized market
accounted for 69% of the total in comparison with
57% in 2008. The fall of volumes sold yoy was
primarily due to lower demand for natural gas from
the electrical segment and lower sales to the trading
segment. Whereas the 12% slump in the electrical
segment followed from an increase in hydropower
and coal-fired generation, faltering international
demand for natural gas led to a 69% drop in trading
volumes.
Considering both the regulated and the liberalized
markets, sales of natural gas to the industrial segment
were relatively stable in comparison with 2008. In
Spain, in spite of an adverse economic environment,
165 million cubic metres were sold to the industrial
segment, up 45% from the 114 million cubic metres
sold in 2008.
The volume of natural gas transported by the
networks owned by Galp Energia’s distribution
companies totalled 1.4 billion cubic metres.
The generation of 721 GWh of electricity in 2009 used
222 million cubic metres of natural gas – or 12% of
Fourth Quarter and Twelve Months 2009 Results 26
the Portuguese industrial market – in Galp Energia’s
cogenerations. Sales of electricity to the grid rose 48%
yoy to 706 GWh. In the fourth quarter, the
cogeneration plant at Sines came into operation and
became the main contributor to increasing production
and sales of electricity in the year.
FOURTH QUARTER
Sales of natural gas in the fourth quarter dropped 2%
yoy to 1,198 million cubic metres. Volumes sold in the
liberalized market accounted for 74% of the total,
against 48% a year earlier. Despite the increase in
hydropower, thermal generation by natural gas rose
yoy, which contributed to stable volumes sold
compared with a year earlier. The start of operations
by the cogeneration plant at the Sines refinery in the
fourth quarter of 2009 also increased the demand for
natural gas.
In distribution, transported volumes reached 341
million cubic metres.
Power generation in the fourth quarter rose to 289
GWh from 104 GWh a year earlier. Sales of electricity
to the grid were, at 285 GWh, in line with power
generation. The increase in both generation and sales
originated mainly from the new cogeneration plant at
the Sines refinery.
OPERATING PROFIT
TWELVE MONTHS
RCA operating profit in 2009 was €135 million, down
23% from 2008. This decrease stemmed primarily
from a drop of €36 million in the results of the supply
business, which were 58% lower yoy. This drop was
due to (i) lower volumes sold, (ii) lower margins
caused by the timelag effect between sourcing and
marketing natural gas contracts, primarily in the
beginning of the year, and the higher acquisition cost
of natural gas following the revision of the NLNG+
contract in late 2008, (iii) the regulated tariff for the
last resort supply activity since the second half of
2008 and (iv) the provisions on account of the
renegotiation of natural gas contracts.
The infrastructure business increased its results by 8%
to €94 million and showed its robust contribution to
the overall results of the Gas & Power business
segment.
Considering the sales of both electrical and thermal
energy, the unit margin in the power business
declined to €9.5/MWh from €11.8/MWh a year earlier
and sales to the grid were achieved at an average
price of €94.5/MWh.
FOURTH QUARTER
RCA operating profit in the fourth quarter of the year
improved to €30 million from an operating loss of €52
million a year earlier. This favourable change was
based on the results of the supply business, which
reported an operating profit of €1 million against a
loss of €79 million a year earlier, when results were
affected by the decision regarding the renegotiation
of contracts for the acquisition of natural gas.
However, RCA operating profit for the supply business
in the fourth quarter of 2009 includes the provisions
made for the renegotiation of the natural gas
contracts.
The infrastructure business reported RCA operating
profit of €25 million, was in line with a year earlier,
which evidenced the stable contribution of this activity
to the results of the Gas & Power business segment.
Considering the sales of electrical and thermal energy,
the unit margin in the power business declined to
€10.2/MWh from €11.6/MWh a year earlier. Sales to
the grid of 285 GWh were made at a price of
€68.8/MWh – against sales of 102 GWh at a price of
€123.4/MWh in the fourth quarter of 2008.

Fourth Quarter and Twelve Months 2009 Results 27
THE GALP ENERGIA SHARE
TWELVE MONTHS
In 2009, the Galp Energia share gained 68% and
peaked at €12.65 on October 20. Its minimum for the
year, €7.22, was reached on January 2. Since it was
floated on Euronext on 23 October 2006 up to 31
December 2009, the share has gained 108%. Over this
period, 413.8 million shares, equating to a daily
average of 1.6 million shares, have been traded. At 31
December 2009, Galp Energia had a market
capitalisation of €10,017 million.
FOURTH QUARTER
The stock gained 2% in the last quarter of the year,
when 98.9 million shares, the equivalent of a daily
average of 1.5 million shares, were traded.
Share detail
ISIN PTGAL0AM0009
Reuters GALP.LS
Bloomberg GALP PL
Number of shares 829,250,635
Main indicators
2008 4Q 2009 12M2009
Min (€) 5.95 11.10 7.22
Max (€) 18.95 12.65 12.65
Average (€) 13.05 12.06 10.23
Close price (€) 7.18 12.08 12.08
Volume (M shares) 643.6 98.9 413.8
Average volume per day (M shares) 2.5 1.5 1.6
Market cap (M€) 5,954 10,017 10,017
Performance of the Galp Energia stock
5 €
6 €
7 €
8 €
9 €
10 €
11 €
12 €
13 €
Jan/0
9
Feb/
09
Mar/0
9
Apr/0
9
May/0
9
Jun/0
9
Jul/0
9
Aug/0
9
Sep/
09
Oct/09
Nov/0
9
Dec/0
9
0
1
2
3
4
5
6Volume (Millions) Share price (€)
Source: Bloomberg

Fourth Quarter and Twelve Months 2009 Results 28
MATERIAL EVENTS IN THE FOURTH QUARTER OF 2009
CORPORATE
APPOINTMENT OF NEW MEMBER OF THE BOARD OF
DIRECTORS
On November 18, Galp Energia announced that the
board of directors approved the appointment of Mr.
Francesco Giunti as a non executive member of the
board of directors to fill a vacant position.
EXPLORATION & PRODUCTION
DRILLING OF FOURTH WELL CONFIRMS TUPI’S
POTENTIAL
On November 12, Galp Energia announced the
conclusion of the drilling in the fourth well informally
known as Tupi NE, located in Tupi’s Evaluation Plan
area, reinforcing the estimated volumes of
recoverable light oil and natural gas in the range
between 5 to 8 billion barrels in the pre-salt reservoirs
of that area.
TEST IN TUPI’S AREA PROVES HIGH PRODUCTIVITY
On November 18, Galp Energia announced that the
two drill stem tests conducted in the well, informally
known as Iracema, in block BM-S-11 in Santos basin,
located in Tupi’s Evaluation Plan area, were concluded
and proved a high productivity in the pre-salt
carbonate reservoirs.
NATURAL GAS LIQUEFACTION PROJECT IN THE PRE-SALT
On December 7, Galp Energia announced the
formalization of the entrance into a joint venture,
formed by Petrobras, BG Group and Repsol, to develop
the Front End Engineering and Design (FEED) of a
Floating Liquefied Natural Gas (FLNG) unit. The FLNG
unit is one of the technological transportation
solutions that can be used to transport the natural gas
produced in the pre-salt layers.
FORMATION TESTS PROVE IARA’S POTENTIAL
On December 8, Galp Energia announced the
conclusion of the formation tests on the well
informally known as Iara in the block BM-S-11 in
Santos Basin. The tests proved the exploratory
potential of this area through the production of light
oil (around 28º API) and confirmed the estimated
volumes of recoverable light oil and natural gas in the
range of 3 to 4 billion barrels
JOINT VENTURE FOR THE NATURAL GAS LIQUEFACTION
PROJECT IN THE PRE-SALT SIGNS AGREEMENTS FOR
FRONT END ENGINEERING DEVELOPMENT
On December 18, Galp Energia announced it has
signed the contracts for the development of the FEED
to build a FLNG unit. The successful bidders were
Saipem and the consortia SBM/Chiyoda and
Technip/JGC/Modec.
REFINING & MARKETING
GALP ENERGIA CLOSES THE SALE OF SOME OPERATIONS
ACQUIRED TO EXXONMOBIL
On December 4, Galp Energia closed the sale to
Gestmin, SGPS, S.A., of some businesses and assets
previously controlled by ExxonMobil Group in the oil
distribution business in Portugal for €46 million. This
sale was performed in order to fulfil the commitments
made by Galp Energia to the European Commission in
relation to the purchase of ExxonMobil's Iberian
operations that occurred at the end of 2008.

Fourth Quarter and Twelve Months 2009 Results 29
SINES REFINERY’S CONVERSION PROJECT REACHES
IMPORTANT PHASE
On December 18, Galp Energia announced that it
signed with Tecnicas Reunidas a Lump Sum Turn Key
(LSTK) contract for the Sines refinery’s conversion
project. The contract worth €1,080 million includes, in
addition to the conversion project, several other
projects in energy efficiency, reliability and
environmental areas and corresponds to the
conversion to a LSTK of the previous Engineering,
Procurement, Construction and Management (EPCM).
GAS & POWER
AGREEMENT TO ACQUIRE CERTAIN OF GAS NATURAL’S
GAS DISTRIBUTION ASSETS AND ASSOCIATED GAS
SUPPLY ACTIVITIES
On December 19, Galp Energia announced that
entered into a definitive agreement to acquire jointly
with Morgan Stanley certain of the gas distribution
and supply businesses in the region of Madrid from
Gas Natural SDG, S.A. The purchase price was €800
million. The distribution business comprises the
regulated low pressure gas distribution activities of
Gas Natural which cover most of the municipalities
surrounding the center of Madrid and has
approximately 504,000 homes connected to its
network. The supply business comprises the regulated
and unregulated end customers gas supply activities
in the area of the distribution business and provides
gas to about 412 thousand customers with an annual
consumption of around 0.4 bcm.
Fourth Quarter and Twelve Months 2009 Results 30
EVENTS AFTER THE CLOSE OF THE FOURTH QUARTER OF 2009GAS & POWER
GALP ENERGIA BUYS 15% OF VENTINVESTE FROM
MARTIFER RENEWABLES
On February 3 2010, Galp Energia announced the
acquisition from Martifer Renewables, an affiliate
company of Martifer SGPS, of 50% of the Parque
Eólico Penha da Gardunha, Lda., a company that
currently holds 30% of the share capital of
Ventinveste, S.A. (Ventinveste). The transaction
amounted to approximately 5 million euros. After this
transaction the shareholder structure of Ventinveste
will include Galp Energia group with 49%, Martifer
SGPS with 46.6%, Repower with 2.4% and Efacec with
2%.

Fourth Quarter and Twelve Months 2009 Results 31
ASSOCIATES
1. MAJOR ASSOCIATES
Company Country Business Segment Equity Share Consolidation method
Petróleos de Portugal, Petrogal, S.A. Portugal R&M 100% Full
Galp Energia España, S.A. Spain R&M 100% Full
Galp Exploração e Produção Petrolífera, S.A. Portugal E&P 100% Full
CLCM - Companhia Logística da Madeira, S.A. Portugal R&M 75% Full
CLC - Companhia Logística de Combustíveis, S.A. Portugal R&M 65% Equity
CLH - Compañia Logística de Hidrocarburos, S.A. Spain R&M 5% Equity
GDP, Gás de Portugal, SGPS, S.A. Portugal G&P 100% Full
Galp Gás Natural, S.A. Portugal G&P 100% Full
Transgás, S.A. Portugal G&P 100% Full
Transgás, Armazenagem, S.A. Portugal G&P 100% Full
EMPL - Europe MaghrebPipeline, Ltd Spain G&P 27% Equity
Gasoduto Al-Andaluz, S.A. Spain G&P 33% Equity
Gasoduto Extremadura, S.A. Spain G&P 49% Equity
GDP Distribuição, SGPS, S.A. Portugal G&P 100% Full
Lisboagas, S.A. Portugal G&P 100% Full
Lusitaniagás, S.A. Portugal G&P 85% Full
Setgás, S.A. Portugal G&P 45% Equity
Beiragás, S.A. Portugal G&P 59% Full
Duriensegás, S.A. Portugal G&P 100% Full
Tagusgás, S.A. Portugal G&P 41% Equity
Galp Power, SGPS, S.A. Portugal G&P 100% Full
Galp Energia, S.A. Portugal Others 100% Full
2. RESULTS FROM ASSOCIATES
Million EurosFourth quarter Twelve months
2008 2009 Chg. % Chg. 2008 2009 Chg. % Chg.
2.0 1.8 (0.1) (10.7%) CLH 8.1 8.8 0.7 8.8%
- 2.2 2.2 n.m. CLC - 9.6 9.6 n.m.
11.8 13.1 1.3 11.0% International Pipelines 39.7 45.6 5.9 14.9%
0.4 1.0 0.5 124.7% Setgás - Natural Gas Distribution Company 2.1 3.6 1.6 75.6%
0.6 (1.5) (2.0) n.m. Others 2.1 5.2 3.1 150.6%
14.8 16.6 1.8 12.1% Sub total 52.0 72.9 20.9 40.2%
0.450 (3.5) (4.0) n.m. Consolidation adjustments (3.5) (3.2) 0.3 (7.5%)
15.3 13.1 (2.2) (14.3%) Total 48.5 69.6 21.2 43.7%
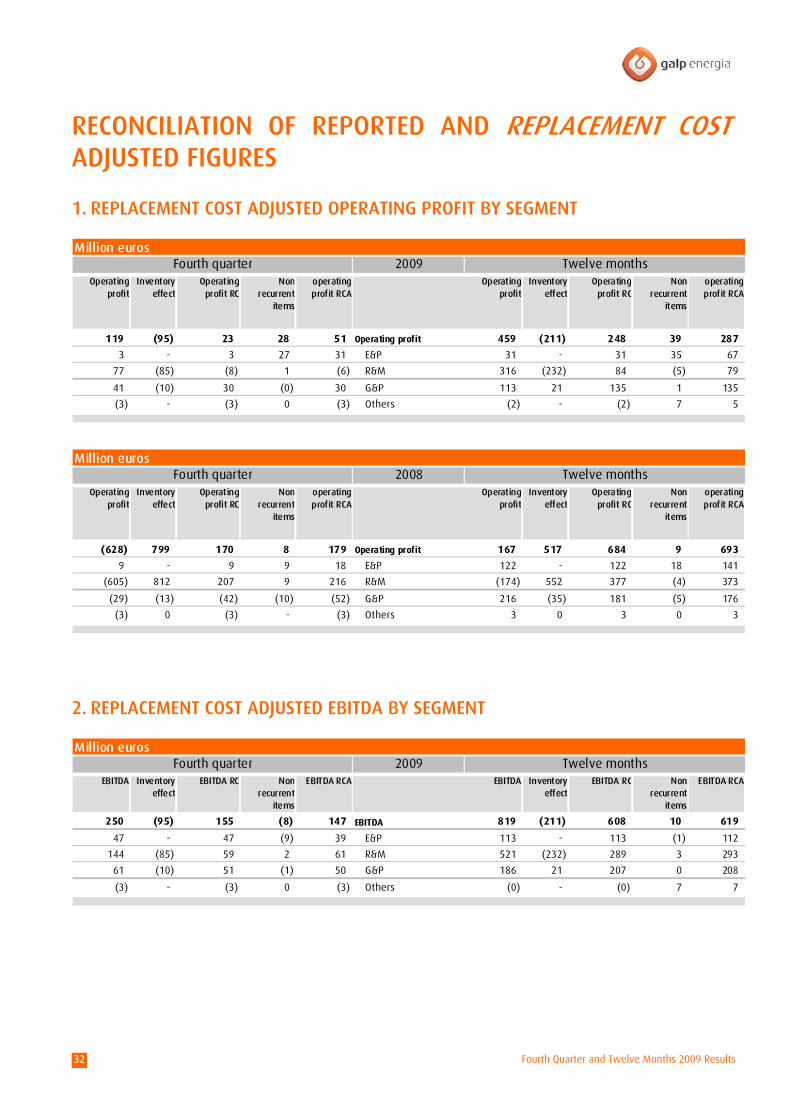
Fourth Quarter and Twelve Months 2009 Results 32
RECONCILIATION OF REPORTED AND REPLACEMENT COST ADJUSTED FIGURES
1. REPLACEMENT COST ADJUSTED OPERATING PROFIT BY SEGMENT
Million eurosFourth quarter 2009 Twelve months
Operating profit
Inventory effect
Operating profit RC
Non recurrent
items
operating profit RCA
Operating profit
Inventory effect
Operating profit RC
Non recurrent
items
operating profit RCA
119 (95) 23 28 51 Operating profit 459 (211) 248 39 287
3 - 3 27 31 E&P 31 - 31 35 67
77 (85) (8) 1 (6) R&M 316 (232) 84 (5) 79
41 (10) 30 (0) 30 G&P 113 21 135 1 135
(3) - (3) 0 (3) Others (2) - (2) 7 5
2. REPLACEMENT COST ADJUSTED EBITDA BY SEGMENT
Million eurosFourth quarter 2009 Twelve months
EBITDA Inventory effect
EBITDA RC Non recurrent
items
EBITDA RCA EBITDA Inventory effect
EBITDA RC Non recurrent
items
EBITDA RCA
250 (95) 155 (8) 147 EBITDA 819 (211) 608 10 619
47 - 47 (9) 39 E&P 113 - 113 (1) 112
144 (85) 59 2 61 R&M 521 (232) 289 3 293
61 (10) 51 (1) 50 G&P 186 21 207 0 208
(3) - (3) 0 (3) Others (0) - (0) 7 7
Million eurosFourth quarter 2008 Twelve months
Operating profit
Inventory effect
Operating profit RC
Non recurrent
items
operating profit RCA
Operating profit
Inventory effect
Operating profit RC
Non recurrent
items
operating profit RCA
(628) 799 170 8 179 Operating profit 167 517 684 9 693
9 - 9 9 18 E&P 122 - 122 18 141
(605) 812 207 9 216 R&M (174) 552 377 (4) 373
(29) (13) (42) (10) (52) G&P 216 (35) 181 (5) 176
(3) 0 (3) - (3) Others 3 0 3 0 3

Fourth Quarter and Twelve Months 2009 Results 33
3. NON RECURRENT ITEMS
Exploration & Production
Million EurosFourth quarter Twelve months
2008 2009 2008 2009
Exclusion of non recurrent items
- (0.0) Gains / losses on disposal of assets - (0.1)
(0.5) (8.8) Assets write offs 9.1 (0.6)
9.5 36.0 Assets impairments 9.5 36.0
0.0 - Provisions for environmental charges and others 0.0 -
(0.2) - Others (0.1) -
8.8 27.1 Non recurrent items of operating profit 18.4 35.3
- - Other financial results - -
8.8 27.1 Non recurrent items before income taxes 18.4 35.3
(2.8) (9.2) Income taxes on non recurrent items (6.0) (12.0)
6.0 17.9 Total non recurrent items 12.4 23.3
Million eurosFourth quarter 2008 Twelve months
EBITDA Inventory effect
EBITDA RC Non recurrent
items
EBITDA RCA EBITDA Inventory effect
EBITDA RC Non recurrent
items
EBITDA RCA
(557) 799 242 2 244 EBITDA 449 517 966 9 975
33 - 33 (0) 33 E&P 199 - 199 9 208
(546) 812 266 3 269 R&M (12) 552 539 1 540
(42) (13) (56) (0) (56) G&P 258 (35) 223 (1) 223
(2) 0 (2) 0 (2) Others 4 0 4 0 4

Fourth Quarter and Twelve Months 2009 Results 34
Refining & Marketing
Million EurosFourth quarter Twelve months
2008 2009 2008 2009
Exclusion of non recurrent items
- (47.9) Sale of strategic stock (24.1) (47.9)
- 47.9 Sale of strategic stock cost 20.4 47.9
2.2 - Monobuoy costs 2.2 -
- (9.2) Accidents caused by natural facts - (16.0)
(1.0) (1.9) Gains / losses on disposal of assets (1.5) (4.6)
0.3 1.5 Assets write offs 0.7 1.5
1.1 6.2 Employees contracts rescission 2.4 15.0
- 10.3 Sines refinery fire - accidents - 16.1
5.4 (0.1) Provisions for environmental charges and others 5.4 (8.7)
0.7 (0.7) Assets impairments (10.4) 0.7
- (4.9) Margin in the sale of CO2 emission licenses - (8.5)
0.4 - Others 0.4 -
9.3 1.2 Non recurrent items of operating profit (4.4) (4.5)
- 0.4 Capital gains / losses on disposal of financial investments - 0.8
9.3 1.7 Non recurrent items before income taxes (4.4) (3.7)
(2.2) (0.9) Income taxes on non recurrent items 1.6 0.1
7.1 0.7 Total non recurrent items (2.8) (3.6)
Gas & Power
Million EurosFourth quarter Twelve months
2008 2009 2008 2009
Exclusion of non recurrent items
- - Services rendered - -
(0.5) (0.0) Gains / losses on disposal of assets (1.0) (0.1)
0.0 0.0 Assets Write offs 0.3 0.1
- - Collections related to the sale of land - -
- - Accidents caused by natural facts - (0.0)
0.1 0.3 Employees contracts rescission - 2.2
(9.2) 0.3 Provisions for environmental charges and others (4.2) 0.3
- (1.1) Margin in the sale of CO2 emission licenses - (1.7)
(9.7) (0.5) Non recurrent items of operating profit (5.0) 0.8
- - Capital gains / losses on disposal of financial investments - -
- - Other financial results - -
(9.7) (0.5) Non recurrent items before income taxes (5.0) 0.8
1.5 0.1 Income taxes on non recurrent items 1.1 (0.2)
(8.1) (0.3) Total non recurrent items (3.9) 0.5
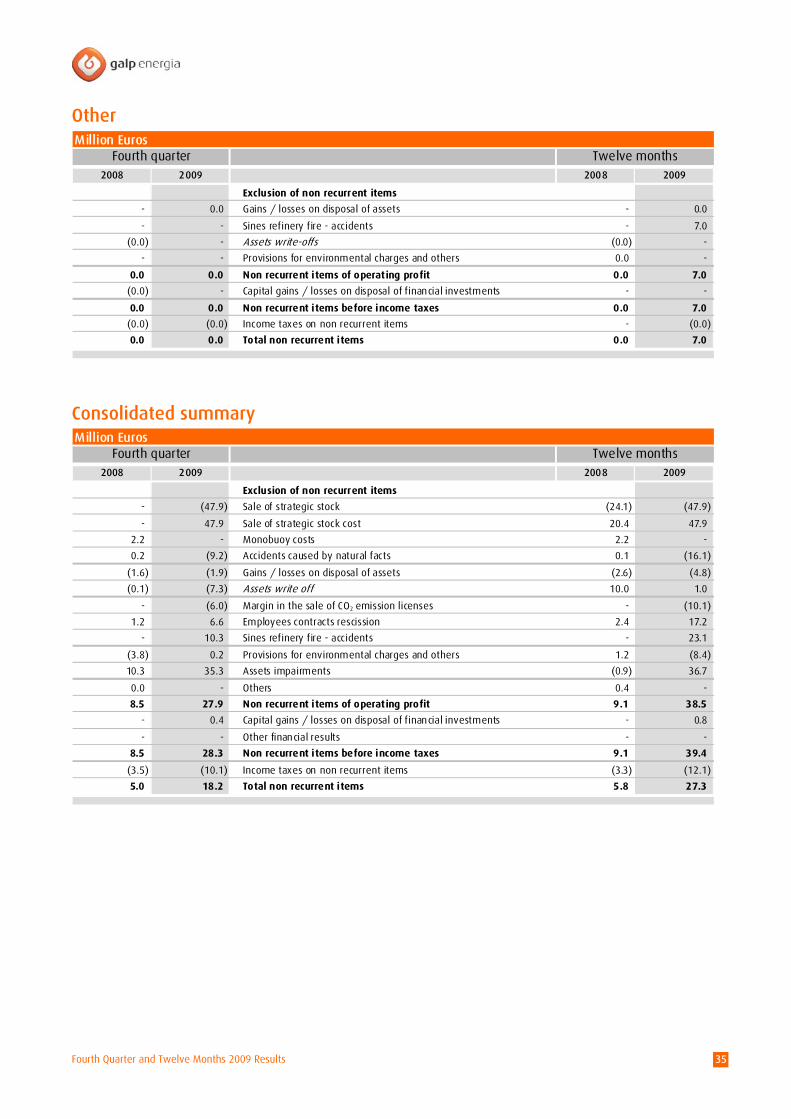
Fourth Quarter and Twelve Months 2009 Results 35
Other
Million EurosFourth quarter Twelve months
2008 2009 2008 2009
Exclusion of non recurrent items
- 0.0 Gains / losses on disposal of assets - 0.0
- - Sines refinery fire - accidents - 7.0
(0.0) - Assets write-offs (0.0) -
- - Provisions for environmental charges and others 0.0 -
0.0 0.0 Non recurrent items of operating profit 0.0 7.0
(0.0) - Capital gains / losses on disposal of financial investments - -
0.0 0.0 Non recurrent items before income taxes 0.0 7.0
(0.0) (0.0) Income taxes on non recurrent items - (0.0)
0.0 0.0 Total non recurrent items 0.0 7.0
Consolidated summary
Million EurosFourth quarter Twelve months
2008 2009 2008 2009
Exclusion of non recurrent items
- (47.9) Sale of strategic stock (24.1) (47.9)
- 47.9 Sale of strategic stock cost 20.4 47.9
2.2 - Monobuoy costs 2.2 -
0.2 (9.2) Accidents caused by natural facts 0.1 (16.1)
(1.6) (1.9) Gains / losses on disposal of assets (2.6) (4.8)
(0.1) (7.3) Assets write off 10.0 1.0
- (6.0) Margin in the sale of CO2 emission licenses - (10.1)
1.2 6.6 Employees contracts rescission 2.4 17.2
- 10.3 Sines refinery fire - accidents - 23.1
(3.8) 0.2 Provisions for environmental charges and others 1.2 (8.4)
10.3 35.3 Assets impairments (0.9) 36.7
0.0 - Others 0.4 -
8.5 27.9 Non recurrent items of operating profit 9.1 38.5
- 0.4 Capital gains / losses on disposal of financial investments - 0.8
- - Other financial results - -
8.5 28.3 Non recurrent items before income taxes 9.1 39.4
(3.5) (10.1) Income taxes on non recurrent items (3.3) (12.1)
5.0 18.2 Total non recurrent items 5.8 27.3
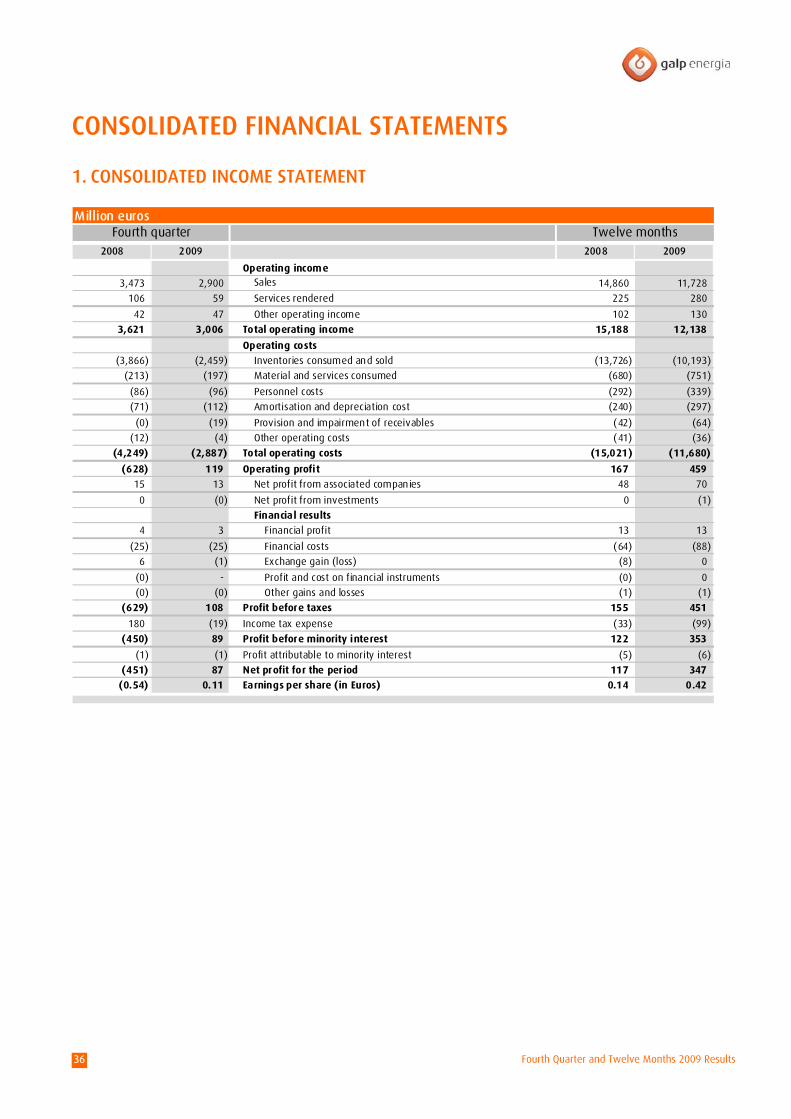
Fourth Quarter and Twelve Months 2009 Results 36
CONSOLIDATED FINANCIAL STATEMENTS
1. CONSOLIDATED INCOME STATEMENT
Million eurosFourth quarter Twelve months
2008 2009 2008 2009
Operating income
3,473 2,900 Sales 14,860 11,728
106 59 Services rendered 225 280
42 47 Other operating income 102 130
3,621 3,006 Total operating income 15,188 12,138
Operating costs
(3,866) (2,459) Inventories consumed and sold (13,726) (10,193)
(213) (197) Material and services consumed (680) (751)
(86) (96) Personnel costs (292) (339)
(71) (112) Amortisation and depreciation cost (240) (297)
(0) (19) Provision and impairment of receivables (42) (64)
(12) (4) Other operating costs (41) (36)
(4,249) (2,887) Total operating costs (15,021) (11,680)
(628) 119 Operating profit 167 459
15 13 Net profit from associated companies 48 70
0 (0) Net profit from investments 0 (1)
Financial results
4 3 Financial profit 13 13
(25) (25) Financial costs (64) (88)
6 (1) Exchange gain (loss) (8) 0
(0) - Profit and cost on financial instruments (0) 0
(0) (0) Other gains and losses (1) (1)
(629) 108 Profit before taxes 155 451
180 (19) Income tax expense (33) (99)
(450) 89 Profit before minority interest 122 353
(1) (1) Profit attributable to minority interest (5) (6)
(451) 87 Net profit for the period 117 347
(0.54) 0.11 Earnings per share (in Euros) 0.14 0.42
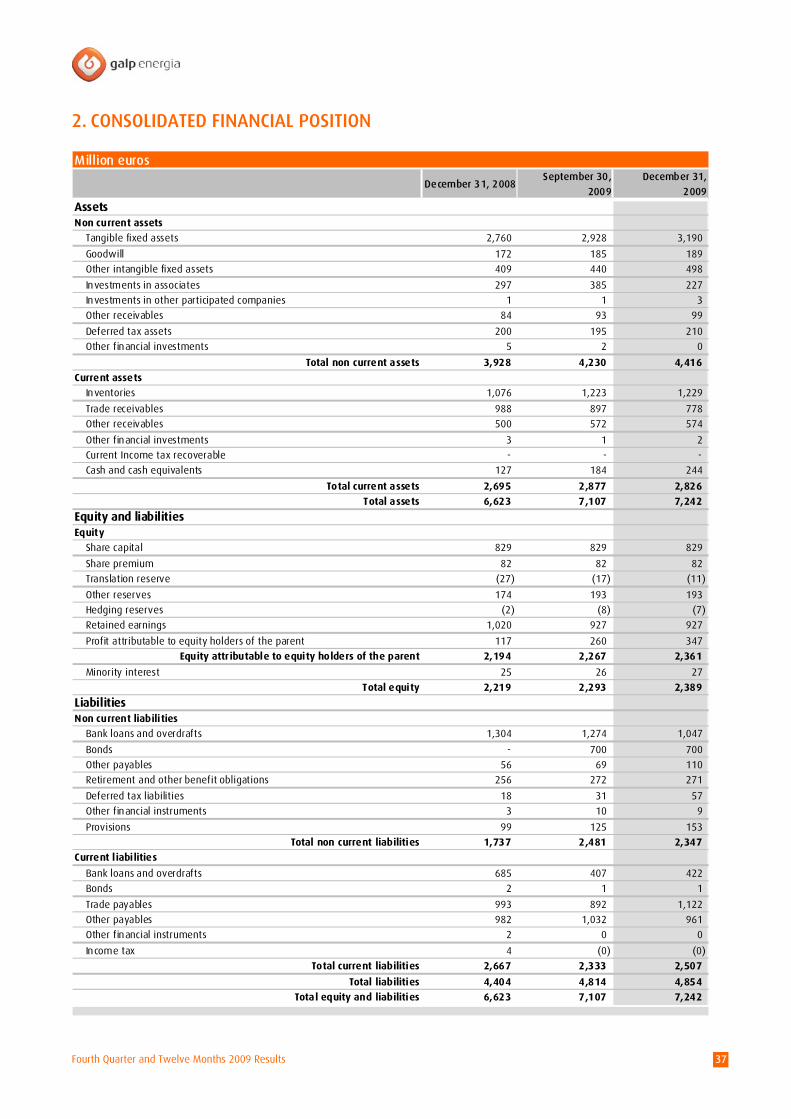
Fourth Quarter and Twelve Months 2009 Results 37
2. CONSOLIDATED FINANCIAL POSITION
Million euros
December 31, 2008September 30,
2009
December 31,
2009
AssetsNon current assets
Tangible fixed assets 2,760 2,928 3,190
Goodwill 172 185 189
Other intangible fixed assets 409 440 498
Investments in associates 297 385 227
Investments in other participated companies 1 1 3
Other receivables 84 93 99
Deferred tax assets 200 195 210
Other financial investments 5 2 0
Total non current assets 3,928 4,230 4,416
Current assets
Inventories 1,076 1,223 1,229
Trade receivables 988 897 778
Other receivables 500 572 574
Other financial investments 3 1 2
Current Income tax recoverable - - -
Cash and cash equivalents 127 184 244
Total current assets 2,695 2,877 2,826
Total assets 6,623 7,107 7,242
Equity and liabilitiesEquity
Share capital 829 829 829
Share premium 82 82 82
Translation reserve (27) (17) (11)
Other reserves 174 193 193
Hedging reserves (2) (8) (7)
Retained earnings 1,020 927 927
Profit attributable to equity holders of the parent 117 260 347
Equity attributable to equity holders of the parent 2,194 2,267 2,361
Minority interest 25 26 27
Total equity 2,219 2,293 2,389
LiabilitiesNon current liabilities
Bank loans and overdrafts 1,304 1,274 1,047
Bonds - 700 700
Other payables 56 69 110
Retirement and other benefit obligations 256 272 271
Deferred tax liabilities 18 31 57
Other financial instruments 3 10 9
Provisions 99 125 153
Total non current liabilities 1,737 2,481 2,347
Current liabilities
Bank loans and overdrafts 685 407 422
Bonds 2 1 1
Trade payables 993 892 1,122
Other payables 982 1,032 961
Other financial instruments 2 0 0
Income tax 4 (0) (0)
Total current liabilities 2,667 2,333 2,507
Total liabilities 4,404 4,814 4,854
Total equity and liabilities 6,623 7,107 7,242

Fourth Quarter and Twelve Months 2009 Results 38
ADDITIONAL INFORMATION
GLOSSARY
EBITDA EBITDA is defined as net operating income plus depreciation, amortisation and
provisions. EBITDA is not a standard measure, the reason it should not be used
in comparisons between companies. EBITDA is not a direct liquidity measure and
should be analyzed jointly with the actual cash flows resulting from operating
activities and taking into account existing financial commitments
Galp Energia, company or
group
Galp Energia, SGPS, S.A. and associates
IRP Tax on revenue generated by the sale of oil in Angola
Rotterdam cracking refining
margin
Rotterdam Cracking refining margin: -100% Dated Brent, +2.3% LGP FOB
Seagoing (50% Butane + 50% Propane), +25.4% PM UL NWE FOB Bg., +7.4%
Naphtha NWE FOB Bg., +8.5% Jet NWE CIF, +33.3% ULSD 50 ppm NWE CIF Cg.
and +15.3% LSFO 1% FOB Cg.; C&L: 7.7%; Terminal rate: 1 $/ton; Ocean loss:
0.15% over Dated Brent; Freight 2009: WS Aframax (80 kts) Route Sullom Voe /
Rotterdam - Flat 6.04 $/ton. Yields in % of weight.
Rotterdam hydroskimming +
aromatics + base oils refining
margin
Rotterdam hydroskimming refining margin: -100% Dated Brent, +2.1% LGP FOB
Seagoing (50% Butane + 50% Propane), +15.1% PM UL NWE FOB Bg., +4.0%
Naphtha NWE FOB Bg., +9% Jet NWE CIF Cg., +32.0% ULSD 10 ppm NWE CIF Cg.
and +33.8% LSFO 1% FOB NWE Cg.; C&L: 4.0%; Terminal rate: 1 $/ton; Ocean
loss: 0.15% over Dated Brent; Freight 2009: WS Aframax (80 kts) Route Sullom
Voe / Rotterdam - Flat 6.04 $/ton.
Rotterdam aromatics refining margin: -60% PM UL NWE FOB Bg., -40% Naphtha
NWE FOB Bg., +37% Naphtha NWE FOB Bg., +16.5% PM UL NWE FOB Bg., +6.5%
Benzene Rotterdam FOB Bg., +18.5% Toluene Rotterdam FOB Bg., +16.6%
Paraxylene Rotterdam FOB Bg., +4.9% Ortoxylene Rotterdam FOB Bg..
Consumptions: -18% LSFO 1% CIF NEW. Yields in % of weight.
Base Oils refining margin: -100% Arabian Light, +3.5% LGP FOB Seagoing (50%
Butane + 50% Propane), +13.0% Naphtha NWE FOB Bg., +4.4% Jet NWE CIF,
34.0% ULSD 10 ppm NWE CIF, +4.5% VGO 1.6% NWE FOB Cg., +14% Base Oils
FOB, +26% HSFO 3.5% NWE Bg.; Consumptions: -6.8% LSFO 1% NWE FOB Cg.;
Losses: 0.6%; Terminal rate: 1 $/ton; Ocean loss: 0.15% over Dated Brent;
Freight 2009: WS Aframax (80 kts) Route Sullom Voe / Rotterdam - Flat 6.04
$/ton. Yields in % of weight.
Rotterdam hydroskimming + Aromatics + Base oils refining margin = 65%
Fourth Quarter and Twelve Months 2009 Results 39
Rotterdam hydroskimming refining margin + 15% Rotterdam aromatics refining
margin + 20% Base Oils refining margin.
Replacement cost (“RC”) According to this method of valuing inventories, the cost of goods sold is valued
at the cost of replacement, i.e. at the average cost of raw materials on the
month when sales materialise irrespective of inventories at the start or end of
the period. The Replacement Cost Method is not accepted by accounting
standards – either Portuguese GAAP or IFRS – and is consequently not adopted
for valuing inventories. This method does not reflect the cost of replacing other
assets.
ACRONYMS Bbl: barrels; BBLT: Benguela, Belize, Lobito and Tomboco; bbl/d: barrels a day; Bg: Barges; Cg: Cargoes; CIF: Cost, Insurance and Freight; CLC: Companhia Logística de Combustíveis; CLH: Companhia Logística de Hidrocarburos, S.A.;CPT:
Compliant Piled Tower; DGEG: Direcção Geral de Energia e Geologia; E&P: Exploration & Production; €: Euro; EWT:
Extended Well Test; FCC: Fluid Catalytic Cracking; FIFO: First In First Out (inventory valuation method); FOB: Free on Board; G&P: Gas & Power; IAS: International Accounting Standards; IFRS: International Financial Reporting Standards;
LIFO: Last In First Out (inventory valuation method); LNG: Liquefied Natural Gas; LSFO: Low sulphur fuel oil; m3: cubic
metres; n.m.: not meaningful; PM UL: Premium unleaded; PSA: Production Sharing Agreement; qoq: quarter on
quarter; R&M: Refining & Marketing; RCA: Replacement Cost Adjusted; SXEP: DJ Europe Oil&Gas Index;
TL: Tômbua-Lândana; ULSD CIF Cg: Ultra Low sulphur diesel CIF Cargoes; USA: United States of America; Usd: US dollar;
OPEC - Organization of the Petroleum Exporting Countries; WAC: Weighted Average Cost (inventory valuation method);
yoy: year on year.
Investor Relations and Corporate Communication Tel: +351 21 724 08 66 Fax: +351 21 724 29 65
E-mail: [email protected] Website: www.galpenergia.com
Galp Energia, SGPS, S.A. Public Company
Head Office: Rua Tomás da Fonseca Torre C, 1600-209 Lisbon Share Capital: 829,250,635 Euros
Registered at the commercial registry Office of Lisbon Company tax number 504 499 777