results from marie - wrmiss.orgwrmiss.org/workshops/eighth/zeitlin.pdfodyssey mission launched april...
TRANSCRIPT
Results from MARIE
C. Zeitlin – LBNL & NSBRIT. Cleghorn, F. Cucinotta, P. Saganti – NASA JSCV. Andersen, K. Lee, L. Pinsky – University of HoustonW. Atwell – Boeing Company, R. Turner – ANSER

Odyssey Mission
Launched April ‘01, reached Mars Oct. ‘01.Two-hour circular, polar mapping orbit established by Feb. 2002 – 5 p.m. day/5 a.m. night
THEMIS and GRS turned on.MARIE turned on March 2002, recovered after anomaly in cruise.

Mars Radiation Map – GCRCalculated skin dose on surface, using HZETRN model. Unshielded doses ~ 1000 times greater on Mars than Earth’s surface.
.30 .28 .26 .24 .22 .20
Annual dose-equivalent (Sv/yr)

MARIE Silicon Detector Stack1-mm Si detectors A1 & A2define trigger, 30° FOV cone, proton E > 30 MeV to reach A2.
No forward/backward distinction w/o Cerenkov.On trigger, read all detectors.
5-mm thick Si detectors B1-B4provide high-resolution dE/dx measurements.At these energies, dE/dx in silicon ∝ tissue dose.Counts in A1, A2, B1, B2 recorded, stored per minute.
MARIE’s Dirty LaundryInstrument has many problems
PSD’s noisy, unreliableTrigger threshold not well understood.Cerenkov not quite dead but close (might be fixable)Preamplifier gains too high, saturation at ~ 60 MeV deposited inA’s & at ~ 320 MeV for B’s.Can only handle about 3 events/second.
Require ∆t between events > 0.4 sec in analysis.Substantial deadtime corrections especially for SPEs.
Only possible gain adjustment: very limited changes to bias voltages (lose-lose on signal:noise).
Some improvements possible w/new software
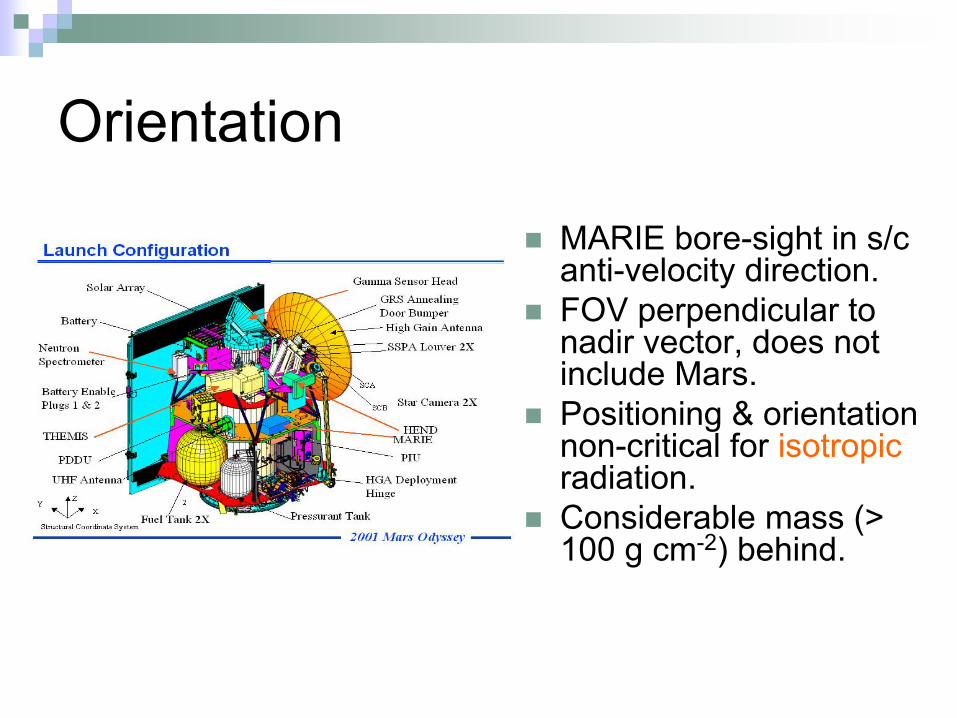
Orientation
MARIE bore-sight in s/c anti-velocity direction.FOV perpendicular to nadir vector, does not include Mars. Positioning & orientation non-critical for isotropicradiation.Considerable mass (> 100 g cm-2) behind.

Detection of GCR HZESee 1:2:1:2 ratio of B:C:N:O at “high” E (~1 GeV/amu)Upper limit for GCR ~ charge 11-12 for high E.
Higher Z or lower energy → saturation.Stopping particles saturate if Z > 3.Result: dose & dose equivalent systematically underestimated.HZETRN predicts ~ 15% of dose due to Z > 12

Comparison with ACE/CRIS
ACE/CRIS in near-Earth orbit. ACE reports flux of protons with E > 30 MeV, good match.Recent quiet-time flux ~ 0.57 cm-2 sr-1 s-1
MARIE “ “ “ ~ 0.35 cm-2 sr-1 s-1
Need to characterize MARIE geometry, trigger threshold, etc., better
Can’t yet directly compare heavy-ion fluxes due to different E sensitivity.
MARIE identifies high-E ions, ACE/CRIS low-E
Flux & Geometry Factor Issues
Probable explanation for low flux result from MARIE: A1 & A2 have large “edge” regions of inefficient charge collection.
Test of A efficiency: select heavy ions in B1+B2, look at A. Result – 40% of these events have small ∆E in A1 (poor correlation w/B signals).Similar for A2, 30% bad.
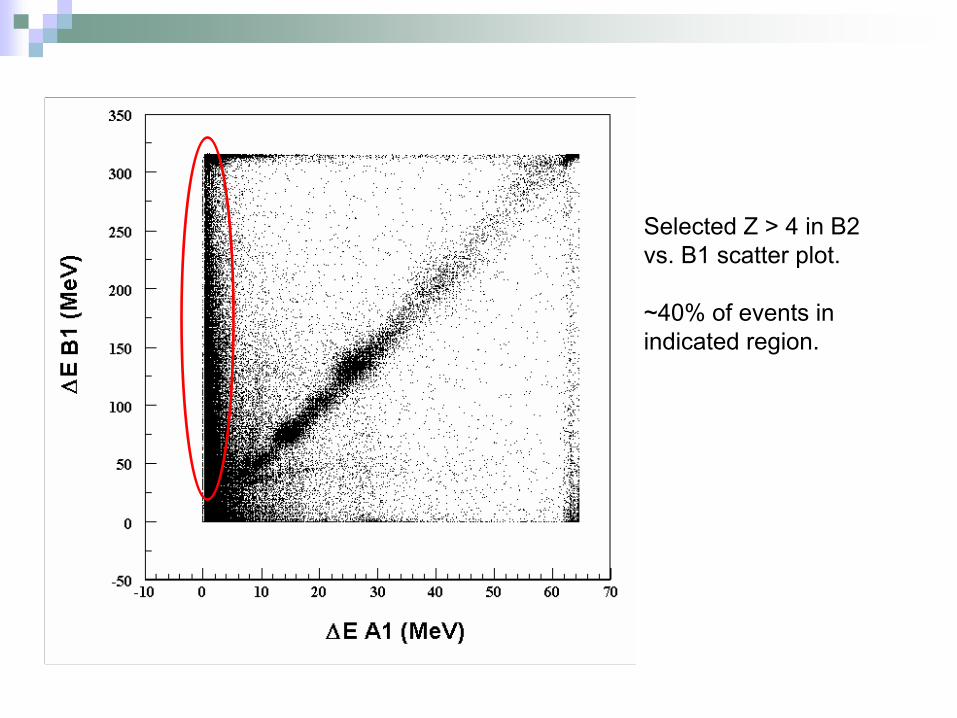
Selected Z > 4 in B2 vs. B1 scatter plot.
~40% of events in indicated region.

Flux & Geometry Factor, more
Possibly, significant numbers of protons are missed due to trigger threshold.
Recent study suggests we see protons up to 1 GeV or higher energy.Threshold was set by trial-and-error to get acceptable data rate.No ground data to tell us correlation between digital control value & true energy.

Q And Saturation Problem
0
5
10
15
20
25
30
35
1 10 100 1000 10000
LET [keV/micron]
Q(L
)
Amplifier saturation
Everything above charge 12 (LET > 30 keV/µm) registers as charge 12 (LET = 30 keV/µm).
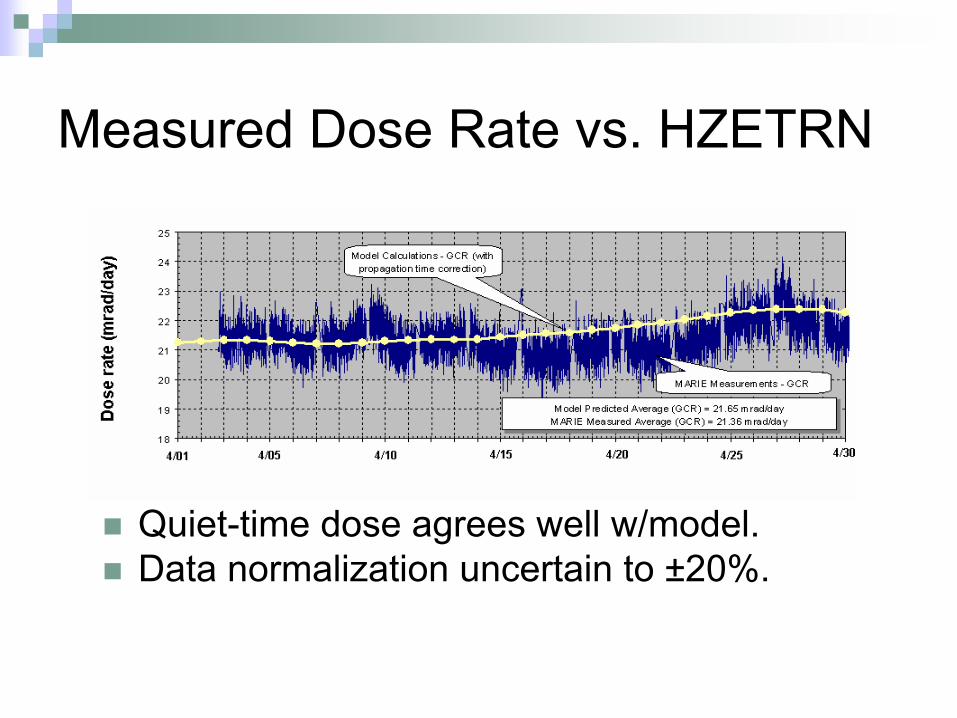
Measured Dose Rate vs. HZETRN
Quiet-time dose agrees well w/model.Data normalization uncertain to ±20%.
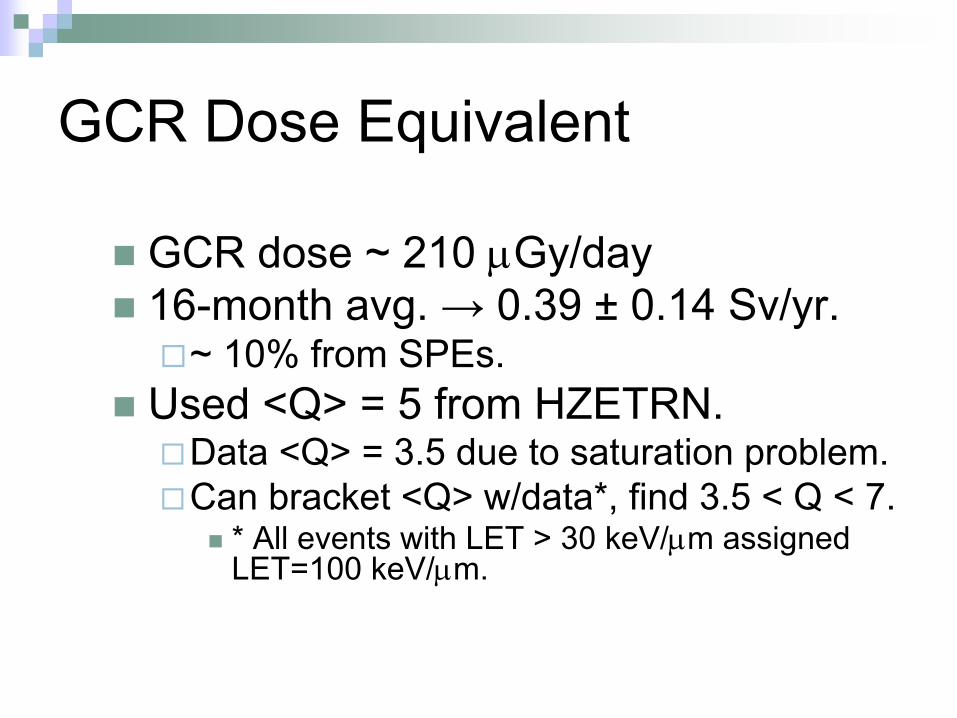
GCR Dose Equivalent
GCR dose ~ 210 µGy/day 16-month avg. → 0.39 ± 0.14 Sv/yr.
~ 10% from SPEs.Used <Q> = 5 from HZETRN.
Data <Q> = 3.5 due to saturation problem.Can bracket <Q> w/data*, find 3.5 < Q < 7.
* All events with LET > 30 keV/µm assigned LET=100 keV/µm.
Several SPE’s since March 2002.Earth-Sun-Mars angle has varied, was 100° to 180° for 2002.
Observation of “back-sided” SPEs.Later in ’03, Earth & Mars magnetically connected to same region on sun.Compare timing, intensity to GOES.
First Detailed SPE Data From Mars

Earth-Mars ComparisonsMARIE has seen:
Events when nothing was seen at Earth.Events well-correlated w/near-Earth observations.Times of no enhancement when an event was observed near Earth.
1
10
100
1000
10000
182 186 190 194 198 202 206 210
Julian Day (UT)
Dos
e ra
te m
rad/
day
MARIE Event data
MARIE A2 counter data
GOES-8 protons E > 30 MeV(arbitrary normaliztion)
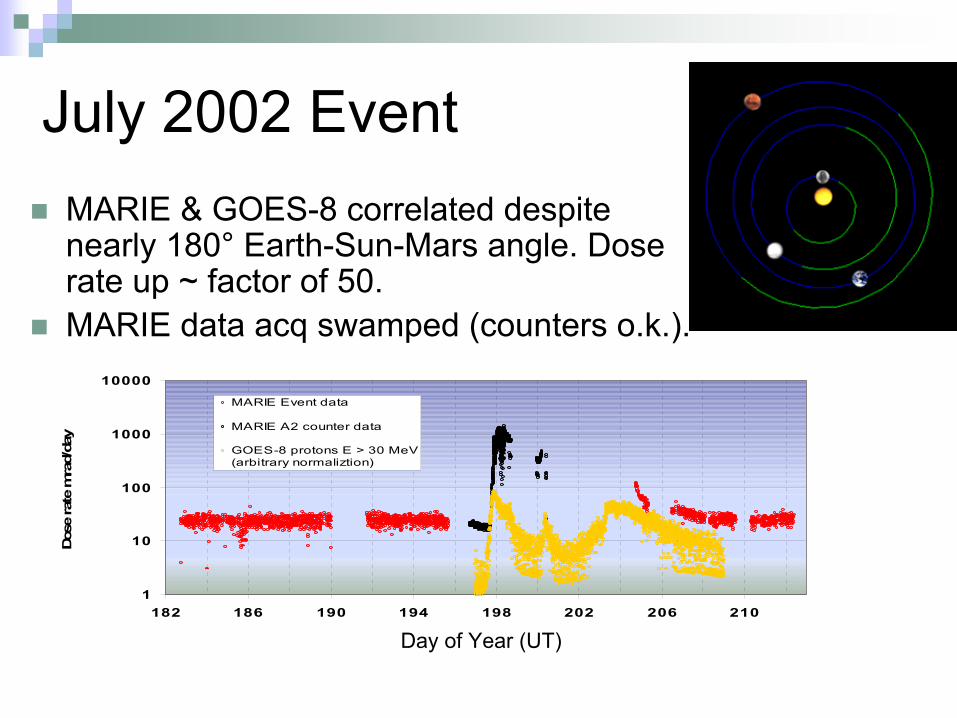
July 2002 EventMARIE & GOES-8 correlated despite nearly 180° Earth-Sun-Mars angle. Dose rate up ~ factor of 50.MARIE data acq swamped (counters o.k.).
Day of Year (UT)
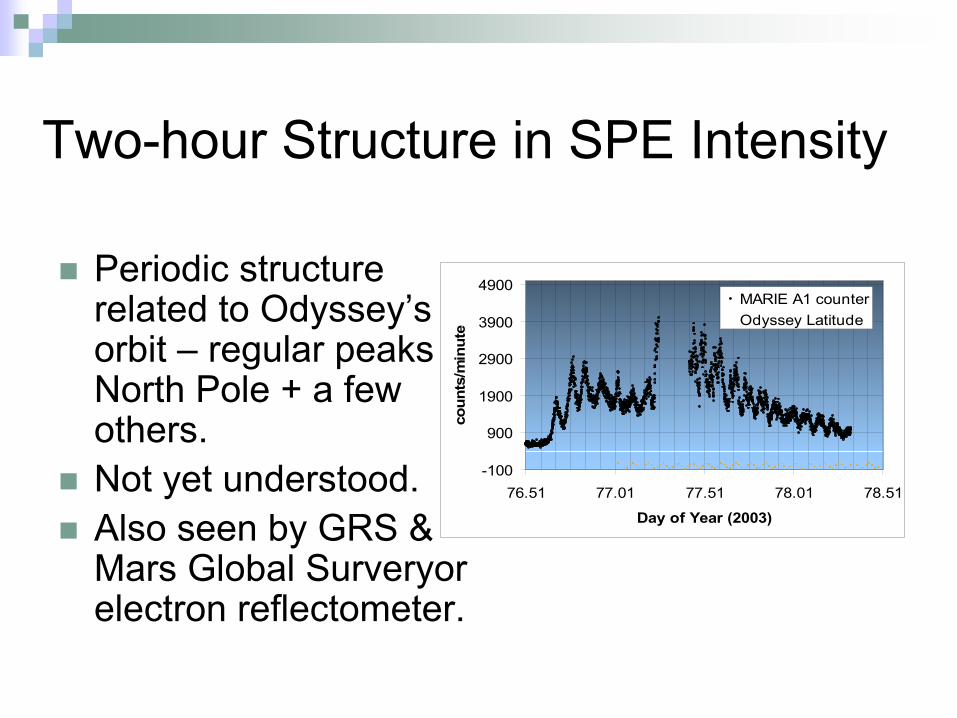
Two-hour Structure in SPE Intensity
Periodic structure related to Odyssey’s orbit – regular peaks at North Pole + a few others.Not yet understood.Also seen by GRS & Mars Global Surveryorelectron reflectometer.
-100
900
1900
2900
3900
4900
76.51 77.01 77.51 78.01 78.51
Day of Year (2003)
coun
ts/m
inut
e
MARIE A1 counterOdyssey Latitude

MARIE & GRS ULD
0
1000
2000
3000
4000
5000
6000
77.5 78.0 78.5 79.0Day of Year
Cou
nt ra
te (a
rbitr
ary
units
)
0
ULD = GRS gamma crystal upper level discriminator.Threshold energy unknown.
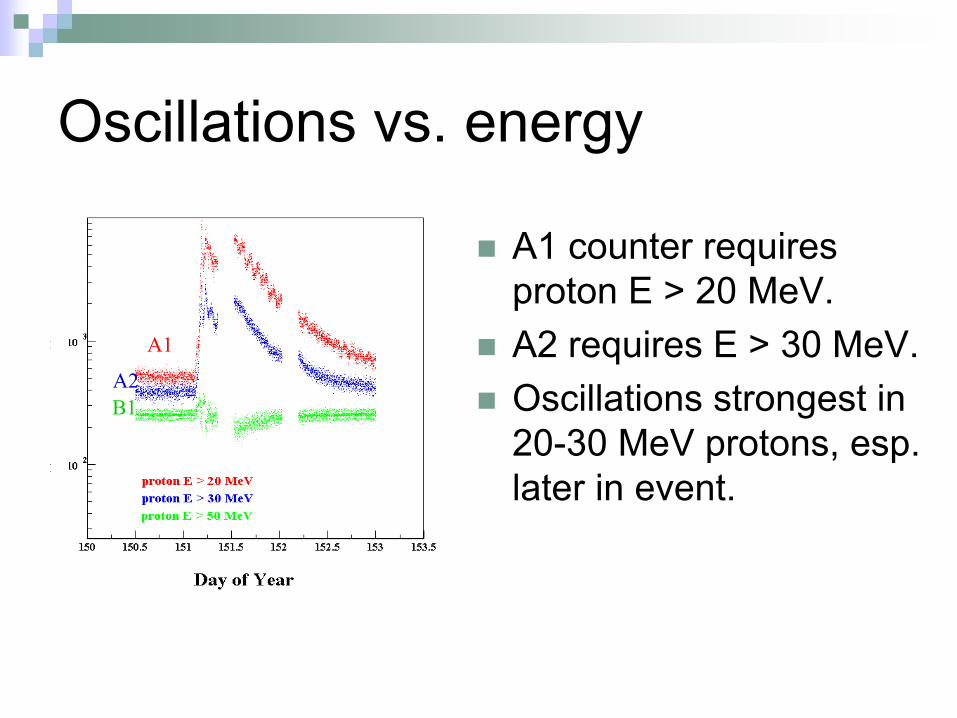
Oscillations vs. energy
A1 counter requires proton E > 20 MeV.A2 requires E > 30 MeV.Oscillations strongest in 20-30 MeV protons, esp. later in event.
A1
A2B1

Relation to Magnetism?
Martian magnetism is complicated.Field lines from surface extend to high altitudes, strength comparable to IMF.
Mars Global Surveyor magnetometer – superb data set thanks to extended aerobraking campaign.
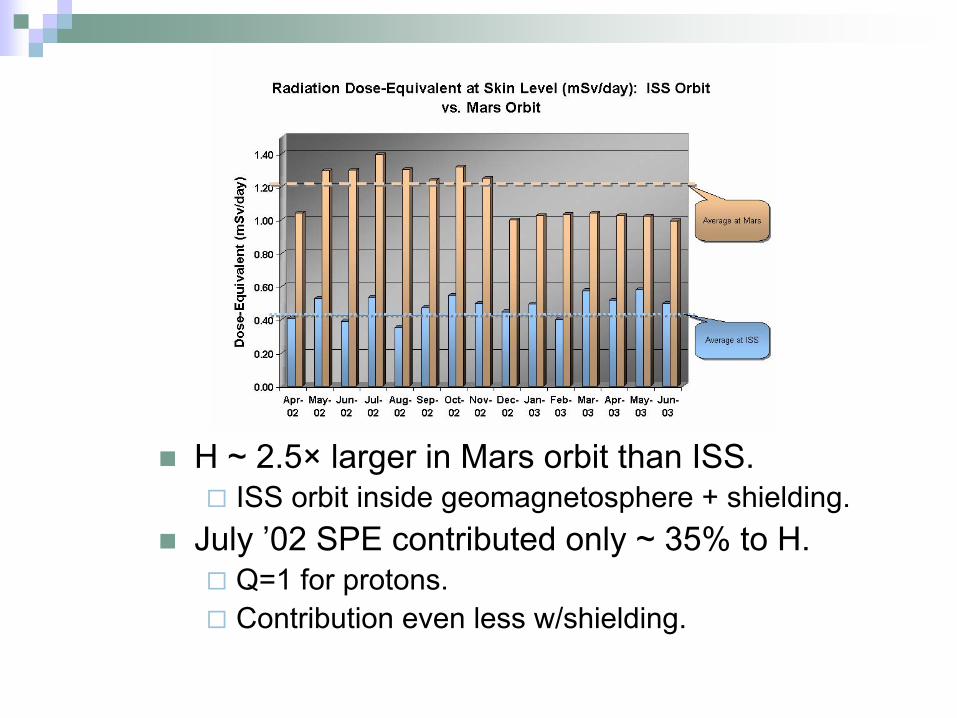
H ~ 2.5× larger in Mars orbit than ISS. ISS orbit inside geomagnetosphere + shielding.
July ’02 SPE contributed only ~ 35% to H.Q=1 for protons.Contribution even less w/shielding.

GRS Physics
Measure γ-rays & neutrons coming up.Made by nuclear interactions of incident protons.Combined γ + neutron data reveals elemental composition of top meter of soil.

GRS discovery of polar water ice
H signal in γ-ray spectrum correlates w/lack of neutrons.Don’t see H at north pole due to CO2 cap.Seasonal, reverses in Northern Summer.

Neutron dose
Neutrons on surface from below & above.GCR + soil → nuclear interactions produce a neutron flux (upward-going).GCR + atmosphere → nuclear int’s produce neutrons (downward-going).
GRS data w/model (MCNP) can be used to estimate dose of upward neutrons.NASA-LaRC model predicts ~ 0.02 Sv/yr.Detector on lander should have neutron sensitivity – possibilities for ’07, ’09.
Mars Mission Risk AssessmentScenario: 1 yr. transit, 2 yrs. on Mars. Mitigating factors on surface:
Charged particles from above only (4π in transit).Atmosphere provides some shielding, esp. from SPE.
Worst exposure is in transit.Total ~ 1 to 1.5 Sv, dominated by GCR.
MARIE is working well, returning first detailed radiation data from Mars.
Improvements planned (event rate, C det., etc.).Good agreement between HZETRN and dose rate during quiet time.
Data normalization still uncertain to ± 20%. Nominal mission ends 8/04, extension likely.
Spacecraft in great shape, lots of fuel.Solar activity declining, minimum in ’06-07, GCR increase expected.Mission could go into ’08.
Summary