results from a scottish large group process · results from a scottish large group process . rhys...
TRANSCRIPT

Public perceptions of low carbon
energy technologies
Results from a Scottish Large Group Process
Rhys Howell
Simon Shackley
Leslie Mabon

Disclaimer
The views expressed in this report are not necessarily the views of the Global CCS Institute (the Institute), and the Institute does not accept responsibility for any information or advice contained therein.
Acknowledgements
Scottish Carbon Capture and Storage acknowledges the financial and other support provided by the Global CCS Institute and CSIRO. The authors would like to thank all the people who helped make this research possible; The facilitators, Osbert Lancaster, Philip Eldridge, Emily Creamer, Ben Evar, Joe Farthing, Alice O’Rourke, Matt Lawson, Jen Roberts, Rudra Kapila, Nils Markusson and Pete Kingsley; the experts Andy Kerr, Maxine Akhurst and Vivian Scott; Brendan Martin, Ian McNab and Angela Fallon in the School of Geosciences.

Table of Contents
Executive Summary ............................................................................................................... 1
1. Introduction ........................................................................................................................ 4
2. Research context ............................................................................................................... 5
3. Methodology ....................................................................................................................... 6 3.1 Recruitment ................................................................................................................. 6 3.2 Process ........................................................................................................................ 6 3.3 Information materials ..................................................................................................10 3.4 Data collection and analysis ........................................................................................10
3.4.1 Quantitative data ..................................................................................................10 3.4.2 Qualitative data ....................................................................................................11
4. Participant characteristics ................................................................................................. 12 4.1 Age and Gender .........................................................................................................12 4.2 Education ....................................................................................................................12 4.3 Employment ................................................................................................................13 4.4 Household structure ....................................................................................................14 4.5 Income ........................................................................................................................15
5. Environmental profile ........................................................................................................ 16 5.1 Position .......................................................................................................................16 5.2 Beliefs .........................................................................................................................16 5.3 Behaviours ..................................................................................................................16
6. Knowledge and attitudes .................................................................................................. 18 6.1 Knowledge about climate change and related issues ..................................................18 6.2 Knowledge of energy sources and related technologies ..............................................19 6.3 Attitudes toward climate change and related issues ....................................................20
6.3.1 Climate change ....................................................................................................21 6.3.2 Electricity and climate change ..............................................................................22 6.3.3 Doing more to reduce emissions ..........................................................................22 6.3.4 Increasing the price of electricity ...........................................................................22
6.4 Attitudes toward energy sources .................................................................................23 6.4.1 Solar, wind, hydro and wave/tidal .........................................................................23 6.4.2 Geothermal and biofuels ......................................................................................25 6.4.3 Natural gas ...........................................................................................................26 6.4.4 Carbon capture and storage (CCS) ......................................................................26 6.4.5 Nuclear .................................................................................................................28 6.4.6 Coal, oil and coal seam gas ..................................................................................28
6.5 Energy technology preferences ...................................................................................29
7. Energy related behaviours and intentions ......................................................................... 32 7.1 Willingness to pay more for electricity .........................................................................32 7.2 Intended behaviours as a result of the workshop ........................................................33
8. Communication ................................................................................................................ 34 8.1 Trust in information sources ........................................................................................34
9. Key issues arising from discussions ................................................................................. 35 9.1 Climate change ...........................................................................................................35 9.2 Energy technologies ...................................................................................................35 9.3 Costs and Benefits ......................................................................................................36 9.4 Responsibility ..............................................................................................................37 9.5 Consumption ...............................................................................................................37 9.6 Trust ...........................................................................................................................38 9.7 Certainty and Uncertainty ............................................................................................40

9.8 Emotion ......................................................................................................................40 9.9 Analogues ...................................................................................................................41 9.10 The process ..............................................................................................................42
10. Key messages from the process .................................................................................... 44
11. Conclusions .................................................................................................................... 45
References ........................................................................................................................... 47
Appendix A - Pre-workshop, Process, and Post- workshop questionnaires .......................... 48
Appendix B - Statistical tables .............................................................................................. 73
Appendix C - Expert Presentations ....................................................................................... 78

List of Figures
Figure 3.1: Workshop schedule ............................................................................................. 7 Figure 3.2: Dr Andrew Kerr explains the science of climate change. ..................................... 8 Figure 3.3: Breakout session discussion. .............................................................................. 9 Figure 3.4: ‘Ask the expert’ session. .....................................................................................10 Figure 5.1: Environmental behaviours ..................................................................................17 Figure 6.1: Mean changes in knowledge of climate change and related issues ....................19 Figure 6.2: Mean changes in knowledge of energy sources and related technologies ..........20 Figure 6.3: Mean changes in attitudes toward climate change and related issues ................21 Figure 6.4: Mean changes in attitudes toward energy sources and related technologies ......23 Figure 6.5: Changes in response for support for wave/tidal energy ......................................24 Figure 6.6: Changes in response for support for wind energy ...............................................24 Figure 6.7: Changes in response for support for geothermal energy ....................................25 Figure 6.8: Changes in response for support for biofuels ......................................................25 Figure 6.9: Changes in response for support for natural gas ................................................26 Figure 6.10: Changes in response for support for carbon capture and storage .....................27 Figure 6.11: Changes in response for support for nuclear energy ........................................28 Figure 6.12: Changes in response for support for coal .........................................................29 Figure 6.13: Changes in priority of the mean preferred energy technology ...........................30 Figure 7.1: Percentage of participants prepared to pay more for electricity if it reduced greenhouse gas emissions ...................................................................................................32 Figure 7.2: Intended behaviour as a result of the workshop ..................................................33 Figure 8.1: Trust in information sources ...............................................................................34
List of Tables
Table 4.1: Age and gender of workshop participants ............................................................12 Table 4.2 Education level .....................................................................................................12 Table 4.3: Employment status ..............................................................................................13 Table 4.4: Employment status ..............................................................................................13 Table 4.5: Household structure .............................................................................................14 Table 4.6: Household size ....................................................................................................14 Table 4.7: Household income ...............................................................................................15 Table 6.1 Ranking of average technology funding priority ....................................................29 Table 7.1 Willingness to pay more for electricity ...................................................................32 Table B.1: Environmental beliefs ..........................................................................................73 Table B.2: Environmental behaviours ...................................................................................74 Table B.3: Knowledge of energy and the environment .........................................................74 Table B.4: Mean changes in knowledge of climate change and related issues .....................74 Table B.5: Mean changes in knowledge of energy sources and related technologies ...........75 Table B.6: Mean changes in attitude toward climate change and related issues ..................75 Table B.7: Mean changes in attitudes to energy sources and related technologies ..............76 Table B.8: Changes in priority of the mean preferred energy technology ..............................76 Table B.9: Intended behaviour as a result of the workshop ..................................................77 Table B.10: Mean trust in information sources ......................................................................77

1
Executive Summary This report describes the outcomes of a large group process workshop held in Edinburgh, capital city
of Scotland, United Kingdom on 24 September 2011. The one day workshop was designed to
investigate Scottish citizens’ perspectives on climate change and low carbon energy technologies, with
a particular focus on carbon dioxide capture and storage (CCS). The report presents the large group
process methodology and the results, both from questionnaire answers and discussions during the
workshop. Results include participants’ environmental profile, stated beliefs, knowledge and attitudes,
support for different energy technologies and environmental behaviours and intentions. The report
also presents observed changes therein over the course of the workshop. Throughout the report we
provide some conclusions and inferences from the observations made; however the focus of the report
is on presenting empirical results.
The key findings of the report reflect a mixed range of public opinions with regard to climate change,
low carbon energy and CCS. Most participants saw climate change as being an important issue for
Scotland, although there was some doubt over the extent to which it was caused by humans and
whether reductions in carbon emissions would be effective in mitigating climate change. The majority
of participants indicated that they took part in environmentally-friendly activities such as recycling
and domestic energy conservation. Support for renewable energy sources remained high throughout
the workshop – with some participants expressing particular pride in Scotland’s renewable energy
achievements and ambitions. Support for CCS declined following the information provision and
group discussion – it was the only energy option for which support diminished. Whilst there was
broad consensus that energy costs would have to rise to meet carbon reduction targets, many
participants were unwilling to pay more for their electricity – particularly when they read media
reports of utility companies’ profits rising.
The study, commissioned on behalf of the Global Carbon Capture and Storage Institute (GCCSI) by
the Commonwealth Scientific and Industrial Research Organisation (CSIRO) in Australia, replicates a
number of large group process workshops held in Australia by CSIRO. To enable comparison of the
outcomes, the Scottish large group process methodology, analysis and report structure has followed
the approach taken by CSIRO as closely as possible. The large group process is a full-day workshop
consisting of a mix of large group plenary sessions featuring expert presentations followed by
questions, and small group breakout sessions where participants discuss the topics amongst themselves
with the help of a facilitator. The workshop also features a series of questionnaires throughout the
day, both individual paper based questionnaires and interactive large group digital voting.
The workshop participants (n=99) were recruited by a professional agency to form a representative
sample of the Edinburgh and Lothian region’s population with respect to age, gender, socio-economic
grouping and ethnic background. Under the direction of a ‘lead facilitator’, the workshop featured
presentations on climate change and energy technologies. Two Scottish experts presented objective
and unbiased information and knowledge on climate change, energy use and energy technologies.
After the presentations, participants were given the opportunity to discuss the material in small group
(n = 10 +/- 2) discussions led by a ‘table facilitator’. Opportunity was also given to ask the experts
questions. This process was designed to engender trust in the information presented, validate
individual viewpoints, and promote informed judgements about climate change and energy issues.
At the start, middle and end of the workshop the participants completed a questionnaire on their
knowledge about and attitudes towards climate change and energy technologies. The questionnaires
were designed to build up a detailed picture of the participant’s knowledge and attitudes and to track
changes therein during the workshop.
Results from the questionnaires revealed the environmental profile of the participants and shows a
relatively high stated engagement with pro-environmental behaviour. More than 80% of the
participants indicated that they use energy efficient light bulbs, conserve energy at home, use reusable
bags when shopping, and recycle their rubbish.

2
The results show that, on average, the participants had limited knowledge of climate change, energy
use and energy technologies. Questions testing knowledge of climate and energy issues were
answered with an even split of correct and incorrect answers. However, participants’ self-reported
knowledge on climate change and energy technologies increased significantly during the workshop.
The largest increases in self-reported knowledge of energy technologies were for new and emerging
technologies such as CCS, geothermal, coal seam gas, biofuels and wave/tidal.
Most participants expressed agreement that climate change is an important issue for Scotland and
believed that all actors, including government, industry and individuals, should be doing more to
address it. Significant changes in opinion were observed over the course of the workshop, with an
increase in the number of participants agreeing that more needed to be done to reduce carbon
emissions. Support for increasing the price of electricity in order to reduce greenhouse gas emissions
significantly increased over the course of the workshop; however the majority of participants remained
unwilling to pay more as individuals in order to reduce greenhouse gas emissions from electricity
generation. It was also noticeable that there was a reluctance to pay higher electricity bills because of
a general distrust of the electricity supply companies, in particular their pricing regime and perceived
profitability.
The expert presenters introduced twelve energy technologies to the workshop participants who were
asked to rank their support for each technology. There was considerable variation in support for the
energy technologies amongst the participants. Generally, support for renewable energy technologies
was larger than support for non-renewable technologies. Wind, wave/tidal and solar energy, received
the highest levels of support both before and after the workshop. The least support was expressed for
coal technologies, oil, nuclear and CCS. On average, the support for eleven of the twelve technologies
presented increased during the workshop. The exception was CCS, for which mean support
significantly decreased. It is important to note that migration of opinion with respect to CCS within
the group during the day went from a large number of ‘un-knowns’ to a mixture of more positive
views and more negative views – but in which the negative views outweighed the positive views;
hence the overall decrease in support reflects something of a polarisation in opinion once participants
understood more about CCS. The technologies which received the largest increases in support during
the workshop were wind, wave/tidal, and geothermal energy.
With regard to energy related behaviour and intentions, at the end of the workshop the majority of
participants (58%) indicated that they were unwilling to pay more for electricity even if it would
reduce greenhouse gasses. Of the minority who were prepared to pay more, most were willing to pay
up to £25 extra per quarter. At the end of the workshop participants expressed a continued
commitment to environmentally friendly behaviour, with the stated intention of conserving energy,
reusing shopping bags, recycling rubbish and using energy efficient appliances.
When asked to rank their trust in sixteen nominated sources of information, participants expressed
varying and fairly low mean levels of trust in the information providers. Universities and research
institutes, academic articles and family and friends were rated most trustworthy, while industry and
internet blogsites were least trusted as information sources.
The opinions that participants expressed verbally in the small group discussions confirm many of the
quantitative results from the questionnaires. Participant discussions serve to add depth and meaning to
the participants’ concerns, as well as to illuminate their heterogeneity, and provide insight into their
thought and decision making processes. Participant quotes are used throughout the report to illustrate
the qualitative findings.
Outcomes from the Scottish large group process workshop suggest that engaging people in facilitated
discussion about climate change and energy technologies can shift perspectives. For example, the
workshop was effective in raising levels of knowledge of climate change issues and a variety of
energy technology options, particularly new and emerging technologies. The workshop process also
shifted participants support for the energy technology options.

3
In the case of renewables, particularly wind and wave/tidal, support among participants increased
during the workshop. This may have been due, in part, to Scotland’s existing successes in deploying
wind energy, a fact unbeknownst to most participants prior to the day. In the case of CCS, there was a
decrease in support. Participants cited concerns over leakage of carbon dioxide from geological
storage sites (including offshore ones) and the possibility of funding shifting away from investment in
renewable energy. Other participants did recognise the carbon mitigation potential of the technology,
however, and supported continued CCS research and development.
Participants indicated a willingness to do more to reduce their emissions, though were less supportive
about paying extra for electricity. Increasing energy prices and claims of unfair pricing practices from
energy companies had been on the news in Scotland prior to the group study, and many participants
expressed frustration with this increasing expense, particularly as they believed that energy
companies’ profits are also on the rise at the same time. Many participants expressed pride in
Scotland’s achievements thus far in developing renewables. This was juxtaposed with frustration at
the seeming inaction of governments worldwide to address the climate/carbon problem.
Several implications can be extrapolated from this research. First, is that an understanding and
acceptance of anthropogenic climate change should not be assumed among the public. The evidence
points to some misunderstanding of the basic scientific concepts of climate change and also to an
element of climate scepticism in which at least some people are reluctant to accept the scientific
consensus perspective regarding the anthropogenic influence upon past and future climate change.
Hence, enabling an effective discussion on low carbon energy and CCS will possibly require more
than the justification of reducing anthropogenic carbon dioxide emissions. Areas such as improving
energy security, opportunities for carbon dioxide usage such as enhanced oil recovery and economic
stimulation could all be encompassed within the CCS narrative.
Second, is that conceptions of who is responsible for taking action to mitigate climate change vary
greatly from person to person, thus future public engagement needs to be able to deal with these
varying conceptions. Third, is the importance of providing information that situates CCS in relation to
a much broader range of possible energy technologies, and that allows participants to determine for
themselves what the costs, benefits, risks and opportunities of CCS may be. Fourth and final, trust
plays a key role in shaping public perceptions of the organisations developing and/or promoting an
energy technology – and thus of the technology itself. The implication of this is that developers need
to think very carefully about how they engage the public at an early stage of project development to
ensure that sufficient trust is built up to allow developments to proceed.
In summary, the Scottish large group process has been very effective at engaging the public
participants in issues of climate change and energy provision. The workshop significantly increased
the participant’s knowledge of climate change and energy technologies, and in so doing proved itself
to be an effective technique for increasing public awareness and stimulating an active public debate.
The rich data collected during the workshop has been very insightful in understanding how the public
view and frame issues of energy and climate, and how they form their opinions on these issues.

4
1. Introduction This document reports on the outcomes of a large group process workshop that was held on 24
September 2011 in Edinburgh, Scotland, United Kingdom. The study, commissioned by the
Commonwealth Scientific and Industrial Research Organisation (CSIRO) in Australia, aims to
replicate a number of large group process workshops held in Australia by CSIRO. The Global Carbon
Capture and Storage Institute (GCCSI) has supported CSIRO and its partners in undertaking this
research.
These workshops are part of a wider research program exploring the likely acceptance of various
energy technologies among the Australian and international publics, and to identify likely pathways to
low carbon energy futures. In order to enable cross-country comparison of results, the Scottish large
group process methodology and analysis has followed the approach taken by CSIRO as much as
possible.
CSIRO has conducted such workshops successfully in four Australian cities in 2009 and one in 2011,
documenting the perspectives of the Australian public towards climate change and low emission
technologies as well as demonstrating the effectiveness of the large group process. To compare
perspectives of citizens in different countries and to further test the effectiveness of the large group
process, CSIRO has commissioned Scottish Carbon Capture and Storage (SCCS) to replicate this
method in a workshop in Scotland. In the same period, CSIRO also commissioned similar workshops
in Canada and the Netherlands.
Scottish Carbon Capture and Storage is an organisation administered by the University of Edinburgh,
drawing on expertise from many academic disciplines relevant to carbon capture and storage. SCCS
has a number of members with social science backgrounds, who have experience of conducting social
research similar to the large group process. SCCS also has easy access, through the University of
Edinburgh, to the kind of conference, IT and procurement facilities required to run a large group
process, in addition to experts on climate change and low-carbon energy technologies.
The workshops have two main research objectives:
1. To explore society’s knowledge and acceptance of climate change and energy technologies;
2. To examine the effectiveness of the large group process for informing participants’
knowledge and attitudes on the topic of climate change and low emission technologies.
This report first outlines the context of the research (chapter 2) and the methodology used for the
research (chapter 3). Next it describes demographics (chapter 4) and environmental beliefs (chapter 5)
of the participants in the workshop. The knowledge and attitudes of the workshop participants
towards climate change and energy technologies are presented in chapter 6. Chapter 7 details
participants’ behaviour and intentions towards the environment and energy use. Participants’ trust in
information sources is presented in chapter 8. The report concludes with the key issues from the
workshop (chapter 9) and the key messages (chapter 10).

5
2. Research context A considerable body of evidence points to human activity as one of the sources of climate change
(IPCC, 2007). Low carbon energy technologies will be essential to mitigating climate change. The
large-scale implementation of these technologies will require societal acceptance and support, and
there is a risk in technology uptake and wide scale diffusion without this social support. Resistance to
wind turbines in rural locations and public opposition to new electricity grid infrastructure and
proposed CCS initiatives in a number of European countries are well documented. Building or
changing societal acceptance of an issue requires an understanding of the present perceptions and
degree of social acceptance or lack thereof. It is also necessary to have information channels that
provide publics with the opportunity for more informed decision making around the range of low
carbon energy technologies, even though in many cases the range of ‘decisions’ available to the public
might be quite restricted.
A well established approach to assess citizens’ perspectives is to undertake discussions with
participants in focus groups of 8-12 people. In the UK context, focus groups, in-depth discussion
groups and citizen panels have been used for over twenty years for better understanding public
perceptions of, and beliefs concerning, environmental change and policy. In order to improve the
efficiency of this approach, CSIRO has developed the ‘Large Group Process’ methodology for
workshops that enables participation of approximately 100 people while maintaining the
characteristics and benefits of smaller groups (Ashworth et al, 2009). Apart from collecting valid and
reliable data on public perceptions on climate change and energy technologies, the Large Group
Process also aims to promote informed judgments about these options.
Discussion groups have the potential to change attitudes toward, and acceptance of, an issue.
However, the effectiveness of the process is dependent on the perceived legitimacy, independence and
trustworthiness of those providing the information (Moon & Balasubramanian, 2003; Slovic, 1993;
Marks et al, 2004). Given this context, the process was designed to ensure the objectivity of
information provided to participants and to engender trust in the information sources used in the
workshop. The process demonstrates that opinions on the topics vary and encourages participants to
engage in meaningful dialogue by making them feel comfortable to share individual thoughts and
opinions.

6
3. Methodology To enable comparison with the workshops conducted in Australia, the Scottish Large Group Process
followed the Australian methodology as closely as possible. Minor changes were made to adapt to the
Scottish context.
3.1 Recruitment Participants were recruited through an external recruitment agency with experience of recruiting
members of the public for participation in focus groups and opinion polls. The recruitment process
described the workshop topic as climate change and low carbon energy technologies.
The agency recruited participants from across the Edinburgh and Lothians region. East, Mid and West
Lothian are the three counties which are adjacent to Edinburgh. The agency was instructed to obtain a
sample that reflected the gender, age, socio-economic grouping and ethnic characteristics of the area.
People less than 18 years of age and more than 75 years of age were not recruited. People with
professional knowledge about climate change and energy technologies were also excluded from the
workshop.
Following telephone recruitment, participants were posted additional information about the schedule
for the day and featuring the University of Edinburgh logo and contact details, in order to add
legitimacy to the telephone contact.
Although the target number of participants was 100, 110 participants were recruited and confirmed on
the assumption that around 10% would not turn up on the day. 100 people attended the workshop and
99 completed the questionnaires and were included in the analysis. Participants who attended the full
day were rewarded with £80 at the end of the workshop. A free lunch and tea/coffee was also
provided for participants.
3.2 Process The workshop was held on Saturday, 24 September 2011, between 9am and 4.30pm. The workshop
took place at the Moray House School of Education, a University of Edinburgh building located in the
centre of the city. The workshop contained a mix of plenary and breakout sessions (Figure 3.1).
The overall workshop and the plenary sessions were managed by a professional lead facilitator,
recruited to ensure that the day ran smoothly and stayed to time. The breakout sessions involved
discussion groups of 8-11 people, each seated at a round table to facilitate discussion. Participants
were allocated to tables according to the order in which they arrived at the venue, so that each table
filled up in turn. A member of the organising team kept an eye out to make sure that each table
contained a good balance of age and gender, and was prepared to direct people to different tables if
necessary.
Each breakout group was hosted by a table facilitator to encourage introductions, guide the discussion
and ensure all participants had a chance to speak. The facilitators – all either university staff or
experienced postgraduate students – were briefed and trained beforehand in facilitation skills and were
provided with a list of questions for prompting discussion for all the sessions. Facilitators were also
put in charge of audio recording the discussions on their table and of all the ‘paperwork’ for their table
– questionnaires, copies of presentation slides, receipt of payment forms – and distributed this to their
groups at the appropriate times.

7
Figure 3.1: Workshop schedule
Session Start Time
Welcome 9:00 10 mins
Round table introductions 9:10 10 mins
Questionnaire #1 – Pre-workshop 9:20 20 mins
Digital voting warm up 9:40 5 mins
Digital voting - Round 1 9:45 15 mins
Interactive Discussion – awareness, state of play 10:00 15 mins
MORNING TEA 10:15 10 mins
Presentation Part 1 – Climate Change, Andy Kerr 10:25 25 mins
Reactions and points of clarification 10:50 15 mins
Presentation Part 2 – Energy Technologies, Andy Kerr 11:05 30 mins
Reactions and points of clarification 11:35 15 mins
Presentation Part 3 – CCS, Maxine Akhurst 11:50 20 mins
Reactions and points of clarification 12:10 15 mins
Questionnaire #2 – Process 12:25 15 mins
LUNCH 12:40 30 mins
Deliberation 1:10 70 mins
AFTERNOON TEA 2:20 10 mins
Ask the Expert 2:30 30 mins
Key themes/ summary presentation 3:00 30 mins
Voicing concerns 3:30 10 mins
Questionnaire #3 – Post-workshop 3:40 20 mins
Digital voting – Round 2 4:00 15 mins
Wind up 4:15 15 mins
FINISH 4:30

8
The workshop was opened by the lead facilitator who set the context of the workshop and the focus for
the day. This was followed by a breakout session, in which participants were allowed time for
introductions within each of their small groups, led by their table facilitator. After introductions but
prior to any discussions or presentations, participants completed the pre-workshop questionnaire to
assess their existing knowledge and attitudes toward climate change and energy technologies and to
collect demographic data.
Participants were then introduced to the digital voting process. This process allows participants to
electronically vote and then displays the results on a large screen at the front of the room. The lead
facilitator asked a question to which all participants responded by pressing a button on their digital
voting handset. After a warm-up round to make the participants familiar with the technology, digital
voting was used to determine the group’s pre-workshop attitudes towards climate change and energy
technologies. The group thus received instant feedback on the range of attitudes in the group. The use
of the digital voting had two main aims:
1. To provide feedback to the participants and facilitators of the range of views in the room;
2. To build the identity of the participants as members of the larger group.
After the digital voting, there was another breakout session in which table facilitators led a short
interactive discussion around participants’ awareness of climate change and energy technologies. This
breakout session was followed by a morning tea break.
After the break, there was a series of three presentations by Scottish experts in the fields of climate
change and energy technologies. One expert (Dr Andrew Kerr, Director of the Edinburgh Centre for
Carbon Innovation) delivered the first presentation on climate change, energy and carbon emissions,
and the second presentation on the range of technology options for climate mitigation and low-carbon
energy. The other expert (Dr Maxine Akhurst, British Geological Survey) gave the third presentation
on carbon capture and storage (CCS).
After each presentation, the breakout groups had 5 minutes to discuss what they had heard and to
formulate any questions, and there was then 10 minutes to ask the presenter questions. Any additional
questions could, at any time, be written down and stuck up on a ‘question board’ at the front of the
room and would be responded to later.
Figure 3.2: Dr Andrew Kerr explains the science of climate change.

9
To finish the morning session participants filled out the process questionnaire in order to assess their
perceptions of the group, the experts and the information provided. The workshop then broke for
lunch.
During lunch the table facilitators convened with the lead facilitator and organisers to report on the
key themes and questions from their table discussions thus far. This also gave an opportunity for the
facilitators to raise any concerns they had about the dynamic of their groups or the discussion process
and for all facilitators to share and learn from each other’s experiences so far.
After lunch, 70 minutes was given for the table groups to deliberate on the information presented
during the morning. Table facilitators led this deliberation and asked participants to share their
reactions to the information, their concerns and preferences for the range of energy options presented,
and also to identify what further information they felt was needed. This session was aimed at giving
the participants all the information and viewpoints that they required in order to make their own
assessments about each of the technologies. During this time, the expert presenters and event
organisers reviewed the questions posted on the question wall, grouped the questions into themes and
prepared their responses for the next session.
Figure 3.3: Breakout session discussion.
Following a tea and coffee break, a 30-minute ‘ask the expert’ session took place. This involved Dr
Maxine Ackhurst and also two additional experts on CCS with specialisations including geology,
socio-economic and policy dimensions (Dr Vivian Scott and Dr Simon Shackley from University of
Edinburgh). The experts responded to some of the questions that had been posted on the question
wall, then took questions from the participants on issues of energy, climate change and CCS.
Participants raised ‘question flags’ to indicate that they wished to ask a question.
Whilst the ‘ask the expert’ session took place, the table facilitators convened and fed back their main
findings from each of their individual tables to the lead facilitator. The lead facilitator collated this
feedback into a number of key messages which he then shared with the large group in a plenary
session. The lead facilitator asked the large group whether the key messages that had been identified
by the facilitators were an accurate summary of the feelings of the group. After additional feedback
from the group some time was spent reflecting on what participants had learned during the day.

10
To close, participants were asked to complete the post-workshop questionnaire in order to measure
shifts in knowledge and attitudes that had taken place during the day. At the same time participants
were asked to write down ‘one key message’ that they would like to give to policy makers. After this,
the digital voting session was repeated to provide instant feedback to the group about changes in
attitudes during the day.
Figure 3.4: ‘Ask the expert’ session.
3.3 Information materials The three presentations that were delivered during the day were based upon the Australian
presentations, and adapted to include information relevant to the context of Scotland. The
presentations strived to present a balanced view of each technology, illustrating both the advantages
and disadvantages of each technology. Participants were given a print out of the presentations to refer
to during the day and take home with them.
3.4 Data collection and analysis The quantitative and qualitative structure and measures used in the large workshops were based on
previous group process research (Ashworth et al, 2006; Ashworth & Gardner, 2006).
3.4.1 Quantitative data
Quantitative data was collected using questionnaires that participants completed at the beginning,
middle and end of the workshop (pre-, process and post-). See Appendix A for a copy of these
questionnaires. The questionnaires served two purposes. First, to assess participants’ actual and
perceived knowledge of climate change and energy technologies, as well their attitudes towards and
acceptance of these topics. Second, to assess the effectiveness of the large group process.
Three measures of social acceptance were used to assess the issue of climate change and each of the
technologies in the pre-, process and post-questionnaires. The measures included: 1) attitudes towards
climate change and energy technologies, 2) self-rated knowledge of climate change and energy
technologies and 3) preferences for the funding priority of the technologies. The technologies
assessed were biofuels, CCS, geothermal, hydro-electric, nuclear, oil, solar, wave/tidal, wind, coal,
natural gas and coal seam gas.

11
Attitudes toward the technologies were captured by asking “How strongly do you agree with the use of
the following?”. Responses were recorded on a seven-point Likert scale where 1=strongly disagree,
4=unsure and 7=strongly agree. Self-rated knowledge was measured by asking “How would you rate
your knowledge of the following?” on a seven-point Likert scale of 1=no knowledge, 4=moderate
knowledge and 7=high knowledge.
Attitudes toward the funding priority of the technologies were measured by asking participants to
“Rank the following energy sources and related technologies in the priority order that you would use
to allocate public funds toward their development and implementation”. Participants recorded their
highest priority as 1 through to 12 for their lowest priority.
The second objective of the questionnaires was to assess the effectiveness of the large group process
and this was measured in the post-questionnaire. Attitudes toward particular features of the process
were measured by asking “How strongly do you agree with the use of the following?” on a seven-
point Likert scale ranging from 1=strongly disagree, 4=unsure and 7=strongly agree. Attitudes toward
the purpose of the workshop were measured by asking respondents to tick boxes that “most closely
match your opinions of the purpose of today’s workshop”.
Additionally, the post-questionnaire contained questions relating to behavioural intention and
communication. The quantitative measures of the pre- and post- questionnaires are described by
reporting descriptive statistics namely, mean scores. T-tests (p < 0.05) were used to identify if the
changes in responses were statistically significant at the 95% level of confidence. Measures that did
not look to compare change in pre-and post questionnaire were reported using descriptive statistics.
3.4.2 Qualitative data
Collecting qualitative data was important, given that one of the research aims was to explore Scottish
society’s knowledge, understanding and interpretation of climate change and low emission energy
technologies. Each of the table conversations were audio taped and then transcribed verbatim. The
transcriptions were analysed to identify key themes, which encompassed the range of ideas, attitudes
and beliefs. The qualitative analysis helped the researchers understand how participants’ thought about
climate change, and low carbon energy technologies, and how they related this to their own lives and
experiences, as well as commenting on what they thought was the role of different societal actors.
Other opportunities to provide individual feedback were given at the end of the day. As well as the
‘one key message’ for policy makers that participants were asked for, there was space at the end of the
post-workshop questionnaire to write down any other comments to share with the organisers.

12
4. Participant characteristics This section outlines the demographic characteristics of the people who participated in the workshop.
Of the 99 participants, 98 completed both the pre- and post-workshop questionnaires, although not all
participants completed all the questions, which is noted in the relevant tables.
4.1 Age and Gender There was an almost equal representation of males and females amongst the workshop participants.
The gender ratio at the workshop was slightly different from the Edinburgh and Lothians population at
large. Whereas in the Edinburgh and Lothians population there are slightly more females than males,
among the workshop participants there are slightly more males than females. Age ranged from 18 to
73 years, with a mean of 44 years. People under 18 years of age and over 75 years of age were not
recruited for the workshop. The age distribution was similar to that for the Edinburgh and Lothians
population as a whole, though with somewhat higher proportions of people aged 30-44 and 60-74 in
the workshop than in the wider population, while the 18-29 and 45-59 age groups were somewhat
underrepresented at the workshop.
Table 4.1: Age and gender of workshop participants compared to Edinburgh and Lothians population
Workshop Participants Population Statistics
Age Male Female Total Male Female Total
18-29 8.1% 12.1% 20.2% 13.9% 14.6% 28.5%
30-44 16.2% 21.2% 37.4% 14.2% 13.9% 28.1%
45-59 15.1% 7.1% 22.2% 12.4% 13.4% 25.8%
60-74 13.1% 17.1% 20.2% 8.3% 9.3% 17.6%
Total 52.5% 47.5% 100.0% 48.8% 51.2% 100.0%
Note: Edinburgh and Lothians population data are derived from the National Records of Scotland and the age
categories are defined by this data set.
4.2 Education Table 4.2 summarises the highest education level attained by the workshop participants. The levels
are for the Scottish education system and are listed from lowest to highest. Almost all participants had
completed secondary school, with over 95% having left school with some form of qualifications.
More than 50% had gone on to earn further qualifications, either a trade certificate or apprenticeship
(6%), a diploma (13%), a bachelor or honours degree (28%), or a postgraduate degree (13%).
Table 4.2 Education level
Education Level Frequency Percentage
Primary School 1 1.0
Secondary School – no qualifications 5 5.1
Secondary School – GCSE/Standard grade 13 13.1
Secondary School – AS level/Highers 8 8.1
Secondary School – A level/Advanced Highers 9 9.1
Trade certificate/apprenticeship 6 6.1
Diploma 13 13.1
Bachelor/honours degree 28 28.3
Postgraduate degree 13 13.1
Did not answer 3 3.0
Total 99 100.0

13
4.3 Employment Table 4.3 shows that the majority of workshop participants were in paid employment, with 33%
employed full-time and the rest part-time or casual (13%) or self-employed (11%). 7% were
unemployed, and 16% were retired or on a pension; 4% performed home duties, and another 13%
identified themselves as either full or part-time students.
Table 4.3: Employment status
Employment status Frequency Percentage
Employed full time 33 33.3
Employed part time or casual 13 13.1
Self employed 11 11.1
Unemployed 7 7.1
Retired/pension recipient 16 16.2
Home duties 4 4.0
Full-time student 12 12.1
Part-time student 1 1.0
Did not answer 2 2.0
Total 99 100.0
Table 4.4 shows that about one-quarter of the participants (24%) worked as professionals, the most
common mode for the group. Fewer than 10% of participants were in any of the other categories.
About one-third (35%) were not in paid employment. 6% did not fit into any of these categories and
4% did not respond to the question.
Table 4.4: Employment status
Employment status Frequency Percentage
Manager 6 6.1
Professional 24 24.2
Technician/trade worker 6 6.1
Community/personal service worker 3 3.0
Clerical/administrative worker 9 9.1
Sales worker 5 5.1
Labourer 1 1.0
Not in paid employment 35 35.1
Other 6 6.4
Did not answer 4 4.0
Total 99 100.0

14
4.4 Household structure Table 4.5 illustrates that almost half of the workshop participants lived as part of a couple, either with
children (25%) or without (23%). About a further one-quarter lived in a group household (22%), and
17% lived alone. The remainder either lived as a single parent (8%) or with other family (2%).
Table 4.5: Household structure
Household structure Frequency Percentage
Group household 22 22.2
Single person household 17 17.2
One parent with children 8 8.1
Couple with no children 23 23.2
Couple with children 25 25.3
Other family (e.g. extended family household). 2 2.0
Did not answer 2 2.0
Total 99 100.0
Participants’ household sizes ranged from one to eight (Table 4.6). The most common household size
was two people (39%); this was followed by single person households (18%) and three-person
households (16%) Almost three-quarters of the participants indicated that they lived in a one-, two- or
three-person household.
Table 4.6: Household size
Household size Frequency Percentage
1 18 18.2
2 39 39.2
3 16 16.2
3 7 7.1
5 12 12.1
6 2 2.0
7 2 2.0
8 1 1.0
Did not answer 2 2.0
Total 99 100.0

15
4.5 Income Participants’ household incomes varied from less than £10 000 to more than £100 000, with the
median income being £30 000 - £39 999 (Table 4.7). Approximately one-quarter of the group (24%)
were from households earning less than £20 000 and about one-quarter (23%) from households
earning more than £50 000.
Table 4.7: Household income
Household Income Frequency Percentage
Less than £10 000 10 10.1
£10 000 - £19 999 14 14.1
£20 000 - £29 999 15 15.2
£30 000 - £39 999 19 19.2
£40 000 - £49 999 13 13.1
£50 000 - £59 999 12 12.1
£60 000 - £69 999 5 5.1
£70 000 - £79 999 2 2.0
£80 000 - £89 999 2 2.0
£90 000 - £99 999 1 1.0
£100 000 - £124 999 1 1.0
Did not answer 5 5.1
Total 99 100.0

16
5. Environmental profile This section summarises the position, beliefs and behaviours participants held in relation to the
environment at the beginning of the workshop.
5.1 Position Participants were asked to self-rate their environmental position, by indicating to what extent they
agreed with two statements: ‘I think of myself as an environmentally-conscious person’ and ‘I am the
type of person who engages in environmentally friendly behaviours’ (1=strongly disagree, 4=unsure,
to 7=strongly agree). On the whole the participants considered themselves to be moderately pro-
environmental with mean responses of 5.1 and 4.9 respectively. However, only 9% of participants
stated that they were currently members of an environmental group.
5.2 Beliefs Fifteen statements about environmental beliefs (see Appendix B) were averaged to form a single
summary measure that ranged from 1=anti-environmental beliefs, 4=unsure, to 7=pro-environmental
beliefs. The group average was 4.8 (SD=0.73) reflecting that the group had a moderate level of pro-
environmental beliefs. The highest mean level of agreement was accorded to the statement ‘Plants and
animals have as much right as humans to exist’. The second-highest mean level of agreement was to
the statement ‘Despite all our special abilities humans are still subject to the laws of nature’. The
lowest mean level of agreement was accorded to the statement ‘The earth has plenty of natural
resources if we just learn how to develop them’.
5.3 Behaviours
Participants were presented with a list of seven pro-environmental behaviours and asked whether they
engaged in these behaviours. At least 80% of the participants performed four of the seven behaviours;
using energy efficient light bulbs (91%), conserving energy at home (91%), using reusable bags when
shopping (88%) and recycling rubbish (83%).
Considering energy efficiency when buying white goods (71%), and conserving energy in the
workplace (60%), were fairly widely practiced behaviours. The least adopted pro-environmental
behaviour was having a solar hot water system in the home, with only 2% of respondents doing this.
Participants’ ‘environmental impact score’ (derived by summing each participant’s ‘yes’ responses to
the seven behaviours) span across the whole range from 0 to 7. The mean score was 4.8 with a
standard deviation of 1.2.

17
Figure 5.1: Environmental behaviours (percentage of participants who circled yes)

18
6. Knowledge and attitudes This section summarises participants’ self-rated knowledge and attitudes regarding climate change and
energy technologies. These have been measured in both the pre- and post-workshop questionnaires,
thus making it possible to highlight changes that occurred during the workshop.
Overall, the workshop was particularly effective in raising participant knowledge of climate change
and energy technology options. Knowledge of all climate change issues and energy technologies
significantly increased over the course of the workshop. There were significant changes pre- and post-
workshop in support towards all energy technologies with the exception of solar and wind (although
both solar and wind were already highly supported pre-workshop and this continued post-workshop).
There was also significant change on three of the seven statements regarding climate change and
related issues.
6.1 Knowledge about climate change and related issues The participants were presented with eight factual statements about climate change and related issues,
and asked to indicate whether these statements were true or false (see Appendix B). There was also an
option for ‘Don’t know’, and for six of the eight statements the most widely selected option was
‘Don’t know’ implying that there was a lack of knowledge about these issues.
Seven of the eight statements were false. The majority of participants correctly identified the true
statement ‘Embodied energy is the energy used to produce and transport the goods and services that
we buy’. The participants also correctly identified two of the statements as false, with the statement
‘Climate change can completely be explained through natural variability in climatic cycles’ being
most widely recognised as false. The remaining five statements were not recognised as false, with the
statement most incorrectly recognised as true being ‘The greenhouse effect is caused by a hole in the
earth’s atmosphere’.
A summary measure of knowledge was obtained by assigning a score of -2 to an incorrect answer and
a score of +2 to a correct answer. Scores were summed across all eight items, yielding a total
knowledge score which could range from -16 to +16. The mean summary measure of knowledge for
all participants was 0.1. This indicates that, while overall slightly more correct than incorrect answers
were provided, there was limited knowledge of the issues in the statements. The scores per question
are presented in Appendix B.
Participants were also asked to rate their knowledge of climate change and related issues. Results
show that self-rated knowledge of all seven issues increased significantly during the workshop (Figure
6.1). At the beginning of the day, participants indicated that they knew least about the relationship
between the price of electricity and greenhouse gas emissions, and most about energy conservation in
the home. At the end of the workshop participants self-rated that they knew most about climate
change, and greenhouse gas emissions.

19
Figure 6.1: Mean changes in knowledge of climate change and related issues (pre- vs post-workshop)
Knowledge was measured as (1) no knowledge, (4) moderate knowledge, (7) high knowledge.
*Paired t-test (p<0.05) identified differences between responses pre- and post- workshop were significant.
6.2 Knowledge of energy sources and related technologies Participants’ self-rated knowledge of all twelve energy technologies significantly increased during the
workshop (Figure 6.2). The largest increase was seen in carbon capture and storage (CCS), to which
one of the three presentations was entirely devoted. There were also large increases in self-rated
knowledge for new and emerging technologies such as geothermal, coal seam gas, biofuels and
wave/tidal. The lowest mean level knowledge increases were for the more established technologies
such as coal and oil.
Of the twelve energy technologies, participants self-rated their knowledge of solar energy the highest,
pre-workshop. This self-rated knowledge increased over the workshop. The highest self-rated
knowledge post-workshop was of wind power, and this self-rated knowledge also rose over the
workshop.
The lowest average levels of self-rated knowledge reported at the beginning of the workshop were for
the new or emerging technologies of CCS, geothermal, and coal seam gas. Coal seam gas and
geothermal remained the lowest post-workshop.
The difference in self-rated knowledge between the various energy sources and related technologies
was smaller after the workshop than before the workshop. The range between the technology with the
lowest mean self-rated knowledge and the technology with the highest mean self-rated knowledge was
2.1 prior to the workshop and 1.8 after the workshop.

20
Figure 6.2: Mean changes in knowledge of energy sources and related technologies (pre- vs post-workshop)
Knowledge was measured as (1) no knowledge, (4) moderate knowledge, (7) high knowledge.
*Paired t-test (p<0.05) identified differences between responses pre- and post- workshop were significant.
6.3 Attitudes toward climate change and related issues Most participants supported six out of the seven statements about climate change and related issues
that were presented, both before and after the workshop (Figure 6.3). More than 85% of respondents
at least moderately agreed with five of these six statements (percentage of participants answering
“moderately agree”, “agree”, or “strongly agree”), and almost 60% at least moderately agreed that the
production of electricity is a major contributor to greenhouse gas emissions.
The seventh statement about increasing the price of electricity to help reduce emissions received less
support. More than 60% of the participants at least moderately disagreed with this statement
(percentage of participants answering “moderately disagree”, “disagree”, or “strongly disagree”) prior
to the workshop. While support did increase significantly during the day, at the end of the workshop
almost 50% of participants still disagreed with the statement.
The largest change in opinion pre- and post-workshop was for the statement that ‘the production of
electricity is a major contributor to greenhouse gas emissions’ with the level of at least moderate
agreement increasing from 60% to more than 90%. Four other statements also showed significant
differences between the pre- and post-workshop questionnaire results. After the workshop,
participants agreed more strongly that climate change is an important issue for the Scotland, that
industry as well as government should be doing more to reduce greenhouse gas emissions, and that
people should be doing more to promote energy conservation in the workplace. There was no
significant difference pre- and post-workshop for the statement that ‘people should be doing more to
promote energy conservation in the home’.

21
Figure 6.3: Mean changes in attitudes toward climate change and related issues (pre- vs post-workshop)
Attitude was measured as (1) strongly disagree, (4) unsure, (7) strongly agree.
*Paired t-test (p<0.05) identified differences between responses pre- and post- workshop were significant.
6.3.1 Climate change
The majority of workshop participants (>90%) considered climate change to be an important issue for
Scotland, both before and after the workshop. In the group discussions, there was a fairly broad
consensus that climate change exists, although some participants were unsure about the extent to
which climate change is caused by human activity. There was also some confusion between the
greenhouse effect and ozone depletion. This is reflected in the statements that participants made
during the discussions:
“We seem to be speeding it up, my opinion is, we’re not causing it, it’s a natural cycle, but
we’re definitely speeding it up.”
“Climate change has always been in place, but I think, you know, by creating an ozone effect,
a greenhouse effect, it’s accelerating the process.”
“Climate change is a natural phenomenon – we can’t stop it, but we can stop aggravating it.”
“I think we don’t know enough about what has caused the changes in climate. I mean, for the
last two years we have had very severe winters, far more so than for a long, long time. Is that
because of what’s happening into the environment, or would that just have happened
anyway?”
“I worry about these earthquakes, these earthquakes and tsunamis, and why they should be
coming, and coming more regularly. Are they going to carry on, or what are we doing about
it? Is there anything being done about it?”
“It’s [CO2] the gases that come out of things like fridges and things like that, is it?”

22
6.3.2 Electricity and climate change
Before the workshop, almost 60% of participants agreed that the production of electricity is a major
contributor to greenhouse gas emissions. At the end this share had increased to more than 90%. The
mean level of agreement thus significantly increased, and the share of participants agreeing or
agreeing strongly increased from 33% to 67%.
6.3.3 Doing more to reduce emissions
There was a rather broad agreement that more should be done to reduce greenhouse gas emissions.
The questionnaire results show that participants think that all societal actors have a responsibility in
this reduction effort. There was substantial agreement concerning the statements that government and
industry should do more to reduce greenhouse gas emissions. Likewise, the statements that people
should do more to conserve electricity in the home and in the workplace received substantial support.
Some quotes from the table conversations illustrate these findings:
“If you put the same amount of, like, impetus and government’s money behind the renewable
energy system as they do into their computer development system, I wonder if we’d be five
times better in ten years with solar panels and stuff, or maybe they just don’t have enough
money.”
“We hear these huge big numbers, millions of pounds, people like industry and energy
companies. But on a small scale we’re the consumers of all these things, so if we could have
maybe more of a, like, knowing about things like fitting solar panels on roofs. It’s small, it’s
not going to make a huge difference once over, but if millions of people have these things.”
“My concerns are about what I can do, and the lack of information that’s out there unless you
really want to investigate it. Unless you’re very interested in the subject matter, the
information’s not easily accessible.”
6.3.4 Increasing the price of electricity
Of the seven statements on attitudes toward climate change and related issues there was least
agreement with ‘increasing the price of electricity’ as a measure to reduce greenhouse gas emissions.
However, there was a significant difference between the pre- and post-workshop results. 17% of
participants agreed with this statement prior to the workshop, whereas 34% agreed after the workshop.
However this means that two-thirds of the participants remained against price rises. There was
scepticism as to whether ‘green’ electricity was indeed truly green, and whether increases in prices
would result in increases in low carbon energy or rather in increases in corporate profits:
“It’s important, but I’m skint.”
“How much are all these [carbon reduction] technologies going to cost? We’ve already gone
through so many energy price rises in the past few years. My energy bills have doubled over
the past few years. If it’s going to cost more I’m not sure people are going to go for that.”
“When the price of oil goes up it goes up, but when the price of oil goes down, the prices that
we pay for electricity and gas, they don’t go down.”
“What I would like to know is what companies are actually doing this, is it just the big
conglomerate oil and gas companies making more money out of things they are doing already
or are there smaller companies getting involved?”

23
6.4 Attitudes toward energy sources Attitudes toward energy sources varied substantially (Figure 6.4). Generally, there was greater
support for renewable options than for non-renewable options. At the beginning of the workshop,
more than 20% of participants were unsure of their support for seven of the twelve technologies. The
most uncertainty was for coal seam gas (68% were unsure), Geothermal (62% were unsure), and CCS
(61% unsure). After the workshop, the share of participants that indicated they were unsure about
individual technologies was substantially lower, e.g. 28% for CCS and geothermal and 44% for coal
seam gas. Greater self-rated knowledge (see Section 6.2) may have contributed to the reduction of
uncertainty. During the workshop there was an entire presentation devoted to CCS, while very little
information on geothermal and coal seam gas was presented. It is therefore interesting to note that
levels of uncertainty in CCS did not change markedly compared to the change in expressed
uncertainty regarding geothermal and coal seam gas.
The mean level of participant support increased during the workshop for all technologies with the
exception of CCS.
Figure 6.4: Mean changes in attitudes toward energy sources and related technologies (pre- vs post-workshop)
Attitude was measured as (1) strongly disagree, (4) unsure, (7) strongly agree.
*Paired t-test (p<0.05) identified differences between responses pre- and post- workshop were significant.
6.4.1 Solar, wind, hydro and wave/tidal
The highest mean levels of support, both before and after the workshop, were for solar, wind, hydro
and wave/tidal power, all eliciting a mean moderate to strong agreement. At least 90% of participants
supported these technologies at the end of the workshop. At the end of the workshop 97% of
participants supported wave/tidal, with 59% expressing strong support (Figure 6.5). Wind received
support from 96% of the participants, with 65% expressing strong support (Figure 6.6). 95% of
participants supported solar and 90% supported hydro.

24
Figure 6.5: Changes in response for support for wave/tidal energy (pre- vs post-workshop)
Figure 6.6: Changes in response for support for wind energy (pre- vs post-workshop)
Despite these high levels of support, some perceived local problems with wind energy arose during the
discussions. The impact of wind turbines on the landscape was mentioned as well as the noise
produced by the turbines, though others played down these impacts:
“See the Inverness council yesterday knocked back an application to build a wind farm, 23
turbines, and the council knocked it back because the locals didn’t want it because of the
effect on the environment. The look and the noise, I’d imagine it would be quite noisy.”
“They are a blot on the landscape.”
“They judder, they get a bit of a crosswind and they judder, but you don’t hear anything. You
could live half a mile away and you wouldn’t hear a thing, you’d just see them going round.”
“They look pretty cool some of them.”

25
6.4.2 Geothermal and biofuels
Two other renewable technologies – geothermal and biofuels – were the next most supported options,
both pre- and post-workshop. There was a lot of uncertainty about these technologies at the start of
the workshop, but support had significantly increased by the end. The proportion of participants that
supported geothermal increased from 34% to 65% during the workshop while the proportion that was
uncertain decreased from 62% to 28% (Figure 6.7). Likewise for biofuels, the proportion of
participants that supported the technology increased from 41% to 67%, while the proportion that was
unsure decreased from 44% to 20% (Figure 6.8). In both instances, it seems that participants became
more favourably disposed towards the technology during the workshop, even though there was limited
information provided about these technologies.
Figure 6.7: Changes in response for support for geothermal energy (pre- vs post-workshop)
Figure 6.8: Changes in response for support for biofuels (pre- vs post-workshop)
“Scotland has a lot of granite, so I’m wondering why geothermal isn’t being considered as a
major energy source.”

26
“The geothermal thing, I just thought, like, Scotland’s such a tiny country, does it really make
such an impact that the granite is far away?”
6.4.3 Natural gas
Of the non-renewable energy technologies, natural gas receives the largest support. The support for
natural gas increased slightly, but not significantly during the workshop. The percentage of
respondents that were unsure about the use of natural gas declined from 31% to 17%, and there was a
shift towards moderate support (Figure 6.9).
Figure 6.9: Changes in response for support for natural gas (pre- vs post-workshop)
6.4.4 Carbon capture and storage (CCS)
61% of the workshop participants were uncertain about carbon capture and storage at the start of the
workshop (Figure 6.10). Of those who had an opinion, three-quarters were supportive. This
uncertainty was reflected in participants’ knowledge about CCS prior to the workshop, which was the
lowest of all the technologies. While there was moderate support for CCS prior to the workshop with
a mean level of support of 4.48, this fell significantly (at 95% confidence levels) during the workshop
to 4.1 (Figure 6.4).
During the workshop, a lot of information on CCS was presented, and self-reported knowledge
increased significantly (see section 6.2). The percentage of participants that indicated that they were
unsure about their support for CCS decreased from 61% to 28% during the workshop. Although the
mean level of support decreased, there were some interesting changes in support, as the percentage of
participants that indicated agreement did increase. Most of this increase was attributable to an
increase in the number of people expressing ‘moderate agreement’ from 10% to 24%, while the
percentage of people ‘strongly agreeing’ decreased. The percentage of participants indicating
disagreement with CCS also increased with the number of people ‘moderately disagreeing’,
‘disagreeing’ and ‘strongly disagreeing’ increasing from 8% to 30%. Overall, this leads to the mean
reduction in support.

27
Figure 6.10: Changes in response for support for carbon capture and storage (pre- vs post-workshop)
It appears as if many of those who started the process being ‘unsure’ about CCS came to an opinion
during the day, and that this was towards the categories of ‘moderately agree’, ‘disagree’, moderately
disagree’ and ‘strongly disagree’. Quotes from the group discussions illustrate that CCS splits
opinion:
“I just can’t get, you know, if it’s causing us so many problems up here, surely it’s going to
cause problems down there. Would there be earthquakes, would the plates move?”
“We’re not concerned about massive eruptions as such. But the point is to get this stuff out of
the atmosphere and if you have a leak…”
“I feel uneasy about CCS but the only alternative is that it goes into the air... and it increases
GHGs. What I don’t want it to be is an excuse for government to say we can continue using as
much fossil fuels …. You know, producing as much carbon as we do because we have a
solution”.
“We’re not going to transfer to whether it’s wind power or nuclear, we’re not going to have
that as a total source of energy. We’re still going to have to use fossil fuels, so if you can take
the carbon away from that, well, it’s a short-term fix which is probably good.”
“CCS is a nice easy solution. You keep all your existing stuff and you suck the CO2 out of the
chimney”.
“The elephant in the room is cost”.
“I would feel very sad if the Scottish Government got a totally negative view of a new
technology [CCS] from the general public, just because we haven’t got questions answered on
it.”

28
6.4.5 Nuclear
Apart from the coal technologies and oil, nuclear energy solicited the least support from participants.
There was a widespread range of opinions in relation to nuclear power and there was no significant
shift in the mean during the workshop. At the start of the workshop about equal proportions of
participants were supportive (39%) and opposed (43%) with 18% uncertain (Figure 6.11). This
changed very little during the workshop, with support increasing slightly, but not significantly, to
47%, and opposition dropping to 40%, 13% remained unsure. Most of the increase in agreement was
at the level of ‘moderate agreement’.
Figure 6.11: Changes in response for support for nuclear energy (pre- vs post-workshop)
"I don't know why, there's a total taboo about nuclear. See if you're pro-nuclear, it's as if, you
know, it's kind of forbidden because of the stigma around it."
“I worked in the nuclear industry, and there’s a lot of poor information out there about
nuclear, and to a large extent they’re to blame for not putting over the correct information. I
worked there, I’m perfectly happy, and I know a lot about the effects of it, and I know there’s a
load of nonsense talked, and people are against it because they just don’t know the truth.”
"When it does go wrong, oh f**k do we pay for it. Children are still being born in Chernobyl
now with radiation effects… So I think it's just a case of when it goes well it goes well, when it
goes bad oh my god."
6.4.6 Coal, oil and coal seam gas
There was limited support for coal, oil and coal seam gas. At least 40% of participants opposed coal
(Figure 6.12) and oil as energy sources both at the start and end of the workshop. Though support for
the technologies did increase significantly during the workshop. There was a lot of uncertainty about
these three energy options, particularly for coal seam gas, with 68% of participants unsure pre-
workshop and 46% remaining uncertain post-workshop.

29
Figure 6.12: Changes in response for support for coal (pre- vs post-workshop)
6.5 Energy technology preferences At the start and end of the workshop, participants were asked to rank the twelve energy technologies in
order of priority if they were able to allocate public funds to their development and/or implementation.
Participants were asked to assign a score of 1 to their most preferred technology, and a score of 12 to
their least preferred technology. A low score thus indicates a larger preference for a technology. The
average pre- and post-workshop rankings are listed in Table 6.1. Figure 6.13 shows the mean funding
priority order of each technology before and after the workshop.
Table 6.1 Ranking of average technology funding priority (pre- and post-workshop)
Energy Technology Pre-workshop rank Post-workshop rank
Wind * 1 1
Solar 2 3
Wave/tidal * 3 2
Hydro-electric 4 4
Carbon Capture and Storage (CCS) * 5 8
Natural Gas 6 6
Biofuels 7 5
Geothermal (hot rocks) * 8 7
Nuclear 9 9
Oil 10 11
Coal seam gas 11 12
Coal (traditional/current methods) 12 10

30
Figure 6.13: Changes in priority of the mean preferred energy technology (pre- vs post-workshop)
Priority was measured from 1=highest priority to 12=lowest priority.
*Paired t-test (p<0.05) identified differences between responses pre- and post- workshop were significant.
Both Table 6.1 and Figure 6.13 show that in general, participants rank renewable technologies higher
than non-renewable technologies. Solar, wind, hydro-electric, and wave/tidal energy top the list both
before and after the workshop. At the bottom end of the list are coal (both traditional and seam gas),
oil and nuclear. In the middle of the list are CCS, biofuels, geothermal and natural gas. There were
changes in ranking within these sub groups during the course of the workshop. The biggest mover
was CCS which dropped from being ranked 5th pre-workshop to 8
th post-workshop. There was a
significant difference in preference before and after the workshop for four of the technologies: wind,
wave/tidal, CCS and geothermal.
Table 6.1 shows that wind energy was the most preferred option both before and after the workshop,
and that its standing as the most preferred option increased during the workshop (Figure 6.13). Pre-
workshop 73% of participants ranked wind in their top-3 of most preferred options, post-workshop
92% of participants placed wind in their top-3.
Wave/tidal overtook solar as the second-most preferred option during the workshop. Pre-workshop,
59% of participants ranked wave/tidal in their top-3, post-workshop this figure had risen to 78%.
Meanwhile the number of participants ranking solar in their top-3 declined from 66% to 55%. Hydro-
electric energy ranked as fourth mean priority both before and after the workshop, with 40% and 30%
of participants ranking hydro-electric energy in their top-3 preferred options pre- and post-workshop
respectively.
Before the workshop, CCS ranked fifth. After the workshop, it had fallen below biofuels, natural gas
and geothermal. Before the workshop, 14% of participants had put CCS among their three most
preferred options; this percentage had declined to 8% after the workshop, with nobody ranking it as
their number one option. Before the workshop, 16% of participants had put CCS among their three
least preferred options; at the end of the workshop 27% of participants ranked CCS in their bottom
three. This decline in mean ranking score was statistically significant.

31
Natural gas remained in sixth place both before and after the workshop. Biofuels moved up two
places to fifth during the workshop, and geothermal moved up one place to seventh. Even though
biofuels moved up two places, the shift in mean score was small and not statistically significant.
Whereas despite only moving up one place, the shift in mean score for geothermal was significant.
Pre-workshop, geothermal energy was ranked among the three most preferred options by 3% of
respondents and in the top six by 37% of participants, while 31% ranked it in their bottom three. Post-
workshop 5% of participants ranked it in the top three, 48% ranked it in the top six, and only 21%
ranked it in the bottom three.
There was a small drop in mean ranking for natural gas and a small increase for biofuels. Natural gas
ranked among the top six technologies for 46% of the participants pre-workshop and for 44% of
participants post-workshop. While biofuels was ranked among the top six by 41% of the participants
at the start of the workshop, this percentage had increased to 50% at the end.
Among the four least preferred technologies, nuclear was ranked ninth both pre- and post-workshop.
Pre-workshop 39% ranked it in the bottom three, and this figure was largely unchanged with 36%
ranking it in the bottom three post-workshop. Coal, which had been the least preferred technology
pre-workshop, climbed two places to tenth post-workshop. However this change was not statistically
significant. 60% of participants had ranked coal in the bottom three at the beginning of the workshop,
but this percentage had decreased to 52% at the end of the workshop.
Oil and coal seam gas, which had been ranked tenth and eleventh respectively pre-workshop, both
dropped one place to fall below coal post-workshop. Before the workshop, 55% of participants ranked
oil among their three least preferred options. After the workshop, this percentage had decreased, with
49% ranking it among the bottom three. Before the workshop, coal seam gas was ranked among the
bottom three by 50% of participants. After the workshop, this percentage had increased, with 55% of
participants ranking it among the three least preferred options.
It is also worth noting that during the table discussions, participants often thought beyond the
information that was presented to them, considering energy issues in different ways. The following
quotes illustrate some of the alternative angles from which participants approached the discussion:
“There are so many other kinds of energy sources that we’ve not really gone into, things like
the wind and the tidal, because these are things we could easily tap into. Money could be
better spent on that than bombing people in Libya and things like that.”
“Scotland’s moving further and further away from industrial things so our emissions are
naturally going down in that sense so surely we would be much better just jumping to
renewables. Yes we’d still have CO2 emissions but they’ll be a hell of a lot less than they are
at the moment”.
“What we’ve been talking about is what is the best way to produce energy, but we haven’t
really said a lot about how to save energy, and I feel we could make a much bigger
contribution by saving a lot of our energy. You go into stores and you, personally I feel the
heat, I think if they dropped their temperature by about three or four degrees in all city centre
stores they could save a huge amount.”

32
7. Energy related behaviours and intentions This section describes participants’ willingness to pay more for electricity if it reduced greenhouse gas
emissions and other behavioural intentions as expressed in the questionnaires.
7.1 Willingness to pay more for electricity Participants were asked whether they would be willing to pay more for electricity if it reduced
greenhouse gas emissions. This question was asked in the pre-questionnaire and in the post-
questionnaire. Figure 7.1 shows that 36% of the participants were willing to do so before the
workshop, and that 42% were willing to do so after the workshop.
Figure 7.1: Percentage of participants that indicated they would be prepared to pay more for electricity if it reduced greenhouse gas emissions (pre- vs post-workshop)
Participants who answered that they would be willing to pay more for electricity if it reduced
greenhouse gas emissions were also asked how much extra they would be willing to pay. Table 7.1
shows that there was hardly any difference between pre- and post-workshop answers. Of those willing
to pay extra, approximately 20% were only willing to pay less than £25 extra per quarter of a year both
pre- and post-workshop. Approximately 45% would pay up to £25 more per quarter, and
approximately 22% would pay up to £50 per quarter extra. This finding suggests that more
information, and a change in attitude, would not necessarily change stated willingness to pay, this
remaining remarkably stable pre- and post-workshop.
Table 7.1 Willingness to pay more for electricity (pre- and post-workshop)
If you answered yes, which of the following best
describes how much more you would be willing
to pay for your household electricity if it
reduced greenhouse gas emissions?
Pre-workshop Post-workshop
I would pay less than £25 extra per quarter 20.0 24.4
I would pay up to £25 extra per quarter 45.7 43.9
I would pay up to £50 extra per quarter 22.9 22.0
I would pay up to £75 extra per quarter 5.7 4.9
I would pay up to £100 extra per quarter 2.9 2.4
I would pay up to £150 extra per quarter 2.9 2.4
I would pay more than £151 extra per quarter 0 0
Total 100 100

33
7.2 Intended behaviours as a result of the workshop Participants were asked in the post-workshop questionnaire whether they intended to change their
behaviour as a result of the workshop. Figure 7.2 shows that there is a (relatively) strong intention to
adopt behaviour generally considered to be more environmentally friendly. The exceptions are paying
extra for ‘green’ electricity and installing a solar hot water system in the home. The mean scores for these
activities were 3.7 and 3.6 respectively and reflect a moderate reluctance among participants to carry out
these activities. As noted above, paying extra for electricity is not popular among the participants, and the
installation of a solar hot water system also has an upfront cost to the homeowner (and may have been
regarded some what skeptically by Scottish citizens).
The highest mean score is given for conserving electricity in the home. The other relatively simple and
cost effective behaviours of conserving energy, using energy efficient options and recycling also score
highly, reflecting willingness among participants to carry out these activities.
There was also moderate agreement with the statement that “I will continue with my current behaviour,
because I already do most of the above”. This is supported by the results from the pre-questionnaire (see
Section 5.2) where participants were asked whether they already exhibit given behaviours. The majority
of participants stated that they already carried out most of the behaviours with the exception of paying
more for ‘green’ electricity and having a solar hot water system.
Figure 7.2: Intended behaviour as a result of the workshop
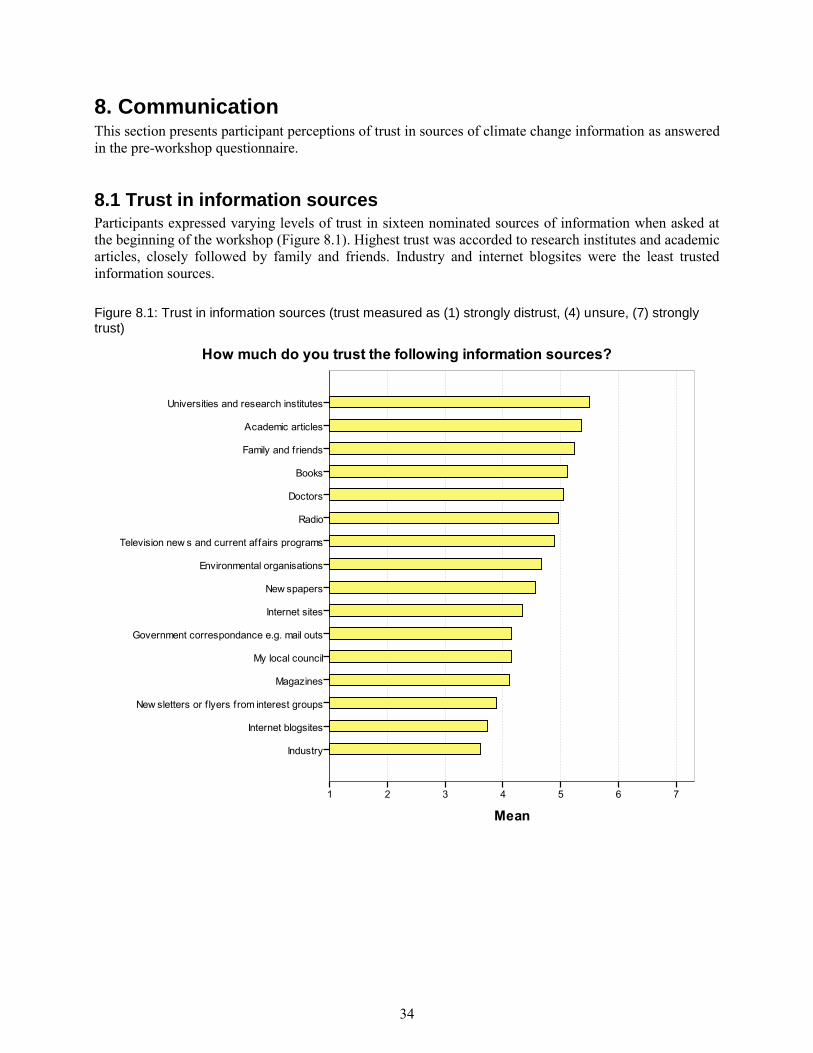
34
8. Communication This section presents participant perceptions of trust in sources of climate change information as answered
in the pre-workshop questionnaire.
8.1 Trust in information sources Participants expressed varying levels of trust in sixteen nominated sources of information when asked at
the beginning of the workshop (Figure 8.1). Highest trust was accorded to research institutes and academic
articles, closely followed by family and friends. Industry and internet blogsites were the least trusted
information sources.
Figure 8.1: Trust in information sources (trust measured as (1) strongly distrust, (4) unsure, (7) strongly trust)

35
9. Key issues arising from discussions During the group discussions participants had the chance to discuss in more depth the issues arising from
the presentations. In this chapter, we extract the key issues and concerns that arose from these group
discussions.
9.1 Climate change Most participants agreed that climate change was happening, however there were mixed opinions as to the
role of humans in causing it. While most participants concurred that we need to address the problem,
others expressed concern that carbon reduction would have no impact on climatic change.
“I’m not sceptical it’s an issue. I’m sceptical that humans are causing it as bad as it is, and
whether it is a natural cycle.”
“I agree that it is happening. The disagreement is the contribution that man is making to all of
this.”
“The question is, if we got down to the levels of carbon emissions that are so desired, would the
weather change, not immediately but over a period of time. I’m not sure it would. Not a vast
amount.”
9.2 Energy technologies Participants showed a preference for renewable technologies over fossil fuel based technologies, while
CCS and nuclear both invoked mixed reactions. The positivity around renewables was also tempered by
realism surrounding the practicalities of increasing renewable generating capacity. This led some
participants to consider the potential role and value of CCS.
“It’s [renewables] the only way forward. There is no other solution.”
“Tides are constant, and once they crack it [tidal power technology] that’s a constant energy.”
“Renewable energy, yes, might upset people from an aesthetic point of view, but on the main
issue, CO2, it cuts that right out. I’d rather see a load of turbines about the place than have a
nuclear power plant that could do a Fukushima on me at any moment.”
“Every second day you hear about wind farms being knocked back. It’s a good energy source but
can it be delivered in the timescales that we need it?”
“A solar unit on your roof costs £15-17 000 a unit, you get a return on your investment, but how
many people can afford to do that?”
“If you can still use fossil fuels which we are going to have to use, and you take the carbon away
from that then it [CCS] is a good short term fix.”

36
9.3 Costs and Benefits The issue of who would pay for, and who would benefit from, new energy technologies, both renewables
and CCS, was of utmost importance to participants when considering their support for any given
technology.
Participants in virtually all groups spoke at length about the increasing costs of energy, and broadly agreed
that the transition to low-carbon energy would incur additional costs. However, there was disagreement
on who should pay for these costs. Participants were largely opposed to paying more for their electricity
due to the perception that energy companies were already making healthy profits and even profiting from
‘green technology’. Numerous participants expressed discontent about a perceived mismatch between
increases in their energy bills on one hand, and soaring profits of utility companies on the other.
“See the price of oil? Oil fluctuates, it can go up the way, down the way. But it never fluctuates,
the price at the pump never fluctuates down the way. How come the price stays?”
“If CCS is done at power stations, those power stations are owned by utility companies, so they’ll
have to pay for it, which means in turn we’ll have to pay for it.”
“When British Gas and Scottish Power announce their profit margins for each quarter they’re
phenomenal sums of cash. Profitable… or to the benefit of Scotland is yet to be seen. Whenever
these companies get asked they say that the money is being pumped back into renewables energy.
Personally I haven’t seen anything that can be said to be of benefit to Scotland…. There are no
clear approaches on what they are doing with the money aside from punting it straight back to
shareholders.”
“They’re saying everyone’ll get a new boiler because it’ll no be as bad for the environment. See
right now, I’m in a house with a boiler that’s maybe twenty years old, still going okay, but you’re
giving me what four hundred pound for the scrappage scheme, but you see what you’ve got to pay
for it, it’s just a money-making racket for these companies. And you see the statistics now, you’d
be lucky if half of these boilers last eight or nine years.”
“I think the companies and the government have to take responsibility, and they have to put their
money... because the consumer can’t just keep… you pay your council tax, what are you paying
your council tax for? And then the gas prices go up twenty percent across the board. We’re
getting done and done. You get a price raise, or a council tax raise, fair enough, but where’s that
money actually physically going? We don’t know, and we don’t get told.”
For most participants, adoption of a new technology was perceived as beneficial if it provided jobs and
brought inward investment; there was less appetite if the main outcome was to boost corporate profits.
There was some support for the idea that CCS could bring jobs to Scotland and possibly even be the basis
of a new export industry, though also considerable scepticism on this issue. There was also the perception
that Scotland might fare better in this regard via development of renewables, and several participants
expressed confidence in Scotland’s lead on renewable technologies such as wind, wave and tidal power.
“How many jobs do these things produce? We do need work for people. It’s important to create
things that create employment, because people need to work. We shouldn’t object to carbon
capture if it creates jobs.”
“Who are these people who will get these jobs? They are highly skilled jobs. Will it be people on
the dole the now?”

37
“We’re creating this innovative technology for wave and CCS. We could export the technology to
other countries, which creates jobs.”
“We should probably be looking at environmental and economic… as well as at also how many
jobs we can create to develop society as a whole. Possibly putting them [CCS projects] in slightly
more deprived areas to create a hub. We can build societies around that. Bring slightly more
depressed areas up to the rest of Scotland’s level in terms of employment and social mobility.”
9.4 Responsibility There was a lot of discussion around who was responsible for addressing climate change. Some people
wanted individuals to do more, while others wanted government to show greater initiative. There was also
debate about which countries should be doing more, specifically developed or developing countries.
“I recycle every week as much as I can. My neighbours don’t, so I think why the hell should I keep
doing this?”
“Personal recycling, the bit we can do, is not going to make a big difference. The big difference is
going to have to come from industry and governments.”
“We can’t just sort Scotland out. Because as was illustrated, if China carries on, and Brazil
carries on, it’s just a drop in the ocean, and we’re all f****d anyway.”
“The poorest countries have the lowest per capita emissions because they don’t have electricity.
They’re emitting so little. The focus is on the richest countries, with the most money, and the most
educated people choosing to do nothing about it. So to focus on poorer countries and say they are
part of the problem is a bit cheeky.”
“If we keep helping everybody, Scotland is going to end up a third world country.”
“I’m from Africa and I see a tremendous amount of developed world coming in and taking
resources out of Africa and not returning them.”
“Russia can put up thousands of wind turbines and nobody would ever see them because there is
so few people compared to the land mass.”
9.5 Consumption Patterns of consumption ran through participants’ discussions of low energy technologies. Participants
recognised that their consumption patterns were often unsustainable and would need to change. A number
of participants talked about excessive consumption of consumer goods in contemporary society, making
links in particular to the energy required to produce consumer goods and also the waste problems caused
by ‘disposable’ goods with a short life cycle such as computers and mobile phones.
“Things like iPhones which are essentially disposable, because when the battery runs out that’s it,
you cannae change it. Because I found that out with my son about five years ago, he got an iPod
Nano and he said ‘it’s no charging, can you change the battery?’ And I was like ‘there’s no
battery, it just goes in the bin, buy a new one’, and that’s what all these things are like.”

38
“You see the spike since the 70s of the fossil fuels, and it seems to coincide exactly with this spike
in consumerist greed, I think the government doesn’t address that at all, like advertising run
rampant and telling people they need this, that and the other, I think there needs to be some
attempt at curbing this.”
“The thing that worries me is all these species that face extinction because of everybody that buys
all this stuff, I think we’re pushing the climate that way.”
9.6 Trust Two types of trust can be distinguished: trust ‘in’ someone else, an organisation or in a process (e.g.
regarding their honesty, integrity or impartiality) and trust ‘to do’ (e.g. with respect to their operational
capabilities). During the discussions there was ample evidence of a lack of trust in ‘experts’ or energy
information providers. In many cases, the lack of trust arises from the perception that commercial self-
interest is causing bias in the information provided. This suspicion also appears to influence people’s
willingness to pay for low carbon energy technologies. For example:
“CCS is very technical, but I thought it was real interesting. It kinda highlights the mistrust of
industry. All it is, is CO2 that we’re storing, it’s not like radiation. There is such a stigma on oil
companies.”
“We need more impartial information. There is a lot of information out there but it’s all quite
biased. Its coming from the wind farm [developers], ‘Oh, and did you know wind turbines is the
best kind of energy’, but that is coming from a business which profits from that.”
“I’m willing to pay a little bit more on my electricity bill to help improve matters. But you see
electricity companies making huge profits and you are just wondering where you money is
going.”
“The chances are the costs’ll filter down to Joe public”.
“Can we be reassured it’s [CCS] not just for economic growth?”
While distrust of government was not generally pronounced, there were some participants who did express
distrust at the ability of government to get the job done properly:
“But we do have a bit of reputation for screwing these sorts of things up. We’re probably going to
screw this one up as well”.
“I’ve got little faith in governments to fix it. Deforestation is very important and affects the
climate, but we don’t stop it, we still let people do it.”
A more frequently expressed view, however, was one of satisfaction and even pride in the performance of
the government and companies in implementing renewables.
“People seem quite suspicious about anything that comes from government about renewable
energy and the environment ….. Some of the stuff that has come out of this [workshop] has been
really positive, about wind power and how they want Scotland to be a forerunner of this in the
world.”

39
Trust, or lack of, in ‘experts’ was also clearly demonstrated during the day. Some participants did not
trust climate scientists:
“We’re not having as big an impact as they [experts] make out.”
“What you hear and what you get are two different things. Like predicted and observed weather.
They don’t know what they’re talking about. They say hotter summers and they’re freezing.”
While others were more supportive:
“I think they do though [know what they are talking about]. This is their livelihood. People do
nothing but spend hours studying this, hours in the Arctic digging up ice from thousands of years
ago.”
Issues of trust and distrust towards experts on CCS also frequently arose:
“I suppose a lot of it is, do you trust geologists? Geologists are good enough to find these oil
fields and suchlike in the first place, they’ve got the technology to do that, they’ve got the
technology to advise the companies on how to get it out, I reckon I could trust them to put this
stuff in again. These deposits have been down there for countless, millions of years. I can’t see
any reason why we can’t put this stuff back to where it came from.”
“I think they’re good enough for their jobs and they know that the worst-case scenario is that the
carbon that’s captured becomes uncaptured. I think that’s symptomatic about the whole sort of
fear-mongering that goes on in society about these issues. They’re geologists, the issue is not
safety I’m sure.”
“They’re telling you what they’re proposing to do, they’re not telling you what they’ve got in
place in case there’s a leakage.”
A: “We tried asking the question … what would be the problem if this did leak, would it affect
people’s health? But [the expert] never really gave us an answer.”
B: “The answer was that it won’t leak.”
A: “They don’t know.”
“She couldnae answer the second question. If she is an expert in her field she should be able to
answer it properly.”
“They’re presuming the effects in 1000 years time … how do they know that? It’s all hear say you
know.”

40
9.7 Certainty and Uncertainty A very common theme throughout the day was that the uncertainties surrounding CCS were large and
some way from being resolved. There was general anxiety regarding the extent of uncertainty and the
‘fledging’ state of the CCS technology. Some responded to this uncertainty by arguing that it justified
more work on CCS.
A: “It’s difficult to give an informed opinion without all the information.
B: I agree with that. I’d also like to say that I am pleased that there are people working on the
solutions.”
The participants responded differently to the uncertainty that arose, with some using uncertainty to justify
their reservations towards CCS, and others tending to accept uncertainty as a ‘fact of life’.
“Seems like a lot of conjecture ….and buts, etc.”
“Lots of ‘ifs’ and ‘buts’, but if it can be done properly, then why not?’
“They do have the scientific models don’t they? But we’ve only just started to use this technology
and who knows 1000 years down the line if it turns out their models are wrong?”
“There are too many uncertain questions for me to make a decision. I’m leaning towards ‘no’
because there are so many questions that an expert in the field was unable to answer. There’s
probably not enough known about this.”
Another response to uncertainty appeared to be a request for better and more simply and clearly
communicated information.
“Education and transparency are key and the fact that none of us knew about it [CCS] before we
walked into the room seems a bit strange …. And it does have this massive potential.”
9.8 Emotion Emotions came into many participants’ discussions, and gave an insight into what in particular it was
about certain technologies or outcomes that most concerned them. Emotions were not only used to justify
action to reduce carbon emissions, but also as a way of conveying scepticism or cynicism. Although
emotive judgments were made on many aspects covered in the process, it is worth taking seriously the role
that emotions themselves play in discussion.
One of the key areas in which emotions bubbled to the surface was in imagining future scenarios. Some
participants expressed more hopeful feelings that energy and emissions targets could be met, with others
also expressing pride and satisfaction that Scotland itself was projected to be able to meet those targets.
On the other hand, others expressed despair or fear at what the future would hold.
“We were happy that the government, the Scottish government had said they were going to get x
amount in renewables by 2020, and I thought, we thought that was a positive thing. It looked like
we were actually going to make it, which I’ve never thought before, and if we do make it I’ll be
happy because we’re not pumping out CO2s into the atmosphere.”
41
“Would they rather be looking out onto ice-capped mountains when it’s all mucked up so much
that we have no, you know that global warming has had so much effect on the country that its
knackered anyway, or would you rather have a couple of turbines up on the hill?”
Emotions also seemed to play a role in galvanising people's convictions for not taking immediate action to
mitigate climate change. Feelings of dissatisfaction or outright rage were expressed not only to energy
companies, but also to over-zealous campaigners.
“To be honest, do most people give a s**t about where it actually comes from? It’s the cost of it,
and it’s like, it’s not so much how we’ve got to pay out every month, it’s how much profit they’re
getting at the end of it, so we’re like why should we have to pay one hundred, two hundred pounds
every month, when they’re getting millions every month, that’s what p***es most people off.”
“I hate when people are like trying to promote like a good cause, and they’re like we’re right,
you’re evil for using energy, I hate when they, because at least at uni there are always people with
banners and leaflets saying you’re evil.”
“So many people who are pro, pro, pro climate change and things like that, who drink their own
bath water and, blah, blah, blah, they’re just, you’re just like they’re so completely nuts, they’re
just, if someone was talking like that I’d be like gosh you’re just Green Party crazy and I don’t
want to listen to you, a lot of people turn off.”
9.9 Analogues In discussions over CCS in particular, participants often made analogies to other energy technologies to
find a sort of ‘anchor’ for their developing viewpoints. Participants often did this in order to illustrate
what they saw as technological risks of CCS; to imagine what some of the aesthetic effects of carbon
storage could be; and to contextualise financial or managerial issues that may arise.
As far as technological risks go, the most commonly raised analogues were the Fukushima nuclear event
in Japan and the recent ‘fracking’ episodes in the United States – both of which pertain to the risks
associated with seismic activity. Concerns centred around the seismic effects of putting carbon in to the
ground, and around the perceived danger of seismic effects causing carbon to come back out of the
ground. Although many participants freely admitted to having very little knowledge of CCS, they made
reference to these other technologies to illustrate what they thought could go wrong.
“I’m an idiot, what’s this going to do to tectonic plates? And is it really going to stay there? And
what are the knock-on effects that we haven’t heard of, because like fracking is a big thing in the
States, okay initially it was safe but now they’re starting to realise, you know.”
With regard to the aesthetic effects and potential objections to uncertain technologies, wind farms were
almost exclusively used as the analogues. Indeed, participants used their own embodied experience of
wind farms to show what they saw as the disparities that can occur between perception and reality, and
also to demonstrate the ways in which energy issues are getting ‘closer to home’.
“I think they’re perceived negative aspects as well, because like not everybody thinks they’re
horrible, I’ve camped quite close to a wind farm and there was no noise at all, we were pretty
close!”

42
“We were talking about where wind farms will be located. There will become a point where they
will be more and more required, there will come a point where these things will end up being in
your back garden. We’re all saying yes just now because we’re in the central belt, we’re all quite
happy just now, but soon there will be a lot of people’s going to be affected by it.”
Finally, analogues were also used to illustrate participants’ points more broadly about behaviour change
and decarbonisation. Participants tended to use familiar domestic processes to represent some of the
behaviour change and technological challenges that they saw as lying ahead in terms of the costs of
decarbonisation and the incentives on offer.
“What’s going to make us actually make a change. You know, if someone’s building a house, do
they get penalised? Do they get incentives? Who’s making it happen?”
“It’s a huge paradigm shift, in the sense that 20-30 years ago smoking was acceptable and now it
is unacceptable, and we’re going to have to do that with energy.”
“Imagine that if they came out and said you can’t eat meat. I think that 5-a-day is enough
already, I think it’s arbitrary enough. They just plucked 5-a-day, and now everybody knows 5-a-
day and you’ll be fit. To me that’s just ludicrous.”
“Years ago they started telling us to start eating healthily, blah blah blah, start taking your 5-a-
day, this that and the next thing you’ve got to eat more healthily. Now they’re telling us that we’re
living too long.”
“When you’re at the forefront of technology, if you buy the latest iPhone or the latest TV, you’ll
pay through the nose for it, and I think it’s the same with any technology. Like this wave machine
like this Edinburgh company’s developed, it’s been up in Orkney for the last ten years, I’m sure
there’s been millions poured into it.”
9.10 The process Feedback from participants at the end of the workshop was generally very positive. Most participants felt
that they had learned a lot about climate change and energy technologies and found the workshop to be a
worthwhile experience.
However, there was some scepticism as to the purpose of the workshop. Some participants were not sure
why they had been invited to the workshop as they felt that their opinions were of no importance. While
others worried that the process was skewed in favour of CCS.
“My opinion on this I think is kind of worthless, the man on the street’s opinion on climate
change. I know that governments want the man on the street’s opinion, but I don’t now how
worthwhile the man on the street’s opinion is on climate change. We can say our opinion, but then
somebody who actually knows about the issue could just come down and say that ‘this is what it
is’ and we would have to say ‘you know your stuff’.”
“For anything that you’re gonna change you first of all have to know where you are at the
moment. So that would be why they want to know our opinions, even though they are uninformed
in some cases.”
“Maybe they think we know stuff we don’t.”

43
“We are quite sceptical about the whole thing (this workshop), they are spending a lot of money
on us being here and maybe they should have put that into actual renewable energy research.”
“This [day] has been incredibly biased towards CCS. If they are trying to find out our general
views on climate change and control of emissions, it needs to be a more well balanced ..... who is
actually creating this bias? … I’ve got a problem with the government using information from a
company that has a vested interest in it ….”
“Why the emphasis on CCS technology? Is this part of a precursor to the re-emergence of coal-
fired power stations in Scotland?”
“I think it’d have been good if we’d been given a talk on nuclear as well as then we’d be able to
make an informed choice”.

44
10. Key messages from the process At the end of the workshop table facilitators summarised key messages, which represented the voice and
opinions of the participants at each table. These were the issues that arose as part of the small group
deliberative process and were subsequently compiled and distilled into key outcomes by the lead
facilitator. These key outcomes were presented to the workshop group as a whole and participants were
collectively satisfied that these were representative of the key messages of their group as a whole. The
following outlines the key messages that emerged from this process:

45
11. Conclusions
The large group process workshop was the first of its kind in the UK. The workshop involved 99 members
of the Edinburgh and Lothian region’s population in a full day discussion of climate change and energy
technologies. The workshop provided a wealth of data that is very illuminating of the views of the general
public on these topics.
While most participants recognised that climate change was happening, some participants believed that it
was naturally occurring rather than being an anthropogenic phenomenon. There was also some scepticism
that decarbonisation would lead to a reduction in climatic changes. This lack of belief and understanding
of the impact of anthropogenic carbon dioxide emissions on the climate, potentially presents a difficulty
for those advocating CCS. The lack of understanding can possibly be mitigated by improved
communication of climate science, however, recognising that some people are unlikely to accept the
anthropogenic climate change narrative, other rationales for renewables and low carbon technologies like
CCS need to be articulated. These rationales could touch on areas like energy security, enhanced oil
recovery and economic stimulation. It cannot be assumed that a single rationale driven by scientific
consensus will succeed in influencing stated public opinions and behaviours, at least not universally across
all sections of the public.
There was a lot of discussion during the workshop about who was responsible, both for causing and for
mitigating climate change. Some participants felt that individuals were responsible, while others believed
that the responsibility lay with governments and industry. There was also debate about whether developed
or developing countries were most responsible. For example, some participants thought that the
increasing use of carbon-intensive energy technologies in other parts of the world was more than off-
setting any carbon reduction in Scotland, though others argued that it was right that Scotland was ‘leading
the way’.
These differing conceptions of responsibility influence people’s support for energy technologies. It would
seem to be important to discuss the issue of responsibility with the public more fully, as the belief that
others are responsible could be a barrier to public support. In addition, it may be necessary to develop
new ways of engendering a sense of shared responsibility or to find ways of working around these
different ideas of responsibility. It is also important to take into account peoples’ sense of ‘agency’ – that
is their capability to act on information. The ability to ‘be environmental’ is not uniform and the reasons
for this heterogeneity need to be better understood if positive change is to occur.
During the workshop, participants were asked to consider their preference for a dozen energy
technologies. This is a strength of the methodology, as participants were able to consider the pros and
cons of each technology in relation to each other, rather than looking at the technologies in isolation. It
also highlights the need to provide balanced information on each technology option. It is clear that when
engaging the public on CCS, it is necessary to carefully frame the information within the wider context of
the full range of available energy technologies. This is particularly true as the sense that the public are
being ‘sold’ a particular option can easily create resistance towards that option.
The most important factor in determining whether participants supported a technology or not, were the
perceived costs (including risks) and benefits of the technology. The costs and benefits could be felt
individually, locally, nationally or globally. For most participants the costs and benefits were seen in
economic terms, though social and environmental issues were also considered. It is therefore important to
give the public sufficient information of each technology to allow them to determine the costs, benefits,
risks and opportunities for themselves. It should be noted that the definition and presentation of costs in
this area is complex and comparing ‘like with like’ is fraught with difficulty. Research on improving the
46
presentation of information on the costs of competing low-carbon technologies is an important area for
future work.
Trust was a very important issue for the participants, some of whom expressed deep levels of distrust in
energy companies. Suspicion of government, industry, the media and scientists was also expressed during
the workshop by some participants. It is clear that public support for an energy project or technology is
very much linked to the trust that the public has in the organisations and institutions that are developing
and promoting it – and sometimes even in individuals such as politicians. Developers therefore need to
think very carefully about how they engage the public to ensure that they can build up levels of trust and
should consider early engagement wherever possible.
The large group process was a very effective way of engaging members of the Scottish public in issues of
climate change and energy provision. The workshop was highly successful at providing information,
increasing participant knowledge and stimulating debate on the issues. Given the reaction of the
participants to CCS, it should be questioned whether the large group process is an effective way of
building public support for CCS. In future work there needs to be a focus on how to present all possible
options in realistic and accurate terms, including presenting uncertain information on costs, benefits and
risks, possibly through use of different future scenarios that help to provide a clear context for considering
all the options.

47
References Ashworth, P., Quezada, G., Van Kasteren, Y., Boughen, N., Paxton, G., Carr-Cornish, S. & Booth, C.
(2009) Perceptions of low emission energy technologies: Results from an Adelaide large group
workshop. CSIRO, Kenmore Qld, Australia.
Ashworth, P. & Gardner, J. (2006) Final Report: Understanding and incorporating stakeholder
perspectives to low emission technologies in New South Wales. Pullenvale: Centre for Low
Emission Technology.
Ashworth, P., Pisarski, A., and Littleboy A. (2006) Final Report: Understanding and incorporating
stakeholder perspectives to low emission technologies in Queensland. 2006 Pullenvale: Centre for
Low Emission Technology.
IPCC ( 2007) Climate Change 2007: The Physical Science Basis. Contribution of Working Group I to the
Fourth Assessment Report of the Intergovernmental Panel on Climate Change [Solomon, S., D.
Qin, M. Manning, Z. Chen, M. Marquis, K.B. Averyt, M.Tignor and H.L. Miller (eds.)].
Cambridge University Press, Cambridge, United Kingdom and New York, NY, USA.
Marks, L. et al. (2004) Designing Food Supply Chains to Enhance Public Acceptance of Agricultural
Biotechnology: Understanding the Consumer. Final Report of the IMBA project. University of
Missouri.
Moon, W. & Balasubramanian, S.K. (2003) Willingness to pay for non-biotech foods in the U.S. and U.K.
Journal of Consumer Affairs, 37(2), 317-339.
Pachauri, R.K., Reisinger, A. eds. (2007) Climate change 2007: Synthesis report: Contribution of Working
Groups I, II and III to the Fourth assessment report of the Intergovernmental Panel on Climate
Change. Geneva, 104 p.
Slovic, P. (1993) Perceived risk, trust and democracy. Risk Analysis, 13(6), 675-682.

48
Appendix A - Pre-workshop, Process, and Post- workshop questionnaires
PRE-WORKSHOP QUESTIONNAIRE
This questionnaire will assess some of your perspectives toward climate change and energy. The
responses you provide form part of a larger research project into the Scottish public’s perspectives on
these issues. This questionnaire should take approximately 20 minutes of your time.
Your participation is greatly appreciated.
SECTION 1: IDENTITY CODE
To help us analyse your responses, we need to be able to link your responses to other questionnaires
you may complete for us later on. To do this, while keeping your responses anonymous, we will ask you
to form an anonymous identity code and record your table number.
Please form an identity code by following these instructions: In the space below list the first two
letters of your mother’s or guardian’s first name (e.g. Mary becomes MA) followed by the date and
month of your birthday (e.g. if you were born on the 2nd April you would write 0204). So this example
ID Code becomes MA0204.
PLEASE PRINT YOUR ID CODE HERE: ____ ____ ____ ____ ____ ____
PLEASE PRINT YOUR TABLE NUMBER HERE: ____

49
SECTION 2: BELIEFS & VALUES
This section is designed to measure the beliefs and values you hold in relation to the environment and society.
QUESTION 1: BELIEFS ABOUT THE ENVIRONMENT
Listed below are statements about the relationship between humans and the environment. For each one, please complete the following by circling the number that most closely matches your opinion.
How strongly do you agree or disagree with the following statements?
Strongly
Disagree
Unsure
(4)
Strongly
Agree
We are approaching the limit of the number of people the earth can support
1 2 3 4 5 6 7
Humans have the right to modify the natural environment to suit their needs
1 2 3 4 5 6 7
When humans interfere with nature it often produces disastrous consequences
1 2 3 4 5 6 7
Human ingenuity will make sure that we do NOT make the earth unliveable
1 2 3 4 5 6 7
Humans are severely abusing the environment 1 2 3 4 5 6 7
The earth has plenty of natural resources if we just learn how to develop them
1 2 3 4 5 6 7
Plants and animals have as much right as humans to exist 1 2 3 4 5 6 7
The balance of nature is strong enough to cope with the impacts of modern industrial nations
1 2 3 4 5 6 7
Despite all our special abilities humans are still subject to
the laws of nature 1 2 3 4 5 6 7
The so-called “ecological crisis” facing humankind has been greatly exaggerated
1 2 3 4 5 6 7
The earth is like a spaceship with very limited room and resources
1 2 3 4 5 6 7
Humans were meant to rule over the rest of nature 1 2 3 4 5 6 7
The balance of nature is very delicate and easily upset 1 2 3 4 5 6 7
Humans will eventually learn enough about how nature works to be able to control it
1 2 3 4 5 6 7
If things continue on their present course, we will soon experience a major ecological catastrophe
1 2 3 4 5 6 7
QUESTION 2: ENVIRONMENTAL POSITION
How strongly do you agree or disagree with the following statements?
Strongly disagree
Unsure
Strongly agree
I think of myself as an environmentally-conscious person 1 2 3 4 5 6 7
I am the type of person who engages in environmentally-
friendly behaviours 1 2 3 4 5 6 7
QUESTION 3: ENVIRONMENTAL GROUP MEMBERSHIP
The following questions relate to membership in environmental groups
Are you currently a member of an environmental group, either as a voluntary member or as a financially-subscribed member?
YES NO (please go to Question 4)
How many environmental groups do you belong to? ________________
Please write the names of the environmental groups you belong to:
____________________________________

50
SECTION 3: AWARENESS & KNOWLEDGE
This section is designed to measure your awareness and knowledge of climate change, energy sources and
related technologies, and other related issues.
QUESTION 4: AWARENESS OF CLIMATE CHANGE AND RELATED ISSUES
QUESTION 5: AWARENESS OF ENERGY SOURCES AND RELATED TECHNOLOGIES
QUESTION 6: KNOWLEDGE OF CLIMATE CHANGE AND RELATED ISSUES
Please complete the following by circling the number that most closely matches your knowledge of the following
topics.
How would you rate your knowledge of the following? No
knowledge
Moderate
knowledge
High knowledge
Climate change 1 2 3 4 5 6 7
Greenhouse gas emissions 1 2 3 4 5 6 7
Government initiatives to reduce greenhouse gas emissions 1 2 3 4 5 6 7
Electricity conservation in the home 1 2 3 4 5 6 7
Industry initiatives to reduce greenhouse gas emissions 1 2 3 4 5 6 7
Electricity conservation in the workplace 1 2 3 4 5 6 7
The relationship between the price of electricity and greenhouse gas emissions
1 2 3 4 5 6 7
Please circle “yes” or “no” to indicate whether you are aware of the following topics:
Climate change YES NO
Greenhouse gas emissions YES NO
Government initiatives to reduce greenhouse gas emissions YES NO
Electricity conservation in the home YES NO
Industry initiatives to reduce greenhouse gas emissions YES NO
Electricity conservation in the workplace YES NO
The relationship between the price of electricity and greenhouse gas emissions YES NO
Please circle “yes” or “no” to indicate whether you are aware of the following energy sources/technologies:
Wind YES NO
Carbon Capture and Storage (CCS) YES NO
Nuclear YES NO
Hydro-electric YES NO
Coal fired (traditional/current methods) YES NO
Natural Gas YES NO
Geothermal (hot rocks) YES NO
Solar YES NO
Biofuels YES NO
Oil YES NO
Wave/tidal YES NO
Coal seam gas YES NO

51
QUESTION 7: KNOWLEDGE OF ENERGY SOURCES AND RELATED TECHNOLOGIES
Please complete the following by circling the number that most closely matches your knowledge of the following
topics.
How would you rate your knowledge of the following energy sources/technologies?
No knowledge
Moderate
knowledge
High
knowledge
Wind 1 2 3 4 5 6 7
Carbon Capture and Storage (CCS) 1 2 3 4 5 6 7
Nuclear 1 2 3 4 5 6 7
Hydro-electric 1 2 3 4 5 6 7
Coal (traditional/current) 1 2 3 4 5 6 7
Natural Gas 1 2 3 4 5 6 7
Geothermal (hot rocks) 1 2 3 4 5 6 7
Solar 1 2 3 4 5 6 7
Biofuels 1 2 3 4 5 6 7
Oil 1 2 3 4 5 6 7
Wave/tidal 1 2 3 4 5 6 7
Coal seam gas 1 2 3 4 5 6 7
QUESTION 8: KNOWLEDGE OF CLIMATE CHANGE, ENERGY SOURCES AND RELATED TECHNOLOGIES
Listed below are some statements about energy and the environment. Please indicate whether you think each
statement is true or false.
Is each of the following statements true or false?
Once the infrastructure is in place, carbon capture and storage will reduce emissions from coal-fired power at no additional costs, other than maintenance
True False Don’t know
Climate change can completely be explained through natural variability in climatic cycles
True False Don’t know
The greenhouse effect is caused by a hole in the earth’s atmosphere True False Don’t know
Generating electricity from renewable energy costs less than generating electricity from coal
True False Don’t know
Embodied energy is the energy used to produce and transport the goods and services we buy
True False Don’t know
Scotland uses less water per person than any other country in Europe (including industrial, agricultural, and domestic water use)
True False Don’t know
About half of Scotland’s carbon emissions come from electricity generation True False Don’t know
Recycling paper, cardboard, metals, and glass saves on materials, but does not help in saving water, energy, or fuel
True False Don’t know

52
SECTION 4: ATTITUDES
This section is designed to measure your opinions toward climate change, energy sources and related
technologies and other related issues.
QUESTION 9: ATTITUDES TOWARD CLIMATE CHANGE AND RELATED ISSUES
Please complete the following by circling the number that most closely matches your opinion.
How strongly do you agree with the following? Strongly
Disagree
Unsure
(4)
Strongly
Agree
Climate change is an important issue for Scotland 1 2 3 4 5 6 7
The production of electricity is a major contributor to greenhouse gas emissions
1 2 3 4 5 6 7
Industry should be doing more to reduce greenhouse gas emissions
1 2 3 4 5 6 7
People should be doing more to promote electricity conservation in the home
1 2 3 4 5 6 7
Government should be doing more to reduce greenhouse gas emissions
1 2 3 4 5 6 7
People should be doing more to promote electricity conservation in the workplace
1 2 3 4 5 6 7
Increasing the price of electricity to help reduce greenhouse gas emissions
1 2 3 4 5 6 7
QUESTION 10: ATTITUDES TOWARD ENERGY SOURCES AND RELATED TECHNOLOGIES
Please complete the following by circling the number that most closely matches your opinion.
How strongly do you agree with the use of the following energy sources/technologies?
Strongly
Disagree
Unsure
(4)
Strongly
Agree
Wind 1 2 3 4 5 6 7
Carbon Capture and Storage (CCS) 1 2 3 4 5 6 7
Nuclear 1 2 3 4 5 6 7
Hydro-electric 1 2 3 4 5 6 7
Coal (traditional/current methods) 1 2 3 4 5 6 7
Natural Gas 1 2 3 4 5 6 7
Geothermal (hot rocks) 1 2 3 4 5 6 7
Solar 1 2 3 4 5 6 7
Biofuels 1 2 3 4 5 6 7
Oil 1 2 3 4 5 6 7
Wave/tidal 1 2 3 4 5 6 7
Coal seam gas 1 2 3 4 5 6 7

53
QUESTION 11: PRIORITY RANKING OF ENERGY SOURCES AND RELATED TECHNOLOGIES
Please rank the following energy sources and related technologies in the priority order that you would use to
allocate public funds toward their development and implementation. Your priority order should be written next
to the energy sources below, in the order of 1 (one) for the highest priority, through to 12 (twelve) for the lowest
priority. Note you should use each number between 1 and 12 only once.
Energy sources and related technologies Funding
Priority Order
Wind
Carbon Capture and Storage (CCS)
Nuclear
Hydro-electric
Coal (traditional/current methods)
Natural Gas
Geothermal (hot rocks)
Solar
Biofuels
Oil
Wave/tidal
Coal seam gas
QUESTION 12: IMPORTANT OTHERS
Please indicate whether you think people who are important to you (e.g., family, friends, colleagues) would approve or disapprove of you supporting the use of the following categories of energy sources and related technologies
Disapprove Neither approve nor disapprove
(4)
Approve
If I supported the use of traditional coal-fired or oil-based energy, most people who are important to me would…..
1 2 3 4 5 6 7
If I supported the use of renewable energy (e.g., wind, wave/tidal, solar), most people who are important to me would…
1 2 3 4 5 6 7
If I supported the use of low-emission fossil-fuel based energy (e.g., gas or coal with CCS technology), most people who are important to me would…..
1 2 3 4 5 6 7
If I supported the use of low-emission nuclear energy, most people who are important to me would…..
1 2 3 4 5 6 7

54
SECTION 5: INTENDED BEHAVIOUR
This section is designed to measure various aspects of your intentions.
QUESTION 13: WILLINGNESS TO PAY MORE FOR ELECTRICITY
Would you be willing to pay more for your household electricity if it reduced greenhouse gas emissions? Please tick “no” or “yes” to indicate your opinion:
No (Go to Question 14)
Yes (Continue below)
If you answered yes, which of the following best describes how much more you would be willing to pay for your household electricity if it reduced greenhouse gas emissions? (Please tick only one box.)
I would pay less than £25 per quarter.
Please specify the amount more per quarter in pounds: £______
I would pay up to £25 more per quarter (about £2 per week)
I would pay up to £50 more per quarter (about £4 per week)
I would pay up to £75 more per quarter (about £6 per week)
I would pay up to £100 more per quarter (about £8 per week)
I would pay up to £150 more per quarter (about £12 per week)
I would pay more than £151 more per quarter.
Please specify the amount more per quarter in pounds: £_____

55
SECTION 6: CURRENT BEHAVIOUR
This section is designed to measure various aspects of your current behaviour.
QUESTION 14: BEHAVIOURS
Listed below are some specific behaviours that relate to the environment. Please circle “yes” or “no” to indicate
whether you do each of the following:
QUESTION 15: GREENPOWER
Please indicate what percentage of lower-emission electricity you subscribe to (e.g., "GreenPower")? (Please tick only
one box).
0% – I do not subscribe to
GreenPower 1 – 10% 11 – 20% 21 – 40% 41 – 60% 61 – 80% 81 – 100% Don’t know
Please circle “yes” or “no” for each statement below: YES NO
I recycle my rubbish (e.g. cans, bottles, newspapers) YES NO
I consider energy efficiency ratings when purchasing white goods YES NO
I use reusable bags when shopping YES NO
I have a solar hot water system in my home YES NO
I use energy efficient light bulbs YES NO
I conserve my use of electricity in the home YES NO
I conserve my use of electricity in the workplace YES NO

56
SECTION 7: INFORMATION ACCESS
This section is designed to identify the information sources you access.
QUESTION 16: TRUST IN INFORMATION SOURCES
Please complete the following by circling the number that most closely matches how much trust you hold in
information or news from the following sources.
How much do you trust the following information sources? Distrust a lot
Unsure
(4)
Trust a lot
Family and friends 1 2 3 4 5 6 7
Internet blogsites 1 2 3 4 5 6 7
Internet sites 1 2 3 4 5 6 7
Television news and current affairs programs 1 2 3 4 5 6 7
Radio 1 2 3 4 5 6 7
Newspapers 1 2 3 4 5 6 7
Magazines 1 2 3 4 5 6 7
Newsletters or flyers from interest groups 1 2 3 4 5 6 7
Environmental organisations 1 2 3 4 5 6 7
Books 1 2 3 4 5 6 7
Academic articles 1 2 3 4 5 6 7
My local council 1 2 3 4 5 6 7
Government correspondence e.g. mail outs 1 2 3 4 5 6 7
Universities and research institutes 1 2 3 4 5 6 7
Doctors 1 2 3 4 5 6 7
Industry 1 2 3 4 5 6 7

57
SECTION 8: DEMOGRAPHICS
These final questions are designed to help us summarise the types of people who respond to this survey.
QUESTIONS ABOUT YOUR HOUSEHOLD QUESTION 17: HOUSEHOLD SIZE How many people (including yourself) live in your household? ____________________
QUESTION 18: HOUSEHOLD TYPE Which of the following best describes your household? (Please tick one only.)
Group household Couple with no children
Single person household Couple with children
One parent with children Other family (e.g. extended family household).
QUESTION 19: HOUSEHOLD INCOME
What is your household’s total income per year (before tax)? (Please tick one only.)
Less than £10 000
£50 000 - £59 999
£100 000 - £124 999
£10 000 - £19 999
£60 000 - £69 999
£125 000 - £149 999
£20 000 - £29 999
£70 000 - £79 999
£150 000 - £199 999
£30 000 - £39 999
£80 000 - £89 999
£200 000 - £249 999
£40 000 - £49 999
£90 000 - £99 999
£250 000 or more
QUESTION 20: LOCATION What is the postcode of your home address? ___________________
QUESTION 21: CURRENT ENERGY USAGE How much was your last electricity bill? £ ______________________
How often do you pay your electricity bill? (Please tick one only.)
Monthly
Half-yearly
Other (please specify ____________ )
Quarterly
Annually

58
QUESTIONS ABOUT YOU
QUESTION 22: AGE What is your age (in years)? ___________________________________
QUESTION 23: GENDER
What is your gender? (Please tick one only.)
Male
Female
QUESTION 24: EDUCATION
What is the highest level of education you have completed? (Please tick one only.)
Primary School
Trade certificate/apprenticeship
Secondary School – no qualifications
Diploma
Secondary School – GCSE/Standard grade
Bachelor/honours degree
Secondary School – AS level/Highers
Postgraduate degree
Secondary School – A level/Advanced Highers
QUESTION 25: EMPLOYMENT
Which term below best describes you? (Please tick one only.)
Employed full time
Retired/pension recipient
Employed part time or casual
Home duties
Self employed
Full-time student
Unemployed
Part-time student
QUESTION 26: OCCUPATION
If you are currently in paid employment, which term below best describes you? (Please tick one only.)
Manager
Sales worker
Professional
Machinery operator/driver
Technician/trade worker
Labourer
Community/personal service worker
Not in paid employment
Clerical/administrative worker
Other (please specify) ____________
THANK YOU FOR YOUR PARTICIPATION IN THIS SURVEY

59
PROCESS QUESTIONNAIRE
This questionnaire will assess some of your perspectives toward the workshop and the group of people
you are working in. The responses you provide form part of a larger research project into the Scottish
public’s perspectives on these issues and help us to evaluate the effectiveness of the process. This
questionnaire should take approximately 10 minutes of your time.
Your participation is greatly appreciated.
SECTION 1: IDENTITY CODE
To help us analyse your responses, we need to be able to link your responses to the questionnaire you
completed earlier. To do this, on the earlier questionnaire we asked you to form an anonymous identity
code, by listing the first two letters of your mother’s or guardian’s first name (e.g. Mary becomes
MA) followed by the date and month of your birthday (e.g. if you were born on the 2nd April you
would write 0204). For this example, the ID Code becomes MA0204. Below, please write in your own
identity code (it should be the same as the code you wrote on the Pre-Workshop Questionnaire).
PLEASE PRINT YOUR ID CODE HERE: ____ ____ ____ ____ ____ ____
PLEASE PRINT YOUR TABLE NUMBER HERE: ____
SECTION 2: DEMOGRAPHICS
To ensure our records are correct we would like you to enter some information about yourself. QUESTION 1: AGE What is your age (in years)? ___________________________________
QUESTION 2: GENDER What is your gender? (Please tick one only.)
Male
Female
QUESTION 3: LOCATION What is the postcode of your home address? _____________________

60
SECTION 3: PERCEPTIONS OF THE PEOPLE AT YOUR TABLE
This section is designed to measure your perceptions of the group of people at your table.
QUESTION 4: IDENTIFICATION WITH THE GROUP OF PEOPLE AT YOUR TABLE Please select the pair of circles that you feel best represents how much you identify with the group of people at your table. Please note that S=self and G=group of people at your table.
QUESTION 5: FEELINGS ABOUT THE GROUP OF PEOPLE AT YOUR TABLE
Please respond to the following statements regarding the group of people at your table.
How strongly do you agree with the following? Strongly
Disagree
Unsure
(4)
Strongly
Agree
I am glad to be part of the group at this table 1 2 3 4 5 6 7
It is pleasant to be in this group at this table 1 2 3 4 5 6 7
Being in this group gives me a good feeling 1 2 3 4 5 6 7
I feel that I belong to this group 1 2 3 4 5 6 7
I am happy to be part of this group 1 2 3 4 5 6 7
I see myself as part of this group 1 2 3 4 5 6 7
I believe I contributed important ideas to group discussions
1 2 3 4 5 6 7
I believe I had a lot of input in group discussions 1 2 3 4 5 6 7
We are a closely knit group 1 2 3 4 5 6 7
Our group works well together 1 2 3 4 5 6 7
This group engaged in effective discussion 1 2 3 4 5 6 7
This group allows for group members to express
themselves 1 2 3 4 5 6 7

61
SECTION 4: PERCEPTIONS OF THE PEOPLE IN THE LARGER WORKSHOP
This section is designed to measure your perceptions of the group of people in the larger workshop.
QUESTION 6: IDENTIFICATION WITH PEOPLE IN THE LARGER WORKSHOP Please select the pair of circles that you feel best represents how much you identify with the group of people in the larger workshop. Please note that S=self and G=group of people in the larger workshop.
QUESTION 7: FEELINGS ABOUT THE GROUP OF PEOPLE IN THE LARGER WORKSHOP
Please respond to the following statements regarding the group of people in the larger workshop.
How strongly do you agree with the following? Strongly
Disagree
Unsure
(4)
Strongly
Agree
I am glad to be part of this workshop group 1 2 3 4 5 6 7
It is pleasant to be in this workshop group 1 2 3 4 5 6 7
Being in this workshop group gives me a good feeling 1 2 3 4 5 6 7

62
SECTION 5: PERCEPTIONS OF THE EXPERTS AND THE WORKSHOP INFORMATION
This section is designed to measure your perceptions of the experts and information provided in the
workshop.
QUESTION 8: TRUST IN THE WORKSHOP INFORMATION
Not at all
Moderate
(4)
Very much
To what extent do you trust the information provided in the workshop?
1 2 3 4 5 6 7
QUESTION 9: TRUST IN EXPERT WHO SPOKE ABOUT CLIMATE CHANGE AND ENERGY TECHNOLOGIES
(DR ANDY KERR)
Please consider the expert who spoke about climate change and low emission technologies when answering the following:
Not at all
Moderate
(4)
Very much
To what extent do you consider this expert to be trustworthy?
1 2 3 4 5 6 7
To what extent do you trust the information provided by
this expert? 1 2 3 4 5 6 7
To what extent do you consider this expert to be honest? 1 2 3 4 5 6 7
To what extent do you think that this expert speaks the truth?
1 2 3 4 5 6 7
Completely disagree
Neutral
(4)
Completely agree
This expert has a lot of knowledge about climate change and low emission technologies
1 2 3 4 5 6 7
This expert was able to demonstrate relevant knowledge 1 2 3 4 5 6 7
QUESTION 10: TRUST IN EXPERT WHO SPOKE ABOUT CARBON CAPTURE AND STORAGE (CCS)
(DR MAXINE AKHURST) 4: ATTITUDES
Please consider the expert who spoke about carbon capture and storage when answering the following:
Not at all
Moderate
(4)
Very much
To what extent do you consider this expert to be
trustworthy? 1 2 3 4 5 6 7
To what extent do you trust the information provided by this expert?
1 2 3 4 5 6 7
To what extent do you consider this expert to be honest? 1 2 3 4 5 6 7
To what extent do you think that this expert speaks the truth?
1 2 3 4 5 6 7
Completely disagree
Neutral
(4)
Completely agree
This expert has a lot of knowledge about Carbon Capture and Storage (CCS)
1 2 3 4 5 6 7
This expert was able to demonstrate relevant knowledge 1 2 3 4 5 6 7

63
SECTION 6: ATTITUDES
This section is designed to measure your opinions toward climate change, energy sources and related
technologies and other related issues.
QUESTION 11: ATTITUDES TOWARD CLIMATE CHANGE AND RELATED ISSUES
Please complete the following by circling the number that most closely matches your opinion.
How strongly do you agree with the following? Strongly
Disagree
Unsure
(4)
Strongly
Agree
Climate change is an important issue for Scotland 1 2 3 4 5 6 7
The production of electricity is a major contributor to greenhouse gas emissions
1 2 3 4 5 6 7
Industry should be doing more to reduce greenhouse gas emissions
1 2 3 4 5 6 7
People should be doing more to promote electricity conservation in the home
1 2 3 4 5 6 7
Government should be doing more to reduce greenhouse gas emissions
1 2 3 4 5 6 7
People should be doing more to promote electricity conservation in the workplace
1 2 3 4 5 6 7
Increasing the price of electricity to help reduce greenhouse gas emissions
1 2 3 4 5 6 7
QUESTION 12: ATTITUDES TOWARD ENERGY SOURCES AND RELATED TECHNOLOGIES
Please complete the following by circling the number that most closely matches your opinion.
How strongly do you support the use of the following energy sources/technologies?
Strongly
Disagree
Unsure
(4)
Strongly
Agree
Wind 1 2 3 4 5 6 7
Carbon Capture and Storage (CCS) 1 2 3 4 5 6 7
Nuclear 1 2 3 4 5 6 7
Hydro-electric 1 2 3 4 5 6 7
Coal (Traditional/current methods) 1 2 3 4 5 6 7
Natural Gas 1 2 3 4 5 6 7
Geothermal (hot rocks) 1 2 3 4 5 6 7
Solar 1 2 3 4 5 6 7
Biofuels 1 2 3 4 5 6 7
Oil 1 2 3 4 5 6 7
Wave/tidal 1 2 3 4 5 6 7
Coal seam gas 1 2 3 4 5 6 7
THANK YOU FOR YOUR PARTICIPATION IN THIS SURVEY

64
POST-WORKSHOP QUESTIONNAIRE
This questionnaire will assess some of your perspectives toward climate change and energy. The
responses you provide form part of a larger research project into the Scottish public’s perspectives on
these issues. This questionnaire should take approximately 20 minutes of your time.
Your participation is greatly appreciated.
SECTION 1: IDENTITY CODE
To help us analyse your responses, we need to be able to link your responses to the questionnaire you
completed earlier. To do this, on the earlier questionnaire we asked you to form an anonymous identity
code, by listing the first two letters of your mother’s or guardian’s first name (e.g. Mary becomes
MA) followed by the date and month of your birthday (e.g. if you were born on the 2nd April you
would write 0204). For this example, the ID Code becomes MA0204. Below, please write in your own
identity code (it should be the same as the code you wrote on the Pre-Workshop Questionnaire).
PLEASE PRINT YOUR ID CODE HERE: ____ ____ ____ ____ ____ ____
PLEASE PRINT YOUR TABLE NUMBER HERE: ____
SECTION 2: DEMOGRAPHICS
To ensure our records are correct we would like you to enter some information about yourself. QUESTION 1: AGE What is your age (in years)? ___________________________________
QUESTION 2: GENDER What is your gender? (Please tick one only.)
Male
Female
QUESTION 3: LOCATION What is the postcode of your home address? _____________________

65
SECTION 3: KNOWLEDGE
This section is designed to measure your knowledge of climate change, energy sources and related
technologies, and other related issues.
QUESTION 4: KNOWLEDGE OF CLIMATE CHANGE AND RELATED ISSUES
Please complete the following by circling the number that most closely matches your knowledge of the following
topics.
How would you rate your knowledge of the following? No knowledge
Moderate
knowledge
High knowledge
Climate change 1 2 3 4 5 6 7
Greenhouse gas emissions 1 2 3 4 5 6 7
Government initiatives to reduce greenhouse gas emissions 1 2 3 4 5 6 7
Electricity conservation in the home 1 2 3 4 5 6 7
Industry initiatives to reduce greenhouse gas emissions 1 2 3 4 5 6 7
Electricity conservation in the workplace 1 2 3 4 5 6 7
The relationship between the price of electricity and greenhouse gas emissions
1 2 3 4 5 6 7
QUESTION 5: KNOWLEDGE OF ENERGY SOURCES AND RELATED TECHNOLOGIES
Please complete the following by circling the number that most closely matches your knowledge of the following
topics.
How would you rate your knowledge of the following? No knowledge
Moderate
knowledge
High
knowledge
Wind 1 2 3 4 5 6 7
Carbon Capture and Storage (CCS) 1 2 3 4 5 6 7
Nuclear 1 2 3 4 5 6 7
Hydro-electric 1 2 3 4 5 6 7
Coal (traditional/current methods) 1 2 3 4 5 6 7
Natural Gas 1 2 3 4 5 6 7
Geothermal (hot rocks) 1 2 3 4 5 6 7
Solar 1 2 3 4 5 6 7
Biofuels 1 2 3 4 5 6 7
Oil 1 2 3 4 5 6 7
Wave/tidal 1 2 3 4 5 6 7
Coal seam gas 1 2 3 4 5 6 7

66
SECTION 4: ATTITUDES
This section is designed to measure your opinions toward climate change, energy sources and related
technologies, and other related issues.
QUESTION 6: ATTITUDES TOWARD CLIMATE CHANGE AND RELATED ISSUES
Please complete the following by circling the number that most closely matches your opinion.
How strongly do you agree with the following? Strongly
Disagree
Unsure
(4)
Strongly
Agree
Climate change is an important issue for Scotland 1 2 3 4 5 6 7
The production of electricity is a major contributor to greenhouse gas emissions
1 2 3 4 5 6 7
Industry should be doing more to reduce greenhouse gas emissions
1 2 3 4 5 6 7
People should be doing more to promote electricity conservation in the home
1 2 3 4 5 6 7
Government should be doing more to reduce greenhouse gas emissions
1 2 3 4 5 6 7
People should be doing more to promote electricity conservation in the workplace
1 2 3 4 5 6 7
Increasing the price of electricity to help reduce greenhouse gas emissions
1 2 3 4 5 6 7
QUESTION 7: ATTITUDES TOWARD ENERGY SOURCES AND RELATED TECHNOLOGIES
Please complete the following by circling the number that most closely matches your opinion.
How strongly do you support the use of the following energy sources/technologies?
Strongly
Disagree
Unsure
(4)
Strongly
Agree
Wind 1 2 3 4 5 6 7
Carbon Capture and Storage (CCS) 1 2 3 4 5 6 7
Nuclear 1 2 3 4 5 6 7
Hydro-electric 1 2 3 4 5 6 7
Coal (traditional/current methods) 1 2 3 4 5 6 7
Natural Gas 1 2 3 4 5 6 7
Geothermal (hot rocks) 1 2 3 4 5 6 7
Solar 1 2 3 4 5 6 7
Biofuels 1 2 3 4 5 6 7
Oil 1 2 3 4 5 6 7
Wave/tidal 1 2 3 4 5 6 7
Coal seam gas 1 2 3 4 5 6 7

67
QUESTION 8: PRIORITY RANKING OF ENERGY SOURCES AND RELATED TECHNOLOGIES
Please rank the following energy sources and related technologies in the priority order that you would use to
allocate public funds toward their development and implementation. Your priority order should be written next
to the energy sources below. Please follow the order of 1 (one) for the highest priority, through to 12 (twelve)
for the lowest priority. Note you should use each number between 1 and 12 only once.
Energy sources and related technologies Funding
Priority Order
Wind
Carbon Capture and Storage (CCS)
Nuclear
Hydro-electric
Coal (traditional/current methods)
Natural Gas
Geothermal (hot rocks)
Solar
Biofuels
Oil
Wave/tidal
Coal seam gas
SECTION 5: INTENDED BEHAVIOUR
This section is designed to measure various aspects of your intentions.
QUESTION 9: INTENTION TO CHANGE BEHAVIOUR
Listed below are some specific behaviours that relate to the environment. Please complete the following by
circling the number that most closely matches your opinion.
As a result of this workshop I will: Strongly
Disagree
Unsure
(4)
Strongly
Agree
Pay extra for ‘green’ electricity 1 2 3 4 5 6 7
Recycle my rubbish (e.g. cans, bottles, newspapers) 1 2 3 4 5 6 7
Consider energy efficiency ratings when purchasing white goods
1 2 3 4 5 6 7
Use reusable bags when shopping 1 2 3 4 5 6 7
Install a solar hot water system in my home 1 2 3 4 5 6 7
Use energy efficient light bulbs 1 2 3 4 5 6 7
Conserve my use of electricity in the home 1 2 3 4 5 6 7
Conserve my use of electricity in the workplace 1 2 3 4 5 6 7
Continue with my current behaviour as I already practice most of the behaviours above
1 2 3 4 5 6 7

68
QUESTION 10: WILLINGNESS TO PAY MORE FOR ELECTRICITY
Would you be willing to pay more for your household electricity if it reduced greenhouse gas emissions? Please tick “no” or “yes” to indicate your opinion:
No (Go to Question 11)
Yes (Continue below)
If you answered yes, which of the following best describes how much more you would be willing to pay for your household electricity if it reduced greenhouse gas emissions? (Please tick only one box.)
I would pay less than £25 per quarter.
Please specify the amount more per quarter in pounds: £______
I would pay up to £25 more per quarter (about £2 per week)
I would pay up to £50 more per quarter (about £4 per week)
I would pay up to £75 more per quarter (about £6 per week)
I would pay up to £100 more per quarter (about £8 per week)
I would pay up to £150 more per quarter (about £12 per week)
I would pay more than £151 more per quarter.
Please specify the amount more per quarter in pounds: £_____
SECTION 6: PERCEPTIONS OF THE PEOPLE AT YOUR TABLE
This section is designed to measure your perceptions of the group of people at your table.
QUESTION 11: IDENTIFICATION WITH THE GROUP OF PEOPLE AT YOUR TABLE Please select the pair of circles that you feel best represents how much you identify with the group of people at your table. Please note that S=self and G=group of people at your table.

69
QUESTION 12: FEELINGS ABOUT THE GROUP OF PEOPLE AT YOUR TABLE Please respond to the following statements regarding the group of people at your table.
How strongly do you agree with the following? Strongly
Disagree
Unsure
(4)
Strongly
Agree
I am glad to be part of the group at this table 1 2 3 4 5 6 7
It is pleasant to be in this group at this table 1 2 3 4 5 6 7
Being in this group gives me a good feeling 1 2 3 4 5 6 7
I feel that I belong to this group 1 2 3 4 5 6 7
I am happy to be part of this group 1 2 3 4 5 6 7
I see myself as part of this group 1 2 3 4 5 6 7
I believe I contributed important ideas to group discussions
1 2 3 4 5 6 7
I believe I had a lot of input in group discussions 1 2 3 4 5 6 7
We are a closely knit group 1 2 3 4 5 6 7
Our group works well together 1 2 3 4 5 6 7
This group engaged in effective discussion 1 2 3 4 5 6 7
This group allows for group members to express themselves
1 2 3 4 5 6 7
SECTION 7: PERCEPTIONS OF THE PEOPLE IN THE LARGER WORKSHOP
This section is designed to measure your perceptions of the group of people in the larger workshop.
QUESTION 13: IDENTIFICATION WITH PEOPLE IN THE LARGER WORKSHOP Please select the pair of circles that you feel best represents how much you identify with the group of people in the larger workshop. Please note that S=self and G=group of people in the larger workshop.
QUESTION 14: FEELINGS ABOUT THE GROUP OF PEOPLE IN THE LARGER WORKSHOP Please respond to the following statements regarding the group of people in the larger workshop.
How strongly do you agree with the following? Strongly
Disagree
Unsure
(4)
Strongly
Agree
I am glad to be part of this workshop group 1 2 3 4 5 6 7
It is pleasant to be in this workshop group 1 2 3 4 5 6 7
Being in this workshop group gives me a good feeling 1 2 3 4 5 6 7

70
SECTION 8: PERCEPTIONS OF THE WORKSHOP INFORMATION
This section is designed to measure your perceptions of the information provided in the workshop.
QUESTION 15: TRUST IN THE WORKSHOP INFORMATION
Not at all
Moderate
(4)
Very much
To what extent do you trust the information provided in the workshop?
1 2 3 4 5 6 7
SECTION 9: WORKSHOP FAIRNESS
This section is designed to measure your perceptions of the workshop.
QUESTION 16: WORKSHOP FAIRNESS We are interested in how you perceived the workshop process. Please complete the following by circling the number that most closely matches your opinion. To what extent:
Small Extent
Moderate Extent
(4)
Large
Extent
Were you able to express your views and feelings during the workshop? 1 2 3 4 5 6 7
Did you have influence over the outcomes (e.g., summary of key points) of the workshop? 1 2 3 4 5 6 7
Were you able to provide feedback regarding the outcomes arrived at by the workshop? 1 2 3 4 5 6 7
Did the workshop outcomes reflect the effort you put in? 1 2 3 4 5 6 7
Were the workshop outcomes appropriate considering the input you had? 1 2 3 4 5 6 7
Did the workshop outcomes reflect what you contributed? 1 2 3 4 5 6 7
Were you treated in a polite manner? 1 2 3 4 5 6 7 Were you treated with dignity? 1 2 3 4 5 6 7 Were you treated with respect? 1 2 3 4 5 6 7 Was communication in the workshop sincere? 1 2 3 4 5 6 7
Was the workshop process thoroughly explained? 1 2 3 4 5 6 7 Were explanations regarding the workshop process reasonable? 1 2 3 4 5 6 7

71
SECTION 10: WORKSHOP EVALUATION
The questions in this section are designed to identify your perspectives of the workshop. This assists with the continued advancement of our research processes.
QUESTION 17: WORKSHOP ACTIVITIES
Please complete the following by circling the number that most closely matches your opinion.
Was your understanding improved through the following?
Strongly
Disagree
Unsure
(4)
Strongly
Agree
The presentations 1 2 3 4 5 6 7
Being able to ask questions 1 2 3 4 5 6 7
The discussions 1 2 3 4 5 6 7
All of the information and activities 1 2 3 4 5 6 7
QUESTION 18: WORKSHOP FEATURES
Please complete the following by circling the number that most closely matches your opinion.
How strongly do you agree with the following? Strongly
Disagree
Unsure
(4)
Strongly
Agree
The venue was suitable 1 2 3 4 5 6 7
I will read the written information provided 1 2 3 4 5 6 7
The workshop was informative 1 2 3 4 5 6 7
The facilitator of the workshop was easy to understand 1 2 3 4 5 6 7
The length of the workshop was appropriate 1 2 3 4 5 6 7
The food provided was excellent 1 2 3 4 5 6 7
The activities were enjoyable 1 2 3 4 5 6 7
QUESTION 19: PURPOSE OF WORKSHOP
Please complete the following by ticking the box(es) that most closely match your opinions of the purpose of
today’s workshop.
Convince
Inform
Engage
Access my opinions
Influence
Other purposes (please state)______________________________
Consult ________________________________________________________

72
QUESTION 20: FURTHER INFORMATION
Please complete the following by circling the number that most closely matches your opinion.
As a result of this workshop I will: Strongly
Disagree
Unsure
(4)
Strongly
Agree
Seek further information on the topic from books 1 2 3 4 5 6 7
Seek further information on the topic from the Internet 1 2 3 4 5 6 7
Talk to my friends about the workshop 1 2 3 4 5 6 7
Talk to my family about the workshop 1 2 3 4 5 6 7
Talk to my work colleagues about the workshop 1 2 3 4 5 6 7
Speak with other people from the workshop about the information provided 1 2 3 4 5 6 7
QUESTION 21: INFORMATION TOPICS
Please complete the following by ticking the box next to the topic(s) that you would like more information on as
a result of this workshop.
Climate change
Coal (traditional/current methods)
Wind energy
Carbon Capture and Storage
Solar energy
Geothermal (Hot Rocks)
Nuclear energy
Hydro-electricity
Natural Gas
Biofuels
Wave/tidal energy
Other (please state)______________________________________________
Coal seam gas
QUESTION 22: COMMENTS
In the space provided please write any other comments you would like to share with us.
_______________________________________________________________________________________________
_______________________________________________________________________________________________
______________________________________________________________________________________________________________________________________________________________________________________________
_______________________________________________________________________________________________
_______________________________________________________________________________________________
THANK YOU FOR YOUR PARTICIPATION IN THIS SURVEY

73
Appendix B - Statistical tables
Table B.1: Environmental beliefs
How strongly do you agree with the following? ¹ Mean Std. Dev.
We are approaching the limit of the number of people earth can support 4.77 1.70
Humans have the right to modify the natural environment to suit their needs. ²
4.14 1.55
When humans interfere with nature it often produces disastrous consequences.
5.12 1.67
Human ingenuity will make sure that we do NOT make the earth unliveable. ²
4.28 1.45
Humans are severely abusing the environment. 5.32 1.51
The earth has plenty of natural resources if we just learn to develop them. ² 3.21 1.69
Plants and animals have as much right as humans to exit. 6.03 1.41
The balance of nature is strong enough to cope with the impacts of modern industrial nations. ²
5.09 1.49
Despite all our special abilities humans are still subject to the laws of nature.
5.87 1.40
The so-called ecological crisis facing humankind has been greatly exaggerated. ²
4.78 1.61
The earth is like a spaceship with very limited room and resources. 4.82 1.52
Humans were meant to rule over the rest of nature. ² 5.30 1.78
The balance of nature is very delicate and easily upset. 5.37 1.43
Humans will eventually learn enough about how nature works to be able to control it. ²
4.53 1.64
If things continue on their present course we will soon experience a major ecological catastrophe.
5.01 1.56
Average Environmental beliefs³ 4.84 0.73
1: Pro-environmental beliefs were measured on a scale of 1-strongly disagree, 4-unsure, to 7-strongly agree.
2: These items are reversed scored.
3: The 15 items were averaged to form a single measure which ranges from 1- anti-environmental beliefs, 4-unsure,
to 7-pro-environmental beliefs.

74
Table B.2: Environmental behaviours
Circled ‘yes’ Frequency Percentage
I recycle my rubbish (e.g. cans, bottles, newspapers) 81 82.7
I consider energy efficiency ratings when purchasing white goods 70 71.4
I use reusable bags when shopping 85 87.6
I have a solar hot water system in my home 2 2.0
I use energy efficient light bulbs 89 90.8
I conserve my use of electricity in the home 89 90.8
I conserve my use of electricity in the workplace 57 60.0
Table B.3: Knowledge of energy and the environment
Is each of the following statements true or false?
Percentage
True False Don’t
know
Once the infrastructure is in place, carbon capture and storage
will reduce emissions from coal-fired power at no additional
costs, other than maintenance
14.7 10.6 74.7
Climate change can completely be explained through natural
variability in climatic cycles 12.6 50.6 36.8
The greenhouse effect is caused by a hole in the earth’s
atmosphere 45.7 34.1 20.2
Generating electricity from renewable energy costs less than
generating electricity from coal 33.7 25.2 41.1
Embodied energy is the energy used to produce and transport
the goods and services we buy 16.8 1.1 82.1
Scotland uses less water per person than any other country in
Europe (including industrial, agricultural, and domestic water
use)
13.7 20 66.3
About half of Scotland’s carbon emissions come from
electricity generation 21.5 7.5 71
Recycling paper, cardboard, metals, and glass saves on
materials, but does not help in saving water, energy, or fuel 33.7 31.6 34.7
Table B.4: Mean changes in knowledge of climate change and related issues
How would you rate your knowledge of the following?¹ Mean
Pre- Post-
Climate change ² 3.97 5.24
Greenhouse gas emissions ² 3.57 5.1
Government initiatives to reduce greenhouse gas emissions ² 3.06 4.36
Electricity conservation in the home ² 4.49 5.03
Industry initiatives to reduce greenhouse gas emissions ² 2.84 4.24
Electricity conservation in the workplace ² 3.44 4.56
The relationship between the price of electricity and greenhouse gas
emissions ² 2.41 4.19
1: Knowledge was measured as (1) no knowledge, (4) moderate knowledge, (7) high knowledge.
2: Paired t-test (p<0.05) identified differences between responses pre- and post- workshop were significant.
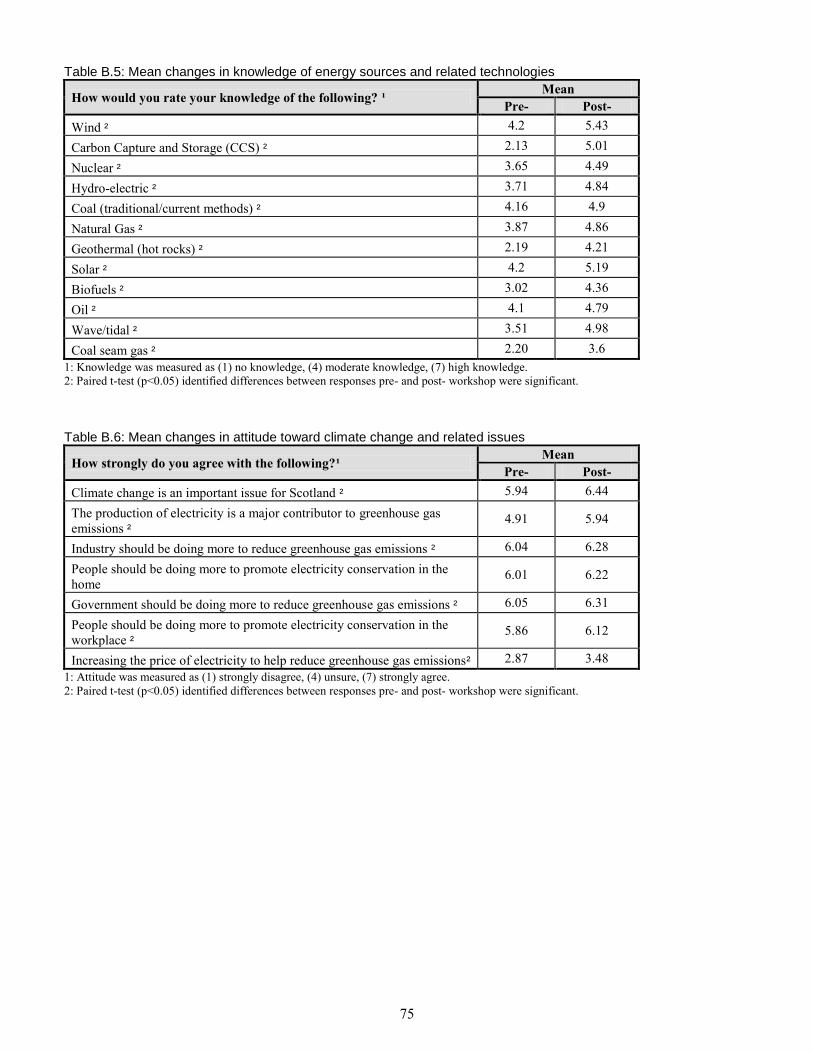
75
Table B.5: Mean changes in knowledge of energy sources and related technologies
How would you rate your knowledge of the following? ¹ Mean
Pre- Post-
Wind ² 4.2 5.43
Carbon Capture and Storage (CCS) ² 2.13 5.01
Nuclear ² 3.65 4.49
Hydro-electric ² 3.71 4.84
Coal (traditional/current methods) ² 4.16 4.9
Natural Gas ² 3.87 4.86
Geothermal (hot rocks) ² 2.19 4.21
Solar ² 4.2 5.19
Biofuels ² 3.02 4.36
Oil ² 4.1 4.79
Wave/tidal ² 3.51 4.98
Coal seam gas ² 2.20 3.6
1: Knowledge was measured as (1) no knowledge, (4) moderate knowledge, (7) high knowledge.
2: Paired t-test (p<0.05) identified differences between responses pre- and post- workshop were significant.
Table B.6: Mean changes in attitude toward climate change and related issues
How strongly do you agree with the following?¹ Mean
Pre- Post-
Climate change is an important issue for Scotland ² 5.94 6.44
The production of electricity is a major contributor to greenhouse gas
emissions ² 4.91 5.94
Industry should be doing more to reduce greenhouse gas emissions ² 6.04 6.28
People should be doing more to promote electricity conservation in the
home 6.01 6.22
Government should be doing more to reduce greenhouse gas emissions ² 6.05 6.31
People should be doing more to promote electricity conservation in the
workplace ² 5.86 6.12
Increasing the price of electricity to help reduce greenhouse gas emissions² 2.87 3.48
1: Attitude was measured as (1) strongly disagree, (4) unsure, (7) strongly agree.
2: Paired t-test (p<0.05) identified differences between responses pre- and post- workshop were significant.

76
Table B.7: Mean changes in attitudes to energy sources and related technologies
How strongly do you agree with the use of the following energy
sources/technologies? ¹
Mean
Pre- Post-
Wind ² 5.81 6.53
Carbon Capture and Storage (CCS) ² 4.48 4.10
Nuclear 3.72 3.88
Hydro-electric ² 5.55 6.0
Coal (traditional/current methods) 3.41 3.86
Natural Gas 4.54 4.75
Geothermal (hot rocks) ² 4.71 5.2
Solar 6.14 6.26
Biofuels ² 4.57 4.97
Oil ² 3.53 3.88
Wave/tidal ² 5.92 6.46
Coal seam gas 3.87 3.99
1: Attitude was measured as (1) strongly disagree, (4) unsure, (7) strongly agree.
2: Paired t-test (p<0.05) identified differences between responses pre- and post- workshop were significant.
Table B.8: Changes in priority of the mean preferred energy technology
Funding priority order¹: Mean
Pre- Post
Wind² 2.89 1.88
Carbon Capture and Storage (CCS) ² 6.56 8.08
Nuclear 8.01 8.20
Hydro-electric 4.51 4.80
Coal (traditional/current methods) 9.44 9.05
Natural Gas 6.67 6.90
Geothermal (hot rocks) ² 7.71 6.97
Solar 3.36 3.85
Biofuels 6.81 6.67
Oil 9.10 9.23
Wave/tidal² 3.68 2.77
Coal seam gas 9.21 9.59
1: Technologies were ranked from 1-12 with 1 being highest priority and 12 lowest priority.
2: Paired t-test (p<0.05) identified differences between responses pre- and post- workshop were significant.

77
Table B.9: Intended behaviour as a result of the workshop
As a result of this workshop I will: ¹ Mean Std. Dev.
Pay extra for ‘green’ electricity 3.71 1.768
Recycle my rubbish (e.g. cans, bottles, newspapers) 6.31 1.034
Consider energy efficiency ratings when purchasing white goods 6.21 0.946
Use reusable bags when shopping 6.36 0.949
Install a solar hot water system in my home 3.61 1.649
Use energy efficient light bulbs 6.3 1.189
Conserve my use of electricity in the home 6.46 0.778
Conserve my use of electricity in the workplace 6.03 1.199
Continue with my current behaviour as I already practice most of the
behaviours above 5.49 1.838
1: Intentions measured as (1) strongly disagree, (4) unsure, (7) strongly agree.
Table B.10: Mean trust in information sources
How much do you trust the following information sources? ¹ Mean Std. Dev.
Family and friends 5.22 1.289
Internet blogsites 3.69 1.459
Internet sites 4.30 1.302
Television news and current affairs programs 4.86 1.331
Radio 4.94 1.206
Newspapers 4.58 1.337
Magazines 4.12 1.348
Newsletters or flyers from interest groups 3.93 1.495
Environmental organisations 4.67 1.434
Books 5.08 1.106
Academic articles 5.32 1.271
My local council 4.15 1.446
Government correspondence e.g. mail outs 4.12 1.348
Universities and research institutes 5.47 1.085
Doctors 5.02 1.225
Industry 3.64 1.590
1: Trust measured as (1) strongly distrust, (4) unsure, (7) strongly trust.

78
Appendix C - Expert Presentations
Presentation 1

79

80

81

82

83

84

85

86

87

88

89
Presentation 2

90

91

92

93

94

95

96
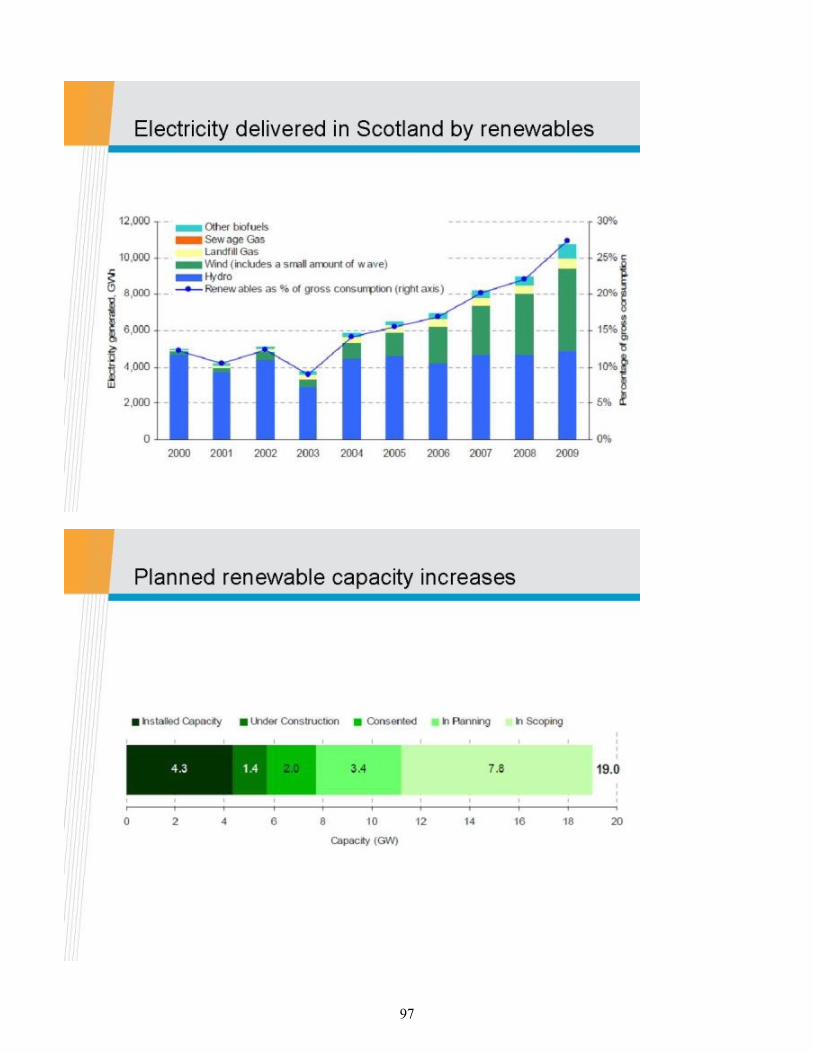
97

98

99

100
Presentation 3

101

102

103

104
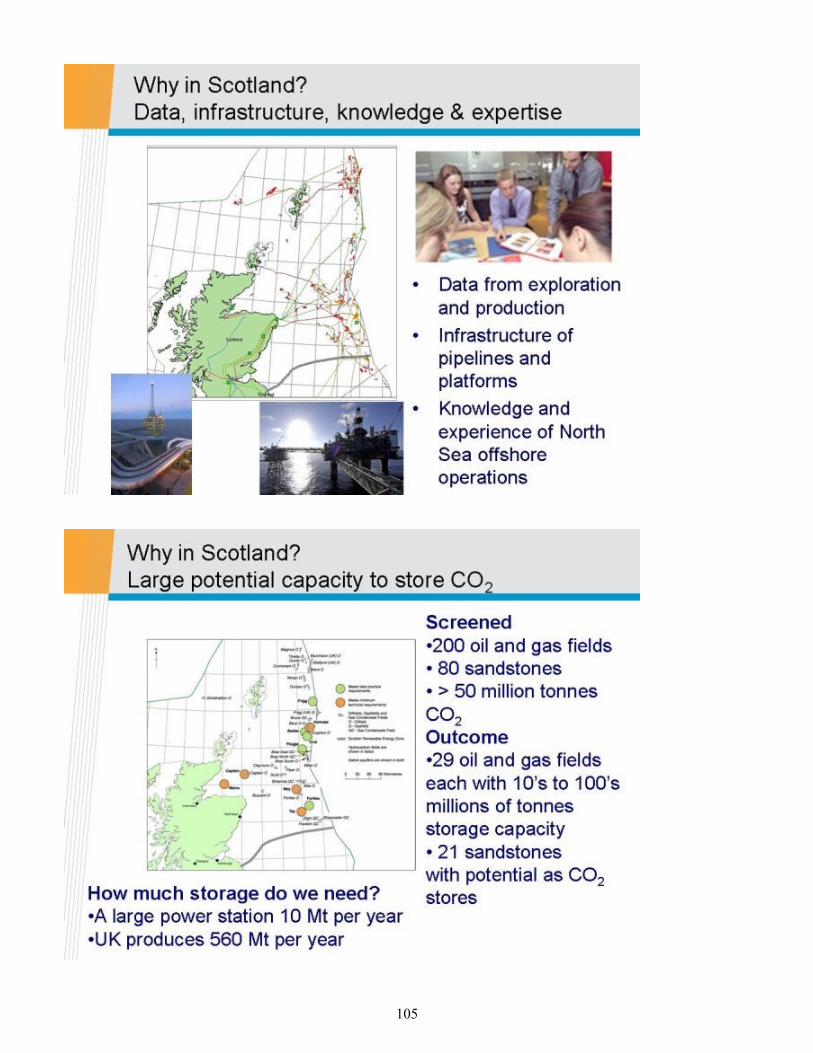
105

106

107

108

109

110