results for the year ending march 31 st 2011 ... ar and qu june 2011.pdfindore and the hotel in...
TRANSCRIPT
1
RESULTS FOR THE YEAR ENDING MARCH 31ST 2011 AND PERFORMANCE UPDATE FOR THE QUARTER ENDING JUNE 30TH 2011
Private and Confidential
22
DISCLAIM
ER
It is possible that this presentation could or may contain forward-looking statements that are based on current
expectations or beliefs, as well as assumptions about future events. These forward-looking statements can be
identified by the fact that they do not relate only to historical or current facts. Forward-looking statements often use
words such as anticipate, target, expect, estimate, intend, plan, goal, believe, will, may, should, would, could or other
words of similar meaning. Undue reliance should not be placed on any such statements because, by their very
nature, they are subject to known and unknown risks and uncertainties and can be affected by other factors that
could cause actual results, and the Company’s plans and objectives, to differ materially from those expressed or
implied in the forward-looking statements.
There are several factors which could cause actual results to differ materially from those expressed or implied in
forward looking statements. Among the factors that could cause actual results to differ materially from those
described in the forward-looking statements are changes in the global, political, economic, business, competitive,
market and regulatory forces, future exchange and interest rates, changes in tax rates and future business
combinations or dispositions.
Forward Looking Statements
3
YATRA CAPITAL

44
EXECUTIVESU
MM
ARY
Executive Summary
• Yatra’s portfolio was valued at €179.94 mn on March 31, 2011; 3.1% lower than the value on March 31, 2010
• The Net Asset Value (NAV) per share stands at €8.0, 14% lower than the NAV on March 31, 2010
• Weakening of the Indian Rupee vis-a-vis the Euro impacted the portfolio valuation negatively by 4%
• Overall, Yatra has let / sold / agreed terms for over 5 million sq ft so far, compared to 3.7 million sq ft at this time last year
• The portfolio continues to be in execution mode. The shopping centre in Punecommenced trading in June 2011. At least two more projects (the shopping centre in Indore and the hotel in Kolkata) are expected to become operational in the next 12-18 months
• This year will also see the launch of two large residential schemes in Bangalore and Pune
• As the portfolio matures, the focus will be on generating liquidity in the Company for distributing surplus funds to the shareholders
55
CO
RPORATE
ACTIO
NSU
PDATE
• The Company has announced the date for its next Annual General Meeting of the shareholders scheduled for September 22, 2011
• In addition to ordinary resolutions relating to the approval of accounts, reappointment of auditors and re-election of a director, following special resolutions will be proposed at the AGM which will
i. approve a change in structure of the Company in order for it to broaden its scope and create and issue a new class of shares investing in Indian infrastructure;
ii. adopt a revised memorandum and articles of associationiii. approve a share buy-back scheme of the Existing shares issued by the Company
• In considering the proposals relating to the New Shares, the Board has had regard to the following key investor concerns:
i. that there should be no cost to the holders of Existing Shares in relation to the creation and offering of the New Shares (whether such offering is successful or not)
ii. that the creation of the New Shares will have no adverse tax consequences for holders of Existing Shares
iii. that the assets and liabilities relating to each of the Existing Shares and New Shares be ring-fenced as far as possible so as to minimise the risk of any cross-class contagion
iv. that there is no change to the currently proposed timetable for the realisation of assets relating to the Existing Shares and the return of capital thereon
Corporate Actions Update
66
CO
RPORATE
ACTIO
NSU
PDATE
v. that the holders of Existing Shares obtain a quantifiable financial benefit (a fee rebate of 15%of the aggregate management fee to be charged to the New Shares for a period of 5 years)from the creation of the New Shares and suffer no economic dilution of their interests
vi. that the recently enhanced governance structures and current board shall remain in place toserve all shareholders, subject to re-election and voting procedures in the customary waysand
vii. that the existing IIAL real estate team remains focused on the continuing management andorderly realisation of the assets financed by the issuance of the Existing Shares
• The board has proposed a buyback of Existing Shares of the Company upto amaximum aggregate consideration of €4 million (subject to a limit of 10% of theExisting Shares in issue as at the date of the AGM being repurchased)
• Following the implementation of the Proposals, the board expects to conclude a seriesof additional steps which will further improve the alignment of interests among theGroup Investment Manager and the holders of the Existing Shares consistent withrealising the assets of K2 within the periods envisaged at the time of the IPO and FPOand up streaming of such proceeds to the Company in anticipation of distributions toExisting Shareholders
Corporate Actions Update
77
SHAREPRICEP
ERFORM
ANCE
SHAREP
RICEP
ERFORM
ANCE
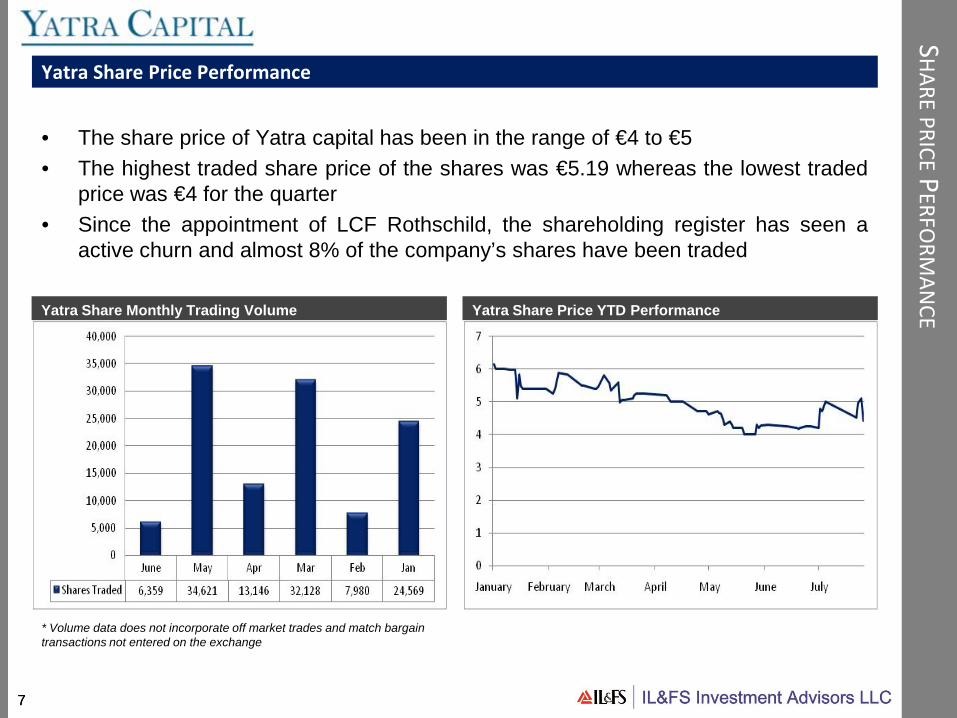
Yatra Share Monthly Trading Volume Yatra Share Price YTD Performance
• The share price of Yatra capital has been in the range of €4 to €5• The highest traded share price of the shares was €5.19 whereas the lowest traded
price was €4 for the quarter• Since the appointment of LCF Rothschild, the shareholding register has seen a
active churn and almost 8% of the company’s shares have been traded
Yatra Share Price Performance
* Volume data does not incorporate off market trades and match bargain transactions not entered on the exchange

8
PERFORMANCE SUMMARY

99
SUM
MARY
Overview
• Portfolio valued at €179.94 mn, 3.1% lower than the value of the portfolio on March 31, 2010
• Net Asset Value* (NAV) per share at €8.0, 14% lower than NAV on March 31, 2010
• Decrease in NAV largely on account of increased construction costs and project level debt in the portfolio
• 76% of net funds raised committed as at March 31, 2011
* Net Asset Value (“NAV”) is based on Yatra’s (including all subsidiaries) net assets divided by number of shares outstanding as at March 31, 2011. This incorporates all adjustments for taxation at the India level, exchange rate movements and carried interest
• Apart from the Nashik shopping centre which is already operational, the shopping centre in Pune commenced trading in June 2011 with more than 40 retailers opening their stores. At least 2 more projects (the shopping centre in Indore and the hotel in Kolkata) are expected to get operational in the next 12-18 months
• Pre-let/ let/ sold/ pre-sold/ terms agreed for over 5 mn sq ft, compared to 3.7 mn sq ft till March 31, 2010
9.55 9.48
13.43
11.5810.86
10.299.27 9.23
8.0
0
2
4
6
8
10
12
14
16
Mar 07 Sep 07 Mar 08 Sep 08 Mar 09 Sep 09 Mar 10 Sep 10 Mar 11
NAV in EUR
1010
AU
DITPRO
CESS
Audit Process
• Financial statements for the group prepared as per IFRS
• Audit for Yatra and all its Mauritian subsidiaries and Indian portfolio companies conducted by PwC
• Lead auditor PwC Jersey reviewed all work done by PwC Mauritius and consolidated results at the Yatra level
• Audit Committee led by Yatra director Richard Boleat oversaw the entire process from India to Jersey
• PwC Mauritius team spent considerable time in India visiting most portfolio companies and conducting the review of their operations
• PwC also spent considerable time with CBRE questioning their valuation methodology and assumptions for all projects
1111
VALU
ATION
SUPDATE
Valuations Update
• CBRE was appointed to value the entire portfolio
• Malcolm King, a key member of the Yatra & K2 boards was involved in the entire valuation process including physical meetings with the CBRE team in India
• Valuation methodology a mix of Discounted Cash Flow (DCF) and Direct Comparable (DCM) approaches, depending upon project status
• Portfolio valued at €179.94 mn, 3.1% lower compared to March 31, 2010
• Weakening of the Indian Rupee vis a vis the Euro impacted the portfolio valuation negatively by 4%
• Conservative WACC rate @ 18.6%, amongst the highest for India RE funds

1212
SUM
MARY
Valuation – Key Changes in Assumptions
• Exit Yields:
• Retail / Commercial Exit Yield – 11%• Special Economic Zone Exit Yield – 10.5%
• Construction Costs: Due to increase in inputs and labor costs, construction costs have moved up in some projects
• Absorption and Revenue Assumptions: Changed on a case to case basis depending upon project activity and performance
• Project Phasing and Schedule: Appropriate adjustments made to the project schedules on a case to case basis
• Product Mix and Area: In some projects, the total development area and area allocation and product mix has changed since March 31, 2010. Adjustments have been made to reflect these changes in the valuations
• Cost of Capital: Weighted Average Cost of Capital (WACC) at 18.6% similar to the previous year, mainly due to increase in cost of debt getting adjusted against decrease in cost of equity in some projects at advanced stages of completion
1313
VALU
ATION
S& N
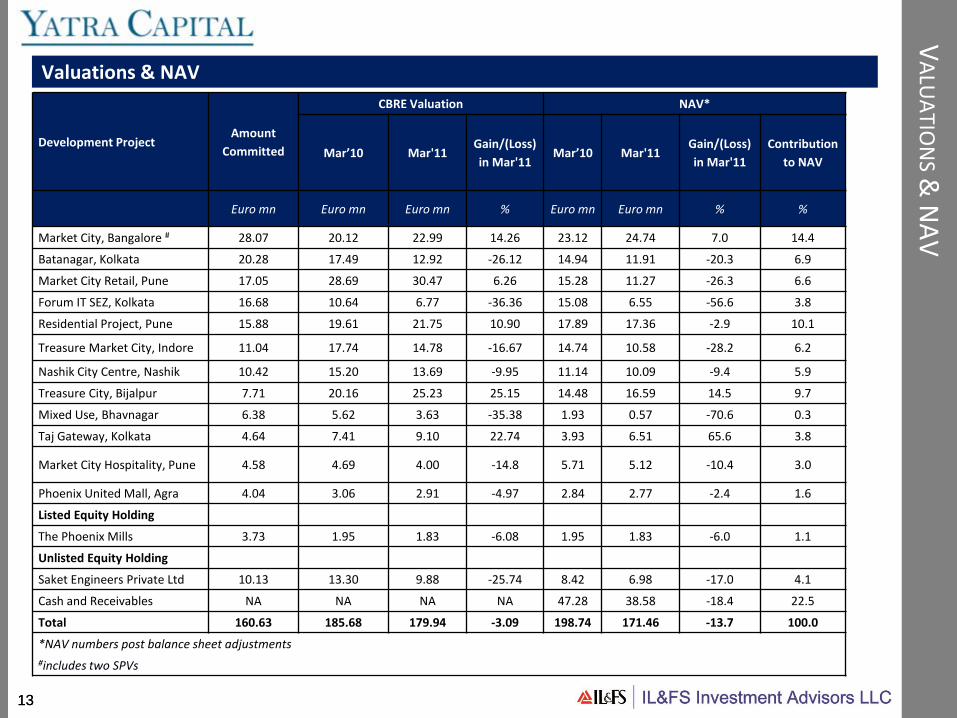
AVValuations & NAV
Development ProjectAmount
Committed
CBRE Valuation NAV*
Mar’10 Mar'11Gain/(Loss) in Mar'11
Mar’10 Mar'11Gain/(Loss) in Mar'11
Contribution to NAV
Euro mn Euro mn Euro mn % Euro mn Euro mn % %
Market City, Bangalore # 28.07 20.12 22.99 14.26 23.12 24.74 7.0 14.4
Batanagar, Kolkata 20.28 17.49 12.92 -26.12 14.94 11.91 -20.3 6.9
Market City Retail, Pune 17.05 28.69 30.47 6.26 15.28 11.27 -26.3 6.6
Forum IT SEZ, Kolkata 16.68 10.64 6.77 -36.36 15.08 6.55 -56.6 3.8
Residential Project, Pune 15.88 19.61 21.75 10.90 17.89 17.36 -2.9 10.1
Treasure Market City, Indore 11.04 17.74 14.78 -16.67 14.74 10.58 -28.2 6.2
Nashik City Centre, Nashik 10.42 15.20 13.69 -9.95 11.14 10.09 -9.4 5.9
Treasure City, Bijalpur 7.71 20.16 25.23 25.15 14.48 16.59 14.5 9.7
Mixed Use, Bhavnagar 6.38 5.62 3.63 -35.38 1.93 0.57 -70.6 0.3
Taj Gateway, Kolkata 4.64 7.41 9.10 22.74 3.93 6.51 65.6 3.8
Market City Hospitality, Pune 4.58 4.69 4.00 -14.8 5.71 5.12 -10.4 3.0
Phoenix United Mall, Agra 4.04 3.06 2.91 -4.97 2.84 2.77 -2.4 1.6
Listed Equity Holding
The Phoenix Mills 3.73 1.95 1.83 -6.08 1.95 1.83 -6.0 1.1
Unlisted Equity Holding
Saket Engineers Private Ltd 10.13 13.30 9.88 -25.74 8.42 6.98 -17.0 4.1
Cash and Receivables NA NA NA NA 47.28 38.58 -18.4 22.5
Total 160.63 185.68 179.94 -3.09 198.74 171.46 -13.7 100.0
*NAV numbers post balance sheet adjustments#includes two SPVs

14
MACRO ECONOMIC OVERVIEW
1515
MACRO
ECON
OM
ICO
UTLO
OK
Macro Economic Summary
• India’s economy grew 7.8% in the fourth quarter of 2010-11, the slowest in ayear, as rising interest rates and input costs pulled down manufacturing growth toa 21-month low
• For the full financial year, the economy grew 8.5%, marginally belowexpectations
• Foreign Institutional Investment (FII) outflows moderated in June after heavyselling in May 2011 while flows from domestic institutions continue to be tepid
• The Reserve Bank of India (RBI) during its July policy review hiked lending andborrowing rates by 50 basis points. This is the 11th rate hike in the last 16months to tame sticky inflation and is amongst the most aggressive amongstglobal central banks
• FII investments in External Commercial Borrowings and corporate bondsexceeds €15 bn which is a new high
• FDI investments in India for the calendar year 2011 were up 19% to €7.5 bn ascompared to €6.3 bn
• Overall, the sentiment remains cautious given the widespread governance issuesbeing faced by the political establishment
1616
REALESTATEO
UTLO
OK
Real Estate Markets
• Price rise and increasing borrowing costs impact demand — Residential: Prices across metros have increased >20% during the past six quarters. Prices
in Mumbai have spiked c.42% during the past six quarters, The spike in property prices, and tightening liquidity have resulted in real estate becoming unaffordable, as seen in declining sales volumes. Market data suggests significant drop in registrations
— Retail: Improvement in occupancy numbers based on rationalising rentals. Most retailers moving to revenue share agreements leading to lower fixed rental outflows. Increased interest in the sector on the back of expected regulatory easing
— Office: Vacancies continue to reduce in key cities. Increased absorption on the back of improved hiring and expansion see rentals largely stable
— Hospitality: ARRs and occupancies improving but still under pressure from supply coming online
• Increase in construction costs because of high commodity prices and labour costs; pressure on margins increases further as financing costs go up as well
• Banking sector slows down significantly on new loan disbursements impacting liquidity. Pressure on developers to cut pricing to improve cash flows
• The industry is facing a crunch and the fund gap over the next five years alone would be as high as €47 bn
• Developers have slowed down new projects launches to decrease inventory levels

17
PORTFOLIO OVERVIEW AS AT JUNE 30TH, 2011
1818
PO
RTFOLIO
OVERVIEW
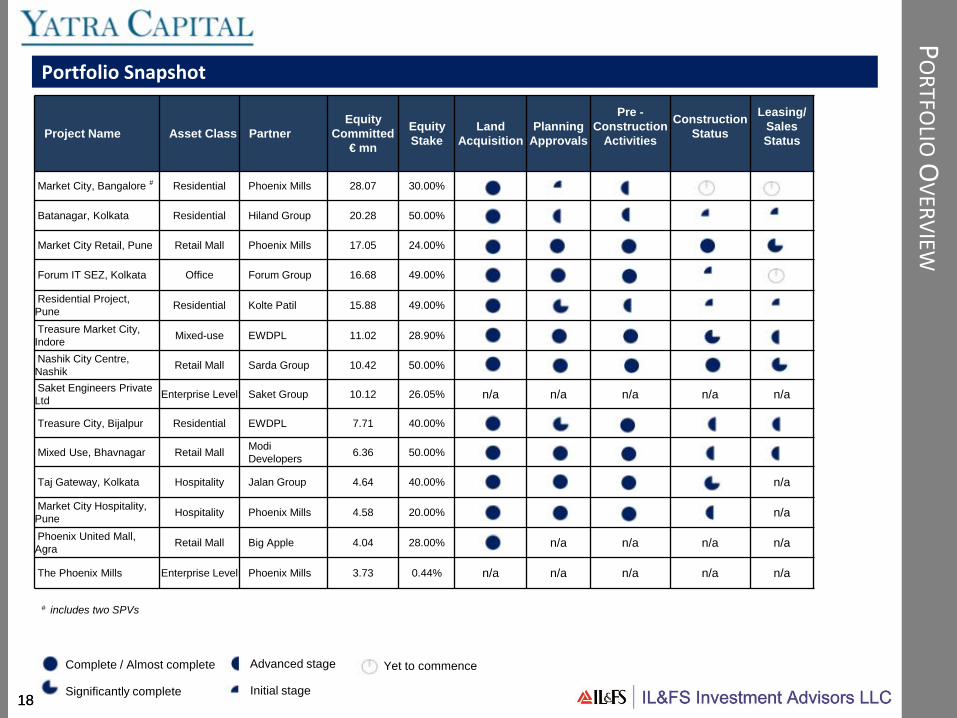
Portfolio Snapshot
Complete / Almost complete
Significantly complete
Advanced stage
Initial stage
Yet to commence
Project Name Asset Class PartnerEquity
Committed€ mn
Equity Stake
Land Acquisition
Planning Approvals
Pre -Construction
Activities
Construction Status
Leasing/Sales Status
Market City, Bangalore # Residential Phoenix Mills 28.07 30.00%
Batanagar, Kolkata Residential Hiland Group 20.28 50.00%
Market City Retail, Pune Retail Mall Phoenix Mills 17.05 24.00%
Forum IT SEZ, Kolkata Office Forum Group 16.68 49.00%
Residential Project, Pune Residential Kolte Patil 15.88 49.00%
Treasure Market City, Indore Mixed-use EWDPL 11.02 28.90%
Nashik City Centre, Nashik Retail Mall Sarda Group 10.42 50.00%
Saket Engineers Private Ltd Enterprise Level Saket Group 10.12 26.05% n/a n/a n/a n/a n/a
Treasure City, Bijalpur Residential EWDPL 7.71 40.00%
Mixed Use, Bhavnagar Retail Mall Modi Developers 6.36 50.00%
Taj Gateway, Kolkata Hospitality Jalan Group 4.64 40.00% n/a
Market City Hospitality, Pune Hospitality Phoenix Mills 4.58 20.00% n/a
Phoenix United Mall, Agra Retail Mall Big Apple 4.04 28.00% n/a n/a n/a n/a
The Phoenix Mills Enterprise Level Phoenix Mills 3.73 0.44% n/a n/a n/a n/a n/a
# includes two SPVs

1919
• Twelve projects (two Bangalore SPVs being taken as one project due to amalgamation of business plans) and two entity level investments; weighted average Yatra (K2) equity holding in projects at 37%
• Over 19.8 mn sq ft saleable / leasable area spread across projects• Over 5.09 mn sq ft pre-let / let / pre-sold / sold / terms agreed for as at June 30th
2011 as against 4.75 mn sq ft at the end of the previous quarter• Financial closure achieved to the extent of 78% at the portfolio level; weighted
average cost of debt 14.5%
PO
RTFOLIO
OVERVIEW
Yatra Portfolio Overview
Geographic Diversification Sectoral DiversificationAgra3%
Bhavnagar4%
Nashik7%
Indore12%
Bangalore17%
Pune23%
Kolkata26%
Hyderabad6%
Mumbai2%
Residential44%
Retail24%
Hospitality5%
Commercial18%
Enterprise Level
9%
2020
PO
RTFOLIO
OVERVIEW
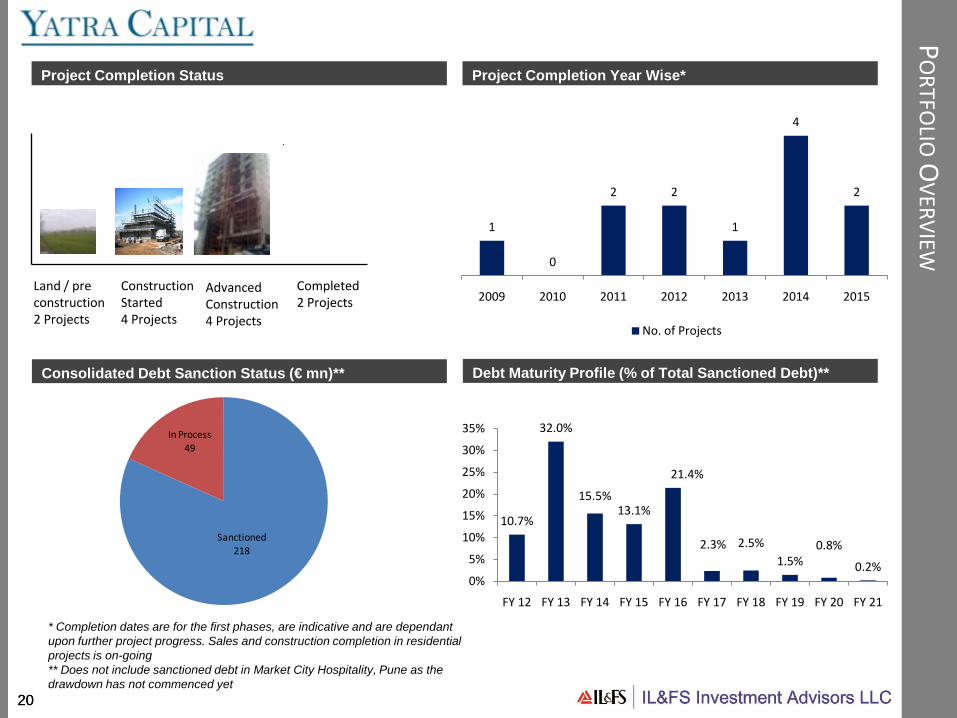
Consolidated Debt Sanction Status (€ mn)** Debt Maturity Profile (% of Total Sanctioned Debt)**
Project Completion Status Project Completion Year Wise*
Land / pre construction2 Projects
Construction Started4 Projects
Advanced Construction4 Projects
Completed2 Projects
* Completion dates are for the first phases, are indicative and are dependant upon further project progress. Sales and construction completion in residential projects is on-going** Does not include sanctioned debt in Market City Hospitality, Pune as the drawdown has not commenced yet
1
0
2 2
1
4
2
2009 2010 2011 2012 2013 2014 2015
No. of Projects
10.7%
32.0%
15.5%13.1%
21.4%
2.3% 2.5%1.5%
0.8%
0.2%0%
5%
10%
15%
20%
25%
30%
35%
FY 12 FY 13 FY 14 FY 15 FY 16 FY 17 FY 18 FY 19 FY 20 FY 21
Sanctioned 218
In Process 49
2121
TREASURY
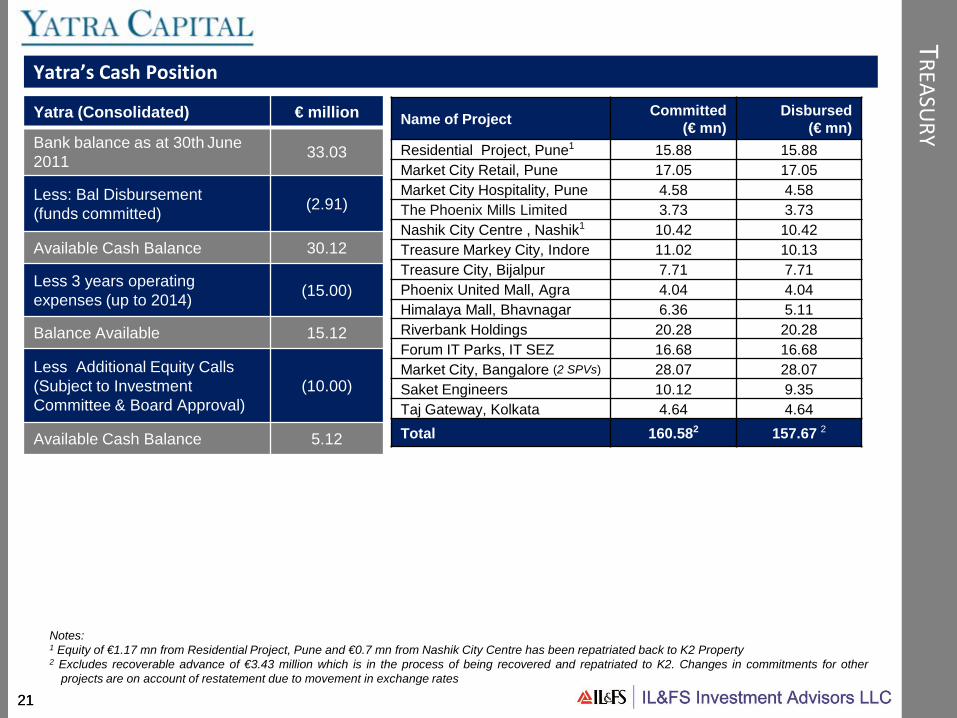
Yatra’s Cash Position
Yatra (Consolidated) € million
Bank balance as at 30th June 2011 33.03
Less: Bal Disbursement (funds committed) (2.91)
Available Cash Balance 30.12
Less 3 years operating expenses (up to 2014) (15.00)
Balance Available 15.12
Less Additional Equity Calls (Subject to Investment Committee & Board Approval)
(10.00)
Available Cash Balance 5.12
Name of Project Committed(€ mn)
Disbursed (€ mn)
Residential Project, Pune1 15.88 15.88Market City Retail, Pune 17.05 17.05Market City Hospitality, Pune 4.58 4.58The Phoenix Mills Limited 3.73 3.73Nashik City Centre , Nashik1 10.42 10.42Treasure Markey City, Indore 11.02 10.13Treasure City, Bijalpur 7.71 7.71Phoenix United Mall, Agra 4.04 4.04Himalaya Mall, Bhavnagar 6.36 5.11Riverbank Holdings 20.28 20.28Forum IT Parks, IT SEZ 16.68 16.68Market City, Bangalore (2 SPVs) 28.07 28.07Saket Engineers 10.12 9.35Taj Gateway, Kolkata 4.64 4.64Total 160.582 157.67 2
Notes:1 Equity of €1.17 mn from Residential Project, Pune and €0.7 mn from Nashik City Centre has been repatriated back to K2 Property2 Excludes recoverable advance of €3.43 million which is in the process of being recovered and repatriated to K2. Changes in commitments for other
projects are on account of restatement due to movement in exchange rates

22
DETAILED PROJECT UPDATES AS AT JUNE 30TH, 2011
2323
MARKETC
ITY, BAN
GALO
RE*
Current Status
Map
3D Elevation
Current Status
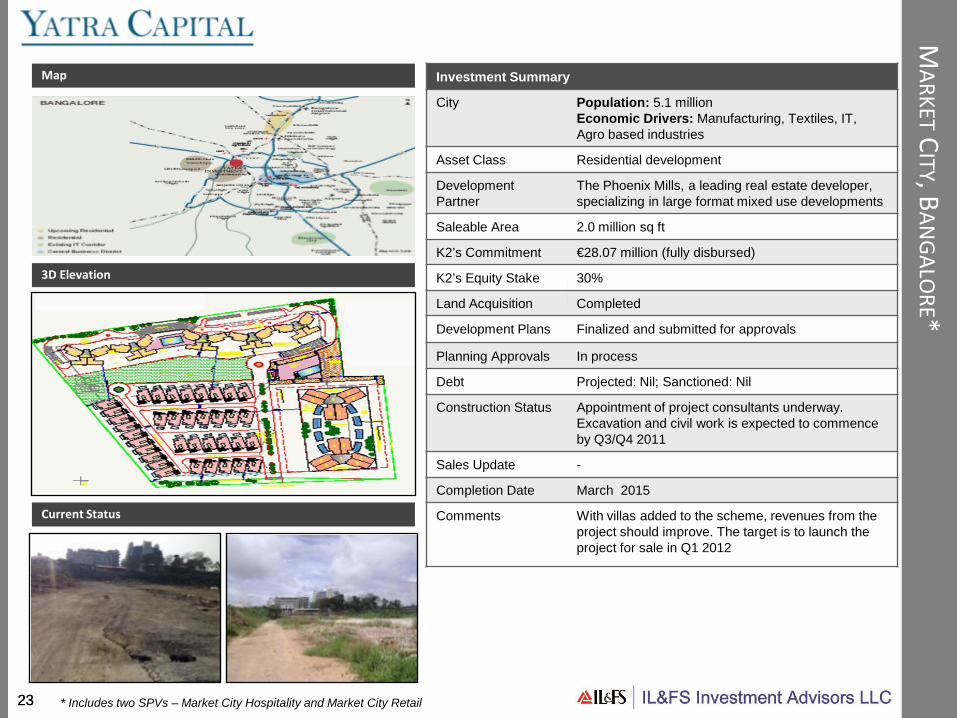
Investment Summary
City Population: 5.1 millionEconomic Drivers: Manufacturing, Textiles, IT, Agro based industries
Asset Class Residential development
DevelopmentPartner
The Phoenix Mills, a leading real estate developer, specializing in large format mixed use developments
Saleable Area 2.0 million sq ft
K2’s Commitment €28.07 million (fully disbursed)
K2’s Equity Stake 30%
Land Acquisition Completed
Development Plans Finalized and submitted for approvals
Planning Approvals In process
Debt Projected: Nil; Sanctioned: Nil
Construction Status Appointment of project consultants underway. Excavation and civil work is expected to commence by Q3/Q4 2011
Sales Update -
Completion Date March 2015
Comments With villas added to the scheme, revenues from the project should improve. The target is to launch the project for sale in Q1 2012
* Includes two SPVs – Market City Hospitality and Market City Retail

2424
BATAN
AGAR, K
OLKATA
Current Status
Map
Current Status
Master Plan of the Township
Investment Summary
City Population: 15 millionEconomic Drivers: Manufacturing, Textiles, IT, Agro based industries
Asset Class Residential led mixed use
DevelopmentPartner
Riverbank Developers, a joint venture between the Kolkata Municipal Development Authority, and one of the leading residential developers, Calcutta Metropolitan Group Ltd., in Kolkata
Saleable Area ~10 million sq ft (complete township)
K2’s Commitment €20.28 million (fully disbursed)
K2’s Equity Stake Originally 50% in the SEZ SPV; likely to be around 30-35% in the complete 262 acre township
Land Acquisition Completed
Development Plans Completed
Planning Approvals Master plan and building plans approved
Debt (for the township)
Projected: €23.2 million; Sanctioned: €23.2 million
Construction Status Construction progressing on various components within the township
Sales/Leasing Update
Of the 404 units in the first phase of premium housing within Calcutta Riverside, 276 units have been pre sold including 7 units in the last quarter. Out of 224 units launched in the mid market housing category, 152 units have been pre sold including 15 units in the last quarter
Completion Date NA
Comments Transaction structuring underway to swap our equity stake in the SEZ with a lower stake in the complete township

2525
MARKETC
ITYRETAIL, P
UN
E
Current Status
Map Investment Summary
City Population: 3.52 millionEconomic Drivers: Manufacturing, IT, Automobiles, Education
Asset Class Retail led mixed use
DevelopmentPartner
The Phoenix Mills, a leading real estate developer, specializing in large format mixed use developments
Leasable Area 1.81 million sq ft (1.43 million sq ft in Phase I and the balance in Phase II)
K2’s Commitment €17.05 million (fully disbursed)
K2’s Equity Stake 24%
Land Acquisition Completed
Development Plans Completed
Planning Approvals Received
Debt Projected: €73.3 million; Sanctioned: €73.3 million
Construction Status Mall opened for trading in June 2011 with 40 stores getting operational
Sales/Leasing Update
0.95 million sq ft of retail space has been pre let including 35,000 sq ft in the last quarter. 165,000 sq ft has been pre sold to investors so far
Completion Date Q4 2013 (Phase II)
Comments With the mall now open, the focus is on getting the ground floor and the first floor significantly operational in the next few months
Current Status
2626
FORU
MIT SEZ, K
OLKATA
Map
3D Elevation
Current Status
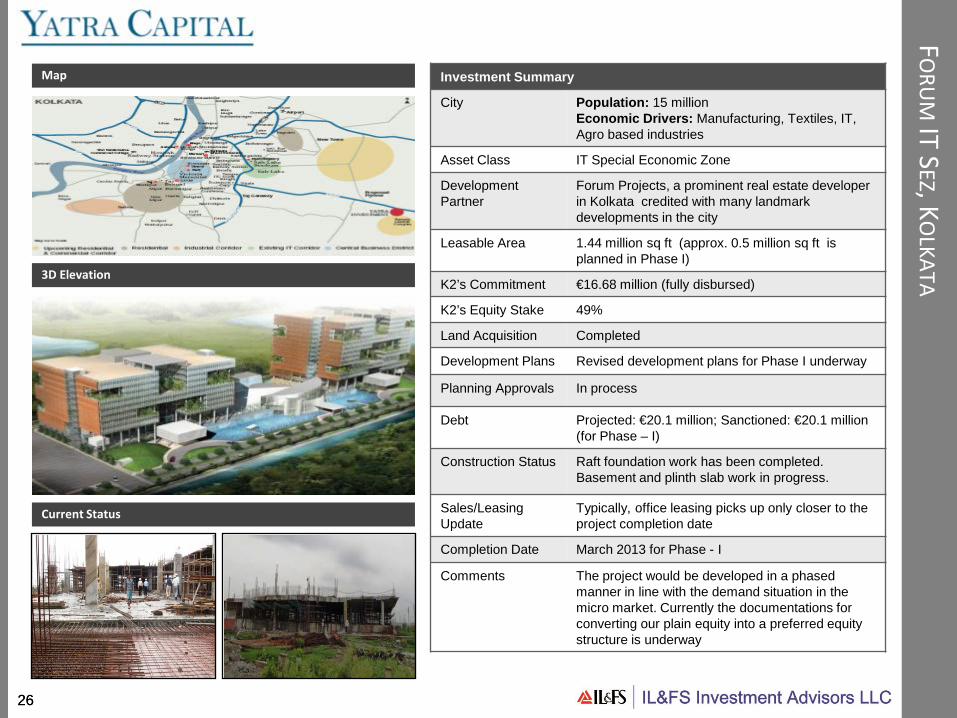
Investment Summary
City Population: 15 millionEconomic Drivers: Manufacturing, Textiles, IT, Agro based industries
Asset Class IT Special Economic Zone
DevelopmentPartner
Forum Projects, a prominent real estate developerin Kolkata credited with many landmark developments in the city
Leasable Area 1.44 million sq ft (approx. 0.5 million sq ft is planned in Phase I)
K2’s Commitment €16.68 million (fully disbursed)
K2’s Equity Stake 49%
Land Acquisition Completed
Development Plans Revised development plans for Phase I underway
Planning Approvals In process
Debt Projected: €20.1 million; Sanctioned: €20.1 million (for Phase – I)
Construction Status Raft foundation work has been completed. Basement and plinth slab work in progress.
Sales/Leasing Update
Typically, office leasing picks up only closer to the project completion date
Completion Date March 2013 for Phase - I
Comments The project would be developed in a phased manner in line with the demand situation in the micro market. Currently the documentations for converting our plain equity into a preferred equity structure is underway

2727
RESIDEN
TIALPRO
JECT, PU
NE
Current Status
Map
Project Master Plan
Current Status
Investment Summary
City Population: 3.52 millionEconomic Drivers: Manufacturing, IT, Automobiles, Education
Asset Class Residential led mixed use development
Development Partner Kolte Patil Developers, a prominent Pune based residential real estate developer
Saleable Area 2.1 million sq ft
K2’s Commitment €15.88 million. €1.16 million has been repatriated back to K2 Property as part of the agreed structure
K2’s Equity Stake 49%
Land Acquisition Completed
Development Plans Completed for Phase I and Phase II
Planning Approvals Obtained for the school; revised approvals as per final drawings at advanced stage for residential
Debt Projected: €8.95 million; Sanctioned: €8.95million
Construction Status Product mix comprising of two and three bedroom apartments and an International School form Phase I of the project. The school building has been completed and handed over to the operator. Podium level work for two residential towers is complete. Further work put on hold till we receive approvals
Sales/Leasing Update
0.12 mn sq ft has been pre let to a school operator.94 out of the 200 apartments launched in Phase I have been booked (net of 36 cancellations because of the delay in approvals)
Completion Date September 2014
Comments Delay in obtaining approvals impacting project timelines. Discussions underway with investors for sale of the school building and the adjacent school plot
Phase I
Phase IIPhase II
Phase II
Phase I
2828
TREASUREM
ARKETCITY, IN
DORE
Current Status
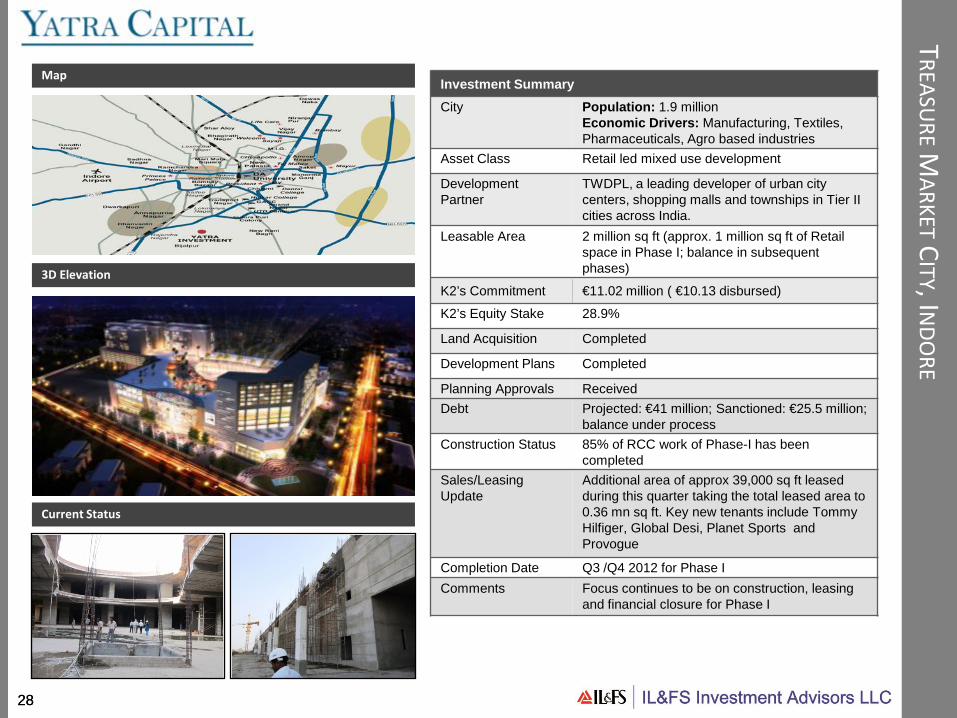
Investment SummaryCity Population: 1.9 million
Economic Drivers: Manufacturing, Textiles,Pharmaceuticals, Agro based industries
Asset Class Retail led mixed use development
DevelopmentPartner
TWDPL, a leading developer of urban city centers, shopping malls and townships in Tier II cities across India.
Leasable Area 2 million sq ft (approx. 1 million sq ft of Retail space in Phase I; balance in subsequent phases)
K2’s Commitment €11.02 million ( €10.13 disbursed)
K2’s Equity Stake 28.9%
Land Acquisition Completed
Development Plans Completed
Planning Approvals ReceivedDebt Projected: €41 million; Sanctioned: €25.5 million;
balance under processConstruction Status 85% of RCC work of Phase-I has been
completedSales/Leasing Update
Additional area of approx 39,000 sq ft leased during this quarter taking the total leased area to 0.36 mn sq ft. Key new tenants include Tommy Hilfiger, Global Desi, Planet Sports and Provogue
Completion Date Q3 /Q4 2012 for Phase I Comments Focus continues to be on construction, leasing
and financial closure for Phase I
Map
3D Elevation
Current Status

2929
NASHIK
CITYC
ENTRE, N
ASHIK
Map
Current Status
Investment Summary
City Population: 1.6 millionEconomic Drivers: Manufacturing, IT, Government run industries, Agriculture
Asset Class Retail development
DevelopmentPartner
Sarda Group, a diversified business group based out of Nashik with interests in Real Estate, Consumer Products and Education
Leasable Area 371,249 sq ft
K2’s Commitment €10.42 million (fully disbursed)
K2’s Equity Stake 50%
Debt Sanctioned LRD debt: €6.76 millionOutstanding LRD debt: €5.98 million
Present Status The mall is operational and receiving footfalls ofmore than 100,000 per week and has become the social and shopping hub for the city
Leasing Update 64% of the total retail space ( 78% of the operational floors, excluding the 3rd and 4th floor) has been leased. Over 58% of the total retail space is operational. Advanced discussions are going on with a large apparel store and several others which are likely to be closed out by Q3 2011
Comments The focus continues to be on leasing the balance space

3030
SAKETENTERPRISELEVEL, H
YDERABAD
Current Status
Map
Current Status
Investment Summary
City Population: 5.7 millionEconomic Drivers: Manufacturing, Textiles, IT, Agro based industries
Asset Class Residential Unlisted Entity Level Investment
DevelopmentPartner
Saket Engineers, a Hyderabad based mid-sized residential developer
Saleable Area N/A
K2’s Commitment €10.12 million (€9.35 million disbursed)
K2’s Equity Stake 26.05%
Debt Projected: €8.8 million; Sanctioned: €8.8 million
Construction Status
Two projects are currently under development –Sriyam, among the first high rise structures in Hyderabad, and Pranaam, a project targeted at senior citizens. Development of two new residential projects (one in Bangalore and the other in Hyderabad) is expected to commence by Q1 2012
Sales/Leasing Update
118 out of 270 apartments launched in Sriyamincluding 4 in the last quarter; 114 out of 180 apartments launched in Pranaam have been pre sold including 10 in the last quarter
Completion Date N/A
Comments With phased handover of the projects having commenced, sales are slowly improving. The political uncertainty in the state continues to impact sales velocity and product pricing. Company working on launching new projects in Hyderabad and Bangalore
3131
TREASUREC
ITY, INDO
RE
Current Status
Map
3D Elevation
Current Status
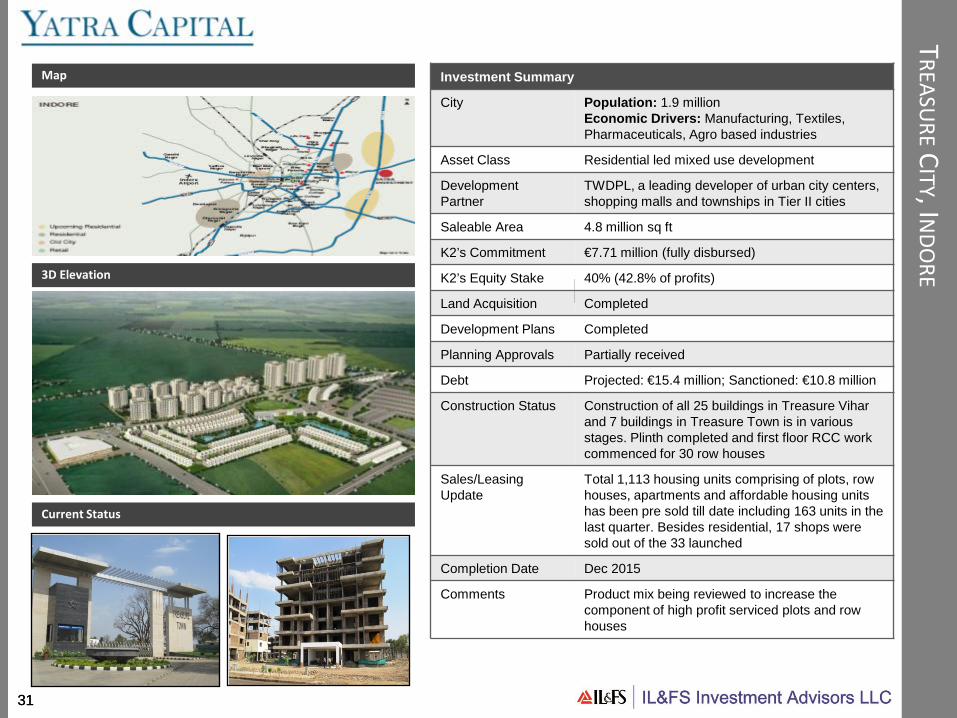
Investment Summary
City Population: 1.9 millionEconomic Drivers: Manufacturing, Textiles,Pharmaceuticals, Agro based industries
Asset Class Residential led mixed use development
DevelopmentPartner
TWDPL, a leading developer of urban city centers, shopping malls and townships in Tier II cities
Saleable Area 4.8 million sq ft
K2’s Commitment €7.71 million (fully disbursed)
K2’s Equity Stake 40% (42.8% of profits)
Land Acquisition Completed
Development Plans Completed
Planning Approvals Partially received
Debt Projected: €15.4 million; Sanctioned: €10.8 million
Construction Status Construction of all 25 buildings in Treasure Viharand 7 buildings in Treasure Town is in various stages. Plinth completed and first floor RCC work commenced for 30 row houses
Sales/Leasing Update
Total 1,113 housing units comprising of plots, row houses, apartments and affordable housing units has been pre sold till date including 163 units in the last quarter. Besides residential, 17 shops were sold out of the 33 launched
Completion Date Dec 2015
Comments Product mix being reviewed to increase the component of high profit serviced plots and row houses
3232
MIXED
USED
EVELOPM
ENT, B
HAVNAG
AR
Current Status
Map
3D Elevation
Current Status
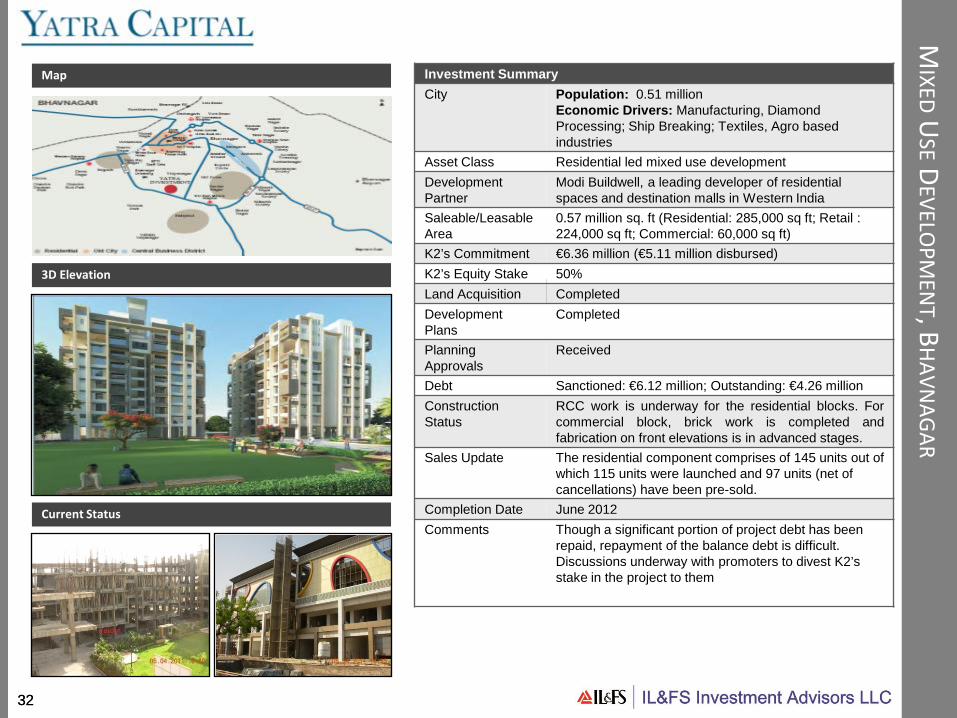
Investment SummaryCity Population: 0.51 million
Economic Drivers: Manufacturing, DiamondProcessing; Ship Breaking; Textiles, Agro based industries
Asset Class Residential led mixed use developmentDevelopmentPartner
Modi Buildwell, a leading developer of residential spaces and destination malls in Western India
Saleable/Leasable Area
0.57 million sq. ft (Residential: 285,000 sq ft; Retail : 224,000 sq ft; Commercial: 60,000 sq ft)
K2’s Commitment €6.36 million (€5.11 million disbursed)K2’s Equity Stake 50%Land Acquisition CompletedDevelopmentPlans
Completed
Planning Approvals
Received
Debt Sanctioned: €6.12 million; Outstanding: €4.26 millionConstructionStatus
RCC work is underway for the residential blocks. Forcommercial block, brick work is completed andfabrication on front elevations is in advanced stages.
Sales Update The residential component comprises of 145 units out of which 115 units were launched and 97 units (net of cancellations) have been pre-sold.
Completion Date June 2012Comments Though a significant portion of project debt has been
repaid, repayment of the balance debt is difficult. Discussions underway with promoters to divest K2’s stake in the project to them
3333
TAJGATEW
AY, KO
LKATA
Current Status
Map
3D Elevation
Current Status
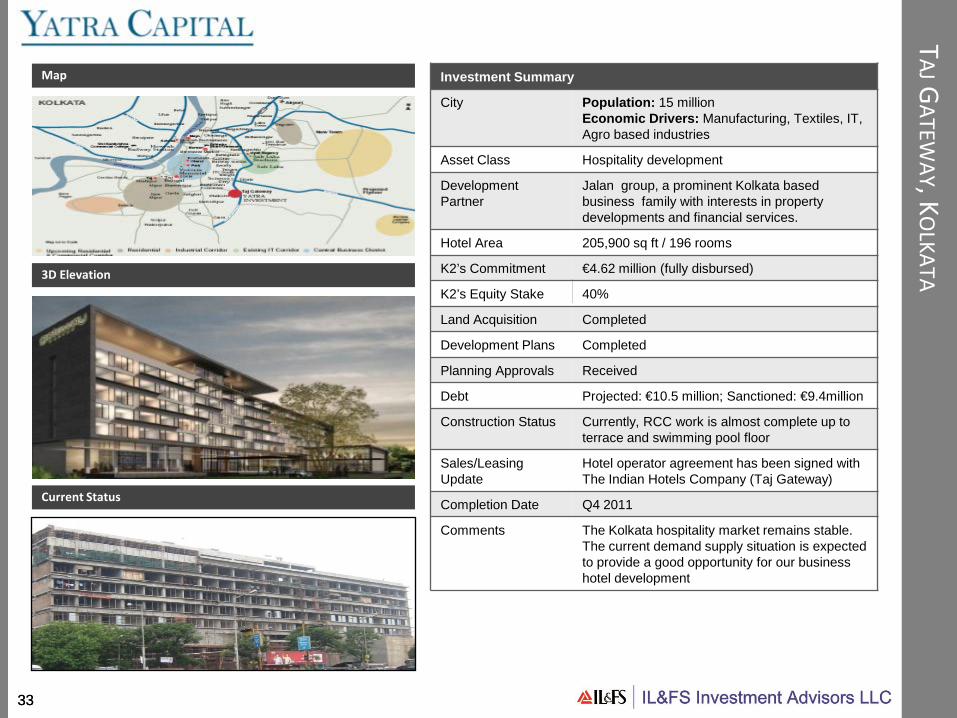
Investment Summary
City Population: 15 millionEconomic Drivers: Manufacturing, Textiles, IT, Agro based industries
Asset Class Hospitality development
DevelopmentPartner
Jalan group, a prominent Kolkata based business family with interests in property developments and financial services.
Hotel Area 205,900 sq ft / 196 rooms
K2’s Commitment €4.62 million (fully disbursed)
K2’s Equity Stake 40%
Land Acquisition Completed
Development Plans Completed
Planning Approvals Received
Debt Projected: €10.5 million; Sanctioned: €9.4million
Construction Status Currently, RCC work is almost complete up to terrace and swimming pool floor
Sales/Leasing Update
Hotel operator agreement has been signed with The Indian Hotels Company (Taj Gateway)
Completion Date Q4 2011
Comments The Kolkata hospitality market remains stable.The current demand supply situation is expected to provide a good opportunity for our business hotel development
3434
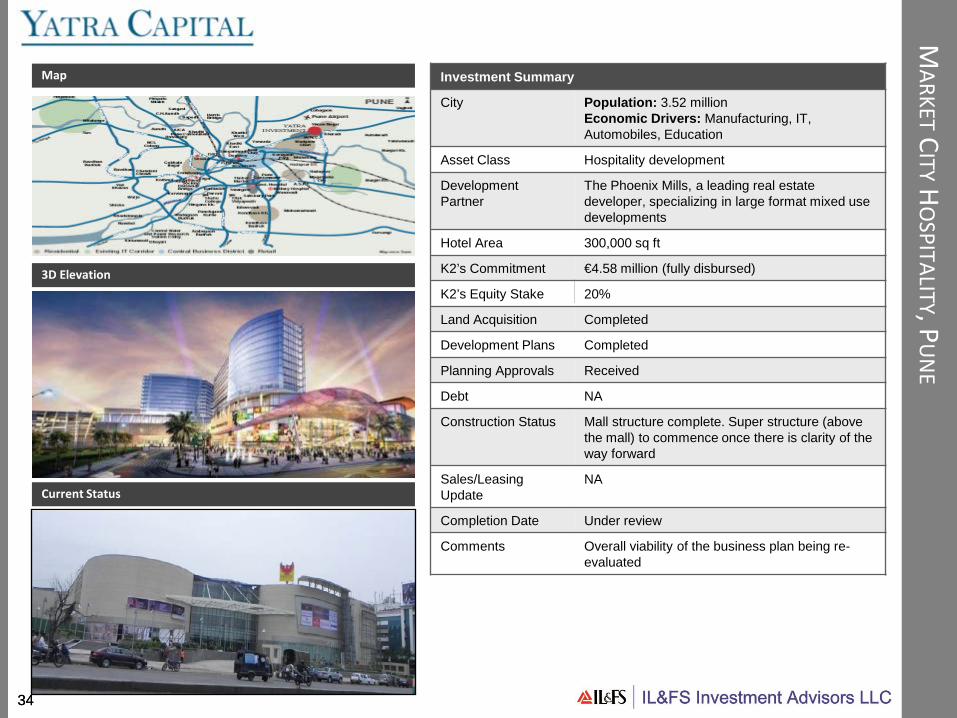
MARKETC
ITYHO
SPITALITY, PU
NE
Current Status
Map
3D Elevation
Current Status
Investment Summary
City Population: 3.52 millionEconomic Drivers: Manufacturing, IT, Automobiles, Education
Asset Class Hospitality development
DevelopmentPartner
The Phoenix Mills, a leading real estate developer, specializing in large format mixed use developments
Hotel Area 300,000 sq ft
K2’s Commitment €4.58 million (fully disbursed)
K2’s Equity Stake 20%
Land Acquisition Completed
Development Plans Completed
Planning Approvals Received
Debt NA
Construction Status Mall structure complete. Super structure (above the mall) to commence once there is clarity of the way forward
Sales/Leasing Update
NA
Completion Date Under review
Comments Overall viability of the business plan being re-evaluated
3535
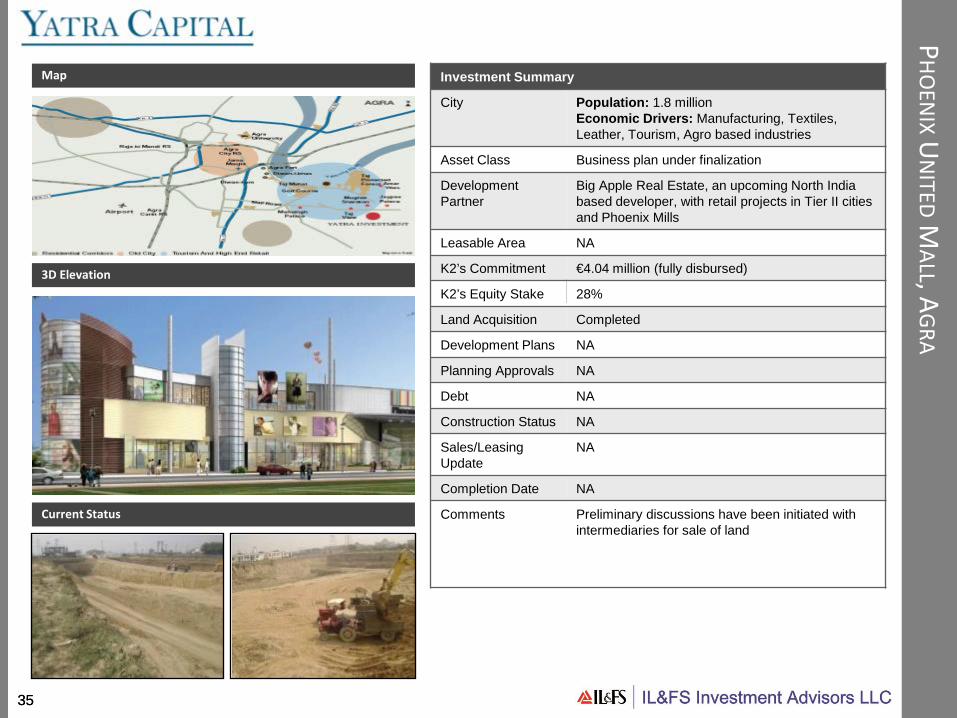
PHO
ENIXU
NITED
MALL, A
GRA
Current Status
Map
3D Elevation
Current Status
Investment Summary
City Population: 1.8 millionEconomic Drivers: Manufacturing, Textiles,Leather, Tourism, Agro based industries
Asset Class Business plan under finalization
DevelopmentPartner
Big Apple Real Estate, an upcoming North India based developer, with retail projects in Tier II cities and Phoenix Mills
Leasable Area NA
K2’s Commitment €4.04 million (fully disbursed)
K2’s Equity Stake 28%
Land Acquisition Completed
Development Plans NA
Planning Approvals NA
Debt NA
Construction Status NA
Sales/Leasing Update
NA
Completion Date NA
Comments Preliminary discussions have been initiated with intermediaries for sale of land

3636
THEPHO
ENIX
MILLSLIM
ITED
Investment Summary
Company Profile The Phoenix Mills (PML) is a mid cap real estate company with a focus on the retail, commercial and entertainment segments in Tier I and Tier II cities. PML’s flagship project, High Street Phoenix, in Lower Parel, Mumbai was the first retail centre developed by the Phoenix Group in India. Developed on 1.5 million sq ft of space, the complex houses retail, entertainment, commercial and residential complexes and is being steadily expanded in phases.
K2’s Commitment €3.73 million (fully disbursed)
K2’s Equity Stake 0.44%
Current Status The Pune Mall is now operational, and handover of retail space for fitouts has commenced in the other Market City projects. With more projects becoming operational later this year and greater certainty around the revenues likely, we expect the share price to appreciate further
Stock Performance Closing stock price of The Phoenix Mills Limited as on June 30th 2011 was INR 952 per share (Adjusted for stock split). This represents a 40% mark-to-market loss on our original investment of INR 1,600 per share
Stock Performance
Phoenix Mills Sobha Dev Purvankara BSE Realty Index