results for the six months ended 31 december...
TRANSCRIPT

1
Interim results for the six months ended 31 December 2009 PureCircle (www.purecircle.com), the world’s leading producer of Natural High Intensity Sweeteners, including Reb A, today announces results for the six months ended 31 December 2009. SUMMARY FINANCIALS Six months ended 31 December (US$m)
2009 (H1 FY 2010)
2008 (H1 FY 2009)
Revenue 37.5 21.6 Gross profit 10.2 7.2 Operating profit 2.6 2.1 Net profit after tax and minority interests 1.5 2.1 Earnings per share (US cents) 1.12 1.57
HIGHLIGHTS
• Stevia market adoption is accelerating: Mintel reports 200 new stevia sweetened product launches in 2009 and 60 already in the first two months of 2010.
• Stevia sweetened sales represent over 12 per cent of the total US table‐top market, and are close to Aspartame and Saccharine levels, after just one year of regulatory clearance.
• This momentum plus the growing use of stevia with sugar, continues to move stevia towards becoming a mainstream mass volume sweetener.
• PureCircle’s contracted customers represent a high proportion of the major companies who have launched new products across all regions.
• PureCircle, with the industry’s only established mass volume supply chain, is well poised for increases in market sales velocity.
• Our business planning is based on a mass volume business model. We continue to invest in scaling our supply chain to support our industry leadership.
• Production capacity is more than 200 per cent larger than H1 FY 2009. Our actual H1 FY 2010 production of 230 tonnes of Reb A was double actual production in H1 FY 2009, but still represents less than 25 per cent of available capacity.
• Low capacity operations leave profits (gross and net) sensitive to volumes. The six months results should not in isolation be seen as indicative of long term trends.
• PureCircle has a strong balance sheet, further strengthened by a placing in November 2009 that raised $67m gross ($65m net).
• The Company is well capitalised to lead the strategic development of the industry. • Our Natural Sweet Ventures joint venture with Imperial Sugar is one of several strategic opportunities
that we see developing. • Sales revenues in H1 FY 2010 increased 74 per cent versus H1 FY 2009. • At 31 December 2009 the Group had:
o Gross assets of $272m (31 December 2008 ‐ $152m) o Gross cash of $80m (31 December 2008 ‐ $27m) o Net debt of $20m (31 December 2008 ‐ $31m)
Paul Selway‐Swift, Chairman of PureCircle, commented: “We are pleased to report a strong first half performance. With widespread regulatory clearances and many product launches across numerous categories and in many regions, we believe stevia is continuing to develop towards being a major global industry. Our strategy remains one of being a leading player in this developing global industry that did not exist a few years ago. We continue to see strong interest from the largest Food & Beverage companies, but product launches on a mass scale require planning and executing over an extended period. So, our sales will remain volatile and it will take time for the true long term sales velocity of our unique products to become apparent. Our business model is based on global mass volume supply. We have demonstrated that we can scale our supply chain and have robust plans in place to continue doing so.
This is an exciting time for PureCircle. As with all businesses, challenges remain, but we look forward to reporting on further progress” 22 March 2010 ENQUIRIES PureCircle Limited Magomet Malsagov, Group CEO +60 1 2388 8049 William Mitchell, Group CFO +44 7974 005 163 Westport Communications Alan Frame +44 20 7065 2690 RFC Corporate Finance Ltd Stephen Allen +61 8 9480 2500
Chairman & Chief Executive’s statement 1. REVIEW
This report covers the six months to 31 December 2009. We ended the period with strong long term growth prospects for the market clearly established and with PureCircle recognised as the leading stevia supplier globally. We are well capitalised, are winning a high proportion of new stevia industry customers and are well placed to accelerate our growth as the overall market demand velocity increases. Our assessment is that stevia will become a mass volume mainstream ingredient, which will require mass volume scaled supply. Our business planning is based on a mass volume business model. This continues to require significant investment ahead of the sales curve in all areas of our business: leaf development, production capacity, research and development and sales and marketing resources. The mass volume business model is sensitive to volumes and whilst operating at low capacity utilisations profitability can be impacted significantly by relatively modest changes in volume. In this context we do not consider that the six month results to 31 December 2009 should be viewed in isolation as indicative of long term trends. The future success of PureCircle is tied to the growth prospects of the stevia market and of the Food and Beverage products launching with stevia as their sweetening ingredient. Therefore the first part of our statement focuses on developments in the market. Quality scaled supply is critical to support a mass volume market. The second part of our statement focuses on our supply chain and sets out why our customers believe that PureCircle is ready to support the mass volume market. In overview the Company remains fully on track to deliver the significant long term growth opportunity that we described at our IPO in December 2007 and at our share placing in November 2009. The stevia market is accelerating. We believe it is past the “tipping point” and it is moving mainstream, although we believe the real long term sales velocity will not be evident until 2011 at the earliest. When the market does go mass, PureCircle is established as the global leader and is well placed to secure significant profitable growth.

2. MARKET
2.1. Market – Strong long term drivers of growth
The stevia market’s strong growth prospects are underpinned by consumers’ need for a natural sweetener that will help them control their calorie intake. The incidence of obesity and diabetes are each already officially at world epidemic levels and are growing daily. The huge medical and hospitalisation costs of addressing the epidemics are forcing governments to look hard at regulating the calorific content of Food and Beverage products. All major Food and Beverage companies are working actively to bring lower calorie solutions to market, particularly natural solutions like stevia.
Specific initiatives include Nestle’s commitment to reduce calories across their entire product portfolio; the high profile USA “Let’s Move” campaign launched in the summer of 2009; the launch by major Food and Beverage companies of the Healthy Weight Commitment Association; and the USA Beverage industry’s decision to disclose calories based on 12 ounce servings not eight ounces.
2.2. Market – Regulatory
Continued progress in terms of regulatory clearance stevia products means there is now little doubt that it is only a question of time before all major markets will grant regulatory approval.
France approved stevia as a food ingredient in September 2009. With Switzerland and France now cleared, both home to numerous major Food and Beverage companies, there is significant momentum for European‐wide clearance. Indications from EFSA suggest that preliminary safety reviews will be disseminated by mid 2010. This will pave the way for full EU clearance for stevia to be used as a mainstream ingredient by spring 2011.
As usage grows the regulatory environment is becoming more supportive of stevia. We believe that there will be regulatory approval for a wider variety of stevia products in the coming months, not just Reb A and “JECFA 95”. PureCircle supports this and is promoting actively the opening up of regulatory approvals for a wider portfolio of steviol glycosides. This will enable a portfolio of regulated products to be available at price points that allow usage in all geographic markets to address the obesity and diabetes epidemics that know no country borders.
2.3. Market – Stevia product launches rapidly gaining market share
Mintel data indicates that there were more than 200 new products launched using stevia in 2009 and that there have already been over 60 new launches in just the first two months of 2010. In the USA High Intensity table top category, the January 2010 Nielsen data shows that stevia‐sweetened brands now account for a 13 per cent share. This represents a rapid penetration of the market and, for example, already compares favourably with long established Aspartame and Saccharine sweeteners which have 14 and 16 per cent share respectively. Stevia table top launches in Australia, Switzerland and France have been growing market share across the last six months.
Stevia's development in table top is being mirrored in other categories. A growing number of the world's biggest Food and Beverage companies are now turning to stevia to provide naturally sweetened calorie‐reduced products for their consumers. Recent launches include a variety of brands from Danone, Nestle, PepsiCo, WhiteWave and Goodman Fielder. Stevia is being used by a growing list of major retailers, including Coles in Australia. In the USA, PepsiCo has extended the range of Sobe Lifewater flavours using PureVia Reb A. Following strong demand from consumers for the first five Sobe flavours featuring stevia, two additional flavours, Strawberry Dragonfruit and Cherimoya Punch, have been launched in January 2010. In PepsiCo's Trop 50 range, which contains 50 percent fewer calories than regular Tropicana products, recent launches include Pomegranate Blueberry and Pineapple Mango. In the large USA soy milk category WhiteWave's Silk Chocolate Light has been launched as the brand's first all natural, stevia‐sweetened soy milk.
In New Zealand Frucor is marketing Revive Supplement Water, the country's first low calorie vitamin‐enhanced beverage featuring Reb A. Also in New Zealand Goodman Fielder's Meadow Fresh Lite yoghurt was reformulated to replace artificial high intensity sweeteners with Reb A, available in four flavours. In Australia Coles has launched a range of hot cross buns with Reb A. In Canada PepsiCo recently unveiled Aquafina Plus Vitamins 10 Cal, the country's first low calorie, vitamin enhanced water to feature stevia. In Latin America PepsiCo launched Gatorade G2 in Mexico and Danone's Levite flavoured water brand is now incorporating Reb A in some products. In Malaysia Nestle rolled out Yoco yoghurt in a variety of flavours and sweetened with stevia. Also in Malaysia Nestle now sells Bliss Drinkable yoghurt in seven flavours, again sweetened with stevia. Other market developments include a survey from KnowGenix which suggests that stevia sweeteners are on track to capture more than 50 per cent of the combined aspartame and sucralose markets.
2.4. Market – Sales Contracts
PureCircle is constrained by confidentiality clauses in announcing many customer supply contracts, particularly before our clients announce their own product launches.
We are securing an accelerating number of new customer contracts, a high proportion of which we believe will form the basis of long term global relationships of some scale. Importantly, while we continue to win share in the beverage sectors, in H1 FY 2010 we also secured our first global food category contracts and expect more to follow in the coming months. Most of our clients start their stevia usage with brand or line extensions in test markets so early volume requirements are small. However we are securing clients who will scale their usage substantially in future years and who are looking for supplier partners who can support their product roll‐outs globally. Our major clients want reliable service, category specific applications and clear pricing and innovation road maps that allow them to use stevia strategically. The feedback suggests that we lead the industry in each of these areas.
Knowing the contracts we have secured and are currently negotiating, PureCircle is confident that it is by some margin the leading stevia supplier in the world and that we continue to secure the majority share of market. We expect that as the overall market usage speeds up, there will be a significant acceleration in our sales.
2.5. Pricing
Our long term strategy is for stevia to be used as a mainstream mass volume commodity sweetener, just like sugar and corn. To achieve this the long term pricing of stevia has to be cost competitive with corn and sugar, on an equivalent sweetness, volume usage and proposition basis.
We encourage our customers to look at stevia strategically in this manner and our corporate strategy is to ensure we are positioned to be able to deliver this pricing long term for mass volume usage. This is a critical marketing communication which will accelerate wider usage. As market leaders with clear production scale and efficiency advantages, our pricing strategy also provides a powerful unique selling point for the Company. We are using our lowest cost producer capability to secure important long term market share.
2.6. Marketing – Industry trust trademark
In H1 FY 2010 PureCircle developed the concept of a Stevia Industry Trust and Quality Trademark: “Stevia by PureCircleTM”. This is being launched in H2 2010 in a marketing campaign fully integrated into our customers’ own launch plans. By closely aligning the Industry trust and quality attributes to the Company, we are generating additional recognition and brand equity for PureCircle.

The industry trademark programme is underpinned by a nationwide USA consumer research programme PureCircle commissioned in 2009. This was undertaken by LaunchForce, a USA consumer research company that specialises in the “four legged consumer” (i.e. Mother and Child). The research confirmed the inherent strength of the stevia natural sweetener proposition in the minds of consumers. The research also identified opportunities to build consumer trust in the stevia natural sustainable supply chain and to educate about the many benefits stevia can bring to the consumer’s balanced diet and lifestyle.
Our Industry leadership with this important consumer communication initiative has been well received by our major clients. We expect the trademark to be carried by a number of major products and for the communication to form an integral part of their launch programmes. The level of investment in this initiative will accelerate across 2010 and 2011, aligned with customer launches.
3. SUPPLY CHAIN
Over the past two years the Group has invested heavily developing a supply chain sufficiently robust to provide for rapid growth in the scale of both the Company and the market. Based on detailed supply chain audit verification, there is now a high level of customer confidence that PureCircle has scaled and is ready to support a major ingredient industry as stevia demand takes off. Our customer confidence is based on the progress we have made in all areas of supply chain: leaf, extract, refining and logistics.
3.1. Leaf
Our strategy for leaf has been to increase the quality of leaf in all markets, increase the percentage of leaf supply “controlled” by PureCircle and to diversify supply from China across multiple countries in Asia, Africa and the Americas. The Group made strong progress on all these fronts in the six months. We started FY 2010 with 7,000 tonnes of leaf in inventory, enough to produce almost 200 tonnes of Reb A. We have again been the largest buyer in the 2009 China leaf season, purchasing at least double the volumes of any other company. If the opening inventory position is taken into account, we remain the dominant purchaser with well over 50 per cent market share. We have used this strong position successfully to negotiate and accelerate a number of key improvements in the China leaf supply market. On leaf quality: the average percentage of Reb A in purchased leaf was higher than in FY 2009 and importantly the level of impurities was lower. This reflects the investment we have made to strengthen the China leaf buying management team and the improved quality control processes in the field that we have implemented. Our leading position in the market has also enabled us to impose quality improvements.
Whilst we have made strong progress in quality in FY 2010, we are targeting further improvements in future years. The foundations built in FY 2009 have paid off in improved leaf and lower prices in FY 2010, and we are confident that we will continue to build on this in the coming years.
On “controlled” leaf: within China we have increased the proportion of leaf purchased from high quality leaf propagation stock sourced from PureCircle and from farmers and regions working directly with our leaf technical teams. This has reduced considerably our exposure to the more volatile and variable quality of the open market supply. Again we have made progress, and are targeting further improvements in future years.
On diversified supply: within China we have successfully diversified supply. Stevia is now sourced by PureCircle from six regions as opposed to just the three main areas of two years ago.
Looking outside China, our strategy is to create supply regions in Africa, South America and South East Asia, each with viable standalone critical mass. Our approach is to own an R&D and propagation based subsidiary in each region and then to work with third party partners to develop secure stable supplies of quality leaf. The Group has made strong progress on both fronts.
In H1 FY 2010 we bought out our partners in both the Paraguay and Kenya joint ventures. Since taking 100 per cent control our pace of development in each country has accelerated significantly. Both now have fully viable standalone operations that are acting as the regional centres of excellence they were intended to be. In addition we have strengthened our global leaf management with the recruitment of leading horticultural development managers for each leaf supply continent.
Strong support from our wholly owned propagation subsidiaries and from the new development management has enabled our third party partners to accelerate significantly. We now have partners growing stevia for purchase by PureCircle in a dozen different countries across four continents. We estimate that at least 40 per cent of our total requirement will come from these good quality “controlled” suppliers by end 2012.
3.2. Extract
The Group produced record levels of stevia extract in H1 FY2010, benefitting from the major capacity and technology improvements that our most recent $35m investment in PureCircle Jiangxi provides. All extract Key Performance Indicators have improved significantly compared to prior periods: for example total production was up, average quality improved and cost per unit reduced. Our stevia extract unit at Jiangxi is producing four times as much volume with a consistently higher Reb A content and at a unit cost of just 80% compared to just two years ago.
In addition our industry leading extract technology is enabling us to produce a much wider range of steviol glycoside products than previously. This supports our strategy of maximising the total sales revenues from each kilo of leaf. Market intelligence suggests that our steviol glycoside product range is now the most flexible in the industry. The H1 FY2010 sales volumes bear some initial confirmation of this assessment.
3.3. Refining
The Group produced record volumes of refined high purity Reb A in H1 FY 2010. In fact our total production in the six months was close to that for the full year FY 2009. Again all our refining Key Performance Indicators showed strong progress against prior periods. Compared to the six months to December 2008 our batch size and production volumes were each up more than 100 percent and our variable (i.e. leaf) unit cost of production was reduced by 15 per cent. As importantly all our quality and consistency indicators have also improved.
To put the refining scaling in context, one of our high purity Reb A scaled batches is now equivalent to some 1,500 tonnes of refined sugar and is sufficient to sweeten more than 26 million cans of soda.
Whilst accelerating actual production we have successfully expanded the capacity at our Malaysian refinery to 2,000 tonnes of high purity Reb A.
4. FUND RAISING AND SIGNIFICANT SHAREHOLDING
In November 2009 we raised $67m gross, $65m net of expenses, of new capital through the placing of 20 million new ordinary shares at an issue price of GBP 2.00 each. The fund raising means that PureCircle is well positioned to take full advantage of the expected increases in demand for stevia as the industry moves mainstream.
The fund raising was well supported with major new international funds participating in the placing, which was significantly oversubscribed.
Additionally, 20 per cent of the placing was subscribed by Olam International (“Olam”), which also in December 2009 bought out the interests in PureCircle of its Joint Venture partner. As a result Olam is the owner of 20 per cent of the shares of the Company.
5. MANAGEMENT
The Group has continued to invest in management to prepare and support the Group for market leadership. The investments made in leaf buying, leaf development, production and other supply chain activities are already enabling significant productivity gains. Early in 2010 we made some changes to our sales and marketing team, notably in Europe, to ensure better delivery of support to our clients and emerging markets.

6. RESULTS
Overall revenues of $37m for H1 FY 2010 increased by $16m (74 per cent) versus comparable sales for the six months to 31 December 2008 (H1 FY 2009). High purity Reb A sales increased with higher volumes and slightly stronger unit prices, compared to H1 FY2009. Sales of our wider portfolio of stevia products grew strongly reflecting our emphasis on maximising revenues from all steviol glycosides. There is growing market demand for a portfolio of steviol glycosides and PureCircle is well placed to respond to it.
The H1 FY 2010 gross profit of $10.2m increased $3m (41 per cent) compared to H1 FY 2009. The gross margin percentage reduced six points versus H1 FY 2009, due to increased production capacity costs. The H1 FY 2010 extract production capacity is 300 per cent larger than H1 FY 2009, and the refining capacity 100 per cent larger. So “fixed” production costs including depreciation, production labour, utility and related charges all increased over H1 FY 2009. The $3m increase in these costs equates to eight points of gross margin. After adjusting for this, underlying gross margin improved by two percentage points. Actual production for the six months was over 230 tonnes, an increase of over 100 per cent from H1 FY 2009. However the Group continues to operate at low capacity utilisation: H1 FY 2010 production represents less than 25 per cent, of capacity. Therefore production margins will benefit as throughput increases. Underlying variable unit costs of production reduced by almost 15 per cent, due to improvements in leaf buying and initial production synergies from the new extract technology employed in PureCircle Jiangxi. With variable costs of production reducing, future gross margins will benefit from increased volumes. Sales and general overheads increased by $2.5m versus H1 FY 2009 reflecting the investments the Group made in building a global sales organisation. This was largely put in place towards the end of calendar 2008, so H1 FY 2009 comparatives bore little equivalent investment cost. As announced at the time of the placing in November 2009, during calendar 2010 the Group will be investing in marketing to support the Stevia by PureCircle Industry quality and trust trademark. In addition, since taking 100 per cent ownership, the Group has accelerated the rate of investment in its leaf development subsidiaries in Kenya and Paraguay. The Group’s business planning is on the basis of a mass volume business model. PureCircle has continued to invest heavily in production and organisational capacity. This means we are highly geared operationally, with net profit sensitive to sales volumes. Historically sales have been weighted to the second half of the year. The tax charge represents increased profitability in H1 FY 2010 from our extract operations. We anticipate tax as a percentage of Group net profits to reduce over the balance of the year as our refining and sales units do not currently incur tax. The Group has a strong balance sheet. This was further strengthened by the share placing in November 2009 that raised GBP40m ($67m) gross. At 31 December 2009 the Group had gross assets of over $270m and net debt of $20m.
Operating cashflow before working capital changes amounted to $8m, a 100% increase over the $4m of H1 FY 2009. Cashflow from operations was a net cash outflow of $25m, a $4m improvement on H1 FY2009. Within operating cashflow, working capital increased $34m due to higher receivables from increased sales, which have been collected in cash since the period ended, and seasonal inventories, including raw leaf stocks that will reduce with production in the coming months.

The Group has deliberately built inventories of finished goods in H1 FY 2010. This is to better smooth production across the full year, which optimises the unit costs of production, rather than for example matching production timing to sales. In addition, as announced at the time of the placing, we are starting to build finished goods inventory holdings in our customers’ markets to provide improved support for them and to accelerate sales. Capital expenditure of $8m (H1 FY 2009 $19m) was mainly in respect of residual payments for the expansion of our Jiangxi extract capacity that came on stream in late FY 2009.
Net debt of $20m is due to seasonal increases in working capital. For example after adjusting for leaf inventories the Group was debt free at 31 December 2009. The Group’s policy is to drawdown on its debt facilities for working capital, leaving cash balances available to finance the future development of the business. The Group is well capitalised and well poised to lead the strategic development of the global industry.
7. STRATEGIC DEVELOPMENTS
As the stevia market accelerates the Group sees significant opportunities to consolidate and strengthen its leadership position through corporate activity. Our strategy is to do so actively. Our Natural Sweet Ventures joint venture with Imperial Sugar announced on 22 February 2010 is the first example of these opportunities. Although not reflected in the results of the period under review we are pleased with the progress that Natural Sweet Ventures is already making and the opportunities that working with Imperial Sugar are giving rise to. We look forward to reporting on further strategic developments in the future.
8. OUTLOOK
The period since we last reported in September 2009 has seen more stevia sweetened products launched in more countries, across more Food and Beverage categories by more global businesses. Looking forward, the questions are not about if but rather how fast the market will grow, what shape it will ultimately take and to what extent will our customers’ new product launch momentum be impacted by global economic pressures.
We believe that stevia will become a mass volume mainstream natural sweetener with market characteristics more akin to sugar than to other niche market artificial high intensity sweeteners. Our business model is set up to produce mass volume products and we have scaled our supply chain to be ready for mass demand. We believe the benefits of this will be seen increasingly across calendar 2010, 2011 and future years.
We look forward to reporting on further progress in the future.
Paul Selway‐Swift, Chairman Magomet Malsagov, Chief Executive 22 March 2010

NOTES TO EDITORS
About PureCircle
PureCircle (LSE:PURE) is the world’s leading producer of natural high intensity sweeteners including high purity Rebaudioside A (‘Reb A’). With a vertically integrated supply chain operating in four continents, PureCircle markets its range of products internationally. The Group sources dry stevia leaves, undertakes extraction processes and refines the extract into sweeteners which it then markets as a mainstream ingredient to Food and Beverage manufacturers worldwide.
PureCircle’s extraction plant is capable of producing 4,000 tonnes of stevia extract annually, making it by far the world’s largest extraction facility. The Company has also the world’s largest state‐of‐the‐art refining plant in Malaysia with capacity of 2,000 tonnes of high purity Reb A. The Company’s production facilities operate in compliance with cGMP, HACCP and ISO standards.
PureCircle’s investment in research and development has given it a leadership position in the manufacture of high‐purity Reb A, and their scientists are globally recognised experts in their field.
The Company works with independent farmers to grow the best quality stevia leaf and is working with partners growing stevia across countries in South East Asia, South America and Africa. PureCircle works closely with communities in each region and endeavours to maximise the social, economic and environmental benefits of its operations.
PureCircle’s corporate offices are located in Chicago, USA; Asuncion, Paraguay; Geneva, Switzerland; Kuala Lumpur, Malaysia; Ganzhou, China and Kericho, Kenya.
PureCircle is listed on the London Stock Exchange AiM market under the ticker symbol: PURE
For more information on PureCircle visit: www.purecircle.com
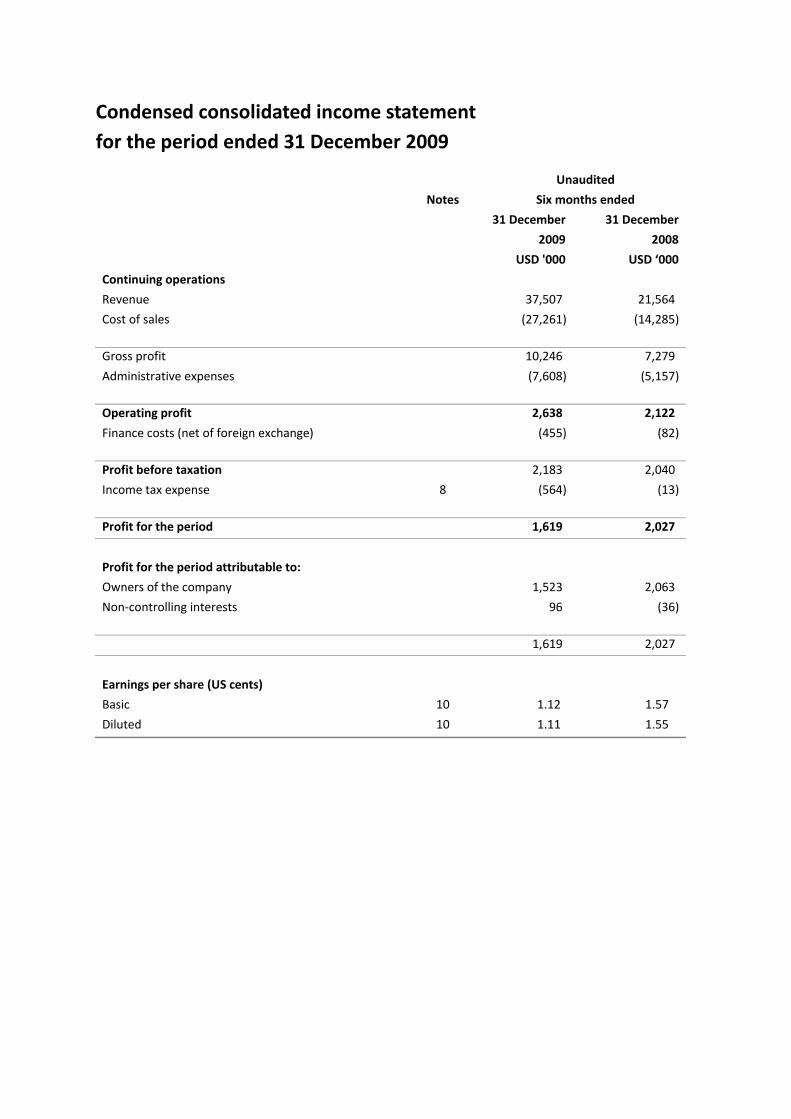
Condensed consolidated income statement for the period ended 31 December 2009
Unaudited
Notes Six months ended
31 December 31 December
2009 2008
USD '000 USD ‘000
Continuing operations
Revenue 37,507 21,564
Cost of sales (27,261) (14,285)
Gross profit 10,246 7,279
Administrative expenses (7,608) (5,157)
Operating profit 2,638 2,122
Finance costs (net of foreign exchange) (455) (82)
Profit before taxation 2,183 2,040
Income tax expense 8 (564) (13)
Profit for the period 1,619 2,027
Profit for the period attributable to:
Owners of the company 1,523 2,063
Non‐controlling interests 96 (36)
1,619 2,027
Earnings per share (US cents)
Basic 10 1.12 1.57
Diluted 10 1.11 1.55

Condensed consolidated statement of comprehensive income for the period ended 31 December 2009
Unaudited
Six months ended
31 December 31 December
2009 2008
USD '000 USD ‘000
Profit for the period 1,619 2,027
Other comprehensive income:
Exchange differences arising on translation of foreign operations
(584)
(72)
Total comprehensive profit for the period (net of tax) 1,035 1,955
Attributable to:
Owners of the company 939 1,991
Non‐controlling interests 96 (36)
1,035 1,955

Condensed consolidated statement of financial position as at 31 December 2009
Unaudited Unaudited Audited 31 December 31 December 30 June Notes 2009 2008 2009 USD '000 USD '000 USD '000
Assets
Non‐current assets Property, plant and equipment 5 69,257 48,837 64,968 Intangible assets 5 15,798 11,401 14,018 Investment in associate ‐ 101 48 Prepaid land lease payments 2,718 2,311 2,776
87,773 62,650 81,810
Current assets Inventories 6 59,140 36,081 31,452 Trade receivables 30,826 14,997 27,173 Other receivables 13,701 10,599 11,020 Cash and cash equivalents 80,287 27,345 18,920
183,954 89,022 88,565
Total assets 271,727 151,672 170,375
Equity and liabilities
Capital and reserves
Share capital 9 15,290 13,272 13,272 Share premium 9 128,943 64,224 66,353 Treasury shares * * * Foreign currency translation reserve 448 1,367 1,032 Share option reserve 2,036 1,169 1,704 Retained earnings 13,799 3,136 12,276
Equity attributable to owners of the company 160,516 83,168 94,637 Non‐controlling interests 776 2,821 600
Total equity 161,292 85,989 95,237
Non‐current liability Borrowings 7 59,069 11,098 40,008
59,069 11,098 40,008
Current liabilities Trade payables 4,287 1,789 2,945 Other payables 5,404 4,866 5,766 Borrowings 7 41,675 47,930 26,419
51,366 54,585 35,130
Total liabilities 110,435 65,683 75,138 Total equity and liabilities 271,727 151,672 170,375
‐
Net assets per share (USD) 1.19 0.64 0.71
Note: *Represents less than USD1.00

14
Condensed consolidated statement of changes in equity as at 31 December 2009
Foreigncurrency Share Non‐
Share Share Treasury translation option Retained controlling Totalcapital premium shares reserve reserve earnings Sub‐total interests equityUSD '000 USD '000 USD '000 USD '000 USD '000 USD '000 USD'000 USD '000 USD '000
Balance at 1 July 2009 13,272 66,353 * 1,032 1,704 12,276 94,637 600 95,237
Profi t for the period ‐ ‐ ‐ ‐ ‐ 1,523 1,523 96 1,619 Other comprehens ive income:Exchange difference ari s ing on trans lation offoreign operations ‐ ‐ ‐ (584) ‐ ‐ (584) ‐ (584)
Tota l comprehens ive income for the period (net of tax) ‐ ‐ ‐ (584) ‐ 1,523 939 96 1,035
Share placements 2,000 61,860 ‐ ‐ ‐ ‐ 63,860 ‐ 63,860 Gain on sa le of treasury shares^ ‐ 180 ‐ ‐ ‐ ‐ 180 ‐ 180 Share option scheme compensation expensegranted during the period ‐ ‐ ‐ ‐ 720 ‐ 720 ‐ 720
Exercise of share options 18 550 ‐ ‐ (388) ‐ 180 ‐ 180 Equi ty subscription by non‐control l ing interests ‐ ‐ ‐ ‐ ‐ ‐ ‐ 80 80
Balance at 31 December 2009 15,290 128,943 * 448 2,036 13,799 160,516 776 161,292
Attributable to owners of the Company
* ‐ Less than USD1.00 ^ ‐ Gain/(Loss) not recognised in Income Statement

Condensed Consolidated Statement of Changes in Equity as at 31 December 2009
Foreigncurrency Share Non‐
Share Share Treasury translation option Retained controlling Totalcapital premium shares reserve reserve earnings Sub‐total interests equityUSD '000 USD '000 USD '000 USD '000 USD '000 USD '000 USD'000 USD '000 USD '000
Balance at 1 July 2008 13,272 64,104 * 2,251 480 1,490 81,597 1,383 82,980 Effect of IAS 21 ‐ ‐ ‐ (812) ‐ (417) (1,229) (2) (1,231)
As restated 13,272 64,104 * 1,439 480 1,073 80,368 1,381 81,749
Profi t for the period ‐ ‐ ‐ ‐ ‐ 2,063 2,063 (36) 2,027 Other comprehens ive income:Exchange difference ari s ing on trans lation offoreign operations ‐ ‐ ‐ (72) ‐ ‐ (72) ‐ (72)
Tota l comprehens ive income for the period (net of tax) ‐ ‐ ‐ (72) ‐ 2,063 1,991 (36) 1,955
Gain on sa le of treasury shares^ ‐ 120 * ‐ ‐ ‐ 120 ‐ 120 Share option scheme compensation expensegranted during the period ‐ ‐ ‐ ‐ 689 ‐ 689 ‐ 689
Equi ty subscription by non‐control l ing interests ‐ ‐ ‐ ‐ ‐ ‐ ‐ 1,476 1,476
Balance at 31 December 2008 13,272 64,224 * 1,367 1,169 3,136 83,168 2,821 85,989
Attributable to owners of the Company
Note * ‐ Less than USD1.00 ^ ‐ Gain/(Loss) not recognised in Income Statement

Condensed consolidated cash flow statement for the period ended 31 December 2009
31 December 31 December2009 2008
USD '000 USD '000
Cash Flows (for)/from operating activitiesProfi t before taxation 2,183 2,040
Adjustments for:‐Amortisation of prepa id land lease 58 (32) Depreciation of property, plant & equipment 2,864 1,097 Interest expense 2,241 2,195 Interest income (25) (277) Unreal i sed gain on foreign exchange 32 (1,655) Share of loss of an associate 9 25 Share option reserve 720 689 Gain on disposa l of an associate (66) ‐
Operating cash flow before working capita l changes 8,016 4,082 Increase in inventories (27,232) (26,239) Increase in trade and other receivables (6,561) (10,539) Increase in trade and other payables 917 3,445
Net cash for operations (24,860) (29,251) Interest received 25 277 Interest paid (2,241) (2,195) Tax paid (564) (13)
Net cash for operating activities (27,640) (31,182)
Additions to property, plant & equipment (7,119) (17,611) Additions to intangible assets (1,043) (1,130) Additions to leasehold land ‐ (26) Proceeds from disposa l of interest in an associate 105 ‐
Net cash for investing activities (8,057) (18,767)
Proceeds from non‐control l ing interests 80 ‐ Proceeds from shares placement 64,040 ‐ Net drawdown of borrowings 32,414 33,183 Proceeds from disposa l of treasury shares 180 120
Net cash from financing activities 96,714 33,303
Effect of foreign exchange rate changes on cash and cash equiva lents 350 (72)
Net increase/(decrease) in cash and cash equivalents 61,367 (16,718) Cash & cash equiva lents at beginning of period 18,920 44,063
Cash & cash equivalents at end of period 80,287 27,345
Unaudited Six months ended

Notes to interim financial statements
1. General information
The Company was incorporated and registered as a private limited company in Bermuda, under the Companies (Bermuda) Law 1991 (as amended). The Company has its primary listing on the Alternative Investment Market (AiM) operated by the London Stock Exchange, plc.
The condensed consolidated interim financial statements have been reviewed, not audited, and were approved for issue on 19 March 2010.
2. Basis of preparation
The condensed consolidated interim financial statements for the six months ended 31 December 2009 have been prepared in accordance with IAS 34, “Interim financial reporting”. The condensed consolidated interim financial statements should be read in conjunction with the Group’s annual financial statements for the year ended 30 June 2009, which have been prepared in accordance with IFRSs.
3. Accounting policies
The condensed interim financial statements have been prepared under the historical cost convention.
Except as described below, the accounting policies applied are consistent with those of the annual financial statements for the year ended 30 June 2009, as described in those financial statements.
3(a) IAS 1 (Revised) ‐ Presentation of financial statements
The revised standard requires all changes in the equity arising from transactions with owners in their capacity as owners be presented separately from non‐owners changes in equity. Recognised income and expenses shall be presented in a single statement (a statement of comprehensive income) or in two statements (a statement of profit and loss and a statement of comprehensive income), separately from owner changes in equity.
Entities can choose whether to present single comprehensive income statement or two statements (the income statement and statement of comprehensive income).
The Group has elected to present two statements: an income statement and a statement of comprehensive income. The condensed consolidated interim financial statements have been prepared under the revised disclosure requirements.
The revised standard is mandatory for the first time for the financial year beginning 1 January 2009.

3(b) IFRS 8 – Operating segments
IFRS 8 replaces IAS 14 “Segment Reporting”. It requires a “management approach” under which segment information is presented on the same basis as that used for internal reporting purposes. It replaces the requirement under IAS 14 to determine primary (business) and secondary (geographical) reporting segments of the Group. Adoption of this standard does not have any effect on the Group’s results of operations or financial position. The Group determines that the operating segments are the same as the business segments previously under IAS14.
As of 1 January 2009 the Group determines and presents operating segments based on the information that internally is provided to the CEO, who is the Group’s chief operating decision maker. This change in accounting policy is due to the adoption of IFRS 8 Operating Segments. Previously operating segments were determined and presented in accordance with IAS 14 Segment Reporting. The new accounting policy in respect of segment operating disclosures is presented as follows. Comparative segment information has been re‐presented in conformity with the transitional requirements of IFRS 8. Since the change in accounting policy only impacts presentation and disclosure aspects, there is no impact on earnings per share.
An operating segment is a component of the Group that engages in business activities from which it may earn revenues and incur expenses, including revenues and expenses that relate to transactions with any of the Group’s other components. An operating segment’s operating results are reviewed regularly by the CEO to make decisions about resources to be allocated to the segment and assess its performance, and for which discrete financial information is available. Segment results that are reported to the CEO include items directly attributable to a segment as well as those that can be allocated on a reasonable basis. Unallocated items comprise mainly corporate assets (primarily the Company’s headquarters), head office and shareholders expenses.
The new standard is mandatory for the first time for the financial year beginning 1 January 2009.
3(c) IAS 21 – The effects of changes in foreign exchange rates
Previously, the results and financial position of Group’s entities were measured in local currency and where applicable, translated into USD upon consolidation. Exchange differences arising thereon were taken directly to currency translation differences reserve.
A subsidiary of the Group has adopted Ringgit Malaysia (MYR) functional currency to reflect their underlying transactions, conditions and events which are MYR based. The effect of this change in accounting policy on the consolidated financial statements for the period ended 31 December 2009 is an increase in profit USD1.14 million in the consolidated income statement and currency translation reserve of approximately USD1.14 million in the consolidated balance sheet. The adoption would take effect from 1 July 2009 and in accordance with IAS 21, such change shall apply prospectively from the date of change.

4. Segmental information The Group principally involves in manufacturing, distribution and selling of natural sweetener and carrying out development on stevia varieties activity. The chief executive officer (the chief operating decision maker) reviews the Group’s internal reporting in order to assess performance and allocate resources and determines the Group has three reportable operating segments as follows:
• Manufacturing and selling of natural sweeteners: comprises the extraction and refinery manufacturing activities of natural sweeteners in China and Malaysia and selling of sweetener products in the region of USA, EMEA and JAC (Japan, Australia/New Zealand and China).
• Stevia leaf development: involves in developing stevia varieties for planting by the farmers.
Manufacturing & selling of natural
sweetenersStevia leaf
developmentReportable
segment total Unallocated Total(Asia, North
America & others)(Paraguay &
Kenya)USD '000 USD '000 USD '000 USD '000 USD '000
Six months ended31 December 2009
Total revenue 92,218 ‐ 92,218 ‐ 92,218 Inter‐segment revenue (54,711) ‐ (54,711) (54,711)
Revenue from externa lcustomers 37,507 ‐ 37,507 ‐ 37,507
Reportable segmentprofi t before taxation 2,087 (507) 1,580 603 2,183
Six months ended31 December 2008
Total revenue 45,948 ‐ 45,948 ‐ 45,948 Inter‐segment revenue (24,384) ‐ (24,384) ‐ (24,384)
Revenue from externa lcustomers 21,564 ‐ 21,564 ‐ 21,564
Reportable segmentprofi t before taxation 5,237 (436) 4,801 (2,761) 2,040
Total assets31 December 2009 201,706 5,044 206,750 64,977 271,727 31 December 2008 146,754 2,697 149,451 2,221 151,672

5. Property, plant and equipment and intangible assets
During the period, the Group continues to upgrade its production facilities throughout the regions. Approximately USD2.8 million was invested in constructing the extraction and refinery buildings with the remaining investment spent on plant and machinery. Addition to intangible assets is resulted by the capitalization of new project developments during the period.
6. Inventories
31 December 30 June2009 2009
USD'000 USD'000At Cost:Raw Materials 20,745 18,207 Work‐in‐progress 10,930 10,019 Finished goods 27,465 3,226
59,140 31,452
7. Borrowings
During the period, the Group obtained a new short‐term bank loan in the amount of USD11.0 million. The loan bears interest at rate of 5.85% per annum and is repayable in 1 year. The proceeds were used to meet working capital. Repayments of other bank loans amounting to USD18.2 million were made in line with previous disclosed repayment terms.
8. Income taxes
Income tax expense is recognised based on management’s best estimate of the weighted average annual income tax rate expected for the full financial year. The estimated tax liabilities incurred during period were for the operation in China which was taxed at 12.5% (2008: nil). The rest of the Group has no estimated assessable profit. PureCircle Sdn Bhd (PCSB), a wholly‐owned subsidiary incorporated in Malaysia, has been granted 100% income tax exemption for a period of 10 years commencing from the first profit‐making year and will expire in year 2019.
31 December
2009 USD ‘000
30 June 2009
USD ‘000 Current ‐ Lease and hire purchase 247 61 ‐ Term loans 41,428 26,358 Non‐current – term loans 59,069 40,008 100,744 66,427

PureCircle (Jiangxi) Co Ltd (PCJX), a subsidiary incorporated in the People’s Republic of China, currently enjoys 50% reduction on corporate income tax at a reduced rate of 12.5%, beginning 1 January 2012, PCJX will be taxed at the normal rate of 25%.
9. Share capital, share premium and treasury shares
Number of shares
Ordinary shares
Share premium
Tresuary shares Total
'000 USD '000 USD '000 USD '000 USD '000
Balance at 1 July 2009 132,723 13,272 66,353 * 79,625 Proceeds from shares i s sued‐ Shares placement 20,000 2,000 61,860 * 63,860 ‐ LTIP 653 18 550 ‐ 568 Gain on sa le of treasury shares ‐ ‐ 180 ‐ 180
Balance at 31 December 2009 153,376 15,290 128,943 * 144,233
Balance at 1 July 2008 132,723 13,272 64,104 * 77,376 Gain on sa le of treasury shares 120 ‐ 120 ‐ 120
Balance at 31 December 2008 132,843 13,272 64,224 * 77,496
* Less than USD1.00
In November 2009, the Company carried out a shares placement exercise and issued 20 million ordinary shares at par value of USD0.10 each at a price of GBP2.00 each share. All shares placed were fully subscribed and paid for. In accordance with the Company’s Long Term Incentive Plan (LTIP) implemented for the employees, options were exercised during the period to 31 December 2009 resulted in 653,250 shares being issued (31 December 2008: nil). In accordance with the terms and conditions of the LTIP, majority of the options were exercised without any consideration.
10. Earnings per share
The basic earnings per share is calculated by dividing the profit attributable to owners of the Company by the weighted average number of ordinary shares in issue (excluding the treasury shares) during the period.
31 December 31 December2009 2008
Profi t attributable to equi ty holders of the Company (USD'000) 1,523 2,063 Weighted average number of ordinary shares in i s sue (' 000) 135,991 131,803 Bas ic earnings per share (US Cents ) 1.12 1.57
6 months ended

The fully diluted earnings per share is calculated by dividing the profit attributable to owners of the Company by the weighted average number of ordinary shares that would have been in issued had all the options been exercised:‐
31 December 31 December2009 2008
Profi t attributable to equity holders of the Company (USD'000) 1,523 2,063 Weighted average number of ordinary shares in i s sue ('000) 137,045 133,298 Bas ic earnings per share (US Cents ) 1.11 1.55
6 months ended
11. Dividends
No dividends were declared or paid by the Company during the interim period.
12. Contingent liabilities and capital commitments
Capital commitments amounting to approximately USD3.77mil is contracted but not paid for, these are incurred for the development of new facilities in both Malaysia and China.
13. Events after the end of the reporting period
On 22 February 2010, the Company announced a joint venture with Imperial Sugar Company forming a jointly controlled entity, Natural Sweet Ventures, LLC (NSV) in the USA. The principal activity of NSV is to create reduced calorie natural sweet applications for the food and beverage industry. The joint venture was invested through the Company’s wholly‐owned subsidiary, PureCircle USA Holdings, Inc which was incorporated in the State of Delaware, USA.
14. Significant related party transactions
14(a) Identities of relate parties:
The Group and / or the Company have related party relationships with:
(i) its subsidiaries;
(ii) the directors who are the key management personnel; and
(iii) companies in which certain directors are common directors and / or substantial shareholders.

14(b) The following transactions were carried out by the Group during the period:
(i) Related parties
Six months ended 31 December 31 December 2009 2008 USD ‘000 USD ‘000 Sales of treasury shares to a director of the Company 180 120
Amount owing by a director in respect of shares sold to him 970 970
(ii) Transaction with key management personnel
Key management personnel receive compensation in the form of short‐term employee benefits, and share‐based payment awards valued at USD720,000 for the six months ended 31 December 2009 (2008: USD689,000).
15. Seasonality
The Group’s working capital is affected by the leaf buying season in China which typically runs from July to February.
16. Changes in Composition of the Group In October 2009, the Group acquired 2% of the equity interest in Finlays PureCircle Limited (FPC) that it did not already own for a nominal consideration. The acquisition resulted the Group to now own 100% of FPC. FPC’s name was subsequently changed to PureCircle Kenya Limited.
17. Comparative figures
Certain comparative figures have been reclassified to conform with current period’s presentation.

Report on review of interim financial statements
PURECIRCLE LIMITED (Incorporated in Bermuda) Registration No.: 40431
Introduction
We have reviewed the accompanying interim condensed consolidated financial statements of PureCircle Limited and its subsidiaries (“the Group”) as at 31 December 2009, comprising the interim consolidated balance sheet as at 31 December 2009 and the related interim consolidated statements of income, changes in equity and cash flows for the six‐month period then ended and the explanatory notes. Management is responsible for the preparation and presentation of these interim condensed consolidated financial statements in accordance with International Financial Reporting Standard IAS 34 Interim Financial Reporting (“IAS 34”). Our responsibility is to express a conclusion on these interim condensed consolidated financial statements based on our review.
Scope of review We conducted our review in accordance with the International Standard on Review Engagements 2410, “Review of Interim Financial Information Performed by the Independent Auditor of the Entity.” A review of the interim financial information consists of making inquiries, primarily of persons responsible for financial and accounting matters, and applying analytical and other review procedures. A review is substantially less in scope than an audit conducted in accordance with International Standards on Auditing and consequently does not enable us to obtain assurance that we would become aware of all significant matters that might be identified in an audit. Accordingly, we do not express an audit opinion.
Conclusion
Based on our review, nothing has come to our attention that causes us to believe that the accompanying interim condensed consolidated financial statements are not prepared, in all material respects, in accordance with IAS 34.
Crowe Horwath Firm No.: AF 1018 Chartered Accountants Kuala Lumpur, Malaysia 19 March 2010
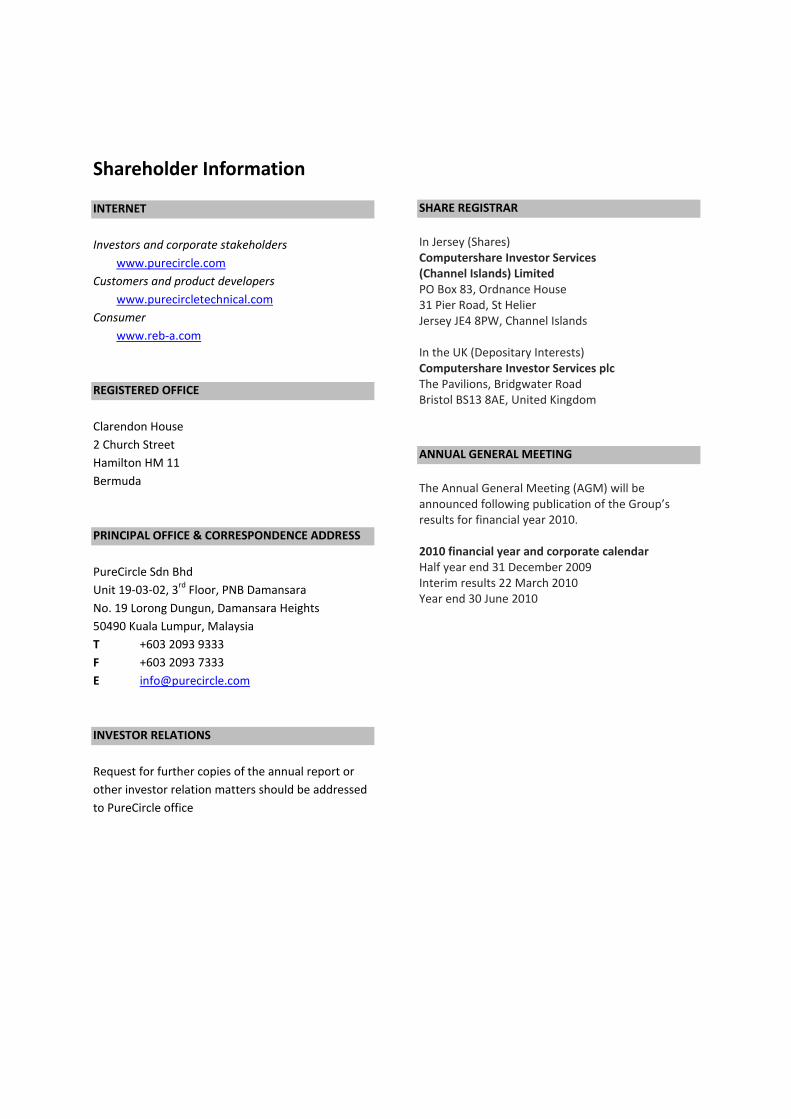
Shareholder Information INTERNET Investors and corporate stakeholders
www.purecircle.com Customers and product developers
www.purecircletechnical.com Consumer
www.reb‐a.com REGISTERED OFFICE Clarendon House 2 Church Street Hamilton HM 11 Bermuda PRINCIPAL OFFICE & CORRESPONDENCE ADDRESS PureCircle Sdn Bhd Unit 19‐03‐02, 3rd Floor, PNB Damansara No. 19 Lorong Dungun, Damansara Heights 50490 Kuala Lumpur, Malaysia T +603 2093 9333 F +603 2093 7333 E [email protected] INVESTOR RELATIONS Request for further copies of the annual report or other investor relation matters should be addressed to PureCircle office
SHARE REGISTRAR In Jersey (Shares) Computershare Investor Services (Channel Islands) Limited PO Box 83, Ordnance House 31 Pier Road, St Helier Jersey JE4 8PW, Channel Islands In the UK (Depositary Interests) Computershare Investor Services plc The Pavilions, Bridgwater Road Bristol BS13 8AE, United Kingdom ANNUAL GENERAL MEETING The Annual General Meeting (AGM) will be announced following publication of the Group’s results for financial year 2010. 2010 financial year and corporate calendar Half year end 31 December 2009 Interim results 22 March 2010 Year end 30 June 2010