results and conlusion
TRANSCRIPT

EXECUTIVE SUMMARY
The National Water Quality Monitoring Programme (NWQMP) was initiated by Pakistan Council of Research in Water Resources (PCRWR) in 2002. It was the premier project of the year which generated the first detailed water quality profile of 23 major cities of the country. The NWQMP continued for five years (2002‐2006). This report is the final and fifth technical report of 2005‐06 and presents the results of the final phase of the monitoring program. During this phase, 357 water samples from 364 selected water sources were collected, adopting the uniform sampling criteria and analyzed for 79 physico‐chemical parameters, including trace, ultra trace elements and bacterial indicators. The analytical findings were compared to World Health Organization (WHO) guidelines and Pakistan Standards Quality Control Authority (PSQCA) standards for drinking water.
In Federal Capital Islamabad, only 7 sources out of 27 (26%) were found safe and the rest of the 74% were unsafe due to bacteriological contamination. In Bahawalpur city, all sources (25) were found unsafe due to bacteriological as well as chemical contamination i.e. arsenic (88%), turbidity (32%), iron (68%), sulfate (20%), sodium (12%), lead (8%) and TDS (16%). In Faisalabad, 3 sources out of 13 were found safe and the remaining 10 sources were found unsafe due to bacteriological contamination, high sulphate and TDS (46%), iron (31%) hardness (23%), sodium (54%), potassium, chlorides (38%) and fluoride (15%). In Gujranwala, all 14 sources were found unsafe due to bacteriological as well as the chemical contamination of arsenic, nitrate and TDS (7%), while only one (1) source was supplying safe drinking water. In Gujrat, 4 sources out of 9 were found unsafe due to bacteriological contamination (56%), turbidity (22%) and iron (11%). In Kasur, all sources (10) were unsafe due to bacteriological contamination and high TDS (40%), arsenic (100%), sodium (50%), potassium (10%), fluoride, sulfate (20%) and nitrate (10%). Lahore, the second largest city of Pakistan has shown an alarming situation of drinking water contamination as all 16 of its sources were supplying unsafe water due to bacteriological (50%) and arsenic (100%) contamination. A similar situation was found in Multan, where all 16 sources were found unsafe due to bacteriological contamination (56%) and arsenic (94%) contamination. In Rawalpindi, out of 15 sources, 11 were found contaminated by bacteriological contamination (53%) and TDS (7%) and nitrate (47%). In Sargodha city, only one source, out of a total of 24 locations, was found safe for drinking purpose and the major causes of contamination were bacteriological (83%), arsenic (13%), sodium (54%), potassium (29%), chloride (46%), sulfate (38%), TDS (67%), nitrate (54%) and fluoride (4%). A similar situation was prevailing in Sheikhupura, where all 11 sources were supplying unsafe water to the public mainly due to the presence of bacteriological contamination (45%), excessive levels of potassium, sulphate and nitrate (9%), arsenic (73%), sodium and TDS (27%). In Sialkot, only three sources out of 10 were supplying safe water and the rest have shown excessive levels of bacteriological (70%) and arsenic (20%) contaminants.
In NWFP, out of a total 11 sources, 3 sources of Abbottabad, were supplying safe water and rest were found polluted with bacterial (55%) contamination, excessive levels of nitrate and turbidity in 9% samples. In Mangora, 80% samples were found unfit due to the prevalence of fecal contamination (70%), excessive levels of nitrate (20%) and lead (10%), whereas the remaining 20% were found safe. In Mardan, out of 12 sources, 11 samples were found unsafe due to bacteriological contamination (83%),

high iron (67%) and nitrate (8%) concentration. Peshawar, the capital of NWFP, has indicated 77% of the unsafe water sources due to bacteriological contamination (62%), iron (38%) and TDS (8%). In Balochistan Province, 66 water sources of 4 cities were monitored. In Khuzdar, out of 11 sources, 10 were found to be unsafe due to bacteriological contamination (91%), fecal contamination by E.Coli (82%) and excessive nitrate (18%). In Loralai, 91% of the 11 water sources were found unsafe because of bacteriological contamination (91%), and nitrate, fluoride, TDS, hardness and turbidity more than permissible limits. In Quetta, the capital of Balochistan, 76% samples were unsafe, mainly due to bacteriological contaminants (68%), excessive iron (26%), fluoride and nitrate (24%). Only 8 sources out of 34 were supplying safe drinking water in Quetta. The worst water quality situation was found in Ziarat, where all the 10 selected sources were contaminated, with bacteriological contamination contributed by fecal pollutants (100%) and excessive levels of nitrate (50%) and iron (20%).
In Sindh Province, all the 15 sources monitored in Hyderabad city were found unfit mainly due to bacteriological contamination (93%), excessive levels of iron (47%) and turbidity (93%). Karachi, the largest metropolitan city and capital of Sindh province revealed 93% unsafe water sources due to the presence of bacteriological contamination (86%), TDS and fluoride (4%), sodium, chlorides, sulphate (7%), nitrate (11%) and iron (18%). Only 2 out of a total of 28 were found safe. In Sukkur, 11 out of 12 sources were unfit because of bacteriological contamination (67%) and turbidity (50%), hardness, chlorides, sodium, potassium, arsenic and fluoride (8%), nitrate (25%), sulphate and TDS (17%).
Twenty two water samples including 6 dams, 9 rivers, 2 canals, 4 lakes and 1 drain; Left Bank Outfall Drain (LBOD), Right Bank Outfall Drain (RBOD), Sukkur) from 23 selected surface water bodies were also collected and analyzed for 28 water quality parameters. All samples (22) were found microbiologically contaminated. Only 3 samples (14%) showed high TDS values.
Detailed data analysis has identified 4 major water quality tribulations in drinking water sources of Pakistan i.e. bacteriological (68%), arsenic (24%), nitrate (13%) and fluoride (5%). On an overall basis, out of a total of 357 only 45 water sources (13%) were found “Safe” and the remaining 312 (87%) were “Unsafe” for drinking purpose. The bacterial contamination level (2002‐2006) was in the range of 40‐74% for Islamabad, 38‐79% for Faisalabad, 52‐76% for Bahawalpur, 29‐71% for Gujranwala, 56‐100% for Gujrat, 40‐50% for Kasur, 37‐63% for Lahore, 31‐87% for Multan, 53‐87% for Rawalpindi, 27‐55% for Sheikhupura, 40‐70% for Sialkot, 75‐92% for Sargodha, 62‐100% for Khuzdar, 73‐100% for Loralai, 48‐68% for Quetta, 100% for Ziarat, 40‐70% for Mangora, 75‐83% for Mardan, 31‐77% for Peshawar, 55‐73% for Abbottabad, 73‐100% for Hyderabad, 61‐100% for Karachi and 67‐83% for Sukkur during 2002‐06. The outcome of all the five phases (2002‐06) of NWQMP has led to the realization that the Federal, Provincial and Local Governments need to take immediate initiatives for the provision of safe drinking water to the public in order to prevent the onslaught of water born diseases. Advocacy efforts for the awareness and education of the general public, regarding the water quality testing and treatment are required.

RESULTS AND DISCUSSION
This chapter presents the results of the fifth and final phase of the National Water Quality Monitoring Programme which was completed in 2005-2006. This report covers the water quality analysis of 23 major cities, 8 rivers, 6 dams, 4 lakes, 2 canals, 2 drains and 1 reservoir. The 11 cities of the Punjab province covered this year were Bahawalpur, Faisalabad, Gujranwala, Gujrat, Kasur, Lahore, Multan, Rawalpindi, Sargodha, Sheikhupura and Sialkot. From NWFP, Abbottabad, Mangora, Mardan and Peshawar were monitored. While Khuzdar, Loralai, Quetta and Ziarat were monitored from the Balochistan. From the Sindh province Hyderabad, Karachi and Sukkur were included in the monitoring program. The locations for the sample collection in all cities were selected, keeping in view the source from where most of the population consumed water for drinking purpose. In total 364 permanent locations from 23 cities were selected for the collection of the water samples. However, 7 water sources in the Balochistan province (2 in Loralai, 4 in Quetta and 1 in Ziarat) were not functioning and therefore, water samples could not be taken from these sites. Consequently, 357 water samples were taken for laboratory analysis with the following distribution:
Islamabad 27 Punjab 163 NWFP 46 Balochistan 66 Sindh 55 Total 357
The area wise distribution of water sources is as under:
i. Islamabad: Tubewell (19), W.Supply Schemes (2), Cistern (1), Reservoir (1), Bore (1), Tap (3) (Total, 27)
ii. Punjab: Tubewell (90), W.Supply Schemes (8), Bore (9), Tap (4), Hand Pump (37), Injection Pump (13), Donkey Pump (1), Well (1) (Total, 163)
iii. NWFP: Tubewell (41), W.Supply Schemes (2), Hand Pump (1) and Bore (2) (Total:46)
� iv. Balochistan: Tubewell (31), W.Supply Schemes (13), Cistern (1), Tap (4), Well (5), Karez (3), Spring (5), Windmill (1), Dam (1), Hand Pump (2) (Total: 66) � v. Sindh: W.Supply Schemes (7), Tap (41), Hand Pump (7) (Total:55) The water quality parameters for which the samples were analyzed are mainly divided into the following four categories:
i. Physical and Aesthetic: pH, Electrical Conductivity (EC), Turbidity, Colour, Taste, Odour.
ii. Major Inorganic Constituents: Alkalinity (Alk), Bicarbonate (HCO3), Carbonate (CO3),

Calcium (Ca), Magnesium (Mg), Hardness, Sodium (Na), Potassium (K), Chloride (Cl), Sulphate (SO4), Nitrate (NO3), Phosphate (PO4), Total Dissolved Solids (TDS).
iii. Trace and Ultra Trace Elements: Silver (Ag), Aluminium (Al), Arsenic (As), Beryllium (Be), Bismuth (Bi), Cadmium (Cd), Cerium (Ce), Cobalt (Co), Chromium (Cr), Cesium (Cs), Copper (Cu), Dysprosium (Dy), Erbium (Er), Europium (Eu), Fluoride (F), Iron (Fe), Gallium (Ga), Gadolinium (Gd), Germanium (Ge), Hafnium (Hf), Mercury (Hg), Holmium (Ho), Indium (In), Iridium (Ir), Lanthanum (La), Lithium (Li), Lutetium (Lu), Manganese (Mn), Molybdenum (Mo), Niobium (Nb), Neodymium (Nd), Nickel (Ni), Lead (Pb), Palladium (Pd), Praseodymium (Pr), Platinum (Pt), Rubidium (Rb), Rhenium (Re), Rhodium (Rh), Ruthenium (Ru), Scandium (Sc), Selenium (Se), Samarium (Sm), Tin (Sn), Strontium (Sr), Tantalum (Ta), Terbium (Tb), Tellurium (Te), Thorium (Th), Titanium (Ti), Thallium (TI), Thullium (Tm), Vanadium (V), Tungsten (W), Yttrium (Y), Ytterbium (Yb), Zinc (Zn), Zirconium (Zr).
iv. Bacteriological Parameters: Coliform and Escherichia Coli (E.Coli).
All the analyzed parameters were compared with the WHO guidelines and the PSQCA Standards in order to evaluate whether the samples were “Safe” or “Unsafe” for drinking purposes.
4.1 FEDERAL AREA-Islamabad
From the city of Islamabad, 27 locations were selected for the sample collection. Out of these 27 locations, 07 water sources were found safe for drinking while the rest of the water sources were found unfit for human consumption, either due to chemical or microbiological contamination. The analysis revealed that 74% of the samples were found to be contaminated with Coliforms and 41% were polluted with E. Coli. Furthermore, 59% of the samples were identified as having an excessive presence of Ca than the permissible limits allowed but were considered safe, as a slightly excessive amount of calcium is not hazardous to health. One sample had a slightly excessive Fe concentration than the WHO guidelines (Annexure-01). The results of the monitoring carried out in Islamabad in 2005-06 are given in Table-4.1.
Table 4.1 Summary of Water Quality Analysis of Islamabad (2005-06)
Sr. No.
Water Quality Parameter Unit
Total No. of Samples Analyzed
Number of Contaminated
Samples
%age of Contaminated
Samples 1 Ca (mg/l) 27 16 59
2 Coliform (MPN/100 ml) 27 20 74
3 E.Coli (MPN/100 ml) 27 11 41
The microbiological contamination in Islamabad could be due to an inadequate water decontamination and disinfection practice, being followed by leakages within the distribution network due to an intermittent water supply etc. The CDA responsible authorities should improve the chlorination practices along with the water distribution infrastructure (especially to control leakage) on a priority basis in an effort to supply safe drinking water to the residents of the city.

4.2 PUNJAB PROVINCE
4.2.1 Bahawalpur
From Bahawalpur City, 25 water sources (12 Tube Wells and 13 Hand Pumps) were monitored, keeping in view the source from where most of the population consumed water for their drinking purpose. According to the water quality data, it was revealed that all the water samples were unfit for human consumption either chemically or microbiologically. Out of the 25 samples, 60% of the samples were found to be contaminated with coliforms; 88% possessing excess Arsenic (As) than permissible limits. Most of the samples had more than 50 ppb which is 5 times more than the WHO set guideline for arsenic in drinking water. Samples with a high Total Dissolved Solids (TDS) were 16%, where as 32% of the samples possessed excessive levels of turbidity, and 60% of the samples had a higher concentration of calcium (Ca). The tubewell of Commercial Area, Satellite Town was pumping water containing more soluble ions of Ca (200 mg/l), which may be due to the presence of underground calcareous mineral rocks. Chloride, Fluoride, Potassium and Hardness were observed beyond the permissible limits in 4% of the water samples. 12% and 20% water samples had excessive sodium and sulphate respectively. The results of the samples are presented at Annexure-2. Information regarding the %age of contaminated samples beyond the permissible limits of different water quality parameters are presented in Table-4.2.
Table 4.2 Results of Water Quality Analysis of Bahawalpur (2005-06)
Sr. No.
Water Quality
Parameter Unit
Total No. of Samples Analyzed
Number of Contaminated
Samples
%age of Contaminated
Samples 1 Turbidity (NTU) 25 8 32 2 Ca (mg/l) 25 15 60 3 Hardness (mg/l) 25 1 4 4 Na (mg/l) 25 3 12 5 K (mg/l) 25 1 4 6 Lead (Pb) (mg/l) 25 2 8 7 Cl (mg/l) 25 1 4 8 SO4 (mg/l) 25 5 20 9 TDS (mg/l) 25 4 16
10 As (ppb) 25 22 88 11 Fe (mg/l) 25 17 68 12 F (mg/l)) 25 1 4
13 Coliforms (MPN/100 ml) 25 15 60
14 E.Coli (MPN/100 ml) 25 2 8

4.2.2 Faisalabad
Faisalabad is a main big industrial city of Pakistan, where the quality of water is deteriorating with the passage of time. Hepatitis-A and gastroenteritis are common diseases in the city, as a result of the unavailability of safe drinking water. The TDS is increasing in most of the sources due to the dumping of industrial waste in water sources without treatment. A water quality crisis occurred in Faisalabad in which more than 20 persons died as a result of drinking contaminated water in the year 2006. An emergency was imposed in the city hospitals, as more than 20 thousand patients of gastroenteritis were hospitalized. The major cause of the drinking water contamination were old and leaky, rusted water pipes. For water quality monitoring in Faisalabad, 13 locations were selected covering the major water sources of the city. The overall supply of drinking water was found unsatisfactory as out of the 13 sources, only three sources were supplying safe drinking water. The water quality analysis revealed that 46% of the water samples were found polluted with Coliforms & E.Coli, the same %age of sources were identified having excessive concentrations of SO4 & TDS. About 54% and 23% of the samples were found with excessive sodium and hardness respectively. Whereas 38% samples were identified with a higher level of K and Cl than permissible limits allowed, another 15% sources had more F and Cd than the WHO guideline values permitted for drinking water. Thirty one % of the samples were identified as having higher Ca and Fe values. The details of the analysis are given at Annexure-3. All the information regarding %age samples beyond the permissible limits of different water quality parameters is given in Table 4.3.
Table 4.3 Results of Water Quality Analysis of Faisalabad (2005-06)
Sr. No.
Water Quality
Parameter Unit
Total No. of Samples Analyzed
Number of Contaminated
Samples
%age of Contaminated
Samples 1 Ca (mg/l) 13 4 31 2 Hardness (mg/l) 13 3 23 3 Na (mg/l) 13 7 54 4 K (mg/l) 13 5 38 5 Cl (mg/l) 13 5 38 6 SO4 (mg/l) 13 6 46 7 TDS (mg/l) 13 6 46 8 F (mg/l) 13 2 15 9 Fe (mg/l) 13 4 31
10 Cd (ppb) 13 2 15
11 Coliforms (MPN/100 ml) 13 6 46
12 E.coli (MPN/100 ml) 13 6 46
4.2.3. Gujranwala
In total, 14 samples were collected from the Gujranwala city covering all the possible drinking water sources. Out of the 14 sources no one was supplying safe drinking water, except one which had a slightly higher level of Ca. The results of the analysis identified that 64% of the water

samples were found to be contaminated due to the presence of coliforms and E.Coli. Whereas 64% of the water samples were found to be contaminated with Arsenic (As) and 7% of the samples had excessive TDS and NO3. Details of the analysis are given in Annexure-4. All the information regarding the %age of the contaminated samples beyond the permissible limits of different water quality parameters are given in Table-4.4.
Table 4.4 Results of Water Quality Analysis of Gujranwala (2005-06)
Sr. No.
Water Quality
Parameter Unit
Total No. of Samples Analyzed
Number of Contaminated
Samples
%age of Contaminated
Samples 1 Ca (mg/l) 14 5 36 2 TDS (mg/l) 14 1 7 3 NO3 (mg/l) 14 1 7 4 As (ppb) 14 9 64 5 TI (ppb) 14 4 29
6 Coliforms (MPN/100 ml) 14 9 64
7 E.coli (MPN/100 ml) 14 5 36
4.2.4 Gujrat
From the Gujrat city area, 9 water samples were collected from water sources according to the sampling design. The water sources included; Tubewells (7), a Hand Pump (1) and a Donkey Pump (1). Out of the 9 water sources, four were supplying safe drinking water to the community while the rest were providing the citizens contaminated water. The water quality analysis results revealed that 56% of the water samples were polluted with Coliforms and E. coli., 22% of the samples were found turbid and 01 sample (11%) had a higher concentration of Fe and Manganese (Mn) (Annexure-05). All the details regarding the %age of the contaminated samples are given in Table 4.5.
Table 4.5 Results of Water Quality Analysis of Gujrat (2005-06)
Sr. No.
Water Quality
Parameter Unit
Total No. of Samples Analyzed
Number of Contaminated
Samples
%age of Contaminated
Samples 1 Turbidity (NTU) 9 2 22 2 Fe (mg/l) 9 1 11 3 Mn (ppb) 9 1 11
4 Coliforms (MPN/100 ml) 9 5 56
5 E.coli (MPN/100 ml) 9 5 56

4.2.5 Kasur
Kasur is an industrial city and is known for its tanneries in Pakistan. From this city, a total of 10 sources from predetermined locations were selected to monitor the water quality. The sources were selected from areas where most of the population obtains their drinking water. It was found that all the 10 sources were supplying contaminated drinking water. In each case, one or more contaminants were present in the drinking water. The analysis of water quality data showed that 40% of the samples were polluted due to the presence of Coliforms and E.Coli. All water samples were identified as having an excessive As concentration when compared with the WHO guidelines. Similarly 20 % of the samples had unacceptable levels of SO4 and F, whereas 30% and 10% of the samples had exceeded the WHO Guidelines for Fe & NO3. Excessive potassium was found in 10% and sodium in 50% of the samples collected from Kasur. Results regarding the %age of the contaminated samples because of different water quality parameters are given in Table 4.6.
Table 4.6 Results of Water Quality Analysis of Kasur (2005-06)
Sr. No.
Water Quality
Parameter Unit
Total No. of Samples Analyzed
Number of Contaminated
Samples
%age of Contaminated
Samples 1 K (mg/l) 10 1 10 2 Na (mg/l) 10 5 50 3 SO4 (mg/l) 10 2 20 4 NO3 (mg/l) 10 1 10 5 TDS (mg/l) 10 4 40 6 As (ppb) 10 10 100 7 Fe (mg/l) 10 3 30 8 F (mg/l) 10 2 20
9 Coliforms (MPN/100 ml) 10 4 40
10 E.coli (MPN/100 ml) 10 4 40
4.2.6 Lahore
Lahore is the 2nd
largest city of Pakistan based on population and accounts amongst the leading industrial cities. A total of 16 sources were selected
according to the sampling design for the monitoring purpose. Out of the 16 locations, none of the sources were supplying safe drinking water to the community. In each case, one or more water quality parameter was found to be present in the samples. The analysis showed that 50% of the sources were unsafe due to bacterial contamination. In the case of chemical parameters, a 100% of the water samples had higher concentrations of Arsenic (As) when compared with the WHO guideline values for drinking water. The higher concentration of Fe was also found present in 56% of the water samples (Annexure-7). The results of the water quality analysis carried out in Lahore during 2005-06 are given in Table 4.7.

Table 4.7 Results of Water Quality Analysis of Lahore (2005-06)
Sr. No.
Water Quality
Parameter Unit
Total No. of Samples Analyzed
Number of Contaminated
Samples
%age of Contaminated
Samples 1 As (ppb) 16 16 100 2 Fe (mg/l) 16 9 56 3 TI (ppb) 16 2 13
4 Coli forms (MPN/100 ml) 16 8 50
5 E. Coli. (MPN/100 ml) 16 7 44
4.2.7. Multan
From Multan city, 16 sources from various locations as per study design, were collected. These water sources included Tube wells (8), Water Supplies (1), Hand Pumps (6) and a Well (1). Out of these 16 sources, none of them was supplying safe drinking water. In each case one or more parameter(s) were found beyond the drinking water guidelines or the PSQCA standards. Fifty six percent of the samples were found to be contaminated with Coliforms and 25% of the samples were polluted with E.Coli. Furthermore, 94% of the water samples were found with an excessive Arsenic (As) concentration. Similarly, in 19% of the samples, manganese (Mn) was reported to be present beyond the permissible limits and 44% of the water samples possessed a higher concentration of Iron (Fe). Calcium and turbidity were also found in high concentrations in 6% and 19% of the water samples, respectively. Details of this analysis are given in Annexure-8. Results of the water quality analysis are summarized in Table-4.8.
Table 4.8 Results of Water Quality Analysis of Multan (2005-06)
Sr. No.
Water Quality
Parameter Unit
Total No. of Samples Analyzed
Number of Contaminated
Samples
%age of Contaminated
Samples 1 Turbidity (NTU) 16 3 19 2 Ca (mg/l) 16 1 6 3 As (ppb) 16 15 94 4 Fe (mg/l) 16 7 44 5 Mn (ppb) 16 3 19 6 TI (ppb) 16 5 31
7 Coliforms (MPN/100 ml) 16 9 56
8 E. Coli. (MPN/100 ml) 16 4 25

4.2.8 Rawalpindi
The water samples from Rawalpindi city were collected from 15 sources at predetermined locations covering the major water supply sources. These included Tubewells (13), Water Supply Schemes (1), and Bore (1). Only four sources were supplying safe drinking water including 3 sources having a slight problem of calcium. The results of the analysis showed that 53% of the water samples were contaminated with Coliforms and 33% of the samples were found to be polluted with E.Coli. Also 7% of the samples were found to be unfit because of excessive hardness and TDS. Forty seven percent of the samples were found contaminated with excessive NO3. Nitrate contamination is one of the emerging issues in Rawalpindi city (Annexure-9). The epidemic of hepatitis-A which appeared in Rawalpindi in 1993 and resulted in 4,000 cases, was mainly due to water pollution by faeces and on inadequate water treatment. Details of water quality analysis can be seen at Annexure-24. Data regarding the %age of contaminated samples beyond the permissible limits of different water quality parameters are summarized in Table 4.9.
Table 4.9 Results of Water Quality Analysis of Rawalpindi City (2005-06)
Sr. No.
Water Quality
Parameter Unit
Total No. of Samples Analyzed
Number of Contaminated Samples
%age of Contaminated
Samples 1 Ca (mg/l) 15 11 73 2 Hardness (mg/l) 15 1 7 3 NO3 (mg/l) 15 7 47 4 TDS (mg/l) 15 1 7 5 Coliform (MPN/100ml) 15 8 53 6 E.Coli (MPN/100ml) 15 5 33
4.2.9. Sargodha
Water samples were collected from 24 sources from various locations covering the major part of the city. Out of 24 sources only one source was providing safe drinking water to the inhabitants of Sargodha City. About 83% of the water samples were found to be contaminated due to the presence of Coliforms and E.Coli. Higher concentrations of As, Na, K, Cl, SO4, Ca, Mg and Hardness were found to be present beyond the permissible limits in 13%, 54%, 29%, 46%, 38%, 67%, 17% and 38% of the water samples, respectively. Higher levels of TDS and Turbidity were observed in 67% and 4% samples, respectively. Fifty four percent of the water samples had higher level of NO3 and 4% had a fluoride contamination. Details of the analysis of the 24 water samples are given in Annexure-10. Sargodha is the second city of Punjab where the nitrate contamination is an emerging issue. Frequent use of fertilizers may be one of the main causes of increasing nitrate. Results of the water quality analysis are summarized in Table 4.10.
Table 4.10 Results of Water Quality Analysis Conducted at Sargodha (2005-06)
Sr. No.
Water Quality
Parameter Unit
Total No. of Samples Analyzed
Number of Contaminated
Samples
%age of Contaminated
Samples 1 Turbidity (NTU) 24 1 4

2 Ca (mg/l) 24 16 67 3 Mg (mg/l) 24 4 17 4 Hardness (mg/l) 24 9 38 5 Na (mg/l) 24 13 54 6 K (mg/l) 24 7 29 7 Cl (mg/l) 24 11 46 8 SO4 (mg/l) 24 9 38 9 NO3 (mg/l) 24 13 54
10 TDS (mg/l) 24 16 67 11 As (ppb) 24 3 13 12 F (mg/l) 24 1 4 13 Coliforms (MPN/100 ml) 24 20 83 14 E.coli (MPN/100 ml) 24 15 63 4.2.10. Sheikhupura
In total, 11 water samples were collected covering the major localities of the city as per the sampling design. The water quality data revealed that none of the water sources was supplying safe drinking water to the community. Nine percent of the water samples were found to be beyond the permissible limits of the water quality parameters i.e. K, NO3 and SO4, while 45% of the samples were found to be contaminated with Coliforms. Seventy three percent of the water samples were found possessing higher level of Arsenic (As). A higher level of Manganese (Mn) was observed in 18% of the samples while 27% of the samples were found with high levels of Ca, Na & TDS. Details of the water quality analysis are given in Annexure-11. The summary of the water quality analysis is given in Table 4.11.
Table 4.11 Results of Water Quality Analysis of Sheikhupura (2005-06)
Sr. No.
Water Quality
Parameter Unit
Total No. of Samples Analyzed
Number of Contaminated
Samples
%age of Contaminated
Samples 1 Ca (mg/l) 11 3 27 2 Na (mg/l) 11 3 27 3 K (mg/l) 11 1 9 4 SO4 (mg/l) 11 1 9 5 NO3 (mg/l) 11 1 9 6 TDS (mg/l) 11 3 27 7 As (ppb) 11 8 73 8 Mn (ppb) 11 2 18
9 Coliforms (MPN/100 ml) 11 5 45
10 E.coli (MPN/100 ml) 11 3 27
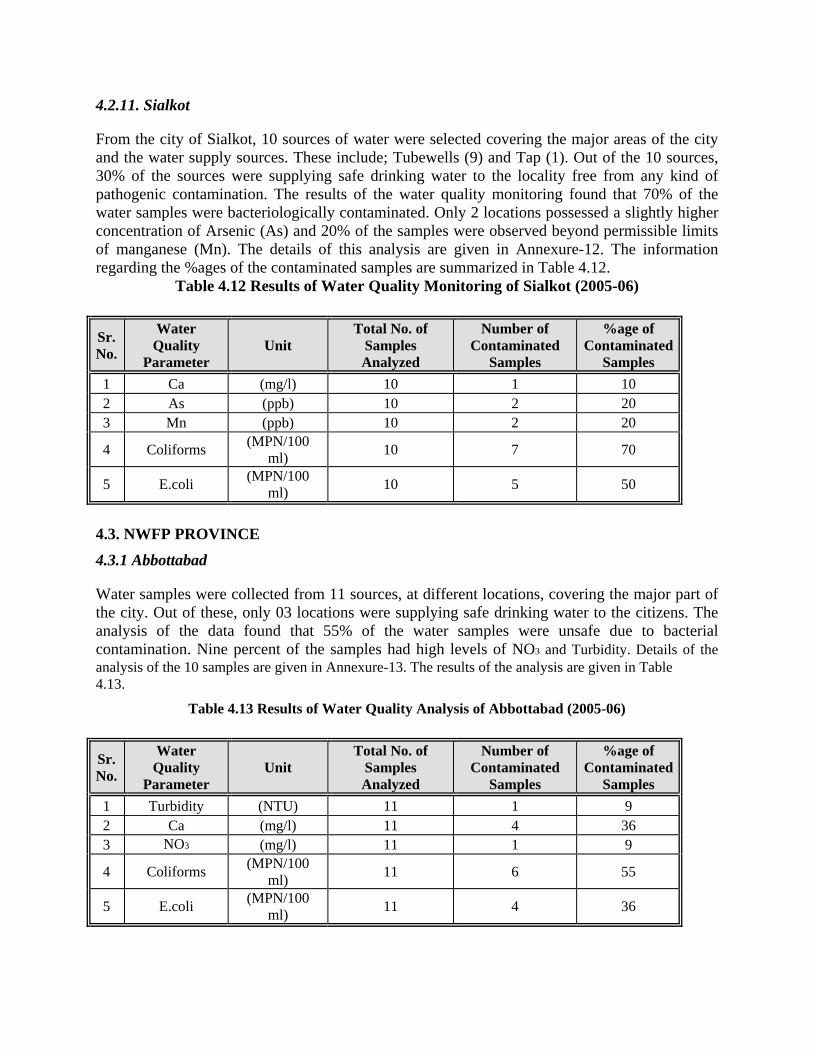
4.2.11. Sialkot
From the city of Sialkot, 10 sources of water were selected covering the major areas of the city and the water supply sources. These include; Tubewells (9) and Tap (1). Out of the 10 sources, 30% of the sources were supplying safe drinking water to the locality free from any kind of pathogenic contamination. The results of the water quality monitoring found that 70% of the water samples were bacteriologically contaminated. Only 2 locations possessed a slightly higher concentration of Arsenic (As) and 20% of the samples were observed beyond permissible limits of manganese (Mn). The details of this analysis are given in Annexure-12. The information regarding the %ages of the contaminated samples are summarized in Table 4.12.
Table 4.12 Results of Water Quality Monitoring of Sialkot (2005-06)
Sr. No.
Water Quality
Parameter Unit
Total No. of Samples Analyzed
Number of Contaminated
Samples
%age of Contaminated
Samples 1 Ca (mg/l) 10 1 10 2 As (ppb) 10 2 20 3 Mn (ppb) 10 2 20
4 Coliforms (MPN/100 ml) 10 7 70
5 E.coli (MPN/100 ml) 10 5 50
4.3. NWFP PROVINCE 4.3.1 Abbottabad
Water samples were collected from 11 sources, at different locations, covering the major part of the city. Out of these, only 03 locations were supplying safe drinking water to the citizens. The analysis of the data found that 55% of the water samples were unsafe due to bacterial contamination. Nine percent of the samples had high levels of NO3 and Turbidity. Details of the analysis of the 10 samples are given in Annexure-13. The results of the analysis are given in Table 4.13.
Table 4.13 Results of Water Quality Analysis of Abbottabad (2005-06)
Sr. No.
Water Quality
Parameter Unit
Total No. of Samples Analyzed
Number of Contaminated
Samples
%age of Contaminated
Samples 1 Turbidity (NTU) 11 1 9 2 Ca (mg/l) 11 4 36 3 NO3 (mg/l) 11 1 9
4 Coliforms (MPN/100 ml) 11 6 55
5 E.coli (MPN/100 ml) 11 4 36

4.3.2 Mangora
In total, 10 sources were selected from Mangora covering the major localities of the city. Only two tube well located in Sector-C, Kanju Township area and Sharifabad Bridge were supplying safe drinking water. Seventy percent of the water samples were found contaminated due to the presence of Coliforms and E. Coli and 20% of the samples had high levels of NO3. Detailed data is given in Annexure-14. The information regarding the %age of the contaminated samples beyond the permissible limits for different water quality parameters is given in Table 4.14.
Table 4.14 Results of Water Quality Analysis of Mangora (2005-06)
Sr. No.
Water Quality
Parameter Unit
Total No. of Samples Analyzed
Number of Contaminated
Samples
%age of Contaminated
Samples 1 Ca (mg/l) 10 7 70 2 NO3 (mg/l) 10 2 20 3 Lead (ppb) 10 1 10
4 Coliforms (MPN/100 ml) 10 7 70
5 E.coli (MPN/100 ml) 10 7 70
4.3.3. Mardan
From Mardan city, 12 sources were selected covering most of the water supply sources. These included Tubewells (10) and Bores (2). Only one source was found supplying safe drinking water to the community, while the rest of the sources were unsafe for human consumption. The analysis of the water samples showed that 83% of the water samples were polluted with Coliforms and one sample was found contaminated with E. Coli. Whereas 67% of the water sample had a higher concentration of Fe, one sample (8%) had the slightly more concentration of NO3 anions (16.80 mg/l) as 10 mg/l is the acceptable level of WHO. Details of the analysis can be seen at Annexure 15.
Table 4.15 Results of Water Quality Analysis of Mardan (2005-06)
Sr. No.
Water Quality
Parameter Unit
Total No. of Samples Analyzed
Number of Contaminated
Samples
%age of Contaminated
Samples 1 NO3 (mg/l) 12 1 8 2 Fe (mg/l) 12 8 67
3 Coliforms (MPN/100 ml) 12 10 83
4 E.coli (MPN/100 ml) 12 1 8

4.3.4. Peshawar
Water samples were collected from 13 sources covering the main water supply locations of Peshawar city. Only three sources were found to be supplying safe drinking water. The analysis of data showed that 62% of the samples were microbiologically contaminated and 38% of the samples were found contaminated with E. Coli and Fe. Twenty three percent of the samples were found to be unsafe because of high levels of Ca, while 8% of the samples were found unfit due to high TDS. The details of the analysis of 13 samples are given in Annexure-16. The percentage of the samples found contaminated is given in Table 4.16.
Table 4.16 Water Samples beyond Permissible Limits of Different WQP in Peshawar
Sr. No.
Water Quality
Parameter Unit
Total No. of Samples Analyzed
Number of Contaminated
Samples
%age of Contaminated
Samples 1 Ca (mg/l) 13 3 23 2 TDS (mg/l) 13 1 8 3 Fe (mg/l) 13 5 38
4 Coliforms (MPN/100 ml) 13 8 62
5 E.coli (MPN/100 ml) 13 5 38
4.4. BALOCHISTAN PROVINCE
4.4.1 Khuzdar
From Khuzdar city of Balochistan, 11 water samples were collected from various water sources in order to give coverage to all possible water sources of the city. The selected sources included Tubewells (4), Water Supplies (2), a Cistern (1), a Tap (1), Wells (2) and a Spring (1), whereas the water sources at two locations were permanently dried. In the last phase of the National Water Quality Monitoring Programme, two new sources were selected in the replacement of the two former dried sources. It was found that only one source was supplying safe drinking water to the community. The analysis of the water samples showed that 91% of the sources of water were found to be contaminated with Coliforms. Also, 18% of the samples had high Aluminium (Al) concentrations. The higher levels of Ca and Nitrate were found in 18% of the water samples when compared with the WHO guideline values (Annexure-17). The results of the analysis showing the percentage of the samples contaminated with various contaminants is given in Table 4.17.
Table 4.17 Results of Water Quality Analysis of Khuzdar (2005-06)
Sr. No.
Water Quality
Parameter Unit
Total No. of Samples Analyzed
Number of Contaminated
Samples
%age of Contaminated
Samples 1 Ca (mg/l) 11 2 18

2 NO3 (mg/l) 11 2 18 3 Al (ppb) 11 2 18
3 Coliforms (MPN/100 ml) 11 10 91
4 E.coli (MPN/100 ml) 11 9 82
4.4.2. Loralai
Water samples from 11 sources were collected from Loralai city, covering the possible surface and groundwater sources. These 11 water sources included Tube wells (4), a Hand Pump (1), Water Supplies (3), a Tap (1), a Dam (1) and a Spring (1). Only a single source was supplying safe drinking water to the community of Loralai city. About 91% of the water samples were found unsafe due to bacterial contamination, whereas 9% of the samples were unfit for drinking purpose due to the presence of higher Turbidity, NO3, TDS, hardness and fluoride. About 27% of the samples were found to be contaminated with higher contents of Aluminium(Al) as given at Annexure-18. The percentage of samples found contaminated due to various contaminants is given in Table 4.18.
Table 4.18 Results of Water Samples found Contaminated in Loralai
Sr. No.
Water Quality
Parameter Unit
Total No. of Samples Analyzed
Number of Contaminated
Samples
%age of Contaminated
Samples 1 Turbidity (NTU) 11 1 9 2 Ca (mg/l) 11 2 18 3 Hardness (mg/l) 11 1 9 4 NO3 (mg/l) 11 1 9 5 TDS (mg/l) 11 1 9 6 F (mg/l) 11 1 9 7 Al (ppb) 11 3 27 8 TI (ppb) 11 4 36 9 Coliforms (MPN/100 ml) 11 10 91
10 E.coli (MPN/100 ml) 11 8 73 4.4.3. Quetta
Out of the total 38 selected sources, water samples were collected from 34 sources as four sources were found un-operational. The water sources covering the major civil residential and cantonment areas of the city included Tube wells (21), Water Supply Schemes (6), a Tap (1), Wells (2), a Karez (1), Springs (2) and a Hand Pump (1). Only 8 sources were supplying safe drinking water while the rest of the sources were found unfit either chemically or microbiologically. The analysis of water quality data revealed that 68% of the samples were bacteriologically contaminated, whereas 26% of the samples were unfit due to a high concentration of Fe and Ca. Twenty four percent of the samples were found unfit due to high

levels of Fluoride & NO3 when compared with the WHO guideline values. Similarly, 3% of the samples were contaminated with a high concentration of Nickel (Ni) and Chromium (Cr) and 21% of the samples were unfit due to a high concentration of Aluminium. There was a high concentration of Na in 6% of the samples. Three percent of the samples were found unsafe due to high levels of Cl, SO4 and Mg whereas 9% of the samples were declared unfit for human consumption due to high levels of hardness, TDS and Turbidity (Annexure-19). The results of the water quality analysis are given in Table 4.19.
Table 4.19 Summary of Results of Water Quality Analysis of Samples from Quetta (2005-06)
Sr. No.
Water Quality
Parameter Unit
Total No. of Samples Analyzed
Number of Contaminated
Samples
%age of Contaminated
Samples 1 Turbidity (NTU) 34 3 9 2 Ca (mg/l) 34 9 26 3 Mg (mg/l) 34 1 3 4 Hardness (mg/l) 34 2 6 5 Cl (mg/L) 34 1 3 6 Na (mg/l) 34 2 6 7 SO4 (mg/l) 34 1 3 8 NO3 (mg/l) 34 8 24 9 TDS (mg/l) 34 3 9
10 Fe (mg/l) 34 9 26 11 F (mg/l) 34 8 24 12 Ni (ppb) 34 1 3 13 Cr (ppb) 34 1 3 14 Al (ppb) 34 7 21 15 TI (ppb) 34 9 26
16 Coliforms (MPN/100 ml) 34 23 68
17 E.coli (MPN/100 ml) 34 16 47
4.4.4. Ziarat
Water samples were collected from 10 sources out of 11 sources, because one source had gone dry. None of the sources was supplying safe drinking water. All water samples were found contaminated with Coliforms and E. Coli organisms. Physical and chemical analysis of water showed that 20% of the samples possessed higher levels of Fe and aluminium (Al) beyond the permissible limits, and 10% of the samples were with higher levels of Turbidity and hardness. Also, 50% of the samples were found unsafe due to higher levels of NO3. Calcium (Ca) ions were found in higher concentrations in 4 water samples which might be due to the presence of Chiltan and Ziarat limestone rocks in the area (Annexure-20). All the information regarding the type of source and the %age of the contaminated samples beyond the permissible limits for different water quality parameters are given in Tables 4.20.

Table 4.20 Summary of Results of Water Quality Analysis in Ziarat (2005-06)
Sr. No.
Water Quality
Parameter Unit
Total No. of Samples Analyzed
Number of Contaminated
Samples
%age of Contaminated
Samples 1 Turbidity (NTU) 10 1 10 2 Ca (mg/l) 10 4 40 3 Hardness (mg/l) 10 1 10 4 NO3 (mg/l) 10 5 50 5 Fe (mg/l) 10 2 20 6 Al (ppb) 10 2 20 7 TI (ppb) 10 3 30
8 Coliforms (MPN/100 ml) 10 10 100
9 E.coli (MPN/100 ml) 10 10 100
4.5. SINDH PROVINCE
4.5.1. Hyderabad
According to the study design, water samples were collected from 15 sources covering the main localities of the city. No source was found to be supplying safe drinking water to the citizens. The analysis of the water quality data showed that 93% of the water samples were contaminated due to Coliforms and E.coli bacterium and a high level of Turbidity. One sample (7%) was found with a high level of Ca, 7 samples (47%) contained excess Fe contents and 13 samples (87%) contained excess Aluminium (Al). The detail of the analysis of the 15 sources is given in Annexure-21. The information on the %age of the contaminated samples beyond the permissible limits of different water quality parameters are given in Tables 4.21.
Table 4.21 Results of Water Quality Analysis of Samples from Hyderabad (2005-06)
Sr. No.
Water Quality
Parameter Unit
Total No. of Samples Analyzed
Number of Contaminated
Samples
%age of Contaminated
Samples 1 Turbidity (NTU) 15 14 93 2 Ca (mg/L) 15 1 7 3 Fe (mg/l) 15 7 47 4 Al (ppb) 15 13 87
5 Coliforms (MPN/100 ml) 15 14 93
5 E.coli (MPN/100 ml) 15 14 93

4.5.2. Karachi
Water samples were collected from 28 sources that covered the major part of the metropolis. Only two sources were found to be safe. It was noticed that 86% of the water samples were contaminated with Coliforms and E.coli and 7% of the samples had high Na, Cl and SO4 ions more than allowed under permissible limits. Similarly 4% of the samples were found with an excessive ionic concentration of Ca, Mg, hardness, K, F & TDS and 18% were identified having high levels of Fe. About 64% of the samples had excessive aluminium while 4% of the samples had high Ni contents. 11% of the samples were found with high levels of NO3 and one sample (4%) was found with an excessive level of Fluoride. Details of the water quality analysis of the 28 samples are given in Annwexure-22. The summary of the water quality results is given in Table 4.22.
Table 4.22 Summary of Results of Water Quality Analysis of Karachi (2005-06)
Sr. No.
Water Quality
Parameter Unit
Total No. of Samples Analyzed
Number of Contaminated
Samples
%age of Contaminated
Samples 1 Ca (mg/l) 28 1 4 2 Mg (mg/l) 28 1 4 3 Hard (mg/l) 28 1 4 4 Na (mg/l) 28 2 7 5 K (mg/l) 28 1 4 6 Cl (mg/l) 28 2 7 7 SO4 (mg/l) 28 2 7 8 NO3 (mg/l) 28 3 11 9 TDS (mg/l) 28 1 4
10 Fe (mg/l) 28 5 18 11 F (mg/l) 28 1 4 12 TI (ppb) 28 16 57 13 Al (ppb) 28 18 64 14 Ni (ppb) 28 1 4
15 Coliforms (MPN/100 ml) 28 24 86
16 E.coli (MPN/100 ml) 28 24 86
4.5.3. Sukkur
From Sukkur, 12 sources covering the entire city were selected for water sampling. The analysis of the water samples showed that only one source was supplying safe drinking water. It was found that 67% of the water samples were microbiologically contaminated and 50% of them were containing a high level of turbidity. High levels of turbidity were observed in tap and water supply distribution systems because the major source of water supplied to the city was drawn from the Indus River containing suspended colloidal material. Twenty five percent of the samples possessed a higher concentration of Calcium (Ca), and Nitrate (NO3), while 17% of the

samples showed excessive contents of Sulphate (SO4). The analysis also showed that 80% of the samples possessed high values of hardness, Cl, Na, K, F and As. Seventeen Percent of the samples had high TDS and 8.3% of the samples were found with high contents of Aluminium (Al). Details of the analysis of the 12 samples are given in Annexure-23. The summary of the results of the analysis of the 12 samples is given in Table 4.23.
Table 4.23 Results of Water Quality Analysis of Sukkur (2005-06)
Sr. No.
Water Quality
Parameter Unit
Total No. of Samples Analyzed
Number of Contaminated
Samples
%age of Contaminated
Samples 1 Turbidity (NTU) 12 6 50 2 Ca (mg/l) 12 3 25 3 Hardness (mg/l) 12 1 8 4 Cl (mg/L) 12 1 8 5 Na (mg/L) 12 1 8 6 K (mg/l) 12 1 8 7 SO4 (mg/l) 12 2 17 8 NO3 (mg/l) 12 3 25 9 TDS (mg/l) 12 2 17
10 As (ppb) 12 1 8 11 F (mg/l) 12 1 8 12 Al (ppb) 12 10 83
13 Coliforms (MPN/100 ml) 12 8 67
14 E.coli (MPN/100 ml) 12 8 67
4.6. OVERALL WATER QUALITY SITUATION IN PAKISTAN
In total, 357 water samples were collected from sixteen types of water supply sources from 23 major cities of Pakistan. The details regarding the types and number of water sources are given in Table-4.24.
Table 4.24 Type of Source and Number of Samples Collected for Water Quality Analysis
Source Number Source Number Tubewell 181 Karez 3 W.Supply 34 Spring 5 Cistern 2 Windmill 1 Bore 12 Hand Pump 47 Tap 52 Injection Pump 13 River 0 Donkey Pump 1 Well 6 Total 357 Bacteriological contamination is the major cause of unsafe drinking water supply to the 23 cities.

Number and percentage of safe and unsafe water sources (microbiologically or chemically) are given in Table-4.25.
Table 4.25 Overall Water Quality Situation of 23 Cities and Causes of Contamination
Sr.No City Total No.of
Sample
Safe Samples Unsafe Samples Type of Contamination
No. %age No. %age
1 Islamabad 27 7 26 20 74 Bacteriological
2 Bahawalpur 25 0 0 25 100 Bacteriological turbidity, As , Fe, So4, Na, K, Pb, TDS, F, Cl
3 Faisalabad 13 3 23 10 77 Bacteriological, So4, TDS, K, Cl, hardness, F, Fe, Cd
4 Gujranwala 14 1 7 13 93 Bacteriological, As, N03, TDS,TI
5 Gujarat 9 4 44 5 56 Bacteriological, Turbidity, Fe,Mn
6 Kasur 10 0 0 10 100 Bacteriological, As, Na, TDS, Fe,F,N03,S04,K
7 Lahore 16 0 0 16 100 Bacteriological, As,Fe,TI
8 Multan 16 0 0 16 100 Bacteriological, As,Fe,turbidity, TI,Mn
9 Rawalpindi 15 4 27 11 73 Bacteriological, N03,TDS,Hardness
10 Sargodha 24 1 4 23 96 Bacteriological, TDS, Na, N03,S04,K,Cl,hardness, As,F, Turbidity
11. Sheikhupura 11 0 0 11 100 Bacteriological, As, TDS, Na, K, SO4, NO3
12. Sialkot 10 3 30 7 70 Bacteriological, As, TI, Mn
Sub-Total 163 16 10 147 90 Sub-total excluding Islamabad
13. Abbottabad 11 3 27 8 73 Bacteriological, NO3, turbidity
14. Mangora 10 2 20 8 80 Bacteriological, K, NO3
15. Mardan 12 1 8 11 92 Bacteriological, Fe, NO3
16. Peshawar 13 3 23 10 77 Bacteriological, Fe, TDS
Sub-Total 46 9 20 37 80 -
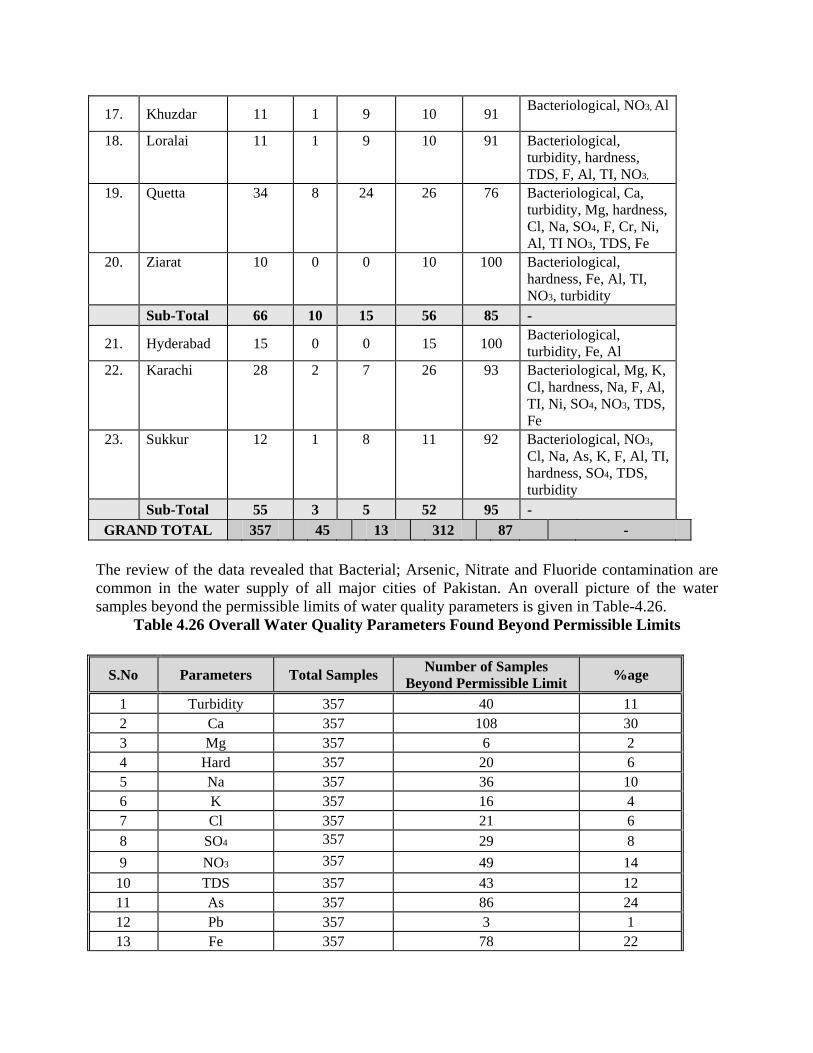
17. Khuzdar 11 1 9 10 91 Bacteriological, NO3, Al
18. Loralai 11 1 9 10 91 Bacteriological, turbidity, hardness, TDS, F, Al, TI, NO3,
19. Quetta 34 8 24 26 76 Bacteriological, Ca, turbidity, Mg, hardness, Cl, Na, SO4, F, Cr, Ni, Al, TI NO3, TDS, Fe
20. Ziarat 10 0 0 10 100 Bacteriological, hardness, Fe, Al, TI, NO3, turbidity
Sub-Total 66 10 15 56 85 -
21. Hyderabad 15 0 0 15 100 Bacteriological, turbidity, Fe, Al
22. Karachi 28 2 7 26 93 Bacteriological, Mg, K, Cl, hardness, Na, F, Al, TI, Ni, SO4, NO3, TDS, Fe
23. Sukkur 12 1 8 11 92 Bacteriological, NO3, Cl, Na, As, K, F, Al, TI, hardness, SO4, TDS, turbidity
Sub-Total 55 3 5 52 95 - GRAND TOTAL 357 45 13 312 87 -
The review of the data revealed that Bacterial; Arsenic, Nitrate and Fluoride contamination are common in the water supply of all major cities of Pakistan. An overall picture of the water samples beyond the permissible limits of water quality parameters is given in Table-4.26.
Table 4.26 Overall Water Quality Parameters Found Beyond Permissible Limits
S.No Parameters Total Samples Number of Samples Beyond Permissible Limit %age
1 Turbidity 357 40 11 2 Ca 357 108 30 3 Mg 357 6 2 4 Hard 357 20 6 5 Na 357 36 10 6 K 357 16 4 7 Cl 357 21 6 8 SO4 357 29 8 9 NO3 357 49 14
10 TDS 357 43 12 11 As 357 86 24 12 Pb 357 3 1 13 Fe 357 78 22

14 F 357 17 5 15 Coliforms 357 246 69 16 E.coli 357 178 50
The highest percentage of unsafe water sources was found in Bahawalpur, Kasur, Lahore, Multan, Sheikhupura and Ziarat, where none was safe for drinking purpose. Based on the complete information, generated through this Water Quality Monitoring Programme, it can be concluded that 13% out of a total of 357 water sources, are “Safe” and the rest of the 87% are Unsafe” for drinking purposes.
4.7. SURFACE WATER
Out of 23 surface water bodies, 22 were evaluated, as the Right Bank Outfall Drain (RBOD) was dried out (Table 4.27). The samples collected from these surface water bodies were analyzed for detailed water quality parameters including Chemical Oxygen Demand (COD), Biochemical Oxygen Demand (BOD) and Dissolved Oxygen (DO). It was found that all samples were contaminated with Coliforms and E.Coli (Table 4.28). Seventy three percent of the samples had a high level of turbidity .Only three samples were found with a high concentration of ions i.e. Ca, Mg, Hardness, Na, K, Cl, TDS, SO4 and NO3, Similarly, 27% of the samples showed an excessive concentration of Fe and F. Two lakes i.e; Hamal & Manchar were found with higher levels of Ca, Mg, Hardness, Cl. Na, K, SO4, and TDS. The LBOD drain was found with higher levels of Ca, Mg, Hardness, Cl, Na, K, SO4, and TDS (Annexure-26a). Table 4.27 Types of Surface Water Sources and Number of Samples Table 4.28 Summary of Water
Quality Analysis of Surface Water Samples
Source Drain River Canal Dam Lake Head works Total Number 1 8 2 6 4 1 22
S.No Parameters Total No. of Samples
Number of Samples Beyond Permissible Limit %age
1 Turbidity (NTU) 22 16 73 2 Ca (mg/l) 22 3 14 3 Mg (mg/l) 22 3 14 4 Hardness (mg/l) 22 3 14 5 Na (mg/l) 22 3 14 6 K (mg/l) 22 3 14 7 Cl (mg/l) 22 3 14 8 NO3 (mg/l) 22 3 14 9 SO4 (mg/l) 22 3 14
10 TDS (mg/l) 22 3 14 11 Fe (mg/l) 22 6 27 12 F (mg/l) 22 6 27 13 Coliforms (MPN/100 ml) 22 22 100

14 E.coli (MPN/100 ml) 22 22 100 When the data was compared with the WHO permissible limits for irrigation water, it was found that the sample from Hamal lake had high values for TDS,HCO3, Mg, Hardness, Chloride, Sodium, Potassium and Sulphate. (Table 4.29). All samples were highly polluted with Coliforms and E Coli, as given at Annexure-26b.
Table 4.29 Surface Water Samples beyond Permissible Limits of Different Water Quality Parameters (for Irrigation Water)
S.No Parameters Total No. of Samples
Number of Samples Beyond Permissible Limit %age
1 HCO3 (mg/l) 22 1 5 2 Mg (mg/l) 22 3 14 3 Hardness (mg/l) 22 3 14 4 Na (mg/l) 22 3 14 5 K (mg/l) 22 2 9 6 Cl (mg/l) 22 3 14 7 SO4 (mg/l) 22 3 14 8 TDS (mg/l) 22 3 14 9 F (mg/l) 22 9 40
10 Coliforms (MPN/100 ml) 22 22 100 11 E.coli (MPN/100 ml) 22 22 100
Water quality analysis data of BOD and COD was compared with the Revised National
Environment Quality Standards (NEQS) for Municipal and Liquid Industrial Effluents. Details can be seen at Annexure-26a. Hammal Lake, Manchar Lake and Left Bank Out Fall Drain (LBOD) have shown excessive levels of COD and BOD as given at Annexure 26b.