results 1st quarter 2018 - investors.softwareag.com/media/files/s/software-ag-ir/... · 2 | safe...
TRANSCRIPT

April 19, 2018
RESULTS 1st QUARTER 2018 (IFRS, UNAUDITED)
© 2018 Software AG. All rights reserved.

2 |
SAFE HARBOR
This presentation includes forward-looking statements based on the beliefs of Software AG
management. Such statements reflect current views of Software AG with respect to future events
and results and are subject to risks and uncertainties. Actual results may vary materially from those
projected here, due to factors including changes in general economic and business conditions,
changes in currency exchange, the introduction of competing products, lack of market acceptance
of new products, services or technologies and changes in business strategy. Software AG does not
intend or assume any obligation to update these forward-looking statements.
This presentation constitutes neither an offer nor recommendation to subscribe or buy in any other way
securities of Software AG or any of the companies that are members of the Group at present or in the
future, nor does it form part of such an offer and it should not be understood as such. This presentation
does not constitute an offer of sale of securities in the United States of America. Securities may not be
offered or sold in the United States of America without registration or exemption from registration in
accordance with the U.S. Securities‘ Act of 1933 in its currently valid form.
© 2018 Software AG. All rights reserved.

3 |
Euro 36%
US Dollar 28%
Other 14%
CURRENCY IMPACT ON REVENUE
© 2018 Software AG. All rights reserved.
Q1 2018
(in €m; yoy)
Q1
2018
Q1
in %
Licenses -3.2 -9%
Maintenance -8.9 -8%
SaaS -0.2 -6%
Consulting & Other -2.1 -4%
Total -14.4 -7%
Currency impact on revenue
36% revenue in Euro
64% revenue in foreign currency
Currency split Q1 2018
BRL 5%
AUD 4%
CAD 3%
GBP 5%
ILS 5%

4 |
DIGITAL BUSINESS PLATFORM (INCLUDING IoT/CLOUD)
SEGMENT REPORT Q1 2018
© 2018 Software AG. All rights reserved.
(in €m) Q1
2018
Q1
2017
∆% ∆%
acc
Licenses 25.2 37.1 -32% -25%
Maintenance 66.8 66.9 0% 8%
SaaS / Usage Based 3.8 1.9 100% 113%
Total revenue 95.8 105.9 -10% -2%
Cost of sales -8.6 -7.4 16% 23%
Gross profit 87.2 98.5 -11% -4%
Sales & Marketing -37.8 -44.8 -16% -9%
Research & Development -22.7 -23.7 -4% 1%
Segment result 26.7 30.0 -11% 1%
Margin in % 27.9% 28.3%
ARR* (Annual Recurring Revenue)
276.5 262.0 6% 14% * Internal Plan Rate 2018 used

5 |
IoT / CLOUD BUSINESS SEGMENT REPORT Q1 2018
© 2018 Software AG. All rights reserved.
(in €m) Q1
2018
Q1
2017
∆% ∆%
acc
Licenses 1.8 0.7 157% 178%
Maintenance 0.8 0.4 100% 95%
SaaS / Usage Based 3.8 1.9 100% 113%
Total revenue 6.4 3.0 113% 125%
ARR* (Annual Recurring Revenue)
18.7 11.1 68% 81%
* Internal Plan Rate 2018 used

6 |
ADABAS & NATURAL
© 2018 Software AG. All rights reserved.
SEGMENT REPORT Q1 2018
(in €m) Q1
2018
Q1
2017
∆% ∆%
acc
Licenses 9.0 7.8 15% 23%
Maintenance 35.6 40.1 -11% -2%
Product revenue 44.6 47.9 -7% 2%
Other 0.2 0.1 - -
Total revenue 44.8 48.0 -7% 2%
Cost of sales -1.4 -2.8 -50% -45%
Gross profit 43.4 45.2 -4% 5%
Sales & Marketing -6.6 -8.1 -19% -17%
Research & Development -5.6 -6.1 -8% -7%
Segment result 31.2 31.0 1% 13%
Margin in % 69.6% 64.6%

7 |
CONSULTING
© 2018 Software AG. All rights reserved.
SEGMENT REPORT Q1 2018
(in €m) Q1
2018
Q1
2017
∆% ∆%
acc
Total revenue 46.1 52.1 -12% -8%
Cost of sales -37.5 -41.7 -10% -6%
Gross profit 8.6 10.4 -17% -14%
Sales & Marketing -4.4 -4.9 -10% -7%
Segment result 4.2 5.5 -24% -22%
Margin in % 9.1% 10.6%

8 |
RESULTS
© 2018 Software AG. All rights reserved.
Q1 2018
(in €m) Q1
2018
Q1
2017
∆% ∆%
acc
Total revenue 186.6 205.9 -9% -2%
Cost of sales -49.5 -55.0 -10% -6%
Gross profit 137.1 150.9 -9% -1%
Margin in % 73.5% 73.3%
Research & Development -28.3 -29.8 -5% 0%
Sales & Marketing -52.0 -62.4 -17% -11%
Administration -17.1 -18.5 -8% -3%
Other income / expense 2.4 1.3 - -
EBIT 42.1 41.5 1% -
Margin in % 22.6% 20.2%
9 |
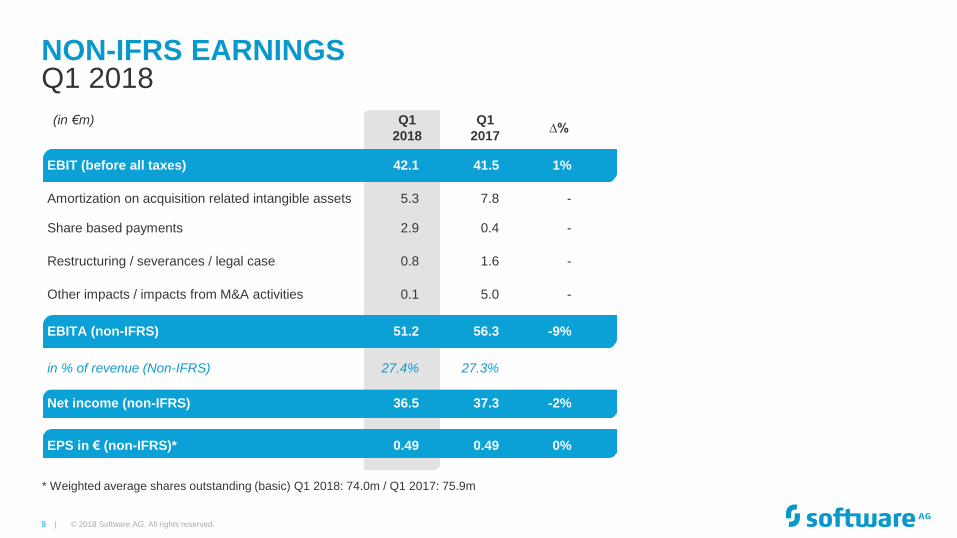
NON-IFRS EARNINGS
© 2018 Software AG. All rights reserved.
Q1 2018
* Weighted average shares outstanding (basic) Q1 2018: 74.0m / Q1 2017: 75.9m
(in €m) Q1
2018
Q1
2017 ∆%
EBIT (before all taxes) 42.1 41.5 1%
Amortization on acquisition related intangible assets 5.3 7.8 -
Share based payments 2.9 0.4 -
Restructuring / severances / legal case 0.8 1.6 -
Other impacts / impacts from M&A activities 0.1 5.0 -
EBITA (non-IFRS) 51.2 56.3 -9%
in % of revenue (Non-IFRS) 27.4% 27.3%
Net income (non-IFRS) 36.5 37.3 -2%
EPS in € (non-IFRS)* 0.49 0.49 0%

10 |
CASH FLOW
© 2018 Software AG. All rights reserved.
Q1 2018
* Cash flow from investing activities except acquisitions and except investments in debt instruments
** yoy change because of one time property investment at Darmstadt
*** Based on weighted average shares outstanding (basic) Q1 2018: 74.0m / Q1 2017: 75.9m
(in €m) Q1
2018
Q1
2017 ∆%
Operating cash flow 61.6 61.7 0%
./. CapEx* -1.5 -18.4
Free cash flow 60.1 43.3 39%
in % of revenue 32.2% 21.0%
Free cash flow per share*** 0.81 0.57 42%
**

11 |
372.1
Mar. 31,
2018
Mar. 31,
2018
Assets Liabilities
BALANCE SHEET
© 2018 Software AG. All rights reserved.
(in €m)
Dec. 31,
2017
Dec. 31,
2017
365.8
279.6
55.3
1,125.9
1,907.5
Cash and cash equivalents
Financial assets
Trade and other receivables
Fixed assets
(Goodwill 910.2 / 921.4)
Total
80.9
Non-financial assets
310.6
357.8
120.8
1,118.3
1,907.5
Financial liabilities
Other liabilities
Deferred income
Shareholders’ equity
(ratio 60.9% / 58.6%)
Total
238.9 64.9
1,106.3
1,832.7
50.5
256.2
282.6
178.5
1,115.4
1,832.7

12 |
DBP Total Revenue
Adabas & Natural
Operating Margin Group
(EBITA non-IFRS)2)
OUTLOOK
© 2018 Software AG. All rights reserved.
FULL YEAR 2018
1) At constant currency rates 2) Adjusted for non-operating items (see non-IFRS earnings results) 3) Weighted average shares outstanding (basic/IAS 33.19) FY 2017: 74.6m / FY 2018: 74.0m; based on new US-Federal-Tax and Euro/US-Dollar exchange rate of 1/1.18
- IoT / Cloud
- DBP excl. IoT / Cloud
EPS non-IFRS3)
FY 2018 Outlook (as of April 13, 2018)
30% to 32%
-6% to -2%1)
N/A
FY 2017 (in €m)
223.7
456.4
31.8%
14.9 +100% to +135%1)
+3% to +7%1) 441.5
+5% to +15% €2.38

13 | © 2018 Software AG. All rights reserved.
APPENDIX

14 |
HEADCOUNT
© 2018 Software AG. All rights reserved.
BY FUNCTIONAL AREAS* AND GEOGRAPHY
* According to P+L structure
(in FTE) Mar. 31,
2018
Dec. 31,
2017
∆%
Mar. 31,
2017
∆%
yoy
Total 4,610 4,596 0% 4,486 3%
Consulting & Services 1,938 1,935 0% 1,891 2%
Research & Development 1,197 1,176 2% 1,122 7%
Sales & Marketing 868 862 1% 863 1%
Administration 607 623 -3% 610 0%
Germany 1,210 1,201 1% 1,141 6%
USA 575 575 - 599 -4%
India 813 823 -1% 764 6%
Rest of world 2,012 1,997 1% 1,982 2%

15 |
EARNINGS
© 2018 Software AG. All rights reserved.
Q1 2018
* Weighted average shares outstanding (basic) Q1 2018: 74.0m / Q1 2017: 75.9m
(in €m) Q1
2018
Q1
2017 ∆%
EBIT (before all taxes) 42.1 41.5 1%
Financial result 1.3 -0.2 -
Profit before taxes 43.4 41.3 5%
Other taxes -1.8 -2.0 -10%
Income taxes -11.7 -12.0 -3%
Tax rate in % 31.1% 33.9%
Net income 29.9 27.3 10%
EPS in €* 0.40 0.36 11%

16 |
Amortization
(in €m)
Depreciation
* Estimated
AMORTIZATION / DEPRECIATION IMPACT
© 2018 Software AG. All rights reserved.
(PRELIMINARY)
FY
2018*
FY
2019*
FY
2020*
Q1
2018
-5.3
-2.7
-19.3
-10.9
17.7
12.0
10.7
12.0

17 |
REVENUE
© 2018 Software AG. All rights reserved.
Q1 2018
(in €m) Q1
2018
Q1
2017
∆% ∆%
acc
Product revenue 140.4 153.7 -9% -1%
Licenses 34.1 44.9 -24% -17%
Maintenance 102.5 106.9 -4% 4%
SaaS / Usage Based 3.8 1.9 100% 113%
Consulting 46.0 52.1 -12% -8%
Other 0.2 0.1 - -
Total 186.6 205.9 -9% -2%
Segment result

18 |
ARR – IOT / CLOUD DEVELOPMENT (NET OF CURRENCY*)
STATUS Q1 2018
13% 6%
20%
27%
0
5
10
15
20
Q1 2017 Q2 2017 Q3 2017 Q4 2017 Q1 2018
Subscription License
Maintenance
SaaS
TOTAL ARR
∆ Prior Quarter
© 2018 Software AG. All rights reserved.
*Internal Plan Rate 2018 used

19 |
ALLOCATION OF CLOUD HOSTING REVENUE
© 2018 Software AG. All rights reserved.
NEW: WITHIN IoT/CLOUD REVENUE LINE (ADJ. FY 2017)
DBP FY 2017 (reported)
€455.3m
Consulting FY 2017 (reported)
€199.9m
Adj. DBP FY 2017
€456.4m (incl. Hosting)
Adj. Consulting FY 2017
€198.8m (excl. Hosting)
Cloud Hosting Revenue Q1 2017 Q2 2017
Q3 2017
Q4 2017
FY 2017
(€m) 0.216 0.248 0.294 0.303 1.061

20 |
IoT / CLOUD REVENUE SPLIT FOR 2017
© 2018 Software AG. All rights reserved.
In €m Q1 Q2 Q3 Q4 FY 2017
License 0.7 0.7 0.7 1.5 3.5
Maintenance 0.4 0.6 0.7 0.7 2.4
SaaS* 1.9 2.2 2.4 2.6 9.1
IoT / Cloud
Revenue 3.0 3.5 3.7 4.8 14.9
* Incl. Cloud Hosting Revenue

21 |
DBP PRODUCT REVENUE SEASONALITY
© 2018 Software AG. All rights reserved.
SHARE OF ANNUAL REVENUE IN THE QUARTERS
21.1% 21.4%
23.2%
20.4%
0%
5%
10%
15%
20%
25%
30%
35%
Q1 Q2 Q3 Q4
2015 2016 2017 2018

22 |
Investor Relations
Uhlandstrasse 12
64297 Darmstadt
Germany
T: +49 (0) 6151 / 92 1900
F: +49 (0) 6151 / 9234 1900
W: softwareag.com
© 2018 Software AG. All rights reserved.

23 | © 2018 Software AG. All rights reserved.