result oriented cohesion policy – regional perspective evidence based cohesion policy conference...
TRANSCRIPT

Result Oriented Cohesion Policy – Regional Perspective
Evidence Based Cohesion Policy Conference
Gdansk, July 7th 2011
Mieczysław StrukThe Marshal of Pomorskie
province
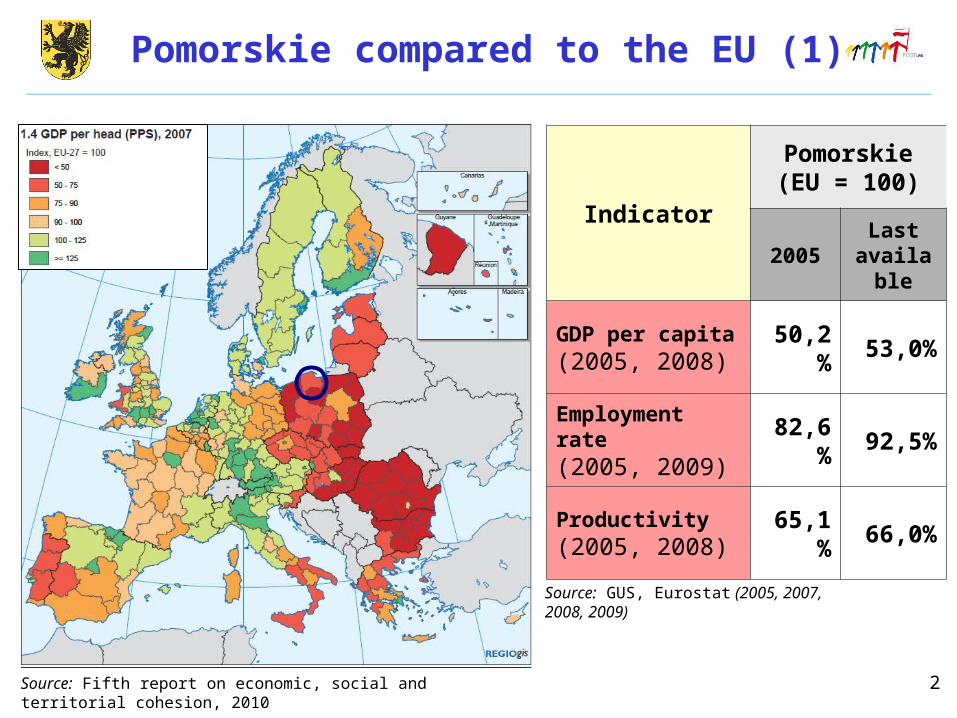
2Source: Fifth report on economic, social and territorial cohesion, 2010
Source: GUS, Eurostat (2005, 2007, 2008, 2009)
Indicator
Pomorskie(EU = 100)
2005Last
available
GDP per capita(2005, 2008)
50,2%
53,0%
Employment rate (2005, 2009)
82,6%
92,5%
Productivity(2005, 2008)
65,1%
66,0%
Pomorskie compared to the EU (1)

3
Selected Europe 2020 objectives
PolandPomors
kie
Employment rate 75% 64,9% 63,9%
R&D as percentage of GDP 3% 0,60% 0,57%
Share of renewable energy 20% 5,8% 9,9%
Source: Eurostat, GUS (2008, 2009)
Pomorskie compared to the EU (2)
…but still lagging behind, especially in the context of EUROPE 2020 targets
The region is catching up with the EU…

4
share of GDP 5.5%
share of population 5.9%
GDP per capita: 5th place
exports per capita: 5th place
unemployment rate: 12.2%
no. of SMEs: 260,000 (95% are micro companies)
private investment: 2.22 bln euro annually (exc. micro companies)Source: GUS, Eurostat, IBnGR (2008, 2009, 2010)
Pomorskie compared to Poland

5
The Region’s Strategic Challenges
1. How to improve our competitive position compared to other Polish regions? How to catch up with Europe’s most developed regions?
2. How to maintain and strengthen the region’s internal cohesion? How to stimulate growth in disadvantaged /marginalised areas?
COMPETITIVENES
S
COHESIO
N
ACCESSIBILITY
Mostly the economy
Mostly infrastructure
Mostly social issues

6
Priority Indicator 2015 target 2005 2009*
Competitiveness
GDP per capita
60% of EU average 50.2% 53.0%
105% of PL average 98.2% 94.9%
Cohesion Employment rate
95% of EU average 80.3% 89.9%
105% of PL average 96.6% 98.0%
Accessibility
Air passenger traffic
75% of EU average 22.5% 56.6%
125% of PL average 101.0% 167.8%
* or the last available
General Goals of the Region
Source: PRDS 2020, PROP 2007-2013, GUS, Eurostat (2008, 2009)

7
Groups of sourcesValue (euro bln)
% of the Strategy
Foreign public funds, including: 2.7 40.5%
Cohesion Policy 2004-2009 2.4 36.0%
National public funds 2.9 44.0%
Funds from strategic companies 1 15.5%
TOTAL 6.6 100%
Contribution of the Region
% of funds
Financial 5.5%
Policy-making 24.5%
Funding the Region’s Development 2005-2009
Source: PRDS Report 2005-2009
Data: end of 2009

8
THEMATIC AREA
2004-2006 perspective
2007-2013 perspective
TOTAL
EU funds(euro mln)
% of EU funds
EU funds(euro mln)
% of EU funds
EU funds(euro mln)
% of EU funds
Transport 652 56% 713 33% 1 365 41%
Environment + energy 203 18% 378 18% 581 18%
Enterprise + innovation 158 14% 470 22% 628 19%
Human capital 75 6% 191 9% 266 8%
Social infrastructure 70 6% 376 18% 446 14%
TOTAL 1 158 100% 2 128 100% 3 286 100%Source: internal
study
The EU’s Cohesion Policy in Pomorskie
NDP 2004-2006 + NSRF 2007-2013
Data: end of 2010

9
Effect of NDP/NSRF on GDP per capita
versus EU average (p.p.)
Average annual effects of Cohesion Policy in Pomorskie 2004-2015:
•GDP higher by 3.1% (625 mln euro)
•Investment expenditure higher by 11.4% (525 mln euro)
•Employment level higher by 15,000 people
Data based on HERMIN model
Effect of NDP/NSRF on GDP per capita
versus Polish average (p.p.)
Source: Estimating the effects…, WARR 2011
The Cohesion Policy’s Effects on the Region (1)

10
Cohesion Policy:
•strengthens strategic approach to planning regional development policy
•encourages informed choices and concentrated and selective interventions
•helps to increase institutional capacity
•teaches coordination and alignment of available funds
•strengthens empowerment and identity of regions
•strengthens the structures of civil society
•provides examples and standards for other regional policies
•ensures feedback from monitoring and evaluation
•emphasises the importance of environmental aspects
•helps to improve the quality of public services
The Cohesion Policy’s Effects on the Region (2)

11
The Region’s Strategic Challenges in the Context of Cohesion Policy
Strategic challenges of the Region
Role of Cohesion Policy
Underperforming innovation capacity +++
Openness to investors +
Raising the environmental “bar” +++
Persistent transport barrier +++
Opening up to energy specialisation ++
Untapped Baltic Sea Region opportunities
++
Capacity for strategic management of growth
+++
Ability to respond to external shocks ++
Growing deficit of labour resources ++

12
New Cohesion Policy should:
1.have a "Lisbon Treaty ORIGIN" and "Europe 2020 DESTINATION" (thematic and territorial concentration, integrated approach)
2.address ALL REGIONS(specific challenges and barriers, endogenous potential, individual development paths)
3.avoid going back to sectoral, centralised and spatially detached approach(spatially-blind intervention is far less efficient)
4.focus on strengthening competitiveness factors in regions lagging behind(right proportion of support for competitiveness and cohesion)
5.be regionalised, simplified and focused on productive instead of quick spending(multi-fund operational programmes, more use of financial engineering instruments)
Regional Expectations for Cohesion Policy

Thank You
Evidence Based Cohesion Policy Conference
Gdansk, July 7th 2011
Mieczysław StrukThe Marshal of Pomorskie province