restructuring of logistics processes -...
TRANSCRIPT

!
Restructuring of Logistics Processes: Case Study of Order Picking at Terminal C2 of Grupo Luís Simões
Francisco Tiago Louro Faria
Thesis to obtain the Master of Science Degree in
Civil Engineering
Supervisor Professor Vasco Domingos Moreira Lopes Miranda dos Reis
Examination Committee
Chairperson: Professor João Torres de Quinhones Levy Supervisor: Professor Vasco Domingos Moreira Lopes Miranda dos Reis
Members of the Committee: Professor Rui Manuel Moura de Carvalho Oliveira
March 2015

!

! i
ACKNOWLEDGEMENTS
This work, even with my committed time, knowledge, research and dedication, would not be possible
without the support of several people that helped me along the way.
In the first place, I have to thank my parents, Francisco and Maria da Luz, for all the support not only
in this entire process but also during my whole academic life. They provided me with everything that I
needed and way more.
For her full support and company while developing this work, I thank Elisa Brazão. She helped in
everyway she could.
I would like to thank my supervisor, Dr. Vasco Reis, for helping me every step of the way, aiding me in
surpassing problems and always providing prodigious suggestions. Even though he has a busy
schedule he made a great effort to always be at my disposal when needed and for that I am really
grateful.
Another important contribution to my work was the case study, and for that I have to thank Luís
Simões Group and many of its members. Virgílio Faustino for the introduction, António Fernandes,
Vera Noll, Paulo Pinto for being my contacts, Jorge Martins, Nuno Oliveira and Paulo Cruz for their
help and availability, just to name a few.
Finally, I would like also to thank João Pedro and all my friends and colleagues that helped me get the
most out of my academic life.

!ii

! iii
RESUMO
O objectivo global desta dissertação é avaliar e reestruturar os processos logísticos do Centro de
Operações Logísticas Carregado 2 da Luis Simões (C2), procurando melhoramentos na separação
de pedidos (picking). O picking representa custos significativos, com qualquer falta de performance a
elevar o custo da cadeia de abastecimento.
Uma análise da literatura propôs a otimização do picking manual e de um nível, através do foco no
layout (interno), políticas de atribuição de lugar de armazenamento, métodos de criação de rotas,
acumulação e separação de ordens, junção de ordens e zoneamento.
Assim, um modelo de simulação foi desenvolvido para avaliar o desempenho do picking no C2,
considerando vários cenários variando em política de atribuição de armazenamento e método de
criação de rotas.
Atingindo os objectivos, esta dissertação facultou conclusões importantes, quer para o C2 quer para a
optimização do picking em geral. Para o C2, o autor sugere que uma política de armazenamento de
classes igual ou similar a ABC1 seja aplicada e que rotas s-shape sejam impostas. ABC1 tem as
vantagens de um armazenamento baseado em classes e apresenta resultados semelhantes à política
turnover. Já s-shape é um dos métodos de criação de rotas com melhor desempenho e já está
implementado no sistema de gestão de armazém.
Em geral, o autor quer enfatizar que a prática metódica deve sempre prevalecer sobre ações
impulsivas, já que aparentes ganhos a curto prazo destas últimas não compensam, a longo prazo, as
perdas de produtividade causadas pelo afastamento dos métodos comprovados.
PALAVRAS-CHAVE
Atribuição de Armazenamento, Elaboração de Rotas, Simulação por Eventos DIscretos, Picking,
Armazenagem, Logística

!iv
! v
ABSTRACT
The comprehensive objective of the present dissertation is to assess and restructure the storage
assignment in the picking area and the order picking process to enhance the performance of Luis
Simões’s Carregado 2 Logistic Operations Centre (C2). Order picking is a labour-intensive operation
and so it represents significant costs, with any underperformance leading to high operational cost for
the whole supply chain.
A literature review proposed the optimization of order-picking processes by focusing on ideal layout
design, storage assignment methods, routing methods, order accumulation, order batching and
zoning.
Hence, to accomplish the objective, a simulation model was developed to evaluate the performance of
the order picking in C2, taking in account multiple scenarios varying in storage assignment policy and
routing method.
Fulfilling its objectives, this dissertation allowed for important conclusions to be drawn for C2 and also
for picking optimization in general. For C2, the author suggests that a class-based storage policy
equal or similar to ABC1 is applied and that s-shape routing is enforced. ABC1 has the advantages of
a class-based storage and performs similarly to the full-turnover policy and s-shape is one of the
better performing routing methods, while already implemented in the warehouse management system.
In general, the author would like to emphasise that a methodical practice should always prevail over
cunning actions, as the perceive short-term gains that pickers seek with their in-the-moment decisions
do not compensated the losses in productivity caused by the deviation from proven methods over a
longer period of time.
KEYWORDS
Storage Assignment, Routing Methods, Discrete Events Simulation, Order Picking, Warehousing,
Logistics

!vi

! vii
TABLE OF CONTENTS
1. INTRODUCTION ............................................................................................................... 1 1.1. MOTIVATION .................................................................................................................... 1 1.1.1. THE IMPORTANCE OF LOGISTICS AND SUPPLY CHAINS IN NOWADAYS SOCIETY .................. 1 1.1.2. THE IMPORTANCE OF WAREHOUSES IN THE SUPPLY CHAIN ............................................... 2 1.1.3. THE IMPORTANCE OF PICKING IN WAREHOUSE OPERATIONS ............................................. 2 1.2. OBJECTIVE ...................................................................................................................... 2 1.3. METHODOLOGY AND STRUCTURE OF THE DISSERTATION .................................................. 3
2. LITERATURE REVIEW .................................................................................................... 5 2.1. LOGISTICS AND SUPPLY CHAIN ......................................................................................... 5 2.1.1. HISTORIC CONTEXT ....................................................................................................... 5 2.1.2. BASIC CONCEPTS .......................................................................................................... 6 2.1.3. COSTS AND IMPORTANCE ............................................................................................. 10 2.2. WAREHOUSING .............................................................................................................. 13 2.2.1. WAREHOUSE DESIGN ................................................................................................... 16 2.2.2. PERFORMANCE EVALUATION ........................................................................................ 18 2.2.3. WAREHOUSE OPERATION ............................................................................................. 18 2.3. ORDER PICKING ............................................................................................................. 20 2.3.1. ORDER PICKING SYSTEMS ........................................................................................... 21 2.3.2. ORDER PICKING SYSTEMS DESIGN ............................................................................... 23 2.3.3. ORDER PICKING SYSTEMS OPTIMIZATION ..................................................................... 24 2.3.3.1. Layout Design ......................................................................................................... 27 2.3.3.2. Zoning ..................................................................................................................... 28 2.3.3.3. Batching .................................................................................................................. 29 2.3.3.4. Routing Methods ..................................................................................................... 32 2.3.3.5. Order Accumulation and Sorting ............................................................................. 36 2.3.3.6. Storage Assignment ................................................................................................ 37 2.3.3.6.1. Forward-reserve allocation ................................................................................... 37 2.3.3.6.2. Storage assignment policies ................................................................................. 38 2.3.3.6.3. Family grouping .................................................................................................... 42
3. THE CASE STUDY ......................................................................................................... 43 3.1. THE CARREGADO 2 LOGISTIC OPERATIONS CENTRE ...................................................... 43 3.2. FACILITIES ..................................................................................................................... 43 3.2.1. STORAGE AREA ........................................................................................................... 44 3.2.2. PERIPHERALS .............................................................................................................. 44 3.2.3. COMMENTS .................................................................................................................. 46 3.3. PROCESSES ................................................................................................................... 47 3.3.1. RECEPTION .................................................................................................................. 48 3.3.2. PICKING ....................................................................................................................... 49 3.3.3. DISPATCH .................................................................................................................... 51 3.3.4. AUTOMATIC HANDLING ................................................................................................. 51 3.3.5. CO-PACKING, REVERSE LOGISTICS AND INVENTORY ..................................................... 53
4. METHODOLOGY: DISCRETE EVENT MODELLING .................................................... 55 4.1. JUSTIFICATION OF METHODOLOGY CHOICES .................................................................. 55 4.1.1. DISCRETE EVENT SIMULATION ...................................................................................... 56 4.1.2. THE CHOICE OF DES FOR THIS RESEARCH WORK ........................................................ 57 4.1.3. DES DEVELOPMENT TOOLKIT ...................................................................................... 59 4.2. MODEL DESCRIPTION ..................................................................................................... 60 4.2.1. OBJECTIVES ................................................................................................................ 60

!viii
4.2.2. MODEL ARCHITECTURE ................................................................................................ 61 4.2.2.1. Scope of the simulation ........................................................................................... 63 4.2.2.2. Model Structure ....................................................................................................... 64 4.2.2.3. Order Entry and Exit ................................................................................................ 65 4.2.2.4. Model Network ........................................................................................................ 67 4.2.2.5. Picking ..................................................................................................................... 68 4.2.2.6. Model Animation ...................................................................................................... 70 4.3. VERIFICATION AND VALIDATION OF THE MODEL .............................................................. 71
5. CASE STUDY APPLICATION ........................................................................................ 75 5.1. SCENARIOS .................................................................................................................... 75 5.1.1. STORAGE ASSIGNMENT POLICIES ................................................................................. 76 5.1.2. ROUTING METHODS ..................................................................................................... 79 5.2. OTHER EXPERIMENTS CONSIDERATIONS ........................................................................ 81 5.3. RESULTS ....................................................................................................................... 82 5.4. RESULTS CONCLUSIONS ................................................................................................ 84 5.4.1. CONCLUSIONS ON STORAGE ASSIGNMENT POLICIES ..................................................... 84 5.4.2. CONCLUSIONS ON ROUTING ......................................................................................... 86 5.4.3. GENERAL CONCLUSIONS .............................................................................................. 88
6. CONCLUSIONS .............................................................................................................. 91
7. REFERENCES ................................................................................................................ 95
APPENDIX I – ADDITIONAL CASE STUDY CONSIDERATIONS ....................................... I.1
APPENDIX II – FLOWCHART OF CARREGADO 2 PROCESSES ..................................... II.1
APPENDIX III – SIMULATION MODEL ............................................................................... III.1
APPENDIX IV – WAREHOUSE SCHEMATICS ................................................................. IV.1
APPENDIX V – EXAMPLE OF ORDERS ............................................................................ V.1
APPENDIX VI – PRODUCT TURNOVER (WEEK 45, 2014) ............................................. VI.1
APPENDIX VII – DISTANCE VECTOR ............................................................................. VII.1
APPENDIX VIII – PRODUCT DISTRIBUTION (TURNOVER) .......................................... VIII.1
APPENDIX IX – PRODUCT DISTRIBUTION (ABC1) ........................................................ IX.1
APPENDIX X – ROUTING ................................................................................................... X.1
APPENDIX XI – RESULTS ................................................................................................. XI.1

! ix
LIST OF FIGURES
Figure 1.1 – Methodology of this project. ................................................................................................ 3 Figure 2.2 - Evolution of supply chain management (adapted from Tan, 2001) ..................................... 6 Figure 2.3 – Activities and firms in a supply chain (based on Tan, 2001). .............................................. 7 Figure 2.4 – The supply chain process (adapted from Min & Zhou, 2002). ............................................ 8 Figure 2.5 – Components of logistics management (adapted from Lambert, Stock, & Ellram, 1998). ... 9 Figure 2.6 – Global logistics expenditures (source: Frazelle, 2002). .................................................... 11 Figure 2.7 – Overall logistics costs as a percentage of sales turnover (source: Rushton, Croucher, &
Baker, 2006). ................................................................................................................................ 11 Figure 2.8 – Roles of a warehouse in the logistics chain (adapted from Frazelle, 2002). ..................... 15 Figure 2.9 – Framework for warehouse design and operation (adapted from Gu et al., 2007 and
Frazelle, 2002). ............................................................................................................................. 16 Figure 2.10 – Warehouse Design (Gu et al., 2010). ............................................................................. 17 Figure 2.11 – Warehouse Operation (Adapted from Frazelle, 2002) .................................................... 19 Figure 2.12 – Classification of order-picking systems (based on De Koster et al., 2007). .................... 21 Figure 2.13 – Complexity of order-picking systems (based on Koster et al., 2007). ............................. 24 Figure 2.14 – Typical distribution of an order picker’s time (Tompkins et al., 2003). ............................ 25 Figure 2.15 – Optimization of low level, manual-pick order-picking processes. .................................... 26 Figure 2.16 – Typical layout decisions in order picking system design (based on Koster et al., 2007).27 Figure 2.17 – Illustration of an order picking situation (above) and its graph representation (below)
(based on Koster et al., 2007). ..................................................................................................... 32 Figure 2.18 – A typical accumulation/sorting (A/S) system (based on Koster et al., 2007). ................. 36 Figure 2.19 – Illustration of two common ways to implement class-based storage (based on Koster et
al., 2007). ...................................................................................................................................... 40 Figure 3.20 – Entrance station (Source: António Fernandes, 2010). .................................................... 45 Figure 3.21 – Chariot (Source: António Fernandes, 2010). .................................................................. 45 Figure 3.22 – CPA picking a pallet from his entrance interface transporter. ......................................... 45 Figure 3.23 – CPA delivering a pallet to his exit interface transporter. ................................................. 45 Figure 3.24 – Produced pallets entrance station. .................................................................................. 46 Figure 3.25 – Rejection station (note the synoptic screen). .................................................................. 46 Figure 3.26 – Flowchart of the Carregado 2 processes. ....................................................................... 47 Figure 3.27 – Flowchart of the reception process. ................................................................................ 48 Figure 3.28 – Flowchart of the picking event. ....................................................................................... 49 Figure 3.29 – Flowchart of the automatic handling process. ................................................................. 52 Figure 3.30 – Flowchart of the store event. ........................................................................................... 53 Figure 3.31 – Flowchart of the retrieve pallets from storage event. ...................................................... 53 Figure 3.32 – Flowchart of the co-packing process. ............................................................................. 54 Figure 4.33 – Basic Discrete Event Model. ........................................................................................... 56 Figure 4.34 – Discrete Event Model with resources. ............................................................................. 57 Figure 4.35 – AnyLogic approaches (Source: AnyLogic, 2015). ........................................................... 59 Figure 4.36 – Conceptual structure of picking simulation. .................................................................... 61 Figure 4.37 – Conceptual representation of the model (delays in bold, movements in italic). .............. 62 Figure 4.38 – C2 schematics, aisle 21 to 30 (produced pallets entrance stations in red). .................... 63 Figure 4.39 – Model Structure. .............................................................................................................. 64 Figure 4.40 – Order entry. ..................................................................................................................... 65 Figure 4.41 – Order arrival schedule. .................................................................................................... 66 Figure 4.42 – Order exit. ....................................................................................................................... 67 Figure 4.43 – Model Network. ............................................................................................................... 68 Figure 4.44 – Picking. ........................................................................................................................... 69 Figure 4.45 – Animation window of the running model. ........................................................................ 70 Figure 4.46 – Statistics window of the running model. .......................................................................... 71 Figure 5.47 – Cumulative Turnover and class divisions. ....................................................................... 77 Figure 5.48 – Distribution of the ABC areas in scenario C (A in green, B in yellow and C in red). ....... 78 Figure 5.49 – Return route (scenario 1). ............................................................................................... 80 Figure 5.50 – Mid-point route (scenario 5). ........................................................................................... 80 Figure 5.51 – Example of a random route (scenario 2). ........................................................................ 80 Figure 5.52 – Example of a “LSPickers” route (scenario 3). ................................................................. 81

!x
Figure 5.53 – S-shape route (scenario 4). ............................................................................................ 81 Figure 5.54 – Return (scenario 1) box-and-whisker diagram (in hours). ............................................... 84 Figure 5.55 – Random (scenario 2) box-and-whisker diagram (in hours). ............................................ 84 Figure 5.56 – LSPickers (scenario 3) box-and-whisker diagram (in hours). ......................................... 85 Figure 5.57 – S-shape (scenario 4) box-and-whisker diagram (in hours). ............................................ 85 Figure 5.58 – Midpoint (scenario 5) box-and-whisker diagram (in hours). ............................................ 85 Figure 5.59 – Current (scenario A) box-and-whisker diagram (in hours). ............................................. 87 Figure 5.60 – Turnover (scenario B) box-and-whisker diagram (in hours). ........................................... 87 Figure 5.61 – ABC1 (scenario C) box-and-whisker diagram (in hours). ............................................... 88 Figure 5.62 – Three dimensional diagram of the picking time under the different scenarios. ............... 89 Figure 5.63 – Box-and-whisker diagram (in hours) of the picking time under the different scenarios. . 89 Figure 5.64 – Ordered box-and-whisker diagram (in hours) of the picking time under the different
scenarios. ..................................................................................................................................... 90

! xi
LIST OF TABLES
Table 2.1 – Literature on internal layout design. ................................................................................... 28 Table 2.2 – Literature on zoning. .......................................................................................................... 29 Table 2.3 – Literature on proximity order-batching. .............................................................................. 30 Table 2.4 – Literature on order-batching heuristics. .............................................................................. 30 Table 2.5 – Review on time window batching. ...................................................................................... 31 Table 2.6 – Review on time window batching, taking into consideration the order due time. ............... 32 Table 2.7 – Solving the (Steiner) Travelling Salesman Problem. .......................................................... 33 Table 2.8 – Routing Methods for a single-block warehouse. ................................................................ 34 Table 2.9 – Other routing issues. .......................................................................................................... 35 Table 2.10 – Travel time estimation under different storage assignment rules. .................................... 35 Table 2.11 – General literature on order accumulation and sorting. ..................................................... 37 Table 2.12 – Positioning of classes in low-level picker-to-part systems. .............................................. 40 Table 2.13 – Storage assignment policies. ........................................................................................... 41 Table 4.14 – Summary of model properties. ......................................................................................... 60 Table 4.15 – Characterization of events in picking. .............................................................................. 69 Table 5.16 – ABC1 class divisions. ....................................................................................................... 77 Table 5.17 – Current SAP results (in seconds). .................................................................................... 82 Table 5.18 – Turnover SAP results (in seconds). ................................................................................. 83 Table 5.19 – ABC1 SAP results (in seconds). ...................................................................................... 83 !! !

!xii
!!
! xiii
ABBREVIATIONS
C2 – Carregado 2 Logistic Operations Centre
DES – Discrete Event Simulation
LS – Luís Simões Group
SAP – Storage Assignment Policy
SKU – Stock-keeping Unit
VBA – Visual Basic for Applications
WMS – Warehouse Management System

!xiv

!
! 1
1. INTRODUCTION
In this section an account of the relevance of this work will be presented. To this end, the motivations,
objectives, methodology and the structure of this project will be clarified.
1.1. MOTIVATION
The main drive behind this dissertation was the massive importance of logistics in our world. Logistics
provide a backbone to economy and society. In this section the author further elaborates the
importance of logistics in general and picking in specific.
1.1.1. THE IMPORTANCE OF LOGISTICS AND SUPPLY CHAINS IN NOWADAYS SOCIETY
Today’s world could not function without logistics. Our everyday activities are supported by logistics,
responsible for the movement of materials. The way this is done affects costs, profits, customer
service, and virtually every other measure of performance of organizations.
Logistics plays a key role in the economy in two significant ways. First, logistics is one of the major
expenditures for businesses, thereby affecting and being affected by other economic activities.
Second, logistics supports the movement and flow of many economic transactions; it is an important
activity in facilitating the sale of virtually all goods and services (Lambert, Stock, & Ellram, 1998).
With this level of omnipresence logistics costs are obviously significant. Rushton, Croucher & Baker
(2006) indicated that the logistics alone represented between 10 and 15 per cent of the gross
domestic product of most major North American, European and Asia/Pacific economies. On a global
level, logistics expenditures exceed $3.5 trillion annually and represent nearly 20 per cent of the
world’s GDP (according to numbers of Frazelle, 2002 and Bowersox, Closs, & Cooper, 2002).
Accumulating significant cost with utmost usefulness, logistics has the awkward combination of being
both essential and expensive. No organisation can expect to prosper if it ignores logistics, hence
organising logistics properly can give a huge competitive advantage. Subsequently, the continuous
search for solutions that enhance the efficiency in logistics operations is nowadays one of the premier
challenges for organizations and so it is a prime field to study.

!
!2
1.1.2. THE IMPORTANCE OF WAREHOUSES IN THE SUPPLY CHAIN
Warehousing is an integral part of every logistics system that plays a vital role in providing a desired
level of customer service at the lowest possible total cost.
Whilst warehouses are critical to an extensive range of service, they are also substantial from a cost
standpoint since most of the warehouse operations are either labour or capital intensive. Baker &
Canessa (2009) indicate that the capital and operating costs of warehouses in Europe represent about
25% of logistics costs.
Therefore, given the importance and costs of warehouses, they are recognized as areas where
significant performance improvements can be achieved for the supply chain.
1.1.3. THE IMPORTANCE OF PICKING IN WAREHOUSE OPERATIONS
As more companies look to cut costs and improve productivity within their warehouses and distribution
centres, picking has come under increased scrutiny. Order picking is the most labour-intensive
operation in warehouses with manual systems, and a very capital-intensive operation in warehouses
with automated systems (De Koster et al., 2007).
Studies estimate the picking costs to be above 50% of the total warehouse operating expense (see
van den Berg & Zijm, 1999; Ruben & Jacobs, 1999; Broulias et al., 2005; Eisenstein, 2008; De Koster
et al, 2007; Rushton et al., 2006). Subsequently any underperformance in order picking can lead to
unsatisfactory service and high operational cost for the warehouse, and consequently for the whole
supply chain.
Therefore, in the present paradigm of companies actively competing and seeking cost reductions,
warehousing professionals (e.g. Goetschalckx & Ashayeri, 1989; De Koster et al., 2007) consider
order picking as the highest priority area for productivity improvements.
1.2. OBJECTIVE
The objective of the present work is to assess and restructure the logistics processes of a warehouse.
From its conception, this work was in symbiosis with the case study of Carregado 2 Logistic
Operations Centre, an automated warehouse located in Carregado, Portugal operated by Luís Simões
Group. In accordance with the observation of the C2 operations, the LS staff and the literature review,
it was decided that the logistics process to be analysed would be the storage assignment in the
picking area and the order picking process itself, namely the routing method. The aim is to enhance

!
! 3
the order picking performance. Order picking – the process of retrieving products from storage in
response to a specific customer request – is a labour-intensive operation and so it is easy to
understand that for distribution centres like C2 it represents significant costs.
The work to be done consisted on developing a methodology that would be able to assess the
performance of the order picking in C2, taking in account several scenarios, respectively before and
after the implementation of various storage assignment policies and routing methods. To this end a
simulation model, based mainly on discrete event simulation (DES), was created.
By comparing the results referent to the current status quo and various new scenarios, and taking in
account performance indicators like the picking travel time, it will be possible to assess about the
quality of the current order picking and of possible alterations. In other words, comparing a scenario
with the current order picking paradigm and scenarios with a new hypothesis will allow conclusions on
the performance of the order picking in C2, which is the objective of this dissertation.
1.3. METHODOLOGY AND STRUCTURE OF THE DISSERTATION
The fulfilment of this work required four stages, as seen in Figure 1.1.
Figure 1.1 – Methodology of this project.
The complete work is divided on five chapters that will be succinctly described.
In the present chapter, chapter 1, a description of the motivations, objectives, methodology and the
structure of this project is presented.
First Stage • Characterization of the Carregado 2 logistic operations centre
Second Stage
• Literature review • Study of possible improvement alternatives
Third Stage
• Construction of the simulation model • Collection and processing of data • Validation of the model
Fourth Stage
• Analysis and discussion of results • Assessment of performance • Final conclusions

!
!4
Chapter 2 is a literature review regarding the supply chain. This chapter unfolds with a progressive
focusing, from the supply chain to specifically order picking systems optimization.
On chapter 3 the topic is the Carregado 2 Logistic Operations Centre, the case study. Starting with a
brief history, it describes the facilities and processes at C2.
Based on the two previous chapters, a simulation model was developed (Chapter 4). This model is
applied to the case study (Chapter 5) and the obtained results discussed.
Finally, the conclusions of this work are offered on chapter 6, as well as indications to future works
related with the topic.

!
! 5
2. LITERATURE REVIEW
In this chapter a literature review regarding the subjects studied on this project is offered. In an effort
to be both exhaustive and brief, this review unfolds with a progressive focusing, from the macro
thematic of the supply chain to the specifics of order picking systems optimization.
In this context, section 2.1 introduces the concepts of logistics and supply chain, along with a historic
context and the costs and importance. Section 2.2 dwells into warehousing, reviewing warehouse
design, performance evaluation and warehouse operation. At last section 2.3 details order picking,
including order picking systems, their design, and their optimization. The focus is on order picking
systems optimization, namely layout design, zoning, batching, routing, order accumulation and sorting,
and storage assignment.
2.1. LOGISTICS AND SUPPLY CHAIN
“The foolish ones took their lamps but did not take any oil
with tem. The wise, however, took oil in jars along with their
lamps.”
Matthew 25:3-4
2.1.1. HISTORIC CONTEXT
Logistics activity is literally thousands of years old, dating back to the earliest forms of organized trade.
As an area of study however, it first began to gain attention in the early 1900s in the distribution of
farm products, as a way to support the organization's business strategy, and as a way of providing
time and place utility (Lambert, Stock, & Ellram, 1998).
Paralleling advances in management theory and information systems, logistics has evolved in scope
and influence (Frazelle, 2002). With the globalization of industry, logistics received more attention as a
major cost driver. Thus, corporations started looking to logistics as an opportunity for cost cutting,
which lead to a great development in this field (Lambert, Stock, & Ellram, 1998).
This evolution in supply chain management is illustrated in Figure 2.2, according with the work of Tan
(2001).

!
!6
Figure 2.2 - Evolution of supply chain management (adapted from Tan, 2001)
While originally considered a function with little added value, and primarily focused on cost
management (Langley, 1986), logistics has evolved into a source of competitive advantage
(Bowersox, Closs, and Stank, 1999; Daugherty, Stank, and Ellinger, 1998; Kent and Flint, 1997;
Lynch, Keller, and Ozment, 2000; Zhao, Dröge, and Stank, 2001). By delivering customer value
through quality logistics service (Mentzer, Flint, and Hult, 2001), firms are able to gain competitive
positioning in an area not as easily duplicated as price and promotion (Bowersox, Mentzer, and Speh,
1995). Hence, leveraging logistics management allows organizations to achieve customer satisfaction
and competitive advantage through inventory availability, timely delivery, and lower levels of product
damage (Bowersox and Closs, 1996; Day 1994; Mentzer and Williams, 2001; Morash, Dröge, and
Vickery, 1996; Olavarrieta and Ellinger, 1997).
2.1.2. BASIC CONCEPTS
According to the Council of Supply Chain Management Professionals (2013), the supply chain links
many companies together, comprehending the material and informational interchanges in the logistical
process, stretching from the acquisition of raw materials to delivery of finished products to the end
user. Figure 2.3 shows the activities and firms involved in a supply chain. Where appropriate, the
supply chain management also encompasses recycling or re-use of the products or materials.
1950s and 1960s: Mass Production
1970s: Manufacturing
Resource Planning
1980s: JIT, developing of supply chain management.
1990s: Inclusion of strategic
suppliers and the logistics function
in the value chain.
2000s: Improved efficiency across the value chain, costumer-focus corporate vision.

!
! 7
Raw Material Extractors/
ManufacturersThe Earth
Component Manufacturers
Final Product Manufacturers Wholesalers Retailers Final
ConsumersFinal
Consumers
Reverse Logistics
Physical)Distribution)and)Warehousing
Physical)Distribution)and)Warehousing
Figure 2.3 – Activities and firms in a supply chain (based on Tan, 2001).
The supply chain consists of the series of activities and organisations along which materials move
through on their journey from initial suppliers to final customers, including suppliers, manufacturing
centres, warehouses, distribution centres, and retail outlets, as well as raw materials, work-in-process
inventory, and finished products that flow between the facilities. Nowadays a supply chain may contain
thousands of links. Consequently, to reduce cost and improve service levels, effective supply chain
strategies must take into account the interactions at the various levels in the supply chain (Waters,
2003; Simchi-Levi et al., 2007).
Market leaders such as Wal-Mart and Dell soon understood that the supply chain could be a strategic
differentiator. They keep refining their supply chains so they stay one step ahead of the competition,
since today’s competitive edge is tomorrow’s price of entry (Cohen and Roussel, 2005).
To better understand and reap benefits from the supply chain, the concept of supply chain
management was introduced in the business and literature world. Referring back to the Council of
Supply Chain Management Professionals (2013) for the definition:
“Supply Chain Management encompasses the planning and management of all activities
involved in sourcing and procurement, conversion, and all logistics management activities.
Importantly, it also includes coordination and collaboration with channel partners, which can
be suppliers, intermediaries, third-party service providers, and customers. In essence, supply
chain management integrates supply and demand management within and across
companies.”
Supply chain management appears to treat all organizations within the value chain as a unified ‘virtual
business’ entity. In a truly ‘integrated’ supply chain, the final consumers pull the inventory through the
value chain instead of the manufacturer pushing the items to the end users (Tan, 2001).
A supply chain is characterized by a forward flow of goods and a backward flow of information
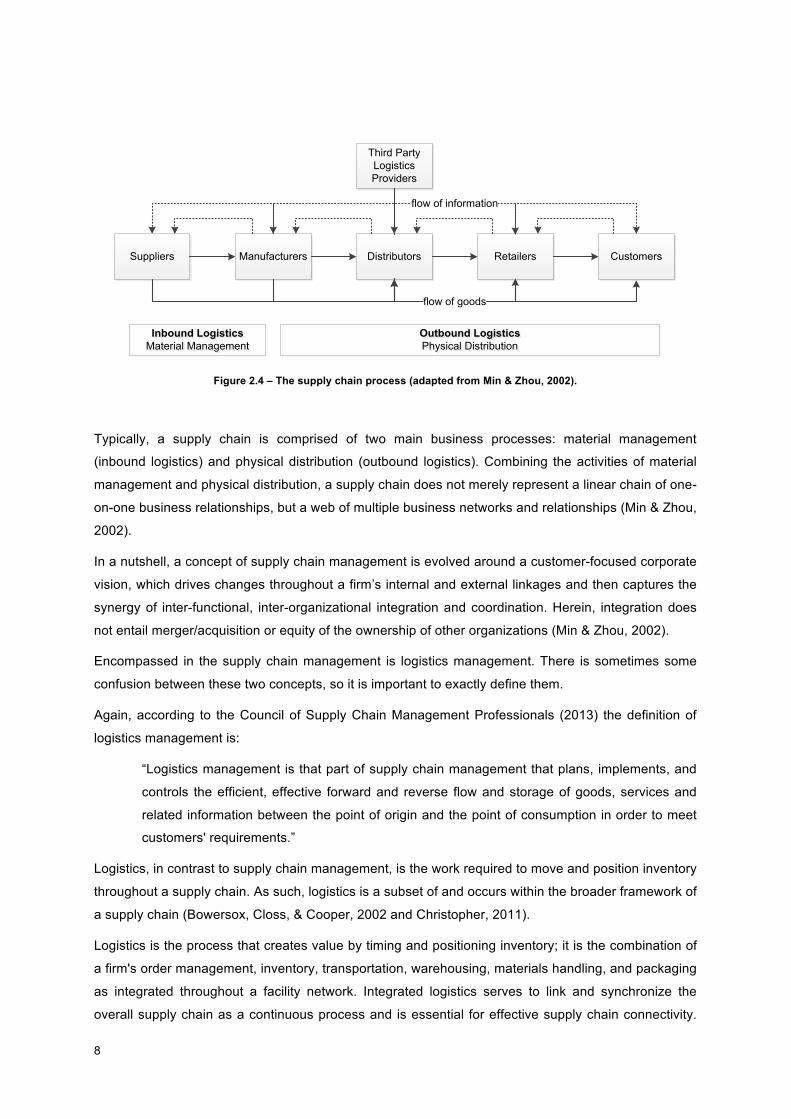
(Beamon, 1998 and Min & Zhou, 2002), as shown by Figure 2.4.
!
!8
Suppliers Manufacturers Distributors Retailers Customers
Third Party Logistics Providers
flow of goods
flow of information
Inbound LogisticsMaterial ManagementInbound Logistics
Material ManagementOutbound LogisticsPhysical Distribution
Outbound LogisticsPhysical Distribution
Figure 2.4 – The supply chain process (adapted from Min & Zhou, 2002).
Typically, a supply chain is comprised of two main business processes: material management
(inbound logistics) and physical distribution (outbound logistics). Combining the activities of material
management and physical distribution, a supply chain does not merely represent a linear chain of one-
on-one business relationships, but a web of multiple business networks and relationships (Min & Zhou,
2002).
In a nutshell, a concept of supply chain management is evolved around a customer-focused corporate
vision, which drives changes throughout a firm’s internal and external linkages and then captures the
synergy of inter-functional, inter-organizational integration and coordination. Herein, integration does
not entail merger/acquisition or equity of the ownership of other organizations (Min & Zhou, 2002).
Encompassed in the supply chain management is logistics management. There is sometimes some
confusion between these two concepts, so it is important to exactly define them.
Again, according to the Council of Supply Chain Management Professionals (2013) the definition of
logistics management is:
“Logistics management is that part of supply chain management that plans, implements, and
controls the efficient, effective forward and reverse flow and storage of goods, services and
related information between the point of origin and the point of consumption in order to meet
customers' requirements.”
Logistics, in contrast to supply chain management, is the work required to move and position inventory
throughout a supply chain. As such, logistics is a subset of and occurs within the broader framework of
a supply chain (Bowersox, Closs, & Cooper, 2002 and Christopher, 2011).
Logistics is the process that creates value by timing and positioning inventory; it is the combination of
a firm's order management, inventory, transportation, warehousing, materials handling, and packaging
as integrated throughout a facility network. Integrated logistics serves to link and synchronize the
overall supply chain as a continuous process and is essential for effective supply chain connectivity.

!
! 9
While the purpose of logistical work has remained essentially the same over the decades, the way the
work is performed continues to radically change (Bowersox, Closs, & Cooper, 2002 and CSCMP,
2013).
More recently, the concept of reverse logistics has been studied. Encompassing the logistics activities
as they operate in reverse, reverse logistics can be defined as the process of planning, implementing,
and controlling the efficient, cost effective flow of raw materials, in-process inventory, finished goods
and related information from the point of consumption to the point of origin for the purpose of
recapturing value or proper disposal. Furthermore reverse logistics also includes processing returned
merchandise due to damage, seasonal inventory, restock, salvage, recalls, and excess inventory. It
also includes recycling programs, hazardous material programs, obsolete equipment disposition, and
asset recovery (Rogers & Tibben-Lembke, 1998).
An overall aim for logistics is to achieve high customer satisfaction or perceived product value. This
must be achieved with acceptable costs (Waters, 2003).
Some of the many activities encompassed under the logistics umbrella are given in Figure 2.5, which
illustrates the outputs of the logistics, specifically competitive advantage, time and place utility,
efficient movement to the customer, and providing a logistics service mix such that logistics becomes
a proprietary asset of the organization.
Natural resources (land, facilities and
equipment)
Human resources
Information resources
Financial resources
Marketing orientation
(competitive advantage)
Time and place utility
Proprietary asset
Efficient movement to customer
Raw materials In-process inventory Finished goods
Logistics management
Suppliers Customers
Inputs into logistics
Outputs of logistics
Logistics activities
Management actions
! " Customer service! " Demand forecasting! " Distribution communications! " Inventory control! " Material handling! " Order Processing! " Parts and service support
! " Plant and warehouse site selection
! " Procurement! " Packaging! " Return goods handling! " Salvage and scrap disposal! " Traffic and transportation! " Warehousing and storage
Planning Implementation Control
Figure 2.5 – Components of logistics management (adapted from Lambert, Stock, & Ellram, 1998).

!
!10
As shown in Figure 2.5, Lambert, Stock, & Ellram (1998), identify the fourteen key activities in the
overall logistics process. While all organizations may not explicitly consider these activities to be part
of logistics activities, each activity affects the logistics process.
In a more concise way, Frazelle (2002) identifies five interdependent activities in logistics: customer
response, inventory planning and management, supply, transportation, and warehousing.
In order to handle its logistics activities effectively and efficiently, a company may consider the
following options (Razzaque & Sheng, 1998):
• It can provide the function in-house by making the service;
• It can own logistics subsidiaries through setting up or buying a logistics firm;
• It can outsource the function and buy the service.
Currently, there is a growing interest in the third option, i.e., outsourcing. Outsourcing refers to the
practice of a firm entrusting to an external entity the performance of an activity that was performed
erstwhile in-house (Varadarajan, 2009).
The tendency towards outsourcing thus is very strong and still growing. From total logistics
expenditures in Western Europe, 57% were directed towards outsourcing in 2005 and will further grow
to 67% in 2008 (Deepen, 2007).
For further details, the supply chains have been widely examined in the literature, either in mainstream
books or in specialised journals, as supported by the many and varied authors cited in this document.
It is possible to find literature reviews in the work of Tan (2001) Croom et al. (2000) and models in
Beamon (1998), Min & Zhou (2002).
2.1.3. COSTS AND IMPORTANCE
Every organisation depends on the movement of materials, and the way this is done affects costs,
profits, relations with suppliers and customers, customer service, and virtually every other measure of
performance (Waters, 2003).
Logistics plays a key role in the economy in two significant ways. First, logistics is one of the major
expenditures for businesses, thereby affecting and being affected by other economic activities. Thus,
by improving the efficiency of logistics operations, logistics makes an important contribution to the
economy as a whole. Second, logistics supports the movement and flow of many economic
transactions; it is an important activity in facilitating the sale of virtually all goods and services
(Lambert, Stock, & Ellram, 1998). Logistics is an important activity, making extensive use of the
human and material resources that affect the national economy (Rushton, Croucher, & Baker, 2006).

!
! 11
A recent study undertaken in the USA indicated the logistics alone represented between 10 and 15
per cent of the gross domestic product of most major North American, European and Asia/Pacific
economies (Rushton, Croucher, & Baker, 2006).
Global logistics expenditures exceed $3.5 trillion annually and represent nearly 20 per cent of the
world’s GDP, as illustrated in Figure 2.6 (Frazelle, 2002 and Bowersox, Closs, & Cooper, 2002).
Figure 2.6 – Global logistics expenditures (source: Frazelle, 2002).
It is also interesting to see how the logistics costs vary from one industry to another. Plotted in Figure
2.7, are some examples of logistics cost from different companies and different industries.
Figure 2.7 – Overall logistics costs as a percentage of sales turnover (source: Rushton, Croucher, & Baker, 2006).
$- $200 $400 $600 $800 $1 000
All Other
Asia/Pacific
Europe
North America
$516
$662
$877
$837
$652
$916
$941
$915
$Billions in USD
1996
1992
0% 20% 40% 60% 80% 100%
Office Equipment
Health Supplies
Soft drinks
Beer (food and drink)
Spirits distribution
Cement
Automotive parts
Gas Supply (non-bulk)
Computer Maintenance
Computer Supply
Healthcare
Specialist chemicals
Fashion
Food packaging
15
12
6
14
1
46
10
12
1
2
3
10
2
8
85
88
94
86
99
54
90
88
99
98
97
90
98
92
Overall Logistics Cost Other Costs

!
!12
The cost of logistics varies widely between different industries, as seen on the exhibits above and as
supported by Waters, 2003. One of the main reasons for these cost differences is that logistics
structures can and do differ quite dramatically between one company and another, and from one
industry to another. Also the relative importance of logistics is, of course, measured in relationship to
the overall value of the particular products in question.
Building materials, such as cement, are low-cost products (as well as being very bulky), so the relative
costs of its logistics are very high compared with, say, jewellery and cosmetics. These are very high-
value products, so the relative logistics costs appear very low (Rushton, Croucher, & Baker, 2006 and
Waters, 2003). However, one rule of thumb suggests that logistics costs are 15–20 per cent of
turnover (Waters, 2003).
For its importance and costs, logistics has the awkward combination of being both essential and
expensive. It affects customer satisfaction, the perceived value of products, operating costs, profit and
just about every other measure of performance (Waters, 2003). No organisation can expect to prosper
if it ignores logistics and organising logistics properly can give a huge competitive advantage.
We can, then, summarise the importance of logistics by saying that it (Waters, 2003):
• is essential, as all organisations, even those offering intangible services, rely on the
movement of materials;
• is expensive, directly affecting profits and other measures of organisational performance;
• has a major affect on lead time, reliability and other measures of customer service;
• determines the best size and location of facilities.
In today's global marketplace, individual firms no longer compete as independent entities with unique
brand names, but rather as integral parts of a supply chain. A single company can rarely control the
production of a commodity together with sourcing, distribution and retail (Min & Zhou, 2002;
Christopher, 2011 and Papageorgiou, 2009).
More importantly, the fierce competition in today’s global market drives companies to reduced cost
structures with lower inventories, more effective transportation systems, and transparent systems able
to support information throughout the supply chain (Papageorgiou, 2009). Furthermore, the
introduction of products with shorter life cycles, the ever increasing trend towards more product
variety, short response times, and heightened expectations of costumers have forced business
enterprises to invest in, and focus attention on, their supply chains. This, together with continuing
advances in communications and transportation technologies (e.g. mobile communication, internet
and overnight delivery), has motivated the continuous evolution of the supply chain and of the
techniques to manage it effectively (Simchi-Levi et al., 2007; Rouwenhorst et al., 2000).
As such, the ultimate success of a firm will depend on its managerial ability to integrate and coordinate
the intricate network of business relationships among supply chain members (Min & Zhou, 2002).

!
! 13
One idea that has been put forward in recent years is that these different elements of logistics are
providing an “added value” to a product, rather than just imposing an additional cost that must be
minimized regardless of any other implications. This is more positive view of logistics and is a useful
way of assessing the real contribution and importance of logistics and distribution services. Leading
organizations have acknowledged this positive value-added role that logistics can offer, recognizing it
as a key enabler for business improvement (Rushton, Croucher, & Baker, 2006).
The works of Christopher (2011) and Lambert, Stock, & Ellram (1998) support that the logistics
importance as a major key player in the organizations has been growing and that a position of
enduring superiority over competitors may be achieved through better management of logistics and
the supply chain. This competitive advantage can be provided by logistics in three forms:
• Considerable reductions in costs can be achieved, with the consequent increase in profits
(cost advantage);
• Ability of the organisation to differentiate itself, in the eyes of the customer, from its
competition, potentiating the development of sustainable competitive advantages (value
advantage)
• Great positive impact on costumer satisfaction, and therefore on sales.
Subsequently, the continuous search for solutions that enhance the efficiency in logistics operations is
nowadays one of the premier challenges for organizations (Bowersox, Closs, & Cooper, 2002).
2.2. WAREHOUSING
“They should collect all the food of these good years that are
coming and store up the grain… This food should be held in
reserve for the country, to be used during the seven years of
famine that will come…”
Genesis 41:35-36
We can define warehousing as that part of a firm’s logistics system that stores products (raw
materials, parts, goods-in-process, finished goods) at and between point of origin and point of
consumption, and provides information to management on the status, condition, and disposition of
items being stored (Lambert, Stock, & Ellram, 1998).
Warehousing is an integral part of every logistics system that plays a vital role in providing a desired
level of customer service at the lowest possible total cost. There are an estimated 750,000 warehouse
facilities worldwide, including state-of-the-art, professionally managed warehouses, as well as

!
!14
company stockrooms, garages, self-store facilities, and even garden sheds (Lambert, Stock, & Ellram,
1998).
Nevertheless, and because the value of strategic storage was not well understood, warehouses were
often considered "necessary evils" that added cost to the distribution process. The concept that
middlemen simply increase cost follows from that belief (Bowersox, Closs, & Cooper, 2002).
Over the years, warehousing has developed from a relatively minor facet of a firm’s logistics system to
one of its most important functions (Lambert, Stock, & Ellram, 1998). Today, warehouses are a key
aspect of modern supply chains and play a vital role in the success, or failure, of businesses (Frazelle,
2002).
The evolution of warehousing has been constant. Driven by market competition, continuous
improvements in the design and operation of distribution networks have required higher performance
from warehouses.
Furthermore, the adoption of new management philosophies such as Just-In-Time (JIT) or lean
production also brings new challenges for warehouse systems. On the other hand, the widespread
implementation of new information technologies (IT), such as bar coding, radio frequency
communications (RF), and warehouse management systems (WMS), provides new opportunities to
improve warehouse operations (Gu et al., 2007).
Warehouses major roles include: buffering the material flow along the supply chain to accommodate
variability caused by factors such as product seasonality and/or batching in production and
transportation and consolidation of products from various suppliers for combined delivery to customers
(Gu et al., 2007).
In addition to these traditional inventory holding roles, warehouses have been evolving to act as cross-
docking points (where goods are moved directly from inward to outward vehicles without being put
away into inventory), value added service centres (e.g. pricing and labelling goods for customers),
production postponement points (configuring or assembling goods specifically to customer demand so
that a smaller range of generic products can be held in inventory), returned good centres (for reverse
logistics of packaging, faulty goods or end-of-life goods) and many other miscellaneous activities, such
as service and repair centres (Baker & Canessa, 2009).
In a supply chain, a warehouse may play one or more of the following roles (Frazelle, 2002):
• Raw material and component warehouses: Hold raw materials at or near the point of induction
into a manufacturing or assembly process;
• Work-in-process warehouses: Hold partially completed assemblies and products at various
points along an assembly or production line;
• Finished goods warehouses: Hold inventory used to balance and buffer the variation between
production schedules and demand;

!
! 15
• Distribution warehouses and distribution centres: Accumulate and consolidate products from
various points of manufacture within a single firm or from several firms for combined shipment
to common customers;
• Fulfilment warehouses and fulfilment centres: Receive, pick, and ship small orders for
individual consumers;
• Local warehouses: Distributed in the field in order to shorten transportation distances to permit
rapid response to customer demand;
Figure 2.8 illustrates warehouses performing these functions in a logistics network.
Raw Materials Warehouse
Distribution Center
Work-in-Process
WarehouseLocal
Warehouse
Fulfilment Center Home Delivery
Local Delivery
Finished(Goods(Warehouse
Figure 2.8 – Roles of a warehouse in the logistics chain (adapted from Frazelle, 2002).
Whilst warehouses are critical to an extensive range of service, they are also substantial from a cost
standpoint since most of the warehouse operations are either labour or capital intensive.
The performance of these operations not only affects the productivity and operation costs of a
warehouse, but also the whole supply chain (Poon et al., 2009). Figures for the USA indicate that the
capital and operating costs of warehouses represent about 22% of logistics costs, whilst figures for
Europe give a similar figure of 25% (Baker & Canessa, 2009).
Given the importance and costs of warehouses, they are recognized as areas where significant
performance improvements can be achieved for the supply chain.
Gu et al. (2007) presents a unifying framework to classify the research on different but related
warehouse problems. This framework considers three categories: Warehouse Design, Performance
Evaluation and Warehouse Operation (Figure 2.9).

!
!16
Performance Evaluation
Warehouse Design
Warehouse Operation
Overall Structure
Sizing and Dimensioning
Equipment Selection
Department Layout
Operation Strategy
Storage
Put-Away
Receiving Cross-Docking
Material Handling
Sortation & Accumulation
Unitizing & Shipping
Order Picking
Figure 2.9 – Framework for warehouse design and operation (adapted from Gu et al., 2007 and Frazelle, 2002).
The following sections will analyse these three categories. The warehouse design decisions are based
mainly on strategic and tactical levels (long-term decisions), while decisions regarding warehouse
operations are based on the operational level (short-term decisions). Performance evaluation analyses
the quality of the project and/or operational policy, allowing improvements.
2.2.1. WAREHOUSE DESIGN
With the critical impact on customer service levels and logistics costs of warehouses, as well as the
degree of complexity involved, it is imperative to the success of businesses that warehouses are
designed so that they function cost effectively. This is particularly important as warehousing costs are
to a large extent determined at the design phase (Rouwenhorst et al., 2000).
According to Gu et al. (2007 & 2010) warehouse design involves five major decisions as illustrated in
Figure 2.10: determining the overall warehouse structure; sizing and dimensioning the warehouse and
its departments; determining the detailed layout within each department; selecting warehouse
equipment; and selecting operational strategies.

!
! 17
Warehouse Design
Overall Structure
Sizing and Dimensioning
Equipment Selection
Department Layout
Operation Strategy
Figure 2.10 – Warehouse Design (Gu et al., 2010).
The overall structure (or conceptual design) of a warehouse determines the material flow pattern
within the warehouse, the specification of functional departments, (e.g. how many storage
departments, employing what technologies, and how orders will be assembled) and the flow
relationships between departments. At this stage, the design intents to meet storage and output
requirements, and to minimize costs, which may be reduced investment or diminutions in future
operation costs (Gu et al., 2010).
The sizing and dimensioning decisions not only determine the size and dimension of the warehouse
but also the space allocation among the various warehouse departments, resulting in important
implications on costs as construction, inventory holding and replenishment, and material handling (Gu
et al., 2010).
Department layout is the detailed configuration within a warehouse department, for example, aisle
configuration in the retrieval area, pallet block-stacking pattern in the reserve storage area, and
configuration of an Automated Storage/Retrieval System (AS/RS) (Gu et al., 2010).
The layout decisions affect the construction and maintenance cost, material handling cost, storage
capacity, space utilization and equipment utilization of the warehouse (Gu et al., 2010).
The equipment selection decisions determine an appropriate automation level for the warehouse and
what type of storage and material handling systems should be applied. These decisions are obviously
in a strategic level, as they affect almost all the other decisions and the overall warehouse investment
and performance (Gu et al., 2010).
The selection of the operation strategy determines how the warehouse will be operated, for example,
with regards to storage and order picking. Operation strategies refer to those decisions about
operations that have global effects on other design decisions, and therefore need to be considered in
the design phase. These strategies, once selected, have important effects on the overall system and
are not likely to be changed frequently (Gu et al., 2010).
Examples of such operation strategies include the choice between randomized storage or dedicated
storage, whether or not to do zone picking, and the choice between sort-while-pick or sort-after-pick.

!
!18
Detailed operational policies, such as how to batch and route the order picking tour, are not
considered design problems (Gu et al., 2010).
It should be emphasized that warehouse design decisions are strongly coupled and it is difficult to
define a sharp boundary between them. Therefore, this proposed classification should not be regarded
as unique, nor does it imply that any of the decisions should be made independently. Furthermore,
one should not ignore operational performance measures in the design phase since operational
efficiency is strongly affected by the design decisions, but it can be very expensive or impossible to
change the design decisions once the warehouse is actually built.
2.2.2. PERFORMANCE EVALUATION
Performance evaluation provides feedback on the quality of a proposed design and/or operational
policy, and more importantly, on how to improve it. Assessing the performance of a warehouse in
terms of cost, throughput, space utilization, and service provides feedback about how a specific
design or operational policy performs compared with the requirements, and how it can be improved
(Gu et al., 2010). So performance evaluation is of utterly importance for both warehouse design and
operation.
Performance evaluation methods include analytical models, and simulation models.
Analytic performance models incorporate two main classes: aisle based models, focusing on a single
storage system and addressing travel or service time and integrated models which address either
multiple storage systems or criteria in addition to travel/service times (Gu et al., 2010).
Simulation is still the most widely used technique for warehouse performance evaluation in the
academic literature as well as in practice. However simulation results depend greatly on the
implementation details and are less pliable to generalization (Gu et al., 2010).
2.2.3. WAREHOUSE OPERATION
The basic requirements in warehouse operations are to receive Stock Keeping Units (SKUs) from
suppliers, store the SKUs, receive orders from customers, retrieve SKUs and assemble them for
shipment, and ship the completed orders to customers. There are many issues involved in designing
and operating a warehouse to meet these requirements. Resources, such as space, labour, and
equipment, need to be allocated among the different warehouse functions, and each function needs to
be carefully implemented, operated, and coordinated in order to achieve system requirements in terms
of capacity, throughput, and service at the minimum resource cost (Gu et al., 2007).

!
! 19
To fulfil these basic requirements, warehouses have a fundamental set of activities in common. These
activities, and the flows between them, are presented in Figure 2.11.
Warehouse Operation
Storage
Put-Away
Receiving Cross-Docking
Material Handling
Sortation & Accumulation
Unitizing & Shipping
Order Picking
Figure 2.11 – Warehouse Operation (Adapted from Frazelle, 2002)
Receiving consists in the orderly receipt of all materials coming into the warehouse, assuring that the
quantity and quality of such materials are as ordered and disbursing materials to storage (Frazelle,
2002).
Pre-packaging is performed in a warehouse when products are received in bulk from a supplier and
subsequently packaged before storage (Frazelle, 2002).
Put-away is the act of placing merchandise in storage. It includes the material handling, location
verification, and product placement (Frazelle, 2002).
Storage is the physical containment of merchandise while it is awaiting a demand. The storage
method depends on the size and quantity of the items in inventory and the handling characteristics of
the product or its container (Frazelle, 2002).
Order picking is the process of removing items from storage to meet a specific demand. It is the basic
service a warehouse provides for customers and is the function around which most warehouse
designs are based (Frazelle, 2002). In view of the importance and complexity of order picking this
subject will be revisited in a following chapter.
Packaging and/or pricing may be done as an optional step after the picking process. As in the pre-
packaging function, individual items or assortments are boxed (and labelled) for more convenient use
(Frazelle, 2002).
Sortation of batch picks into individual orders and accumulation of distributed picks into orders must
be done when an order has more than one item and the accumulation is not done as the picks are
made (Frazelle, 2002).

!
!20
Packing and shipping are the final phase of warehouse operations. They usually include a check of
the orders completeness, preparation of the shipping documents, the accumulating of orders by
outbound carrier and finally the loading of the transport vehicle (Frazelle, 2002).
As for cross-docking, it bypasses the storage activity by transferring items directly from the receiving
dock to the shipping dock. A pure cross-docking operation avoids put-away, storage, and order
picking. Cross-docking has become commonplace in warehousing because of its impact on costs and
customer service. Eliminating the put-away of products reduces costs and the time goods remain at
the warehouse, thus improving customer service levels (Lambert, Stock, & Ellram, 1998).
Available to assist in the warehouse operations are numerous commercial Warehouse Management
Systems (WMS). These computational systems help the warehouse manager to keep track of the
products, orders, space, equipment and human resources in a warehouse, while also providing
algorithms for storage location assignment, order batching or pick routing.
Decisions regarding to the warehouse operation are mainly made on the operational level (very
common and short-term decisions), but they are strongly influenced by the decision made on the
tactical and strategic level.
2.3. ORDER PICKING
As more companies look to cut costs and improve productivity within their warehouses and distribution
centres, picking has come under increased scrutiny. Order picking – the process of retrieving products
from storage (or buffer areas) in response to a specific customer request – is the most labour-
intensive operation in warehouses with manual systems, and a very capital-intensive operation in
warehouses with automated systems (De Koster et al., 2007).
Order picking has long been identified as the most labour-intensive and costly activity for almost every
warehouse. Studies estimate the picking costs to be above 50% of the total warehouse operating
expense (see van den Berg & Zijm, 1999; Ruben & Jacobs, 1999; Broulias et al., 2005; Eisenstein,
2008; De Koster et al, 2007; Rushton et al., 2006). Subsequently any underperformance in order
picking can lead to unsatisfactory service and high operational cost for the warehouse, and
consequently for the whole supply chain. Therefore, in the present paradigm of companies actively
competing and seeking cost reductions, warehousing professionals consider order picking as the
highest priority area for productivity improvements (Goetschalckx & Ashayeri, 1989; De Koster et al.,
2007).
Several recent tendencies in manufacturing and distribution have increased the importance and
complexity of the order-picking design and management. In distribution logistics and to satisfy
customers, businesses tend to accept late orders while still offering rapid and timely delivery within
tight time windows, resulting in a short time availability for order picking (De Koster et al., 2007).

!
! 21
The organisation of order-picking processes directly influences the distribution centres and
consequently the supply chain’s performance. To answer industry needs, the latest innovative
solutions have made it possible to accomplish productivity up to 1000 picks per person hour. This
evolution is also backed by science, which rapid progression in the last decades allowed for many
papers on order picking processes (De Koster et al., 2007).
2.3.1. ORDER PICKING SYSTEMS
Order picking can be a somehow vast process, starting with the reception and scheduling of customer
orders and proceeding with the assigning of stock on locations to order lines, the release of the orders
to the pickers and finally the retrieval of the articles from storage locations, the actual picking. The
customer orders (also referred as order lists in this work) consist of order lines, each line
corresponding to a certain quantity of product or stock-keeping unit (SKU) (De Koster et al., 2007).
Order-picking methods
Employing humans
Employing machines
Automated picking
Picking robots
Put system
Parts-to-picker
Picker-to-parts
Pick by order (discrete picking) or pick by article
(batch picking)Not zoned or zoned
Progressive or synchronized (if zoned)
Low-level or high-level
Figure 2.12 – Classification of order-picking systems (based on De Koster et al., 2007).
Many different order-picking system types can be found in warehouses (Figure 2.12), with the
possibility that multiple order-picking systems are employed within one warehouse.
Order-picking systems are, primarily, distinguished according to whether humans or automated
machines are used. The majority of warehouses employ humans for order picking. Among these, a
common means for classifying order picking systems is the method by which items are retrieved from

!
!22
storage. The picker-to-parts systems, where the order picker walks or drives along the aisles to pick
items, are most common.
A major advantage of picker-to-part systems is that, due to the dexterity of the human order picker,
multiple locations can be visited on each tour through the warehouse (Ruben & Jacobs, 1999).
Within the picker-to-parts systems there are two alternatives: low-level picking and high-level picking.
In low-level order-picking systems, the order picker picks needed items from storage racks or bins
while travelling along the storage aisles at ground level. On a high-level (or man-aboard) order-picking
system pickers travel to the pick locations on various levels (at high storage racks) on board of a lifting
order-pick crane (De Koster et al., 2007). In simple terms, low-level picking evolves a bi-dimensional
movement of the picker while high-level picking requires three-dimensional moment, being the extra
dimension height.
Figure 2.12 also shows several organizational variants of picker-to-parts systems.
The main alternatives include picking by article (batch picking) or pick by order (discrete picking).
These take in consideration the method by which the customer orders are assigned to order pickers.
Picking by order refers to the case where a single picker retrieves each customer order individually. In
picking by article system however, various customer orders (the batch) are picked by an order picker,
simultaneously. This simultaneously picking of multiple orders requires, obviously, subsequent sorting.
The sorting can be immediate (on the pick cart) and performed by the order picker (sort-while-pick), or
it can take place after the picking has finished (pick-and-sort) (De Koster et al., 2007; Ruben &
Jacobs, 1999).
Discrete picking is common because it is simple and reliable in that a picker needs only to manage
one customer order at a time. Furthermore, a customer order is picked quickly upon receipt without
delaying the batch with other customer orders or to hand off a partially picked order from one picker to
another. The main disadvantage of discrete order picking is that the amount of walking per pick can be
high (Eisenstein, 2008).
Another basic variant is zoning, which means that the storage area is split in multiple parts, each with
designated order pickers charged with picking items within his zone. Contingent on the picking
strategy, zoning may be additionally classified as two types: progressive zoning and synchronized
zoning, depending on whether orders picked in a zone are transferred to other zones for completion or
picked in parallel. The term wave picking refers to orders for a common destination (for example,
departure at a fixed time with a certain carrier), which are discharged simultaneously for picking in
multiple warehouse areas. Order pickers continuously pick the demanded items in their zones, and the
next picking wave can only start when the previous one is finalised (De Koster et al., 2007).
Please bear in mind that it is possible the combine this various variations, e.g. it is possible to have in
place a picking by article system with zoning.
In a metaphoric way, picker-to-parts systems and parts-to-picker systems can be the two sides of the
same coin, being opposite in nature.

!
! 23
Parts-to-picker are systems in which items are delivered to a stationary order picker by an automated
device (Ruben & Jacobs, 1999). Parts-to-picker systems embrace automated storage and retrieval
systems (AS/RS), which retrieve one or more unit loads (e.g. pallets or bins) and bring them to a pick
position (i.e. a depot), using mostly aisle-bound cranes. At this position the order picker takes the
necessary number of products, with the remaining load returning to storage again. These systems can
also appear in literature under the names of unit-load or end-of-aisle order-picking system. Other
systems like modular vertical lift modules (VLM) or carousels can also be used in a parts-to-picker
operation (De Koster et al., 2007).
Put systems, or order distribution systems, consist of a retrieval and distribution procedure. Firstly
items are retrieved to a carrier, in a parts-to-picker or picker-to-parts manner. Secondly, a picker
distributes these pre-picked units, which arrive in the carrier, over customer orders (‘puts’ them, hence
the name). Put systems are specially popular for picking a large number of customer order lines in a
short amount of time, being capable of 500 picks on average per picker hour in well-managed systems
(De Koster et al., 2007).
Finally, in the order-picking systems employing machines, we have automated and robotized picking.
These systems are only used in special cases (e.g. valuable, small and delicate items) (De Koster et
al., 2007).
2.3.2. ORDER PICKING SYSTEMS DESIGN
Due to a wide spectrum of external and internal factors which impact design choices, the design of
real order-picking systems is often complicated. External factors that influence the order-picking
choices are diverse and comprise marketing channels, customer demand pattern, supplier
replenishment pattern and inventory levels, the overall demand for a product, and the state of the
economy. Some of these factors can be hard to evaluate and undergo serious changes overtime.
Internal factors are also extensive and include system characteristics, as well as organization and
operational policies of the order-picking systems. As seen in Figure 2.13, system characteristics
consist of mechanization level, information availability and warehouse dimensionality. Because of the
strategic level of these factors, they are often concerned at the design stage. As for the organization
and operational policies, they include mainly five factors: routing, storage, batching, zoning and order
release mode. Figure 2.13 illustrates the complexity of order-picking systems, measured by the
distance of the representation in the axis system to the origin. Meaning that the farther a system is
positioned from the origin, the more difficult it is to design and control (De Koster et al., 2007).
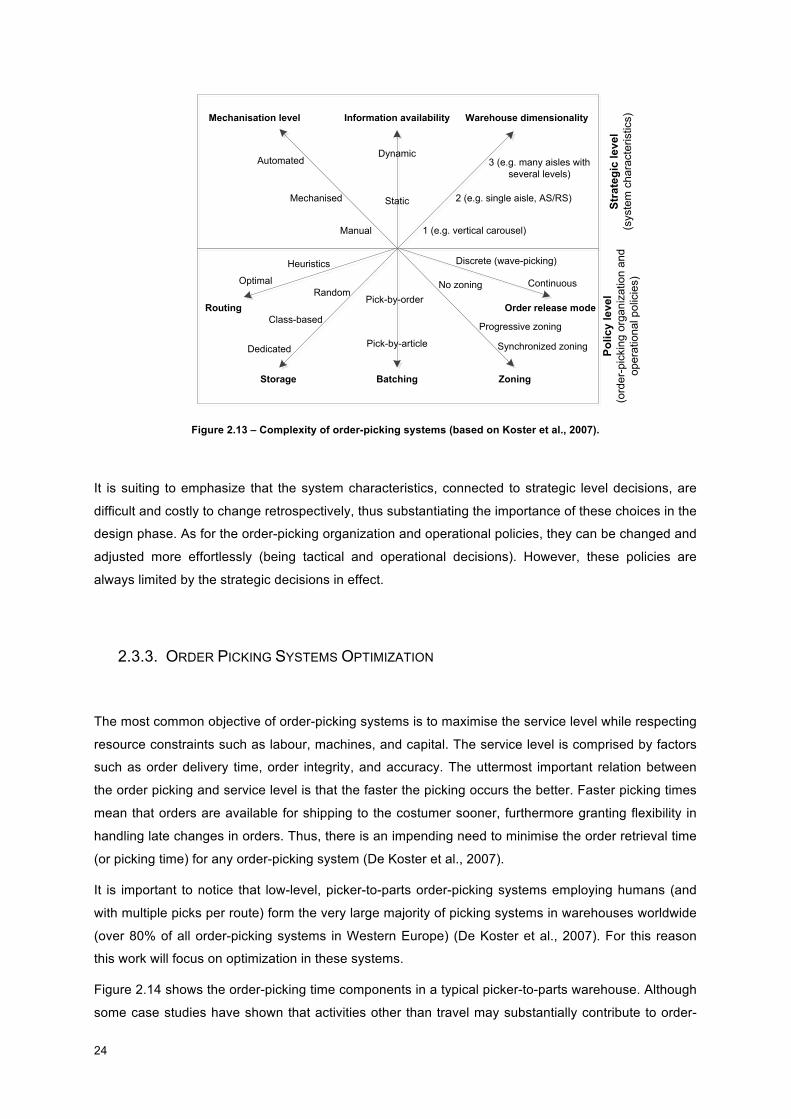
!
!24
Information availability
Batching
Warehouse dimensionalityMechanisation level
ZoningStorage
Routing Order release mode
Polic
y le
vel
(ord
er-p
icki
ng o
rgan
izat
ion
and
oper
atio
nal p
olic
ies)
Stra
tegi
c le
vel
(sys
tem
cha
ract
eris
tics)
Automated
Mechanised
Manual
Dynamic
Static
1 (e.g. vertical carousel)
2 (e.g. single aisle, AS/RS)
3 (e.g. many aisles with several levels)
OptimalRandom
Dedicated
Class-based
Heuristics
Pick-by-order
Pick-by-article
No zoning
Progressive zoning
Synchronized zoning
Discrete (wave-picking)
Continuous
Figure 2.13 – Complexity of order-picking systems (based on Koster et al., 2007).
It is suiting to emphasize that the system characteristics, connected to strategic level decisions, are
difficult and costly to change retrospectively, thus substantiating the importance of these choices in the
design phase. As for the order-picking organization and operational policies, they can be changed and
adjusted more effortlessly (being tactical and operational decisions). However, these policies are
always limited by the strategic decisions in effect.
2.3.3. ORDER PICKING SYSTEMS OPTIMIZATION
The most common objective of order-picking systems is to maximise the service level while respecting
resource constraints such as labour, machines, and capital. The service level is comprised by factors
such as order delivery time, order integrity, and accuracy. The uttermost important relation between
the order picking and service level is that the faster the picking occurs the better. Faster picking times
mean that orders are available for shipping to the costumer sooner, furthermore granting flexibility in
handling late changes in orders. Thus, there is an impending need to minimise the order retrieval time
(or picking time) for any order-picking system (De Koster et al., 2007).
It is important to notice that low-level, picker-to-parts order-picking systems employing humans (and
with multiple picks per route) form the very large majority of picking systems in warehouses worldwide
(over 80% of all order-picking systems in Western Europe) (De Koster et al., 2007). For this reason
this work will focus on optimization in these systems.
Figure 2.14 shows the order-picking time components in a typical picker-to-parts warehouse. Although
some case studies have shown that activities other than travel may substantially contribute to order-

!
! 25
picking time, travel is often the dominant component. Quoting Bartholdi and Hackman (2011) “travel
time is waste. It costs labour hours but does not add value”. It is, therefore, the first and most
promising candidate for enhancement.
Figure 2.14 – Typical distribution of an order picker’s time (Tompkins et al., 2003).
For manual-pick order-picking systems, the travel time is a function of the travel distance.
Consequently, the travel distance is fairly considered as a primary objective for improvement, in
warehouse design and optimisation (De Koster et al., 2007).
Nevertheless, minimising the travel distance is only one of many possibilities. Another important
objective would be minimising the total cost (that may include both investment and operational costs).
Other objectives that are often taken into account in warehouse design and optimisation are to (De
Koster et al., 2007):
• minimise the throughput time of an order;
• minimise the overall time (e.g. to complete a batch of orders);
• maximise the space utilization;
• maximise the equipment utilization;
• maximise the use of labour;
• maximise the accessibility to all items.
0% 10% 20% 30% 40% 50% 60%
Other
Setup
Pick
Search
Travel
5%
10%
15%
20%
50%
% of order-picker's time
Act
ivity

!
!26
To achieve these objectives companies make design and control choices regarding their order picking
systems. These decisions occur at tactical or operational levels (policy level in Figure 2.13), with a
different time horizon (Rouwenhorst et al., 2000). De Koster et al. (2007) lists the following decisions:
• layout design and dimensioning of the storage system (tactical level);
• assigning products to storage locations (storage assignment) (tactical and operational level);
• assigning orders to pick batches and grouping aisles into work zones (batching and zoning)
(tactical and operational level);
• order picker routing (routing) (operational level);
• sorting picked units per order and grouping all picks of the orders (order accumulation/sorting)
(operational level).
In fulfilling the overhead objectives, the decisions carried out at the various levels are strongly
interdependent. For instance, a certain layout or storage organization may present good results for
certain routing strategies, but perform inadequately for others. Still, including all decisions (with
obvious different decision horizons) in one model is complex. Researchers, consequently, restrict their
studies to one or few decision areas at a time. To be practical, the decision process follows a
sequential approach, while some variations may simply not be pondered (De Koster et al., 2007).
In a nutshell, this dissertation targets the optimization of low level, manual-pick order-picking
processes by focusing on ideal (internal) layout design, storage assignment methods, routing
methods, order accumulation, order batching and zoning (Figure 2.15).
Zoning
Order Batching
Routing Methods
Order Accumulation
(Internal) Layout Design
Storage Assignment Methods
Figure 2.15 – Optimization of low level, manual-pick order-picking processes.
The optimization of these six policies has the advantage to stay within the tactical and operational
levels, which is critical for a built warehouse where strategic decisions are already taken and are
difficult and expensive to change. In this optimization the author aims fundamentally to minimize the
total time of picking, although this is not the only objective taken into consideration.

!
! 27
2.3.3.1. LAYOUT DESIGN
In order picking, the layout design addresses two sub-problems: the layout of the facility containing the
order-picking system and the layout within the order-picking system. The first problem is usually called
the facility layout problem and relates to the decision of locating various departments (receiving,
picking, storage, sorting, and shipping, etc.). This decision often takes into account the activity
correlation between the departments. The common objective is to minimise the handling cost, which is
often represented by a function with the travel distance as variable (De Koster et al., 2007).
To stay within the tactical and operational levels the author focuses on the second sub-problem, which
will be referred as internal layout design. It concerns the determination of the number of blocks, and
the number, length and width of aisles in each block of a picking area (see Figure 2.16).
Lenght and number of
aisles?Location of depot?depot
Cross aisle: yes or no? If yes: how
many and where?
Storage blocks: how many?
Figure 2.16 – Typical layout decisions in order picking system design (based on Koster et al., 2007).
The objective is to find the best warehouse layout with respect to a certain objective function, taking in
consideration a set of constraints and requirements. Again, the most common objective function is the
travel distance. Table 2.1 presents a literature review on the subject.

!
!28
Table 2.1 – Literature on internal layout design.
Low-level manual order-picking systems
Bassan et al. (1980) Evaluation of two different parallel-aisle layouts for handling (including travel) and layout costs
Rosenblatt and Roll (1984) Study of the effect of storage policy on the internal layout of warehouse (using both analytical and simulation methods)
Rosenblatt and Roll (1988) Effects of stochastic demands and different service levels on the warehouse layout and storage capacity
Yoon and Sharp (1995) Example application of the cognitive design procedure for an order pick system
Roodbergen (2001) Determining the aisle configuration for random storage warehouses that minimises the average tour length (using a non-linear objective function)
Caron et al. (2000) Minimisation of the average tour length in 2-block warehouses (i.e., one middle cross aisle) under the COI-based storage assignment
Le-Duc and De Koster (2005a) Minimisation of the average tour length in class-based storage assignment warehouses
Petersen (2002) Simulation of the total travel time with different aisle length and number of aisles, for both random and volume-based storage assignment methods
Unit-load (mainly AS/RS) systems
Larson et al. (1997) Heuristic approach to layout a unit-load warehouse and to assign product classes to locations, with the objective of increasing floor space utilisation and decreasing travel distance
Eldemir et al. (2004) New cycle time and space estimation models for automated storage and retrieval system conceptualization
Park and Webster (1989) Design of class-based storage racks for minimizing travel time in a three dimensional storage system
De Koster and Le-Duc (2005) Optimal dimensions of a three-dimensional rack of given capacity (minimising the unit-load retrieval time)
2.3.3.2. ZONING
The order picking area can be divided into zones, each with an assigned order picker that picks the
part of the order that is in his assigned zone.
Possible advantages of zoning include the fact that each picker is confined to a smaller area, reducing
traffic congestion and allowing the familiarisation with the item locations within the zone. The central
disadvantage of zoning is that orders are split, requiring consolidation before shipment to the customer
(De Koster et al., 2007).
Two tactics can be used to manage these disadvantages. Firstly the order can be assembled
progressively, which uses multiple order pickers to conclude an order. One order picker is responsible
to start on the order and, when he concludes his part, the task is transferred to the next picker, who
continues assembling the order. Therefore an order (or batch of orders) is only completed after having
visited all relevant zones. This system is also called pick-and-pass. The second approach for zoning is
parallel (or synchronised) picking, where a number of order pickers pick simultaneously the same

!
! 29
order, each in his attributed zone. The partial orders are consolidated after picking (De Koster et al.,
2007).
In reality, zoning is based on product characteristics, as size, weight, required temperature and safety
requirements. Table 2.2 presents a literature review on the subject.
Table 2.2 – Literature on zoning.
General literature on zoning Speaker (1975) Generic discussion on zoning
De Koster (1994) Models a zoned pick-and-pass system determining the number of zones and the system size
Mellema and Smith (1988)
Examination of the effects of the aisle configuration, stocking policy and batching and zoning rules by using simulation. Results suggest that a combination of batching and zoning can significantly increase the productivity (pieces per man-hour)
Petersen (2002)
Effects of zone shape (number of aisles per zone, the aisle lengths), the number of items on the pick-list and the storage policy on the average travel distance within the zone, using simulation
Choe et al. (1993) Effects of three strategies in an aisle-based order-picking system: single- order-pick, sort-while-pick, and pick-and-sort
Malmborg (1995) Assignment of products to locations with zoning constraints Brynzer and Johansson (1995) A case study with zoning and batching
Yu and De Koster (2009) Impact of order batching and picking area zoning on order picking system performance
Distribution of the workload over the order pickers
Jane (2000) Heuristic algorithms to balance the workloads and to adjust the zone size for order volume fluctuation in a progressive zoning system
Jane and Laih (2005) Assigning products to zones in a synchronised system (using heuristics)
Jewkes et al. (2004) Product assignment problem (as well as zone sizing and picker home base location) for a progressive system, using dynamic programming
Le-Duc and De Koster (2005b) Optimal number of zones in a synchronised zoning system such that the total order-picking and assembly time is minimized
2.3.3.3. BATCHING
Order batching is the method of grouping a set of orders into a number of sub-sets, each of which can
then be retrieved by a single picking tour. According to Choe and Sharp (1991), there are basically two
criteria for batching: the proximity of pick locations and time windows.
In proximity batching each order is assigned to a batch based on nearness of its storage locations to
those of other orders. The major difficulty in establishing a batch using proximity batching is measuring
the proximities among orders, which implicitly assumes a pick sequencing rule to visit a set of
locations (De Koster et al., 2007). Therefore batching and routing decisions become interdependent,
testifying to the already stated in chapter 2.3.3. Please also note that this distance between batches

!
!30
may not be strictly a physical (i.e. meter) distance. Table 2.3 presents a literature review on the
subject.
Table 2.3 – Literature on proximity order-batching.
General proximity order-batching literature
Gademann et al. (2001)
Study of the proximity order-batching problem in a manual-pick wave-picking warehouse, with the objective of minimising the maximum lead-time of any batch. They propose a branch-and-bound algorithm to solve the order-batching problem exactly for small instances and a 2-opt heuristic procedure for large instances.
Henn et al. (2011) Survey of approaches for order batching in order picking warehouses.
Gademann and Van de Velde (2005)
Minimising the total travel time using order batching on a manual picking system. A branch-and-price algorithm is designed to solve instances of modest size to optimality. For larger instances, it is suggested to use an iterated descent approximation algorithm.
Chen and Wu (2005) They develop an association-based order-clustering model based on 0-1 integer programming.
Chen et al. (2005) Aggregation of orders in distribution centers using data mining
Hsu et al. (2005) Batching orders in warehouses by minimizing travel distance with genetic algorithms
Being order batching a complex problem, many studies on the subject focus on developing heuristic
approaches to solve it. For manual picking systems, two types of order-batching heuristics can be
appointed: seed and savings algorithms (De Koster et al., 2007). A literature review on order-batching
heuristics is presented in Table 2.4.
Table 2.4 – Literature on order-batching heuristics.
Seed algorithms literature Elsayed (1981)
Single aisle man-on-board AS/RS systems Elsayed and Stern (1983) Hwang et al. (1988) Hwang and Lee (1988) Pan and Liu (1995) Gibson and Sharp (1992)
Multiple aisle systems Rosenwein (1994) Ruben and Jacobs (1999) De Koster et al. (1999)
Saving algorithms literature
Elsayed and Unal (1989) Propose four batching heuristics like the SL algorithm, which classifies orders as large or small before assigning them to different batches, generating lowest travel distances.
De Koster et al. (1999)
Comparative study for the seed and savings heuristics for multiple-aisle picker-to-parts systems. They conclude that: order batching methods improve significantly when compared to the first-come first-serve batching rule; seed algorithms are best in conjunction with the s-shape routing and a large capacity pick device; time savings algorithms perform best in conjunction with the largest gap routing and a small pick device capacity.
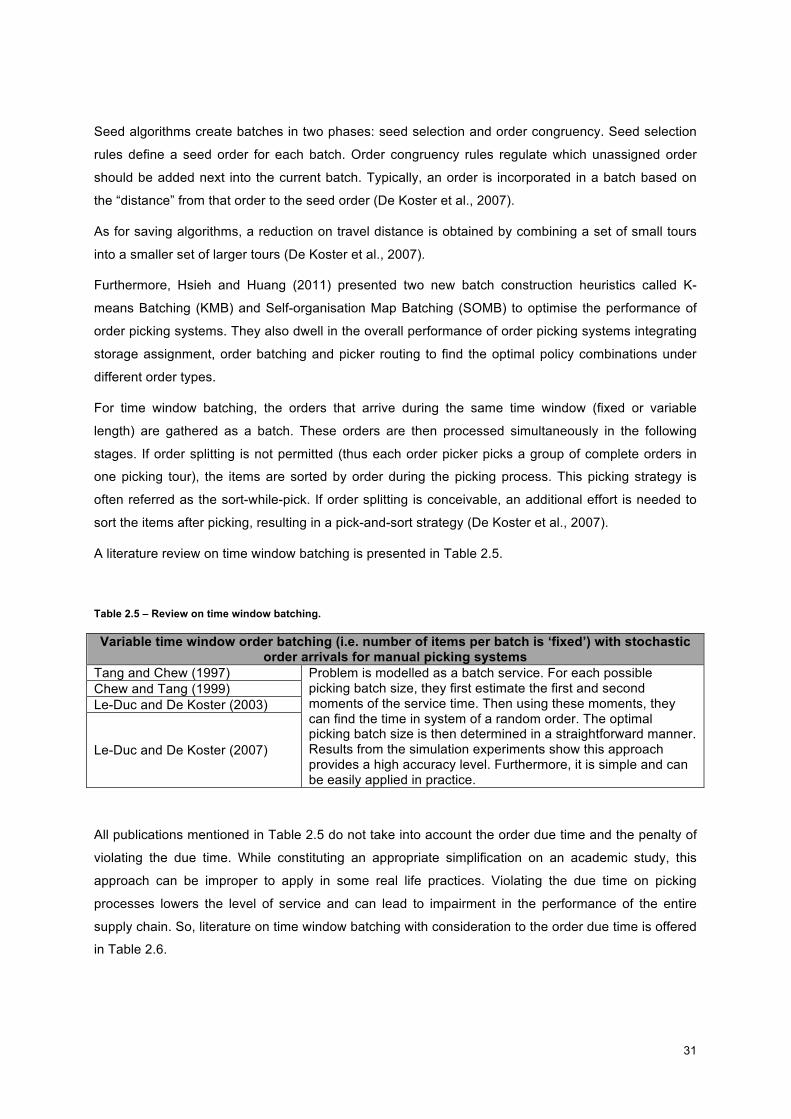
!
! 31
Seed algorithms create batches in two phases: seed selection and order congruency. Seed selection
rules define a seed order for each batch. Order congruency rules regulate which unassigned order
should be added next into the current batch. Typically, an order is incorporated in a batch based on
the “distance” from that order to the seed order (De Koster et al., 2007).
As for saving algorithms, a reduction on travel distance is obtained by combining a set of small tours
into a smaller set of larger tours (De Koster et al., 2007).
Furthermore, Hsieh and Huang (2011) presented two new batch construction heuristics called K-
means Batching (KMB) and Self-organisation Map Batching (SOMB) to optimise the performance of
order picking systems. They also dwell in the overall performance of order picking systems integrating
storage assignment, order batching and picker routing to find the optimal policy combinations under
different order types.
For time window batching, the orders that arrive during the same time window (fixed or variable
length) are gathered as a batch. These orders are then processed simultaneously in the following
stages. If order splitting is not permitted (thus each order picker picks a group of complete orders in
one picking tour), the items are sorted by order during the picking process. This picking strategy is
often referred as the sort-while-pick. If order splitting is conceivable, an additional effort is needed to
sort the items after picking, resulting in a pick-and-sort strategy (De Koster et al., 2007).
A literature review on time window batching is presented in Table 2.5.
Table 2.5 – Review on time window batching.
Variable time window order batching (i.e. number of items per batch is ‘fixed’) with stochastic order arrivals for manual picking systems
Tang and Chew (1997) Problem is modelled as a batch service. For each possible picking batch size, they first estimate the first and second moments of the service time. Then using these moments, they can find the time in system of a random order. The optimal picking batch size is then determined in a straightforward manner. Results from the simulation experiments show this approach provides a high accuracy level. Furthermore, it is simple and can be easily applied in practice.
Chew and Tang (1999) Le-Duc and De Koster (2003)
Le-Duc and De Koster (2007)
All publications mentioned in Table 2.5 do not take into account the order due time and the penalty of
violating the due time. While constituting an appropriate simplification on an academic study, this
approach can be improper to apply in some real life practices. Violating the due time on picking
processes lowers the level of service and can lead to impairment in the performance of the entire
supply chain. So, literature on time window batching with consideration to the order due time is offered
in Table 2.6.

!
!32
Table 2.6 – Review on time window batching, taking into consideration the order due time.
Taking into account the order due time Elsayed et al. (1993) Consider the order-batching problem in a man-aboard system
with minimising of the penalties and tardiness as respective objectives. They propose a heuristic that first establishes batches and then determines the release times for the batches.
Elsayed and Lee (1996)
Won and Olafsson (2005) Focus on customer response times by jointly considering the batching and picking operation.
2.3.3.4. ROUTING METHODS
The objective of routing policies is to sequence the items on the pick list so that a good route through
the warehouse is ensured. So, by definition, the problem of routing order pickers in a warehouse is
actually similar to the prominent Travelling Salesman Problem.
The travelling salesman problem is explained by the following. A salesman starts in his home city and
has to visit a number of cities (once) before returning home. He knows the distance between each pair
of cities and wants to determine the order to follow in his journey, so that the total travelled distance is
minimised. Evidently, the situation of an order picker in a warehouse is similar to that of the travelling
salesman. The order picker starts at the depot (home city), where he receives a pick list, has to visit all
pick locations (cities) and finally has to return to the depot (De Koster et al., 2007). An example layout
of a warehouse with pick and a corresponding graph representation is given in Figure 2.17.
Depot
Figure 2.17 – Illustration of an order picking situation (above) and its graph representation (below) (based on Koster et al., 2007).

!
! 33
Naturally, some differences exist between the classical Travelling Salesman Problem and the reality of
order picking in warehouses. First of all, if we look at the graph in Figure 2.17, a number of nodes
have no need to be visited (indicated with white circles). These nodes represent the cross points
between aisles and cross aisles. The order picker is allowed to visit them, but it is not required. The
black circles represent the pick locations and the depot, which must be visited. It is also allowed to
visit the pick locations and depot more than once. So, the problem of order picking classifies as a
Steiner Travelling Salesman Problem (some of the nodes do not have to be visited and that the other
nodes can be visited more than once) (De Koster et al., 2007).
The difficulty with the (Steiner) Travelling Salesman Problem is that it is in general not solvable in
polynomial time (De Koster et al., 2007). However, there is literature on the subject, under specific
circumstances, as presented in Table 2.7.
Table 2.7 – Solving the (Steiner) Travelling Salesman Problem.
Solving the (Steiner) Travelling Salesman Problem
Ratliff and Rosenthal (1983) Solve, using an algorithm, the traveling salesman problem in a rectangular warehouse.
Makris and Giakoumakis (2003) A modification of the k-interchange heuristic is applied to tour construction, for warehouses with parallel aisles of equal length or with rectangular racks.
Cornuejols et al. (1985) Show that the algorithm of Ratliff and Rosenthal (1983) can be extended to solve the Steiner Traveling Salesman Problem in all, so-called, series-parallel graphs.
Theys et al. (2010) Using a TSP heuristic (Lin-Kernighan-Helsgaun) for routing order pickers in warehouses.
De Koster and Van der Poort (1998)
Algorithm that can determine shortest order picking routes in a warehouse of one block with decentralised depositing (order picker can deposit picked items at the head of every aisle).
Roodbergen and De Koster (2001a) Routing methods for warehouses with multiple cross aisles.
Roodbergen and De Koster (2001b) Routing order-pickers in a warehouse with a middle aisle.
In practice, the problematic of routing order pickers in a warehouse is mostly resolved using heuristics.
This is caused by some disadvantages of optimal routing in practice. In the first place, it is important to
note that an optimal algorithm is not available for every layout. Secondly, optimal routes may appear
illogical to the pickers, resulting in departures from the specified routes. Thirdly, a standard optimal
algorithm cannot account aisle congestion, while with heuristic methods this problematic can be at
least reduced (De Koster et al., 2007).
Hall (1993), Petersen (1997) and Roodbergen (2001) distinguish several heuristic methods for routing
order pickers in single-block warehouses, with examples of a number of routing methods for a single-
block warehouse is presented in Table 2.8.

!
!34
Table 2.8 – Routing Methods for a single-block warehouse.
S-shape (or traversal) heuristic
Description
Routing order pickers by using the S-shape method means that any aisle containing at least one pick is traversed entirely (except potentially the last visited aisle). Aisles without picks are not entered. From the last visited aisle, the order picker returns to the depot. For single-block random storage warehouses S-shape provides routes which, on average, are between 7% and 33% longer than the optimum solutions (see De Koster and Van der Poort (1998) and De Koster et al. (1998)).
Advantages One of the simplest heuristics for routing order pickers. Drawbacks Outperformed by more complex heuristics.
Return method
Description An order picker enters and leaves each aisle from the same end. Only aisles with picks are visited.
Advantages Another simple heuristic for routing order pickers. Drawbacks Outperformed by more complex heuristics.
Midpoint method
Description
The midpoint method essentially divides the warehouse into two areas. Picks in the front half are accessed from the front cross aisle and picks in the back half are accessed from the back cross aisle. The order picker traverses to the back half by either the last or the first aisle to be visited.
Advantages According to Hall (1993), this method performs better than the S-shape method when the number of picks per aisle is small (i.e. one pick per aisle on average).
Drawbacks More intricate practical implementation that S-shape or return heuristics. Largest gap method
Description
The largest gap strategy is similar to the midpoint strategy except that an order picker enters an aisle as far as the largest gap within an aisle, instead of the midpoint. The gap represents the separation between any two adjacent picks, between the first pick and the front aisle, or between the last pick and the back aisle. If the largest gap is between two adjacent picks, the order picker performs a return route from both ends of the aisle. Otherwise, a return route from either the front or back aisle is used. The largest gap within an aisle is therefore the portion of the aisle that the order picker does not traverse. The back aisle can only be accessed through either the first or last aisle.
Advantages The largest gap method always outperforms the midpoint method and the S-shape when the pick density is less than about 4 picks per aisles (see Hall, 1993).
Drawbacks However, from an implementation point of view, the midpoint method is simpler.
Combined (or composite) heuristic
Description Aisles with picks are either entirely traversed or entered and left at the same end. However, for each visited aisle, the choice is made by using dynamic programming (see Roodbergen and De Koster, 2001a).
Advantages
Outperforms the other heuristics in many instances Roodbergen and De Koster (2001a) compared six routing methods (optimal, largest gap, S-shape, aisle-by- aisle, combined and combined+), in 80 warehouse instances and reported that the combined+ heuristic gives the best results in 74 of the 80 instances they analysed.
Drawbacks Being dynamic, doesn’t allow the human order picker to familiarize with the routing heuristics.
Petersen (1997) carried out a number of numerical experiments to compare six routing methods: the
S-shape, return, largest gap, mid-point, composite and optimal in a situation with random storage. He
concludes that a best heuristic solution is on average 5% over the optimal solution.

!
! 35
All above-mentioned methods were initially developed for single-block warehouses; however, they can
be applied in multiple-block warehouses with some adjustments (De Koster et al., 2007). Please note
that in real life implementation, some routing problems may arise with assumptions taken in the
articles discussed so far. Table 2.9 offers examples of routing issues.
Table 2.9 – Other routing issues.
Other routing issues
Goetschalckx and Ratliff (1988a)
Polynomial-time optimal algorithm that solves the problem of routing order pickers in wide aisles (where the picker cannot retrieve products from both sides of the aisle without changing position).
Daniels et al. (1998)
Tackles, using heuristics, the routing problem that may arise if products are stored at multiple locations in a warehouse. In this case a choice has to be made from which location the products have to be retrieved.
Goetschalckx and Ratliff (1988b)
Analysis and solves optimally the problem of allowing the order picker to do multiple picks per stop. There is a trade-off between the time to stop and start the vehicle and the increased walking distance if fewer vehicle stops are made.
Since travel time is the primary objective regarding order picking systems optimization, travel time
estimation is an important part of the research on routing. Hall (1993) presents a distance
approximation for routing manual pickers in one-block warehouses. However, Hall (1993) assumes
that pick locations are distributed randomly over the order picking area according to a uniform
distribution, which is not always a correct assumption. Table 2.10 comprehends a collective of articles
referring to travel time estimation under different storage assignment rules.
Table 2.10 – Travel time estimation under different storage assignment rules.
Travel time estimation under different storage assignment rules
Jarvis and McDowell (1991) Travel time estimates are determined and used to determine which products (fast moving, slow moving) should be located in which aisles.
Le-Duc and De Koster (2004) Travel time estimates in picker-to-parts narrow-storage-aisle ABC-storage strategy warehouses, using the return heuristic as routing policy.
Chew and Tang (1999) Travel time analysis for a general product-to-location assignment. They use the travel time estimates to evaluate batching strategies. Tang and Chew (1997)
Caron et al. (1998) Expected travel distances for two routing methods in a warehouse consisting of two blocks (items are distributed according to the cube- per-order index).
Hwang et al. (2004) Analytical expressions for three routing methods (return, S-shape, midpoint) under various COI-based storage rules.

!
!36
2.3.3.5. ORDER ACCUMULATION AND SORTING
When batching and/or zoning is applied, usually some additional effort is needed to split the batch and
to congregate the items per customer order or per destinations to which orders will be shipped. These
processes are frequently called accumulation/sorting (A/S) (De Koster et al., 2007). Figure 2.18 shows
an example of a typical A/S system.
Storage/picking area
Sorter
Circulation conveyor
Shipping lanes
Transportation conveyor
Figure 2.18 – A typical accumulation/sorting (A/S) system (based on Koster et al., 2007).
The performance of an A/S system depends not only on the equipment capacity (i.e. sorter capacity
and conveyor speed) but also on operating policies like shipping lane assignment (see Figure 2.18).
The order-to-lane delegation problem is crucial for most A/S systems as usually the number of
shipping lanes is less than the number of orders, which may instigate a blocking of orders at the
entrance of the lanes, bottlenecking the entire operation (De Koster et al., 2007). Table 2.11 reviews
literature on order accumulation and sorting.

!
! 37
Table 2.11 – General literature on order accumulation and sorting.
General literature on order accumulation and sorting
Bozer and Sharp (1985) Advantages of using a recirculation loop to avoid lane blocking in an A/S system when a shipping lane is full, assuming that each lane is assigned to one order.
Bozer et al. (1988) Recommend that assigning orders to shipping lanes just before the orders arrive at the circulation desk of the sorter is better than any static fixed-assignment rule, in A/S systems where multiple orders can be assigned to one lane.
Johnson (1998)
Johnson and Lofgren (1994) Describe an A/S system used at Hewlett-Packard.
Meller (1997) Proposes an integer formulation for the order-to-lane assignment problem in an A/S system.
Russell and Meller (2003) Present a model to aid in the decision whether or not to automate the sorting process.
Le-Duc and De Koster (2005b) Present an integer-programming model to minimise the total picking and order accumulation time.
2.3.3.6. STORAGE ASSIGNMENT
Products need to be distributed into storage locations before they can be picked to complete customer
orders. To assign products to storage locations a set of rules designated storage assignment method
can be applied. However, before such an assignment can be made, it must be decided which pick
activities will take place in which storage system (De Koster et al., 2007).
2.3.3.6.1. FORWARD-RESERVE ALLOCATION
In order to quicken the pick process, it is frequently effective to separate the bulk stock (reserve area)
from the pick stock (forward area). The size of the forward area must be limited, since the smaller the
area, the lower the average travel times of the order pickers will be (De Koster et al., 2007).
It is imperative to decide how much of each SKU is assigned in the forward area and where in the
area it has to be located. Dividing a SKU’s inventory over multiple areas requests regular internal
replenishments from the reserve to the forward area. This will create a need for additional
replenishment efforts, fact that has to be balanced with the picking savings. For instance, if demand
quantities are high or if demand frequencies are low, it may be wise to store some of the SKUs
exclusively in the reserve area. Moreover, there are additional constraints as replenishments are often
restricted to times at which there is no order picking activity (De Koster et al., 2007).
The decisions concerning the problems described here are commonly called the forward-reserve
problem. Literature on this problem includes Frazelle et al. (1994) Hackman and Platzman (1990), and
Van den Berg et al. (1998).

!
!38
One concept that explores the strengths of the forward-reserve problematic is dynamic storage. In
dynamic storage the pick area is reduced, reducing travel time, and the SKUs are brought to the
storage locations dynamically just in time for the pick (by an automated crane for example). The
dynamic nature of this concept, allows for a number of locations available in the forward area smaller
than the total number of SKUs (De Koster et al., 2007).
2.3.3.6.2. STORAGE ASSIGNMENT POLICIES
There are numerous ways to assign products to storage locations within the forward and reserve
storage areas. The five more frequently used sorts of storage assignment are (see De Koster et al.,
2007): random storage, closest open location storage, dedicated storage, full turnover storage and
class based storage.
In random storage every incoming pallet (or of similar product unit) is assigned a location in the
warehouse that is randomly selected from all eligible empty locations with equal probability. This
storage assignment policy achieves high space utilisation (or low space requirement), by trading off
with increased travel distance. A computer-controlled environment is required to apply the random
storage policy (De Koster et al., 2007).
If the order pickers themselves make the choice for the location of storage, a system of closest open
location storage will likely arise. In this system, the first empty location that is encountered will be used
to store the products. This leads to the existence of full racks around the depot and gradually emptier
racks towards the back of the warehouse (De Koster et al., 2007). Hausman et al. (1976) reason that
closest open location storage and random storage have a similar performance, if products are moved
by full pallets only.
Another possibility is to store each product at a fixed location, which is called dedicated storage. This
creates the disadvantage of a location being reserved even for products that are out of stock.
Likewise, for every product there has to be a reservation of sufficient space to ensure the storage of
the maximum inventory level. Consequently the space utilisation is lowest among all storage policies.
An upside for this policy is the familiarity order pickers gain with product locations. Using this
advantage, dedicated storage can be applied in pick areas, with the bulk area for restock using, for
example, random storage. In this case, the advantages of dedicated storage are maintained, but the
disadvantages are reduced because only a small area applies dedicated storage (De Koster et al.,
2007).
A fourth storage policy is full-turnover storage. This policy allocates products over the storage area
according to their turnover. The products with the highest sales rates are located at the easiest
accessible locations, usually near the depot. On the other hand, slow moving products are positioned
somewhere towards the back of the warehouse (De Koster et al., 2007).

!
! 39
An early policy to access the product turnover is the cube-per-order index (COI) rule. Citing De Koster
et al., (2007): “The COI of an item is defined as the ratio of the item’s total required space to the
number of trips required to satisfy its demand per period”. Simply, COI is the ratio between of the
item’s storage space requirement (cube) and its popularity. Logically, the items with the lowest COI
are stored in the most desirable locations (closest to the depot). Heskett (1963, 1964), Kallina and
Lynn (1976), Malmborg and Bhaskaran (1987, 1989, 1990) and Malmborg (1995, 1996) report on the
subject.
The main disadvantage of the practical implementation of full-turnover policies is that demand rates
vary repeatedly and the product sorting changes frequently. And with each change a new ordering of
products in the warehouse is necessary, causing a large amount of reallocation of the stock. Hence,
the loss of flexibility and consequent loss of efficiency might be considerable when using full-turnover
storage. The adoption of COI-based storage assignment, or other assignments based on demand
frequency generally require a more “information intensive” methodology than random storage, since
order and storage data must be processed in order to rank and assign locations to products. In some
cases this information may not be available, for example, because the product assortment changes
too fast to create trustful statistics (De Koster et al., 2007).
The final storage policy, class-based storage, combines some of the methods mentioned so far. In
inventory control, Pareto’s method is a commonly used way for distributing items into classes based
on their demand. It is based on the well know conclusion of the Italian sociologist and economist
Vilfredo Pareto that 80% of the wealth in Italy was held by 20% of the population (Waters, 2003).
Similarly, products can be grouped into classes so that to the fastest moving class contributes to about
80% of the turnover, even though it will only contain about 20% of the products stored.
Each class is assigned to a designated area of the warehouse with storage within an area being
random. Classes are determined by some measure of demand frequency of the products, such as
COI or pick volume. Fast moving items are generally called A-items, while the following fastest moving
category of products is referred as B-items, and so on. Usually the number of classes is restricted to
three, although in some situations more classes can convey additional reductions in travel times (De
Koster et al., 2007).
Based on simulation experimental results, Petersen et al. (2004) show that with regards to the travel
distance in a manual order-picking system, full-turnover storage outperforms class-based storage.
This conclusion is logical, if it is taken into consideration that by definition full-turnover storage is a
class-based storage where every SKU is his own class. The gap between the two depends on the
class partition strategy (i.e. number of classes, percentage of the total volume per class) and the
routing method used. However, they suggest using the class-based method with 2 to 4 classes in
practice as it is easier to apply than the volume-based method; it does not require a complete list of
the items classified by volume and it requires less time to manage than the other dedicated methods
do. As for AS/RS, Yang (1988) and Van den Berg and Gademann (2000) found that a 6-class division
is recommended.

!
!40
The advantage of this way of storing is that fast-moving products can be stored close to the depot,
while still maintaining the flexibility and low storage space requirements of random storage within the
classes (De Koster et al., 2007). It should be taken into consideration however that, as Graves et al.
(1977) point out, in order to allow an inbound load to be stored in the correct class region empty slots
must be available, thus increasing space requirements with the number of classes. Hence, class-
based storage requires more rack space than random storage.
Various possibilities exist for positioning the A-, B- and C-areas in low-level picker-to-part systems.
Table 2.12 reviews some articles on this subject.
Table 2.12 – Positioning of classes in low-level picker-to-part systems.
Positioning of classes in low-level picker-to-part systems
Jarvis and McDowell (1991) Suggest that each aisle should contain only one class, resulting in the within-aisle storage.
Muppani and Adil (2008a) Develop of a branch and bound algorithm for class based storage location assignment.
Petersen (1999, 2002) Comparison of multiple configurations, among which across-aisles storage.
Petersen and Schmenner (1999) Petersen and Aase (2004) Petersen et al. (2004)
Muppani and Adil (2008b)
Efficient formation of storage classes for warehouse storage location. A simulated annealing algorithm (SAA) is developed for class formation and storage assignment, taking in consideration all possible product combinations, storage-space cost and order-picking cost.
Roodbergen (2005) Compares various storage assignment policies for warehouse layouts with multiple cross aisles.
Chan and Chan (2011) Improving the productivity of order picking of a manual-pick and multi-level rack distribution warehouse through the implementation of class-based storage.
Le-Duc and De Koster (2005c) Optimization of storage-class positioning based on average travel distance estimate for the return routing policy. They claim that the across-aisle storage method is close to optimal.
Le-Duc (2005) Extends Le-Duc and De Koster (2005c) results for other routing policies.
Figure 2.19 depicts the within aisle and across-aisles storage configurations mentioned in Table 2.12.
C CC C B B A A B B C CC C
C
B
C
B
C
B
C
B
C
B
C
B
C
B
C
B
C
B
C
B
C
B
C
B
C
B
C
B
A A A A A A A A A A A A A A
depotdepot depotdepot
within-aisle storage across-aisle storage
Figure 2.19 – Illustration of two common ways to implement class-based storage (based on Koster et al., 2007).
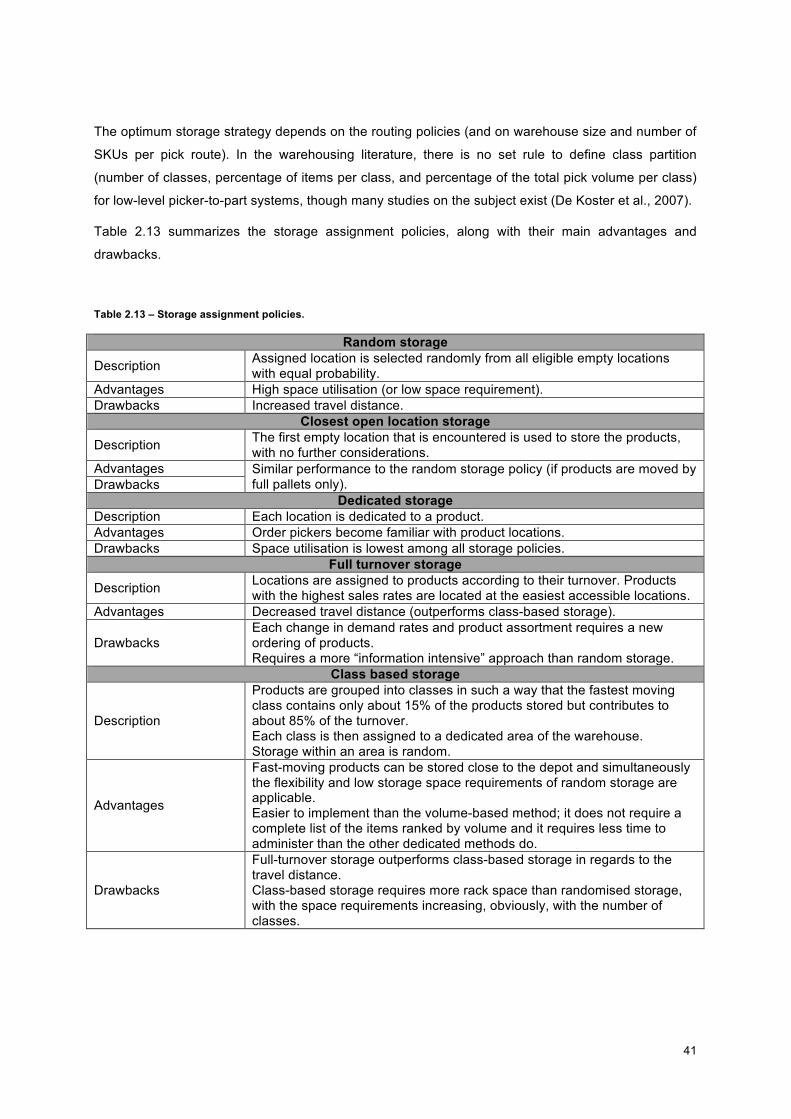
!
! 41
The optimum storage strategy depends on the routing policies (and on warehouse size and number of
SKUs per pick route). In the warehousing literature, there is no set rule to define class partition
(number of classes, percentage of items per class, and percentage of the total pick volume per class)
for low-level picker-to-part systems, though many studies on the subject exist (De Koster et al., 2007).
Table 2.13 summarizes the storage assignment policies, along with their main advantages and
drawbacks.
Table 2.13 – Storage assignment policies.
Random storage
Description Assigned location is selected randomly from all eligible empty locations with equal probability.
Advantages High space utilisation (or low space requirement). Drawbacks Increased travel distance.
Closest open location storage
Description The first empty location that is encountered is used to store the products, with no further considerations.
Advantages Similar performance to the random storage policy (if products are moved by full pallets only). Drawbacks
Dedicated storage Description Each location is dedicated to a product. Advantages Order pickers become familiar with product locations. Drawbacks Space utilisation is lowest among all storage policies.
Full turnover storage
Description Locations are assigned to products according to their turnover. Products with the highest sales rates are located at the easiest accessible locations.
Advantages Decreased travel distance (outperforms class-based storage).
Drawbacks Each change in demand rates and product assortment requires a new ordering of products. Requires a more “information intensive” approach than random storage.
Class based storage
Description
Products are grouped into classes in such a way that the fastest moving class contains only about 15% of the products stored but contributes to about 85% of the turnover. Each class is then assigned to a dedicated area of the warehouse. Storage within an area is random.
Advantages
Fast-moving products can be stored close to the depot and simultaneously the flexibility and low storage space requirements of random storage are applicable. Easier to implement than the volume-based method; it does not require a complete list of the items ranked by volume and it requires less time to administer than the other dedicated methods do.
Drawbacks
Full-turnover storage outperforms class-based storage in regards to the travel distance. Class-based storage requires more rack space than randomised storage, with the space requirements increasing, obviously, with the number of classes.

!
!42
2.3.3.6.3. FAMILY GROUPING
All storage assignment policies referred so far have not considered possible relations between
products. For example, customers may tend to order a certain product along with another product. In
this case, it may be advantageous to store these two products near to each other. This is referred to
as family grouping, where similar products are located in the same region of the storage area. To
employ family grouping the statistical relationship between items should be known or at least be
predictable (De Koster et al., 2007).
Evidently, grouping of products can be associated with some of the previously mentioned storage
policies. For example, it is possible to use class-based storage and simultaneously group related
items within classes (De Koster et al., 2007).
In the literature, two types of family grouping are mentioned: the complementary-based method and
the contact-based method. For more details on the methods please refer to (De Koster et al., 2007).

!
! 43
3. THE CASE STUDY
In this chapter the author aims to present the case study. To that end a small review on the history of
the Carregado 2 Logistic Operations Centre is presented, followed by a complete analysis. This
analysis covers its facilities and implemented processes. The author analyzed all the implemented
processes, which was crucial to verifying that the order picking was indeed the prime candidate for
optimization. A more comprehensive and detailed analysis of the case study is present in Appendix I.
3.1. THE CARREGADO 2 LOGISTIC OPERATIONS CENTRE
The Luís Simões Group (LS) was established in Portugal in the 1940s. In 2001, Luis Simões defined a
development strategy focusing in logistics and the Iberian Peninsula. To fulfil that strategy, Luís
Simões operates twenty logistics operations centres located all across the Iberian Peninsula, essential
to the group logistics operations, (Grupo Luís Simões, 2010). One of those logistic operations centres
is the modern Carregado 2.
The Carregado 2 logistics operation centre (COL C2) project was the response to the necessity of LS,
as a market leader, to search for solutions that increase the competitive edge and further differentiate
the company from other competitors, thus pushing forward the market and reinforcing the importance
of third-party logistics providers in the supply chain (Fernandes, 2010).
The initial goal for this project was to implement a multi-client and multi-product warehouse in which
the operations where the human resources don’t add value would be automated. It was also needed
to maintain the flexibility of a conventional warehouse and integrate the automatic operations with the
remaining manual operations (Fernandes, 2010).
3.2. FACILITIES
The Carregado 2 Logistics operation centre features some state-of-the-art facilities and equipment.
The facilities can be divided in two brands: the storage area and the peripherals that function as the
interface between the storage area and the exterior. The technical information presented in this
section is retrieved from observation, interviews and the work of António Fernades (2010).

!
!44
3.2.1. STORAGE AREA
The storage area occupies the majority of the warehouse and basically includes the shelf and the
automated cranes responsible for moving the pallets.
The shelf was designed for the proposed automated crane and has a capacity for 55432 stored pallets
in sixteen double depth corridors and 3700 picking as well as inventory positions, on the ground floor.
Stored pallets are divided into four types, according to their height. The storage spaces are zoned to
different clients or types of products, with the dimension of each assigned zone being adjusted
dynamically to the current needs.
The storage area also comprises sixteen automated cranes, dubbed CPAs (from the Portuguese
Carro ponte de armazenagem automática) and equipped with double depth forks. This solution based
on an overhead crane is used because it was necessary to have the ground floor free for picking
purposes.
The CPAs can perform three types of movements: expedition movements, transfer movements and
push away movements. Expedition movements move pallets from storage to the cargo preparation
lines. Transfer movements move pallets from storage to picking or inventory positions. Push away
movements move away pallets that are in front of pallets that are required to move.
3.2.2. PERIPHERALS
The peripherals include equipment that function as the interface between the storage area and the
exterior. This equipment is used for the entry and exit of products to the storage area. They consist in
entrance stations for reception, chariots, entrance and exit interface transporters, produced pallets
entrance stations, rejection stations for unfit produced pallets, and cargo preparation lines.
The warehouse features four entrance stations (Figure 3.20) for pallets, each one including two
entrance points that merge into one entrance line and one rejection line. Likewise there are four
chariots (Figure 3.21), with capacity for two pallets each.
These chariots share the same rail and so they have the ability to transfer pallets to the next chariot if
needed to fulfil the transport across the entire warehouse, using expedition lines as buffer for the
pallets.

!
! 45
Figure 3.20 – Entrance station (Source: António Fernandes, 2010).
Figure 3.21 – Chariot (Source: António Fernandes, 2010).
The warehouse also includes sixteen entrance interface transporters and sixteen exit interface
transporters. These interfaces function as a buffer between the chariots and the CPAs and are located
at each side of the CPA. Figure 3.22 shows a CPA picking a pallet from his entrance interface
transporter and Figure 3.23 displays a CPA delivering a pallet to his exit interface transporter.
Figure 3.22 – CPA picking a pallet from his entrance interface transporter.
Figure 3.23 – CPA delivering a pallet to his exit interface transporter.
Four produced pallets entrance stations (Figure 3.24) are available as well. Produced pallets have a
maximum height of 1800mm, which is controlled by a gauge.

!
!46
Figure 3.24 – Produced pallets entrance station.
Figure 3.25 – Rejection station (note the synoptic screen).
Four rejection stations for unfit produced pallets also exist in the warehouse. They include a synoptic
screen with indication of the rejection motive (Figure 3.25).
Finally, to prepare cargo for expedition there are forty-one cargo preparation lines with capacity for
twenty-two pallets in each one.
3.2.3. COMMENTS
From a reception and dispatch point of view the C2 can be divided in four zones. Each zone features
five loading docks, an entrance station for reception and is served by four CPAs. Zone number one
has eleven cargo preparation lines, zone two has ten cargo preparation lines and finally zone three
and four have both nine cargo preparation lines. From a picking point of view each zone has one
produced pallets entrance station and the complementary rejection station for unfit pallets.
Since there are no barcode readers either in the conveyors, CPAs, chariots or storage places the
barcodes are read only by the workers with their portable scanners, during reception, dispatch or
picking. So in this warehouse a physical dimension and a logical dimension coexist. The physical
dimension retrieves information from photoelectric sensors that detect objects in the transporters,
without identifying them. The logical dimension tracks the expected movement of the pallets within the
warehouse.

!
! 47
3.3. PROCESSES
In Carregado 2 it is possible to identify six separated processes (Figure 3.26).
Figure 3.26 – Flowchart of the Carregado 2 processes.

!
!48
The author presents a complete flowchart of Carregado 2 processes in Appendix II. Note that the full
lines represent the transfer of goods and the non-continuous line represents the transfer of
information.
Some of these processes are standard for any warehouses like reception and dispatch. The automatic
handling, which serves as a bridge between reception and dispatch, is a specific process of an
automated warehouse like Carregado 2, distinguishing it from standard warehouses.
Processes like co-packing and picking allowing for value-added services to the clients. Finally the
warehouse also includes the reverse logistics process. Besides this six processes there is also a
support process, the inventory. This is a process essential for the control of any warehouse and
permits contact with the stored products. All this processes are explained in detail in the subsequent
sections.
3.3.1. RECEPTION
The reception process (Figure 3.27) is responsible for the acceptance and processing of the incoming
wares and information. The C2 COL receives forty to fifty trucks each day.
Truck&Arrival
Pallet&or&bulk? Unload&pallets&to&entrance&stationPallet
Build&pallets
Bulk
DockingProducts&in&perfect&
condition?
No
Yes
Fix&pallet
Truck&and&goods&arrival&information
Dock&selection&and&allocation
Unwanted
Figure 3.27 – Flowchart of the reception process.

!
! 49
The reception process begins with the influx of information on the incoming truck and goods carried.
The majority of the cargo received is already in pallets. These pallets are moved, from the cargo bed
to the allocated entrance station.
If the pallet is not in accordance (see section 3.3.4 for details) it is moved to a rejection line. The
teams responsible for the reception process keep a close eye on the rejection lines and fix the
rejected pallets so that they could be inserted back in an entrance point.
3.3.2. PICKING
The picking is a very important process in C2. Being an important service to the LS clients, the C2 was
specifically designed to support picking. This was a challenge since labour intensive processes, like
the picking-to-parts system in place, do not easily conjugate with automated facilities. The outcome
was a picking area that consists in corridors in the ground floor, below the storage shelves, and is
served by the CPAs that operate between the corridors.
Picking
Automatic)Handling
Allocation)of)the)order)to)a)picker
Mixed)products)order)received
Picker)consults)order)instructions)in)his)portable)scanner
Are)the)picking)positions)
stocked)to)fulfill)the)order?
Retreive)pallets)from)storage
No
Protects)the)produced)pallet)
with)film)and)labels)it
Move)to)produced)pallets)entrance)
station
Deliver)to)picking)positionsDo)nothing
Yes
Items)to)pick?
No
Avaliable)product)to)pick?Yes
Picker)moves)to)picking)position
Yes
Withdraws)the)necessary)units)of)
product
Other)products)to)pick?No
Yes
Other)orders)allocated?No
Wait
Yes
Figure 3.28 – Flowchart of the picking event.

!
!50
The picking event (Figure 3.28) is triggered by the influx of orders containing pallets with mixed
products. This pallets need to be produced by a picker. Once the picking pallets are produced they are
stored in the warehouse, in a buffer zone. Their dispatch is then processed normally, as if they were
any other storage pallets.
The picking process begins with the reception of orders. A manager will launch a cycle of orders and
allocate them gradually to pickers. This allocation is determined by the estimated time of dispatch for
that order instead of the order arrival time. The manager can also take in account the performance of
each picker and the singularities of the order when choosing the picker.
When a cycle of orders is launched the warehouse management system automatically verifies if the
needed products are stocked in the picking positions and if not commands the CPAs to retrieve the
necessary pallets from storage and deliver them to empty picking positions.
Note that the manager also oversees the list of unavailable products in real time and if beneficial he
manually instructs the CPA to lower to some pallets. There are either some picking positions that are
only used by manual commands to respond to strains.
After the allocation the picker receives in his portable scanner the information of which and how much
product to pick and its location. An order can also specify a set of rules for the construction of the
pallets, e.g. the number of maximum references by pallet.
Using a forklift, the picker goes to the indicated picking position, uses the portable scanner to read the
position and the product bar codes and retrieves the necessary units of that product.
For control proposes the picker is required to count the items of product left at each picking position
and insert the data in the scanner. This reassures that the picker retrieves the right quantity of
products at each position. To facilitate this task the management team inputs in the WMS the logistic
data for each product reference, allowing for example for the picker to count rows instead of individual
products. When the picker miscounts the units of product left three times and locks the portable
scanner the manager is required to intervene.
Next the picker goes to the following picking position and repeats the same steps. This is repeated
until the order is completed.
If a product is not available for picking in any of the picking positions the picker skips this particular
product and proceeds with the rest of the order as usual. When the automated mechanism finishes
moving a pallet of the depleted product from storage to a picking position the information of the picking
location where the product is now available will be shown in the picker’s portable scanner.
Note that if one or more products are not available and the rest of the order is already complete the
picker will put down the incomplete produced pallet, label it for control proposes, and start a new
order. He will then complete the standby order when the missing product or products are restocked.
When a produced pallet is complete it is protected with film. Finally it is moved to a produced pallets
entrance station and labelled. Alternatively, and if possible, the picker can request the automatic

!
! 51
filming machine to film the pallet after being deposited in the conveyor. This process is repeated until
all products are picked in accordance with the order.
If the produced pallet is reject, as described in section 3.3.4, it will be moved by chariot to the
corresponding rejection line. The picker will then be warned about it in is portable scanner and will
retrieve the pallet from the rejection line and fix it when possible.
Due to security reasons the pallets on picking positions cannot be directly picked by the CPA and
moved back to storage. So it is the picker’s responsibility to retrieve the pallets from the picking
position when they empty them, so that the place is available for another pallet.
To make sure that picking positions are not occupied for long periods of time by a less requested
product a daily review on the picking stock is made and pallets of products which do not have a
demand are moved to a produced pallets entrance station to be stored again. This activity is
performed during periods of the day with low picking workload.
3.3.3. DISPATCH
The dispatch process can be divided in two parts. One referred as ordering and another referred as
loading.
In the ordering part of this process the orders are received, electronically from the clients. This order
could comprise full pallets, i.e. pallets of only one product, or pallets of mixed products. If an order
consists of full pallets the warehouse management system will automatically retrieve the pallets from
storage to cargo preparation lines two hours before the dispatch time. Alternatively an operator can
command the retrieving from storage time and the cargo preparation lines selection. On the other
hand if an order contains pallets of mixed products a picking process is started, as described in
section 3.3.2.
The loading consists in loading the truck and finally leaving the warehouse. To fulfil this task workers
in forklifts move the pallets from the cargo preparation lines to the cargo bed of the docked trailer. To
increase efficiency the dock chosen for the truck is as near as possible of the cargo preparation line.
When the loading is finalized the truck leaves the warehouse dock. The C2 COL dispatches seventy to
seventy-five trucks each day.
3.3.4. AUTOMATIC HANDLING
The automatic handling process (Figure 3.29) consists in the automated movement of pallets to and
from storage. This process is fulfilled by an automated storage and retrieval system (AS/RS) that

!
!52
works with the pallet as unit. No labour is involved in this process, making this a process that is
specific to automated warehouse like C2.
Pallet Pallet&in&accordance? StoreYes
Moved&to&rejection&line
No
Retrieve)pallets)from)storageFull&pallets
Store&in&buffer
Matching&with&orders
Matching&with&orders
Pallet&in&accordance?
Moved&to&rejection&line
Yes
No
Figure 3.29 – Flowchart of the automatic handling process.
After receiving pallets, the automatic handling process starts with the checking of the pallets. If the
pallet is in accordance then it is stored in the warehouse shelves; if not then it is moved to the
rejection line.
Likewise pallets produced in the internal picking process are also verified before being stored by the
automated mechanism in a buffer zone of the warehouse, while they wait for dispatch. In case of
rejection the pallet is moved, by chariot, to the rejection station for unfit produced pallets
corresponding to the produced pallets entrance station used.
The automatic handling process includes also the retrieving of pallets from storage, to fulfil incoming
orders. The store and retrieve events are further explained in Figure 3.30 and Figure 3.31
respectively.

!
! 53
Store
Pallet&at&the&end&of&an&entrance&station
CPA&picks&the&pallet
Chariot&picks&the&pallet
CPA&moves&pallet&to&its&storage&location Pallet&stored
Entrance&interface&in&the&reach&of&this&chariot?
Chariot&moves&the&pallet&to&the&
selected&entrance&interface
Yes
Pallet&is&transfered&to&the&following&
chariot
No
Figure 3.30 – Flowchart of the store event.
Retrieve'pallets'from'storage
Pallet&Stored CPA&picks&the&palletCPA&moves&the&pallet&to&its&exit&
interface
Final&position&in&the&reach&of&this&
chariot?
Chariot&moves&pallet&to&the&final&
positionYes
Pallet&is&transfered&to&the&following&
chariot
No
Unload&pallet&to&final&position
Chariot&picks&the&pallet
Figure 3.31 – Flowchart of the retrieve pallets from storage event.
This final position of a retrieved pallet can be either a cargo preparation line, when dispatching an
order, or an entrance interface transporter, when restocking the picking products.
3.3.5. CO-PACKING, REVERSE LOGISTICS AND INVENTORY
The COL C2 also features three other minor processes. In co-packing specific staff bundles individual
products together according to the costumer wishes and labels the new product. This process is
explained in Figure 3.32.

!
!54
Automatic)Handling
Co0packing)orders Individual)products)are)packed)togheter
Pallets)of)bundle)products)are)produced
Move)to)dedicated)co0packing)conveyor
Unload)pallets)to)entrance)station
Retreive)pallets)of)individual)products)
from)storage
Deliver)to)inventory)positions
Move)by)forklift)to)co0packing)area
Figure 3.32 – Flowchart of the co-packing process.
As for reverse logistics, it deals with damage products or denied delivers. When delivered products
are rejected they are brought back to the warehouse and stored back into the storage position or
stored in an area dedicated to unfit products, depending on the reason why the delivery was rejected:
unwanted products or unfit products. Likewise if an unfit product is spotted in the reception process it
is stored in the area for unfit products.
Lastly, like in any other warehouse there is a need to support an inventory processes to inspect the
stored pallets. To this end, pallets are lowered to dedicated inventory positions on the ground floor,
adjacent to the picking positions. Then the workers can inspect the pallets, now on the ground floor,
and do as required. If after inventory the pallets are intended to return to storage they are transported
back to the produced pallets entrance station.

!
! 55
4. METHODOLOGY: DISCRETE EVENT MODELLING
As discussed in the literature review, simulation is an extensively used technique for warehouse
performance evaluation in the academic world as well as in practice. So it was an easy decision to opt,
in the context of this academic work with a real life case study, for a simulation, namely a discrete
event model.
To better explain the methodology used in this work this chapter develops the reasoning, the
architecture and the specifics of the model developed for this dissertation.
4.1. JUSTIFICATION OF METHODOLOGY CHOICES
In an academic work with a real case study attached like this one it is common for the author to
develop theories with its academic research and knowledge. Theories, as put by Reis (2010), “are
meant to explain the mechanisms underlying real world phenomena”. Therefore, to be considered
correct and valid these theories have to be tested.
Testing theories in the real world is, however, not possible in many situations and for multiple reasons.
Especially when these theories aim at the optimization of processes already in place there is a strong
resistance from the stakeholders to hinder or even halt the, sometimes vital, processes in place so
that academic theories can be verified, even when the process in place is inefficient and the theories
promise breakthroughs. In these cases, theories have to be put to the test using alternative methods,
like simulation. Simulations make use of computational resources to replicate real world phenomena in
a virtual environment. The fast breakthroughs in computer science have allowed simulations that can
replicate reality to great detail and are available to the general public via user-friendly modelling
software.
Picking in C2, the object of analysis in this dissertation, is a prime case where real world
experimentation is extremely inconvenient. It would not only hinder the operation, resulting in losses to
LS, as it is also unacceptable to subject the client’s goods to a series of experiments without their
previous approval. So, and after consideration of other options like mathematical formulations, a
decision was made to develop a simulation model. Simulation models have been used in warehouses
and the possibility of testing various scenarios with minimal changes were keen in this decision. This
model will serve as validation to the hypotheses of the dissertation.
So a model was developed. But what is a model? A model is a representation of the real world that
solely encompasses the necessary properties to fulfil a specific purpose, consequently being far
simpler than the real world. As pointed by Reis (2010) there is no formula for determining the
necessary amount of detail, being up to the modeller to guarantee that the model is as simple as it can
be while having always in mind the ultimate purpose of the model and its validity.

!
!56
There is also no method to support model development (Reis, 2010). This process is largely an
iterative process (a try, run, debug, correct and repeat process), with every iteration removing errors or
adding one more detail. Problem articulation (identification of the problem, variables and dynamics) is
the most significant step in model development, being the foundations of a good model (Reis, 2010).
4.1.1. DISCRETE EVENT SIMULATION
Discrete Event Simulation Modelling, therefore DES, was the conceptual approach elected to develop
the model used in this dissertation. This decision was not made without the study of alternatives, like
Agent Base Modelling, but DES presented a better fit for its fundamental simplicity and potential.
For the eyes of an observer, most real-world processes are ever changing. The core of DES is to
divide these processes into discrete parts to simplify analysis. DES techniques approximate
continuous real-world processes with discrete events. DES engrosses three main aspects: events,
entities and resources. In its most simple iteration a DES can consist of a source, which introduces
entities to the model, an operation like a delay (with the respective queue) that simulates a real-world
operation, and a sink that removes the processed entities from the model (Figure 4.33).
source sinkqueue delay
Figure 4.33 – Basic Discrete Event Model.
In DES a system is analysed as a sequence of operations being performed on entities of certain types
such as customers, documents, parts, data packets, vehicles, or phone calls. Entities are by definition
passive, but can have attributes that affect the way they are handled or may change as the entity flows
through the process. This process-centric modelling is a medium-low abstraction level modelling
approach in a way that, although each object is modelled individually as an entity, typically the
modeller ignores details such as exact geometry (AnyLogic, 2014). The disposable of unnecessary
details is a core objective in good programing, as already discussed. Please note that, to enhance
realism, some events may require resources (Figure 4.34).

!
! 57
source sinkqueuedecision
queue
resource
delay
delay
Figure 4.34 – Discrete Event Model with resources.
In its most simple iterations a DES model does not have any correlation with the geography of the
modelled problem. This is acceptable in many domains but some processes require space awareness.
Citing AnyLogic (2014), “Space aware processes are those that take place in a certain physical space
and involve movement of entities and resources”. This approach is called Network Based Modelling
and requires the definition of the network topography. Entities and resources movements will be in
accordance with the defined network, and the corresponding animations augment the grasp of the
model.
Process-centric modelling is used widely in the manufacturing, logistics, and healthcare fields
(AnyLogic, 2014). All of the above validates DES as a choice to model picking in a warehouse.
That being said DES comes with its shortcomings if applied in unfit scenarios. DES techniques are
better used when the system under analysis can naturally be described as a sequence of operations.
Other situations better suit other approaches. In situations where it is easier to describe the behaviour
of each individual entity than trying to put together a global workflow, agent based modelling will excel.
Similarly, system dynamics may be the right choice if you are interested in aggregates and not in
individual unit interaction (AnyLogic, 2014). And, analogously to every modelling approach, either lack
of appropriate data or incomplete understanding of the phenomenon of interest may hinder the
model’s validity (Reis, 2010).
4.1.2. THE CHOICE OF DES FOR THIS RESEARCH WORK
It has been established the need for a simulation in this research and DES has been explained. Now
this subchapter explains the reasoning that established DES as the choice for the modelling needs of
this work. The method of modelling is the instrument that builds our representation of the real world.
And, as it is true almost every activity, using the right tools greatly enhances the changes of success
and alleviates the workload. Each method presents its spin on reality with contiguous strongpoints and
limitations, related to the premises that founded that method.

!
!58
Therefore it is vital to choose the method that thrives in the context of the research project. Reis
(2010) synthesizes three factors for this process. First, the purpose of the research project, which will
determine the variables, behaviours or processes that have to be conveniently highlighted or studied.
Second, the specific properties of the real world phenomenon, as this will determine the possibilities
and limits of the research project. One example of a recurrent constraint is the lack of data, because
either data is scarce or there is an apprehension to allow publication of data by private business. And
last, the fitness of the method of modelling to achieve the desired outcomes (first factor) while keeping
in line with the necessary properties (second factor).
The method of modelling chosen was, as already stated, DES – Discrete Event Simulation. To justify
this choice lets first recall the objective of this work: to assess and restructure the order picking in C2.
To meet this end, there was a need to develop a methodology that would be able to assess the
performance of the order picking in C2, in different scenarios, respectively before and after the
implementation of the new policies. The evaluation of the performance indicator, time, allows to
compare the current situation and the alternative theories, with chances either in storage assignment
polices or routing policies. DES presents itself as a suitable candidate to fulfil this objective since order
picking is easily described as a sequence of discrete processes. Furthermore DES allows an easy
supervision of our performance indicator, time. Lastly, logistics and in warehouses in particular have
been extensively modelled using DES before.
So, in essence, DES presented the best and natural choice to model the picking in C2 because the
real world operation is process-centric. A simple but powerful modelling technic, DES thrives in
process-centric models by nature making the basic modelling simpler, while still keeping flexibility for
further detailing if needed to fulfil the objectives. For this work in particular the DES model was embed
with “space-awareness”, turning into a Network Based Modelling, because the exact geometry of the
warehouse and the geography of its picking positions is paramount to the travel times when picking.
The decision on using DES was not done, however, without the examining of other approaches like
real word testing, optimisation, Agent Based Modelling, System Dynamics. Real world testing was
harmful to the operation of C2 so it was ruled out first, as explained before. Optimization, via
mathematical formulations, was disregarded because there was from the onset a desire to promote
several different scenarios with changes in interdependent aspects (like routing and storage) of the
picking operation. Using an optimization approach would be difficult, since the global optimization
might not be obtained by the independent optimization of every aspect and translating the extensive
real world constrains of every scenario to a mathematical construction would be time-consuming.
Finally Agent Based Modelling and System Dynamics were discarded because, to the author, they
added complexity while not being needed for the model to fulfil its objective.
Nevertheless, the choice of DES does not imply that the use of other approaches is incorrect or that
DES excels in every aspect versus other approaches. This choice only reflects the author conviction
that DES is the correct approach to fulfil the task at hand while taking in consideration his modelling
skills.

!
! 59
4.1.3. DES DEVELOPMENT TOOLKIT
Over the last decades, hardware and software have evolved exponentially in performance as well as
simplicity. This has opened the doors of DES for non-professionals, with a proliferation of powerful
personal computers and user-friendly software.
For this work, and after consideration of other simulation software like SIMUL8, AnyLogic was chosen.
AnyLogic is multimethod simulation software developed by The AnyLogic Company (former XJ
Technologies) first shown at Winter Simulation Conference in year 2000. AnyLogic encompasses
System Dynamics, Discrete Event, Agent Based, and any combination of these approaches within one
model development environment (Figure 4.35). This grants extensive flexibility and enables the
modeller to capture the complexity and heterogeneity of business, economy and social systems at any
desirable level of detail.
Figure 4.35 – AnyLogic approaches (Source: AnyLogic, 2015).
AnyLogic’s graphical interface and library objects allow you to quickly model diverse areas, such as
manufacturing and logistics, accompanied by an attractive visual materialization of the model. The
object-oriented model design paradigm also provides modular, hierarchical, and incremental
construction for large models.
AnyLogic makes use of a graphical modelling language and also allows the user to extend simulation
models with Java code. The modelling process mainly in dragging and dropping library objects and,
then, adapting to particularities by programing in Java specific features onto the objects. In this way,
AnyLogic blends the easiness of a high-level programing (drag and drop) while keeping the possibility
for complete control over the model via Java programming. Therefore AnyLogic is suitable for use by a
wide range of programing skills (AnyLogic, 2015 and Reis, 2010).
The Java nature of AnyLogic lends itself also to the creation of Java applications that can operate as
standalones. This makes AnyLogic models very easy to share and distribute to end-users.
The main reasons behind the author’s choice of AnyLogic were its user friendliness and support for all
three modelling approaches, which allowed early experimentation with the abstraction levels and
modelling approaches and leaves open the possibility for future developments of the model with other
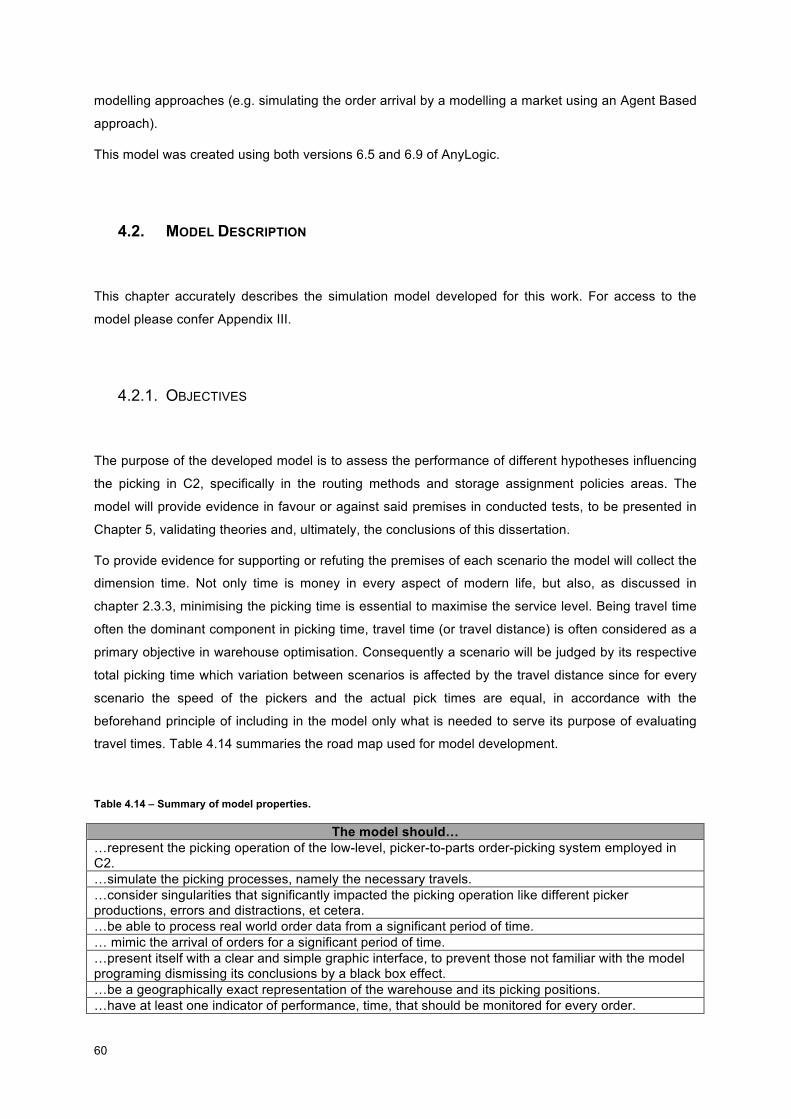
!
!60
modelling approaches (e.g. simulating the order arrival by a modelling a market using an Agent Based
approach).
This model was created using both versions 6.5 and 6.9 of AnyLogic.
4.2. MODEL DESCRIPTION
This chapter accurately describes the simulation model developed for this work. For access to the
model please confer Appendix III.
4.2.1. OBJECTIVES
The purpose of the developed model is to assess the performance of different hypotheses influencing
the picking in C2, specifically in the routing methods and storage assignment policies areas. The
model will provide evidence in favour or against said premises in conducted tests, to be presented in
Chapter 5, validating theories and, ultimately, the conclusions of this dissertation.
To provide evidence for supporting or refuting the premises of each scenario the model will collect the
dimension time. Not only time is money in every aspect of modern life, but also, as discussed in
chapter 2.3.3, minimising the picking time is essential to maximise the service level. Being travel time
often the dominant component in picking time, travel time (or travel distance) is often considered as a
primary objective in warehouse optimisation. Consequently a scenario will be judged by its respective
total picking time which variation between scenarios is affected by the travel distance since for every
scenario the speed of the pickers and the actual pick times are equal, in accordance with the
beforehand principle of including in the model only what is needed to serve its purpose of evaluating
travel times. Table 4.14 summaries the road map used for model development.
Table 4.14 – Summary of model properties.
The model should… …represent the picking operation of the low-level, picker-to-parts order-picking system employed in C2. …simulate the picking processes, namely the necessary travels. …consider singularities that significantly impacted the picking operation like different picker productions, errors and distractions, et cetera. …be able to process real world order data from a significant period of time. … mimic the arrival of orders for a significant period of time. …present itself with a clear and simple graphic interface, to prevent those not familiar with the model programing dismissing its conclusions by a black box effect. …be a geographically exact representation of the warehouse and its picking positions. …have at least one indicator of performance, time, that should be monitored for every order.

!
! 61
4.2.2. MODEL ARCHITECTURE
This chapter describes the architecture of the model developed to explore the theoretical scenarios
developed to optimize picking. The choice for DES and AnyLogic has already be explained so now the
focus is on presenting the structure of the model and detailing both the rational and assumption taken
on each object of the model. Being a DES model it is mainly composed of delays (events), queues
and decisions, along with network specific objects responsible for the space-awareness of the model.
Figure 4.36 represents a conceptual interpretation of picking through the lens of DES. The structure is
perfectly recognisable and of easy interpretation, while allowing to add details, rules and complication
as needed.
source of orders
move to position picking
picker
end of order? sinkYes
NoWarehouse
“Space Awareness”
(Environment Physical Rules &
Geography)
Figure 4.36 – Conceptual structure of picking simulation.
Orders arrive, the picker moves to the picking position, and retrieves the products. This process is
repeated until the order is finished, and is circumscribed to the geographic reality of the warehouse.
The model evolved from this basic framework, receiving further details to better simulate real-world
specifics and handle the number of pickers and orders. In its final iteration, the network based discrete
event model is conceptually represented in Figure 4.37.

!
!62
Source of orders Picker selection and allocation
Arrival schedule
Acceleration Incident?
Downtime
Yes
Deceleration Picking End of order? Pallet Entrance?Yes
B
No
Move to depot
A
Move to depotB
Picker release Sink
Move to position
No
Figure 4.37 – Conceptual representation of the model (delays in bold, movements in italic).
A source object introduces orders, controlled by an arrival schedule mimicking the real arrivals. Next
pickers are selected and allocated to an order and the simulation of their movement begins with a
delay object (acceleration). Continuing, a decision object ponders the occurrence of an incident and
the corresponding downtime. Succeeding, a movement object moves the picker to its picking position,
movement that is controlled by the defined network associated to the model that represents the
warehouse. After moving, a delay object accounts for the deceleration of the picker. The existence of
separate delays representing acceleration and deceleration permits that the pickers are defined in the
network with the cruising speed of their forklifts. Following deceleration, the actual picking takes place
and, if the order list continues, the model becomes iterative, proceeding to the acceleration object. If
every product of the order list is picked a decision object evaluates which produced pallets entrance
station is closer, taking into account the last picking location. After movement to the appropriate pallet
entrance, the picker is released and the order exits the model via a sink object.

!
! 63
4.2.2.1. SCOPE OF THE SIMULATION
As for the scope of this model it was decided, with consultation from LS, that the model would simulate
a full week of orders (week 45, 2014) from one client, which occupies a third of the warehouse (aisle
21 to 30, from 30 aisles) and it is served by up to eleven pickers. Figure 4.38 presents the schematics
of the warehouse drawn by the author, the backbone of the model space-awareness. Appendix IV
grants a better resolution image and an example of the order list is accessible in Appendix V.
Figure 4.38 – C2 schematics, aisle 21 to 30 (produced pallets entrance stations in red).

!
!64
It should be noted that the week of orders is fully representative of several months, since the author
apprehended, supported by feedback from the staff, that orders only diverge strongly in the summer
months and holidays.
4.2.2.2. MODEL STRUCTURE
In its final iteration the model is composed of two main blocks: order entry and exit and picking (Figure
4.39).
Figure 4.39 – Model Structure.
Order entry and exit simulates the arrival of orders and their allocation to a picker as well as the
liberation of the picker and exit of the order after fulfilment. As for the picking block, it consists of
eleven blocks one for each of the pickers that can be allocated to this client. By the author’s
observation in loco, it was decided that of those pickers two would be faster than average
(represented in green) and one would be slower (represented in orange).
The entity in this model is the “Order” and the resource is “Pickers”. The network is the warehouse
schematics.

!
! 65
Time related dimensional properties of the model are:
• Time is measured in seconds;
• Time 0 (zero) corresponds to Monday (3 of November, 2014) 00:00:00;
• The simulation ends on Sunday (9 of November, 2014) 23:59:59.
4.2.2.3. ORDER ENTRY AND EXIT
Order entry replicates the arrival of orders and their allocation to a picker (Figure 4.40). It consists
mainly on a source object and various decision objects.
Figure 4.40 – Order entry.
The source object mimics the arrival of orders on week 45, 2014. To accomplish this purpose, the
author divided the week into time units of six hours and accounted the orders that arrived in each of
them in reality. The results, present in Figure 4.41, are stored in the object arrivalSchedule and control
the source object, granting that the order arrival is exact over this time unit (six hours). Redundantly,
this also guarantees that a reality-matching 765 orders are fulfilled in this week. This division in six-

!
!66
hour periods not only enhances the model correctness with the realistic arrival of orders but also
further keeps the model in line with the real world policy of releasing the orders to the pickers in
waves, to align their conclusion with the already established dispatch of trucks (see section 3.3.2 for
details).
Figure 4.41 – Order arrival schedule.
Object “delayForPickers”, that in DES fashion is coupled with its mandatory queue, allocates every
received order to an available picker. This event takes one second (to replicate the sending of the
picking information to the picker personal scanner) and, using Java programming broadly, also
changes a custom entity property in every order, identification. Identification, with integer values
starting at 0, corresponds to the picker that is going to attend to that order. Since there are 11 pickers
available, orders with identifications from 0 to 10 are also assigned a products list from the order pool,
the first picking position is retrieved and a picker is allocated.
“selectP” corresponds to the first decision in the model. It evaluates the order identification number
and sends all orders with an identification of 11 or more back to the “queueForPicers” to wait a new
allocation.
“timeMeasureStart” object is responsible for start timing every order.
Finally, the four decision objects “select” direct the orders to the allocated picker, according to their
identification. Orders with identification 0 correspond to “Picking 1” up to “Picking 11” for orders with
identification 10.
On the other end of the model, order exit (Figure 4.42) releases the pickers and withdraws the order of
the model after fulfilment.
0
20
40
60
80
100
120
44 49
64
49
20
0
81
47
1 0
81
106
1 0
75
34
0 0
48
63
2 0 0 0
Number of orders

!
! 67
Figure 4.42 – Order exit.
Order exit consists of a series of network objects, responsible for the detachment of order and picker,
release of the picker and exit of the order from the network, and a sink, which marks the exit of orders
from the model.
The “timeMeasureEnd” object is responsible for storing the time spent in model by every order, the
critical performance evaluation statistic of the simulation.
4.2.2.4. MODEL NETWORK
Since our performance measure is the picking time and its major component is travel time it was
paramount to replicate travel distances exactly. To achieve that, after measurements by the author in
loco, a CAD of the warehouse was drawn with exact dimensions (Figure 4.38).
This CAD was the backbone for the model network. In AnyLogic, rectangles were placed in every
picking position, with polylines serving as routes and order rectangles as intermediary points. The
rectangles in picking positions, named pos##### (e.g. pos21035, with 21 being the aisle and 035 the
position), are called in the model according to the orders. Figure 4.43 shows a portion the model
network. Appendix V presents an example of the orders input in the model.
Other network related dimensional properties of the model are:
• Picker and Order speed assumes a value in the model of sixty, assuring that the travel
velocity in the model mimics reality as timed directly by the author;
• Picker resource pool consists of eleven pickers, representing the up to eleven pickers working
in this area of the warehouse;
• There are two produced pallets entrance stations, marked in red (named “depot” and
“depotB”), positioned as in real life. Mirroring reality, orders finishing with products up to aisle
twenty-three are delivered in the left produced pallets entrance station (“depotB”) and orders
finishing with products from aisle twenty-four up to aisle thirty are delivered in the right
produced pallets entrance station (“depot”);
• Rectangle in the centre, name “staffRoom”, is where the pickers wait for orders.

!
!68
Figure 4.43 – Model Network.
4.2.2.5. PICKING
The picking block consists of eleven blocks, one for each of the pickers that can be allocated to this
client. By the author’s observation in loco, it was decided that of those pickers two would be faster
than average and one would be slower. All picking blocks have the same structure, varying only the
proprieties of some events. A generic picking block is presented in Figure 4.44.
The picking block starts with four network objects, responsible for entering the order in the network
(specifically at the “staffRoom”) and then binding together the order with a picker.
Afterwards, six objects represent the actual picking operation: “pickUpSpeed”, “disractionOrNot”,
“distraction”, “moveToPos”, “slowingDown”, “picking”. “moveToPos” is a network object that moves the
picker and the attached order to the designated picking position. The other five objects, one decision
and four delays, typical DES events, are characterized in Table 4.15. Please note that the only
difference between normal and special pickers is in the properties of these objects.

!
! 69
Figure 4.44 – Picking.
Table 4.15 – Characterization of events in picking.
Normal Picker Simulates Name Values
Acceleration pickUpSpeed triangular(1, 2.5, 2)1 Rate of incidents distractionOrNot 0.942 Incident downtime distraction triangular(4, 30, 14) Slowing down slowingDown triangular(0.5, 1.5, 1) Picking picking triangular(5, 34, 11)
Fast Picker Simulates Name Values
Acceleration pickUpSpeed triangular(1, 2.5, 2) Rate of incidents distractionOrNot 0.93 Incident downtime distraction triangular(4, 30, 14) Slowing down slowingDown triangular(0.5, 1.5, 1) Picking picking triangular(5, 34, 9)
Slow Picker Simulates Name Values
Acceleration pickUpSpeed triangular(1, 2.5, 2) Rate of incidents distractionOrNot 0.94 Incident downtime distraction triangular(4, 30, 14) Slowing down slowingDown triangular(0.5, 1.5, 1) Picking picking triangular(5, 34, 13)
!!!!!!!!!!!!!!!!!!!!!!!!!!!!!!!!!!!!!!!!!!!!!!!!!!!!!!!!1 triangular (double min, double max, double mode) – Generates a sample of the Triangular Distribution. 2 Expression used to evaluate the probability that the entity will exit via true (T) port.
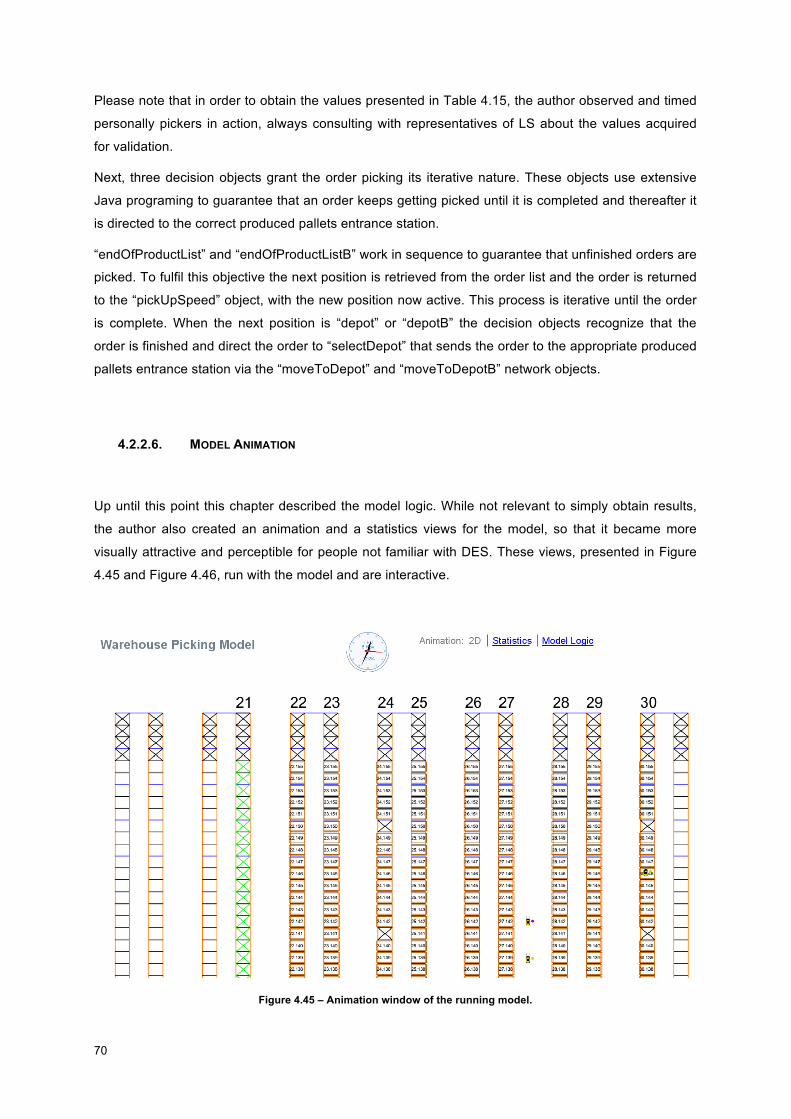
!
!70
Please note that in order to obtain the values presented in Table 4.15, the author observed and timed
personally pickers in action, always consulting with representatives of LS about the values acquired
for validation.
Next, three decision objects grant the order picking its iterative nature. These objects use extensive
Java programing to guarantee that an order keeps getting picked until it is completed and thereafter it
is directed to the correct produced pallets entrance station.
“endOfProductList” and “endOfProductListB” work in sequence to guarantee that unfinished orders are
picked. To fulfil this objective the next position is retrieved from the order list and the order is returned
to the “pickUpSpeed” object, with the new position now active. This process is iterative until the order
is complete. When the next position is “depot” or “depotB” the decision objects recognize that the
order is finished and direct the order to “selectDepot” that sends the order to the appropriate produced
pallets entrance station via the “moveToDepot” and “moveToDepotB” network objects.
4.2.2.6. MODEL ANIMATION
Up until this point this chapter described the model logic. While not relevant to simply obtain results,
the author also created an animation and a statistics views for the model, so that it became more
visually attractive and perceptible for people not familiar with DES. These views, presented in Figure
4.45 and Figure 4.46, run with the model and are interactive.
Figure 4.45 – Animation window of the running model.

!
! 71
Figure 4.46 – Statistics window of the running model.
4.3. VERIFICATION AND VALIDATION OF THE MODEL
If a model is to be accepted and used in general, verification and validation is an essential phase of
the model development process. There is no value whatsoever in the outcomes of an untested model
and, therefore, it has no use. In simple terms, before verification and validation models are toys,
becoming tools after appropriate verification and validation (Reis, 2010). In this chapter the author
expects to explain the how can a model be verified and validated and applied to his model.
It is necessary to take in consideration however that no model could ever be completely verified or
validated; at best, we could get confidence on the model’s outcome. This is because, by definition,
models are a simplified representation of reality and, as so, cannot achieve a perfect depiction of
reality. Hence, verification and validation is always a matter of judgement and credibility building (Reis,
2010).
Although verification and validation are commonly done simultaneously and as words are used as
synonyms daily, they refer to different concepts in modelling. Referring back to Reis (2010) for
definitions: Verification refers to the steps, processes or techniques the modeller deploys to ensure the
model behaves according to every initial specification and assumption. Validation refers to the steps,
processes or techniques the modeller (and any other interested party) deploys to ensure the model
adequately represents and reproduces the behaviours of the real world phenomenon.
Verification concerns with the inner part of the model, making sure if is running well (with no bugs or
other errors), and performs every task initially specified (Reis, 2010). In this dissertation, the process
of verification of the model embraced several steps and tests that were performed repeatedly
throughout the development of the model.

!
!72
The main steps were as follow:
• Stress testing the model with a wide range of parameters and orders. Each component of the
model was tested under particular circumstances like for example: arrival of thousands of
orders at the same time or orders with all the positions;
• Debugging the model through AnyLogic, to ensure no programming bug makes to the final
version of the model. Despite the fact that the user used the university version of AnyLogic,
which does not include the full debugging tools, the basic debugger still alerted to severe
model issues;
• The model was constructed stage by stage, with extensive testing every step of the way.
Testing each stage separately makes it easier to identify incongruences since each stage by
itself is easier to understand than the full model. It has to be said however that the sum of
proper working stages does not add necessarily to a properly working model. Nonetheless a
flaw in a stage would definitely result in a model breakdown;
• The model was documented from the beginning. This documentation resulted in the current
piece of writing (namely chapter 4.2) and makes the model to be transparent to others;
• Review by a more senior modeller (the author’s supervisor), which was very helpful
eliminating some errors and providing input for some conceptual changes. Not only a senior
modeller helps with its extensive knowledge but also an observer from an exterior perspective
is often immediately aware of aspects that the modeller would never contemplate, since
modellers frequently become blind to some inaccuracies in their own models (Reis, 2010).
Besides verification, the model was subject to validation. Validation ensures that the model adequately
represents the real world and outputs meaningful results. The validation technique adopted in this
dissertation was based in the work of Reis (2010). It includes several features:
• Requirements Validation: the model should answer to clear requirements and questions about
the real world.
The model specifications were described thoroughly in chapter 4.2.1. In short, the
model is required to simulate picking in C2 so that it serves as a tool to assess the
validity of theoretical change scenarios.
• Data Validation: the date in the model should be valid.
As explained, the date feed into the model was from the real world. This data was
either arranged by LS or obtained in loco by the author.
• Face validation: the assumptions of the model should be valid.
Similarly to data, every assumption of the model is based in field observations by the
author or discussed with people from the real world operations.

!
! 73
• Process Validation: the steps in the model have to be clear, meaningful and correspond to
real world process.
The structure of the model replicates the process of picking in C2. Likewise, the
properties of every object in the model also reproduce the reality.
Other steps of validation included interviews with the real world picking personal of LS and
comparison of outcomes of the model with real world results. Unfortunately, most of these interviews
with practitioners could not validate the model as a whole, since practitioners revealed some
difficulties in grasping the full details of and, more importantly, the simplifications of the model. This
lead to some out of place feedback, like productivity values. To outmanoeuvre this difficulty, the author
questioned in sequence about details of the model, receiving positive feedback of every part of the
model after some explaining.
LS was not able to facilitate discriminated and extensive picking times or productivity values for a
definitive comparison with the model results. Nevertheless, in interviews with the staff, the impromptu
productivity values facilitated were lower than the values obtained for the entire week with the model.
To address this difference lets again recall that, respecting the simulation principle of keeping models
as simple as possible, our model ignores activities that occur before, after and parallel to the actual
picking like manual order assignment, labelling and filming and assumes that the resupply of picking
positions is faultless (see chapter 3.3.2 for the details on the picking operation). Also disregarded is
the possibility of each order requiring more than one pallet, either because the size of the order or
client specification. Lastly, the timing of picking operation (see Table 4.15) was conducted by the
author with a picker in the start of is shift. Over an entire workday fluctuation on his productivity is
bound to occur. By all of the reasoning before, severe drops in the overall picking productivity may
occur, reflected in the on sight measures by LS. So, naturally, the picking times resulting from the
model represent optimal picking times and can act as a goal for real life operations. They simulate a
picking operation completely unhindered and were the pickers operate always at full speed with no
drops in productivity.
Concluding, based on the method presented by Reis (2010) and on interviews the author believes that
the model is effectively validated.

!
!74

!
! 75
5. CASE STUDY APPLICATION
This chapter presents the theoretical scenarios raised by the author and the results of the experiments
carried out with the model for the assessment of their validity.
5.1. SCENARIOS
As explained in chapter 1.2, the objective of the present work is to assess and restructure the logistics
processes of a warehouse, specifically the storage assignment in the picking area and the order
picking routing method. To this end a simulation model, based mainly on discrete-event simulation
(DES), was created and applied to data supplied by LS. This allowed assessing the performance,
using picking time as measure of performance (see chapter 2.3.3 for details about the picking time as
a measure of service level in picking), of the order picking in C2 under various scenarios, respectively
before and after the implementation of the storage assignment policies and routing methods.
In this chapter the different scenarios chosen by the author for simulation will be presented. As already
explained there are two dimensions for these scenarios: storage assignment policy and routing
method. The choice of these two dimensions by the author is substantiated.
As further elaborated in chapter 2.3.3, improvements in low level, manual-pick order-picking
processes is achieved commonly by focusing on ideal (internal) layout design, storage assignment
methods, routing methods, order accumulation, order batching and zoning. The six policies normally
stay within the sphere of tactical and operational levels, which is critical for a built warehouse where
strategic decisions are already taken and are difficult and expensive to change.
However there are specifics in C2, resultant primarily from the fact that C2 is an automated
warehouse. The automation of many processes already in place requires specific machinery and
results in some space constrains. So unlike a normal warehouse where space constrains relate mostly
to the building, being the inner space a blank canvas for optimization, C2 presents restriction in space
implied by the position of custom made and expensive automated machinery.
Because of this lack of flexibility in the floor plan, changes on the layout were not possible within the
tactical and operation levels, where the author wanted his conclusion to reside so that they can be
transferred to reality in a short cost and time frame. This impossibility to change the layout also ruled
out optimization with order accumulation and sorting since there is no space for sorting station in C2.
This fact, along with the fact that the corridors are too small for forklifts with more than one pallet (the
picking unit in C2), rules out the batching of orders. As for zoning, the same reasoning also excludes
parallel (or synchronised) picking and the author did not found appealing studying a pick-and-pass
system since LS already restricts pickers to one client and orders tend to stay within a client. Hence
storage assignment and routing are the dimensions left to seek improvements.

!
!76
5.1.1. STORAGE ASSIGNMENT POLICIES
The scenarios in this work include three storage assignment policies: current, turnover, and ABC1.
As the name indicates, the current policy (scenario A) mimics the actual positions of each product in
week 45, 2014. These positions were obtained from the order list provided by LS. The position of this
policy respect a class-based storage policy already implemented by LS in C2. With this scenario,
named scenario A, the author expects not only to have a comparison point to other storage policies
but also to conclude about the routing methods versus the actual situation with no method enforced.
Supported by literature (see chapter 2.3.3.6.2), the author proposes a turnover (scenario B) and ABC1
(scenario C) storage assignments.
Scenario B is the full turnover policy, where products are distributed over the storage area according
to their turnover. The products with the highest turnover are closer to the produced pallets entrance
stations and slow moving products are at the back of the warehouse. In this work the author used
simply the actual turnover (or pick volume) as measure, obtained from the orders supplied by LS and
presented in Appendix VI. By corresponding the turnovers with the positions distance vector
(Appendix VII) the storage assignment was obtained (Appendix VIII). Other widely used turnover
indicator is cube-per-order index (COI) (see chapter 2.3.3.6.2 for further details on COI), which
includes a measure of the space occupied by each product in the picking floor as well as its turnover.
Within the same turnover, products that occupy less space are favoured. While a great idea to
traditional warehouses, COI was not used because, with the automated supply of the picking positions
working flawless as it was assumed for the optimization of picking in this work, it returns exactly the
same results as the turnover since any product only occupies one position in the picking area. This full
turnover policy, by definition, outperforms class-based storage but requires a new ordering of products
every time the demand rates change.
Scenario C is a class-based storage policy (explained in chapter 2.3.3.6.2). It consists of three classes
(A, B and C) each with a dedicated area of the warehouse. The use of three classes is common and
while in some cases more classes can provide additional gains it has the drawback of increasing the
space requirements. For the same reasoning of the full turnover policy, the class with the highest
turnover products (A area) is closer to the produced pallets entrance stations and slow moving
products (class C) are at the back of the warehouse. Since there is no firm rule to define a class
partition, the author selected an 80/19/1 turnover split to this scenario. This split was achieved by
analysis of the cumulative turnover curve (Figure 5.47), whilst minding the frequently applied Pareto
principle (or the 80-20 rule). So, to A class was assigned 20% of the products, responsible for 80% of
the turnover, precisely as predicted by the Pareto principle, and B class was designated to
approximately the next 40% of the products (39% to be exact), responsible, along with A class

!
! 77
products, for 99% of the turnover. The remaining 40% of the products, which account only to 1% of the
turnover, were allocated to class C.
Figure 5.47 – Cumulative Turnover and class divisions.
Table 5.16 presents the ABC1 class divisions. For further detail, Appendix VI presents the full turnover
table, with the class divisions indicated.
Table 5.16 – ABC1 class divisions.
Class Number of SKUs Turnover (%) SKUs (%) Cumulative
Turnover (%) Cumulative SKUs (%)
A 131 80% 20% 80% 20% B 265 19% 40% 99% 59% C 271 1% 41% 100% 100%
Within each class the product distribution was random, using for the author for that purpose VBA
programing. Figure 5.48 presents the distribution of the ABC areas within the picking area. Because of
the location of the produced pallets entrance stations, the distribution of ABC areas in scenario C
materialize mainly as an across-aisle storage. It is also clear that, as intended, class A is closer to the
produced pallets entrance stations, followed by class B. Class C products are left to fill more distant
positions. Product distribution for this scenario is accessible in Appendix IX.
0%
10%
20%
30%
40%
50%
60%
70%
80%
90%
100%
0% 10% 20% 30% 40% 50% 60% 70% 80% 90% 100%
Cum
ulat
ive
Turn
over
(%)
Cumulative SKUs (%)
Cumulative Turnover (%)
A/B Division
B/C Division

!
!78
Figure 5.48 – Distribution of the ABC areas in scenario C (A in green, B in yellow and C in red).

!
! 79
Please note that both scenario B and C leave some empty position in the far end of the picking area,
since the list of the client-in-study products provided by LS is lesser than the available positions. Also
note that, by assuming that the automated supply of picking positions is working flawlessly, scenarios
B and C only assigned one position to every product, which not always occurs in scenario A.
5.1.2. ROUTING METHODS
As for as routing methods go, the scenarios in this work include five: return, random, “LSPickers”, s-
shape and midpoint.
Of the routing methods detailed in chapter 2.3.3.4, optimal routing was not contemplated in this work
because it presents some disadvantages in practice, resulting in the usual use in warehouses of
heuristics. Largest gap and combined heuristics were disregarded for their complexity, inadequate
especially for pickers habituated with deviating from the specified route like in C2. Return and s-shape
were selected for their simplicity (and correspondent easy implementation) while midpoint was
selected because, while more intricate to implement, it performs better than the s-shape method when
the number of picks per aisle is small (Hall, 1993).
Random routing, where the routing is completely random as the name indicates, was selected to serve
as a comparison point, and to testify the possible effects of routing anarchy. “LSPickers” was a routing
created by the author to somehow simulate the comportment of the real life pickers in C2. In this
routing pickers have a 4/6 probability of going to the next picking position within the aisle and 1/6
probability of either going to picking position in the next aisle or going to a random picking position.
These five routing methods are combined with every storage assignment policy and are numbered
from one to five. Figure 5.49 to Figure 5.53 exemplify in a visual and appealing way the routing
methods applied in this work.
For comparison, a routing method identified as “original” (scenario 0) is also applied. This routing is
the actual travels made by the pickers, obtained from the order list provided by LS. Since, as referred,
pickers in C2 have the liberty to deviate from the routing assigned by their personal scanner if they
see fit to their productivity this scenario does not correspond to any method. Nevertheless, it
sometimes resembles the s-shape method, which is applied by the WMS and indicated by the
personal scanners. Since it relies in the reasoning of each picker and it is impossible to duplicate, this
routing is only applied with the current storage assignment.

!
!80
Figure 5.49 – Return route (scenario 1).
Figure 5.50 – Mid-point route (scenario 5).
Figure 5.51 – Example of a random route (scenario 2).
21.35
21.36
21.37
21.38
21.39
21.40
21.41
21.42
21.43
21.44
21.45
21.46
21.47
21.48
21.49
21.50
21.51
21.52
21.53
23.35
23.36
23.37
23.38
23.39
23.40
23.41
23.42
23.43
23.44
23.45
23.46
23.47
23.48
23.49
23.50
23.51
23.52
23.53
22.35
22.36
22.37
22.38
22.39
22.40
22.41
22.42
22.43
21.44
22.45
22.46
22.47
22.48
22.49
22.50
22.51
22.52
22.53
25.35
25.36
25.37
25.38
25.39
25.40
25.41
25.42
25.43
25.44
25.45
25.46
25.47
25.48
25.49
25.50
25.51
25.52
25.53
24.35
24.36
24.37
24.38
24.39
24.40
24.41
24.43
24.44
24.45
24.46
24.47
24.48
24.49
24.50
24.53
24.52
23.137
23.138
23.145
23.146
23.147
23.148
23.149
23.150
23.154
23.155
22.137
22.138
22.145
22.146
22.147
22.148
22.149
22.150
22.154
22.155
23.142
23.143
23.144
22.142
22.143
22.144
23.139
23.140
23.141
22.139
22.140
22.141
23.151
23.152
23.153
22.151
22.152
22.153
25.137
25.138
25.145
25.146
25.147
25.148
25.149
25.150
25.154
25.155
24.137
24.138
24.145
24.146
24.147
22.148
24.149
24.154
24.155
25.142
25.143
25.144
24.142
24.143
24.144
25.139
25.140
25.141
24.139
24.140
25.151
25.152
25.153
24.151
24.152
24.153
21.35
21.36
21.37
21.38
21.39
21.40
21.41
21.42
21.43
21.44
21.45
21.46
21.47
21.48
21.49
21.50
21.51
21.52
21.53
23.35
23.36
23.37
23.38
23.39
23.40
23.41
23.42
23.43
23.44
23.45
23.46
23.47
23.48
23.49
23.50
23.51
23.52
23.53
22.35
22.36
22.37
22.38
22.39
22.40
22.41
22.42
22.43
21.44
22.45
22.46
22.47
22.48
22.49
22.50
22.51
22.52
22.53
25.35
25.36
25.37
25.38
25.39
25.40
25.41
25.42
25.43
25.44
25.45
25.46
25.47
25.48
25.49
25.50
25.51
25.52
25.53
24.35
24.36
24.37
24.38
24.39
24.40
24.41
24.43
24.44
24.45
24.46
24.47
24.48
24.49
24.50
24.53
24.52

!
! 81
Figure 5.52 – Example of a “LSPickers” route (scenario 3).
Figure 5.53 – S-shape route (scenario 4).
5.2. OTHER EXPERIMENTS CONSIDERATIONS
In this section the author would like to express various considerations about the experiments carried
and the steps needed to reach them.
First of all lets address the experiment runs in AnyLogic. To surpass the effects of randomness every
scenario was run 250 times, and the picking times of all simulations were statistically treated to
withdrawn meaningful results. In every run the seed value of the random number generator was
random, resulting in unique model runs and, therefore, distinctive picking times.
Secondly lets address the input of the model. The model in this work used as input bi-dimensional
array, consisting of order lists and the positions within each list. To create inputs for the model the
author used VBA programing within Excel, using as basis the order list provided by LS (Appendix V).
21.35
21.36
21.37
21.38
21.39
21.40
21.41
21.42
21.43
21.44
21.45
21.46
21.47
21.48
21.49
21.50
21.51
21.52
21.53
23.35
23.36
23.37
23.38
23.39
23.40
23.41
23.42
23.43
23.44
23.45
23.46
23.47
23.48
23.49
23.50
23.51
23.52
23.53
22.35
22.36
22.37
22.38
22.39
22.40
22.41
22.42
22.43
21.44
22.45
22.46
22.47
22.48
22.49
22.50
22.51
22.52
22.53
25.35
25.36
25.37
25.38
25.39
25.40
25.41
25.42
25.43
25.44
25.45
25.46
25.47
25.48
25.49
25.50
25.51
25.52
25.53
24.35
24.36
24.37
24.38
24.39
24.40
24.41
24.43
24.44
24.45
24.46
24.47
24.48
24.49
24.50
24.53
24.52
21.35
21.36
21.37
22.35
22.36
22.37

!
!82
To create the input for each routing, a routing key was used to order the positions on each list
according to a routing method. This routing key, available in Appendix X, was created by the author
using extensive VBA programing in Excel. In routing with a random aspect (LSPicker and Random)
code was written to guarantee a correct behaviour (e.g. no repetitions), code that was also used in
other instances that require a random number generator like the position assignment within classes in
ABC scenarios. The process of attributing positions for every product in the scenarios theorised by the
author (scenarios B and C) was already explained in chapter 5.1.1. To this end VBA was also used. In
short VBA programming in Excel was a backbone for the DES model, creating the correct model
inputs list for every scenario, changing the product position according to the SAP and ordering the
products according to the routing key.
Finally lets address the results. As explained in chapter 4.3, the picking times resulting from the model
represent a picking operation completely unhindered and where the pickers operate always at full
speed with no drops in productivity. Please note that this high productivity of the picking model does
not in anyway disrupt the author’s conclusions about SAP and routing has every scenario runs in the
same optimum picking ambience.
5.3. RESULTS
Table 5.17, Table 5.18 and Table 5.19 present the results, total picking time for week 45, 2014, of
every scenario. The results were treated with descriptive statistics. Since that is the time of the model,
results are in seconds. Appendix XI facilitates the complete results, corresponding to the 250 runs.
Please note that while these results are presented in seconds, the model unit of the model, section 5.4
presents the same results in hours using box-and-whisker diagrams.
Table 5.17 – Current SAP results (in seconds).
Current SAP Original (A0)
Return (A1)
Random (A2)
LSPickers (A3)
S-Shape (A4)
Midpoint (A5)
Average 343148 313580 396432 382767 300517 295530 Standard Error 46 42 48 40 45 43
Median 343110 313631 396452 382752 300573 295543 Standard Deviation 722 665 762 639 711 675
Sample Variance 521488 441993 580606 408606 505299 455579
Range 4734 4305 3615 3097 4236 3725 Minimum 340968 311008 394758 381257 298340 293997 Maximum 345702 315313 398373 384354 302576 297722
Third Quartile 343615 314019 396940 383224 300999 296005 First Quartile 342699 313114 395881 382292 300026 295058

!
! 83
Table 5.18 – Turnover SAP results (in seconds).
Turnover SAP Return (B1)
Random (B2)
LSPickers (B3)
S-Shape (B4)
Midpoint (B5)
Average 248916 302441 292996 242266 249376 Standard Error 45 46 45 44 44
Median 248915 302363 292968 242255 249384 Standard Deviation 705 725 709 688 697
Sample Variance 496521 525547 502837 473567 486341 Range 3871 4248 4132 3613 3703
Minimum 246797 300236 290764 240178 247453 Maximum 250668 304484 294897 243790 251156
Third Quartile 249403 303017 293508 242789 249930 First Quartile 248424 301995 292545 241767 248854
Table 5.19 – ABC1 SAP results (in seconds).
ABC1 SAP Return (C1)
Random (C2)
LSPickers (C3)
S-Shape (C4)
Midpoint (C5)
Average 257857 314367 305329 249698 256953 Standard Error 44 44 48 42 44
Median 257857 314377 305335 249673 256970 Standard Deviation 690 694 751 664 701
Sample Variance 475570 481840 564662 441306 490793 Range 4268 3955 3944 3975 3986
Minimum 255482 312625 303261 247688 254711 Maximum 259750 316581 307205 251663 258696
Third Quartile 258299 314852 305836 250148 257441 First Quartile 257400 313879 304832 249273 256450
From observation of the descriptive statics presented in the tables, it is clear that standard deviation
and range are minor. Likewise, the coefficient of variation is also marginal. These circumstances,
coupled with the also small difference between average and median, emphasize that the model results
are consistent and augments the confidence in the results.
As for the difference in results between the various scenarios, it is important to realize that the picking
time in best performing scenario (B4) amounts to only 61% of the picking time of the worst performing
scenario (A2). This fact further endorses the wide range alternatives, and the corresponding
performance, covered by these scenarios.

!
!84
5.4. RESULTS CONCLUSIONS
In this chapter the author includes his own conclusions on the obtained results. To support the
conclusions, box-and-whisker diagrams are presented. These diagrams including minimum, first
quartile, third quartile and maximum values each scenario, all in hours for simpler reading and
understanding.
5.4.1. CONCLUSIONS ON STORAGE ASSIGNMENT POLICIES
Figure 5.54 to Figure 5.58 plot the results for the three SAPs, one box-and-whisker diagram for each
routing method.
!
Figure 5.54 – Return (scenario 1) box-and-whisker diagram (in hours).
Figure 5.55 – Random (scenario 2) box-and-whisker diagram (in hours).
!
68
70
72
74
76
78
80
82
84
86
88
Current Turnover ABC1 82
87
92
97
102
107
112
Current Turnover ABC1

!
! 85
Figure 5.56 – LSPickers (scenario 3) box-and-whisker diagram (in hours).
Figure 5.57 – S-shape (scenario 4) box-and-whisker diagram (in hours).
!
Figure 5.58 – Midpoint (scenario 5) box-and-whisker diagram (in hours).
From observing the results it is clear that the turnover SAP presents the best results, no matter the
routing method. This was expected, as by definition a full turnover policy outperforms any class-based
storage. Nevertheless, and taking into account that a turnover policy demands a lot of information and
80
85
90
95
100
105
Current Turnover ABC1 66
68
70
72
74
76
78
80
82
84
86
Current Turnover ABC1
68
70
72
74
76
78
80
82
84
Current Turnover ABC1

!
!86
control, with each change in demand rates requiring a new ordering of products, the ABC1 SAP
becomes attractive.
The ABC1 SAP presents results closer to the turnover SAP in every routing, being within a 4-hour
range that amounts to 5% of the average of all scenarios (83 hours), and being a class-based storage
policy it is easier to implement and requires less time to administer than the turnover SAP. The
proximity of turnover and ABC1 performance renders the turnover SAP, with its added complications,
superfluous. Moreover, this proximity of performance between ABC1 and the optimum full-turnover
policy also dissuaded the author from an extensive testing of other class based SAPs, since the
potential gains are definitely diminutive.
As for the current SAP, it is grossly outperformed by the other two in every routing method, adding up
to 26 hours (32% of the average of all scenarios) to the picking time than the turnover SAP. One
extenuatory circumstance that could help explain the lack of performance of this SAP versus ABC1 is
the fact that for the definition of the current SAP, a class-based storage policy with 3 classes, the
product demand taken into consideration corresponds to 90 days. So while ABC1 was optimized
exactly for week 45 the current SAP reflects demands from 8 weeks. That being said, by his personal
observation of the demand patterns from the time span of this work the author does note believe that
demand changes over weeks fully explain the lack of performance of the current SAP.
Also keep in mind that scenarios B and C only assigned one position to every product (assuming that
automated supply of the picking positions working faultlessly), which not always happens in scenario
A. However the occurrence in scenario A of the same product in two different positions within the
same order, which hinders scenario A performance in contrast to scenarios B and C, is residual. So,
and although this fact can furthermore explain the poor performance of scenario A, in the author’s
opinion it is still far from enough to justify the staggering shortage of performance of the current SAP.
What can be safely concluded is that a perfect picking supply combined with SAP closer to full-
turnover performance (like ABC1) would amount to serious performance improvements of more than
30%. Furthermore it is also worth noting that the inefficient of the current SAP greatly escalate when a
non optimal routing, like random and LSPickers, is considerate as opposed to the literature proven
return, s-shape and midpoint methods. This circumstance, which happens to a lesser extent between
turnover and ABC1, proves that inadequate routing will only enhance the SAP shortcomings.
5.4.2. CONCLUSIONS ON ROUTING
Figure 5.59 to Figure 5.61 plot the results for the routing methods, one box-and-whisker diagram for
each SAP.

!
! 87
Figure 5.59 – Current (scenario A) box-and-whisker diagram (in hours).
Discerning Figure 5.59 it becomes clear that 3 groups of routing methods exist. One, consisting of
random and LSPickers, is by far the worst performing. This proves that randomness is really hurtful to
the productivity; assuring that any time saved by not preparing picking routes (random routing) or any
deviation from a rational method (LSPickers) will result in severe lost time. A second group,
comprising only the original routing, serves as proof that the on-the-fly routing decisions of the pickers
(in a honest attempt to achieve greater productivity) are far from optimal, resulting in substantial lost
time over a week. This result reassures that planning always outperforms in-the-moment decisions by
the pickers, be they as cunning as they are. The third and final group consists of the best performing
methods, return, s-shape and midpoint, all widely studied and applied. These three methods are good
performers, particularly s-shape and midpoint.
Figure 5.60 – Turnover (scenario B) box-and-whisker diagram (in hours).
80
85
90
95
100
105
110
Original Return Random LSPickers S-shape Midpoint
66
68
70
72
74
76
78
80
82
84
86
Return Random LSPickers S-shape Midpoint

!
!88
Figure 5.61 – ABC1 (scenario C) box-and-whisker diagram (in hours).
The conclusions draw from scenario A largely apply to scenario B and C. It is however important to
notice that under the better performing turnover and ABC1 SAP the performance gap between the
random routings and the literature routings diminishes.
So, with all the SAP taken into account, the author concludes that the return, s-shape and midpoint
are the better preforming methods. Since midpoint is the more complex to implement, a specially
penalizing factor in C2 where the pickers are not used to have a routing enforced, and s-shape always
outperforms return the author indicates s-shape as the appropriate routing method.
In a fortunate coincidence s-shape is already applied by the WMS and indicated by the pickers
personal scanners. So, by simply enforcing the pickers to follow the already implemented routing
performance could be significantly boosted.
5.4.3. GENERAL CONCLUSIONS
Figure 5.62 illustrates a three dimensional representation of the picking time for different scenarios.
68
70
72
74
76
78
80
82
84
86
88
Return Random LSPickers S-shape Midpoint

!
! 89
Figure 5.62 – Three dimensional diagram of the picking time under the different scenarios.
By the valley form of Figure 5.62, it is clear that SAP B is the best performing. Also scenario A clearly
emerges as the one with the highest picking times. As for the routing dimension, routings 2 and 3
present a peak in the diagram, vouching for the low performance of random based routings.
Figure 5.63 and Figure 5.64 present the results for every scenario in one convenient diagram.
Figure 5.63 – Box-and-whisker diagram (in hours) of the picking time under the different scenarios.
A
B
C
0
20
40
60
80
100
120
1 2
3 4
5
SAP
Tota
l Pic
king
Tim
e (H
ours
)
Routing Method
66
71
76
81
86
91
96
101
106
111
A0 A1 A2 A3 A4 A5 B1 B2 B3 B4 B5 C1 C2 C3 C4 C5

!
!90
Revalidating previous conclusions, it is clear that scenario A (current SAP), is seriously
underperforming and that scenarios B (turnover) and C (ABC1) present a similar and worthy
performance. Furthermore routing 1, 4 and 5 (return, s-shape and midpoint) present the best results.
Figure 5.64 – Ordered box-and-whisker diagram (in hours) of the picking time under the different scenarios.
In absolute terms, scenario B4 (combining s-shape routing and turnover SAP) represents the fastest
picking times, with a worrying performance gap to the current situation represented by A0. Scenarios
B1, B5 and C4 follow close.
Supported by these results, by the already mention advantages of class-based storage and by the fact
that s-shape routing is already implemented in the WMS the author suggests that a class-based
storage policy equal or similar too ABC1 is applied to C2 and that s-shape routing is enforced. The
author also reinforces the importance of keeping the supply of the picking zone flawless. A culture of
method should always prevail over cunning actions, as short term gains do not compensate the losses
in productivity over a longer period of time.
66
71
76
81
86
91
96
101
106
111
A0 B4 B1 B5 C4 C5 C1 B3 A5 A4 B2 C3 A1 C2 A3 A2

!
! 91
6. CONCLUSIONS
This dissertation’s utmost motivation was the importance and costs of logistics. Today’s world would
simply not function without logistics, being the support of our everyday activities. Warehousing is an
integral part of every logistics system that plays a vital role in providing a desired level of customer
service at the lowest possible total cost. And within warehouses and distribution centres, picking has
come under increased scrutiny. Order picking is the most labour-intensive operation in warehouses
with manual systems, and a very capital-intensive operation in warehouses with automated systems,
with any underperformance in leading to unsatisfactory service and high operational cost for the whole
supply chain. Therefore, order picking is considered as the highest priority area for productivity
improvements (Goetschalckx & Ashayeri, 1989; De Koster et al., 2007).
Henceforth, the all-embracing objective of the present dissertation is to assess and restructure the
storage assignment in the picking area and the order picking process (explicitly the routing method) of
a warehouse, Carregado 2 Logistic Operations Centre. Order picking was the process chosen for
analysis, in accordance with the observation of the C2 operations, the LS staff, the literature review
and the scope of this work. Order picking is a labour-intensive operation, especially in an automated
distribution centre like C2, and so it represents significant costs.
To accomplish this objective a methodology was developed to assess the performance of the order
picking in C2, taking in account various scenarios, respectively before and after the implementation of
various storage assignment policies and routing methods (see chapter 5.1, for details in the choice of
these two dimensions). To this end a simulation model, based mainly on discrete-event simulation
(DES), was created. To provide evidence for supporting or refuting the hypothesis of each scenario,
validating theories and, ultimately, the conclusions of this dissertation, the model collected the
dimension time. This allowed assessing the performance, using picking time as measure (see chapter
2.3.3 for details about the picking time as a measure of service level in picking), of the order picking in
C2 under various scenarios. By analysing the results the current paradigm of the order picking was
evaluated, as were possible modifications in storage assignment policies and routing methods.
In total sixteen scenarios were evaluated. These bi-dimensional scenarios consist, in one dimension,
of three storage assignment policies; current SAP (scenarios A), a full-turnover SAP (scenario B) and
a class based SAP named ABC1 (scenario C). As for the other dimension, routing method, five
methods were combined with every SAP; return (scenarios 1), random (scenarios 2), LSPickers
(scenarios 3), s-shape (scenarios 4) and midpoint (scenarios 5). Also, the current SAP was also
combined with the routing that was actually applied by LS pickers (named “original” and represented
by a 0). This scenario (A0) was necessary to evaluate the current performance of picking and to serve
as benchmark for comparisons.
When applying this methodology, the prime difficulty encountered was the deficiency of information.
Many measurements helpful for the assessment of the picking and for the model were not regularly
and precisely taken in C2, leaving the author to conduct them. Also, and similarly to many academic

!
!92
work with a real case study attached, testing theories in the real world was not possible. So the
simulation model was used to validate every hypotheses of the dissertation. In essence, scarce
information and impossibility of any real world validation for the model or parts of it were the difficulties
encountered in this work, but both were surpassed unscathed.
The objective of this dissertation was completely fulfilled, with the assessment of alternatives in the
picking process capable of largely enhancing its performance.
The main conclusions to be drawn from this dissertation, grounded on the attained results, are that in
relation with the storage assignment methods:
• The turnover SAP presents the best results, as expected by definition;
• The ABC1 SAP presents results closer to the turnover SAP in every routing while being easier
to implement and requiring less time to administer;
• The proximity of turnover and ABC1 performance renders the turnover SAP, with its added
complications, less attractive;
• As for the current SAP, it is grossly outperformed by the other two in every routing method,
although there are extenuatory circumstances that could help explain the lack of performance
like the product demand taken into consideration corresponding to 90 days and the fact that
scenarios B and C only assigned one position to every product which not always happens in
scenario A;
As for the routing methods:
• Three groups of routing methods exist;
• One, consisting of random and LSPickers, is by far the worst performing, thus assuring that a
random behaviour is categorically hurtful to the productivity;
• A second group, comprising only the original routing, serves as proof that the on-the-fly
routing decisions of the pickers equal a substantial loss of time over a week;
• The third and final group consists of the best performing methods, return, s-shape and
midpoint, all widely studied and applied. These three methods are the better performing
methods, particularly s-shape and midpoint;
• Under better performing turnover and ABC1 SAPs the performance gap between the random
routings and the literature routings decreases.
As a result:
• It is clear that scenario A (current SAP), is seriously underperforming and that scenarios B
(turnover) and C (ABC1) present a comparable and admirable performance. Additionally
routing 1, 4 and 5 (return, s-shape and midpoint respectively) present the best results;

!
! 93
• In absolute terms, scenario B4 (combining s-shape routing and turnover SAP) represents the
quickest picking time, with a significant performance gap to the current situation represented
by A0. Scenarios B1, B5 and C4 follow with similar performance.
With the literature review, analysis of the case study and conclusions provided by the model and its
results, this dissertation can sum its main contributions, specifically for C2 and also for picking
optimization in general.
For C2, the author suggests that a class-based storage policy equal or similar too ABC1 is applied and
that s-shape routing is enforced (scenario C4). This suggestion is backed by the top tier performance
of this scenario, the previously mentioned advantages of class-based storage over a full-turnover
policy and by the fact that s-shape routing is already implemented in the WMS. These alterations,
combined with perfect picking supply, would amount to serious performance improvements of more
than 30%.
In general, the author would like to point out that inadequate routing only enhances the SAP
shortcomings and, in what the author thinks is the single most important conclusion of this
dissertation, that a culture of method should always prevail over cunning actions, as the perceived
short term gains that pickers seek with their in-the-moment decisions do not compensate the losses in
productivity caused by the deviation from proven methods over a longer period of time.
Finally the author would like to address potential future research. While satisfying its objectives, the
research developed in this dissertation identified other possible avenues for optimization and space for
further sophistication of the methodology, not fitting for the scope of this work.
Within the established methodology there is still room for further optimization, for example by testing
other class-based storage scenarios or specifically other ABC class distributions. There are various
literature works regarding the positioning of classes, with several listed in Table 2.12 (the author
suggest especially the works of Petersen et al. (2004) and Le-Duc and De Koster (2005c)).
Furthermore, combining the class-based storage with family grouping (chapter 2.3.3.6.3)
considerations might present results. As for routing, assessing the optimal routing solution, to quantify
its gains in comparison with the tested routing methods and see if they overcome the added
complexity, could further add value, as well as assessing any other routing method not addressed by
this work.
Additional methodology sophistication can be achieved by complicating the model to include for
example the simulation of the automatic handling operations responsible for the supply of the picking
area. In this methodology, it is taken as certain that the automatic handling will never bottleneck the
process, keeping always one and only one pallet of each product in the picking zone. Simulation of the
automatic handling movements, fitting for Agent Based Modelling, would relief the picking model of
this simplification and also allow a possible parallel optimization of the CAP movements, with benefits
for all C2 processes. Also the inclusion in the model of activities that occur before, after and parallel to
the actual picking (e.g. manual order assignment, labelling and filming, etc.) could help explain these
operations implication in the overall picking productivity.

!
!94

!
! 95
7. REFERENCES
AnyLogic. (2015). AnyLogic Simulation Software. Retrieved January 15, 2015 from Why AnyLogic?:
http://www.anylogic.com/features
AnyLogic. (2014). Discrete Event - AnyLogic Simulation Software. Retrieved December 15, 2014 from
AnyLogic Simulation Software: http://www.anylogic.com/discrete-event-simulation
Baker, P., & Canessa, M. (2009). Warehouse design: A structured approach. European Journal of
Operational Research , 193, 425-436 .
Bartholdi, J. J., & Hackman, S. T. (2011). Warehouse & distribution science. . Atlanta: Available on
line at: http://www2.isye.gatech.edu/~jjb/wh/book/editions/wh-sci-0.95.pdf (accessed January 2014).
Bassan, Y., Roll, Y., & Rosenblatt, M. (1980). Internal layout design of a warehouse. AIIE
Transactions , 12 (4), 317-322.
Beamon, B. M. (1998). Supply chain design and analysis: Models and methods. Internaional Journal
Production Economics , 55, 281-294.
Berg, J. v., & Zijm, W. (1999). Models for warehouse management: Classification and examples.
International Journal Production Economics , 59, 519-528 .
Bowersox, D. J., Closs, D. J., & Cooper, M. B. (2002). Supply Chain Logistics Management (First
Edition ed.). New York: McGraw-Hill.
Bowersox, D. J., Closs, D. J., & Stank, T. P. (1999). 21st Century Logistics: Making Supply Chain
Integration a Reality. Council of Logistics Management.
Bowersox, D. J., Mentzer, J. T., & Speh, T. W. (1995). Logistics Leverage. Journal of Business
Strategies , 12 (1), 36-49.
Bowersox, D., & Closs, D. (1996). Logistical Managers: The Integrated Supply Chain Approach. New
York: McGraw-Hill.
Bozer, Y., & Sharp, G. (1985). An empirical evaluation of general purpose automated order
accumulation and sortation system used in batch picking. Material Flow , 2, 111-113.
Bozer, Y., Quiroz, M., & Sharp, G. (1988). An evaluation of alternative control strategies and design
issues for automated order accumulation and sortation system. Material Flow , 4, 265-282.
Broulias, G., Marcoulaki, E., Chondrocoukis, G., & Laios, L. (2005). Warehouse management for
improved order picking performance: An application case study from the wood industry. Proceedings
of the 5th International Conference on Analysis of Manufacturing Systems – Production Management
(pp. 17-23). Zakynthos: In C Papadopoulos.
Brynsér, H., & Johansson, M. (1995). Design and performance of kitting and order picking systems.
International Journal of Production Economics , 41, 115-125.

!
!96
Caron, F., Marchet, G., & Perego, A. (2000). Optimal layout in low-level picker-to-part systems.
International Journal of Production Research , 38, 101-117.
Caron, F., Marchet, G., & Perego, A. (1998). Routing policies and COI-based storage policies in
picker-to-part systems. International Journal of Production Research , 36 (3), 713-732.
Chan, F., & Chan, H. (2011). Improving the productivity of order picking of a manual-pick and multi-
level rack distribution warehouse through the implementation of class-based storage. Expert Systems
with Applications , 38, 2686-2700.
Chen, M., & Wu, H. (2005). An association-based clustering approach to order batching considering
customer demand patterns. Omega International Journal of Management Science , 33 (4), 333-343.
Chen, M., Huang, C., Chen, K., & Wu, H. (2005). Aggregation of orders in distribution centers using
data mining. Expert Systems with Applications , 28 (3), 453-460.
Chew, E., & Tang, L. (1999). Travel time analysis for general item location assignment in a rectangular
warehouse. European Journal of Operational Research , 112, 582-597.
Choe, K., & Sharp, G. (1991). Small parts order picking: design and operation.
Choe, K., Sharp, G., & Serfozo, R. (1993). Aisle-based order pick systems with batching, zoning and
sorting. In Progress in Material Handling Research (pp. 245-276). Charlotte: Material Handling
Institute.
Christopher, M. (2011). Logistics & Supply Chain Management (Fourth Edition ed.). Harlow: Pearson.
Cohen, S., & Roussel, J. (2005). Strategic Supply Chain Management. 2005: McGraw-Hill.
Cornuéjols, G., Fonlupt, J., & Naddef, D. (1985). The travelling salesman problem on a graph and
some related integer polyhedra. Mathematical Programming , 33, 1-27.
Council of Supply Chain Management Professionals. (2013). Glossary of Terms. Retrieved 12 2013
from Council of Supply Chain Management Professionals:
http://cscmp.org/sites/default/files/user_uploads/resources/downloads/glossary-2013.pdf
Croom, S., Romano, P., & Giannakis, M. (2000). Supply chain management: an analytical framework
for critical literature review. European Journal of Purchasing & Supply Management , 6, 67-83.
Daniels, R., Rummel, J., & Schantz, R. (1998). A model for warehouse order picking. European
Journal of Operational Research , 105, 1-17.
Daugherty, P. J., Stank, T. P., & Ellinger, A. E. (1998). Leveraging Logistics/Distribution Capabilities:
The Effect of Logistics Service on Market Share. Journal of Business Logistics , 19 (2), 35-52.
Day, G. (1994). The Capabilities of Market-Driven Organizations. Journal of Marketing , 58 (4), 37-60.
De Koster, R. (1994). Performance approximation of pick-to-belt orderpicking systems. European
Journal of Operational Research , 72, 558-573.
!
! 97
De Koster, R., & Le-Duc, T. (2005). Single-command travel time estimation and optimal rack design
for a 3-dimensional compact AS/RS. In R. Meller, M. K. Ogle, B. Peters, G. Taylor, & J. Usher,
Progress in Material Handling Research (pp. 49-66). Charlotte: Material Handling Institute.
De Koster, R., & Van der Poort, E. (1998). Routing orderpickers in a warehouse: A comparison
between optimal and heuristic solutions. IIE Transactions , 30, 469-480.
De Koster, R., Le-Duc, T., & Roodbergen, K. J. (2007). Design and control of warehouse order
picking: A literature review. European Journal of Operatonal Research , 182, 481-501.
De Koster, R., Van der Poort, E. S., & Wolters, M. (1999). Efficient orderbatching methods in
warehouses. International Journal of Production Research , 37 (7), 1479-1504.
De Koster, R., Van der Poort, E., & Roodbergen, K. (1998). When to apply optimal or heuristic routing
to orderpickers. In B. Fleischmann, J. van Nunen, M. Speranza, & P. Stahly, Advances in Distribution
Logistics (pp. 375-401). Berlin: Springer.
Deepen, J. M. (2007). Logistics Outsoursing Relationships. Düsseldorf: Physica-Verlag.
Eisenstein, D. D. (2008). Analysis and Optimal Design of Discrete Order Picking Technologies Along a
Line. Naval Research Logistics .
Eldemir, F., Graves, R., & Malmborg, C. (2004). New cycle time and space estimation models for
automated storage and retrieval system conceptualization. International Journal of Production
Research , 42 (22), 4767-4783.
Elsayed, E. (1981). Algorithms for optimal material handling in automatic warehousing systems.
International Journal of Production Research , 19 (5), 525-535.
Elsayed, E., & Lee, M. (1996). Order processing in automated storage/retrieval systems with due
dates. International Journal of Production Research , 28 (7), 567-577.
Elsayed, E., & Stern, R. (1983). Computerized algorithms for order processing in automated
warehousing systems. International Journal of Production Research , 21 (4), 579-586.
Elsayed, E., & Unal, O. (1989). Order batching algorithms and travel-time estimation for automated
storage/retrieval systems. International Journal of Production Research , 27, 1097-1114.
Elsayed, E., Lee, M., Kim, S., & Scherer, E. (1993). Sequencing and batching procedures for
minimizing earliness and tardiness penalty or order retrievals. International Journal of Production
Research , 31 (3), 727-738.
Fernandes, A. (2010). Projecto Carregado 2 "Centro Logístico do Futuro". Lisboa: Grupo Luís Simões.
Frazelle, E. H. (2002). Supply Chain Strategy: The Logistics of Supply Chain Management. McGraw-
Hill.
Frazelle, E., Hackman, S., Passy, U., & Platzman, L. (1994). The forward-reserve problem. In T.
Ciriani, & R. Leachman, Optimization in Industry 2 (pp. 43-61). New York: Wiley.

!
!98
Gademann, A., & Van de Velde, S. (2005). Batching to minimize total travel time in a parallel-aisle
warehouse. IIE Transactions , 37 (1), 63-75.
Gademann, A., Van den Berg, J., & Van der Hoff, H. (2001). An order batching algorithm for wave
picking in a parallel-aisle warehouse. IIE Transactions , 33, 385-398.
Gibson, D., & Sharp, G. (1992). Order batching procedures. European Journal of Operational
Research , 58 (1), 57-67.
Goetschalckx, M., & Ashayeri, J. (1989). Classification and design of order picking. Logistics
Information Management , 2 (2), 99-106.
Goetschalckx, M., & Ratliff, D. (1988b). An efficient algorithm to cluster order picking items in a wide
aisle. Engineering Costs and Production Economy , 13, 263-271.
Goetschalckx, M., & Ratliff, D. (1988a). Order picking in an aisle. IIE Transactions , 20, 531-562.
Graves, S., Hausman, W., & Schwarz, L. (1977). Storage-retrieval interleaving in automatic
warehousing systems. Management Science , 23, 935-945.
Grupo Luís Simões. (2010). Dossier de Imprensa. Lisboa: Grupo Luís Simões.
Grupo Luís Simões. (2013). Onde Estamos: Luís Simões. Retrieved October 15, 2013 from Luís
Simões Corporation Web Site: http://www.luis-simoes.com
Gu, J., Goetschalckx, M., & McGinnis, L. F. (2010). Research on warehouse design and performance
evaluation: A comprehensive review. European Journal of Operational Research , 203, 539-549.
Gu, J., Goetschalckx, M., & McGinnis, L. F. (2007). Research on warehouse operation: A
comprehensive review. European Journal of Operational Research , 177, 1-21.
Hackman, S., & Platzman, L. (1990). Near optimal solution of generalized resource allocation
problems with large capacities. Operations Research , 38 (5), 902-910.
Hall, R. (1993). Distance approximation for routing manual pickers in a warehouse. IIE Transactions ,
25, 77-87.
Hausman, W., Schwarz, L., & Graves, S. (1976). Optimal assignment in automatic warehousing
systems. Management Science , 22 (6), 629-638.
Henn, S., Koch, S., & Wascher, G. (2011). Order Batching in Order Picking Warehouses: A Survey of
Solution Approaches. Magdeburg, Germany.
Heskett, J. (1963). Cube-per-order index - A key to warehouse stock location. Transport and
Distribution Management , 3, 23-40.
Heskett, J. (1964). Putting the cube-per-order index to work in warehouse layout. Transport and
Distribution Management , 4, 23-30.
Hsieh, L.-F., & Huang, Y.-C. (2011). New batch construction heuristics to optimise the performance of
order picking systems. International Journal of Production Economics , 131, 618-630.

!
! 99
Hsu, C., Chen, K., & Chen, M. (2005). Batching orders in warehouses by minimizing travel distance
with genetic algorithms. Computers in Industry , 56, 169-178.
Hwang, H., & Lee, M. (1988). Order batching algorithms for a man-on-board automated storage and
retrieval system. Engineering Costs and Production Economics , 13, 285-294.
Hwang, H., Baek, W., & Lee, M. (1988). Cluster algorithms for order picking in an automated storage
and retrieval system. International Journal of Production Research , 26, 189-204.
Hwang, H., Oh, Y., & Lee, Y. (2004). An evaluation of routing policies for order-picking operations in
low-level picker-to-part system. International Journal of Production Research , 42 (18), 3873-3889.
Jane, C. (2000). Storage location assignment in a distribution center. International Journal of Physical
and Logistics Management , 30 (1), 55-71.
Jane, C., & Laih, Y. (2005). A clustering algorithm for item assignment in a synchronized zone order
picking system. European Journal of Operational Research , 166 (2), 489-496.
Jarvis, J., & McDowell, E. (1991). Optimal product layout in an order picking warehouse. IIE
Transactions , 23 (1), 93-102.
Jewkes, E., Lee, C., & Vickson. (2004). Product location, allocation and server home base location for
an order picking line with multpiple servers. Computers & Operations Research , 31, 623-626.
Johnson, M. (1998). The impact of sorting strategies on automated sortation system performance. IIE
Transactions , 30, 67-77.
Johnson, M., & Lofgren, T. (1994). Model decomposition speeds distribution center design. Interfaces
, 24 (5), 95-106.
Kallina, C., & Lynn, J. (1976). Application of the cube-per-order index rule for stock location in a
distribution warehouse. Interfaces , 7 (1), 37-46.
Kent, J. L., & Flint, D. J. (1997). Perpectives on the Evolution of Logistics Thought. Journal of
Business Logistics , 18 (2), 15-29.
Lambert, D. M., Stock, J. R., & Ellram, L. M. (1998). Fundamentals of Logistics Management.
McGraw-Hill.
Langley, J. C. (1986). The Evolution of the Logistics Concept. Journal of Business Logistics , 7 (2), 1-
13.
Larson, T., March, H., & Kusiak, A. (1997). A heuristic approach to warehouse layout with class based
storage. IIE Transactions , 29, 337-348.
Le Duc, T., & De Koster, R. (2003). An approximation for determining the optimal picking batch size
for order picker in single aisle warehouses. In R. Meller, M. Ogle, B. Peters, G. Taylor, & J. Usher,
Progress in Material Handling Research (pp. 267-286).
Le Duc, T., & De Koster, R. (2007). Travel time estimation and order batching in a 2-block warehouse.
European Journal of Operational Research , 176 (1), 374-388.

!
!100
Le-Duc, T. (2005). Design and control of efficient order picking processes. Ph.D. Thesis. RSM
Erasmus University.
Le-Duc, T., & De Koster, R. (2005b). Determining the optimal number of zones in a pick-and-pack
order picking system. Netherlands: RSM Erasmus University.
Le-Duc, T., & De Koster, R. (2005a). Layout optimization for class-based storage strategy
wreahouses. In R. De Koster, & W. Delfmann, Supply Chain Management - European Perspectives
(pp. 191-214). Copenhagen: CBS Press.
Le-Duc, T., & De Koster, R. (2005c). Travel distance estimation and storage zone optimization in a 2-
block class-based storage strategy warehouse. International Journal of Production Research , 43 (17),
3561-3581.
Le-Duc, T., & De Koster, R. (2004). Travel distance estimation in a single-block ABC storage strategy
warehouse. In B. Fleischmann, & B. Klose, Distribution Logistics: Advanced Solutions to Practical
Problems (pp. 185-202). Berlin: Springer.
Lynch, D., Keller, S. B., & Ozment, J. (2000). The Effects of Logistics Capabilities and Strategy on
Firm Performance. Journal of Business Logistics , 21 (2), 47-67.
Makris, P., & Giakoumakis, I. (2003). k-Interchange heuristic as an optimization procedure for material
handling applications. Applied Mathematical Modelling , 27, 345-358.
Malmborg, C. (1995). Optimization of Cubic-per-Order Index layouts with zoning constraints.
International Journal of Production Research , 33 (2), 465-482.
Malmborg, C. (1996). Storage assignment policy tradeoffs. International Journal of Production
Research , 34 (2), 363-378.
Malmborg, C., & Bhaskaran, K. (1990). A revised proof of optimality for the cube-per-order index rule
for the stored item location. Applied Mathematical Modelling , 14, 87-95.
Malmborg, C., & Bhaskaran, K. (1987). On the optimality of the cube per order index for conventional
warehouses with dual command cycles. Material Flow , 4, 169-175.
Malmborg, C., & Bhaskaran, K. (1989). Optimal storage assignment policies for multiaddress
warehousing systems. IEEE Transactions on Systems, Man and Cybernetics , 19 (1), 197-204.
Mellema, P., & Smith, C. (1988). Simulation analysis of narrow-aisle order selection systems.
Proceedings of the 1988 Winter Simulation Conference, (pp. 597-602).
Meller, R. (1997). Optimal order-to-lane assignments in an order accumulation/sortation system. IIE
Transactions , 29 (4), 293-301.
Mentzer, J. T., & Williams, L. R. (2001). The Role of Logistics Leverage in Marketing Strategy. Journal
of Marketing Channels , 8 (3-4), 29-47.
Mentzer, J. T., Flint, D., & Hult, T. (2001). Logistics Service Quality as a Segment-Customized
Process. Journal of Marketing , 65 (4), 82-105.

!
! 101
Min, H., & Zhou, G. (2002). Supply chain modeling: past, present and future. Computers & Industrial
Engineering , 43, 231-249.
Morash, E. E., Droge, C. L., & Vickery, S. K. (1996). Strategic Logistics Capabilities for Competitive
Advantage and Firm Success. Journal of Business Logistics , 17 (1), 1-22.
Muppani, V. R., & Adil, G. K. (2008a). A branch and bound algorithm for class based storage location
assignment. European Journal of Operational Research , 189, 492-507.
Muppani, V. R., & Adil, G. K. (2008b). Efficient formation of storage classes for warehouse storage
location assignment: A simulated annealing approach. Omega , 36, 609-618.
Olavarrieta, S., & Ellinger, A. E. (1997). Resource-Based Theory and Strategic Logistics Research.
International Journal of Physical Distribution and Logistics Management , 27 (9/10), 559-587.
Pan, C., & Liu, S. (1995). A compative study of order batching agorithms. Omega International Journal
of Management Science , 23 (6), 691-700.
Papageorgiou, L. G. (2009). Supply chain optimisation for the process industries: Advances and
opportunities . Computers and Chemical Engineering , 33, 1931–1938.
Park, Y., & Webster, D. (1989). Design of class based storage racks for minimizing travel time in a
three dimensional storage system. International Journal of Production Research , 27 (9), 1589-1601.
Petersen, C. (1997). An evaluation of order picking routing policies. International Journal of Operations
& Production Management , 17 (11), 1098-1111.
Petersen, C. (2002). Considerations in order picking zone configuration. International Journal of
Operations & Production Managment , 27 (7), 793-805.
Petersen, C. (1999). The impact of routing and storage policies on warehouse efficiency. International
Journal of Operations & Production Management , 19 (10), 1053-1064.
Petersen, C., & Aese, G. (2004). A comparison of picking, storage, and routing policies in manual
order picking. International Journal of Production Economics , 92, 11-19.
Petersen, C., & Schmenner, R. (1999). An evaluation of routing and volume-based storage policies in
an order picking operation. Decision Sciences , 30 (2), 481-501.
Petersen, C., Aese, G., & Heiser, D. (2004). Improving order-picking performance through the
implementation of class-based storage. International Journal of Physical Distribution & Logistics
Management , 34 (7), 534-544.
Poon, T., Choy, K., Chow, H. K., Lau, H. C., Chan, F. T., & Ho, K. (2009). A RFID case-based logistics
resource management system for managing order-picking operations in warehouses. Expert Systems
with Applications , 36, 8277-8301 .
Ratliff, H., & Rosenthal, A. (1983). Orderpicking in a rectagular warehouse. A solvable case of the
travelling salesman problem. Operations Research , 31 (3), 507-521.

!
!102
Razzaque, M., & Sheng, C. (1998). Outsoursing of logistics functions: a literature survey. International
Journal of Physical Distribution & Logistics Management , 28, 89-107.
Reis, V. (2010). Development of Cargo Business in Combination Airlines: Strategy and Instrument,
Phd Thesis. Lisbon: Universidade Técnica de Lisboa.
Rogers, D. S., & Tibben-Lembke, R. S. (1998). Going Backwards: Reverse Logistics Trends and
Practices. Reno, Nevada: Reverse Logistics Executive Council.
Roodbergen, K. (2001). Layout and routing methods for warehouses. Ph.D. Thesis. Netherlands: RSM
Erasmus University.
Roodbergen, K. (2005). Storage assignment policies for warehouses with multiple cross aisles. In R.
Meller, M. Ogle, B. Peters, G. Taylor, & J. Usher, Progress in Material Handling Research (pp. 541-
560). Progress in Material Handling Research.
Roodbergen, K., & De Koster, R. (2001a). Routing methods for warehouses with multiple cross aisles.
International Journal of Production Research , 39 (9), 1865-1883.
Roodbergen, K., & De Koster, R. (2001b). Routing order pickers in a warehouse with middle aisle.
European Journal of Operational Research , 133, 32-43.
Rosenblatt, M., & Roll, Y. (1988). Warehouse capacity in a stochastic environment. International
Journal of Production Research , 26 (12), 1847-1851.
Rosenblatt, M., & Roll, Y. (1984). Warehouse design with storage policy considerations. International
Journal of Production Research , 22 (5), 809-821.
Rosenwein, M. (1994). An application of cluster analysis to the problem of locating items within a
warehouse. IIE Transactions , 26 (1), 101-103.
Rouwenhorst, B., Reuter, B., Stockrahm, V., Houtum, G. v., Mantel, R., & Zijm, W. (2000). Warehouse
design and control: Framework and literature review. European Journal of Operational Research ,
122, 515-533.
Ruben, R. A., & Jacobs, F. R. (1999). Batch Construction Heuristics and Storage Assignment
Strategies for Walk/Ride and Pick Systems . Management Science , 45, 575-596.
Ruben, R., & Jacobs, F. (1999). Batch construction heuristics and storage assignment strategics for
walk/ride and picking systems. Management Science , 45 (4), 575-596.
Rushton, A., Croucher, P., & Baker, P. (2006). The Handbook of Logistics and Distribution
Management (Third Edition ed.). Great Britain: Kogan Page.
Russell, M., & Meller, R. (2003). Cost and throughput modelling of manual and automated order
fulfilment systems. IIE Transactions , 35 (7), 589-603.
Simchi-Levi, D., Kaminsky, P., & Simchi-Levi, E. (2007). Designing and Managing the Supply Chain:
Concepts, Strategies, and Case Studies (Third Edition ed.). New York: McGraw-Hill.
Speaker, R. (1975). Bulk order picking. Industrial Engineering , 7 (12), 14-18.

!
! 103
Tan, K. C. (2001). A framework of supply chain management literature. European Journal of
Purchasing & Supply Management , 39-48.
Tang, L., & Chew, E. (1997). Order picking systems: batching and storage assignment strategies.
Computer & Industrial Engineeering , 33 (3), 817-820.
Theys, C., Braysy, O., Dullaert, W., & Raa, B. (2010). Using a TSP heuristic for routing order pickers
in warehouses. European Journal of Operational Research , 200, 755-763.
Tompkins, J. A., White, J. A., Bozer, Y. A., & Tanchoco, J. (2003). Facilities Planning. New Jersey:
John Wiley & Sons.
Van den Berg, J., & Gademann, A. (2000). Simulation study of an automated storage/retrieval system.
International Journal of Production Research , 38, 1339-1356.
Van den Berg, J., Sharp, G., & Pochet, Y. (1998). Forward-reserve allocation in a warehouse with unit-
load replenishments. European Journal of Operational Research , 111, 98-113.
Varadarajan, R. (2009). Outsoursing: Think more expansively. Journal of Business Research , 62,
1165-1172.
Waters, D. (2003). Logistics: An Introduction to Supply Chain Management. Palgrave Macmillan.
Won, J., & Olafsson, S. (2005). Joint order batching and order picking in warehouse operations.
International Journal of Production Research , 43 (7), 1427-1442.
Yang, M. (1988). Analysis of optimization of class-based dedicated storage systems. Report, Material
Handling Research Center .
Yoon, C., & Sharp, G. (1995). Example application of the cognitive design procedure for an order pick
system: Case study. European Journal of Operational Research , 87, 223-246.
Yu, M., & De Koster, R. (2009). The impact of order batching and picking area zoning on order picking
system performance. European Journal of Operational Research , 198, 480-490.
Zhao, M., Droge, C., & Stank, T. P. (2001). The Effects of Logistics Capabilities on Firm Performance:
Costumer-Focused vs. Information-Focused Capabilities. Journal of Business Logitics , 22 (2), 91-108.

!
!104

!
! I.1
APPENDIX I – ADDITIONAL CASE STUDY CONSIDERATIONS
In this appendix the author aims to further present the case study. This appendix makes use of the
main work references. To that end a small review on the Luís Simões Group is presented followed by
a complete analysis of the Carregado 2 Logistic Operations Centre. This analysis covers the history of
C2, its facilities and finally the implemented processes.
I.1. THE LUÍS SIMÕES GROUP
The Luís Simões Group (LS) was established in Portugal in the forties. In 1948, Fernando Luís
Simões and Delfina Rosa Simões, parents of the current directors of Luís Simões, decided to buy the
first truck and start a business. In the late 50's, with the growth of construction in Lisbon and the
increased need for transportation, the business expanded (Grupo Luís Simões, 2010).
In 1968, Transportes Luís Simões is founded and five years later the couple's three children - Lionel,
José Luis and Jorge - assume the management of the company. With the access of Portugal and
Spain to the EEC in 1986, Transportes Luís Simões start an approach to the Spanish market (Grupo
Luís Simões, 2010).
In 2001, with the acquisition of a Spanish third-party logistics provider, Luis Simões defines a
development strategy focusing in logistics and the Iberian Peninsula. In recent years the company
continues to consolidate its market share in Portugal and to grow in Spain with the goal of being a
leading operator in the Iberian Peninsula, a market that is still seen as a priority (Grupo Luís Simões,
2010).
Luís Simões Group consists of 10 legally independent companies and grouped into three areas of
business: transportation, logistics and diversification. Transportation represents 60% of turnover,
logistics 35% and diversification the remaining 5% (Grupo Luís Simões, 2010).
In 2008, Luís Simões achieved consolidated sales of 172 million euros with the core business
activities (logistics and transportation) recording an increase of 1.1 %. The LS is the leading road
haulage company in Portugal and the market leader in road flows on the Iberian Peninsula. Provides
integrated logistics services in approximately 250.000 m2 of warehouses and manages a fleet of 1988
vehicles with an average age of 2.5 years (Grupo Luís Simões, 2010).
The group employs about 1700 people distributed in the areas of insurance, equipment and support
services to the transport industry, distribution and logistics and property management (Fernandes,
2010).

!
!I.2
The LS has facilities in major cities across the Iberian Peninsula, as shown in Figure I.65, and will
continue the policy of implementing proprietary platforms in areas with significant growth in both
countries.
!Figure I.65 - Luís Simões Iberian network (source: Grupo Luís Simões, 2013).
The group has diversified its activities, entering new markets, expanding its operations nationally and
internationally, with clear business objectives, capable of great synergies and introducing innovative
solutions in distribution, mostly for clients operating in both markets: Portugal and Spain (Fernandes,
2010).
Luís Simões operates twenty logistics operations centres located all across the Iberian Peninsula. The
centres are essential to the group logistics operations,
I.2. THE CARREGADO 2 LOGISTIC OPERATIONS CENTRE
The third-party logistics market is a mature and competitive market where the established players
compete in a levelheaded way, with similar facilities and operational resources. As a market leader is
essential for LS to search for solutions that increase the competitive edge and further differentiate the
company from other competitors, thus pushing forward the market and reinforcing the importance of
third-party logistics providers in the supply chain (Fernandes, 2010).
The Carregado 2 logistics operation centre (COL C2) project arises from this necessity.
Cross-Docking Platforms !
Head Office !
Insurances
Technical Assistence Centers
Transport Operations Centers
Logistics Operations Centers (COL’s)

!
! I.3
The initial goal for this project was to implement a multi-client and multi-product warehouse here all
the operations where the human resources don’t add value would be automated. It was also needed
to maintain the flexibility of a conventional warehouse and integrate the automatic operations with the
remaining manual operations (Fernandes, 2010).
So the objective was to automate all the movements of the storage units, pallets, but keep
conventional operations like picking. Furthermore it was necessary to seek a large storage capacity
minimizing the construction area, hence respecting a sustainable development (Fernandes, 2010).
The project aimed to achieve the following objectives:
• Increase of storage capacity by 200%, with only 25% more occupied ground;
• Create facilities to accommodate new clients with needs for major flows in a daily basis;
• Reduce labor;
• Increase productivity in reception and dispatch operations;
• Reduce the unit cost of the internal logistic activities by 15-20%;
• Increased inventory control;
• Further distinguish from the competitors;
• Innovate in the supply chain, searching for gains with the use of automatism in a third-party
logistics provider warehouse.
PROJECT MILESTONES
The project was launched in 2005, with an analysis of the existing flows and projections for 2010. In
this phase clear objectives were defined and shared with consulting firms contacted to support in the
design. Hanhart Logistics was the chosen consultant, after evaluating various proposals. This was a
period of internal studies and reflection to define a strategy for the future (Fernandes, 2010).
In 2006 various possibilities were studied with support from consulting. To study and gather
information on automated processes and acquaintance with the European reality in this matter visits
were conducted to many proven solutions in Germany, Spain, Switzerland, France and Italy. From
these observations and exploring innovative ideas a new concept of COL was defined. After the
analysis of countless possibilities the layout was selected (Fernandes, 2010).
2007 saw the analysis and design of the Warehouse Management System (WMS, SGA in
Portuguese) and his interrelation with the control systems that manage the movements of mechanic
equipment, like the conveyors and chariots. Also the design and conception of the mechanic systems
was decided. February marks the beginning of the construction of the warehouse building.

!
!I.4
Throughout January 2008 the installation of the automated systems started, being finished in June.
These systems represent an innovative solution, based in prototypes design exclusively for this project
and recurring to unique concepts studied to fulfil the settled objectives. Meanwhile the building
construction was complete in April. July saw the beginning of the test phase with October marking the
first client (Fernandes, 2010).
In 2009 the project was consolidating and the facilities were 60% occupied, with the influx of new
clients, acquired in synergy with the existing facilities, and the automated system was with an
availability and movement capability of 92%. Improvements and corrections were underway to
enhance the performance, mechanical and system wide (Fernandes, 2010).
By 2010 the warehouse was at 85% of full capacity and the automated system were fully operational
(Fernandes, 2010).
Figure I.66 summarizes the project milestones.
!
Figure I.66 – Project Milestones (adapted from Fernandes, 2010)
CONCEPT/IMPLEMENTATION OF THE PROJECT
Aiming to further consolidate its business and continuing a strategy of constant development, LS
invests in new facilities and new solutions, to keep growing in the long run. In this context a plot of
20,000 square meters was acquired at Carregado, contiguous to facilities existing since 1997.
• Lauch!of!the!project!• Hanhart!Logistics!was!the!consultant!chosen!to!support!the!design!2005!• Visits!to!automated!facilities!across!Europe!• De>initions!of!the!new!COL!concept!and!layout!2006!• Design!and!conception!of!the!mechanic!systems!!• Beginning!of!the!construction!of!the!bulding,!in!February!2007!• Installation!of!the!automated!systems!• Building!construction!completed!• First!client!in!October!2008!• Facilities!60%!occupied!• Automated!system!with!a!capability!of!92%!2009!• Facilities!85%!occupied!• Automated!system!fully!operational!2010!

!
! I.5
The challenge set by the group administration was to find a solution that would allow a construction of
a 20,000m2 warehouse to respond and enhance to the business growth in the fowling 5 years. This
solution should also increase productivity and reduce costs, benefiting the company and the clients,
along with maximizing the rigor and reliability of the operation. Faced with this challenge a project was
undertaken.
In a first phase the flow of movements at the start of the project and the flow of movements to reach
within the next 5 years (2010) were calculated, and the daily flow distribution was analysed. Likewise
the unitary cost, at the start of the project, for pallet reception, pallet storage, produced pallet and
pallet expedition were appraised. It was also defined the clients and market segments to collect in the
future and the goals to accomplish with the project.
The second phase included approaching consulting firms to enquiry their interest in the project, so that
their knowledge could help find a solution that accomplishes all the project objectives. This enquiry
also targeted companies with know-how in automated processes, since that was a new subject to LS.
The following firms where contacted: Logistema, Iberlog, Hanhart Logistics, Cap Gemini and Deloitte.
The consulting firms prepared proposals which included an operational solution and financial and
profitability analysis. One proposal stood above the others, from Hanhart Logistics, presenting a
variety of solutions, innovative and focused on optimization of the flows and resources, therefore
approaching the project objectives.
In a third phase and after choosing Hanhart as the partner for this project, the work proceeded with the
fine-tuning of the solutions. In this stage, and since some objectives were still not met, a sequence of
visits across Europe was undertaken, with Hanhart, to identify Europe’s state of the art in automated
warehouses.
During this visits various solutions were viewed from which withdrew the conclusion that automated
warehouses lost operational flexibility. This was a by-product of the high level of rigor and
standardization required for its operation and the existence of plentiful restricted access areas, for
safety and space concerns, since the automated mechanisms moved over rails fixed to the ground.
As a result of these visits it became clear that the solution should be an automatic warehouse but with
the flexibility of a conventional warehouse, where the area for preparing orders could stay under the
automated storage area and the robots should be suspended.
With the solution finalized, the design was made based on an overhead crane, commonly called a
bridge crane, having presented the idea and specifications to Efacec as well as other suppliers of
automatisms in order to assess the implementation and budgeting.
In this phase was carried out all the design work of the layout, calculation of shelving capacity,
calculations of loads, shelving specifications, etc.
As for the fourth phase, the building construction had the duration of thirteen months, being conducted
by an inner LS team with the support from an external engineering team that supervised and followed
the work made by the hired contractors.
!
!I.6
The automatic system implementation was carried out in eighteen months, including mechanical and
operational tests.
These tests had the duration of approximately four months, and allowed the real operation to start in a
organized way and with no interruptions by mechanical or informatics issues.
Finally, the fifth phase included physical tests, in six steps.
The first stage of testing consisted of two weeks of movements with only empty pallets. An operational
team dedicated to the project and supported by the project team, with a total of eight collaborators of
LS and six from Efacec, carried out entrance, exit and restock movements exhaustively, evaluating
difficulties and correcting anomalies or inconsistencies.
In this stage the objective was to make an initial evaluation of the system functioning and to detect any
mechanical problems.
The second stage of testing saw four weeks of pallet movement with products without any market
value, testing and trying to detect SGA movement deficiencies.
In the third stage of testing, of two weeks, the warehouse was used for the real operation using a
range of products of one client that only works with a complete pallet and only for one receiver. In this
phase the convectional warehouse adjacent to the C2 was ready to act as a failsafe in case of
problems with the automatic operations.
The forth stage consisted of approximately two weeks, continuing the previous stage testing but now
with all ranges of products and all the receivers, although still only by the pallet.
Fifth stage testing consisted of two weeks where a receiver with delivers that require picking was
included, finalizing with this step the testing of all the different operations.
The sixth and final stage of testing, of approximately two weeks, saw the test client fully operating in
the automatic warehouse.
Note that the above information was adapted from the work of António Fernades (2010).
FACILITIES
The Carregado 2 Logistics operation center (Figure I.67) features some state-of-the-art facilities and
equipment. The facilities can be divided in two brands: the storage area and the peripherals that
function as the interface between the storage area and the exterior. The technical information
presented in this section is retrieved from observation, interviews and the work of António Fernades
(2010).

!
! I.7
Figure I.67 – Illustration of the Carregado 2 COL (adapted from Fernandes, 2010).
STORAGE AREA
The storage area occupies the majority of the warehouse and basically includes the shelf and the
automated cranes responsible for moving the pallets.
SHELF
The shelf (Figure I.68) was designed for the proposed automated crane and has a capacity for 55432
stored pallets in sixteen double depth corridors and 3700 picking as well as inventory positions, on the
ground floor.
Stored pallets are divided into four types, according to their height (Table I.20).
Table I.20 - Pallet types.
Pallet type Maximum height (mm) 1 1400 2 1800 3 2000 4 2400
By default the shelves have seven levels and can store pallets of type one, two or three. The first
through third shelves and the fourteenth through sixteenth shelves have only six levels but can store
pallets of type four.

!
!I.8
The storage spaces are mainly assigned to different clients or types of products, with the dimension of
each assigned zone being adjusted dynamically to the current needs.
This warehouse houses food and hygiene products. Rows one through eleven are occupied by
hygiene products and food products take rows twelve through sixteen.
AUTOMATED CRANE (CPA)
The warehouse has sixteen automated cranes, dubbed CPAs (from the Portuguese Carro ponte de
armazenagem automática). The CPAs (Figure I.68) are equipped with double depth forks, use infrared
communication and use a bar code system for horizontal and vertical codification. The CPAs
characteristics are in Table I.21.
Table I.21 – CPAs fundamental characteristics.
Translation speed in a straight line (m/s) 4.0 Elevation speed (m/s) 0.6
Fork speed (m/s) 0.5/1.0 Load capacity (kg) 1000
Figure I.68 – CPA and shelf (Source: António Fernandes,2010)
This solution based on an overhead crane is used because it was necessary to have the ground floor
free for picking purposes.
The CPA cadence was calculated according to the regulation FEM 9851. Two points were considered,
P1 and P2. P1 is on quota (1/5L, 2/3H) and P2 in (2/3L, 1/5H) where L and H are length and height of
the shelf, respectively. Each CPA guaranties a cadence of 44 simple cycles and 26 combined cycles
per hour.

!
! I.9
The number of simple cycles is calculated from the mean value of loading cycles for a pallet in the
entrance, unloading in P1 or P2 and return to the entrance. The number of combined cycles is
obtained from the time to load a pallet in the entrance, unload on P1, load on P2 and unload at the
exit.
The number of pallets moved by the sixteen CPAs is:
44×16 = 704 !"##$%& ℎ!"#
Equation I.1 – Pallets moved in simple cycles.
2×26×16 = 832 !"##$%& ℎ!"#
Equation I.2 – Pallets moved in combined cycles.
The CPAs can perform three types of movements: expedition movements, transfer movements and
push away movements. Expedition movements move pallets from storage to the cargo preparation
lines. Transfer movements move pallets from storage to picking or inventory positions. Push away
movements move away pallets that are in front of pallets that are required to move.
As for security equipment the CPAs feature an array of devices in place to assure that a movement
can be fulfilled without endangering products, equipment or workers.
To verify if its path is unobstructed a CPA uses a SICK S3000 safety laser scanner. A servomotor
controls the position of the forks. Furthermore photoelectric sensors confirm that the cargo is properly
positioned (Figure I.69) as well as if pallet height is in accordance. If an anomaly triggers the safety
laser scanner or the photoelectric sensors the CPA stops for security reasons and maintenance is
automatically notified.
Figure I.69 – CPA cargo bed (note the photoelectric sensors in the lower corners).

!
!I.10
Also installed on the warehouse are magnetic sensors and profiles at the extremities, destined to
trigger the security switches of the CPA. They guaranty the sequential shutdown of high speeds,
medium speeds and finally bring to a halt the machine.
For the security of the personal working in the ground floor, illuminating signals are installed, one per
three ground spots, to warn the operator that one of those three spots is going to be accessed by the
CPA for a unload movement. Note that the CPA platform will never go below the second shelf level
(first level of storage) during the translation movement. The movement between de first and second
shelf levels will be carried out with the CPA stopped and positioned in the place where the movement
will occur.
The positions in the shelf are described, for each CPA, by four coordinates: X, Y, Z and P. X has
values from one to one hundred and fifty-six and represent the longitudinal position. Y varies from one
to seven and indicates the level. Z and P are either one or two and represent left or right and the depth
in the double shelves respectively.
PERIPHERALS
The peripherals include equipment that function as the interface between the storage area and the
exterior. This equipment is used for the entry and exit of producs to the storage area.
ENTRANCE STATIONS FOR RECEPTION
The warehouse features four entrance stations (Figure I.70) for pallets, each one including two
entrance points that merge into one entrance line and one rejection line.
Figure I.70 – Entrance station (Source: António Fernandes, 2010).

!
! I.11
The two entrance points are constituted by:
• A motorized chain transporter equipped with protection against forklift
• A motorized chain transporter equipped with a weighting system for maximum weight control
• Two motorized chain transporters
• An orthogonal transfer table
• A motorized rolls transporter featuring:
o Control of pallet dimensions
o A verification and control system for the wood pallet itself
o An orthogonal transfer table
The rejection line for unfit pallets is constituted by:
• Three motorized chain transporters
• Protection against forklifts at the pallets exit point
• A synoptic screen with indication for the rejection motive
The entrance line consists in:
• Seven motorized chain transporters
• Two orthogonal transfer tables
CHARIOTS
The warehouse has four chariots (Figure I.71), with capacity for two pallets each (characteristics in
Table I.22).
Table I.22 – Chariot fundamental characteristics.
Translation speed (m/s) 3.0 Aceleration (m/s2) 1.0
Cargo capacity (kg) 1000+1000

!
!I.12
Figure I.71 – Chariot (Source: António Fernandes, 2010).
These chariots share the same rail and so they have the ability to transfer pallets to the next chariot to
fulfil transport needs across the entire warehouse. To transfer pallets from one chariot to the next
selected expedition lines are used to temporally store the pallets. Note that it is possible for a chariot
to move outside is area if the rail is empty.
For security reasons photoelectric sensors confirm that the cargo is properly positioned. Also a fence
seals the access to the chariots line and the corresponding access doors for maintenance are
equipped with security locks.
As for the cadence, each chariot moves 193 pallets/hour. This number was obtained assuming a peak
hour between 10 and 11 a.m. with the following values:
• Reception entrance with 330 pallets/h
• Picking entrance with 190 pallets/h
• Exit for expedition of 218 pallets/h
• Each chariot will do ¼ of these movements
For this situation it was considered that the chariot always loads two pallets simultaneously at the
entrances and unload one by one in the interface conveyers and load pallets one by one at the exit
and unloads two simultaneously at the cargo preparation lines.

!
! I.13
ENTRANCE AND EXIT INTERFACE TRANSPORTERS
The warehouse includes sixteen entrance interface transporters and sixteen exit interface
transporters, each one constituted by three motorized chain transporters. These interfaces function as
a buffer between the chariots and the CPAs and are locate at each side of the CPA.
Figure I.72 shows a CPA picking a pallet from his entrance interface transporter and Figure I.73
displays a CPA delivering a pallet to his exit interface transporter.
Figure I.72 – CPA picking a pallet from his entrance interface transporter.
Figure I.73 – CPA delivering a pallet to his exit interface transporter.
PRODUCED PALLETS ENTRANCE STATIONS
Four produced pallets entrance stations (Figure I.74) are available, each one constituted by:
• A motorized roll transporter equipped with protection against forklifts
• A Strapex wrapping machine (Figure I.75), Tosa 101 model, equipped with roll transporter
• A rotating table with orthogonal transfer
• A motorized chain transporter containing a gauge for cargo dimension control
• A motorized chain transporter where is installed:
o A weighting system for maximum weight control
o An orthogonal transfer table
By default station one and two are used for produced pallets of hygiene products and stations three
and four for the produced pallets of food products.

!
!I.14
Produced pallets have a maximum height of 1800mm, witch is controlled by the gauge.
Figure I.74 – Produced pallets entrance station.
Figure I.75 – Wrapping machine in action.
REJECTION STATION FOR UNFIT PRODUCED PALLETS
Also present in the warehouse are four rejection stations for unfit produced pallets (Figure I.76), each
one constituted by:
• Two motorized chain transporters
• Protection against forklifts at the pallets exit point
• A synoptic screen with indication for the rejection motive (Figure I.76)
Figure I.76 – Rejection station (note the synoptic screen).

!
! I.15
CARGO PREPARATION LINES
To prepare cargo for expedition there are forty-one cargo preparation lines with 20.5 meters and
capacity for twenty-two pallets in each one. Each line features:
• A motorized chain transporter with capacity for one interface pallet with the chariots
• Five motorized chain transporters with capacity for four pallets in each one.
• A motorized chain transporter with capacity for one pallet equipped with protection against the
forklifts for the pallets exit
MAINTENANCE
With the importance of the mechanic elements to this warehouse performance, maintenance is
executed around the clock by three separated shifts that cover all twenty-four hours of a day.
Preventive maintenance is the key to assured a good performance and so a CPA is fully maintained
every eight weeks and a chariot every two weeks.
Besides preventive maintenance, maintenance teams also attend to the failures (e.g. debris triggering
the CPA safety scanner or misplaced pallets triggering the photoelectric sensors) and breakdowns
(i.e. mechanical problems) that occur during operation.
COMMENTS
From a reception and dispatch point of view the C2 can be divided in four zones. Each zone features
five loading docks, an entrance station for reception and is served by four CPAs. Zone number one
has eleven cargo preparation lines, zone two has ten cargo preparation lines and finally zone three
and four have both nine cargo preparation lines. From a picking point of view each zone has one
entrance station for produced pallets and the complementary rejection station for unfit pallets.
The C2 features a warehouse management system, named Efastart and design by Efacec, which
controls the automated operations. This warehouse management system works along side with
Geode400, another management software, which manages the other LS facilities. LS clients also
interact only with Geode400. The interaction interface is updated every thirty minutes.

!
!I.16
Since there are no barcode readers either in the conveyors, CPAs, chariots or storage places the
barcodes are read only by the workers with their portable scanners, during reception, dispatch or
picking. So in this warehouse a physical dimension and a logical dimension coexist.
The physical dimension retrieves information from photoelectric sensors that detect objects in the
transporters, without identify them. The logical dimension tracks the expected movement of the pallets
within the warehouse.
All the automated systems require physical and logical information to perform a movement. When both
are not present the mechanical system where the error occurred automatically stops and signalizes
maintenance and management to restore balance between the logical and physical dimensions.
The storage location for each pallet is determined by the WMS system in three stages. At entrance the
pallet is given four possible CPA destinations. On entry on the chariot it is decided the best of those
four positions. Upon arrival at the chosen CPA the final storage position is decided and the pallet is
moved to storage. This way the chances of all the pallets of one product being in the same CPA zone
and being inaccessible in the case of that CPA malfunction is minimized.
By default the all movements have normal priority, except for inventory that has less priority. The
priorities can be manually controlled to respond to emergencies.
PROCESSES
In Carregado 2 it is possible to identify six separated processes, all coexisting in the warehouse. A
complete flowchart of Carregado 2 processes is on Appendix II, and a simplified version can be seen
in Figure I.77. Note that the full lines represent the transfer of goods and the non-continuous line
represents the transfer of information.

!
! I.17
Figure I.77 – Flowchart of the Carregado 2 processes.

!
!I.18
Some of these processes are standard for any warehouses like reception and dispatch. The automatic
handling, which serves as a bridge between reception and dispatch, is a specific process of an
automated warehouse like Carregado 2, distinguishing it from standard warehouses.
Processes like co-packing and picking allowing for value-added services to the clients. Finally the
warehouse also includes the reverse logistics process.
Besides this six processes there is also a support process, the inventory. This is a process essential
for the control of any warehouse and permits contact with the stored products.
All this processes are explained in detail in the subsequent sections.
RECEPTION
The reception processes (Figure I.78) is responsible for the acceptance and processing of the
incoming wares. Note that this process includes not only the arrival of the actual products but also the
beforehand arrival of the information. The C2 COL receives forty to fifty trucks each day.
Figure I.78 – Flowchart of the reception process.
The reception process begins with the influx of information on the incoming truck and goods carried.
With this information a dock is selected and allocated at the assured time.
Truck&Arrival
Pallet&or&bulk? Unload&pallets&to&entrance&stationPallet
Build&pallets
Bulk
DockingProducts&in&perfect&
condition?
No
Yes
Fix&pallet
Truck&and&goods&arrival&information
Dock&selection&and&allocation
Unwanted

!
! I.19
If an unscheduled trucks arrives it has to wait until all the scheduled trucks go through the reception
process before being unload. Unscheduled trucks can be up to 20% of the total received trucks each
day, therefore presenting a challenge for the reception teams.
Upon arrival, the truck filled with supplies docks in the allocated space and the unloading begins.
The majority of the cargo received is already in pallets. These pallets are moved, using a forklift, from
the cargo bed to the allocated entrance station (which includes two entrance points and a rejection
line). While moving the pallets, workers use their portable scanners to read the barcodes. If a pallet
does not have a barcode then one is printed and placed by the worker unloading it.
If the pallet is not in accordance it is moved to a rejection line. The teams responsible for the reception
process keep a close eye on the rejection lines and fix the rejected pallets so that they could be
inserted back in an entrance point.
If the workers, while unloading the pallet, spot a problem the pallet is fixed before being transferred to
the entrance point.
Particular clients send their cargo packed with the right dimensions but missing the actual pallet. In
these cases a special fork is installed on the forklift to move the products to a pallet. From there on the
reception proceeds as usual.
Despite the fact that the majority of the cargo arrives in pallets, some clients send their products to the
warehouse as bulk. This creates a setback since the automated mechanisms in C2, in fashion with
lack of adaptability characteristic of an automated system, can only transport and store pallets. So
when the products arrive individually it is necessary to arrange them in pallets (Figure I.79), so they
can proceed through the reception operation.
Figure I.79 – Flowchart of the build pallets event.
Build&pallets
Arrival'of'bulk'products
Large'or'Small'products?
Move'a'pallet'to'the'cargo'bed
Large
With'a'portable'conveyor,'unload'
the'truckSmall Arrange'the'
products'in'a'pallet
Arrange'the'products'in'a'pallet
This'process'is'repeated'until'all'of'the'cargo'is'handled
Protects'the'produced'pallet'
with'film'and'label'it
Move'the'pallet'to'entrance'station

!
!I.20
The different sizes of products force some difference in the approach to produce a pallet. When the
bulk products are small a portable conveyor is used to move products from the truck to the warehouse
bay were the products are staked in a pallet. With larger products the pallet is produced in the truck
bay. This sub-process employs teams of three workers.
When the stacked products on the pallet have the desired dimensions the pallet is wrapped with film
and labeled. Then a forklift moves the finished pallet to the assign entrance point and the reception
operation is completed.
Through all the reception process if products in faulty condition are detected they are transferred to
the reverse logistics process.
PICKING
The picking (Figure I.80) is a very important process in C2. Being an important service to the LS
clients, the C2 was specifically designed to support picking. This was a challenge since labour
intensive processes, like the picking-to-parts system in place, do not easily conjugate with automated
facilities. The outcome was a picking area that consists in corridors in the ground floor, below the
storage shelves, and is served by the CPAs that operate between the corridors.
Figure I.80 – Flowchart of the picking process.
The picking event (Figure I.81) is triggered by the influx of orders containing pallets with mixed
products. This pallets need to be produced by a picker. Once the picking pallets are produced they are
stored in the warehouse, in a buffer zone. Their dispatch is then processed normally, as if they were
any other storage pallets.
Picking
Mixed&products
Move&to&produced&pallets&entrance&
station
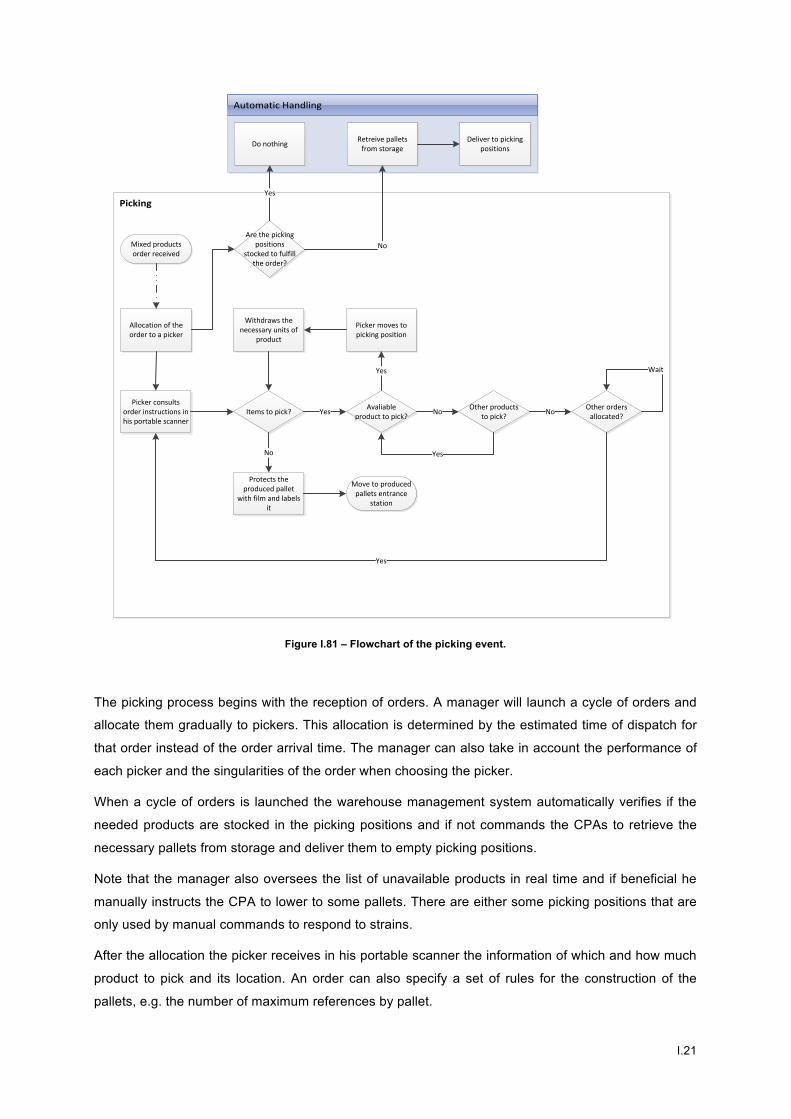
!
! I.21
Figure I.81 – Flowchart of the picking event.
The picking process begins with the reception of orders. A manager will launch a cycle of orders and
allocate them gradually to pickers. This allocation is determined by the estimated time of dispatch for
that order instead of the order arrival time. The manager can also take in account the performance of
each picker and the singularities of the order when choosing the picker.
When a cycle of orders is launched the warehouse management system automatically verifies if the
needed products are stocked in the picking positions and if not commands the CPAs to retrieve the
necessary pallets from storage and deliver them to empty picking positions.
Note that the manager also oversees the list of unavailable products in real time and if beneficial he
manually instructs the CPA to lower to some pallets. There are either some picking positions that are
only used by manual commands to respond to strains.
After the allocation the picker receives in his portable scanner the information of which and how much
product to pick and its location. An order can also specify a set of rules for the construction of the
pallets, e.g. the number of maximum references by pallet.
Picking
Automatic)Handling
Allocation)of)the)order)to)a)picker
Mixed)products)order)received
Picker)consults)order)instructions)in)his)portable)scanner
Are)the)picking)positions)
stocked)to)fulfill)the)order?
Retreive)pallets)from)storage
No
Protects)the)produced)pallet)
with)film)and)labels)it
Move)to)produced)pallets)entrance)
station
Deliver)to)picking)positionsDo)nothing
Yes
Items)to)pick?
No
Avaliable)product)to)pick?Yes
Picker)moves)to)picking)position
Yes
Withdraws)the)necessary)units)of)
product
Other)products)to)pick?No
Yes
Other)orders)allocated?No
Wait
Yes

!
!I.22
Using a forklift, the picker goes to the indicated picking position, uses the portable scanner to read the
position and the product bar codes and retrieves the necessary units of that product.
For control proposes the picker is required to count the items of product left at each picking position
and insert the data in the scanner. This reassures that the picker retrieves the right quantity of
products at each position. To facilitate this task the management team inputs in the WMS the logistic
data for each product reference, allowing for example for the picker to count rows instead of individual
products. When the picker miscounts the units of product left three times and locks the portable
scanner the manager is required to intervene.
Next the picker goes to the following picking position and repeats the same steps. This is repeated
until the order is completed.
If a product is not available for picking in any of the picking position the picker skips this particular
product and proceeds with the rest of the order as usual. When the automated mechanism finishes
moving a pallet of the depleted product from storage to a picking position the information of the picking
location where the product is now available will be shown in the picker’s portable scanner.
Note that if one or more products are not available and the rest of the order is already complete the
picker will put down the incomplete produced pallet, label it for control proposes, and start a new
order. He will them complete the standby order when the missing product or products are restocked.
When a produced pallet is complete it is protected with film. Finally it is moved to an produced pallets
entrance station and labelled. Alternatively, and if possible, the picker can request the automatic
filming machine to film the pallet after being deposited in the conveyor. This process is repeated until
all products are picked in accordance with the order.
If the produced pallet is reject it will be moved by chariot to the corresponding rejection line. The picker
will then be warned about it in is portable scanner and will retrieve the pallet from the rejection line and
fix it when possible.
Due to security reasons the pallets on picking positions cannot be directly picked by the CPA and
moved back to storage. So it is the picker responsibility to retrieve the pallets from the picking position
when they empty them, so that the place is available for another pallet.
To make sure that picking positions are not occupied for long periods of time by a less requested
product a daily review on the picking stock is made and pallets of products witch do not have a
demand are filmed and moved to an produced pallets entrance station to be stored again. This activity
is performed during periods of the day with low picking workload.
DISPATCH
The dispatch process can be divided in two parts. One referred as ordering (Figure I.82) and another
referred as loading (Figure I.83).

!
! I.23
Figure I.82 – Flowchart of dispatch (ordering).
In the ordering part of this process the orders are received, electronically from the clients. This order
could comprise full pallets, i.e. pallets of only one product, or pallets of mixed products.
If an order consists of full pallets the warehouse management system will automatically retrieve the
pallets from storage to cargo preparation lines two hours before the dispatch time. Alternatively an
operator can command the retrieving from storage time and the cargo preparation lines selection.
On the other hand if an order contains pallets of mixed products a picking process is started.
Figure I.83 – Flowchart of dispatch (loading).
The loading consists in loading the truck and finally leaving the warehouse. To fulfil this task workers
in forklifts move the pallets from the cargo preparation lines to the cargo bed of the docked trailer. To
increase efficiency the dock chosen for the truck is as near as possible of the cargo preparation line.
When the loading is finalized the truck leaves the warehouse dock. The C2 COL dispatches seventy to
seventy-five trucks each day.
AUTOMATIC HANDLING
The automatic handling process (Figure I.84) consists in the automated movement of pallets to and
from storage. This process is fulfilled by an automated storage and retrieval system (AS/RS) that
works with the pallet as unit. No labour is involved in this process, making this a process that is
specific to automated warehouse like C2.
Orders Full)pallets)or)mixed)products? Full)pallets
Mixed)products
Load%truck Leave%warehouse

!
!I.24
Figure I.84 – Flowchart of the automatic handling process.
After receiving pallets, the automatic handling process starts with the checking of the pallets
dimensions in a gauge of the entrance station. The weight and the state of the wood pallet itself are
also verified. When checking the height of the pallet the WMS automatically classifies it in one of four
types, which will impact the storage location. If the pallet is in accordance then it is stored in the
warehouse shelves.
If the pallet is not in accordance then it is moved to the rejection line. Note that, in reception, there is
one rejection line serving every two entry conveyors. Some typical problems that cause rejection are
damage of the actual wood pallet or the misalignment of products in the pallet causing protrusions.
This verification is essential for security reason because if an unbalanced or damaged pallet would to
be stored it could trigger the CPA or chariot sensors while being moved, stopping that machine, or
even result in the falling of products while stored.
Likewise pallets produced in the internal picking process are also verified before being stored by the
automated mechanism in a buffer zone of the warehouse, while they wait for dispatch. In case of
rejection the pallet is moved, by chariot, to the rejection station for unfit produced pallets
corresponding to the produced pallets entrance station used.
Pallet Pallet&in&accordance? StoreYes
Moved&to&rejection&line
No
Retrieve)pallets)from)storageFull&pallets
Store&in&buffer
Matching&with&orders
Matching&with&orders
Pallet&in&accordance?
Moved&to&rejection&line
Yes
No

!
! I.25
Note that the size of this buffer zone is dynamically controlled to better serve the warehouse needs at
each moment. If the dispatch process for a picking order is already on the way then the automated
mechanism moves the pallets directly to the according cargo preparation line instead of storing them.
The automatic handling process includes also the retrieving of pallets from storage, to fulfil incoming
orders.
The store and retrieve events are further explained in Figure I.85 and Figure I.86 respectively.
Figure I.85 – Flowchart of the store event.
The store event initiates with the pallet at the end of an entrance station, already checked. In this
instance the pallet is transferred from the entrance line to a chariot, which can carry up to two pallets,
and moved to entrance interface transporter of the chosen CPA. Note that this can require more
transfers between the four chariots that operate in the warehouse. When the pallet is the end of the
entrance interface transporter the CPA picks the pallet and moves it to its storage location in the shelf.
Figure I.86 – Flowchart of the retrieve pallets from storage event.
Store
Pallet&at&the&end&of&an&entrance&station
CPA&picks&the&pallet
Chariot&picks&the&pallet
CPA&moves&pallet&to&its&storage&location Pallet&stored
Entrance&interface&in&the&reach&of&this&chariot?
Chariot&moves&the&pallet&to&the&
selected&entrance&interface
Yes
Pallet&is&transfered&to&the&following&
chariot
No
Retrieve'pallets'from'storage
Pallet&Stored CPA&picks&the&palletCPA&moves&the&pallet&to&its&exit&
interface
Final&position&in&the&reach&of&this&
chariot?
Chariot&moves&pallet&to&the&final&
positionYes
Pallet&is&transfered&to&the&following&
chariot
No
Unload&pallet&to&final&position
Chariot&picks&the&pallet

!
!I.26
The retrieve event is naturally similar to the store event, but in a reverse order.
The CPA picks the pallet and moves it to its exit interface transporter. A chariot then picks the pallet
from the end of the exit interface transporter and moves it to the final position. This final position can
be either a cargo preparation line, when dispatching an order, or an entrance interface transporter,
when restocking the picking products. Note that this can require more transfers between the four
chariots that operate in the warehouse.
CO-PACKING
The COL C2 also features co-packing (Figure I.87), in a dedicated space.
Figure I.87 – Flowchart of the co-packing process.
In this space specific staff bundles individual products together according to the costumer wishes and
labels the new product. The new products are then grouped into pallets and put into an exit conveyor
dedicated to the co-packing. This exit conveyor ends in the warehouse loading dock where the
products are transferred to a entrance station for reception, continuously if possible. At the end of
each day the co-packing entrances are accounted and balanced with the retrieved individual products.
Notice that the individual products used in the co-packing are sourced from the warehouse stock, via
inventory operations, and moved to the dedicated co-packing space via forklift. The co-packing area is
stocked once a day with products for the following day. This operation is executed between six p.m.
and eight a.m., when the workload of the other warehouse processes is low.
The material consumed in the co-packing operation, like boxes and packages, are sourced from the
nearby C1 COL.
Automatic)Handling
Co0packing)orders Individual)products)are)packed)togheter
Pallets)of)bundle)products)are)produced
Move)to)dedicated)co0packing)conveyor
Unload)pallets)to)entrance)station
Retreive)pallets)of)individual)products)
from)storage
Deliver)to)inventory)positions
Move)by)forklift)to)co0packing)area

!
! I.27
REVERSE LOGISTICS
The COL C2 also supports reverse logistics (Figure I.88), to deal with damage products or denied
delivers.
Figure I.88 – Flowchart of the reverse logistics process.
When delivered products are rejected they are brought back to the warehouse and stored back into
the storage position or stored in an area dedicated to unfit products, depending on the reason why the
delivery was rejected: unwanted products or unfit products.
Likewise if an unfit product is spotted in the reception process it is stored in the area for unfit products.
The outcome of the products stored is this area is determined by the client.
Note that within the warehouse products can also get damaged but that is a rare occurrence. The
damage can occur in the reception, picking or dispatch processes, turning them into unfit products.
These products are also moved to an unfit products area.
INVENTORY
Like in any other warehouse there is a need to support an inventory processes to inspect the stored
pallets. However the automated nature of the warehouse provides a different way to do the inventory.
When there is a need to inspect one or more pallets the manager commands the WMS that lowers
these pallets to dedicated inventory positions on the ground floor, adjacent to the picking positions.
Then the workers can inspect the pallets, now on the ground floor, and do as required.
Reception
Products.in.perfect.
condition?
Returned.products Store.in.the.unfit.products.area
No
Unwanted.or.unfit? Unfit Consult.client
Docking
Unwanted

!
!I.28
If after inventory the pallets are intended to return to storage they are transported by forklift to the
produced pallets entrance station.

!
! II.1
APPENDIX II – FLOWCHART OF CARREGADO 2 PROCESSES
Page II.3 presents a complete flowchart of Carregado 2 processes, in A3 paper size.

!
!II.2

Automatic Handling
Reception
Reverse Logistics
Dispatch (Loading)
Co-packing
Dispatch (Ordering)
Picking
Truck arrival Pallet or bulk? Unload pallets to entrance stationPalletDocking Pallet in
accordance? StoreYes
Moved to rejection line
No
Orders Full pallets or mixed products?
Retrieve pallets from storageFull pallets
Picking
Mixed products
Move to produced pallets entrance
station
Store in buffer
Matching with orders
Matching with orders
Load truck Leave warehouse
Products in perfect
condition?
Returned products Store in the unfit products area
No
Unwanted or unfit? Unfit
Unwanted
Consult client
Co-packing orders Individual products are packed togheter
Pallets of bundle products are
produced
Move to dedicated co-packing conveyor
Yes
Fix pallet
Build pallets
Bulk
Truck and goods arrival information
Dock selection and allocation
Pallet in accordance?
Moved to rejection line
Yes
No
Fix pallet
Unload pallets to entrance station
II.3

II.4

!
! III.1
APPENDIX III – SIMULATION MODEL
To facilitates access to the simulation model developed for this work, the model is available in the
folder “A.III – Picking Model” of the companion CD, inside the “Digital Appendices” folder.
The contents of the CD are also accessible in the following link:
• https://fenix.tecnico.ulisboa.pt/homepage/ist165183/thesis
To inspect and run the model AnyLogic must be installed. Please refer to Anylogic download page
(http://www.anylogic.com/downloads) for obtaining the free Personal Learning Edition.

!
!III.2

!
! IV.1
APPENDIX IV – WAREHOUSE SCHEMATICS
Page IV.3 presents the schematics of the warehouse drawn by the author, the backbone of the model
space-awareness, in A3 paper size.

!
!IV.2

21.35
21.36
21.37
21.38
21.39
21.40
21.41
21.42
21.43
21.44
21.45
21.46
21.47
21.48
21.49
21.50
21.51
21.52
21.53
23.35
23.36
23.37
23.38
23.39
23.40
23.41
23.42
23.43
23.44
23.45
23.46
23.47
23.48
23.49
23.50
23.51
23.52
23.53
22.35
22.36
22.37
22.38
22.39
22.40
22.41
22.42
22.43
21.44
22.45
22.46
22.47
22.48
22.49
22.50
22.51
22.52
22.53
25.35
25.36
25.37
25.38
25.39
25.40
25.41
25.42
25.43
25.44
25.45
25.46
25.47
25.48
25.49
25.50
25.51
25.52
25.53
27.35
27.36
27.37
27.38
27.39
27.40
27.41
27.42
27.43
27.44
27.45
27.46
27.47
27.48
27.49
27.50
27.51
27.52
27.53
24.35
24.36
24.37
24.38
24.39
24.40
24.41
24.43
24.44
24.45
24.46
24.47
24.48
24.49
24.50
24.53
26.35
26.36
26.37
26.38
26.39
26.40
26.41
26.42
26.43
26.44
26.45
26.46
26.47
26.48
26.49
26.50
26.51
26.52
26.53
29.35
29.36
29.37
29.38
29.39
29.40
29.41
29.42
29.43
29.44
29.45
29.46
29.47
29.48
29.49
29.50
29.51
29.52
29.53
28.35
28.36
28.37
28.38
28.39
28.40
28.41
28.42
28.43
28.44
28.45
28.46
28.47
28.48
28.49
28.50
28.51
28.52
28.53
30.35
30.36
30.37
30.38
30.39
30.40
30.41
30.43
30.44
30.45
30.46
30.47
30.48
30.49
30.50
30.53
30.52
24.52
21.67
21.68
21.69
21.70
21.71
21.72
21.73
21.74
21.75
21.76
21.77
23.59
23.60
23.67
23.68
23.69
23.70
23.71
23.72
23.73
23.74
23.75
23.76
23.77
22.59
22.60
22.67
22.68
22.69
22.70
22.71
22.72
22.73
22.74
22.75
22.76
22.77
21.78
21.79
21.80
22.78
22.79
22.80
23.78
23.79
23.80
25.59
25.60
25.67
25.68
25.69
25.70
25.71
25.72
25.73
25.74
25.75
25.76
25.77
24.59
24.67
24.68
24.70
24.71
24.72
24.73
24.74
24.75
24.76
24.77
24.79
24.80
25.78
25.79
25.80
27.59
27.60
27.67
27.68
27.69
27.70
27.71
27.72
27.73
27.74
27.75
27.76
27.77
26.59
26.60
26.67
26.68
26.69
26.70
26.71
26.72
26.73
26.74
26.75
26.76
26.77
26.78
26.79
26.80
27.78
27.79
27.80
29.59
29.60
29.67
29.68
29.69
29.70
29.71
29.72
29.73
29.74
29.75
29.76
29.77
28.59
28.60
28.67
28.68
28.69
28.70
28.71
28.72
28.73
28.74
28.75
28.76
28.77
28.78
28.79
28.80
29.78
29.79
29.80
30.59
30.67
30.68
30.70
30.71
30.72
30.73
30.74
30.75
30.76
30.77
30.79
30.80
23.86
23.87
23.88
23.89
23.90
23.94
23.95
23.96
23.97
23.98
23.99
23.100
23.101
23.102
23.103
23.104
22.86
22.87
22.88
22.89
22.90
22.94
21.95
22.96
22.97
22.98
22.99
22.100
22.101
22.102
22.103
22.104
25.86
25.87
25.88
25.89
25.90
25.94
25.95
25.96
25.97
25.98
25.99
25.100
25.101
25.102
25.103
25.104
24.86
24.88
24.89
24.90
24.94
24.95
24.97
24.98
24.99
24.100
24.101
24.102
24.103
24.104
21.86
21.87
21.88
21.89
21.90
21.94
21.95
21.96
21.97
21.98
21.99
21.100
21.101
21.102
21.103
21.104
27.86
27.87
27.88
27.89
27.90
27.94
27.95
27.96
27.97
27.98
27.99
27.100
27.101
27.102
27.103
27.104
26.86
26.87
26.88
26.89
26.90
26.94
26.95
26.96
26.97
26.98
26.99
26.100
26.101
26.102
26.103
26.104
29.86
29.87
29.88
29.89
29.90
29.94
29.95
29.96
29.97
29.98
29.99
29.100
29.101
29.102
29.103
29.104
28.86
28.87
28.88
28.89
28.90
28.94
28.95
28.96
28.97
28.98
28.99
28.100
28.101
28.102
28.103
28.104
30.86
30.88
30.89
30.90
30.94
30.95
30.97
30.98
30.99
30.100
30.101
30.102
30.103
30.104
23.110
23.111
23.118
23.119
23.120
23.121
23.122
23.123
23.127
23.128
22.110
22.111
22.118
22.119
22.120
22.121
22.122
22.123
22.127
22.128
22.129
22.130
22.131
23.129
23.130
23.131
23.115
23.116
23.117
22.115
22.116
22.117
23.112
23.113
23.114
22.112
22.113
22.114
25.110
25.111
25.118
25.119
25.120
25.121
25.122
25.123
25.127
25.128
24.110
24.111
24.118
24.119
24.120
24.121
24.122
24.127
24.128
24.129
24.130
24.131
25.129
25.130
25.131
25.115
25.116
25.117
24.115
24.116
24.117
25.112
25.113
25.114
24.112
24.113
21.110
21.111
21.118
21.119
21.120
21.121
21.122
21.123
21.127
21.128
21.129
21.130
21.131
21.115
21.116
21.117
21.112
21.113
21.114
27.110
27.111
27.118
27.119
27.120
27.121
27.122
27.123
27.127
27.128
26.110
26.111
26.118
26.119
26.120
26.121
26.122
26.123
26.127
26.128
26.129
26.130
26.131
27.129
27.130
27.131
27.115
27.116
27.117
26.115
26.116
26.117
27.112
27.113
27.114
26.112
26.113
26.114
29.110
29.111
29.118
29.119
29.120
29.121
29.122
29.123
29.127
29.128
28.110
28.111
28.118
28.119
28.120
28.121
28.122
28.123
28.127
28.128
28.129
28.130
28.131
29.129
29.130
29.131
29.115
29.116
29.117
28.115
28.116
28.117
29.112
29.113
29.114
28.112
28.113
28.114
30.110
30.111
30.118
30.119
30.120
30.121
30.122
30.127
30.128
30.129
30.130
30.131
30.115
30.116
30.117
30.112
30.113
23.137
23.138
23.145
23.146
23.147
23.148
23.149
23.150
23.154
23.155
22.137
22.138
22.145
22.146
22.147
22.148
22.149
22.150
22.154
22.155
23.142
23.143
23.144
22.142
22.143
22.144
23.139
23.140
23.141
22.139
22.140
22.141
23.151
23.152
23.153
22.151
22.152
22.153
25.137
25.138
25.145
25.146
25.147
25.148
25.149
25.150
25.154
25.155
24.137
24.138
24.145
24.146
24.147
22.148
24.149
24.154
24.155
25.142
25.143
25.144
24.142
24.143
24.144
25.139
25.140
25.141
24.139
24.140
25.151
25.152
25.153
24.151
24.152
24.153
27.137
27.138
27.145
27.146
27.147
27.148
27.149
27.150
27.154
27.155
26.137
26.138
26.145
26.146
26.147
26.148
26.149
26.150
26.154
26.155
27.142
27.143
27.144
26.142
26.143
26.144
27.139
27.140
27.141
26.139
26.140
26.141
27.151
27.152
27.153
26.151
26.152
26.153
29.137
29.138
29.145
29.146
29.147
29.148
29.149
29.150
29.154
29.155
28.137
28.138
28.145
28.146
28.147
28.148
28.149
28.150
28.154
28.155
29.142
29.143
29.144
28.142
28.143
28.144
29.139
29.140
29.141
28.139
28.140
28.141
29.151
29.152
29.153
28.151
28.152
28.153
30.137
30.138
30.145
30.146
30.147
30.148
30.149
30.154
30.155
30.142
30.143
30.144
30.139
30.140
30.151
30.152
30.153
2122
2324
2526
2728
2930
2122
2324
2526
2728
2930
0 168m
IV.3

IV.4

!
! V.1
APPENDIX V – EXAMPLE OF ORDERS
Is this appendix orders lists are exemplified, in their original form as provided by LS and in their final
form as input to the model. To achieve the final form, the author used extensive VBA programing.
As fits the scope of the model, these orders are from week 45, 2014, from one client that occupies a
third of the warehouse (aisle 21 to 30, from 30 aisles) and it is served by up to eleven pickers.
First follows an extract of the original form of the orders. The author organized them by date of picking.
SSCC Date Order Number
Product Cod
Product Description3 Number Date of
Picking Aisle X
Order List 14 556097610021230348 03-Nov-14 00000030
6338 01026608 ##################### 13 3/11/14 0:27 29 99
556097610021228192 03-Nov-14 00000030
6338 01026608 ##################### 19 3/11/14 0:29 24 14
9 330469214091023559 03-Nov-14 00000030
6338 01011012 ##################### 20 3/11/14 0:37 25 15
5 556097610020036903 03-Nov-14 00000030
6338 01027103 ##################### 24 3/11/14 0:42 30 89
456010191140094447 03-Nov-14 00000030
6338 01001701 ##################### 48 3/11/14 0:48 26 12
0 450001574023063035 03-Nov-14 00000030
6338 01006911 ##################### 8 3/11/14 0:53 24 12
7 450001574023141016 03-Nov-14 00000030
6338 01006911 ##################### 22 3/11/14 0:56 25 41
350500836051549776 03-Nov-14 00000030
6338 01027086 ##################### 16 3/11/14 1:00 30 14
0 350500833035606302 03-Nov-14 00000030
6338 01026421 ##################### 9 3/11/14 1:16 30 72
350500833035608627 03-Nov-14 00000030
6338 01026421 ##################### 11 3/11/14 1:17 30 37
456010191140437411 03-Nov-14 00000030
6338 01001705 ##################### 24 3/11/14 1:22 26 46
556097610020044960 03-Nov-14 00000030
6338 01027063 ##################### 6 3/11/14 1:24 29 10
3 Order List 2 556097610021494108 03-Nov-14 00000030
6557 01020294 ##################### 1 3/11/14 0:15 24 37
Order List 3 340005390987122027 03-Nov-14 00000030
6559 01011734 ##################### 1 3/11/14 3:51 22 38
380033409163703772 03-Nov-14 00000030
6559 01011033 ##################### 1 3/11/14 3:52 29 68
340055003442702140 03-Nov-14 00000030
6559 01001324 ##################### 1 3/11/14 3:52 28 40
Now the orders in their Anylogic input form. Please note many of the discussed details, like the
indication of the pallets entrance station in the end of each order. Also note that the positions in these
lists, different between them, are a product of the storage assignment performed by the author. As for
!!!!!!!!!!!!!!!!!!!!!!!!!!!!!!!!!!!!!!!!!!!!!!!!!!!!!!!!3 Product description is censured to protect LS costumers. 4 Order list separation and numeration was added by the author dynamically.

!
!V.2
the variation in sequence, they respect the routing methods applied by the author. The various storage
assignment product distributions and routing keys are also presented in appendixes.
So for the current SAP the inputs are:
// Rota Original // Rota Return // Rota Aleatório // Rota LSPickers // Rota S-Shape // Rota Midpoint
// Guia 1 // Guia 1 // Guia 1 // Guia 1 // Guia 1 // Guia 1 orderPool[0][0]= pos29099;
orderPool[0][0]= pos24149;
orderPool[0][0]= pos24127;
orderPool[0][0]= pos30089;
orderPool[0][0]= pos24149;
orderPool[0][0]= pos24127;
orderPool[0][1]= pos24149;
orderPool[0][1]= pos24127;
orderPool[0][1]= pos25041;
orderPool[0][1]= pos24127;
orderPool[0][1]= pos24127;
orderPool[0][1]= pos24149;
orderPool[0][2]= pos25155;
orderPool[0][2]= pos25041;
orderPool[0][2]= pos25155;
orderPool[0][2]= pos25041;
orderPool[0][2]= pos25041;
orderPool[0][2]= pos25155;
orderPool[0][3]= pos30089;
orderPool[0][3]= pos25155;
orderPool[0][3]= pos30089;
orderPool[0][3]= pos30072;
orderPool[0][3]= pos26046;
orderPool[0][3]= pos26120;
orderPool[0][4]= pos26120;
orderPool[0][4]= pos26120;
orderPool[0][4]= pos26046;
orderPool[0][4]= pos26046;
orderPool[0][4]= pos26120;
orderPool[0][4]= pos30140;
orderPool[0][5]= pos24127;
orderPool[0][5]= pos26046;
orderPool[0][5]= pos30037;
orderPool[0][5]= pos29103;
orderPool[0][5]= pos25155;
orderPool[0][5]= pos29103;
orderPool[0][6]= pos25041;
orderPool[0][6]= pos29099;
orderPool[0][6]= pos26120;
orderPool[0][6]= pos30140;
orderPool[0][6]= pos30037;
orderPool[0][6]= pos29099;
orderPool[0][7]= pos30140;
orderPool[0][7]= pos29103;
orderPool[0][7]= pos30072;
orderPool[0][7]= pos25155;
orderPool[0][7]= pos30072;
orderPool[0][7]= pos30089;
orderPool[0][8]= pos30072;
orderPool[0][8]= pos30140;
orderPool[0][8]= pos24149;
orderPool[0][8]= pos30037;
orderPool[0][8]= pos30089;
orderPool[0][8]= pos30072;
orderPool[0][9]= pos30037;
orderPool[0][9]= pos30089;
orderPool[0][9]= pos29099;
orderPool[0][9]= pos26120;
orderPool[0][9]= pos29099;
orderPool[0][9]= pos30037;
orderPool[0][10]= pos26046;
orderPool[0][10]= pos30072;
orderPool[0][10]= pos29103;
orderPool[0][10]= pos29099;
orderPool[0][10]= pos29103;
orderPool[0][10]= pos26046;
orderPool[0][11]= pos29103;
orderPool[0][11]= pos30037;
orderPool[0][11]= pos30140;
orderPool[0][11]= pos24149;
orderPool[0][11]= pos30140;
orderPool[0][11]= pos25041;
orderPool[0][12]= depot;
orderPool[0][12]= depot;
orderPool[0][12]= depot;
orderPool[0][12]= depot;
orderPool[0][12]= depot;
orderPool[0][12]= depot;
// Guia 2 // Guia 2 // Guia 2 // Guia 2 // Guia 2 // Guia 2 orderPool[1][0]= pos24037;
orderPool[1][0]= pos24037;
orderPool[1][0]= pos24037;
orderPool[1][0]= pos24037;
orderPool[1][0]= pos24037;
orderPool[1][0]= pos24037;
orderPool[1][1]= depot;
orderPool[1][1]= depot;
orderPool[1][1]= depot;
orderPool[1][1]= depot;
orderPool[1][1]= depot;
orderPool[1][1]= depot;
// Guia 3 // Guia 3 // Guia 3 // Guia 3 // Guia 3 // Guia 3 orderPool[2][0]= pos22038;
orderPool[2][0]= pos22038;
orderPool[2][0]= pos29068;
orderPool[2][0]= pos22038;
orderPool[2][0]= pos22038;
orderPool[2][0]= pos22038;
orderPool[2][1]= pos29068;
orderPool[2][1]= pos28040;
orderPool[2][1]= pos28040;
orderPool[2][1]= pos28040;
orderPool[2][1]= pos28040;
orderPool[2][1]= pos29068;
orderPool[2][2]= pos28040;
orderPool[2][2]= pos29068;
orderPool[2][2]= pos22038;
orderPool[2][2]= pos29068;
orderPool[2][2]= pos29068;
orderPool[2][2]= pos28040;
orderPool[2][3]= depot;
orderPool[2][3]= depot;
orderPool[2][3]= depotB;
orderPool[2][3]= depot;
orderPool[2][3]= depot;
orderPool[2][3]= depot;
For the turnover SAP:
// Pos Turnover - Return
// Pos Turnover - LSPickers
// Pos Turnover - Aleatório
// Pos Turnover - S-Shape
// Pos Turnover - Midpoint
// Guia 1 // Guia 1 // Guia 1 // Guia 1 // Guia 1 orderPool[0][0]= pos22053;
orderPool[0][0]= pos24040;
orderPool[0][0]= pos26039;
orderPool[0][0]= pos22053;
orderPool[0][0]= pos22053;
orderPool[0][1]= pos23037;
orderPool[0][1]= pos25071;
orderPool[0][1]= pos22053;
orderPool[0][1]= pos24040;
orderPool[0][1]= pos30040;
orderPool[0][2]= pos23037;
orderPool[0][2]= pos29037;
orderPool[0][2]= pos27049;
orderPool[0][2]= pos23037;
orderPool[0][2]= pos30040;
orderPool[0][3]= pos24040;
orderPool[0][3]= pos22053;
orderPool[0][3]= pos25071;
orderPool[0][3]= pos23037;
orderPool[0][3]= pos29037;
orderPool[0][4]= pos25071;
orderPool[0][4]= pos26050;
orderPool[0][4]= pos26050;
orderPool[0][4]= pos26039;
orderPool[0][4]= pos27049;
orderPool[0][5]= pos26050;
orderPool[0][5]= pos26050;
orderPool[0][5]= pos26050;
orderPool[0][5]= pos26050;
orderPool[0][5]= pos26039;

!
! V.3
orderPool[0][6]= pos26050;
orderPool[0][6]= pos26039;
orderPool[0][6]= pos30040;
orderPool[0][6]= pos26050;
orderPool[0][6]= pos26050;
orderPool[0][7]= pos26039;
orderPool[0][7]= pos27049;
orderPool[0][7]= pos30040;
orderPool[0][7]= pos25071;
orderPool[0][7]= pos26050;
orderPool[0][8]= pos27049;
orderPool[0][8]= pos30040;
orderPool[0][8]= pos23037;
orderPool[0][8]= pos27049;
orderPool[0][8]= pos25071;
orderPool[0][9]= pos29037;
orderPool[0][9]= pos30040;
orderPool[0][9]= pos23037;
orderPool[0][9]= pos29037;
orderPool[0][9]= pos24040;
orderPool[0][10]= pos30040;
orderPool[0][10]= pos23037;
orderPool[0][10]= pos29037;
orderPool[0][10]= pos30040;
orderPool[0][10]= pos23037;
orderPool[0][11]= pos30040;
orderPool[0][11]= pos23037;
orderPool[0][11]= pos24040;
orderPool[0][11]= pos30040;
orderPool[0][11]= pos23037;
orderPool[0][12]= depot;
orderPool[0][12]= depotB;
orderPool[0][12]= depot;
orderPool[0][12]= depot;
orderPool[0][12]= depotB;
// Guia 2 // Guia 2 // Guia 2 // Guia 2 // Guia 2 orderPool[1][0]= pos24045;
orderPool[1][0]= pos24045;
orderPool[1][0]= pos24045;
orderPool[1][0]= pos24045;
orderPool[1][0]= pos24045;
orderPool[1][1]= depot; orderPool[1][1]= depot; orderPool[1][1]= depot; orderPool[1][1]= depot; orderPool[1][1]= depot;
// Guia 3 // Guia 3 // Guia 3 // Guia 3 // Guia 3 orderPool[2][0]= pos21039;
orderPool[2][0]= pos21039;
orderPool[2][0]= pos21039;
orderPool[2][0]= pos21039;
orderPool[2][0]= pos21039;
orderPool[2][1]= pos22060;
orderPool[2][1]= pos22060;
orderPool[2][1]= pos25049;
orderPool[2][1]= pos22060;
orderPool[2][1]= pos22060;
orderPool[2][2]= pos25049;
orderPool[2][2]= pos25049;
orderPool[2][2]= pos22060;
orderPool[2][2]= pos25049;
orderPool[2][2]= pos25049;
orderPool[2][3]= depot; orderPool[2][3]= depot; orderPool[2][3]= depotB; orderPool[2][3]= depot; orderPool[2][3]= depot;
And for the ABC1 SAP:
// Pos ABC1 - Return // Pos ABC1 - Aleatório
// Pos ABC1 -LS Pickers // Pos ABC1 - S-Shape // Pos ABC1 - MidPoint
// Guia 1 // Guia 1 // Guia 1 // Guia 1 // Guia 1 orderPool[0][0]= pos24036;
orderPool[0][0]= pos29044;
orderPool[0][0]= pos26040;
orderPool[0][0]= pos24036;
orderPool[0][0]= pos29051;
orderPool[0][1]= pos26040;
orderPool[0][1]= pos24036;
orderPool[0][1]= pos28059;
orderPool[0][1]= pos26040;
orderPool[0][1]= pos30050;
orderPool[0][2]= pos27048;
orderPool[0][2]= pos26040;
orderPool[0][2]= pos28059;
orderPool[0][2]= pos28059;
orderPool[0][2]= pos29044;
orderPool[0][3]= pos28059;
orderPool[0][3]= pos28059;
orderPool[0][3]= pos30050;
orderPool[0][3]= pos28059;
orderPool[0][3]= pos28042;
orderPool[0][4]= pos28059;
orderPool[0][4]= pos28059;
orderPool[0][4]= pos29051;
orderPool[0][4]= pos28049;
orderPool[0][4]= pos28042;
orderPool[0][5]= pos28049;
orderPool[0][5]= pos27048;
orderPool[0][5]= pos24036;
orderPool[0][5]= pos28049;
orderPool[0][5]= pos28049;
orderPool[0][6]= pos28049;
orderPool[0][6]= pos29051;
orderPool[0][6]= pos29044;
orderPool[0][6]= pos27048;
orderPool[0][6]= pos28049;
orderPool[0][7]= pos28042;
orderPool[0][7]= pos30050;
orderPool[0][7]= pos28049;
orderPool[0][7]= pos28042;
orderPool[0][7]= pos28059;
orderPool[0][8]= pos28042;
orderPool[0][8]= pos28042;
orderPool[0][8]= pos28049;
orderPool[0][8]= pos28042;
orderPool[0][8]= pos28059;
orderPool[0][9]= pos29044;
orderPool[0][9]= pos28042;
orderPool[0][9]= pos27048;
orderPool[0][9]= pos29044;
orderPool[0][9]= pos27048;
orderPool[0][10]= pos29051;
orderPool[0][10]= pos28049;
orderPool[0][10]= pos28042;
orderPool[0][10]= pos30050;
orderPool[0][10]= pos26040;
orderPool[0][11]= pos30050;
orderPool[0][11]= pos28049;
orderPool[0][11]= pos28042;
orderPool[0][11]= pos29051;
orderPool[0][11]= pos24036;
orderPool[0][12]= depot;
orderPool[0][12]= depot;
orderPool[0][12]= depot;
orderPool[0][12]= depot;
orderPool[0][12]= depot;
// Guia 2 // Guia 2 // Guia 2 // Guia 2 // Guia 2 orderPool[1][0]= pos25074;
orderPool[1][0]= pos25074;
orderPool[1][0]= pos25074;
orderPool[1][0]= pos25074;
orderPool[1][0]= pos25074;
orderPool[1][1]= depot; orderPool[1][1]= depot; orderPool[1][1]= depot; orderPool[1][1]= depot; orderPool[1][1]= depot;
// Guia 3 // Guia 3 // Guia 3 // Guia 3 // Guia 3
orderPool[2][0]= orderPool[2][0]= orderPool[2][0]= orderPool[2][0]= orderPool[2][0]=

!
!V.4
pos21036; pos30071; pos24070; pos21036; pos21036;
orderPool[2][1]= pos24070;
orderPool[2][1]= pos24070;
orderPool[2][1]= pos30071;
orderPool[2][1]= pos24070;
orderPool[2][1]= pos30071;
orderPool[2][2]= pos30071;
orderPool[2][2]= pos21036;
orderPool[2][2]= pos21036;
orderPool[2][2]= pos30071;
orderPool[2][2]= pos24070;
orderPool[2][3]= depot; orderPool[2][3]= depotB;
orderPool[2][3]= depotB; orderPool[2][3]= depot; orderPool[2][3]= depot;

!
! VI.1
APPENDIX VI – PRODUCT TURNOVER (WEEK 45, 2014)
Because of the extensive size of the data, the product turnover is available in the Excel file “A.VI” of
the companion CD, inside the “Digital Appendices” folder.
The contents of the CD are also accessible in the following link:
• https://fenix.tecnico.ulisboa.pt/homepage/ist165183/thesis
Please note that in the A/B division is assigned in green and B/C division in orange.

!
!VI.2

!
! VII.1
APPENDIX VII – DISTANCE VECTOR
Because of the extensive size of the data, the position to depot minimum distance is available in the
Excel file “A.VII” of the companion CD, inside the “Digital Appendices” folder.
The contents of the CD are also accessible in the following link:
• https://fenix.tecnico.ulisboa.pt/homepage/ist165183/thesis
Please note that there are two tables, one ordered by the distance and one by the positions.

!
!VII.2
!
! VIII.1
APPENDIX VIII – PRODUCT DISTRIBUTION (TURNOVER)
Because of the extensive size of the data, the product distribution of the turnover SAP is available in
the Excel file “A.VIII” of the companion CD, inside the “Digital Appendices” folder.
The contents of the CD are also accessible in the following link:
• https://fenix.tecnico.ulisboa.pt/homepage/ist165183/thesis

!
!VIII.2

!
! IX.1
APPENDIX IX – PRODUCT DISTRIBUTION (ABC1)
Because of the extensive size of the data, the product distribution of the ABC1 SAP is available in the
Excel file “A.IX” of the companion CD, inside the “Digital Appendices” folder.
The contents of the CD are also accessible in the following link:
• https://fenix.tecnico.ulisboa.pt/homepage/ist165183/thesis

!
!IX.2

!
! X.1
APPENDIX X – ROUTING
Because of the extensive size of the data, the routing key is available in the Excel file “A.X” of the
companion CD, inside the “Digital Appendices” folder.
The contents of the CD are also accessible in the following link:
• https://fenix.tecnico.ulisboa.pt/homepage/ist165183/thesis
Please note that this routing key was used in all of the sequencing of the orders. To that end the
author used the “Match” function in Excel with the routing key to attribute to each position in order lists
his sequence number, for every routing method. Then VBA was used to sort every order, according to
the sequence numbers.

!
!X.2

!
! XI.1
APPENDIX XI – RESULTS
The descriptive statistics treatment of the results was presented in chapter 5.3.
To allow the access to the complete results, corresponding to the 250 runs, they are available in the
Excel file “A.XI” of the companion CD, inside the “Digital Appendices” folder.
The contents of the CD are also accessible in the following link:
• https://fenix.tecnico.ulisboa.pt/homepage/ist165183/thesis
Each sheet of the excel file presents the results for a SAP. The results are all in seconds.

!
!XI.2