restoration scaling of benthic, aquatic, and bird … · restoration scaling of benthic, aquatic...
TRANSCRIPT

RESTORATION SCALING OF BENTHIC, AQUATIC AND BIRD INJURIES TO OYSTER REEF AND MARSH RESTORATION PROJECTS
April 16, 2002
prepared by:
Dr. Deborah French McCay Applied Science Associates, Inc.
Dr. Pete Peterson University of North Carolina - Chapel Hill
Institute of Marine Sciences
Michael Donlan Industrial Economics, Inc.

Introduction
This report describes our approach and results for scaling marsh and oyster reef restoration projects to address benthic, aquatic and bird injuries.
Summary Description of Scaling Approach
Two separate options are presented as potential restoration projects for benthic, aquatic and bird injuries: 1) marsh restoration; and 2) creating and seeding an oyster reef sanctuary. Both options will directly enhance production of biota relative to the habitat replaced by the restoration.1 The biota directly enhanced by the restoration project in turn will enhance populations of other biota that reside at higher trophic levels within the local food web. This scaling approach seeks to replace the lost biomass (measured in kilograms or similar units) caused by the spill with an equivalent biomass, taking into account trophic level differences between biota injured by the spill, biota directly restored by the restoration project and predators that consume them.
Losses Requiring Compensation
Losses of birds are presented in Estimate of Total Acute Mortality to Birds Resulting from the Chalk Point Oil Spill, Swanson Creek, Maryland prepared by the Wildlife Injury Workgroup of the Chalk Point NRDA Council, final report dated May 2001, and Reproductive Success Of Osprey (Pandion haliaetus) Nesting In The Vicinity Of The Chalk Point Oil Spill, final report dated October 2001. The Trustees are proposing to restore ruddy duck injuries through a breeding habitat protection project, and so are not considered in the scaling calculations described in this document. The Trustees estimate that 134 other birds (almost exclusively waterbirds) were killed by the spill. Finally, the Trustees estimate a foregone production of 17 osprey fledglings, as described in the osprey reproductive success report.2
Benthic injuries are described in Quantification of Injury to Benthic Resources from the Chalk Point Oil Spill on the Patuxent River (Peterson, 2002), final report dated 5 March 2002. This report identifies a total biomass loss of 2,256.1 kg (ash free dry weight), comprised of 1,932.8 kg of bivalve molluscs (mostly Macoma balthica, also Rangia cuneata), 446.9 kg of
1 This scaling approach can also be used to estimate the benefits associated with protection of existing, degrading habitat.
2 For consistency with the approach used to scale ruddy duck restoration, injuries to fledglings are expressed in units of adult-equivalents. We assume an osprey fledgling survival rate of 55 percent (Henny and Wight 1969, Spitzer 1980).
2

amphipods (primarily Leptocheirus plumulosus) and offset by a spill-related increase of 123.6 kg in opportunistic polychaetes (mostly spionids, also capitellids).3
To ensure consistency in restoration scaling calculations, all injuries are expressed in Year 2000 units. Those portions of the benthic injury that occur in 2001 and 2002 must be discounted back to Year 2000. This issue does not affect the mollusc and polychaete injury estimates presented above, as recovery occurred for those species by the end of 2000. However, a portion of the amphipod injury occurred in 2001 and 2002. Discounting those amounts back to Year 2000 (using a standard discount rate of three percent) results in a total discounted amphipod injury of 439.1 kg. Combining this number with the 1932.8 kg of mollusc injury and 123.6 kg credit for increased polychaete production results in a discounted net loss of 2,248.3 kg for benthic injuries. This estimate is used as the basis for the calculations performed in this restoration scaling analysis, and is translated from ash free dry weight to wet weight using factors described in later sections of this report.
Aquatic injuries are as presented in PEPCO Oil Spill of April 7, 2000 in Patuxent River, MD: Modeling of the Fates and Acute Biological Effects of the Spilled Oil on the Water Column (French McCay and Jennings, March 2002). This report identifies a biomass loss of 2,463.8 kilograms, comprising approximately 18 different species of fish and shellfish.
Key Oyster Reef Project Estimates/Assumptions
Key oyster reef project parameters are summarized below and described in more detail in Appendix A. First, estimation of the quantitative benefits of oyster reef restoration requires knowledge of the habitat chosen for the oyster reef restoration project. Specifically, reefs could be constructed on either the soft sediments of muddy sand or on shell bottom. Knowing the habitat to be used for the restoration is important for calculation of the net enhancement in ecosystem services from the restoration because shell bottom and unconsolidated sedimentary bottom possess different benthic communities.
Specific sites have not yet been identified for potential oyster reefs. With respect to site selection, Chris Judy of the Maryland Department of Natural Resources (pers. comm.) notes that potential sites are likely to be "marginal" bars that once were productive and may still have a remnant population on them, but a sparse one. A variety of habitat conditions may exist. These sites may have shells only and no oysters. The shell may be scattered on top of the bar or just under a layer of silt. Some bars may be "sanded" and covered with a thin layer of sand. Others may be covered by a thicker layer of sand.
Experts, including Chris Judy (pers. comm.) strongly recommend selection of sites with some shell bottom, especially in an area like the Patuxent River where the sediments are
3 As discussed in Peterson, 2002, we "credit" only 50 percent (123.6 kg) of the 247.2 kg total increase in polychaete production caused by the spill. This is because of the likelihood that a substantial fraction of this production of opportunists suffered food limitation, died, and decomposed. A well established pattern of succession in marine sediments is early explosion of opportunists, especially polychaetes, followed by starvation (e.g., Marsh and Tenore 1990).
3
otherwise very soft. A shell bottom provides greater stability so that loss of reef matrix by sinking and burial is minimized. Furthermore, a shell bottom is indicative of the presence of an historical oyster reef at that site, which implies greater likelihood of successful restoration. For these reasons, we assume that oyster reef restoration will occur on shell bottom.4
Restoring oyster reef habitat in the Patuxent River is expected (based on the literature reviewed in Peterson 2001) to produce augmentation in four groups of organisms that serve to replace lost ecosystem services; oysters, mud crabs, grass shrimp and small crustaceans (amphipods, tanaids and isopods). Oyster recruitment in the Patuxent River is historically low and sporadic over time. Therefore, the reef must be established by construction of a shell (or similar substrate) matrix on stable shell bottom followed by emplacement of a surface veneer of seed oysters. Information obtained from Chris Judy (pers. comm.) and other experts suggests that a seeding density of 500 oysters per square meter (approximately two million oysters per acre) is reasonable for planning purposes. Our scaling calculations are based on this assumed seeding density. Note that a square meter of reef cannot physically hold 500 larger oysters. Mortality will occur over time, especially in the first year, resulting in much lower densities of larger oysters. DNR field studies in the mid 1990’s in various tributaries including the Patuxent River showed high first year mortality among hatchery spat, due to predation by blue crabs and the flatworm Stylocchus.
We considered other potential productivity benefits and ecosystem services provided by restored oyster reef, but do not include them in our scaling calculation for a variety of reasons. With respect to productivity gains for other invertebrates, we recognize that barnacles settle and grow on hard substrata, including oysters. However, barnacles are not extensively consumed by vertebrates at higher trophic levels, so their contribution as prey is limited. Furthermore, barnacles already grow on unaugmented shell bottom, and we were unable to find quantitative data that could be used to evaluate potential increases in productivity associated with construction of an oyster reef.
Reef habitat can augment fish production by enhancing recruitment and prey production, which together lead to increases in fish biomass. Although our calculations do not explicitly include a contribution of enhanced recruitment or enhanced survival through additional reef refuges, both processes are implicitly included in our estimation of augmented transfer of energy production from enhanced abundances of invertebrate prey organisms on restored reefs to predators and scavengers higher up the food chain. Including both fish prey and fish biomass gains in our estimates of reef productivity would be double-counting; these gains are not independent of each other. Stated another way, our scaling calculations estimate the increased quantity of invertebrate prey biomass made available to the food web; reef size is adjusted to produce enough prey to restore lost fish, bird or other injured biomass, given assumptions about transfer efficiencies between different levels of the food web.
4 Additional shells or similar substrate will be needed at selected sites to build the oyster reef. Chris Judy (pers. comm.) suggests that for planning purposes, it is appropriate to assume six inches of shells/substrate will need to be laid down at selected sites.
4
We also considered quantifying the potential benefits of oyster filtration in reducing turbidity and thereby allowing expansion and recovery of SAV habitat. While some benefit of this type may occur, related service loss likely occurred but was not specifically quantified as part of the benthic injury quantification. Because injuries were measured in terms of lost biomass, restoration should be measured in similar terms. In addition, given the general scale of benthic losses it is unlikely that impacts to this service would be large.
Reef-related production of oysters, mud crabs, grass shrimp and small crustaceans associated with an initial seeding is summed over five years to estimate total annual augmented production for each species. A portion of this biomass is consumed by predators, contributing to their growth and survival. Chris Judy (pers. comm.) and other experts indicated that five years is a reasonable assumption for restored oyster reefs in the Patuxent River because of mortality from sedimentation, low dissolved oxygen, oyster disease, episodes of higher than average fresh water inputs and similar factors. The relative importance of particular causes of oyster mortality depends on location of the site in the river. For example, Chris Judy (pers. comm.) indicates disease is a key factor downriver and fresh water runoff is a key factor upriver.
As described in more detail in Appendix A, we make the simplifying assumption that the relatively small number of oysters alive after five years die at that point in time (thereby contributing to biomass available for predators/scavengers at the end of year 5, rather than over ensuing years). This method adequately approximates their quantitative contribution to energy transfer to predators and scavengers, for several reasons. Most mortality takes place during the first five years; available information indicates that on average, less than ten percent of seeded oysters would be expected to survive five years. In addition, annual growth slows for oysters that are several years old, and any increments in growth would need to be offset by additional discounting applied to production from later years.
Oysters introduced as seed to restored reefs may reproduce and contribute to spat settlement in the region. Physical transport of larvae formed from gametes released by oysters surviving to adulthood on the restored reefs may settle successfully on shells and other hard substrata downstream. However, given the low historic spat setting trends for the Patuxent River, and the low salinities that can occur upriver, spat set in the Patuxent River due to the restored reefs is likely to be small relative to the productivity gains already included in our scaling calculations (C. Judy pers. comm.).
Based on production data from local researchers, the scientific literature (including Kneib 1987, Zimmerman et al. 1989, Llanso and Volstad 2000 - see Appendix A for more information) and unpublished data from research conducted by Peterson and his associates, species life history information and five year productivity duration, we estimate a reef-related increase in production of oyster, mud crab, grass shrimp and small crustacean biomass of approximately 365.9 grams of (ash free dry weight) per square meter of restored reef. This estimate reflects the net increase in biomass associated with oyster reefs compared to shell bottom for the mesohaline conditions that exist in the vicinity of the area affected by the spill.
The 365.9 grams per square meter estimate of biomass production is used to scale oyster reef restoration to all non-oyster injuries identified in the previous section of this report. As described in Appendix A, it reflects the portion of reef-generated biomass expected to be
5

consumed by predators in the foodweb. These species are expected to benefit from the restoration project through consumption of prey generated by it. In addition, non-oyster mollusks injured by the spill generally were small, soft-shelled species that primarily serve as prey for higher trophic level organisms. The production estimate includes full credit for crab, shrimp and small crustacean biomass but only 50 percent of the oyster biomass generated by reef restoration. We credit less than 100 percent of the oyster biomass because older oysters are relatively well protected from predators. Although some may be scavenged by fish and other predators if their shells gape after death, oysters that die during times of the year when predators are less active, don't gape after death, are killed by events (e.g., low dissolved oxygen or fresh water inflows) that also affect predators, and/or are buried by sedimentation events are more likely to decompose than directly contribute to the growth of higher level predators in the foodweb.
The scaling calculations for non-oyster injuries require injured biomass to be categorized according to trophic level relative to the oyster reef invertebrates produced, and ecological transfer efficiencies between trophic levels to be estimated.5 Assumptions for these parameters are identified in Appendix B. Injured and restored biota from the same trophic level are assumed to be 100% equivalent (from a biomass perspective), as they would presumably have similar ecological value in the food web. For example, injured crustaceans are restored on a one-for-one basis with crustacean biomass generated by the oyster reef, although in some cases the particular species of crustacean injured and restored may differ. To generate equivalencies between biota in “higher” or “lower” trophic levels, we rely on estimates of the ecological efficiency from prey to predator. Values for production of predator per unit production of prey (i.e., ecological efficiency) are taken from the ecological literature, as reviewed by French et al. (1996a) and summarized below.
As noted above, we make the simplifying assumption that restored biomass is equivalent to injured biomass from the same trophic level, and so scaled on a one to one basis. Thus, for scaling purposes, one kilogram of benthic production is required for every kilogram of benthic biomass lost. However, we use different "transfer ratios" for scaling to "higher" levels of the food web. The ecological efficiency of prey to invertebrate and fish consumers has been estimated to be 10-30% in both freshwater and marine environments by a number of authors (e.g., Slobodkin, 1960, 1962; Ryther, 1969; Odum, 1971; Steele, 1974; Petersen and Curtis, 1980; Cohen et al., 1982; Jones, 1984; Sissenwine et al., 1984; Borgman et al., 1984; Mills et al., 1984; Cohen and Grosslein, 1987). Therefore, for fish or invertebrates preying on fish or invertebrates, we use the midpoint of this range (20%) of transfer efficiency. The implication of this assumption is that five kilograms of benthic production from the reef are required for every one kilogram of biomass injury to fish or invertebrate predators of these resources.
For birds and mammals (which are homeotherms, i.e., warm-blooded, and so less efficient) the ecological efficiency is much lower, with estimates ranging from 1-5% (McNeill and Lawton, 1970; Steele, 1974; Whittaker, 1975; Grodzinski and Wunder, 1975). For our scaling purposes, we assume 2% efficiency for birds and mammals feeding on fish or invertebrate prey. Thus, 50 kilograms of prey biomass are needed for every one kilogram of biomass injury to bird/mammal
5 For purposes of this analysis, "trophic" levels are defined based on feeding patterns and preferences.
6

predators. Bird injuries are translated to biomass (kg) to include them in this trophic level scaling. Exhibit B-1 in Appendix B contains a list of the injuries as both numbers and biomass.6
Oyster biomass lost due to the spill is restored on a one-for-one basis with oyster biomass created by the reef restoration project. Because the restored reef simultaneously generates live oysters (which directly offset oysters killed by the spill) and oyster, grass shrimp, mud crab and small crustacean biomass consumed by predators (used to address non-oyster injuries), the restored reef must be of sufficient size to meet both objectives. Scaling calculations indicate that the area of reef needed to address non-oyster injuries (described in the following section of this report) also will be sufficient to address injuries to oysters.
Scaling Results – Oyster Reef
Appendix B contains calculations of the total acreage of reef needed to restore benthic injury, bird injury (without ruddy ducks), and aquatic injuries and combinations of these together. The scaling calculations provide the results identified in Exhibit 1 to compensate for injuries to all species (except ruddy ducks).
Exhibit 1
OYSTER REEF SCALING RESULTS ASSUMING A ONE-TIME SEEDING IN 2003
Injury Compensated Area Required (acres) Benthic infauna 2.07 Aquatic (fish and macroinvertebrate predators)
3.21
Birds (excluding ruddy ducks) 3.45 Total 8.74
The area required decreases if an additional seeding effort is undertaken five years after the initial seeding. Exhibit 2 provides the results if a second seeding in 2008 is performed. The results are slightly more than half the single-seeding results (rather than exactly half) because the future gains from 2008-2013 need to be discounted (3% annually).
Exhibit 2
OYSTER REEF SCALING RESULTS ASSUMING SEEDING IN 2003 AND RESEEDING IN 2008
6 As noted previously, it is our understanding that injuries to ruddy ducks will be restored through breeding habitat purchase/protection in the Prairie Pothole region. As a result, we do not include ruddy duck injury in our calculations for oyster reef and marsh scaling.
7

Injury Compensated Area Required (acres) Benthic infauna 1.11 Aquatic (fish and macroinvertebrate predators)
1.73
Birds (excluding ruddy ducks) 1.85 Total 4.69
Marsh Production Estimates
We reviewed available literature to obtain estimates of marsh annual primary and secondary (benthic infaunal) production (as g dry weight m2 yr-1). Exhibit B-2 in Appendix B is a summary of that review. We were able to find good estimates of primary production for Spartina and Typha marshes. In addition, we identified quantitative information on secondary production in Spartina marshes, but were unable to find similar information for Typha marshes.7 Finally, we attempted to find evidence in the literature for a net gain in production by restoring a Phragmites marsh to a Spartina or Typha, but as described in Appendix C do not believe available data support this scaling approach.
Key Marsh Project Assumptions
The scaling for saltmarsh injuries by the Wetlands Assessment Subgroup (2001) was performed with the following assumptions:
• 50 year project duration;
• restoration project completed in 2003; and
• net gain of 50% of services in 5 years, 75% services in 10 years, 80 % services in 15 years and beyond.
For the present scaling analysis we use similar parameters.
Scaling Results – Marsh Restoration
Scaling results are provided in Appendix B. The Spartina marsh is the most productive of the three plant communities considered and the least acreage is required for this habitat type. The table below shows area of marsh required for all benthic, aquatic (based on draft injury quantification) and bird injuries, with the exception of ruddy ducks.
7 We note that two different species of Spartina marsh were affected by the Chalk Point oil spill: Spartina alterniflora and Spartina cynosuroides. Available information was not sufficient to develop species specific estimates of productivity for these different types of Spartina marsh.
8

With respect to scaling for Spartina marsh, if we use primary production (i.e., plant biomass) as the measure of marsh productivity our preliminary results indicate that slightly less than one acre of restored marsh would be required to compensate for all benthic, bird (except ruddy duck) and aquatic injuries. However, if we use secondary production (i.e., macroinvertebrate infauna biomass) as the measure of marsh productivity, just over three acres are required.
9

Exhibit 3
MARSH SCALING RESULTS Habitat Production Trophic
Level Used in Scaling Area Required (acres)
Spartina marsh Primary 0.72 Spartina marsh Secondary 2.46 Typha marsh Primary 1.48
To avoid double counting, one of these measures needs to be selected as the basis for scaling.8 In our view, for scaling purposes it is more appropriate to use secondary production as the measure of productivity. Use of primary production requires an additional set of assumptions regarding transfer efficiencies from primary to secondary production. From a trophic level perspective, secondary production is "closer" to the injuries we are scaling to (i.e., benthic, aquatic and bird injuries) and so is a better starting point for the scaling analysis. Exhibit 4 lists the scaling results for Spartina marsh by injury category (using secondary production as the basis for scaling).
Exhibit 4
SPARTINA SCALING RESULTS BY INJURY CATEGORY Injury Compensated Area Required (acres) Benthic infauna 0.58 Fish and macroinvertebrate predators (draft)
0.91
Birds (excluding ruddy ducks) 0.97 Total 2.46
8 While we acknowledge that estimates of primary and secondary production have uncertainties associated with them, adding them together would clearly result in substantial double-counting, for reasons similar to those described in previous sections of this document. Furthermore, we are unable to find a conceptual or empirical basis supporting any approach for combining these estimates of productivity in some manner.
10

APPENDIX A
Estimate of Productivity Gains Associated with Oyster Reef Restoration in the Patuxent River
Knowing the habitat to be used for the restoration is important for calculation of the net enhancement in ecosystem services from the restoration because shell bottom and unconsolidated sedimentary bottom possess different benthic communities. These pre-existing benthic communities will be covered over and replaced by communities on living oyster reefs after restoration has been achieved. Specifically, the shelly bottom provides substantial protection against predation for infaunal invertebrates (Castagna and Kraueter 1977) and therefore possesses higher densities of bivalve molluscs than a muddy sand habitat. Thus, the restoration of an oyster reef on shell bottom in the Patuxent River would not be expected to enhance abundances of infaunal bivalves, such as Macoma balthica and Rangia cuneata above the already enhanced levels on the shell bottom.
A second challenge in estimating the enhancement of invertebrate production expected from restoring an area of oyster reef habitat in the Patuxent River arises from the low salinity of the area likely to be chosen. Salinities in a range of 4-6 ppt are adequate to sustain oyster growth and survival. Unfortunately, all available data sets that can be used to estimate the enhancement of invertebrates associated with restoration of oyster reef habitat come from higher salinity. The data sets that contrast invertebrate abundance on oyster reefs as compared to shell bottom come from Back Sound (North Carolina) and Galveston Bay (Texas) at salinities of 20-35 ppt.
Consequently, we are compelled to estimate augmentation of invertebrate abundance from oyster reef restoration in the Patuxent River region by using the earlier studies to estimate the factor by which abundances of relevant types of benthic invertebrates increase when shell bottom is converted to functional oyster reef habitat. We then apply that ratio to the Patuxent River, assuming that the factor by which enhancement will be augmented is unaltered by changing salinity over this range. In support of this approach, the groups of organisms that are present and important to restoring invertebrate prey for higher-level predators are the same under both salinity conditions: mud crabs; grass shrimp; and small crustaceans (amphipods, tanaids and isopods). Because of the work of Paynter in oyster reef restoration in the lower Patuxent River and in the Severn River and the work of the state of Maryland available through George Abbe and Chris Judy, excellent data are available with which to estimate the oyster production of these reefs.
Production of Oysters
Production estimates of oysters are based on an initial density of 500 oysters per m2 (average size = 7 mm in length at planting) of reef and expressed as g of ash-free dry weight (AFDW) m-2. This density follows the recommendation of Chris Judy, Maryland Department of Natural Resources and other experts based upon past results with hatchery seed plantings and input from the Maryland Oyster Roundtable Scientific Committee. Mortality rate of oysters (Table 1) during the first year of reef life is estimated from data collected by K. Paynter in his current oyster reef restoration study in the lower Patuxent River and his past studies in the
11

Table 1. Mortality rate and length-at-age and weight-at-length values used in oyster productioncalculations. Parameters are estimated based on Paynter (unpub. data), Judy and Abbe (pers. comm.).
Age Mortality Average length Average dry Average ash-free- Ratea (mm) weight (g) dry-weight (g)
0b 7 0.3 0.24 1 65% 35 0.6 0.48 2 30% 60 0.8 0.64 3 30% 80 1.4 1.12 4 30% 100 2.3 1.84 5 100% 115 3.1 2.48
Severn River. In his studies, seed oyster mortality over the first year averaged 65 % (range 5080%). Similar first year rates were seen by DNR in hatchery seed studies in the Patuxent River, and other rivers, in the mid-1990’s. Mortality rates drop the following years as oysters are larger and more able to withstand crabs and flatworms. Rates can increase again, however, if disease or fresh water runoff are factors in the later years (Chris Judy, pers. comm.).
Annual mortality rate (Table 1) for years 2, 3, and 4 (30%) is based on both Paynter’s data and consultation with additional Maryland experts (Judy and Abbe, pers. comm.). Assuming a practical limit of five years to the life span of oysters in the Patuxent River (D. Breitburg and K. Paynter, pers. comm.), we applied a mortality rate of 100% in year 5 to the few oysters remaining: thus no oyster lives to its fifth birthday in our production estimation (Table 1). Although some oysters may survive in this river beyond their fifth birthday, even up to 8-10 years of age, our method adequately approximates their quantitative contribution to energy transfer to predators and scavengers. That is true because oysters by age 5 achieve only small additional annual increments in size: those small production increments are balanced in our calculations by that fact that we have already credited their deaths and thus their transfers to higher trophic levels at earlier ages and thus have not had to apply the 3% annual discount rate for each later year in this computation.
Our oyster survivorships and calculations of energy production assume that the restored oyster reef is closed to oyster harvest. Length-at-age estimates (Table 1) are based on data from Paynter for 0-, 1- and 2-yr-old oysters. For years 3-5, length at age is based on Judy and Abbe (pers. comm.). For oysters in the 0-yr-old age class, length-at-age measurements (mm) are converted (Table 1) to dry tissue weight at age (g) from length-weight relationships of Crassostrea virginica in North Carolina waters (Peterson, unpubl. data). For older ages classes, length-to-weight conversions are based on data collected from Maryland oysters (Abbe and Judy, pers. comm.). Finally, dry tissue weights are then converted to ash-free dry weight (AFDW) by subtracting 20% (Table 1), based on data presented in Appendix 1 of Bahr and Lanier (1981).
a Our convention reports mortality rate for the previous year, ending on the birthday b Age 0 refers the date seed oysters are planted on the reef.
We first calculate the production of oysters associated with the reef. The change in average weight, expressed as g AFDW, between successive age classes is equal to the annual
12

production (Pi) of an individual surviving through age class i, Pi = Wi – W(i-1). Production of oysters for any given year (Py) is then estimated by multiplying Pi by the number of individuals surviving to the end of a particular year, Py = Pi · Ni. Py is adjusted for future production in years 1-5 by a standard annual discount rate (d) of 0.03: P ·1/(1+d)y
y . Total production of oysters is then estimated by summing the discounted Py for years 1-5. For the initial year, Wi is set to zero, rather than the 7-mm size of planting so as to also give production credit for the growth in the hatchery before planting in the field.
In addition, oysters also provide an ecosystem service by transferring energy to higher trophic levels through predation and scavenging by crabs and other consumers. Consequently, some fraction of the mortality of oysters on the reef should be credited to achieving the restoration in the transfer of prey biomass to higher trophic levels. We use data from Powers and Grabowski (2002) to estimate the fraction of the annual mortality of 0-year-class oysters on reefs that is caused by predation. Their study assayed predation rates only on small seed oysters (8-12 mm shell length) superglued to oyster shells and placed on oyster reefs. Predation was responsible for 50% of the observed mortality in that study. Although there is evidence that predation rate decreases as oyster size increases (White and Wilson 1996), some fraction of larger oysters that die from causes other than predators gets transferred to higher trophic levels through the activity of scavengers. Scavenging does not appear to play a role in the 0-year-class oysters because their shells rarely gape open after death and thus access to scavengers is inhibited. We assume for all older age classes that 50% of the mortality results in transferring energy to higher trophic levels through the joint effects of predators and scavengers.
To calculate the biomass of energy transfer from oysters to predators/scavengers, we multiplied the number of oysters that died in each year by 0.5 to estimate the numbers of oysters that were consumed. We then multiplied the estimated numbers of oyster consumed in each year by the mid-year AFDW to compute energy transfer to the next higher trophic level. We use this mid-year size as a reasonable approximation knowing that deaths occurred at a range of sizes throughout the year. Energy transfers that occurred in the first year were not discounted. For each subsequent year’s transfer, the biomass transfer was discounted by 3%.
These calculations result in estimated oyster production for predators of 188.41 grams AFDW per square meter over the 5 year expected duration of oysters seeded after construction of the reef, as summarized in Exhibit A-1 below. This productivity estimate would increase substantially if additional seeding efforts were implemented in subsequent years.
Production of Other Biomass
Elevated densities of some important non-oyster biota are expected to occur as a result of
the conversion of shell bottom habitat to a fully functional oyster reef. To estimate the augmented production of these groups, we used a similar approach as in Peterson et al. (2002). In that study a contrast between restored oyster reef and unstructured sand/mud bottom was used to estimate the quantitative augmentation of fish and mobile crustacean density resulting from the restoration of a unit area of oyster reef. The proposed restoration for the Chalk Point injury requires an analogous contrast between shell bottom and a fully functional oyster reef in a
13

mesohaline system. For benthic infaunal species, density enhancement is unlikely to result because the shell bottom already provides adequate refuge and surface feeding area (e.g., Skilleter 1994). The types of species groups most likely to show enhancements and of value as prey for higher trophic levels are mobile epifaunal species such as grass shrimp, mud crabs and small crustaceans (amphipods, tanaids and isopods). All of these are superb fish food, such that their complete production can be assumed to be consumed by higher trophic levels.
Because grass shrimps and mud crabs are considered annual species, we calculated annual production by multiplying average weight per individual by the augmented density estimate. Consistent with the method of quantification of injury to subtidal benthos following the Chalk Point oil spill (Peterson 2002), we assumed that the small crustaceans undergo two generations per year. To determine the expected augmentation of absolute abundance per m2 for each prey type deemed to be enhanced by oyster reef presence (grass shrimp, mud crabs, and small crustaceans), we subtracted our density estimate of each group on shell bottom (subtracting 30% from our on-reef density estimate based on data in Powers and Grabowski [unpub. data]). The rationale was that the density of crabs, shrimp, and small crustaceans on shell bottom represents prey that would be present in the absence of restoring live reef habitat and that the reef should be credited only for the enhancement of prey.
On-reef density estimates of grass shrimp and mud crabs are estimated from those studies reviewed in Peterson et al. (2002) that used sampling gear appropriate for the estimation of mobile crustaceans (i.e., lift nets, drop samplers) plus additional information from ongoing studies in North Carolina (Powers and Grabowski, unpub. data). For grass shrimp we sum the density estimates of the spring/summer and fall/winter samplings to account for the likely presence of two seasonally recruiting cohorts of grass shrimp within the year (Kneib 1987). For mud crabs, that generally have only a single cohort each year, we treated seasonal variation in density estimates differently. The spring/summer density of crabs is treated as the estimate of maximum recruitment, whereas the fall/winter estimate represents those recruits that have survived.
Because predators will consume almost all mud crabs, we credited the entire augmented density (i.e., the density from spring/summer) as prey, but used the differences in seasonal abundance to determine the average weight these crabs would likely have achieved before being consumed. For crabs consumed after spring/summer but before fall/winter (i.e., density in spring/summer – density in fall/winter = crabs consumed during summer), we calculate production by multiplying this density difference by the average weight of a mud crab 18 mm in carapace width. For that fraction of crabs consumed after the fall/winter sampling (i.e., density in fall/winter = crabs consumed after summer’s end), we calculate production by multiplying this density estimate by the average AFDW of a mud crab 28 mm in carapace width. Production of mud crabs as prey is then the sum of these two seasonal production estimates.
14

A. Suspension feeding production
Exhibit A-1
PARAMETERS
Age class (i)a N
( oyster m
-2)b
Average shell length at i
(mm)c
Average tissue weight (g, dry
weight) for id
Average tissue weight (g, AFDW)
for i e
Base
W(i-1)-W i g
f: Tissue (g, AFDW)
Production Production (N*Wi) h (d) i
0 500 7 1 175 35 0.6 0.48 0.48 84.00 81.552 123 60 0.8 0.64 0.16 19.60 18.473 86 80 1.4 1.12 0.48 41.16 37.674 60 100 2.3 1.84 0.72 43.22 38.405 42 115 3.1 2.48 0.64 26.89 23.20
B.
-2) Total production (g m
Oyster production to predators
0 199.29
Age class (i)a N
( oyster m
-2)b
Mortality during the yr (
oyster m -2) Mortality due
j to predators
Average shell length at i
(mm)c
Average tissue weight (g, dry
weight) for id
Average tissue weight (g, AFDW)
for i e M id-year weight
(g AFDW for i) k
f Base : Tissue (g, AFDW) Mid-year weight (g Production Production
(N*W m) L AFDW for i) (d) i
0 500 325 163 7 0.3 0.24 0.36 0.36 58.50 58.5 1 175 53 26 35 0.6 0.48 0.56 0.72 18.90 18.35 2 123 37 18 60 0.8 0.64 0.88 1.18 21.68 20.44 3 86 26 13 80 1.4 1.12 1.48 1.82 23.41 21.42 4 60 18 9 100 2.3 1.84 2.16 2.46 22.15 19.68 5 42 42 21 115 3.1 2.48 2.76 2.76 57.98 50.02
188.41
0
a Age class notation: age class 1 is 365 days past origina l planting day (i.e. age 0). b Mortality rate is 65% during first year and 30% for all following years based on Paynt er (unpubl. data, pers comm.) and Abb e and Judy (pers. comm.). Origi nal planting density is 500 m -2. Al l oysters ar e assum ed to be dead afte r reachi ng their 5th birthday (see report text fo r explanation). c Age-length relationships fo r oysters through ag e 2 ar e based on Paynt er (unpubl. data, pers. comm.) wit h growth slowing in years 3- 5 (bas ed on Judy and Abbe, pers. comm.). d Length-weight relationship bas ed on Paynt er (unpubl. data) for age clas s 0 and A bbe and Judy (pers. comm.)for all othe r age classes. e Based on data presented in Bahr & Lani er 1981 ash free dry weight (AFDW i n g) is calculat ed as 0. 8 of dry tissue weig ht (g). f Production is calculated as g AFDW without oyster shell to match the methodology used in the injury quantification. g Change in weight from one yea r class to the next is calculate by subtracting the previous year's weig ht gai n from the curr ent year's estimate. h Production is calculate by multiplying the average weig ht gain of an individual by the total number individuals surviving at the end of t hat particul ar year. i Producti on is discount ed at a rat e of 0.03 yr-1 from the time restoration is completed. j We assum e 50% of oysters mortality is transferred to predators/scavengers. k Predati on credit for oysters during the y ear is bas ed on the average weight for tha t y ear (weig ht at t he end o f previous age class+weig ht at the end of current age class/2). L Production going to predators/scavengers is calculate by multiplying mortality due to predators by the mid-year weight estimate.
15
Length estimates were based on data in Kneib (1987) for grass shrimp or from ongoing studies in North Carolina for mud crabs (Powers and Grabowski, unpub. data). Dry tissue weights of mud crabs and grass shrimp were determined from live and archived individuals at the Institute of Marine Sciences, University of North Carolina. Expected AFDW for mud crabs and grass shrimp were calculated by subtracting 14% from the dry tissue weight.
On-reef density estimates of the small crustaceans (amphipods, tanaids, and isopods) are estimated from quantitative density data on oyster reefs in Zimmerman et al. (1989). Their study used coring on oyster reefs in Galveston Bay (Texas) to document invertebrate density in two seasons, sampling in July and December. Consistent with the methods used in Peterson (2002) to compute the injury to amphipods, we assumed that each of these small crustaceans undergoes two generations annually and that the Zimmerman et al. (1989) samplings correspond to the peak abundances of each cohort. Consequently, we added the abundances of these two cohorts and multiplied by average AFDW per individual (from Patuxent River data in Llanso and Volstad 2000) to form our estimate of the total annual production. This calculation was done separately for amphipods, tanaids, and isopods but reported as the sum here in the text. The AFDW value used for each of these three taxa of small crustaceans represents the unweighted average computed across all species within the relevant taxon found in the Llanso and Volstad sampling of subtidal benthos in the Chalk Point area of the Patuxent River. Because it is likely that all of this production will be consumed by fish and other predators, we credit the entire annual production of small crustaceans as prey.
Production for grass shrimp, crabs and small crustaceans in years after year 1 was discounted by a standard annual discount rate (d) of 0.03: Py·1/(1+d)y. We then summed these production estimates over the five-year lifetime of a functional oyster reef to produce an estimate of total annual augmented production for each taxon. Chris Judy and other experts report that for scaling purposes, oysters on restored reefs in the Patuxent River can be expected to be productive for five years after an initial seeding because of mortality from sedimentation, low dissolved oxygen, oyster disease and similar factors.
These calculations result in estimated oyster reef production of 82 grams (AFDW) of mud crabs, 83 grams (AFDW) of grass shrimp and 12 grams (AFDW) of small crustaceans per square meter over the five year expected duration, as summarized in Exhibit A-2 below.
16

a Season
Augmented Density
-2) b (No. m
Reef Enhanced Density
-2) c (No. m N preyed
d upon
Average carapace
width at age i
Average Weight (g,
wet)
Average Weight (g, dry
tissue)
Average weight (g,
AFDW) AFDW
= N*W P
Spring/Summer 66 46.2 34.3 1.8 0.81 0.24 0.21 7.20 Fall/Winter 17 11.9 11.9 2.8 3.50 1.05 0.90 10.74 Year Total 17.94
Year Annual Crab P
AFDW) (
Dicounted Crab P
(AFDW)e
1 17.94 17.422 17.94 16.913 17.94 16.424 17.94 15.945 17.94 15.48
Total Production -2) (g m 82.17
2. Grass shrimp
a Season
Augmented Density
-2) b (No. m
Reef Enhanced Density
-2) c (No. m N preyed
d upon
Average carapace
width at age i
Average Weight (g,
wet)
Average Weight (g, dry
tissue)
Average weight (g,
AFDW) AFDW
= N*W P
Spring/Summer 151 105.7 105.7 29 0.3 0.1 0.09 9.09 Fall/Winter 151 105.7 105.7 29 0.3 0.1 0.09 9.09 Year Total 18.18
Discounted Grass Grass shrimp shrimp P (g,
Year P (AFDW) AFDW) 1 18.18 17.65 2 18.18 17.14 3 18.18 16.64 4 18.18 16.15 5 18.18 15.68
Total Production -2) (g m 83.26
Exhibit A-2
C. Production of other prey species (grass shrimp & mud crabs) 1. Mud Crabs
a Season density was measured. b Augmented density (density on oyster reef - density on unstructured bottom). c Enhanced density on reefs (density on live oyster reef - density on shell bottom). d Number of individuals from the season that are consumed by predators. e Production is discounted by 0.03 yr-1.
17

Annual Discounted Annual Year production Production
1 2.62 2.55 2 2.62 2.47 3 2.62 2.40 4 2.62 2.33 5 2.62 2.26
Total Production -2) (g m 12.01
Exhibit A-2 (continued)
3. Small Crustaceans, amphipods+tanaids+isopods
Taxaa
Augmented Density
(No. m-2) b
Reef Enhanced Density
(No. m-2) c
Avg. individual weight (g, AFDW)d
Biomass (g/m2)
# of generations/
year
Annual Production
(g/m2) Amphipods 8320 5824 0.00019 1.10656 2 2.21312 Tanaids 2061 1442.7 0.00005 0.072135 2 0.14427 Isopods 422 295.4 0.00045 0.13293 2 0.26586 Total small crustaceans 2.62325
a Taxa = amphipods, tanaids, or isopods b Augmented density (density on oyster reef - density on unstructured bottom); density estimates are from Zimmerman et al. 1989 c Enhanced density on reefs (density on live oyster reef - density on shell bottom). d Average weights are identical to those used in injury calculations. The weights for each group represent the average of species collected in the assessment. For tanaids, the average weight for a corophid was used. e Production is discounted by 0.03 yr-1.
18
Assumed ecological efficiencies for trophic step: Consumer Prey/food % Efficiency
Invertebrate or fish Invertebrate 20 Birds, mammals Invertebrate 2
Invertebrate or fish Finfish 20 Birds, mammals Finfish 2
Invertebrate detritivore Macrophytes 4 Finfish detritivore Macrophytes 4
Birds, mammals (herbivores) Macrophytes 0.03
APPENDIX B
Scaling Estimates for Compensatory Restoration
The scale (area) of habitat needed to compensate for the injuries resulting from the Chalk Point spill are calculated using the following assumptions: • The bird injury is as from: “Estimate of Total Acute Mortality to Birds Resulting from the Chalk
Point Oil Spill, Swanson Creek, Maryland, April 7 2000”, prepared by the Wildlife Injury Workgroup of the Chalk Point NRDA Council, dated May 2001 and “Reproductive Success Of Osprey (Pandion haliaetus) Nesting In The Vicinity Of The Chalk Point Oil Spill”, Final Report October, 2001. Scaling for ruddy ducks is calculated separately and not included in the totals.
• The benthic infauna and mollusk injury is from Peterson (2002). Half of the net gain in polychaete production is credited against the amphipod injury to calculate a total benthic infauna injury (following the arguments in Peterson, 2002). The injuries are translated to wet weight from ash free dry weight (AFDW) assuming AFDW is 86% of (decalcified) dry weight and dry weight is 15% of wet weight.
• The fish and macroinvertebrate injury is from French McCay and Jennings (March 2002). Scaling to oyster reef and marshes is performed for all injuries except for oysters in Exhibits B-3 to B-7.
• All marsh restoration projects are assumed habitat creation projects, where the previous habitat for the restored area is assumed to have no contribution to fauna equivalent to those injured.
• Scaling is calculated assuming that the fauna supported by the restored habitat are food-limited, such that the net gain in production from the habitat translates to a net gain is consumer species.
• A net gain is species of the same trophic level is assumed to be equivalent in ecological services to the injured species.
• Ecological efficiencies (given in Exhibits B-3 to B-7) are calculated relative to benthic infaunal detritivores and omnivores using the assumed ecological efficiencies per step in the food chain in the table below. When macrophyte production is used for scaling, the ecological efficiency relative to detritivores is multiplied by 0.04 to account for the additional trophic transfer step from macrophyte production to detritivore. If an injured resource is of the same trophic level as detritivores, the ecological efficiency is indicated as 100% in Exhibits B-3 to B-7 (i.e., they are assumed equivalent in value).
• The project life is assumed 50 years for marshes, an d 5 or 10 years for oyster reef. • For the oyster reef, production available to the food web for each of the 5 years following a single
year of seeding is assumed 365.9 g AFDW/m2 as described in Appendix A, corrected to wet weight using available species-specific information in Exhibits A-1 and A-2. Absent species-specific information, we assume AFDW is 86% of dry weight, and dry weight is 15% of weight. Two options are scaled: a single seeding in 2003 and two seedings of the same acreage, one in 2003 and one in 2008. The second seeding is discounted for 8 years of lag time between the injury and restoration.
• Oysters are assumed restored by oyster reef suspension feeding production of 199.3 g AFDW/m2 (Appendix A). Assuming a conversion for oysters of 80% AFDW per unit dry weight and 15%
19
dry weight of wet weight, this is equivalent to 1661 g wet weight/m2 (these same conversion factors are used to translate the oyster injury). Results are in Exhibit B-8. As noted in the text, these services are provided simultaneously with predation services; the calculations in Exhibit B-8 demonstrate that the size of reef needed to scale non-oyster injuries also will provide sufficient oyster biomass to restore oyster injuries.
• For marshes, it is assumed that the marsh develops to 80% functionality in 15 years and levels off to remain at that level indefinitely. This is based on Wetlands Assessment Subgroup (2002) in their scaling of the Chalk Point marsh restoration and is consistent with French et al (1996, based on Dunn and Best, 1983; Broome et al, 1986; D’Avanzo et al, 1989; PERL, 1990; Blair, 1991). The logistic model in French et al (1996) is used to make these calculations, such that the gains increase according to that function over years after the restoration is initiated.
• Future gains from marsh production are discounted at 3% annually. • It is assumed that the restoration projects are performed in 2003. Discounting is used to account
for the lag from the year of the spill (2000) to 2003.
20

Exhibit B-1. Bird injury as numbers (from the Wildlife Injury Working Group) and biomass (kg). Estimated weight per bird is from Sibley (2000).
Affected Biota* Numbers Lost kg/bird kg Injury Greater Scaup 9 1.05 9.45 Green-winged Teal 11 0.35 3.85 Canada Goose 3 3.05 9.15 Mallard 19 1.1 20.9 American Coot 34 0.65 22.1
Total waterfowl 76 65.45
Double-crested Cormorant 43 1.7 73.1 Loon 1 4.1 4.1 Gulls 2 1.1 2.2 Terns 2 0.16 0.32
Total seabirds 48 79.72
Great Blue Heron 3 2.4 7.2 Virginia Rail 1 0.085 0.085
Total waders 4 7.285
Osprey (Adults) 2 1.6 3.2 Osprey (Fledglings)** 8 1.6 12.8 Kingfisher 1 0.15 0.15
Total aerial piscivores 11 16.2
Other (passerine+unident.) 3 0.01 0.03
* The Trustees propose to restore ruddy duck injuries through a breeding habitat protection project, and so ruddy duck injuries are not scaled using the method described in this document. ** For consistency with the approach used to scale ruddy duck restoration, injuries to osprey fledglings (17 fledglings lost) are converted to adult-equivalents (8 adult-equivalents lost) before performing scaling calculations. We assume an osprey fledgling survival rate of 55 percent (Henny and Wight 1969, Spitzer 1980).
21

Component References Details Production estimates Macrophytes Valiela, I., Cole, M. L. , McClelland, J., Hauxwell, J.,
Cebrian, J., Joye, S. B (2000) Role of salt marshes as part of coastal landscapes.pp.23-38. See p.30 Fig 2. In
Weinsteen & Kreeger (2000) *
Production of macroalgae, eelgrass and phytoplantkton are functions of
the ratio of the saltmarsh area to estuary area
Waiquot Bay estuaries
Ranges for 0�60% change in ratio of saltmarsh to estuary area macroalgae 53�0 gm-2 (linear)
eelgrass 0�45 gm-2 (exponential)
does not state time units for production
Macrophytes Chambers, R. M., Meyerson, L. A. & Saltonstall, K. (1999) Expansion of Phragmites australis into tidal wetlands of
North America. Aquatic Botany, Vol. 64. Pp. 261-273
Review of causes and effects of Phragmites expansion into tidal wetlands. Evidence that Phragmites-
dominated brackish wetlands with full tidal flows can provide strong
trophic link to fishes and invertebrates of estuaries.
However, evidence that Phragmites can, in some instances, cause small
creeks to fill in restricting passage of foraging fish/crustaceans.
However, this result is not consistent.
No quantitative data presented
Macrophytes Daie & Waigert (1996) cited in Newell S. Y., & Porter D. Microbial secondary production from salt marsh-grass
shoots, and it’s known and potential fates. Pp 159-185. See p. 168 in Weinsteen & Kreeger (2000) *
Estimated for annual production of Spartina shoots at Sapelo Average for tall/short forms
1313 g m-2 yr-1
Exhibit B-2. References for biomass, density or production that were reviewed
22
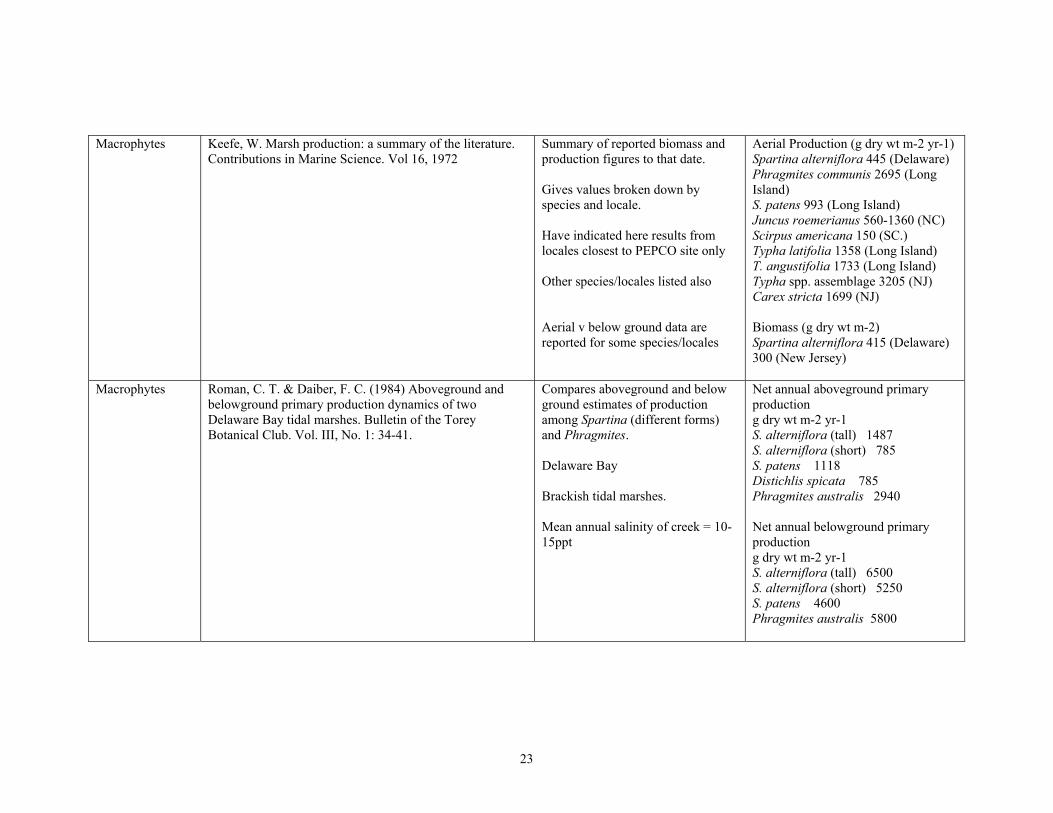
Macrophytes Keefe, W. Marsh production: a summary of the literature. Contributions in Marine Science. Vol 16, 1972
Summary of reported biomass and production figures to that date.
Gives values broken down by species and locale.
Have indicated here results from locales closest to PEPCO site only
Other species/locales listed also
Aerial v below ground data are reported for some species/locales
Aerial Production (g dry wt m-2 yr-1) Spartina alterniflora 445 (Delaware) Phragmites communis 2695 (Long Island) S. patens 993 (Long Island) Juncus roemerianus 560-1360 (NC) Scirpus americana 150 (SC.) Typha latifolia 1358 (Long Island) T. angustifolia 1733 (Long Island) Typha spp. assemblage 3205 (NJ) Carex stricta 1699 (NJ)
Biomass (g dry wt m-2) Spartina alterniflora 415 (Delaware) 300 (New Jersey)
Macrophytes Roman, C. T. & Daiber, F. C. (1984) Aboveground and belowground primary production dynamics of two Delaware Bay tidal marshes. Bulletin of the Torey Botanical Club. Vol. III, No. 1: 34-41.
Compares aboveground and below ground estimates of production among Spartina (different forms) and Phragmites.
Delaware Bay
Brackish tidal marshes.
Mean annual salinity of creek = 1015ppt
Net annual aboveground primary production g dry wt m-2 yr-1 S. alterniflora (tall) 1487 S. alterniflora (short) 785 S. patens 1118 Distichlis spicata 785 Phragmites australis 2940
Net annual belowground primary production g dry wt m-2 yr-1 S. alterniflora (tall) 6500 S. alterniflora (short) 5250 S. patens 4600 Phragmites australis 5800
23

Macrophytes Stribling, J. M. & Cornwell, J. C. (1997) Identification of important primary producers in a Chesapeake Bay Tribal Creek System using stable isotopes of carbon and sulphur. Estuaries. Vol. 20, No. 1. pp.77-85.
Reports biomass at midcreek (212ppt) and uppermost point (0-4ppt) for macrophytes
Also has C and S content of macrophytes and consumers
S. alterniflora 240-360
Macrophytes Windham, L. (2001) Comparison of biomass production and decomposition between Phragmites australis (common red) and Spartina patens (salt hay grass) in brackish tidal marshes of New Jersey, USA. Wetlands. Vol. 21, No. 2: 179-188.
Compared standing stock (above/below ground) and rates of decay between marsh types
Brackish section of Mullica River, Great Bay, southern New Jersey
0.5 to 18 ppt
P. australis invasion leads to build up of organic biomass in sediment compared to S.patens
Peak-season above ground biomass (mean ash free dry weight g m-2)
S. patens 694 P. australis 1855
Peak season below ground biomass (mean ash free dry weight g m-2)
S. patens 757 P. australis 1368
Total pool dead biomass (mean ash free dry weight g m-2)
S. patens 1802 P. australis 624
Macrophytes Windham, L. & Lathrop, R. G. (1999) Effects of Phragmites australis (Common Reed) invasion on aboveground biomass and soil properties in brackish tidal marsh of the Mullica River, New Jersey. Estuaries. Vol. 22, No. 4 pp.927-935.
Compared soil characteristics with age of invasive Phragmites stands
Brackish region (0.5-18 ppt) about 17 km upstream from river mouth
Biomass (g m-2) “mixed shortgrass” 199
Phragmites 1868
Phragmites biomass is increasing function of age for first 7 years
24

Birds Benoit, L. K. & Askins, R. A (1999). Impact of the spread of Phragmites on the distribution of birds in Connecticut tidal marshes. Wetlands, Vol. 19, No. 1. pp. 194-208.
Compares bird counts for individual spp. among 6 vegetation types:
Salt and brackish marshes
1.Short-grass meadow (>50% mixed cover) 2. Phragmites (> 50% monoculture cover) 3. Cattail (>30% cattail, < 30% other spp.) 4. Brackish mixture (graminoids and tall emergents, each < 50% cover). 5. Short Spartina alterniflora (>50% cover < 50 cm tall)
Abundance of individual spp. also compared
Highest mean species (5.2) and [mean no. of marsh specialists] (2.56) in Brackish mixture
Per 7,854 m2 (50 m radius plot)
For comparison: Phragmites: 3.64 , [1.71]
Short Spartina: 5.0, [ 0.67]
Species using habitats in order: Cattail: 8 Phragmites: 11 Short Spartina: 13 Brackish mixture: 16 Short-grass meadow: 24
Fish/Decapods Smith, K. J., Taghon, G. L. & Able K. W. Trophic linkages in marshes: Ontogenetic changes in diet for young of the year Mummichog, Fundulus heteroclitus. Pp. 221-236 in Weinsteen & Kreeger (2000) *
YOY sampled from flooded salt marsh surfaces, lower Delaware Bay
Former salt hay farm, now extensive stands of Spartina alterniflora
Density was 15-30 fish m-2
F. heteroclitus are a vector for production export.
25
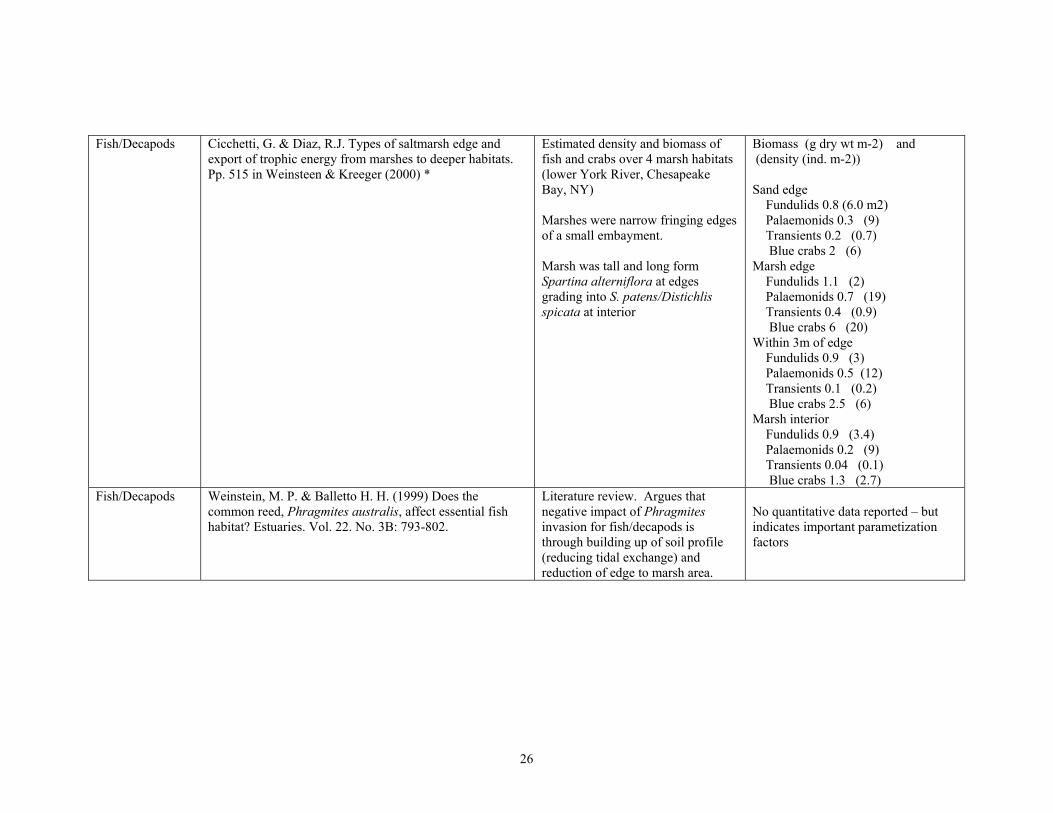
Fish/Decapods Cicchetti, G. & Diaz, R.J. Types of saltmarsh edge and export of trophic energy from marshes to deeper habitats. Pp. 515 in Weinsteen & Kreeger (2000) *
Estimated density and biomass of fish and crabs over 4 marsh habitats (lower York River, Chesapeake Bay, NY)
Marshes were narrow fringing edges of a small embayment.
Marsh was tall and long form Spartina alterniflora at edges grading into S. patens/Distichlis spicata at interior
Biomass (g dry wt m-2) and (density (ind. m-2))
Sand edge Fundulids 0.8 (6.0 m2) Palaemonids 0.3 (9) Transients 0.2 (0.7) Blue crabs 2 (6)
Marsh edge Fundulids 1.1 (2) Palaemonids 0.7 (19) Transients 0.4 (0.9) Blue crabs 6 (20)
Within 3m of edge Fundulids 0.9 (3) Palaemonids 0.5 (12) Transients 0.1 (0.2) Blue crabs 2.5 (6)
Marsh interior Fundulids 0.9 (3.4) Palaemonids 0.2 (9) Transients 0.04 (0.1) Blue crabs 1.3 (2.7)
Fish/Decapods Weinstein, M. P. & Balletto H. H. (1999) Does the common reed, Phragmites australis, affect essential fish habitat? Estuaries. Vol. 22. No. 3B: 793-802.
Literature review. Argues that negative impact of Phragmites invasion for fish/decapods is through building up of soil profile (reducing tidal exchange) and reduction of edge to marsh area.
No quantitative data reported – but indicates important parametization factors
26

Fish/Decapod Able, K. W. & Hagan, S.M. (2000) Effects of Common Compare larval, juvenile and later Pit traps –selective for larvae/juv. Reed (Phragmites australis) invasion on marsh surface stages of fish/crustacean abundance CPUE (catch per trap) for two macrofauna: Response of fishes and decapod crustaceans. and species richness among marshes consecutive years Estuaries. Vol. 23: 633-646 were P. australis or S. alterniflora +
other spp. were aerial dominants. All fish species
All sites within 1.5 km2 area. P. australis 0.08 / 0.07
S. alterniflora 2.89 / 2.78 Mullica River, southern New Jersey.
All crab speciesSalinity 0-20 ppt P. australis 0.43 / 0.15
S. alterniflora 0.47 / 1.56 Elevation not significantly different between sites. Flume nets – selective for later stages
CPUE (catch per net) Marsh surface topography DID vary by vegetation type. Standing water All fish species present at Spartina sites, little or P. australis 2.78 none at Phragmites sites. S. alterniflora 3.64
Larval fish consistently far more All crab speciesabundant in S. alterniflora than in P. P. australis 19.80 australis. S. alterniflora 22.48
Larval fish also more abundant at F. heteroclitus larvae/early juveniles back of S. alterniflora than front almost excusively in Spartina mix edge. (with pools) and rare in Phragmites
(lacking pools). Note: larval fish were collected in pit-traps that mimicked standing As F. heteroclitus selectively deposit pools of water. eggs, pattern indicates that Spartina is
the strongly preferred laying site and No strong and consistent pattern for larvae continue to use pools initially, later stages. Overall fish abundance then occupy marsh habitats without similar. Some species most preference at later stages. abundant in Spartina, some in Phragmites.
27

Fish/Decapods Meyer, D. L, Johnson, J. M., Gill, J. W. (2001) Comparison of nekton use of Phragmites australis and Spartina alterniflora marshes in the Chesapeake Bay, USA. Marine Ecology Progress Series. Vol 209: 71-84
Compare fish/crustacean abundance and spp. richness among marshes of each type.
Note: sites for both types were structurally similar: relatively open with small sinuous channels between hummocks. See Weinstein & Balletto
Salinity 5-10 ppt
No significant (or consistent) difference in abundance or biomass of any species or all spp. of fish
Paper also reports densities of spp. at Table 3.
Mean biomass of all fish species [& decapod spp. in brackets] g wet wt. per linear m. of fringe
May Phragmites 305.9 [11.7] Spartina 309.2 [7.7]
July Phragmites 345.6 [5.1] Spartina 325.6 [0.16]
October Phragmites 159.0 [77.1] Spartina 204.1 [27.5]
.
Fish/Decapod Able, K. W., Nemerson, D. M., Light, P. R. & Bush, R.O (2000) Initial response of fishes to marsh restoration at a former salt hay farm bordering Delaware Bay. Pp. 749-773. in Weinsteen & Kreeger (2000) *
Compared nekton between salt-hay farm ditches and creeks where hydroperiod had been restored recently and 2 decades previously.
Delaware Bay
Salinity in recently & longer term restored creeks similar: 12-22 ppt.
Large increase in spp. richness with restoration. Species richness (for 99% abundance) Pre: 2 spp Post: 12 spp
Abundance reportedly increased but change was not quantified because of different gear efficiencies.
Fish/Decapod Kneib, R. T. (2000). Salt marsh ecoscapes and production transfers by estuarine nekton in the southeastern Unites States. Pp. 267- 291. in Weinsteen & Kreeger (2000) *
Reviews evidence for nekton production from tidal marshes (at general “marsh” level) and quotes production values reported in the literature.
Fundulus heteroclitus 10-16 g dry wt m-2 yr-1 (Valiela et.al 1977)
Palaemonnetes pugio 9-16 g dry wt m-2 yr-1(Sikora 1977, Welsh 1975)
28

Fish Hettler W. F Jr. (1989) Nekton use of regularly-flooded saltmarsh cordgrass habitat in North Carolina, USA. Marine Ecology Progress Series. Vol. 56: 111-118.
Sampled fish and crustaceans from a regularly-flooded saltmarsh monthly. Compared abundance and biomass by stream order and month
Salinity 25-35 ppt
Reports biomass and abundance for each species.
Individual species showed preference for rivulets or channel.
Mean biomass of all species combined peaked in September at 900 g per 10 m of marsh.
Fish Meredith, W. H. & Lotrich V. A. (1979) Production dynamics of a tidal creek population of Fundulus heteroclidus (Linnaeus). Estuarine and Coastal Marine Science. Vol. 8: 99-118.
Calculated biomass and production for life-stages of Fundulus heteroclitus
From main channel of a creek off Delaware Bay. Salinity 18-28ppt
Reports production estimates by size class (and summed) for 7 seasons.
Average annual production 40.7 g dry wt m-2 yr-1
Macroinfauna Sarda, R. Foreman, K. and I. Valielea. (1995) Macroinfauna of a southern New England salt marsh: seasonal dynamics and production. Marine Biology Vol. 121: 431-445
Compared density and biomass between sandy inorganic, sandy organic and muddy sediments
Great Sippewisset salt marsh (Mass.)
Salt marsh dominated by Spartina spp. Mean salinity 26 ppt
Also reports seasonal values for individual spp.
Production (g dry wt m-2 yr-1) Sandy inorg. 15.0 Sandy org. 98.7
Mud 6.0
Biomass (g m-2) Sandy inorg. 3.0
Sandy org. 24.0 Mud 1.6
Density (ind m-2) Sandy inorg. 28128 Sandy org. 24494
Mud 18215
29

Macroinfauna Sarda, R. Valiela, I. & Foreman K. (1995) Life cycle, demography, and production of Marenzelleria viridis in a salt marsh of southern New England. J. mar. biol. Ass. U.K. Vol. 75: 725-738
Reports density and biomass of M.viridis and all other macroinfaunal spp. from sandy organic sediments
Gives results by month also
Great Sippewissett marsh (Mass.)
Mean salinity 26 ppt
Annual production for M. viridis was 60 g m-2 yr-1 in one year and 26 g m2 yr-1 in subsequent year.
M. viridis Ann. Mean density 3689 m-2 Ann. Mean biomass 9.69 g m-2 All other spp. Ann. Mean density 20,804 m-2 Ann. Mean biomass 11.2 g m-2
Macroinfauna Fleeger, J. W. & Palmer, M. (1982) Secondary production of the estuarine, meiobenthic copepod Microarthridion littorale. Marine Ecology Progress Series. Vol 7. 157-162
Annual production estimate for one meiobenthic sp.
Soft sediment between “healthy” Spartina culms
Intertidal estuary
0.14 g (dry) m-2 yr-1
Macroinfauna Sarda, R. Foreman, K. Wermee, C. E., and Valiela, I. (1998) The impact of epifaunal predation on the structure of macroinfaunal invertebrate communities of tidal saltmarsh Creeks. Estuarine, Coastal and Shelf Science. Vol. 46: 657-669.
Reports annual production of macro-infauna in sandy organic sediments
Great Sippewissett marsh (Mass.)
Paired sites along a salinity gradient. Mean range 3.6 to 20 ppt
Average production of all macroinfauna
77.2 g dry wt m-2 yr-1
Values are also reported for individual spp.
30

Macroinfauna
&
Fish
Fell, P. E. Weissbach, S. P., Jones D. A. Fallon M. A., Julie A. Z., Faison E. K., Lennon K. A., Newberry K. J. & Reddington L. K. (1998) Does invasion of oligohaline tidal marshes by red grass, Phragmites australis (Cav.) Trin. ex Steud., affect the availability of prey resources for the mummichog, Fundulus heteroclitus L.? Journal of Exp. Mar. Biol. Ecol. 222:59-77.
Compared macroinfaunal abundance and feeding by F. heteroclitus on macroinfauna among Phragmites monocultures and mixed stands (Juncus/Spartina)
Connecticut River
Paired sites along a salinity gradient. Mean range 3.6 to 20 ppt
Four major macroinfaunal spp. were at least, and often more, abundant in Phragmites. monoculture stands than adjacent mixed stands.
F. heteroclitus fed effectively within the Phragmites monoculture –using both the marsh surface (when flooded) and channels through the marsh.
Gut contents of F. heteroclitus that had fed in the two marsh tyes weer similar
Mean densities + SE (ind. m-2) are reported for site by date by species for the two habitats.
Abundance not significantly different.
Phytoplankton Valiela, I., Cole, M. L. , McClelland, J., Hauxwell, J., Cebrian, J., Joye, S. B (2000) Role of salt marshes as part of coastal landscapes.pp.23-38. See p. 30 Fig 2. In Weinsteen & Kreeger (2000) *
Production of macroalgae, eelgrass and phytoplantkton are functions of ratio of saltmarsh to estuary area
(Waiquot Bay estuaries)
Ranges for 0�60% change in ratio of saltmarsh/estuary areas.
Phytoplankton 3�1.5 mgO2L-1 (linear) does not state time period for rate
31

Bacterial production
Newell S. Y., & Porter D. Microbial secondary production from salt marsh-grass shoots, and it’s known and potential fates. Pp 159-185. See p. 169. Table 3. in Weinsteen & Kreeger (2000) *
Study reports estimates for: -Bacterial productivity on dead Spartina shoots -Bacterioplankton -Bacteria in sediment (to 20 cm) -Total fungal productivity
10 (summer) 35 (winter) mg m-2 528(summer) 36(winter) mg m-2 750 (summer) 265 (winter) mg m-2 369 (summer) 3652(winter) mg m-2 rates are per day
Bacterial production
Sullivan M. J., & Currin C, A. Community structure and functional dynamics of benthic microalgae in salt marshes. Pp.81-106. See Table 2. p.93 in Weinsteen & Kreeger (2000) *
Annual benthic microalgal productivity in Saltmarshes compared geographically
Massachusetts 105 gC m-2 yr-1 Delaware 61-99 gC m-2 yr-1
* Concepts and controversies in tidal marsh ecology (2000). Edited by Weinstein, M.P. & Kreeger, D. A.. Kluwer Academic Publishers, The Netherlands. ISBN 0-7923-6019-2.
32

Exhibit B-3. Restoration scaling of fish, invertebrate and bird injuries using secondary (benthic) production from oyster reef available to the food web (365.9 g AFDW/m2 = 2272 g wet weight/m2), assuming the reef is seeded once in 2003. Time for restored habitat to be 99% of fully functional is assumed 1 year and the project life is 5 years.
Species Category Total Injury
(kg)
Trophic Level Ecological Efficiency Relative to
Benthic Detritivores
(%)
Compensatory Production
(kg)a
Habitat Area (m2)b
Habitat Area
(acres)
Fish and Invertebrates: Small pelagic fish 217 planktivorous 20 1,085 522 0.129 Large pelagic fish 737 piscivores 4 18,416 8857 2.188
Demersal fish 802 bottom feeders 20 4,009 1928 0.476 Demersal
macroinvertebrates 706 bottom feeders 20 3,530 1698 0.419
Mollusks 14,983 filter/bottom feeder
100 14,983 7206 1.781
Benthic invertebrates (non
molluscan)
2,446 filter/bottom feeder
100 2,446 1177 0.291
Birds: Waterfowl ( # * kg
each) 65 bottom feeders 2 3,273 1574 0.389
Seabirds ( # * kg each)
80 piscivores 0.4 19,930 9585 2.368
Waders ( # * kg each)
7.2 piscivores 0.4 1,800 866 0.214
Shorebirds ( # * kg each)
0.1 bottom feeders 2 4 2 0.001
Raptors ( # * kg each)
16 piscivores 0.4 4,038 1942 0.480
Subtotal fish and invertebrates
19,891 21,386 5.28
Subtotal birdsc 169 13,968 3.45 Total all species 20,059 73,512 35,355 8.74
a: compensatory production = total injury / ecological efficiency. Calculated totals may vary slightly from numbers presented in the table due to ro unding. b: habitat area = compensatory production / 2.079 kg per square meter. 2.079 kg per square meter = 2.272 kg per square meter / (1.03)3, and is the oyster reef productivity expressed as wet weight, summed over the productive life of the project and discounted three years to account for timing differences between injury and expected restoration. Calculated totals may vary slightly from numbers presented in the table due to rounding. c: as noted in the text, scaling results for bird injuries presented here do not include ruddy ducks.
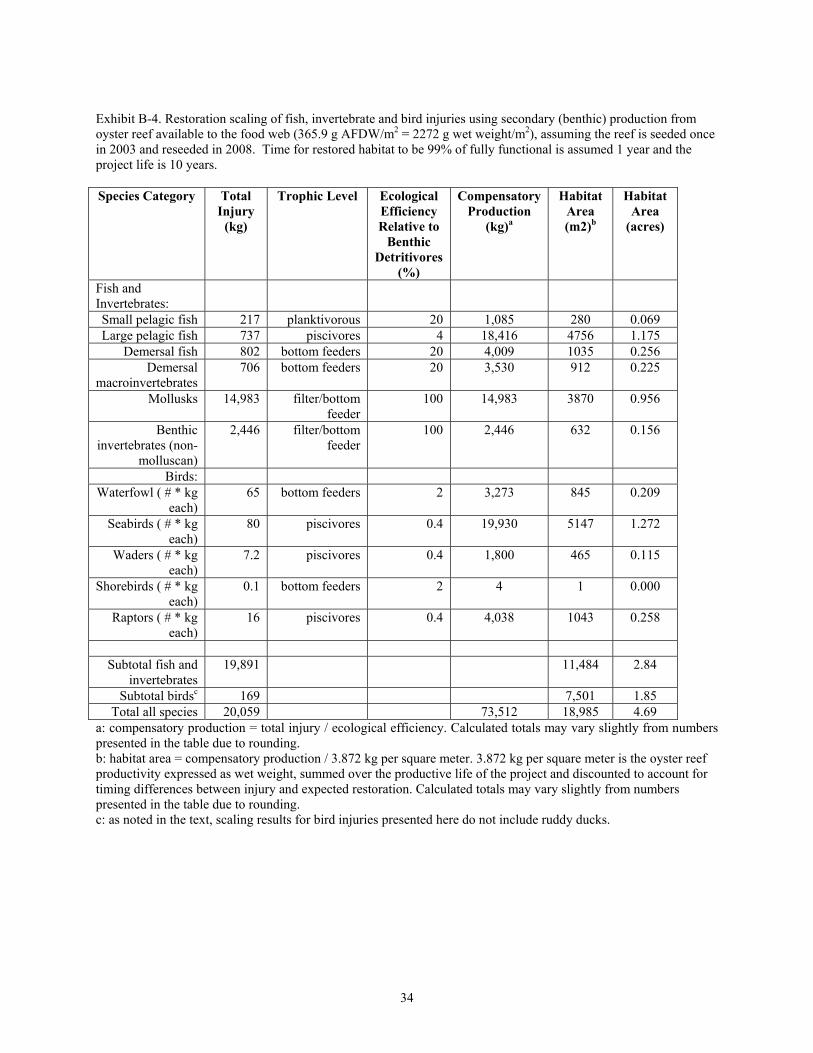
Exhibit B-4. Restoration scaling of fish, invertebrate and bird injuries using secondary (benthic) production from oyster reef available to the food web (365.9 g AFDW/m2 = 2272 g wet weight/m2), assuming the reef is seeded once in 2003 and reseeded in 2008. Time for restored habitat to be 99% of fully functional is assumed 1 year and the project life is 10 years.
Species Category Total Injury
(kg)
Trophic Level Ecological Efficiency Relative to
Benthic Detritivores
(%)
Compensatory Production
(kg)a
Habitat Area (m2)b
Habitat Area
(acres)
Fish and Invertebrates: Small pelagic fish 217 planktivorous 20 1,085 280 0.069 Large pelagic fish 737 piscivores 4 18,416 4756 1.175
Demersal fish 802 bottom feeders 20 4,009 1035 0.256 Demersal
macroinvertebrates 706 bottom feeders 20 3,530 912 0.225
Mollusks 14,983 filter/bottom feeder
100 14,983 3870 0.956
Benthic invertebrates (non
molluscan)
2,446 filter/bottom feeder
100 2,446 632 0.156
Birds: Waterfowl ( # * kg
each) 65 bottom feeders 2 3,273 845 0.209
Seabirds ( # * kg each)
80 piscivores 0.4 19,930 5147 1.272
Waders ( # * kg each)
7.2 piscivores 0.4 1,800 465 0.115
Shorebirds ( # * kg each)
0.1 bottom feeders 2 4 1 0.000
Raptors ( # * kg each)
16 piscivores 0.4 4,038 1043 0.258
Subtotal fish and invertebrates
19,891 11,484 2.84
Subtotal birdsc 169 7,501 1.85 Total all species 20,059 73,512 18,985 4.69
a: compensatory production = total injury / ecological efficiency. Calculated totals may vary slightly from numbers presented in the table due to rounding. b: habitat area = compensatory production / 3.872 kg per square meter. 3.872 kg per square meter is the oyster reef productivity expressed as wet weight, summed over the productive life of the project and discounted to account for timing differences between injury and expected restoration. Calculated totals may vary slightly from numbers presented in the table due to rounding. c: as noted in the text, scaling results for bird injuries presented here do not include ruddy ducks.
34

Exhibit B-5. Restoration scaling of fish, invertebrate and birds injuries using primary (macrophyte) production from a Spartina saltmarsh. Saltmarsh production is assumed 6580 g dry wt m-2 yr-1 (from Roman and Daiber, 1984, assuming dry weight is 15% of wet weight). Recovery is assumed to reach 80% of this rate in 15 years.
Species Category Total Injury
(kg)
Trophic Level Ecological Efficiency Relative to
Benthic Detritivores
(%)
Compensatory Production
(kg)a
Habitat Area (m2)b
Habitat Area
(acres)
Fish and Invertebrates: Small pelagic fish 217 planktivorous 20 27,113 43 0.011 Large pelagic fish 737 piscivores 4 460,400 732 0.181 Demersal fish 802 bottom feeders 20 100,214 159 0.039 Demersal macroinvertebrates
706 bottom feeders 20 88,246 140 0.035
Mollusks 14,983 filter/bottom feeder
100 374,574 596 0.147
Benthic invertebrates (nonmolluscan)
2,446 filter/bottom feeder
100 61,159 97 0.024
Birds: Waterfowl ( # * kg each)
65 bottom feeders 2 81,813 130 0.032
Seabirds ( # * kg each)
80 piscivores 0.4 498,250 792 0.196
Waders ( # * kg each)
7.2 piscivores 0.4 45,000 72 0.018
Shorebirds ( # * kg each)
0.1 bottom feeders 2 106 0 0.000
Raptors ( # * kg each)
16 piscivores 0.4 100,938 160 0.040
Subtotal fish and invertebrates
19,891 1,768 0.44
Subtotal birdsc 169 1,155 0.29 Total all species 20,059 1,837,811 2,922 0.72 a: compensatory production = total injury / ecological efficiency. Calculated totals may vary slightly from numbers presented in the table due to rounding. b: habitat area = compensatory production / 628.76 kg per square meter. 628.76 kg per square meter is the marsh primary productivity expressed as wet weight, summed over the life of the project and discounted to account for timing differences between injury and restoration. Calculated totals may vary slightly from numbers presented in the table due to rounding. c: as noted in the text, scaling results for bird injuries presented here do not include ruddy ducks.
35

Species Category Total
Injury (kg)
Trophic Level Ecological Efficiency
Relative to Benthic
Detritivores (%)
Compensatory Production
(kg)a
Habitat Area
(m2)b
Habitat Area
(acres)
Fish and Invertebrates:
Small pelagic fish 217 planktivorous 20 1,085 147 0.036 Large pelagic fish 737 piscivores 4 18,416 2496 0.617 Demersal fish 802 bottom feeders 20 4,009 543 0.134 Demersal macroinvertebrates
706 bottom feeders 20 3,530 478 0.118
Mollusks 14,983 filter/bottom feeder
100 14,983 2031 0.502
Benthic invertebrates (nonmolluscan)
2,446 filter/bottom feeder
100 2,446 332 0.082
Birds: Waterfowl ( # * kg
each) 65 bottom feeders 2 3,273 444 0.110
Seabirds ( # * kg each)
80 piscivores 0.4 19,930 2701 0.667
Waders ( # * kg each)
7.2 piscivores 0.4 1,800 244 0.060
Shorebirds ( # * kg each)
0.1 bottom feeders 2 4 1 0.000
Raptors ( # * kg each)
16 piscivores 0.4 4,038 547 0.135
Subtotal fish and
invertebrates 19,891 6,026 1.49
Subtotal birdsc 169 3,936 0.97 Total all species 20,059 73,512 9,963 2.46
Exhibit B-6. Restoration scaling of fish, invertebrate and birds injuries using secondary (benthic macroinfauna) production from a Spartina saltmarsh. Saltmarsh production is assumed 77.2 g dry wt m-2 yr-1 (from Sarda et al 1998, assuming dry weight is 15% of wet weight). Recovery is assumed to reach 80% of this rate in 15 years.
a: compensatory production = total injury / ecological efficiency. Calculated totals may vary slightly from numbers presented in the table due to rounding. b: habitat area = compensatory production / 7.379 kg per square meter. 7.379 kg per square meter is the marsh secondary productivity expressed as wet weight, summed over the life of the project and discounted to account for timing differences between injury and restoration. Calculated totals may vary slightly from numbers presented in the table due to rounding. c: as noted in the text, scaling results for bird injuries presented here do not include ruddy ducks.
36
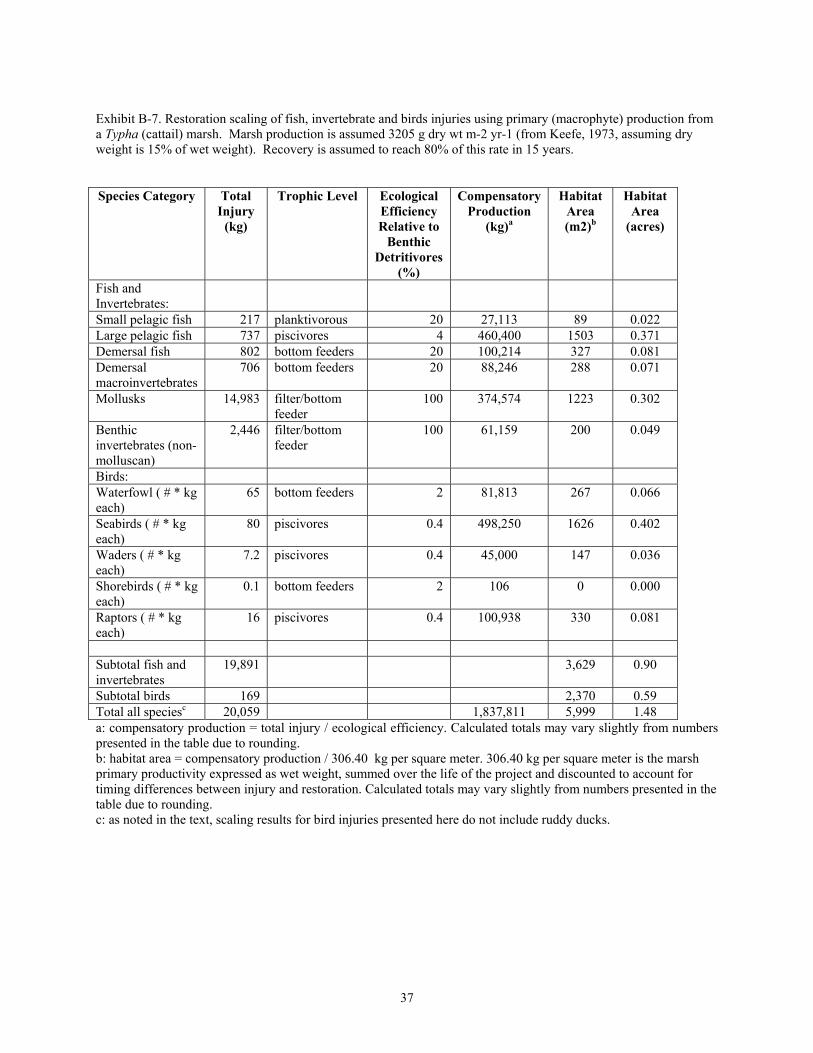
Exhibit B-7. Restoration scaling of fish, invertebrate and birds injuries using primary (macrophyte) production from a Typha (cattail) marsh. Marsh production is assumed 3205 g dry wt m-2 yr-1 (from Keefe, 1973, assuming dry weight is 15% of wet weight). Recovery is assumed to reach 80% of this rate in 15 years.
Species Category Total Injury
(kg)
Trophic Level Ecological Efficiency Relative to
Benthic Detritivores
(%)
Compensatory Production
(kg)a
Habitat Area (m2)b
Habitat Area
(acres)
Fish and Invertebrates: Small pelagic fish 217 planktivorous 20 27,113 89 0.022 Large pelagic fish 737 piscivores 4 460,400 1503 0.371 Demersal fish 802 bottom feeders 20 100,214 327 0.081 Demersal macroinvertebrates
706 bottom feeders 20 88,246 288 0.071
Mollusks 14,983 filter/bottom feeder
100 374,574 1223 0.302
Benthic invertebrates (nonmolluscan)
2,446 filter/bottom feeder
100 61,159 200 0.049
Birds: Waterfowl ( # * kg each)
65 bottom feeders 2 81,813 267 0.066
Seabirds ( # * kg each)
80 piscivores 0.4 498,250 1626 0.402
Waders ( # * kg each)
7.2 piscivores 0.4 45,000 147 0.036
Shorebirds ( # * kg each)
0.1 bottom feeders 2 106 0 0.000
Raptors ( # * kg each)
16 piscivores 0.4 100,938 330 0.081
Subtotal fish and invertebrates
19,891 3,629 0.90
Subtotal birds 169 2,370 0.59 Total all speciesc 20,059 1,837,811 5,999 1.48 a: compensatory production = total injury / ecological efficiency. Calculated totals may vary slightly from numbers presented in the table due to rounding. b: habitat area = compensatory production / 306.40 kg per square meter. 306.40 kg per square meter is the marsh primary productivity expressed as wet weight, summed over the life of the project and discounted to account for timing differences between injury and restoration. Calculated totals may vary slightly from numbers presented in the table due to rounding. c: as noted in the text, scaling results for bird injuries presented here do not include ruddy ducks.
37

Exhibit B-8. Restoration scaling of oyster injuries using suspension feeding production from oyster reef (199.3 g AFDW/m2 = 1661 g wet weight/m2), (1) assuming the reef is seeded once in 2003, where the time for restored habitat to be 99% of fully functional is assumed 1 year and the project life is 5 years; or (2) assuming the reef is seeded once in 2003 and reseeded in 2008, where the time for restored habitat to be 99% of fully functional is assumed 1 year and the project life is 10 years.
Number of Seedings Injury (kg wet weight) Reef Area (m2) Reef Area (acres) 1: in 2003 24 15.8 0.004 2: in 2003 and 2008 24 8.48 0.002
38
APPENDIX C
Available Data Comparing the Productivity of Phragmites to Other Types of Marsh
Phragmites australis has expanded rapidly in areal coverage over recent decades in marshlands along the northern and middle Atlantic coasts. The rate and pattern of this increase is perceived as invasive and related to anthropogenic interference either through genetic introductions or disturbance (Chambers et al. 1999). Reductions in plant diversity have been documented where there has been a shift to dominance by Phragmites (Odum et al. 1984 cites in Chambers et al. 1999). However, there appears to be less quantitative evidence for a consistent loss of productivity and ecosystem function with a change in marsh-plant species composition. Productivity, energy transfer and use of habitats by faunal components do not appear to be related to species composition of marshes per se, but to structural conditions of the marshes such as tidal exchange and access pathways for fauna. For example, Meyer et al. (2001) found no significant or consistent difference in abundance or biomass of any fish species or of all fish species combined when they compared structurally and hydrologically similar stands of Phragmites australis and Spartina alterniflora. Marshes in each case were relatively open with small sinuous channels between hummocks. In comparison, distinct increases in species diversity and abundance were found when the channel fringe area and tidal exchange were increased by restoration works within a monoculture of the one salt marsh species (S. alterniflora; Able et al. 2000).
Macroinvertebrate abundance does not appear to be reduced in Phragmites. Fell et. al. (1998) found that the four most common macroinvertebrate species in Connecticut brackish marshes were as abundant, and often more abundant in Phragmites monocultures than in adjacent stands of mixed salt marsh plants (either Juscus/Spartina mix or Typha/Scirpus mix). Further, they found that the numerically dominant fish species, Fundulus heteroclitus was feeding as effectively on the macroinvertebrate prey within Phragmites as on the other marsh types. Thus, Phragmites is an effective foraging source and there appears to be a direct trophic link between Phragmites and the adjacent estuary that is at least of the same magnitude as for the other, mixed marsh types.
Use of marshes by birds appears to be related to plant species, or at least to the mix of species. A lower number of bird species, and of saltmarsh specialist bird species, has been reported in stands where Phragmites was growing as a monoculture, when compared to other saltmarsh habitats in Connecticut (Benoit and Askins 1999). The highest species richness was found in marshes with the greatest diversity of marsh plants.
Weinstein and Balletto (1999) and Chambers et al. (1999) argued that potential negative impacts of Phragmites on nekton can result from the build up of sediment levels and choking of channels, with a reduction of tidal exchange and foraging pathways. The latter cites evidence that this build-up restricted movement by fish and crustaceans into feeding areas of Connecticut marshes (M.Sc thesis by Roman, 1978). In a latter study (Windham 2001), organic and inorganic material was found to build-up at three times greater rate in Phragmites monocultures compared to Spartina monocultures due to a greater rate of production and slower rate of decay. Keefe (1972) and Roman and Daiber (1984) also report higher production rates for Phragmites compared to other salt marsh plants.

The lack of quantitative production data showing net gains precludes scaling of marsh
alteration from Phragmites to other marsh types or of restoration by channelization of Phragmites to improve productivity. Thus, the scaling was performed for marsh “creation” projects. The assumption is made that the previous biota on the restored ground were either undesirable or not productive for marine resources.
40

REFERENCES
Able, K. W. & Hagan, S.M. (2000) Effects of Common Reed (Phragmites australis) invasion on marsh surface macrofauna: Response of fishes and decapod crustaceans. Estuaries. Vol. 23: 633-646
Bahr, L.N. and W.P. Lanier. 1981. The ecology of intertidal oyster reefs of the South Atlantic coast: a community profile. U.S. Fish and Wildlife Service, Office of Biological Services, Washington DC. FWS/OBS-81/15.
Benoit, L. K. & Askins, R. A (1999). Impact of the spread of Phragmites on the distribution of birds in Connecticut tidal marshes. Wetlands, Vol. 19, No. 1. pp. 194-208.
Blair, C., 1991. Successful tidal wetland mitigation in Norfolk, VA. p. 463-476, In: Coastal Wetlands, H.S. Bolton (ed.) Proceedings of Coastal Zone '91, Long Beach, Calif., July 1991, Am. Soc. Civil Engineers, New York, NY.
Borgman, U., H. Shear and J. Moore, 1984. Zooplankton and potential fish production in Lake Ontario. Can. J. Fish. Aquat. Sci. 41:1303-1309.
Broome, S., W. Seneca, and W. Woodhouse, Jr. 1986. Long-term growth and development of transplants of the saltmarsh grass, Spartina alterniflora. Estuaries 9:63-74.
Burreson, E., G. Gross, V. Kennedy, M. Luckenbach, R. Mann, D. Meritt, R. Newell, K. Paynter, C. Peterson, and R. Takacs. 1999. Chesapeake Bay Oyster Restoration: Consensus of a Meeting of Scientific Experts. Chesapeake Bay Research Consortium, Virginia Institute of Marine Sciences, Gloucester Point, VA.
Calvo, G.W., M.W. Luckenbach, S.K. Allen, Jr. and E. M. Burreson. 2000. A comparative study of Crassostrea ariakensis and Crassostrea virginica in relation to salinity in Virginia. VIMS, Special Report in Applied Marine Science and Ocean Engineering No. 360. Virginia Institute of Marine Sciences, Gloucester Point, VA.
Castagna, M., and J.N. Kraeuter. 1977. Mercenaria culture using stone aggregate for predator protection. Proceedings of the National Shellfisheries Association 67: 1-6.
Chambers, R. M., Meyerson, L. A. & Saltonstall, K. (1999) Expansion of Phragmites australis into tidal wetlands of North America. Aquatic Botany, Vol. 64. Pp. 261-273
Cohen, E.B. and M.D. Grosslein, 1987. Production on Georges Bank compared with other shelf ecosystems. p. 383-391. In: R.B. Backus (ed.), Georges Bank, MIT Press, Cambridge, Mass., 593 p.
Cohen, E.B., M.D. Grosslein, M.P. Sissenwine, F. Steimle, and W. R. Wright, 1982. Energy budget of Georges Bank, p. 95-107. In: M.C. Mercer (ed.), Multispecies approaches to fisheries management advice. Can. Spec. Publ. Fish. Aquat. Sci. 59, 169 p.
41
Dame, R.F. 1972. Comparison of various allometric relationships in intertidal and subtidal American oysters. Fishery Bulletin 70: 1121-1126.
D'Avanzo, C., J.A. Jusler, and M.E. Kentula, (ed.), 1989. Long-term evaluation of wetland creation projects. p. 75-84, In: Wetland creation and restoration: The status of the science. Vol II: Perspectives, October. EPA/600/3-89/038B, 172 p.
Dunn, W.J. and G.R. Best, 1983. Enhancing ecological succession: 5 seed bank survey of some Florida marshes and role of seed banks in marsh reclamation. p. 365-370. In: D.H. Graves (ed.) Proc. Symp. on Surface Mining Hydrology, Sedimentology and Reclamation, University of Kentucky, Lexington.
Fell, P. E. Weissbach, S. P., Jones D. A. Fallon M. A., Julie A. Z., Faison E. K., Lennon K. A., Newberry K. J. & Reddington L. K. (1998) Does invasion of oligohaline tidal marshes by red grass, Phragmites australis (Cav.) Trin. ex Steud., affect the availability of prey resources for the mummichog, Fundulus heteroclitus L.? Journal of Exp. Mar. Biol. Ecol. 222:59-77.
French, D., M. Reed, K. Jayko, S. Feng, H. Rines, S. Pavignano, T. Isaji, S. Puckett, A. Keller, F. W. French III, D. Gifford, J. McCue, G. Brown, E. MacDonald, J. Quirk, S. Natzke, R. Bishop, M. Welsh, M. Phillips and B.S. Ingram, 1996. The CERCLA type A natural resource damage assessment model for coastal and marine environments (NRDAM/CME), Technical Documentation, Vol.I - Model Description. Final Report, submitted to the Office of Environmental Policy and Compliance, U.S. Dept.of the Interior, Washington, DC, April, 1996, Contract No. 14-0001-91-C-11.
French McCay and Jennings, 2002. Draft Final Report - PEPCO Oil Spill of April 7, 2000 in Patuxent River, MD: Modeling of the Fates and Acute Biological Effects of the Spilled Oil on the Water Column. March 2002.
Grodzinski, W. and B.A. Wunder, 1975. Ecological energetics of small mammals. p. 173-204. In: F.B. Golley, K. Petrusewicz and L. Ryszkowski (eds.) Small mammals: their productivity and population dynamics. Cambridge Univ. Press, Cambridge, 451 p.
Henny, C.J., and H.M. Wight. 1969. An endangered osprey population: estimates of mortality and production. Auk, 86:188-198.
Jackson, J.B.C., M.X. Kirby, W.H. Berger, K.A. Bjorndal, L.W. Botsford, B.J. Bourque, R. Bradbury, R. Cooke, J.A. Estes, T.P. Hughes, S. Kidwell, C.B. Lange, H.S. Lenihan, J.M. Pandolphi, C.H. Peterson, R.S. Steneck, M.J. Tegner, and R.R. Warner. 2001. Historical overfishing and the recent collapse of coastal ecosystems. Science 293: 629-635.
Jones, R., 1984. Some observations on energy transfer through the North Sea and Georges Bank food webs. Rapp. P.-v. Reun. Cons. int. Explor. Mer 183:204-217.
Keefe, W. Marsh production: a summary of the literature. Contributions in Marine Science. Vol 16, 1973
42

Kneib, R.T. 1987. Seasonal abundance, distribution and growth of postlarval and juvenile grass shrimp (Palaemonetes pugio) in a Georgia, USA, salt marsh. Marine Biology 96: 215224.
Lenihan, H.S., and C.H. Peterson. 1998. How habitat degradation through fishery disturbance enhances impacts of hypoxia on oyster reefs. Ecological Applications 8: 128-140.
Lenihan H.S., C.H. Peterson, J.E. Byers, J.H. Grabowski, G.W. Thayer, and D. Colby. 2001. Cascading of habitat degradation: oyster reefs invaded by refugee fishes escaping stress. Ecological Applications 11: 746-782.
Llanso, R.J., and J. Volstad. 2001. Patuxent River oil spill: assessment of impacts on benthos. Versar, Columbia, MD.
Luckenbach, M.A., R. Mann, and J.E. Wesson (eds.). 1998. Oyster reef restoration: a symposium and synthesis of approaches. Virginia Institute of Marine Sciences Press, Gloucester Point, VA.
Marsh, A.G., and K.P. Tenore. 1990. The role of nutrition in regulating the population dynamics of opportunistic, surface deposit feeders in a mesohaline community. Limnology and Oceanography 35: 710-724.
McNeill, S. and J.H. Lawton, 1970. Annual production and respiration in animal populations. Nature 225:472-474.
Meyer, D. L, Johnson, J. M., Gill, J. W. (2001) Comparison of nekton use of Phragmites australis and Spartina alterniflora marshes in the Chesapeake Bay, USA. Marine Ecology Progress Series. Vol 209: 71-84
Mills, E.L., K. Pittman and F.C. Tan, 1984. Food-web structure on the Scotian Shelf, eastern Canada: A study using 13C as a food-chain tracer. Rapp. P.-v. Reun. Cons. int. Explor. Mer. 183:111-118.
Newell, R.I.E. 1988. Ecological changes in the Chesapeake Bay: are they the result of overharvesting the American oyster, Crassostrea virginica? In: Lynch M.P., and E.C. Krome (eds.) Understanding the estuary: advances in Chesapeake Bay research. Chesapeake Bay Research Consortium, Publ 129 CBP/TRS 24/88, Gloucester Point, VA, pp. 536-546.
Odum, E.P., 1971. Fundamentals of Ecology, W.B. Saunders Co., Philadelphia, 574 p.
Olafsson, E.B. 1986. Density dependence in suspension-feeding and deposit-feeding populations of the bivalve Macoma balthica: a field experiment. Journal of Animal Ecology 55: 517526.
Pacific Estuarine Research Laboratory (PERL), 1990. A manual for assessing restored and natural coastal wetlands with examples from southern California. California Sea Grant Report No. T-CSGCP-021. La Jolla, California.
43

Peterson, C.H. 2002. Quantification of Injury to Benthic Resources from the Chalk Point Oil Spill on the Patuxent River. Report to the Chalk Point Oil Spill Trustees.
Peterson, C.H., J.H. Grabowski, and S.P. Powers. 2002. Quantitative estimation of the oyster reef service of enhancing fish production: restoration valuation. Marine Ecology Progress Series: in press.
Petersen, G.H. and M.A. Curtis, 1980. Differences in energy flow through major components of subarctic, temperate and tropical marine shelf ecosystems. Dana 1:53-64.
Powers, S. P. and J.H. Grabowski. 2002. The influence of hydrodynamic setting on pre and post-settlement processes in intertidal oyster reefs: implications for habitat conservation and restoration. Ecology: in review.
Roman, C. T. & Daiber, F. C. (1984) Above ground and belowground primary production dynamics of two Delaware Bay tidal marshes. Bulletin of the Torey Botanical Club. Vol. III, No. 1: 34-41.
Rothschild, B.J., J.S. Ault, P. Goulletquer, and M. Heral. 1994. Decline of the Chesapeake Bay oyster population: a century of habitat destruction and overfishing. Marine Ecology Progress Series 111: 29-39.
Ryther, J.H., 1969. Photosynthesis and fish production in the sea. Science 166:72-76.
Sarda, R. Foreman, K. Wermee, C. E., and Valiela, I. (1998) The impact of epifaunal predation on the structure of macroinfaunal invertebrate communities of tidal saltmarsh Creeks. Estuarine, Coastal and Shelf Science. Vol. 46: 657-669.
Sibley, D.A. 2000. The Sibley Guide to Birds. National Audubon Society, Alfred A. Knopf, NY.
Sissenwine, M.P., E.B. Cohen and M.D. Grosslein, 1984. Structure of Georges Bank ecosystem. Rapp. P.-v. reun. Cons. int. Explor. Mer 183:243-254.
Skilleter, G.A. 1994. Refuges from predation and the persistence of estuarine clam populations. Marine Ecology Progress Series 109: 29-42.
Skilleter, G.A., and C.H. Peterson. 1994. Control of foraging behavior of individuals within an ecosystem context: the clam Macoma balthica and interactions between competition and siphon nipping. Oecologia 100: 268-278.
Slobodkin, L.B., 1960. Ecological energy relationships at the population level. Am. Nat. 95: 213-236.
Slobodkin, L.G., 1962. Energy in animal ecology. In: Advances in Ecological Research, J.B. Cragg (ed.), Vol. I. pp. 69-101.
Spitzer, P.R. 1980. Dynamics of a discrete coastal breeding population of ospreys in the Northeastern USA, 1969-1979. Unpublished PhD thesis, Cornell University, New York.
44

Steele, J.H., 1974. The structure of marine ecosystems. Harvard U. Press, Cambridge, Mass., 128 p.
Weinstein, M. P. & Balletto H. H. (1999) Does the common reed, Phragmites australis, affect essential fish habitat? Estuaries. Vol. 22. No. 3B: 793-802.
White, M.E. and E. A. Wilson. 1996. Predators, pests, and competitors. Pages 559-580. In, V.S. Kennedy, R.I.E. Newell, and A. F. Eble (Editors) The Eastern Oyster Crassostrea virginica. Maryland Sea Grant, College Park, MD.
Whittaker, R.H., 1975. Communities and ecosystems. 2nd edition, MacMillan Publishing Co., NY, 385 p.
Windham, L. (2001) Comparison of biomass production and decomposition between Phragmites australis (common red) and Spartina patens (salt hay grass) in brackish tidal marshes of New Jersey, USA. Wetlands. Vol. 21, No. 2: 179-188.
Zimmerman, R.J., T.J. Minello, T.J. Baumer, and M.C. Castiglione. 1989. Oyster reef as habitat for estuarine macrofauna. NOAA Technical Memorandum, NMFS-SEFC-249, 16pp.
45