restated audited consolidated financial statements and … · 2015-11-12 · disclosure document...
TRANSCRIPT
Restated Audited Consolidated Financial Statements
and
Management’s Discussion and Analysis
For the year ended
December 31, 2005
Contents
Management’s Responsibility for the Financial
Statements and Management’s Report on Internal
Control over Financial Reporting (Restated)******* 1
Auditors’ Report to the Shareholders *************** 4
Comments by Auditors for United States Readers on
Canada – United States Accounting Differences *** 6
Fairfax Consolidated Financial Statements ********** 7
Notes to Consolidated Financial Statements********* 13
Management’s Discussion and Analysis of Financial
Condition and Results of Operations ************* 52
Consolidated Financial Summary******************* 129
Management’s Responsibility for the Financial Statements
The preparation and presentation of the accompanying consolidated financial statements,Management’s Discussion and Analysis (‘‘MD&A’’) and all financial information are theresponsibility of management and have been approved by the Board of Directors.
The consolidated financial statements have been prepared in accordance with Canadiangenerally accepted accounting principles. Financial statements, by nature, are not precise sincethey include certain amounts based upon estimates and judgments. When alternative methodsexist, management has chosen those it deems to be the most appropriate in the circumstances.
We, as Fairfax’s Chief Executive Officer and Chief Financial Officer, will certify Fairfax’s annualdisclosure document filed with the SEC (Form 40-F) in accordance with the United StatesSarbanes-Oxley Act of 2002.
The Board of Directors is responsible for ensuring that management fulfills its responsibilitiesfor financial reporting and is ultimately responsible for reviewing and approving theconsolidated financial statements. The Board carries out this responsibility principally throughits Audit Committee which is independent from management.
The Audit Committee is appointed by the Board of Directors and reviews the consolidatedfinancial statements and MD&A; considers the report of the external auditors; assesses theadequacy of the internal controls of the company, including management’s assessmentdescribed below; examines the fees and expenses for audit services; and recommends to theBoard the independent auditors for appointment by the shareholders. The independentauditors have full and free access to the Audit Committee and meet with it to discuss theiraudit work, Fairfax’s internal control over financial reporting and financial reporting matters.The Audit Committee reports its findings to the Board for consideration when approving theconsolidated financial statements for issuance to the shareholders and management’sassessment of the internal control over financial reporting.
Management’s Report on Internal Control over Financial Reporting (Restated)
Management is responsible for establishing and maintaining adequate internal control overfinancial reporting.
Management has assessed the effectiveness of the company’s internal control over financialreporting as of December 31, 2005 using criteria established in Internal Control – IntegratedFramework issued by the Committee of Sponsoring Organizations of the TreadwayCommission (‘‘COSO’’). A material weakness is a control deficiency or combination of controldeficiencies that results in more than a remote likelihood that a material misstatement of theannual or interim financial statements will not be prevented or detected.
As of December 31, 2005, the following material weaknesses have been identified and includedin management’s assessment:
1. The company did not maintain an appropriate accounting and financial reportingorganizational structure and a sufficient complement of accounting personnel tosupport the activities of the company. Specifically, lines of communication betweenour operations and accounting and finance personnel and subsidiaries were notadequate to raise issues to the appropriate level of accounting personnel. Further, thecompany did not maintain personnel with an appropriate level of accountingknowledge, experience and training to support the size and complexity of theorganization and its financial reporting requirements. This control deficiencyresulted in the restatement of the company’s consolidated financial statements forthe years ended December 31, 2001 through 2005 and related disclosures. This
1
FAIRFAX FINANCIAL HOLDINGS LIMITED
control deficiency contributed to each of the material weaknesses discussed in 2through 4 below.
2. The company did not maintain effective controls over the completeness andaccuracy of period-end financial reporting and period-end close processes at theFairfax head office consolidation level. Specifically, the company did not maintaineffective review and monitoring processes and documentation relating to the(i) recording of recurring and non-recurring journal entries, (ii) recording ofintercompany and related company eliminations and reconciliations and(iii) translation of foreign currency transactions and subsidiary company results. Thiscontrol deficiency resulted in the restatement of the company’s consolidatedfinancial statements for the years ended December 31, 2001 through 2005 andrelated disclosures to correct significant accounts and disclosures.
3. The company did not maintain effective controls over the accounting for certainderivative instruments in accordance with FAS 133. Specifically, the company did notmaintain appropriate controls over the processes to account for convertible bondsecurities and to identify embedded derivatives in other fixed income securities inaccordance with US GAAP. This control deficiency resulted in the restatement of thecompany’s US GAAP net earnings (loss) with an offsetting amount in othercomprehensive income for each of the three years ended December 31, 2005.
4. The company did not maintain effective controls over the completeness andaccuracy of the calculation and review of income taxes, including the determinationof income taxes payable, future income tax assets and liabilities and the relatedincome tax provision including the impact on US GAAP information. Specifically,the company did not maintain appropriate controls over tax effecting certainpermanent differences, temporary differences and US GAAP differences. This controldeficiency resulted in the restatement of the company’s consolidated financialstatements for the years ended December 31, 2001 through 2005 and relateddisclosures.
Each of the control deficiencies described in 1 to 4 above could result in misstatements of anyof the company’s financial statement accounts and disclosures that would result in a materialmisstatement to the annual or interim consolidated financial statements that would not beprevented or detected.
Accordingly, management has determined that each of the control deficiencies constitutes amaterial weakness.
In Management’s Report on Internal Control over Financial Reporting included in our originalAnnual Report on Form 40-F for the year ended December 31, 2005, our management,including our CEO and CFO, concluded that we maintained effective internal control overfinancial reporting as of December 31, 2005. Our CEO and CFO have subsequently concludedthat the material weaknesses described above existed as of December 31, 2005. As a result, theynow have concluded that we did not maintain effective internal control over financialreporting as of December 31, 2005, based on the criteria in Internal Control-IntegratedFramework issued by the COSO. Accordingly, management has restated its report on internalcontrol over financial reporting.
2
Management’s assessment of the effectiveness of the company’s internal control over financialreporting as of December 31, 2005 has been audited by PricewaterhouseCoopers LLP, anindependent registered public accounting firm, as stated in its report which appears herein.
August 31, 2006
V. Prem Watsa Greg TaylorChairman and Chief Executive Officer Vice President and Chief Financial Officer
3
FAIRFAX FINANCIAL HOLDINGS LIMITED
Auditors’ Report
To the Shareholders of Fairfax Financial Holdings Limited
We have audited the accompanying consolidated balance sheets of Fairfax Financial HoldingsLimited (the ‘‘Company’’) as at December 31, 2005 and 2004 and the related consolidatedstatements of earnings, shareholders’ equity and cash flows for each of the years in the three-year period ended December 31, 2005. We have also audited the effectiveness of theCompany’s internal control over financial reporting as at December, 31, 2005 based on thecriteria established in Internal Control – Integrated Framework issued by the Committee ofSponsoring Organizations of the Treadway Commission (COSO) and management’sassessment thereof included in Management’s Report on Internal Control over FinancialReporting. The Company’s management is responsible for these financial statements, formaintaining effective internal control over financial reporting and for its assessment of theeffectiveness of internal control over financial reporting. Our responsibility is to express anopinion on Fairfax Financial Holdings Limited’s 2005, 2004, and 2003 consolidated financialstatements, an opinion on management’s assessment as at December 31, 2005 and an opinionon the effectiveness of the Company’s internal control over financial reporting as atDecember 31, 2005 based on our audits.
A company’s internal control over financial reporting is a process designed to providereasonable assurance regarding the reliability of financial reporting and the preparation offinancial statements for external purposes in accordance with generally accepted accountingprinciples. A company’s internal control over financial reporting includes those policies andprocedures that (1) pertain to the maintenance of records that, in reasonable detail, accuratelyand fairly reflect the transactions and dispositions of the assets of the company; (2) providereasonable assurance that transactions are recorded as necessary to permit preparation offinancial statements in accordance with generally accepted accounting principles, and thatreceipts and expenditures of the company are being made only in accordance withauthorizations of management and directors of the company; and (3) provide reasonableassurance regarding prevention or timely detection of unauthorized acquisition, use, ordisposition of the company’s assets that could have a material effect on the financialstatements.
We conducted our audits of the Company’s financial statements in accordance with Canadiangenerally accepted auditing standards and the standards of the Public Company AccountingOversight Board (United States). Those standards require that we plan and perform an audit toobtain reasonable assurance about whether the financial statements are free of materialmisstatement. An audit of financial statements includes examining, on a test basis, evidencesupporting the amounts and disclosures in the financial statements. A financial statementaudit also includes assessing the accounting principles used and significant estimates made bymanagement, and evaluating the overall financial statement presentation. We conducted ouraudit of the effectiveness of the Company’s internal control over financial reporting andmanagement’s assessment thereof in accordance with the standards of the Public CompanyAccounting Oversight Board (United States). Those standards require that we plan and performthe audit to obtain reasonable assurance about whether effective internal control over financialreporting was maintained in all material respects. Our audit included obtaining anunderstanding of internal control over financial reporting, evaluating management’sassessment, testing and evaluating the design and operating effectiveness of internal controland performing such other procedures as we considered necessary in the circumstances. Webelieve that our audits provide a reasonable basis for our opinions.
A material weakness is a control deficiency, or combination of control deficiencies, that resultsin more than a remote likelihood that a material misstatement of the annual or interim
4
financial statements will not be prevented or detected. As of December 31, 2005, the followingmaterial weaknesses have been identified and included in management’s assessment:
1. The Company did not maintain an appropriate accounting and financial reportingorganizational structure and a sufficient complement of accounting personnel tosupport the activities of the Company. Specifically, lines of communication betweenour operations and accounting and finance personnel and subsidiaries were notadequate to raise issues to the appropriate level of accounting personnel. Further, theCompany did not maintain personnel with an appropriate level of accountingknowledge, experience and training to support the size and complexity of theorganization and its financial reporting requirements. This control deficiencyresulted in the restatement of the Company’s consolidated financial statements forthe years ended December 31, 2001 through 2005 and related disclosures. Thiscontrol deficiency contributed to each of the material weaknesses discussed in 2through 4 below.
2. The Company did not maintain effective controls over the completeness andaccuracy of period-end financial reporting and period-end close processes at theFairfax head office consolidation level. Specifically, the Company did not maintaineffective review and monitoring processes and documentation relating to the(i) recording of recurring and non-recurring journal entries, (ii) recording ofintercompany and related Company eliminations and reconciliations and(iii) translation of foreign currency transactions and subsidiary Company results.This control deficiency resulted in the restatement of the Company’s consolidatedfinancial statements for the years ended December 31, 2001 through 2005 andrelated disclosures to correct significant accounts and disclosures.
3. The Company did not maintain effective controls over the accounting for certainderivative instruments in accordance with FAS 133. Specifically, the Company didnot maintain appropriate controls over the processes to account for convertible bondsecurities and to identify embedded derivatives in other fixed income securities inaccordance with US GAAP. This control deficiency resulted in the restatement of theCompany’s US GAAP net earnings (loss) with an offsetting amount in othercomprehensive income for each of the three years ended December 31, 2005.
4. The Company did not maintain effective controls over the completeness andaccuracy of the calculation and review of income taxes, including the determinationof income taxes payable, future income tax assets and liabilities and the relatedincome tax provision including the impact on US GAAP information. Specifically,the Company did not maintain appropriate controls over tax effecting certainpermanent differences, temporary differences and US GAAP differences. This controldeficiency resulted in the restatement of the Company’s consolidated financialstatements for the years ended December 31, 2001 through 2005 and relateddisclosures.
Each of these control deficiencies described in 1 to 4 above could result in misstatements of theCompany’s financial statement accounts and disclosures that would result in a materialmisstatement to the annual consolidated financial statements that would not be prevented ordetected. Therefore, management has determined that each of these control deficienciesconstitutes a material weakness. These material weaknesses were considered in determining thenature, timing, and extent of audit tests applied in our audit of the 2005 consolidated financialstatements, and our opinion regarding the effectiveness of the Company’s internal controlover financial reporting does not affect our opinion on those consolidated financialstatements.
5
FAIRFAX FINANCIAL HOLDINGS LIMITED
In our opinion, the consolidated financial statements referred to above present fairly, in allmaterial respects, the financial position of the Company as at December 31, 2005 and 2004and the results of its operations and its cash flows for each of the years in the three-year periodended December 31, 2005 in accordance with Canadian generally accepted accountingprinciples. Also, in our opinion, management’s assessment as shown on page 118 that theCompany did not maintain effective internal control over financial reporting as atDecember 31, 2005 is fairly stated, in all material respects, based on criteria established inInternal Control – Integrated Framework issued by the COSO. Furthermore, in our opinion,because of the effects of the material weaknesses described above on the achievement of theobjectives of the control criteria, the Company has not maintained effective internal controlover financial reporting as at December 31, 2005 based on criteria established in InternalControl – Integrated Framework issued by the COSO.
Because of its inherent limitations, internal control over financial reporting may not prevent ordetect misstatements. Also, projections of any evaluation of effectiveness to future periods aresubject to the risk that controls may become inadequate because of changes in conditions, orthat the degree of compliance with the policies or procedures may deteriorate.
Our previous report dated March 31, 2006, except as to Note 2, which was as of August 31,2006, has been withdrawn and the consolidated financial statements have been restated asdiscussed in note 21. In addition, our original opinion on the effectiveness of internal controlover financial reporting at December 31, 2005 was restated as of August 31, 2006.
Chartered AccountantsToronto, Ontario
March 31, 2006, except as to Note 2 which is as of August 31, 2006 and as to Note 21 which isas of November 2, 2006.
Comments by Auditors for United States Readers on Canada – United StatesAccounting Differences
Accounting principles generally accepted in Canada vary in certain significant respects fromaccounting principles generally accepted in the United States of America. Information relatedto the nature and effect of such differences is presented in note 21, as restated, to theconsolidated financial statements.
Chartered AccountantsToronto, Ontario
March 31, 2006, except as to Note 2 which is as of August 31, 2006 and as to Note 21 which isas of November 2, 2006.
6
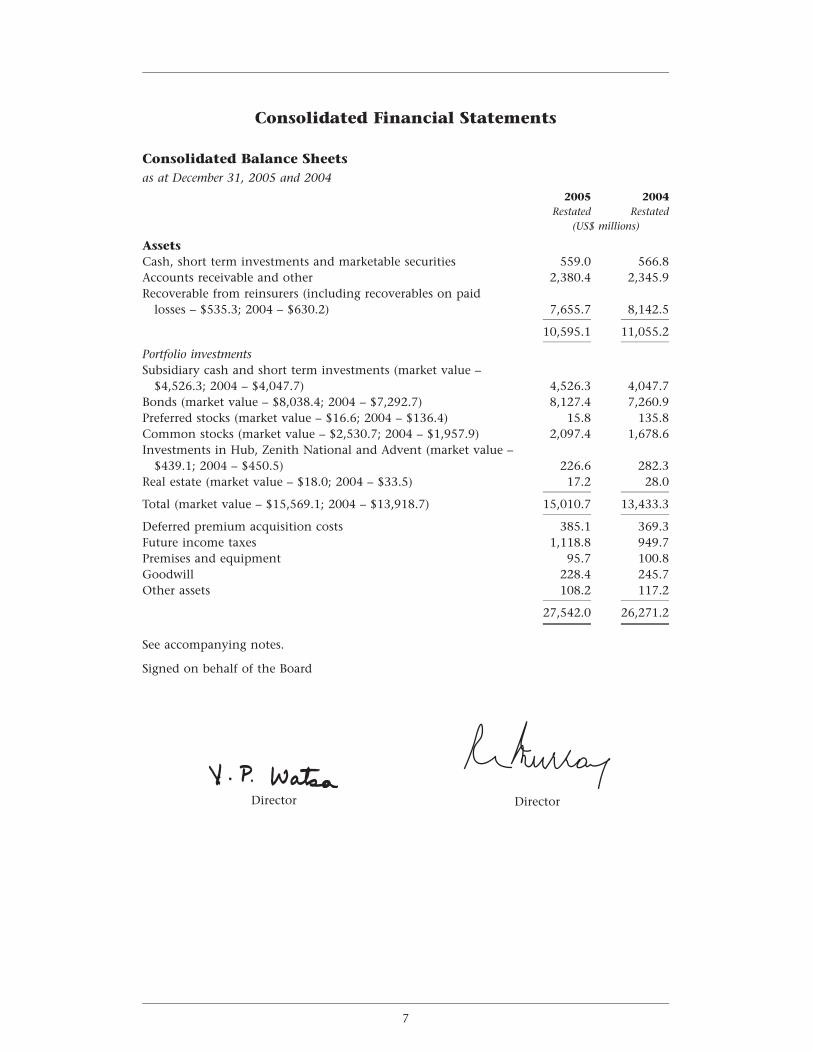
Consolidated Financial Statements
Consolidated Balance Sheetsas at December 31, 2005 and 2004
2005 2004Restated Restated
(US$ millions)
AssetsCash, short term investments and marketable securities 559.0 566.8Accounts receivable and other 2,380.4 2,345.9Recoverable from reinsurers (including recoverables on paid
losses – $535.3; 2004 – $630.2) 7,655.7 8,142.5
10,595.1 11,055.2
Portfolio investmentsSubsidiary cash and short term investments (market value –
$4,526.3; 2004 – $4,047.7) 4,526.3 4,047.7Bonds (market value – $8,038.4; 2004 – $7,292.7) 8,127.4 7,260.9Preferred stocks (market value – $16.6; 2004 – $136.4) 15.8 135.8Common stocks (market value – $2,530.7; 2004 – $1,957.9) 2,097.4 1,678.6Investments in Hub, Zenith National and Advent (market value –
$439.1; 2004 – $450.5) 226.6 282.3Real estate (market value – $18.0; 2004 – $33.5) 17.2 28.0
Total (market value – $15,569.1; 2004 – $13,918.7) 15,010.7 13,433.3
Deferred premium acquisition costs 385.1 369.3Future income taxes 1,118.8 949.7Premises and equipment 95.7 100.8Goodwill 228.4 245.7Other assets 108.2 117.2
27,542.0 26,271.2
See accompanying notes.
Signed on behalf of the Board
Director Director
7
FAIRFAX FINANCIAL HOLDINGS LIMITED
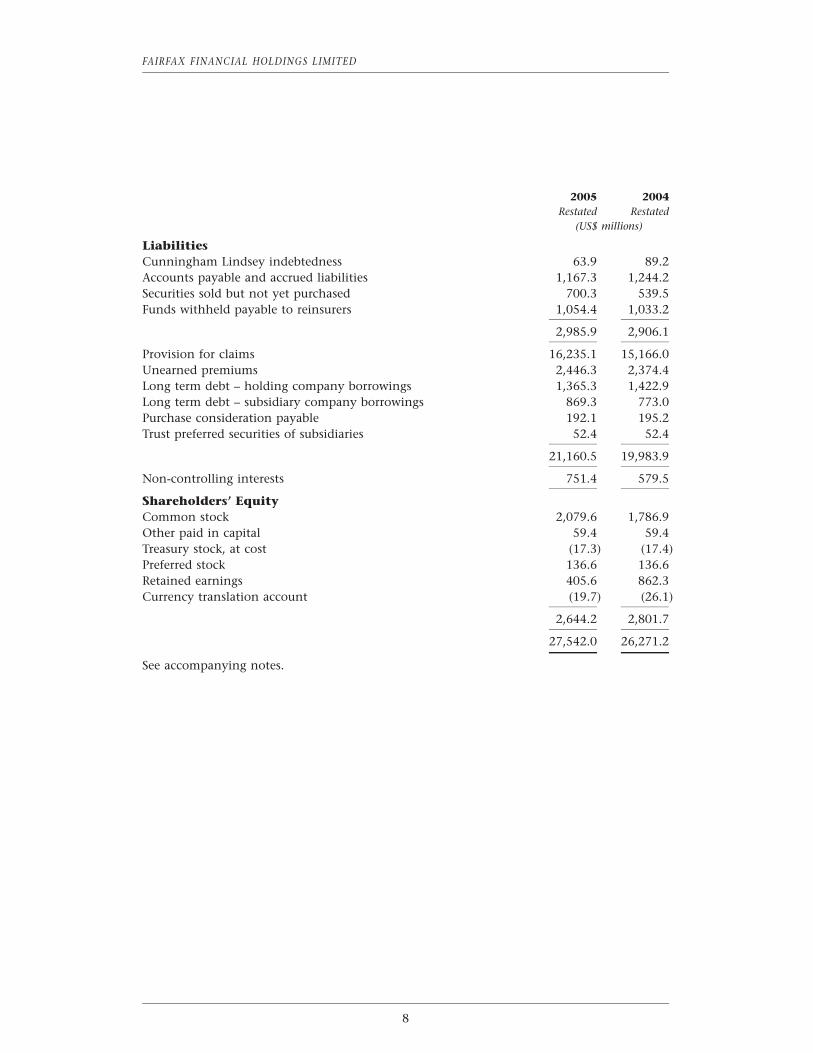
2005 2004Restated Restated
(US$ millions)
LiabilitiesCunningham Lindsey indebtedness 63.9 89.2Accounts payable and accrued liabilities 1,167.3 1,244.2Securities sold but not yet purchased 700.3 539.5Funds withheld payable to reinsurers 1,054.4 1,033.2
2,985.9 2,906.1
Provision for claims 16,235.1 15,166.0Unearned premiums 2,446.3 2,374.4Long term debt – holding company borrowings 1,365.3 1,422.9Long term debt – subsidiary company borrowings 869.3 773.0Purchase consideration payable 192.1 195.2Trust preferred securities of subsidiaries 52.4 52.4
21,160.5 19,983.9
Non-controlling interests 751.4 579.5
Shareholders’ EquityCommon stock 2,079.6 1,786.9Other paid in capital 59.4 59.4Treasury stock, at cost (17.3) (17.4)Preferred stock 136.6 136.6Retained earnings 405.6 862.3Currency translation account (19.7) (26.1)
2,644.2 2,801.7
27,542.0 26,271.2
See accompanying notes.
8
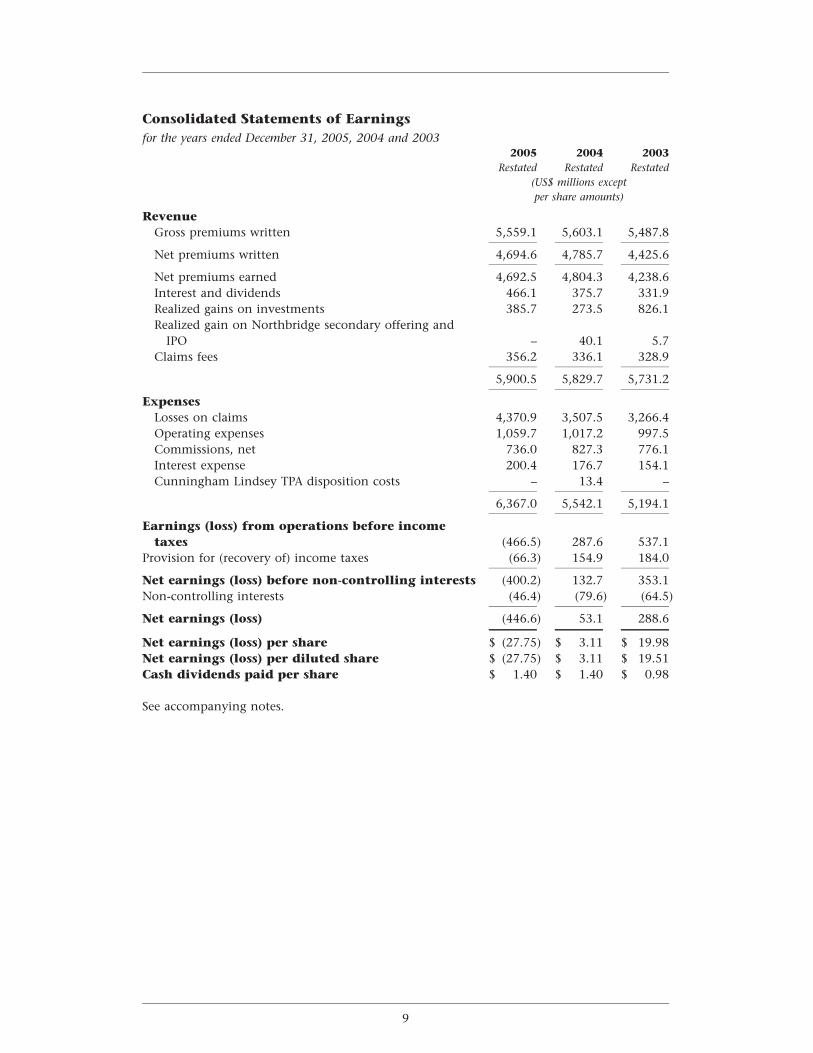
Consolidated Statements of Earningsfor the years ended December 31, 2005, 2004 and 2003
2005 2004 2003Restated Restated Restated
(US$ millions exceptper share amounts)
RevenueGross premiums written 5,559.1 5,603.1 5,487.8
Net premiums written 4,694.6 4,785.7 4,425.6
Net premiums earned 4,692.5 4,804.3 4,238.6Interest and dividends 466.1 375.7 331.9Realized gains on investments 385.7 273.5 826.1Realized gain on Northbridge secondary offering and
IPO – 40.1 5.7Claims fees 356.2 336.1 328.9
5,900.5 5,829.7 5,731.2
ExpensesLosses on claims 4,370.9 3,507.5 3,266.4Operating expenses 1,059.7 1,017.2 997.5Commissions, net 736.0 827.3 776.1Interest expense 200.4 176.7 154.1Cunningham Lindsey TPA disposition costs – 13.4 –
6,367.0 5,542.1 5,194.1
Earnings (loss) from operations before incometaxes (466.5) 287.6 537.1
Provision for (recovery of) income taxes (66.3) 154.9 184.0
Net earnings (loss) before non-controlling interests (400.2) 132.7 353.1Non-controlling interests (46.4) (79.6) (64.5)
Net earnings (loss) (446.6) 53.1 288.6
Net earnings (loss) per share $ (27.75) $ 3.11 $ 19.98Net earnings (loss) per diluted share $ (27.75) $ 3.11 $ 19.51Cash dividends paid per share $ 1.40 $ 1.40 $ 0.98
See accompanying notes.
9
FAIRFAX FINANCIAL HOLDINGS LIMITED
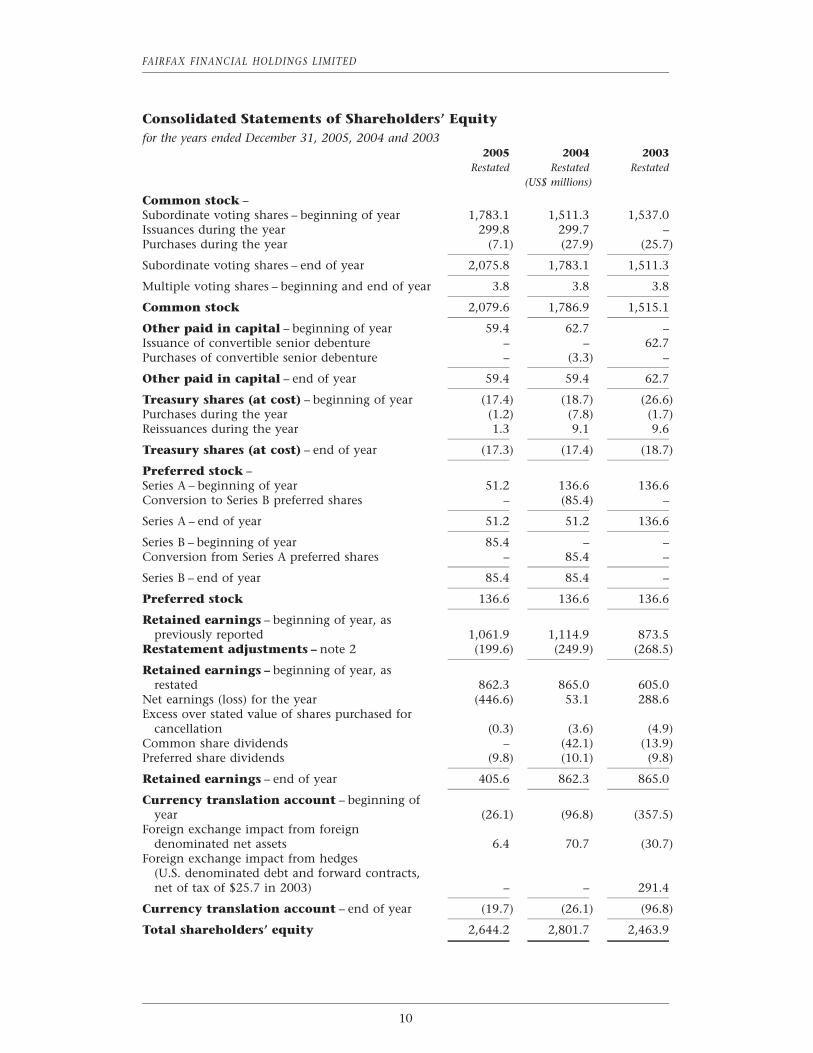
Consolidated Statements of Shareholders’ Equityfor the years ended December 31, 2005, 2004 and 2003
2005 2004 2003Restated Restated Restated
(US$ millions)
Common stock –Subordinate voting shares – beginning of year 1,783.1 1,511.3 1,537.0Issuances during the year 299.8 299.7 –Purchases during the year (7.1) (27.9) (25.7)
Subordinate voting shares – end of year 2,075.8 1,783.1 1,511.3
Multiple voting shares – beginning and end of year 3.8 3.8 3.8
Common stock 2,079.6 1,786.9 1,515.1
Other paid in capital – beginning of year 59.4 62.7 –Issuance of convertible senior debenture – – 62.7Purchases of convertible senior debenture – (3.3) –
Other paid in capital – end of year 59.4 59.4 62.7
Treasury shares (at cost) – beginning of year (17.4) (18.7) (26.6)Purchases during the year (1.2) (7.8) (1.7)Reissuances during the year 1.3 9.1 9.6
Treasury shares (at cost) – end of year (17.3) (17.4) (18.7)
Preferred stock –Series A – beginning of year 51.2 136.6 136.6Conversion to Series B preferred shares – (85.4) –
Series A – end of year 51.2 51.2 136.6
Series B – beginning of year 85.4 – –Conversion from Series A preferred shares – 85.4 –
Series B – end of year 85.4 85.4 –
Preferred stock 136.6 136.6 136.6
Retained earnings – beginning of year, aspreviously reported 1,061.9 1,114.9 873.5
Restatement adjustments – note 2 (199.6) (249.9) (268.5)
Retained earnings – beginning of year, asrestated 862.3 865.0 605.0
Net earnings (loss) for the year (446.6) 53.1 288.6Excess over stated value of shares purchased for
cancellation (0.3) (3.6) (4.9)Common share dividends – (42.1) (13.9)Preferred share dividends (9.8) (10.1) (9.8)
Retained earnings – end of year 405.6 862.3 865.0
Currency translation account – beginning ofyear (26.1) (96.8) (357.5)
Foreign exchange impact from foreigndenominated net assets 6.4 70.7 (30.7)
Foreign exchange impact from hedges(U.S. denominated debt and forward contracts,net of tax of $25.7 in 2003) – – 291.4
Currency translation account – end of year (19.7) (26.1) (96.8)
Total shareholders’ equity 2,644.2 2,801.7 2,463.9
10
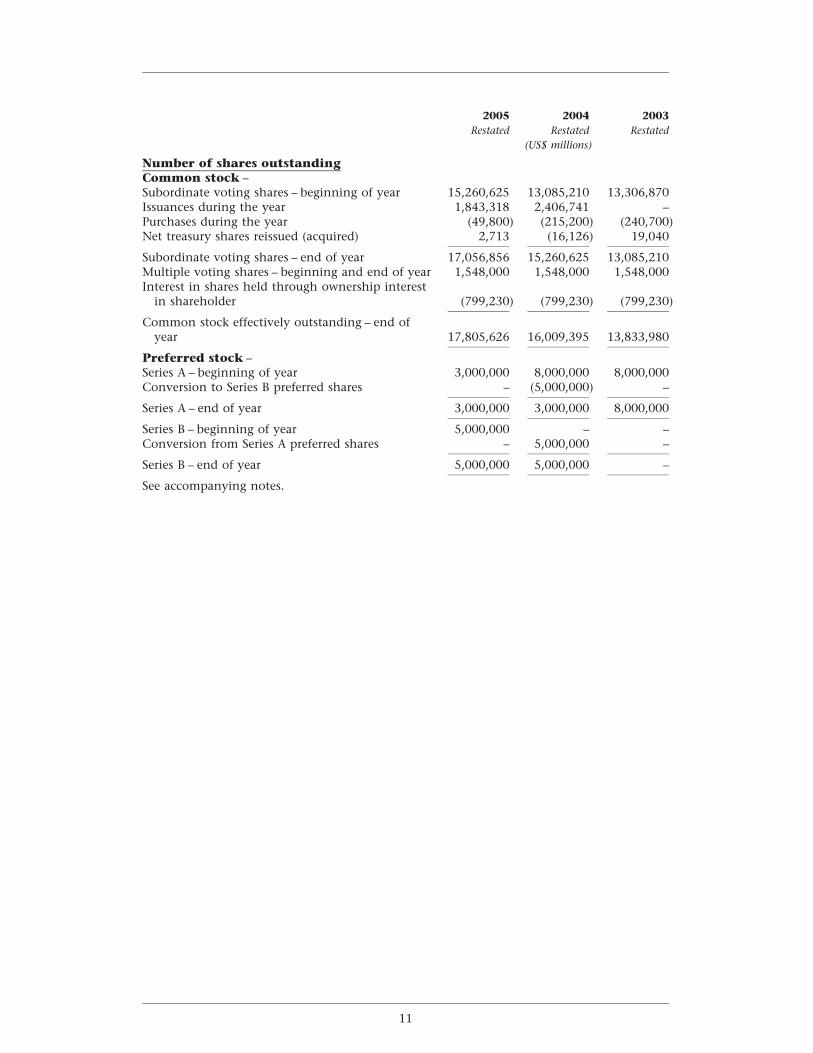
2005 2004 2003Restated Restated Restated
(US$ millions)
Number of shares outstandingCommon stock –Subordinate voting shares – beginning of year 15,260,625 13,085,210 13,306,870Issuances during the year 1,843,318 2,406,741 –Purchases during the year (49,800) (215,200) (240,700)Net treasury shares reissued (acquired) 2,713 (16,126) 19,040
Subordinate voting shares – end of year 17,056,856 15,260,625 13,085,210Multiple voting shares – beginning and end of year 1,548,000 1,548,000 1,548,000Interest in shares held through ownership interest
in shareholder (799,230) (799,230) (799,230)
Common stock effectively outstanding – end ofyear 17,805,626 16,009,395 13,833,980
Preferred stock –Series A – beginning of year 3,000,000 8,000,000 8,000,000Conversion to Series B preferred shares – (5,000,000) –
Series A – end of year 3,000,000 3,000,000 8,000,000
Series B – beginning of year 5,000,000 – –Conversion from Series A preferred shares – 5,000,000 –
Series B – end of year 5,000,000 5,000,000 –
See accompanying notes.
11
FAIRFAX FINANCIAL HOLDINGS LIMITED
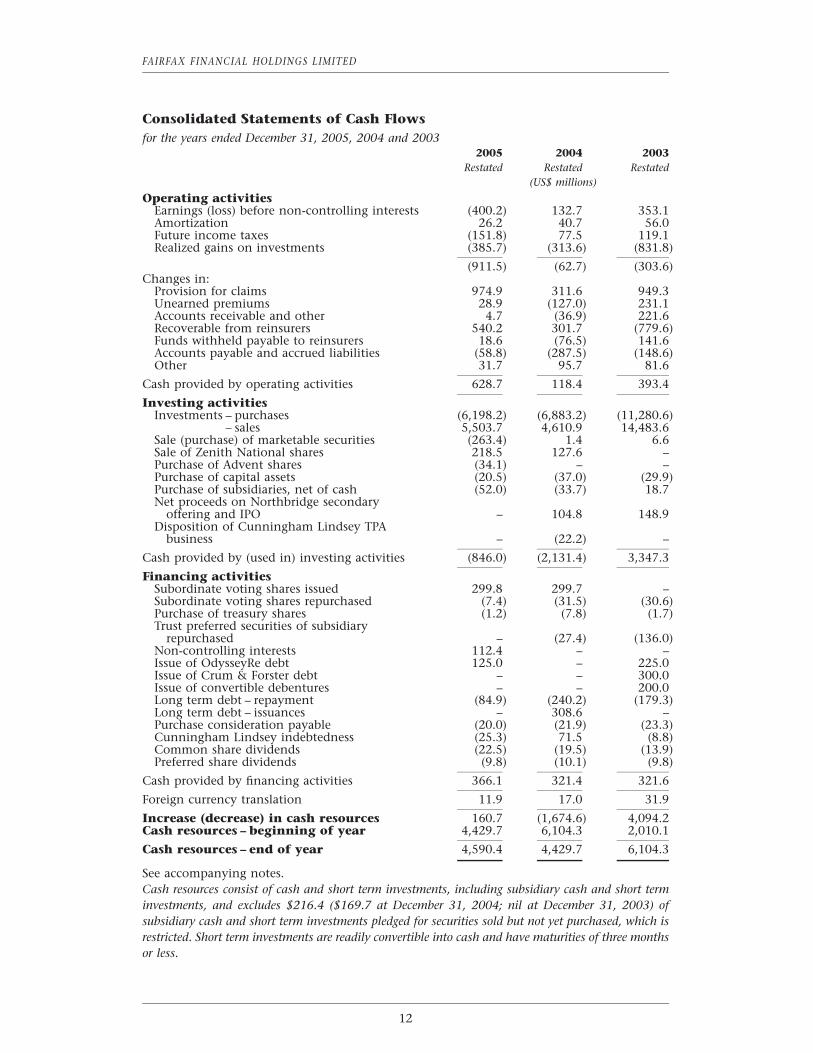
Consolidated Statements of Cash Flowsfor the years ended December 31, 2005, 2004 and 2003
2005 2004 2003Restated Restated Restated
(US$ millions)
Operating activitiesEarnings (loss) before non-controlling interests (400.2) 132.7 353.1Amortization 26.2 40.7 56.0Future income taxes (151.8) 77.5 119.1Realized gains on investments (385.7) (313.6) (831.8)
(911.5) (62.7) (303.6)Changes in:
Provision for claims 974.9 311.6 949.3Unearned premiums 28.9 (127.0) 231.1Accounts receivable and other 4.7 (36.9) 221.6Recoverable from reinsurers 540.2 301.7 (779.6)Funds withheld payable to reinsurers 18.6 (76.5) 141.6Accounts payable and accrued liabilities (58.8) (287.5) (148.6)Other 31.7 95.7 81.6
Cash provided by operating activities 628.7 118.4 393.4
Investing activitiesInvestments – purchases (6,198.2) (6,883.2) (11,280.6)
– sales 5,503.7 4,610.9 14,483.6Sale (purchase) of marketable securities (263.4) 1.4 6.6Sale of Zenith National shares 218.5 127.6 –Purchase of Advent shares (34.1) – –Purchase of capital assets (20.5) (37.0) (29.9)Purchase of subsidiaries, net of cash (52.0) (33.7) 18.7Net proceeds on Northbridge secondary
offering and IPO – 104.8 148.9Disposition of Cunningham Lindsey TPA
business – (22.2) –
Cash provided by (used in) investing activities (846.0) (2,131.4) 3,347.3
Financing activitiesSubordinate voting shares issued 299.8 299.7 –Subordinate voting shares repurchased (7.4) (31.5) (30.6)Purchase of treasury shares (1.2) (7.8) (1.7)Trust preferred securities of subsidiary
repurchased – (27.4) (136.0)Non-controlling interests 112.4 – –Issue of OdysseyRe debt 125.0 – 225.0Issue of Crum & Forster debt – – 300.0Issue of convertible debentures – – 200.0Long term debt – repayment (84.9) (240.2) (179.3)Long term debt – issuances – 308.6 –Purchase consideration payable (20.0) (21.9) (23.3)Cunningham Lindsey indebtedness (25.3) 71.5 (8.8)Common share dividends (22.5) (19.5) (13.9)Preferred share dividends (9.8) (10.1) (9.8)
Cash provided by financing activities 366.1 321.4 321.6
Foreign currency translation 11.9 17.0 31.9
Increase (decrease) in cash resources 160.7 (1,674.6) 4,094.2Cash resources – beginning of year 4,429.7 6,104.3 2,010.1
Cash resources – end of year 4,590.4 4,429.7 6,104.3
See accompanying notes.Cash resources consist of cash and short term investments, including subsidiary cash and short terminvestments, and excludes $216.4 ($169.7 at December 31, 2004; nil at December 31, 2003) ofsubsidiary cash and short term investments pledged for securities sold but not yet purchased, which isrestricted. Short term investments are readily convertible into cash and have maturities of three monthsor less.
12
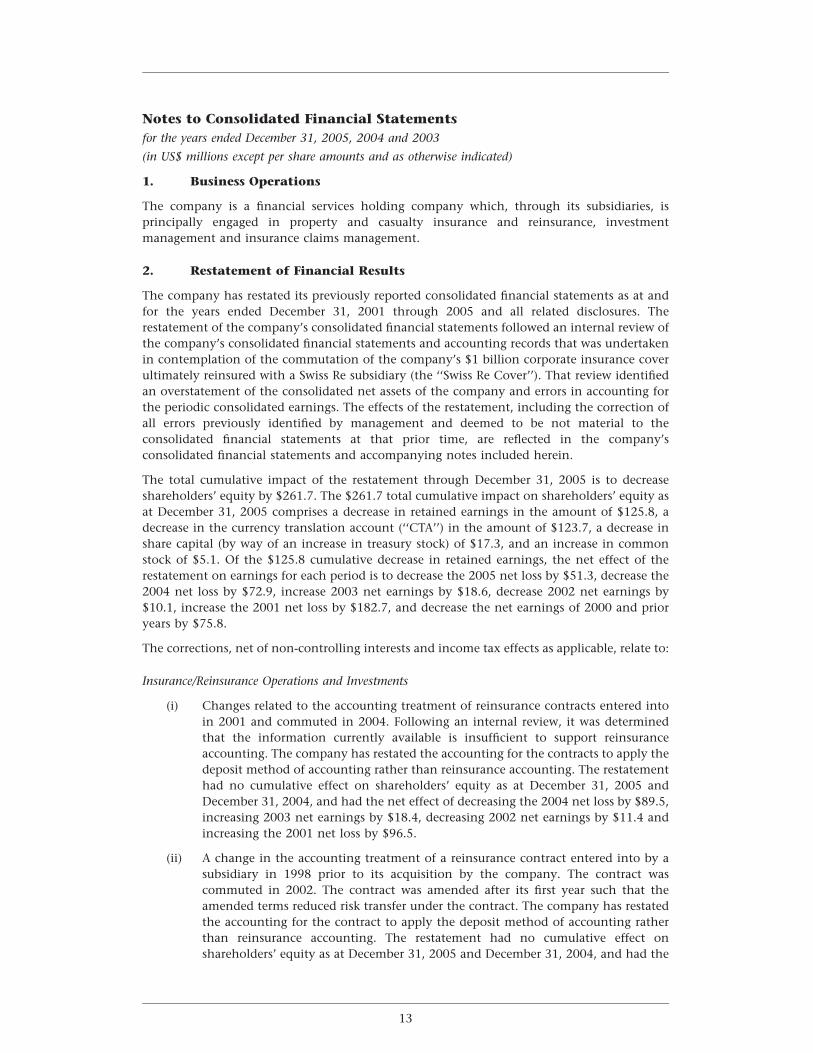
Notes to Consolidated Financial Statementsfor the years ended December 31, 2005, 2004 and 2003
(in US$ millions except per share amounts and as otherwise indicated)
1. Business Operations
The company is a financial services holding company which, through its subsidiaries, isprincipally engaged in property and casualty insurance and reinsurance, investmentmanagement and insurance claims management.
2. Restatement of Financial Results
The company has restated its previously reported consolidated financial statements as at andfor the years ended December 31, 2001 through 2005 and all related disclosures. Therestatement of the company’s consolidated financial statements followed an internal review ofthe company’s consolidated financial statements and accounting records that was undertakenin contemplation of the commutation of the company’s $1 billion corporate insurance coverultimately reinsured with a Swiss Re subsidiary (the ‘‘Swiss Re Cover’’). That review identifiedan overstatement of the consolidated net assets of the company and errors in accounting forthe periodic consolidated earnings. The effects of the restatement, including the correction ofall errors previously identified by management and deemed to be not material to theconsolidated financial statements at that prior time, are reflected in the company’sconsolidated financial statements and accompanying notes included herein.
The total cumulative impact of the restatement through December 31, 2005 is to decreaseshareholders’ equity by $261.7. The $261.7 total cumulative impact on shareholders’ equity asat December 31, 2005 comprises a decrease in retained earnings in the amount of $125.8, adecrease in the currency translation account (‘‘CTA’’) in the amount of $123.7, a decrease inshare capital (by way of an increase in treasury stock) of $17.3, and an increase in commonstock of $5.1. Of the $125.8 cumulative decrease in retained earnings, the net effect of therestatement on earnings for each period is to decrease the 2005 net loss by $51.3, decrease the2004 net loss by $72.9, increase 2003 net earnings by $18.6, decrease 2002 net earnings by$10.1, increase the 2001 net loss by $182.7, and decrease the net earnings of 2000 and prioryears by $75.8.
The corrections, net of non-controlling interests and income tax effects as applicable, relate to:
Insurance/Reinsurance Operations and Investments
(i) Changes related to the accounting treatment of reinsurance contracts entered intoin 2001 and commuted in 2004. Following an internal review, it was determinedthat the information currently available is insufficient to support reinsuranceaccounting. The company has restated the accounting for the contracts to apply thedeposit method of accounting rather than reinsurance accounting. The restatementhad no cumulative effect on shareholders’ equity as at December 31, 2005 andDecember 31, 2004, and had the net effect of decreasing the 2004 net loss by $89.5,increasing 2003 net earnings by $18.4, decreasing 2002 net earnings by $11.4 andincreasing the 2001 net loss by $96.5.
(ii) A change in the accounting treatment of a reinsurance contract entered into by asubsidiary in 1998 prior to its acquisition by the company. The contract wascommuted in 2002. The contract was amended after its first year such that theamended terms reduced risk transfer under the contract. The company has restatedthe accounting for the contract to apply the deposit method of accounting ratherthan reinsurance accounting. The restatement had no cumulative effect onshareholders’ equity as at December 31, 2005 and December 31, 2004, and had the
13
FAIRFAX FINANCIAL HOLDINGS LIMITED
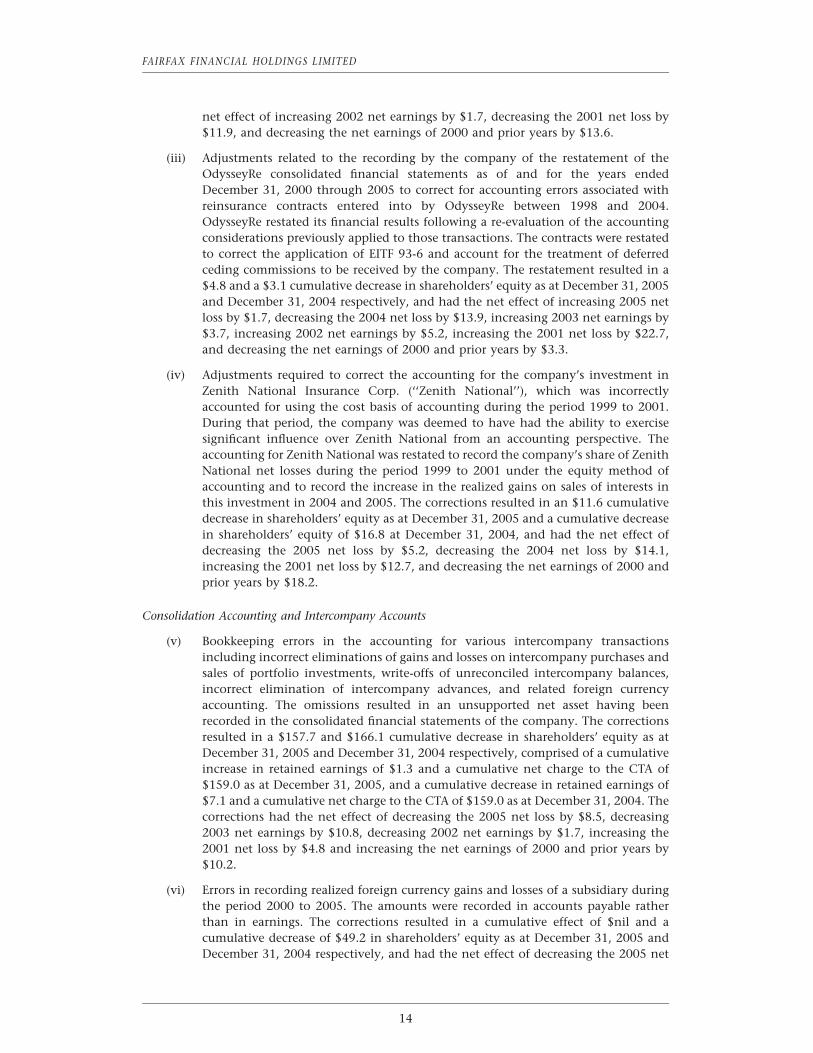
net effect of increasing 2002 net earnings by $1.7, decreasing the 2001 net loss by$11.9, and decreasing the net earnings of 2000 and prior years by $13.6.
(iii) Adjustments related to the recording by the company of the restatement of theOdysseyRe consolidated financial statements as of and for the years endedDecember 31, 2000 through 2005 to correct for accounting errors associated withreinsurance contracts entered into by OdysseyRe between 1998 and 2004.OdysseyRe restated its financial results following a re-evaluation of the accountingconsiderations previously applied to those transactions. The contracts were restatedto correct the application of EITF 93-6 and account for the treatment of deferredceding commissions to be received by the company. The restatement resulted in a$4.8 and a $3.1 cumulative decrease in shareholders’ equity as at December 31, 2005and December 31, 2004 respectively, and had the net effect of increasing 2005 netloss by $1.7, decreasing the 2004 net loss by $13.9, increasing 2003 net earnings by$3.7, increasing 2002 net earnings by $5.2, increasing the 2001 net loss by $22.7,and decreasing the net earnings of 2000 and prior years by $3.3.
(iv) Adjustments required to correct the accounting for the company’s investment inZenith National Insurance Corp. (‘‘Zenith National’’), which was incorrectlyaccounted for using the cost basis of accounting during the period 1999 to 2001.During that period, the company was deemed to have had the ability to exercisesignificant influence over Zenith National from an accounting perspective. Theaccounting for Zenith National was restated to record the company’s share of ZenithNational net losses during the period 1999 to 2001 under the equity method ofaccounting and to record the increase in the realized gains on sales of interests inthis investment in 2004 and 2005. The corrections resulted in an $11.6 cumulativedecrease in shareholders’ equity as at December 31, 2005 and a cumulative decreasein shareholders’ equity of $16.8 at December 31, 2004, and had the net effect ofdecreasing the 2005 net loss by $5.2, decreasing the 2004 net loss by $14.1,increasing the 2001 net loss by $12.7, and decreasing the net earnings of 2000 andprior years by $18.2.
Consolidation Accounting and Intercompany Accounts
(v) Bookkeeping errors in the accounting for various intercompany transactionsincluding incorrect eliminations of gains and losses on intercompany purchases andsales of portfolio investments, write-offs of unreconciled intercompany balances,incorrect elimination of intercompany advances, and related foreign currencyaccounting. The omissions resulted in an unsupported net asset having beenrecorded in the consolidated financial statements of the company. The correctionsresulted in a $157.7 and $166.1 cumulative decrease in shareholders’ equity as atDecember 31, 2005 and December 31, 2004 respectively, comprised of a cumulativeincrease in retained earnings of $1.3 and a cumulative net charge to the CTA of$159.0 as at December 31, 2005, and a cumulative decrease in retained earnings of$7.1 and a cumulative net charge to the CTA of $159.0 as at December 31, 2004. Thecorrections had the net effect of decreasing the 2005 net loss by $8.5, decreasing2003 net earnings by $10.8, decreasing 2002 net earnings by $1.7, increasing the2001 net loss by $4.8 and increasing the net earnings of 2000 and prior years by$10.2.
(vi) Errors in recording realized foreign currency gains and losses of a subsidiary duringthe period 2000 to 2005. The amounts were recorded in accounts payable ratherthan in earnings. The corrections resulted in a cumulative effect of $nil and acumulative decrease of $49.2 in shareholders’ equity as at December 31, 2005 andDecember 31, 2004 respectively, and had the net effect of decreasing the 2005 net
14
loss by $49.2, increasing the 2004 net loss by $14.7, decreasing 2003 net earnings by$12.8, increasing 2002 net earnings by $23.2, increasing the 2001 net loss by $53.3,and increasing 2000 net earnings by $8.4. These corrections occurred in a lower taxrate jurisdiction and resulted in a 2005 income tax expense of $9.4, a 2004 incometax recovery of $4.7, a 2003 income tax expense of $0.1, a 2002 income tax expenseof $1.8 and a 2001 income tax recovery of $6.7.
(vii) Accounting errors related to the recognition in earnings of forgiveness of debt. Theaccounting was restated to reflect the forgiveness of debt in the appropriate periods.The corrections had no cumulative effect on shareholders’ equity as at December 31,2005 and December 31, 2004, and had the net effect of decreasing the 2001 net lossby $20.8 and decreasing the net earnings of 2000 and prior years by $20.8.
(viii) Certain losses related to an intercompany dispute that were not recorded in theconsolidated financial statements. The restatement resulted in an $18.3 and $nilcumulative decrease in shareholders’ equity as at December 31, 2005 andDecember 31, 2004 respectively, and had the net effect of increasing the 2005 netloss by $18.3.
(ix) Errors in the accounting for fair value adjustments to portfolio investments in thepurchase equations for certain acquisitions. The corrections had no cumulativeeffect on shareholders’ equity as at December 31, 2005 and a $9.8 cumulativedecrease in shareholders’ equity at December 31, 2004, and had the net effect ofdecreasing the 2005 net loss by $9.8, decreasing 2002 net earnings by $7.9, anddecreasing the net earnings of 2000 and prior years by $1.9.
(x) The treatment of losses on foreign exchange contracts that hedged the 1999acquisition funding for TIG. The losses were incorrectly recorded as a charge to theCTA. The correction resulted in the revision of the purchase equation and therecording of goodwill associated with the Odyssey America Re subsidiary and acredit to the CTA in the amount of $23.8. The related unamortized goodwill balanceas at December 31, 2005 and 2004 was $17.6. Retained earnings had a $6.2cumulative decrease as at December 31, 2005 and December 31, 2004.
(xi) Adjustments required to correct accounting errors arising primarily in the headoffice consolidation process during 2000 and prior years. The corrections resulted ina $25.3 cumulative decrease in shareholders’ equity as at December 31, 2005 andDecember 31, 2004, and had the net effect of decreasing net earnings of 2000 andprior years by $25.3.
Accounting for Income Taxes
The aggregate income tax effects of the corrections and adjustments described herein,excluding the effects of the tax-specific items (xii) through (xiv), resulted in a $10.7 and an$11.1 cumulative increase in shareholders’ equity as at December 31, 2005 and December 31,2004 respectively, and had the net effect of increasing 2005 net loss by $0.5, increasing2004 net loss by $52.8, and decreasing 2003 net earnings by $2.4.
(xii) Errors in calculating the income tax provisions during the period 2001 to 2004. Thecorrections had no cumulative effect on shareholders’ equity as at December 31,2005 and December 31, 2004, and had the net effect of increasing the 2004 net lossby $9.4, increasing 2003 net earnings by $16.5, increasing 2002 net earnings by$10.9, and increasing the 2001 net loss by $18.0.
(xiii) Recognition of the tax impact of an intercorporate dividend. The correction resultedin a $17.2 cumulative decrease in shareholders’ equity as at December 31, 2005 and
15
FAIRFAX FINANCIAL HOLDINGS LIMITED
December 31, 2004, and had the net effect of increasing the 2004 net loss by $13.8,and decreasing 2003 net earnings by $3.4.
(xiv) Errors in recording the income tax effects on certain foreign currency contractshedging the company’s U.S. dollar investments in subsidiaries in the pre-2004period which were recorded in earnings rather than in the CTA. The corrections hadno impact on shareholders’ equity as at December 31, 2005 and December 31, 2004,and had the net effect of decreasing the 2004 net loss by $4.0, decreasing 2003 netearnings by $2.9, and decreasing 2002 net earnings by $13.0.
Other
(xv) The recording of a dividend declared in 2004 in the amount of $22.5 in 2004instead of 2005. The correction had no cumulative impact on shareholders’ equityas at December 31, 2005, and had the effect of decreasing shareholders’ equity as atDecember 31, 2004 by $22.5.
(xvi) Recording the balance sheet reclassification of common shares owned by thecompany as an increase in treasury stock rather than as an increase in other assets.The correction resulted in a $17.3 increase in treasury stock and a corresponding$17.3 decrease in shareholders’ equity as at December 31, 2005, and a $17.4 increasein treasury stock and a corresponding $17.4 decrease in shareholders’ equity as atDecember 31, 2004.
(xvii) Other unrelated adjustments of an immaterial nature individually that were eithertiming differences in the recording of amounts or corrections. The adjustmentsresulted in a $27.1 aggregate cumulative decrease in shareholders’ equity as atDecember 31, 2005, comprised of a $31.8 cumulative decrease in retained earnings,a $0.4 cumulative net charge to the CTA and a $5.1 cumulative increase in commonstock. The adjustments resulted in a $59.2 aggregate cumulative decrease inshareholders’ equity as at December 31, 2004, comprised of a $30.5 cumulativedecrease in retained earnings, a $33.8 cumulative net charge to the CTA and a$5.1 cumulative increase in common stock.
(xviii) Adjustments that resulted in a $415.4 aggregate cumulative decrease inshareholders’ equity as at December 31, 2003, comprised of a $249.9 cumulativedecrease in retained earnings, a $151.9 cumulative charge to the CTA, an $18.7cumulative increase in treasury stock and a $5.1 cumulative increase in commonstock, and adjustments that resulted in a $351.0 aggregate cumulative decrease inshareholders’ equity as at December 31, 2002, comprised of a $268.5 cumulativedecrease in retained earnings, a $61.0 cumulative charge to the CTA, a$26.6 cumulative increase in treasury stock and a $5.1 cumulative increase incommon stock.
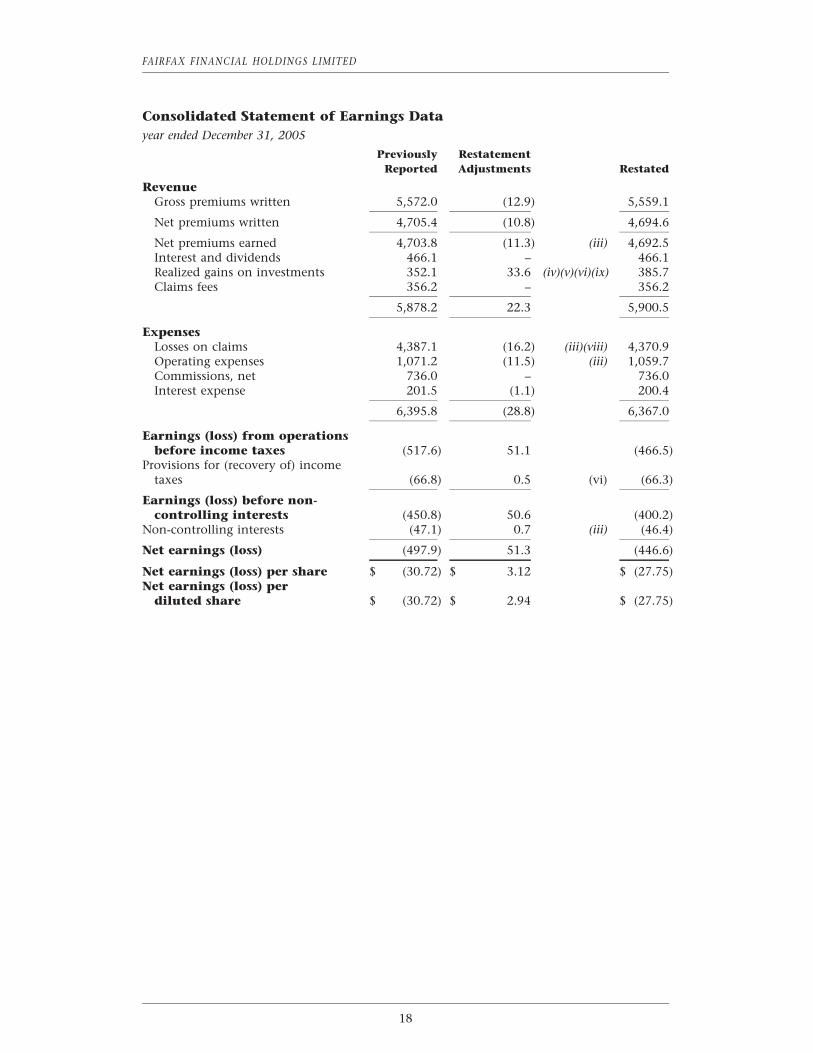
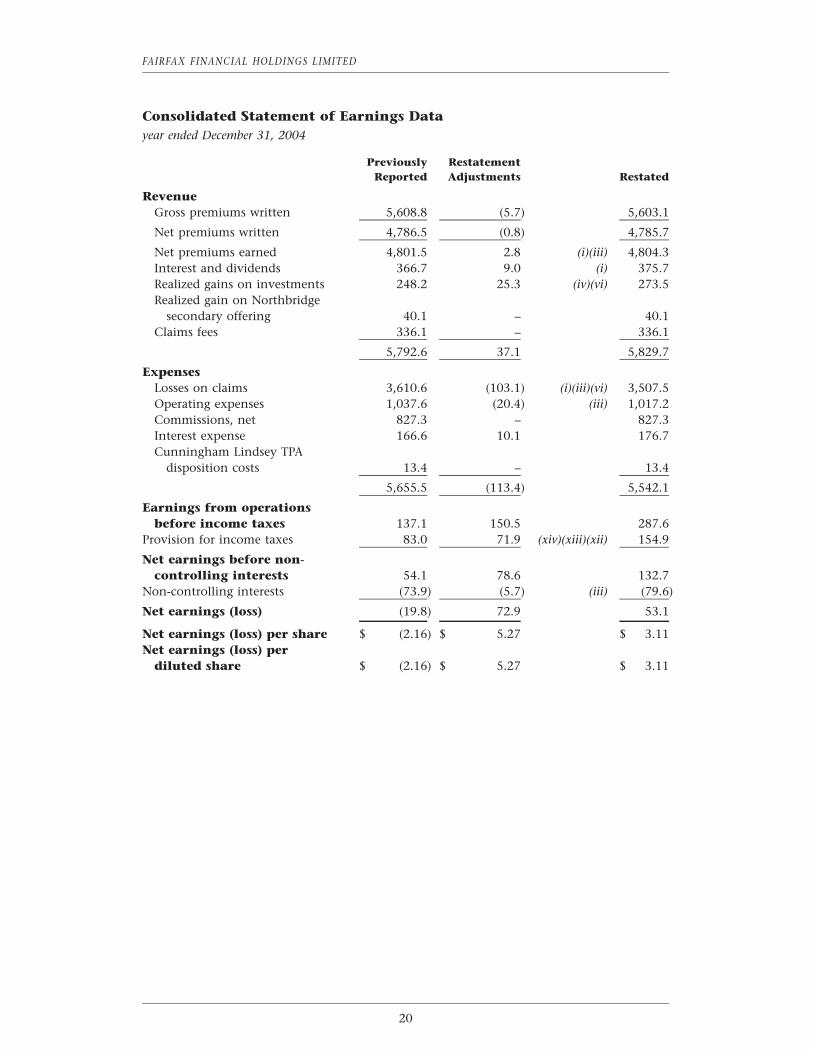
The previously reported, restatement adjustments and restated amounts for those accountsaffected by this restatement in the consolidated statements of earnings for the years endedDecember 31, 2005, 2004 and 2003 and on the consolidated balance sheets as at December 31,2005 and 2004 are as follows. The accounts primarily affected by the adjustments above havebeen footnoted. Refer to Note 21 for the impact of the restatement on the US GAAPReconciliation.
16
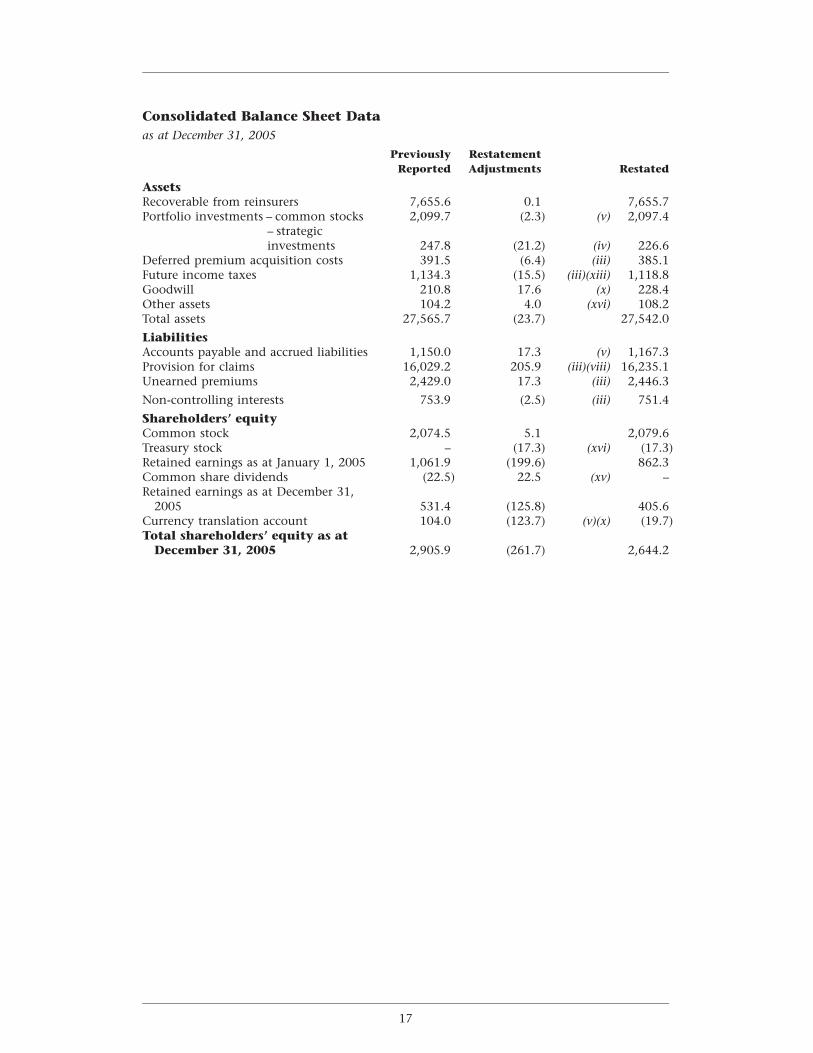
Consolidated Balance Sheet Dataas at December 31, 2005
Previously RestatementReported Adjustments Restated
AssetsRecoverable from reinsurers 7,655.6 0.1 7,655.7Portfolio investments – common stocks 2,099.7 (2.3) (v) 2,097.4
– strategicinvestments 247.8 (21.2) (iv) 226.6
Deferred premium acquisition costs 391.5 (6.4) (iii) 385.1Future income taxes 1,134.3 (15.5) (iii)(xiii) 1,118.8Goodwill 210.8 17.6 (x) 228.4Other assets 104.2 4.0 (xvi) 108.2Total assets 27,565.7 (23.7) 27,542.0
LiabilitiesAccounts payable and accrued liabilities 1,150.0 17.3 (v) 1,167.3Provision for claims 16,029.2 205.9 (iii)(viii) 16,235.1Unearned premiums 2,429.0 17.3 (iii) 2,446.3
Non-controlling interests 753.9 (2.5) (iii) 751.4
Shareholders’ equityCommon stock 2,074.5 5.1 2,079.6Treasury stock – (17.3) (xvi) (17.3)Retained earnings as at January 1, 2005 1,061.9 (199.6) 862.3Common share dividends (22.5) 22.5 (xv) –Retained earnings as at December 31,
2005 531.4 (125.8) 405.6Currency translation account 104.0 (123.7) (v)(x) (19.7)Total shareholders’ equity as at
December 31, 2005 2,905.9 (261.7) 2,644.2
17
FAIRFAX FINANCIAL HOLDINGS LIMITED
Consolidated Statement of Earnings Datayear ended December 31, 2005
Previously RestatementReported Adjustments Restated
RevenueGross premiums written 5,572.0 (12.9) 5,559.1
Net premiums written 4,705.4 (10.8) 4,694.6
Net premiums earned 4,703.8 (11.3) (iii) 4,692.5Interest and dividends 466.1 – 466.1Realized gains on investments 352.1 33.6 (iv)(v)(vi)(ix) 385.7Claims fees 356.2 – 356.2
5,878.2 22.3 5,900.5
ExpensesLosses on claims 4,387.1 (16.2) (iii)(viii) 4,370.9Operating expenses 1,071.2 (11.5) (iii) 1,059.7Commissions, net 736.0 – 736.0Interest expense 201.5 (1.1) 200.4
6,395.8 (28.8) 6,367.0
Earnings (loss) from operationsbefore income taxes (517.6) 51.1 (466.5)
Provisions for (recovery of) incometaxes (66.8) 0.5 (vi) (66.3)
Earnings (loss) before non-controlling interests (450.8) 50.6 (400.2)
Non-controlling interests (47.1) 0.7 (iii) (46.4)
Net earnings (loss) (497.9) 51.3 (446.6)
Net earnings (loss) per share $ (30.72) $ 3.12 $ (27.75)Net earnings (loss) per
diluted share $ (30.72) $ 2.94 $ (27.75)
18
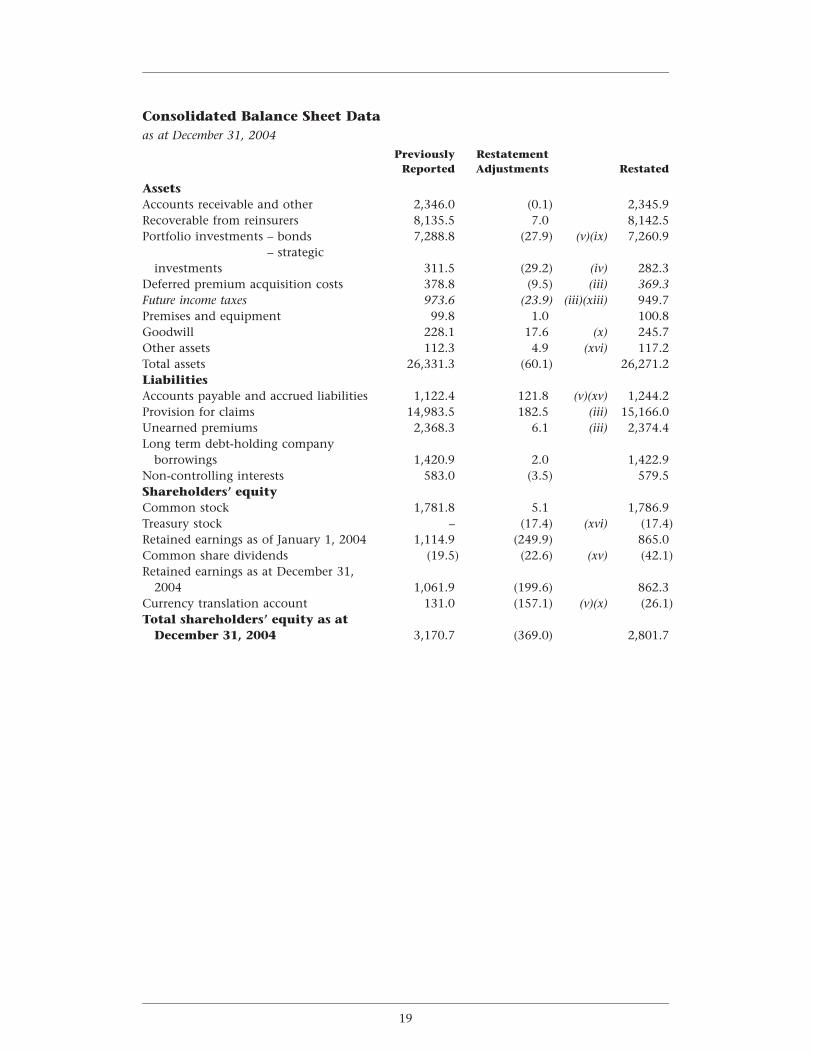
Consolidated Balance Sheet Dataas at December 31, 2004
Previously RestatementReported Adjustments Restated
AssetsAccounts receivable and other 2,346.0 (0.1) 2,345.9Recoverable from reinsurers 8,135.5 7.0 8,142.5Portfolio investments – bonds 7,288.8 (27.9) (v)(ix) 7,260.9
– strategicinvestments 311.5 (29.2) (iv) 282.3
Deferred premium acquisition costs 378.8 (9.5) (iii) 369.3Future income taxes 973.6 (23.9) (iii)(xiii) 949.7Premises and equipment 99.8 1.0 100.8Goodwill 228.1 17.6 (x) 245.7Other assets 112.3 4.9 (xvi) 117.2Total assets 26,331.3 (60.1) 26,271.2LiabilitiesAccounts payable and accrued liabilities 1,122.4 121.8 (v)(xv) 1,244.2Provision for claims 14,983.5 182.5 (iii) 15,166.0Unearned premiums 2,368.3 6.1 (iii) 2,374.4Long term debt-holding company
borrowings 1,420.9 2.0 1,422.9Non-controlling interests 583.0 (3.5) 579.5Shareholders’ equityCommon stock 1,781.8 5.1 1,786.9Treasury stock – (17.4) (xvi) (17.4)Retained earnings as of January 1, 2004 1,114.9 (249.9) 865.0Common share dividends (19.5) (22.6) (xv) (42.1)Retained earnings as at December 31,
2004 1,061.9 (199.6) 862.3Currency translation account 131.0 (157.1) (v)(x) (26.1)Total shareholders’ equity as at
December 31, 2004 3,170.7 (369.0) 2,801.7
19
FAIRFAX FINANCIAL HOLDINGS LIMITED
Consolidated Statement of Earnings Datayear ended December 31, 2004
Previously RestatementReported Adjustments Restated
RevenueGross premiums written 5,608.8 (5.7) 5,603.1
Net premiums written 4,786.5 (0.8) 4,785.7
Net premiums earned 4,801.5 2.8 (i)(iii) 4,804.3Interest and dividends 366.7 9.0 (i) 375.7Realized gains on investments 248.2 25.3 (iv)(vi) 273.5Realized gain on Northbridge
secondary offering 40.1 – 40.1Claims fees 336.1 – 336.1
5,792.6 37.1 5,829.7
ExpensesLosses on claims 3,610.6 (103.1) (i)(iii)(vi) 3,507.5Operating expenses 1,037.6 (20.4) (iii) 1,017.2Commissions, net 827.3 – 827.3Interest expense 166.6 10.1 176.7Cunningham Lindsey TPA
disposition costs 13.4 – 13.4
5,655.5 (113.4) 5,542.1
Earnings from operationsbefore income taxes 137.1 150.5 287.6
Provision for income taxes 83.0 71.9 (xiv)(xiii)(xii) 154.9
Net earnings before non-controlling interests 54.1 78.6 132.7
Non-controlling interests (73.9) (5.7) (iii) (79.6)
Net earnings (loss) (19.8) 72.9 53.1
Net earnings (loss) per share $ (2.16) $ 5.27 $ 3.11Net earnings (loss) per
diluted share $ (2.16) $ 5.27 $ 3.11
20
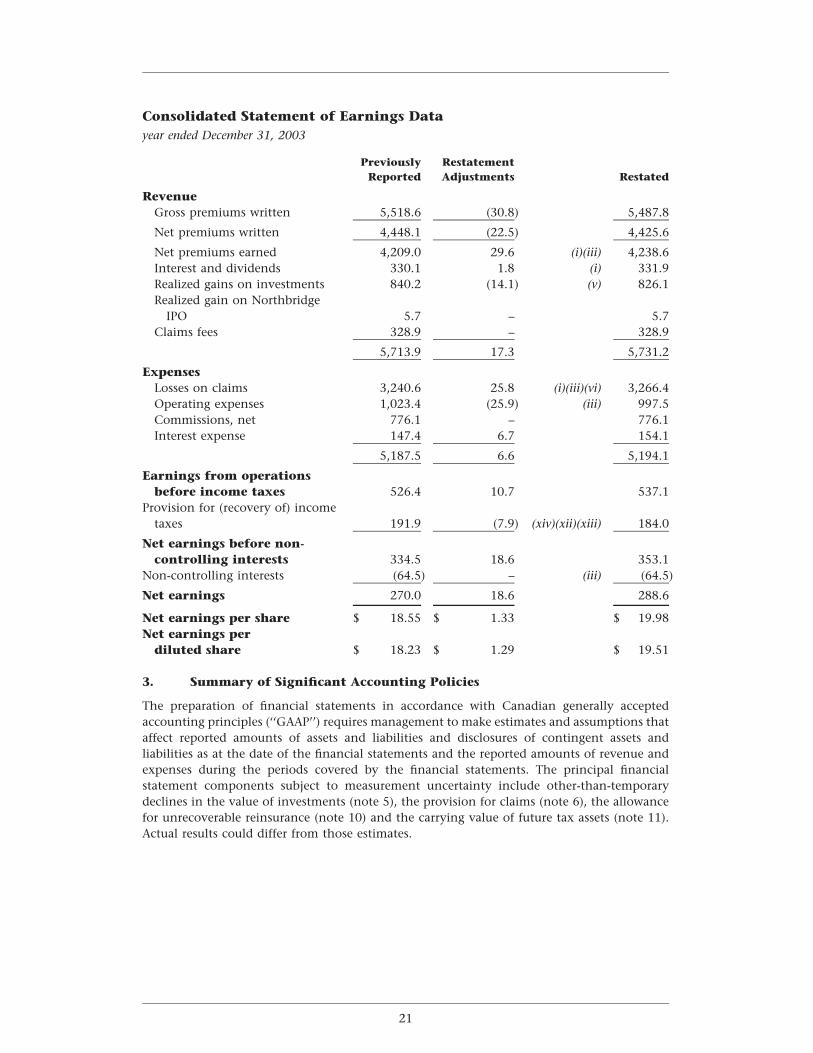
Consolidated Statement of Earnings Datayear ended December 31, 2003
Previously RestatementReported Adjustments Restated
RevenueGross premiums written 5,518.6 (30.8) 5,487.8
Net premiums written 4,448.1 (22.5) 4,425.6
Net premiums earned 4,209.0 29.6 (i)(iii) 4,238.6Interest and dividends 330.1 1.8 (i) 331.9Realized gains on investments 840.2 (14.1) (v) 826.1Realized gain on Northbridge
IPO 5.7 – 5.7Claims fees 328.9 – 328.9
5,713.9 17.3 5,731.2
ExpensesLosses on claims 3,240.6 25.8 (i)(iii)(vi) 3,266.4Operating expenses 1,023.4 (25.9) (iii) 997.5Commissions, net 776.1 – 776.1Interest expense 147.4 6.7 154.1
5,187.5 6.6 5,194.1
Earnings from operationsbefore income taxes 526.4 10.7 537.1
Provision for (recovery of) incometaxes 191.9 (7.9) (xiv)(xii)(xiii) 184.0
Net earnings before non-controlling interests 334.5 18.6 353.1
Non-controlling interests (64.5) – (iii) (64.5)
Net earnings 270.0 18.6 288.6
Net earnings per share $ 18.55 $ 1.33 $ 19.98Net earnings per
diluted share $ 18.23 $ 1.29 $ 19.51
3. Summary of Significant Accounting Policies
The preparation of financial statements in accordance with Canadian generally acceptedaccounting principles (‘‘GAAP’’) requires management to make estimates and assumptions thataffect reported amounts of assets and liabilities and disclosures of contingent assets andliabilities as at the date of the financial statements and the reported amounts of revenue andexpenses during the periods covered by the financial statements. The principal financialstatement components subject to measurement uncertainty include other-than-temporarydeclines in the value of investments (note 5), the provision for claims (note 6), the allowancefor unrecoverable reinsurance (note 10) and the carrying value of future tax assets (note 11).Actual results could differ from those estimates.
21
FAIRFAX FINANCIAL HOLDINGS LIMITED
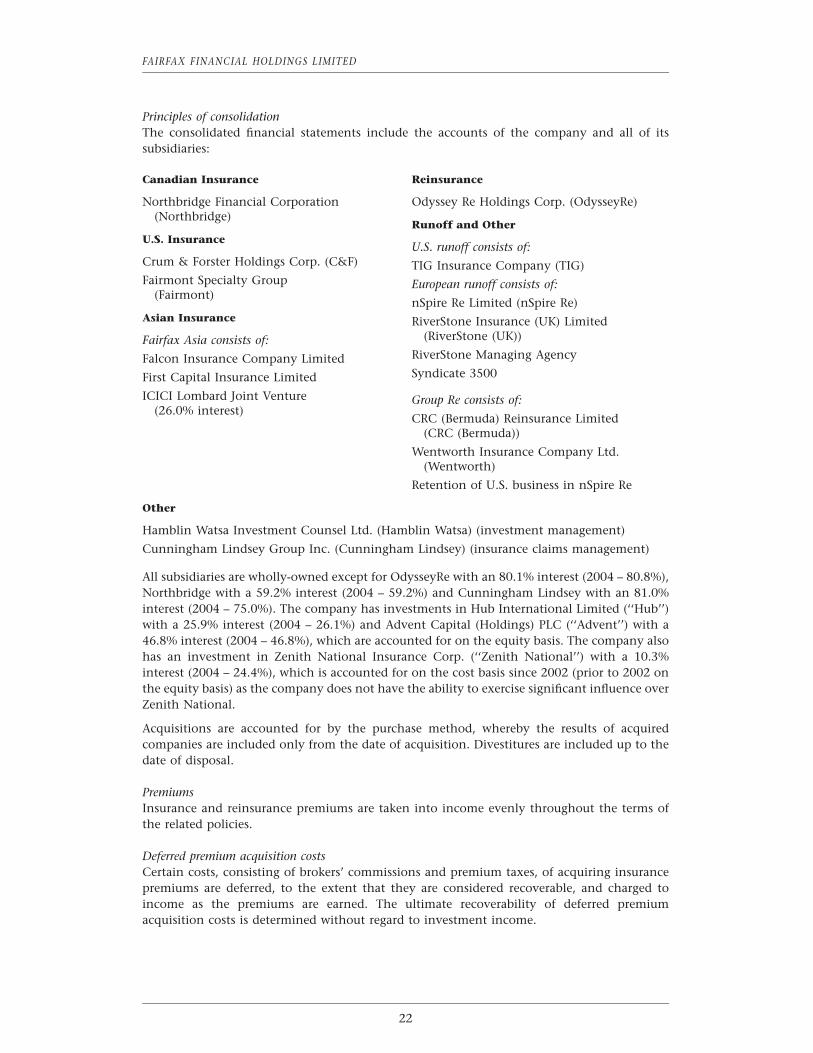
Principles of consolidationThe consolidated financial statements include the accounts of the company and all of itssubsidiaries:
Canadian Insurance Reinsurance
Northbridge Financial Corporation Odyssey Re Holdings Corp. (OdysseyRe)(Northbridge)
Runoff and OtherU.S. Insurance
U.S. runoff consists of:Crum & Forster Holdings Corp. (C&F) TIG Insurance Company (TIG)Fairmont Specialty Group European runoff consists of:
(Fairmont)nSpire Re Limited (nSpire Re)
Asian Insurance RiverStone Insurance (UK) Limited(RiverStone (UK))Fairfax Asia consists of:
RiverStone Managing AgencyFalcon Insurance Company LimitedSyndicate 3500First Capital Insurance Limited
ICICI Lombard Joint Venture Group Re consists of:(26.0% interest)
CRC (Bermuda) Reinsurance Limited(CRC (Bermuda))
Wentworth Insurance Company Ltd.(Wentworth)
Retention of U.S. business in nSpire Re
Other
Hamblin Watsa Investment Counsel Ltd. (Hamblin Watsa) (investment management)
Cunningham Lindsey Group Inc. (Cunningham Lindsey) (insurance claims management)
All subsidiaries are wholly-owned except for OdysseyRe with an 80.1% interest (2004 – 80.8%),Northbridge with a 59.2% interest (2004 – 59.2%) and Cunningham Lindsey with an 81.0%interest (2004 – 75.0%). The company has investments in Hub International Limited (‘‘Hub’’)with a 25.9% interest (2004 – 26.1%) and Advent Capital (Holdings) PLC (‘‘Advent’’) with a46.8% interest (2004 – 46.8%), which are accounted for on the equity basis. The company alsohas an investment in Zenith National Insurance Corp. (‘‘Zenith National’’) with a 10.3%interest (2004 – 24.4%), which is accounted for on the cost basis since 2002 (prior to 2002 onthe equity basis) as the company does not have the ability to exercise significant influence overZenith National.
Acquisitions are accounted for by the purchase method, whereby the results of acquiredcompanies are included only from the date of acquisition. Divestitures are included up to thedate of disposal.
PremiumsInsurance and reinsurance premiums are taken into income evenly throughout the terms ofthe related policies.
Deferred premium acquisition costsCertain costs, consisting of brokers’ commissions and premium taxes, of acquiring insurancepremiums are deferred, to the extent that they are considered recoverable, and charged toincome as the premiums are earned. The ultimate recoverability of deferred premiumacquisition costs is determined without regard to investment income.
22
InvestmentsBonds are carried at amortized cost providing for the amortization of the discount or premiumon a yield to maturity basis. Preferred and common stocks are carried at cost. Real estate iscarried at cost. When there has been a loss in value of an investment that is other thantemporary, the investment is written down to its estimated net realizable value. Suchwritedowns are reflected in realized gains (losses) on investments.
Provision for claimsClaim provisions are established by the case method as claims are reported. For reinsurance,the provision for claims is based on reports and individual case estimates received from cedingcompanies. The estimates are regularly reviewed and updated as additional information on theestimated claims becomes known and any resulting adjustments are included in earnings. Aprovision is also made for management’s calculation of factors affecting the futuredevelopment of claims including claims incurred but not reported (IBNR) based on the volumeof business currently in force and the historical experience on claims.
Translation of foreign currenciesThe operations of the company’s subsidiaries (principally in Canada, the United States and theUnited Kingdom) are self-sustaining. As a result, the assets and liabilities of the non U.S. dollardenominated subsidiaries are translated at the year-end rates of exchange. Revenue andexpenses are translated at the average rate of exchange for the year. The net unrealized gains orlosses which result from translation are deferred and included in shareholders’ equity.
Historically, prior to the company’s change in functional currency to U.S. dollars effectiveJanuary 1, 2004, the company had entered into foreign currency contracts from time to time tohedge the foreign currency exposure related to its net investments in self-sustainingU.S. operations. Such contracts were translated at the year-end rates of exchange and theimpact was included in shareholders’ equity. The remaining contracts were terminated during2003.
GoodwillThe company assesses the carrying value of goodwill based on the underlying discounted cashflows and operating results of its subsidiaries. The carrying value of goodwill will be charged toearnings if and to the extent that it is determined that an impairment in value exists.Management has compared the carrying value of goodwill balances as at December 31, 2005and the estimated fair values of the underlying operations and concluded that there was noimpairment in the value of goodwill. The estimated fair values are sensitive to the cash flowprojections and discount rates used in the valuation and more specifically the ability ofCunningham Lindsey’s U.K. operations to meet their profit and cash flow forecasts for 2006and future years.
Negative goodwill arising on acquisitions during the year is recognized in the consolidatedstatement of earnings as an extraordinary item.
ReinsuranceThe company reflects third party reinsurance balances on the balance sheet on a gross basis toindicate the extent of credit risk related to third party reinsurance and its obligations topolicyholders and on a net basis in the statement of earnings to indicate the results of itsretention of premiums written.
In order to control the company’s exposure to loss from adverse development of reserves orreinsurance recoverables on pre-acquisition reserves of companies acquired or from futureadverse development on long tail latent or other potentially volatile claims, and to protectcapital, the company obtains vendor indemnities or purchases excess of loss reinsurance
23
FAIRFAX FINANCIAL HOLDINGS LIMITED
protection from reinsurers. For excess of loss reinsurance treaties (other than vendorindemnities), the company generally pays the reinsurer a premium as losses from adversedevelopment are ceded under the treaty. The company records both the premium charge andthe related reinsurance recovery in its consolidated statement of earnings in the period inwhich the adverse development is ceded to the reinsurer.
Income taxesIncome taxes reflect the expected future tax consequences of temporary differences betweenthe carrying amounts of assets and liabilities and their tax bases based on tax rates which areexpected to be in effect when the asset or liability is settled.
PensionsAccrued benefit obligations for pensions and other post retirement benefits are actuariallydetermined using the projected benefit method prorated on service and incorporatesmanagement’s best estimate of future salary levels, other cost escalation, retirement ages of theemployees and other actuarial factors.
Expected return on plan assets is calculated based on the fair value of those assets.
Actuarial gains (losses) arise from the difference between the actual long term rate of returnand the expected long term rate of return on plan assets for that period or from changes inactuarial assumptions used to determine the accrued benefit obligation. The excess of the netaccumulated actuarial gain (loss) over 10 percent of the greater of the benefit obligation andthe fair value of plan assets is amortized over the average remaining service period of activeemployees.
Past service costs arising from plan amendments are deferred and amortized on a straight linebasis over the average remaining service period of employees active at the date of amendment.
Future accounting changesThe Canadian Institute of Chartered Accountants (CICA) has issued three new accountingstandards: Financial Instruments – Recognition and Measurement, Hedges and ComprehensiveIncome which the company will adopt effective January 1, 2007.
Financial Instruments – Recognition and Measurement. The company’s financial assets andliabilities will be carried at fair value in its consolidated balance sheet, except for receivablesand non-trading financial liabilities, which will be carried at amortized cost. Realized andunrealized gains and losses on financial assets and liabilities which are held for trading willcontinue to be recorded in the consolidated statement of earnings. Unrealized gains and losseson financial assets which are held as available for sale will be recorded in other comprehensiveincome until realized, at which time the gain or loss will be recorded in the consolidatedstatement of earnings. All derivatives will be recorded at fair value in the consolidated balancesheet.
Hedges – For fair value hedges, the change in fair value of the hedging derivative will be offsetin the consolidated statement of earnings against the change in the fair value of the hedgeditem relating to the hedged risk. For cash flow hedges, the change in fair value of the derivativeto the extent effective will be recorded in other comprehensive income until the asset orliability being hedged affects the consolidated statement of earnings, at which time the relatedchange in fair value of the derivative will also be recorded in the consolidated statement ofearnings. Any hedge ineffectiveness will be recorded in the consolidated statement of earnings.
Accumulated Other Comprehensive Income – Unrealized gains and losses on financial assetswhich are classified as available for sale, unrealized foreign currency translation amountsarising from self-sustaining foreign operations, and changes in the fair value of cash flowhedging instruments will be recorded in a statement of accumulated other comprehensive
24
income until recognized in the consolidated statement of earnings. Accumulated othercomprehensive income will form part of shareholders’ equity.
The transitional impact of these new standards is dependent on the company’s outstandingpositions, hedging strategies and market volatility at the time of transition; however, thesestandards generally align Canadian GAAP with existing US GAAP. The effects of US GAAP aredisclosed in the company’s US GAAP reconciliation note (note 21).
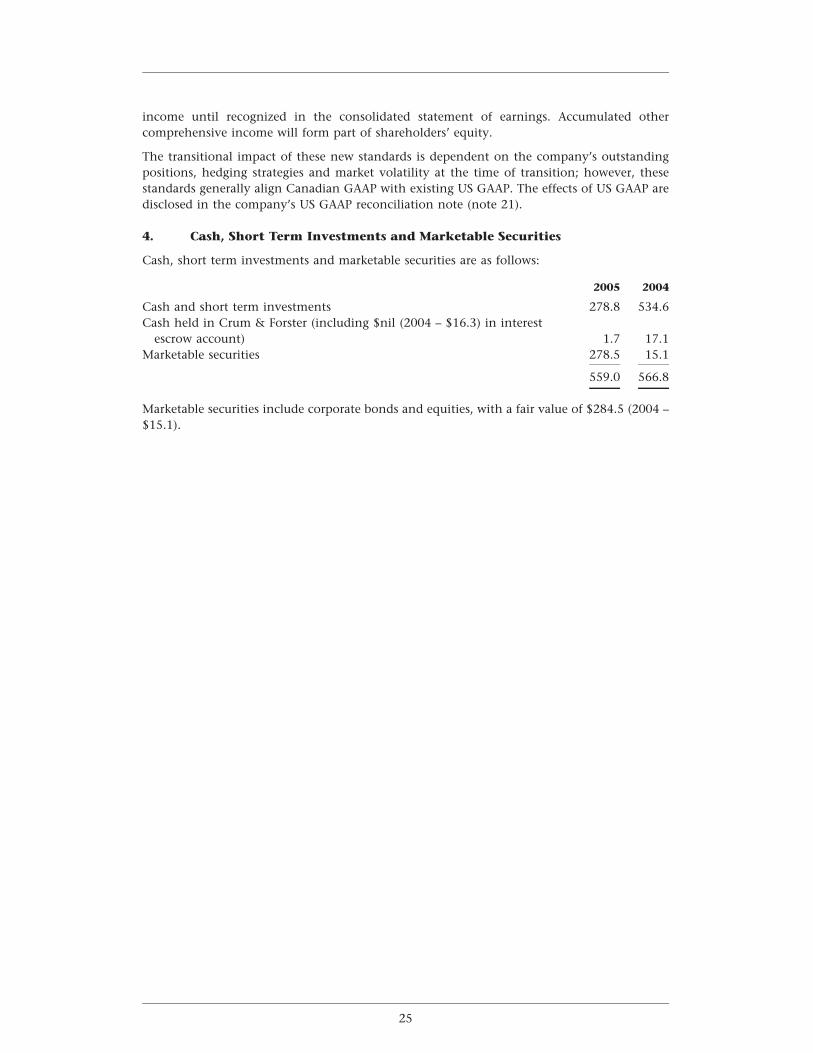
4. Cash, Short Term Investments and Marketable Securities
Cash, short term investments and marketable securities are as follows:
2005 2004
Cash and short term investments 278.8 534.6Cash held in Crum & Forster (including $nil (2004 – $16.3) in interest
escrow account) 1.7 17.1Marketable securities 278.5 15.1
559.0 566.8
Marketable securities include corporate bonds and equities, with a fair value of $284.5 (2004 –$15.1).
25
FAIRFAX FINANCIAL HOLDINGS LIMITED
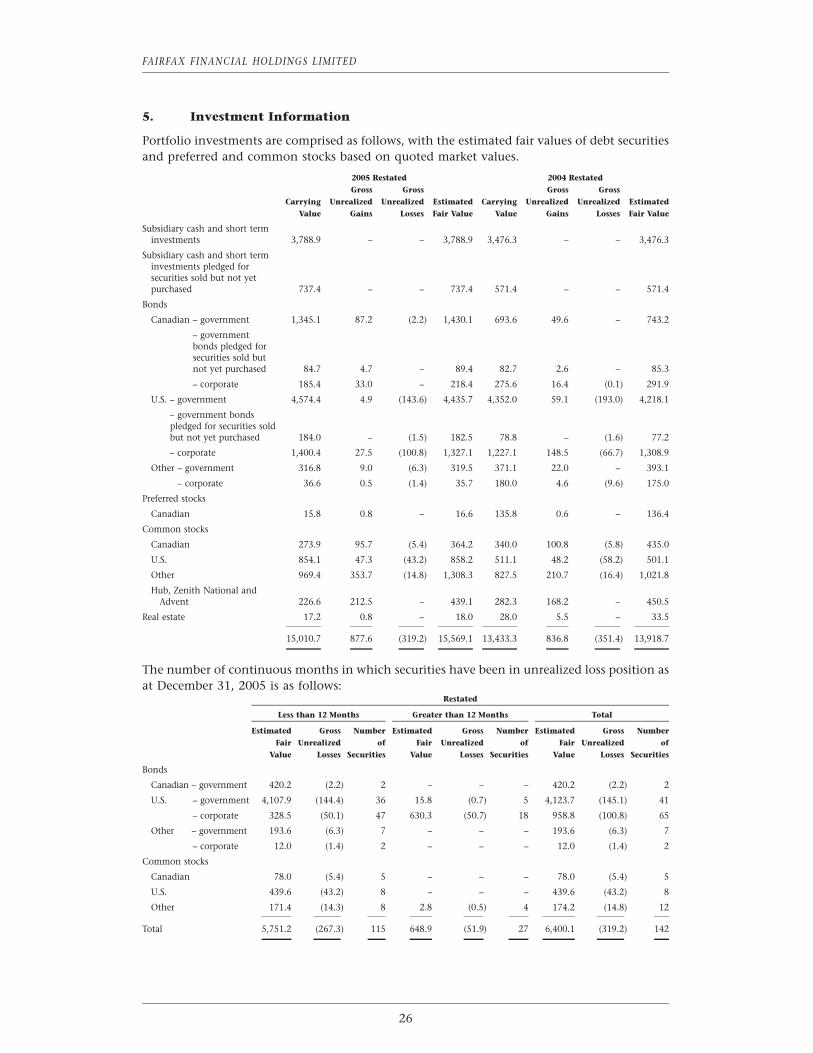
5. Investment Information
Portfolio investments are comprised as follows, with the estimated fair values of debt securitiesand preferred and common stocks based on quoted market values.
2005 Restated 2004 RestatedGross Gross Gross Gross
Carrying Unrealized Unrealized Estimated Carrying Unrealized Unrealized EstimatedValue Gains Losses Fair Value Value Gains Losses Fair Value
Subsidiary cash and short terminvestments 3,788.9 – – 3,788.9 3,476.3 – – 3,476.3
Subsidiary cash and short terminvestments pledged forsecurities sold but not yetpurchased 737.4 – – 737.4 571.4 – – 571.4
Bonds
Canadian – government 1,345.1 87.2 (2.2) 1,430.1 693.6 49.6 – 743.2
– governmentbonds pledged forsecurities sold butnot yet purchased 84.7 4.7 – 89.4 82.7 2.6 – 85.3
– corporate 185.4 33.0 – 218.4 275.6 16.4 (0.1) 291.9
U.S. – government 4,574.4 4.9 (143.6) 4,435.7 4,352.0 59.1 (193.0) 4,218.1
– government bondspledged for securities soldbut not yet purchased 184.0 – (1.5) 182.5 78.8 – (1.6) 77.2
– corporate 1,400.4 27.5 (100.8) 1,327.1 1,227.1 148.5 (66.7) 1,308.9
Other – government 316.8 9.0 (6.3) 319.5 371.1 22.0 – 393.1
– corporate 36.6 0.5 (1.4) 35.7 180.0 4.6 (9.6) 175.0
Preferred stocks
Canadian 15.8 0.8 – 16.6 135.8 0.6 – 136.4
Common stocks
Canadian 273.9 95.7 (5.4) 364.2 340.0 100.8 (5.8) 435.0
U.S. 854.1 47.3 (43.2) 858.2 511.1 48.2 (58.2) 501.1
Other 969.4 353.7 (14.8) 1,308.3 827.5 210.7 (16.4) 1,021.8
Hub, Zenith National andAdvent 226.6 212.5 – 439.1 282.3 168.2 – 450.5
Real estate 17.2 0.8 – 18.0 28.0 5.5 – 33.5
15,010.7 877.6 (319.2) 15,569.1 13,433.3 836.8 (351.4) 13,918.7
The number of continuous months in which securities have been in unrealized loss position asat December 31, 2005 is as follows:
Restated
Less than 12 Months Greater than 12 Months Total
Estimated Gross Number Estimated Gross Number Estimated Gross NumberFair Unrealized of Fair Unrealized of Fair Unrealized of
Value Losses Securities Value Losses Securities Value Losses Securities
Bonds
Canadian – government 420.2 (2.2) 2 – – – 420.2 (2.2) 2
U.S. – government 4,107.9 (144.4) 36 15.8 (0.7) 5 4,123.7 (145.1) 41
– corporate 328.5 (50.1) 47 630.3 (50.7) 18 958.8 (100.8) 65
Other – government 193.6 (6.3) 7 – – – 193.6 (6.3) 7
– corporate 12.0 (1.4) 2 – – – 12.0 (1.4) 2
Common stocks
Canadian 78.0 (5.4) 5 – – – 78.0 (5.4) 5
U.S. 439.6 (43.2) 8 – – – 439.6 (43.2) 8
Other 171.4 (14.3) 8 2.8 (0.5) 4 174.2 (14.8) 12
Total 5,751.2 (267.3) 115 648.9 (51.9) 27 6,400.1 (319.2) 142
26
Management has reviewed currently available information regarding those investments whoseestimated fair value is less than carrying value at December 31, 2005. Debt securities whosecarrying value exceeds market value are expected to be held until maturity or until marketvalue exceeds carrying value. All investments have been reviewed to ensure that corporateperformance expectations have not changed significantly to adversely affect the market valueof these securities other than on a temporary basis. The company has made investments incertain high yield debt securities for which the market value of the investments is below thecarrying value to the company. The company has written down the carrying value of theseinvestments to reflect other than temporary declines in value. The carrying values have beenwritten down to the company’s assessment of the underlying fair value of the investmentswhen the company does not view the current quoted market value as being reflective of theunderlying value of the investments. At December 31, 2005, the company had total bondsrated less than investment grade with an aggregate carrying value of $674.7 (2004 – $477.3),aggregate quoted market value of $644.5 (2004 – $498.7), gross unrealized gains of $43.1(2004 – $69.0) and gross unrealized losses of $73.2 (2004 – $47.6).
At December 31, 2005, as an economic hedge against a decline in the equity markets, thecompany had short sales of approximately $500.0 notional amount of Standard & Poor’sDepository Receipts (‘‘SPDRs’’) and $60.3 of common stocks as well as a Total Return Swap(‘‘swap’’) with a notional value of approximately $550.0 (constituting together hedges with anaggregate notional value of approximately $1,110.3), as described in the two followingparagraphs. At December 31, 2005, common stocks in the company’s portfolio aggregated$2,097.4, with a market value of $2,530.7.
Simultaneously with short sales of approximately $500.0 ($400.0 at December 31, 2004)notional amount of SPDRs and $60.3 ($50.0 at December 31, 2004) of common stocks, thecompany entered into two-year call options (‘‘options’’) to limit the potential loss on thefuture purchase of the SPDRs and the common stocks to $112.1 ($90.0 at December 31, 2004).The company is required to provide collateral for the obligation to purchase the SPDRs, whichamounted to $521.0 ($401.7 at December 31, 2004) of cash and short term securities and$271.9 ($162.5 at December 31, 2004) of bonds at market value (shown on the table above assubsidiary cash and short term investments and bonds pledged for securities sold but not yetpurchased). The collateral provided for the purchase of common stocks sold short is $112.3($70.5 at December 31, 2004) of cash. Both the obligation to purchase the securities sold shortand options are carried at fair value in the consolidated financial statements. The fair value ofthe obligation to purchase the SPDRs and common stocks is included in securities sold but notyet purchased and the fair value of the options is included in common stocks on theconsolidated balance sheet.
The company also has a Total Return Swap (the ‘‘swap’’) with a notional value ofapproximately $550.0 ($450.0 at December 31, 2004). The company receives floating paymentsbased on the notional value multiplied by LIBOR. The company pays or receives a fixed ratebased on the change of the SPDRs which are the underlying security multiplied by the notionalvalue of the swap. Simultaneously, the company entered into an option to limit the potentialloss on the swap to $110.0 ($90.0 at December 31, 2004). Short term securities have beenpledged as collateral for the swap in the amount of $104.1 ($99.2 at December 31, 2004). Thefair value of the swap is a liability of $60.5 ($44.9 at December 31, 2004) and is included insecurities sold but not yet purchased on the consolidated balance sheet.
The company also has purchased credit default swaps and put bond warrants which are carriedat fair value of $142.2 ($52.5 at December 31, 2004) and classified as bonds in the table above.
27
FAIRFAX FINANCIAL HOLDINGS LIMITED
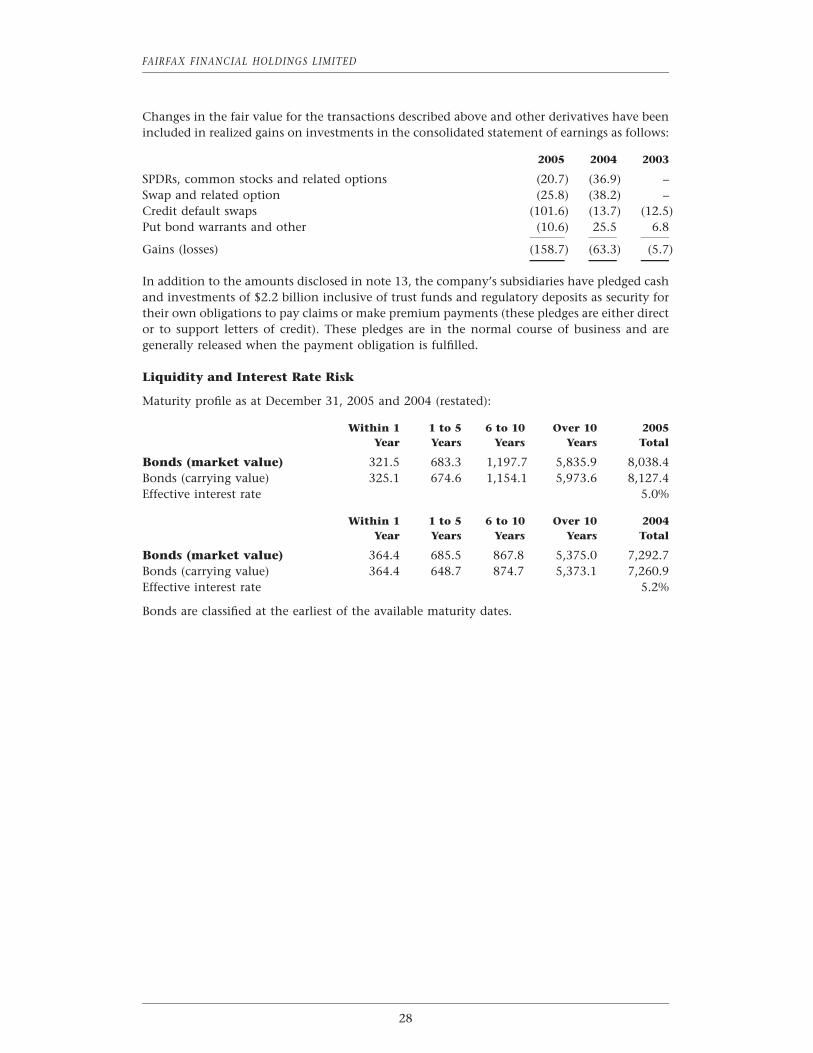
Changes in the fair value for the transactions described above and other derivatives have beenincluded in realized gains on investments in the consolidated statement of earnings as follows:
2005 2004 2003
SPDRs, common stocks and related options (20.7) (36.9) –Swap and related option (25.8) (38.2) –Credit default swaps (101.6) (13.7) (12.5)Put bond warrants and other (10.6) 25.5 6.8
Gains (losses) (158.7) (63.3) (5.7)
In addition to the amounts disclosed in note 13, the company’s subsidiaries have pledged cashand investments of $2.2 billion inclusive of trust funds and regulatory deposits as security fortheir own obligations to pay claims or make premium payments (these pledges are either director to support letters of credit). These pledges are in the normal course of business and aregenerally released when the payment obligation is fulfilled.
Liquidity and Interest Rate Risk
Maturity profile as at December 31, 2005 and 2004 (restated):
Within 1 1 to 5 6 to 10 Over 10 2005Year Years Years Years Total
Bonds (market value) 321.5 683.3 1,197.7 5,835.9 8,038.4Bonds (carrying value) 325.1 674.6 1,154.1 5,973.6 8,127.4Effective interest rate 5.0%
Within 1 1 to 5 6 to 10 Over 10 2004Year Years Years Years Total
Bonds (market value) 364.4 685.5 867.8 5,375.0 7,292.7Bonds (carrying value) 364.4 648.7 874.7 5,373.1 7,260.9Effective interest rate 5.2%
Bonds are classified at the earliest of the available maturity dates.
28
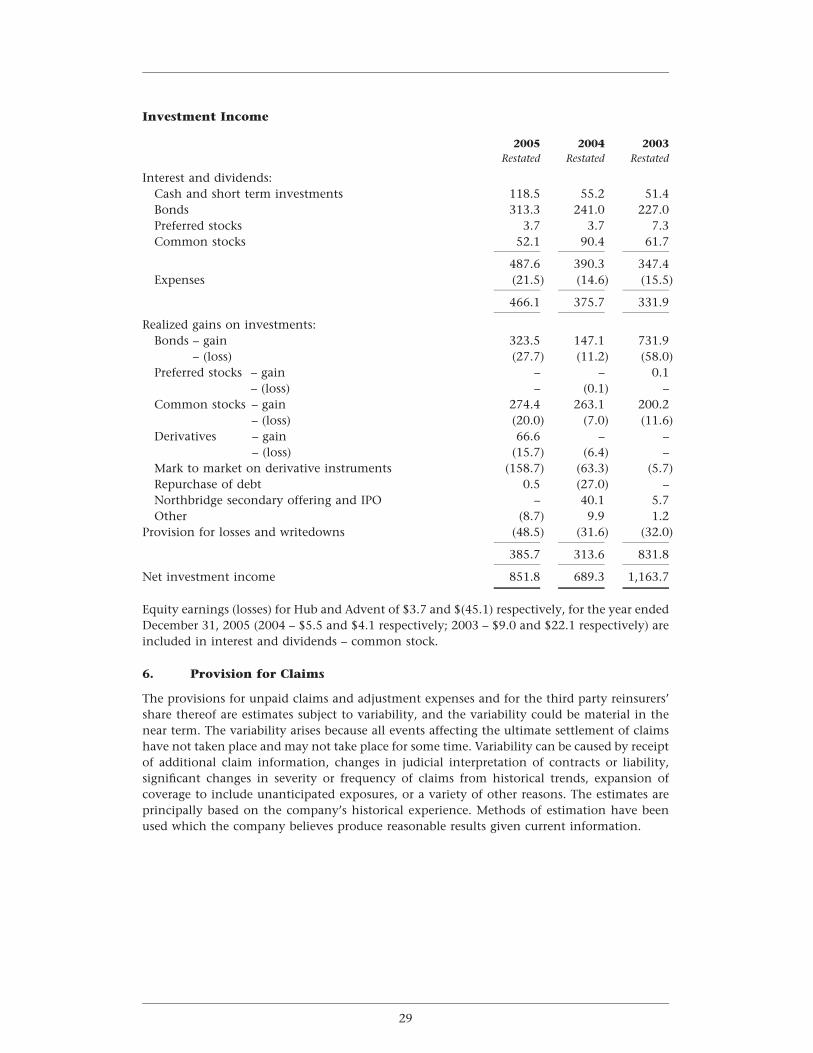
Investment Income
2005 2004 2003Restated Restated Restated
Interest and dividends:Cash and short term investments 118.5 55.2 51.4Bonds 313.3 241.0 227.0Preferred stocks 3.7 3.7 7.3Common stocks 52.1 90.4 61.7
487.6 390.3 347.4Expenses (21.5) (14.6) (15.5)
466.1 375.7 331.9
Realized gains on investments:Bonds – gain 323.5 147.1 731.9
– (loss) (27.7) (11.2) (58.0)Preferred stocks – gain – – 0.1
– (loss) – (0.1) –Common stocks – gain 274.4 263.1 200.2
– (loss) (20.0) (7.0) (11.6)Derivatives – gain 66.6 – –
– (loss) (15.7) (6.4) –Mark to market on derivative instruments (158.7) (63.3) (5.7)Repurchase of debt 0.5 (27.0) –Northbridge secondary offering and IPO – 40.1 5.7Other (8.7) 9.9 1.2
Provision for losses and writedowns (48.5) (31.6) (32.0)
385.7 313.6 831.8
Net investment income 851.8 689.3 1,163.7
Equity earnings (losses) for Hub and Advent of $3.7 and $(45.1) respectively, for the year endedDecember 31, 2005 (2004 – $5.5 and $4.1 respectively; 2003 – $9.0 and $22.1 respectively) areincluded in interest and dividends – common stock.
6. Provision for Claims
The provisions for unpaid claims and adjustment expenses and for the third party reinsurers’share thereof are estimates subject to variability, and the variability could be material in thenear term. The variability arises because all events affecting the ultimate settlement of claimshave not taken place and may not take place for some time. Variability can be caused by receiptof additional claim information, changes in judicial interpretation of contracts or liability,significant changes in severity or frequency of claims from historical trends, expansion ofcoverage to include unanticipated exposures, or a variety of other reasons. The estimates areprincipally based on the company’s historical experience. Methods of estimation have beenused which the company believes produce reasonable results given current information.
29
FAIRFAX FINANCIAL HOLDINGS LIMITED
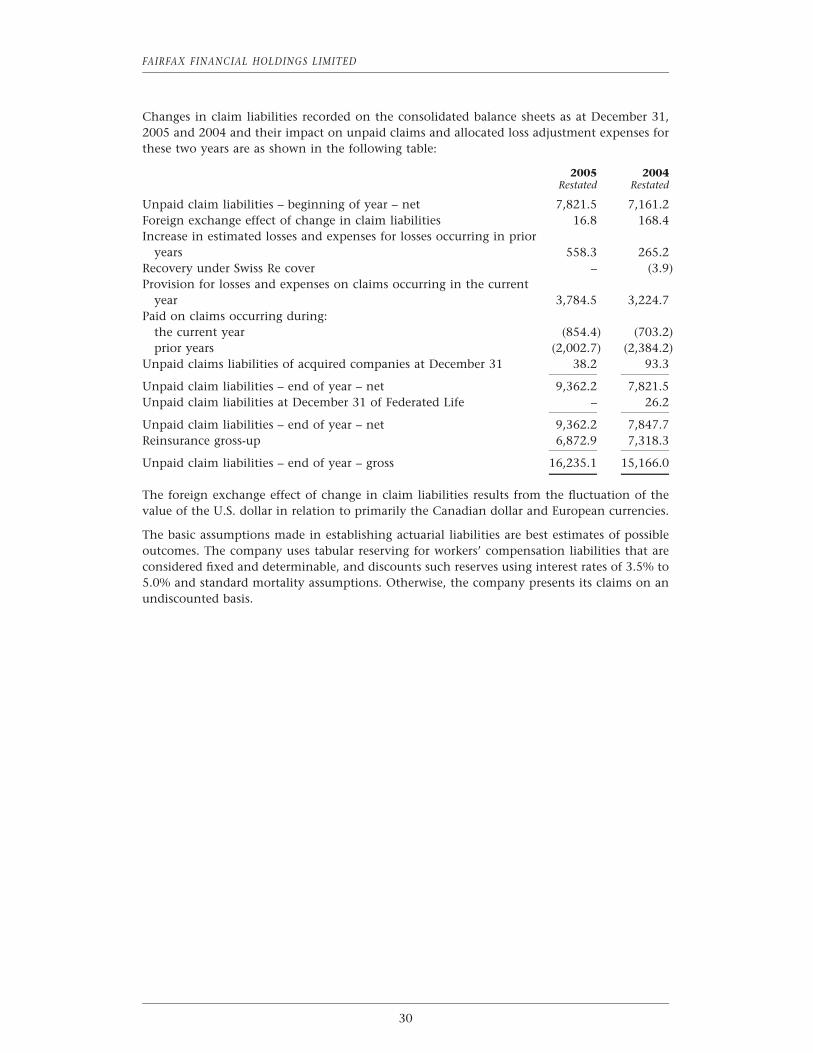
Changes in claim liabilities recorded on the consolidated balance sheets as at December 31,2005 and 2004 and their impact on unpaid claims and allocated loss adjustment expenses forthese two years are as shown in the following table:
2005 2004Restated Restated
Unpaid claim liabilities – beginning of year – net 7,821.5 7,161.2Foreign exchange effect of change in claim liabilities 16.8 168.4Increase in estimated losses and expenses for losses occurring in prior
years 558.3 265.2Recovery under Swiss Re cover – (3.9)Provision for losses and expenses on claims occurring in the current
year 3,784.5 3,224.7Paid on claims occurring during:
the current year (854.4) (703.2)prior years (2,002.7) (2,384.2)
Unpaid claims liabilities of acquired companies at December 31 38.2 93.3
Unpaid claim liabilities – end of year – net 9,362.2 7,821.5Unpaid claim liabilities at December 31 of Federated Life – 26.2
Unpaid claim liabilities – end of year – net 9,362.2 7,847.7Reinsurance gross-up 6,872.9 7,318.3
Unpaid claim liabilities – end of year – gross 16,235.1 15,166.0
The foreign exchange effect of change in claim liabilities results from the fluctuation of thevalue of the U.S. dollar in relation to primarily the Canadian dollar and European currencies.
The basic assumptions made in establishing actuarial liabilities are best estimates of possibleoutcomes. The company uses tabular reserving for workers’ compensation liabilities that areconsidered fixed and determinable, and discounts such reserves using interest rates of 3.5% to5.0% and standard mortality assumptions. Otherwise, the company presents its claims on anundiscounted basis.
30
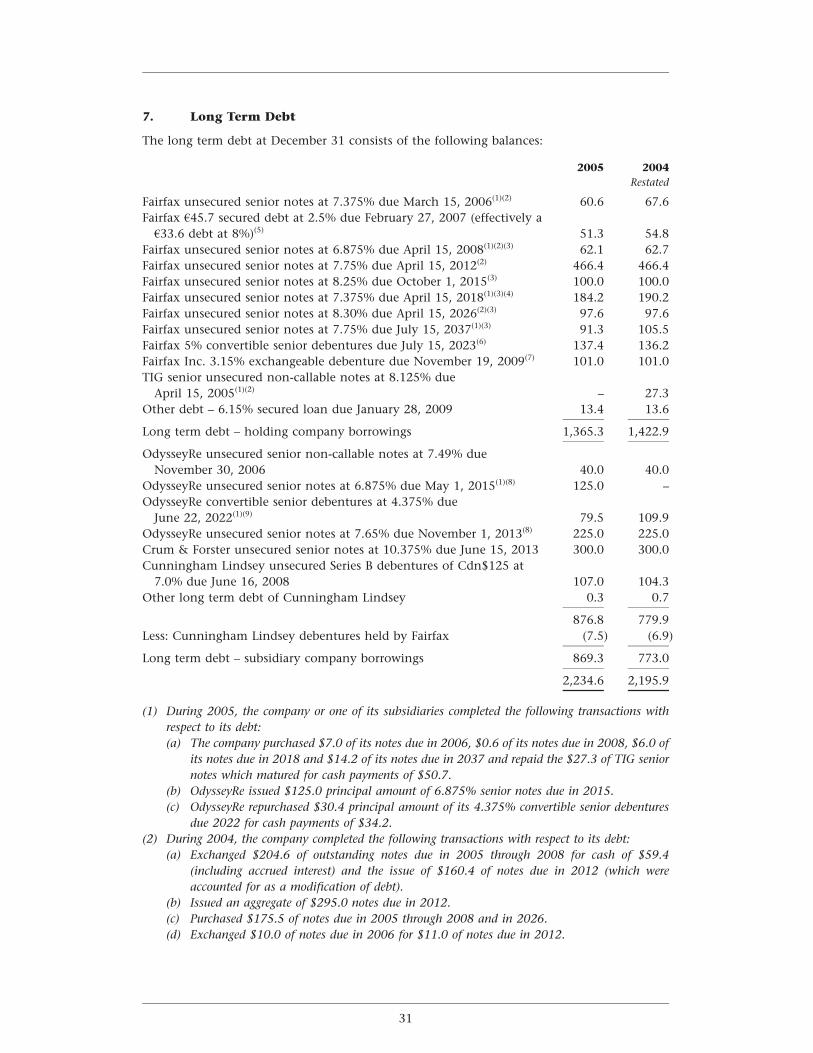
7. Long Term Debt
The long term debt at December 31 consists of the following balances:
2005 2004Restated
Fairfax unsecured senior notes at 7.375% due March 15, 2006(1)(2) 60.6 67.6Fairfax 445.7 secured debt at 2.5% due February 27, 2007 (effectively a
433.6 debt at 8%)(5) 51.3 54.8Fairfax unsecured senior notes at 6.875% due April 15, 2008(1)(2)(3) 62.1 62.7Fairfax unsecured senior notes at 7.75% due April 15, 2012(2) 466.4 466.4Fairfax unsecured senior notes at 8.25% due October 1, 2015(3) 100.0 100.0Fairfax unsecured senior notes at 7.375% due April 15, 2018(1)(3)(4) 184.2 190.2Fairfax unsecured senior notes at 8.30% due April 15, 2026(2)(3) 97.6 97.6Fairfax unsecured senior notes at 7.75% due July 15, 2037(1)(3) 91.3 105.5Fairfax 5% convertible senior debentures due July 15, 2023(6) 137.4 136.2Fairfax Inc. 3.15% exchangeable debenture due November 19, 2009(7) 101.0 101.0TIG senior unsecured non-callable notes at 8.125% due
April 15, 2005(1)(2) – 27.3Other debt – 6.15% secured loan due January 28, 2009 13.4 13.6
Long term debt – holding company borrowings 1,365.3 1,422.9
OdysseyRe unsecured senior non-callable notes at 7.49% dueNovember 30, 2006 40.0 40.0
OdysseyRe unsecured senior notes at 6.875% due May 1, 2015(1)(8) 125.0 –OdysseyRe convertible senior debentures at 4.375% due
June 22, 2022(1)(9) 79.5 109.9OdysseyRe unsecured senior notes at 7.65% due November 1, 2013(8) 225.0 225.0Crum & Forster unsecured senior notes at 10.375% due June 15, 2013 300.0 300.0Cunningham Lindsey unsecured Series B debentures of Cdn$125 at
7.0% due June 16, 2008 107.0 104.3Other long term debt of Cunningham Lindsey 0.3 0.7
876.8 779.9Less: Cunningham Lindsey debentures held by Fairfax (7.5) (6.9)
Long term debt – subsidiary company borrowings 869.3 773.0
2,234.6 2,195.9
(1) During 2005, the company or one of its subsidiaries completed the following transactions withrespect to its debt:(a) The company purchased $7.0 of its notes due in 2006, $0.6 of its notes due in 2008, $6.0 of
its notes due in 2018 and $14.2 of its notes due in 2037 and repaid the $27.3 of TIG seniornotes which matured for cash payments of $50.7.
(b) OdysseyRe issued $125.0 principal amount of 6.875% senior notes due in 2015.(c) OdysseyRe repurchased $30.4 principal amount of its 4.375% convertible senior debentures
due 2022 for cash payments of $34.2.(2) During 2004, the company completed the following transactions with respect to its debt:
(a) Exchanged $204.6 of outstanding notes due in 2005 through 2008 for cash of $59.4(including accrued interest) and the issue of $160.4 of notes due in 2012 (which wereaccounted for as a modification of debt).
(b) Issued an aggregate of $295.0 notes due in 2012.(c) Purchased $175.5 of notes due in 2005 through 2008 and in 2026.(d) Exchanged $10.0 of notes due in 2006 for $11.0 of notes due in 2012.
31
FAIRFAX FINANCIAL HOLDINGS LIMITED
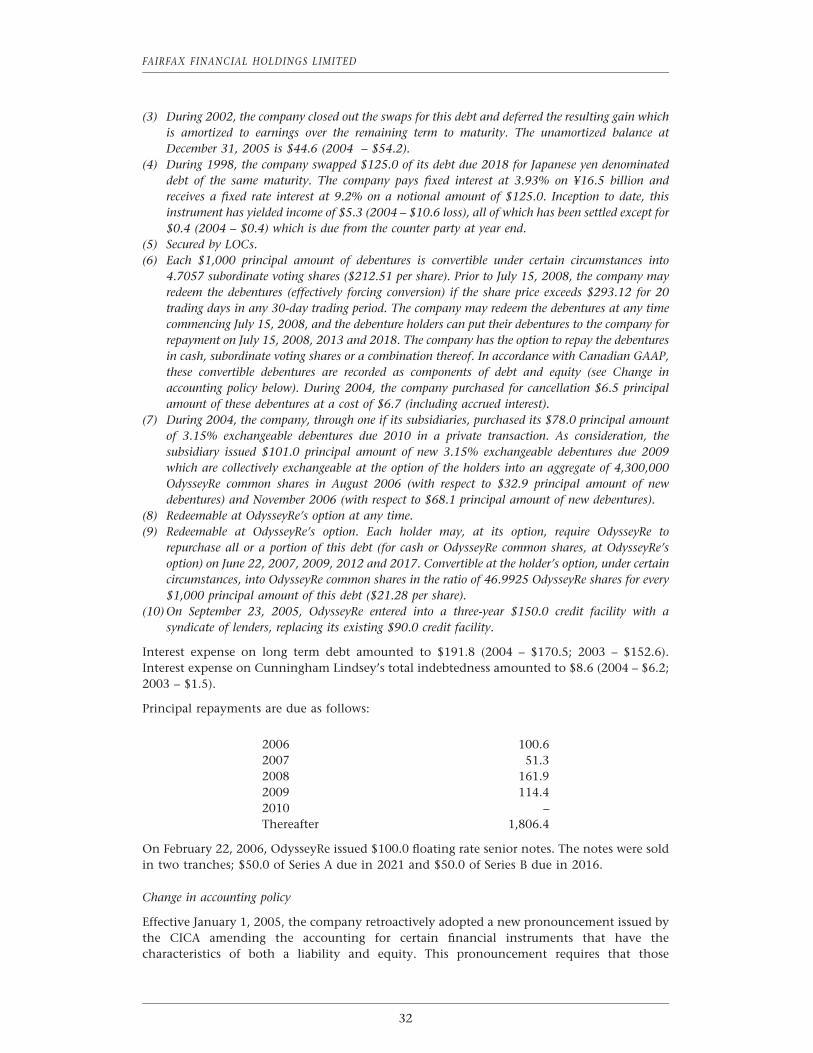
(3) During 2002, the company closed out the swaps for this debt and deferred the resulting gain whichis amortized to earnings over the remaining term to maturity. The unamortized balance atDecember 31, 2005 is $44.6 (2004 – $54.2).
(4) During 1998, the company swapped $125.0 of its debt due 2018 for Japanese yen denominateddebt of the same maturity. The company pays fixed interest at 3.93% on ¥16.5 billion andreceives a fixed rate interest at 9.2% on a notional amount of $125.0. Inception to date, thisinstrument has yielded income of $5.3 (2004 – $10.6 loss), all of which has been settled except for$0.4 (2004 – $0.4) which is due from the counter party at year end.
(5) Secured by LOCs.(6) Each $1,000 principal amount of debentures is convertible under certain circumstances into
4.7057 subordinate voting shares ($212.51 per share). Prior to July 15, 2008, the company mayredeem the debentures (effectively forcing conversion) if the share price exceeds $293.12 for 20trading days in any 30-day trading period. The company may redeem the debentures at any timecommencing July 15, 2008, and the debenture holders can put their debentures to the company forrepayment on July 15, 2008, 2013 and 2018. The company has the option to repay the debenturesin cash, subordinate voting shares or a combination thereof. In accordance with Canadian GAAP,these convertible debentures are recorded as components of debt and equity (see Change inaccounting policy below). During 2004, the company purchased for cancellation $6.5 principalamount of these debentures at a cost of $6.7 (including accrued interest).
(7) During 2004, the company, through one if its subsidiaries, purchased its $78.0 principal amountof 3.15% exchangeable debentures due 2010 in a private transaction. As consideration, thesubsidiary issued $101.0 principal amount of new 3.15% exchangeable debentures due 2009which are collectively exchangeable at the option of the holders into an aggregate of 4,300,000OdysseyRe common shares in August 2006 (with respect to $32.9 principal amount of newdebentures) and November 2006 (with respect to $68.1 principal amount of new debentures).
(8) Redeemable at OdysseyRe’s option at any time.(9) Redeemable at OdysseyRe’s option. Each holder may, at its option, require OdysseyRe to
repurchase all or a portion of this debt (for cash or OdysseyRe common shares, at OdysseyRe’soption) on June 22, 2007, 2009, 2012 and 2017. Convertible at the holder’s option, under certaincircumstances, into OdysseyRe common shares in the ratio of 46.9925 OdysseyRe shares for every$1,000 principal amount of this debt ($21.28 per share).
(10) On September 23, 2005, OdysseyRe entered into a three-year $150.0 credit facility with asyndicate of lenders, replacing its existing $90.0 credit facility.
Interest expense on long term debt amounted to $191.8 (2004 – $170.5; 2003 – $152.6).Interest expense on Cunningham Lindsey’s total indebtedness amounted to $8.6 (2004 – $6.2;2003 – $1.5).
Principal repayments are due as follows:
2006 100.62007 51.32008 161.92009 114.42010 –Thereafter 1,806.4
On February 22, 2006, OdysseyRe issued $100.0 floating rate senior notes. The notes were soldin two tranches; $50.0 of Series A due in 2021 and $50.0 of Series B due in 2016.
Change in accounting policy
Effective January 1, 2005, the company retroactively adopted a new pronouncement issued bythe CICA amending the accounting for certain financial instruments that have thecharacteristics of both a liability and equity. This pronouncement requires that those
32
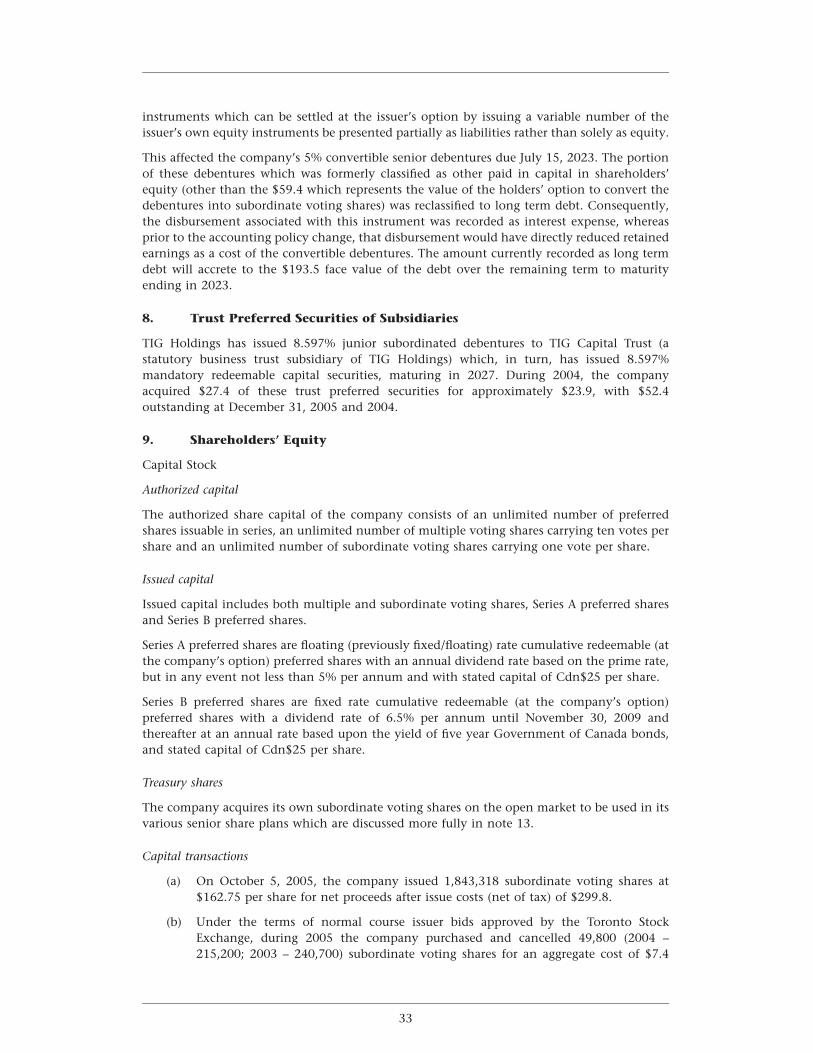
instruments which can be settled at the issuer’s option by issuing a variable number of theissuer’s own equity instruments be presented partially as liabilities rather than solely as equity.
This affected the company’s 5% convertible senior debentures due July 15, 2023. The portionof these debentures which was formerly classified as other paid in capital in shareholders’equity (other than the $59.4 which represents the value of the holders’ option to convert thedebentures into subordinate voting shares) was reclassified to long term debt. Consequently,the disbursement associated with this instrument was recorded as interest expense, whereasprior to the accounting policy change, that disbursement would have directly reduced retainedearnings as a cost of the convertible debentures. The amount currently recorded as long termdebt will accrete to the $193.5 face value of the debt over the remaining term to maturityending in 2023.
8. Trust Preferred Securities of Subsidiaries
TIG Holdings has issued 8.597% junior subordinated debentures to TIG Capital Trust (astatutory business trust subsidiary of TIG Holdings) which, in turn, has issued 8.597%mandatory redeemable capital securities, maturing in 2027. During 2004, the companyacquired $27.4 of these trust preferred securities for approximately $23.9, with $52.4outstanding at December 31, 2005 and 2004.
9. Shareholders’ Equity
Capital Stock
Authorized capital
The authorized share capital of the company consists of an unlimited number of preferredshares issuable in series, an unlimited number of multiple voting shares carrying ten votes pershare and an unlimited number of subordinate voting shares carrying one vote per share.
Issued capital
Issued capital includes both multiple and subordinate voting shares, Series A preferred sharesand Series B preferred shares.
Series A preferred shares are floating (previously fixed/floating) rate cumulative redeemable (atthe company’s option) preferred shares with an annual dividend rate based on the prime rate,but in any event not less than 5% per annum and with stated capital of Cdn$25 per share.
Series B preferred shares are fixed rate cumulative redeemable (at the company’s option)preferred shares with a dividend rate of 6.5% per annum until November 30, 2009 andthereafter at an annual rate based upon the yield of five year Government of Canada bonds,and stated capital of Cdn$25 per share.
Treasury shares
The company acquires its own subordinate voting shares on the open market to be used in itsvarious senior share plans which are discussed more fully in note 13.
Capital transactions
(a) On October 5, 2005, the company issued 1,843,318 subordinate voting shares at$162.75 per share for net proceeds after issue costs (net of tax) of $299.8.
(b) Under the terms of normal course issuer bids approved by the Toronto StockExchange, during 2005 the company purchased and cancelled 49,800 (2004 –215,200; 2003 – 240,700) subordinate voting shares for an aggregate cost of $7.4
33
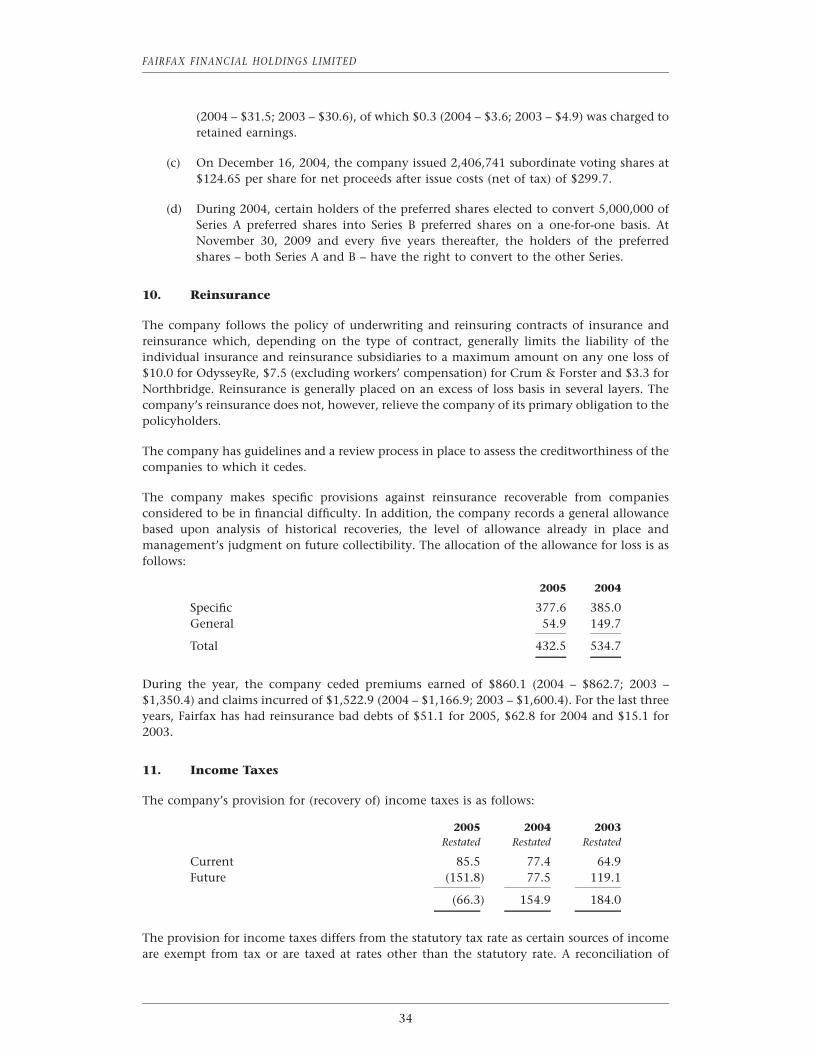
FAIRFAX FINANCIAL HOLDINGS LIMITED
(2004 – $31.5; 2003 – $30.6), of which $0.3 (2004 – $3.6; 2003 – $4.9) was charged toretained earnings.
(c) On December 16, 2004, the company issued 2,406,741 subordinate voting shares at$124.65 per share for net proceeds after issue costs (net of tax) of $299.7.
(d) During 2004, certain holders of the preferred shares elected to convert 5,000,000 ofSeries A preferred shares into Series B preferred shares on a one-for-one basis. AtNovember 30, 2009 and every five years thereafter, the holders of the preferredshares – both Series A and B – have the right to convert to the other Series.
10. Reinsurance
The company follows the policy of underwriting and reinsuring contracts of insurance andreinsurance which, depending on the type of contract, generally limits the liability of theindividual insurance and reinsurance subsidiaries to a maximum amount on any one loss of$10.0 for OdysseyRe, $7.5 (excluding workers’ compensation) for Crum & Forster and $3.3 forNorthbridge. Reinsurance is generally placed on an excess of loss basis in several layers. Thecompany’s reinsurance does not, however, relieve the company of its primary obligation to thepolicyholders.
The company has guidelines and a review process in place to assess the creditworthiness of thecompanies to which it cedes.
The company makes specific provisions against reinsurance recoverable from companiesconsidered to be in financial difficulty. In addition, the company records a general allowancebased upon analysis of historical recoveries, the level of allowance already in place andmanagement’s judgment on future collectibility. The allocation of the allowance for loss is asfollows:
2005 2004
Specific 377.6 385.0General 54.9 149.7
Total 432.5 534.7
During the year, the company ceded premiums earned of $860.1 (2004 – $862.7; 2003 –$1,350.4) and claims incurred of $1,522.9 (2004 – $1,166.9; 2003 – $1,600.4). For the last threeyears, Fairfax has had reinsurance bad debts of $51.1 for 2005, $62.8 for 2004 and $15.1 for2003.
11. Income Taxes
The company’s provision for (recovery of) income taxes is as follows:
2005 2004 2003Restated Restated Restated
Current 85.5 77.4 64.9Future (151.8) 77.5 119.1
(66.3) 154.9 184.0
The provision for income taxes differs from the statutory tax rate as certain sources of incomeare exempt from tax or are taxed at rates other than the statutory rate. A reconciliation of
34
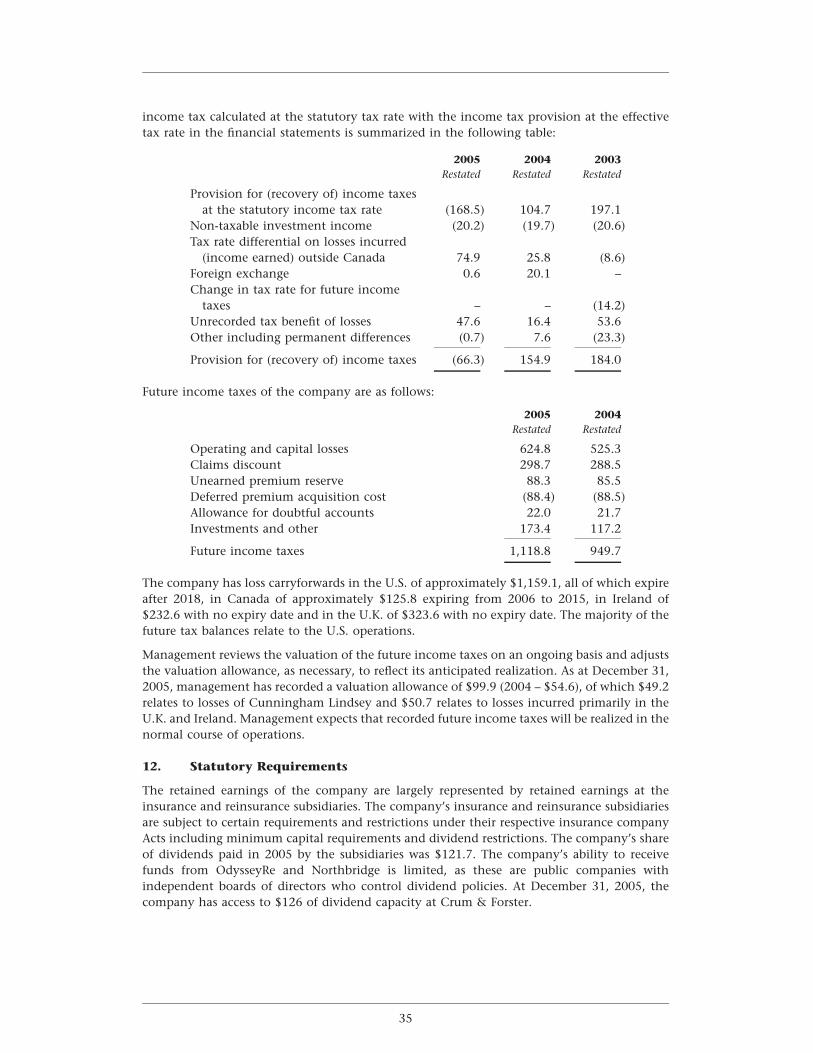
income tax calculated at the statutory tax rate with the income tax provision at the effectivetax rate in the financial statements is summarized in the following table:
2005 2004 2003Restated Restated Restated
Provision for (recovery of) income taxesat the statutory income tax rate (168.5) 104.7 197.1
Non-taxable investment income (20.2) (19.7) (20.6)Tax rate differential on losses incurred
(income earned) outside Canada 74.9 25.8 (8.6)Foreign exchange 0.6 20.1 –Change in tax rate for future income
taxes – – (14.2)Unrecorded tax benefit of losses 47.6 16.4 53.6Other including permanent differences (0.7) 7.6 (23.3)
Provision for (recovery of) income taxes (66.3) 154.9 184.0
Future income taxes of the company are as follows:
2005 2004Restated Restated
Operating and capital losses 624.8 525.3Claims discount 298.7 288.5Unearned premium reserve 88.3 85.5Deferred premium acquisition cost (88.4) (88.5)Allowance for doubtful accounts 22.0 21.7Investments and other 173.4 117.2
Future income taxes 1,118.8 949.7
The company has loss carryforwards in the U.S. of approximately $1,159.1, all of which expireafter 2018, in Canada of approximately $125.8 expiring from 2006 to 2015, in Ireland of$232.6 with no expiry date and in the U.K. of $323.6 with no expiry date. The majority of thefuture tax balances relate to the U.S. operations.
Management reviews the valuation of the future income taxes on an ongoing basis and adjuststhe valuation allowance, as necessary, to reflect its anticipated realization. As at December 31,2005, management has recorded a valuation allowance of $99.9 (2004 – $54.6), of which $49.2relates to losses of Cunningham Lindsey and $50.7 relates to losses incurred primarily in theU.K. and Ireland. Management expects that recorded future income taxes will be realized in thenormal course of operations.
12. Statutory Requirements
The retained earnings of the company are largely represented by retained earnings at theinsurance and reinsurance subsidiaries. The company’s insurance and reinsurance subsidiariesare subject to certain requirements and restrictions under their respective insurance companyActs including minimum capital requirements and dividend restrictions. The company’s shareof dividends paid in 2005 by the subsidiaries was $121.7. The company’s ability to receivefunds from OdysseyRe and Northbridge is limited, as these are public companies withindependent boards of directors who control dividend policies. At December 31, 2005, thecompany has access to $126 of dividend capacity at Crum & Forster.
35
FAIRFAX FINANCIAL HOLDINGS LIMITED
13. Contingencies and Commitments
On September 7, 2005, the company announced that it had received a subpoena from theU.S. Securities and Exchange Commission (the ‘‘SEC’’) requesting documents regarding anynon-traditional insurance or reinsurance product transactions entered into by the entities inthe consolidated group and any non-traditional insurance or reinsurance products offered bythe entities in that group. On September 26, 2005, the company announced that it hadreceived a further subpoena from the SEC as part of its investigation into such loss mitigationproducts, requesting documents regarding any transactions in the company’s securities, thecompensation for such transactions and the trading volume or share price of such securities.Previously, on June 24, 2005, the company announced that the company’s Fairmontsubsidiary had received a subpoena from the SEC requesting documents regarding any non-traditional insurance product transactions entered into by Fairmont with General ReCorporation or affiliates thereof. The U.S. Attorney’s office for the Southern District of NewYork is reviewing documents produced by the company to the SEC and is participating in theinvestigation of these matters. The company is cooperating fully with these requests. Thecompany has prepared presentations and provided documents to the SEC and theU.S. Attorney’s office, and its employees, including senior officers, have attended or have beenrequested to attend interviews conducted by the SEC and the U.S. Attorney’s office.
The company and Prem Watsa, the company’s Chief Executive Officer, received subpoenasfrom the SEC in connection with the answer to a question on the February 10, 2006 investorconference call concerning the review of the company’s finite insurance contracts. In the fall of2005, Fairfax and its subsidiaries prepared and provided to the SEC a list intended to identifycertain finite contracts and contracts with other non-traditional features of all Fairfax groupcompanies. As part of the 2005 year-end reporting and closing process, Fairfax and itssubsidiaries internally reviewed all of the contracts on the list provided to the SEC and someadditional contracts as deemed appropriate.
It is possible that other governmental and enforcement agencies will seek to reviewinformation related to these matters, or that the company, or other parties with whom itinteracts, such as customers or shareholders, may become subject to direct requests forinformation or other inquiries by such agencies. These inquiries are ongoing and the companycontinues to comply with requests for information from the SEC and the U.S. Attorney’s office.At the present time the company cannot predict the outcome from these continuing inquiries,or the ultimate effect on its financial statements, which effect could be material and adverse.
Subsidiaries of the company are defendants in several damage suits and have been named asthird party in other suits. The uninsured exposure to the company is not considered to bematerial to the company’s financial position.
In addition to the secured letters of credit referred to in note 5, at December 31, 2005 letters ofcredit aggregating $450.0 had been issued upon the company’s application and pledged assecurity for subsidiaries’ reinsurance balances, all relating to intercompany reinsurancebetween subsidiaries. These letters of credit are effectively secured by the assets held in trustderived from the premiums on the company’s corporate insurance cover ultimately reinsuredwith a Swiss Re subsidiary, and the interest thereon. The lenders have the ability, in the eventof a default, to cause the commutation of this cover, thereby gaining access to the above-mentioned assets.
At December 31, 2005, OdysseyRe had pledged and placed on deposit at Lloyd’s approximately$188.8 (£110.0) of U.S. Treasury Notes on behalf of Advent. Subsequent to year end, $65.2(£38.0) of these pledged funds were substituted with funds from Advent, thereby reducingfunds pledged and deposited by OdysseyRe to $123.6 (£72.0). nSpire Re had previously pledgedassets at Lloyd’s on behalf of Advent pursuant to a November 2000 Funding Agreement withAdvent whereby the funds are used to support Advent’s underwriting activities for the 2001 to
36
2005 underwriting years of account. Advent is responsible for the payment of any lossesresulting from the use of these funds to support its underwriting activities.
A subsidiary of Cunningham Lindsey owes $62.3 (Cdn$72.8) (2004 – $78.3 (Cdn$105.0))under an unsecured non-revolving term credit facility. Fairfax has extended its letter of supportof Cunningham Lindsey to apply to a two-year extension of this credit facility.
The company under certain circumstances may be obligated to assume loans to officers anddirectors of the company and its subsidiaries from Canadian chartered banks totalling $9.5(2004 – $9.3) for which 214,186 (2004 – 214,186) subordinate voting shares of the companywith a year-end market value of $30.8 (2004 – $36.1) have been pledged as security by theborrowers.
The company also has restricted stock plans or equivalent for management of the holdingcompany and its subsidiaries with vesting periods of up to ten years from the date of grant. AtDecember 31, 2005, 245,858 (2004 – 237,853) subordinate voting shares had been purchasedfor the plans at a cost of $54.1 (2004 – $51.6).
Shares for the above-mentioned plans are purchased on the open market. The costs of theseplans are amortized to compensation expense over the vesting period. Amortization expensefor the year for these plans amounted to $6.7 (2004 – $10.5; 2003 – $7.7).
14. Pensions
The company’s subsidiaries have various pension and post retirement benefit plans for theiremployees. These plans are a combination of defined benefit plans which use variousmeasurement dates between September 30, 2005 and December 31, 2005 and definedcontribution plans. The investment policy for the defined benefit pension plans is to invest inhighly rated, lower risk securities that preserve the investment asset value of the plans whileseeking to maximize the return on those invested assets. The plans’ assets as of December 31,2005 and 2004 are invested principally in highly rated fixed income securities. The long termrate of return assumption is based on the fixed income securities portfolio. The actual returnon assets has historically been in line with the company’s assumptions of expected returns.The following tables set forth the funded status of the company’s benefit plans along with
37
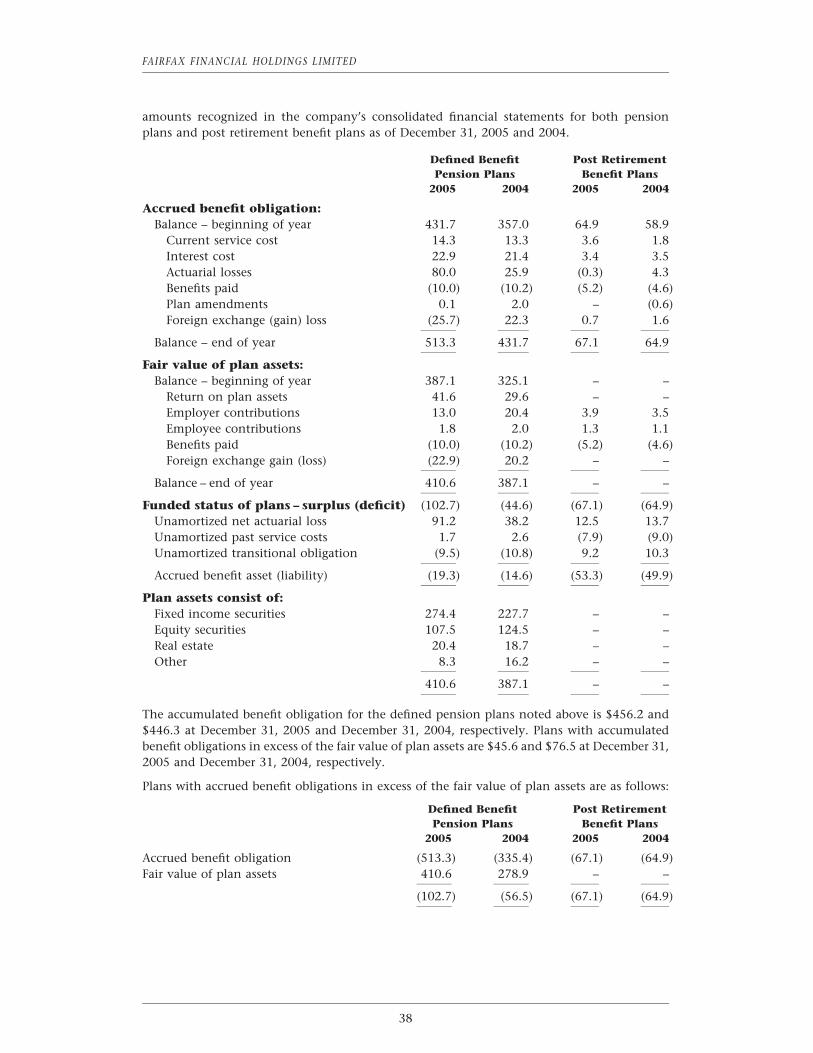
FAIRFAX FINANCIAL HOLDINGS LIMITED
amounts recognized in the company’s consolidated financial statements for both pensionplans and post retirement benefit plans as of December 31, 2005 and 2004.
Defined Benefit Post RetirementPension Plans Benefit Plans
2005 2004 2005 2004
Accrued benefit obligation:Balance – beginning of year 431.7 357.0 64.9 58.9
Current service cost 14.3 13.3 3.6 1.8Interest cost 22.9 21.4 3.4 3.5Actuarial losses 80.0 25.9 (0.3) 4.3Benefits paid (10.0) (10.2) (5.2) (4.6)Plan amendments 0.1 2.0 – (0.6)Foreign exchange (gain) loss (25.7) 22.3 0.7 1.6
Balance – end of year 513.3 431.7 67.1 64.9
Fair value of plan assets:Balance – beginning of year 387.1 325.1 – –
Return on plan assets 41.6 29.6 – –Employer contributions 13.0 20.4 3.9 3.5Employee contributions 1.8 2.0 1.3 1.1Benefits paid (10.0) (10.2) (5.2) (4.6)Foreign exchange gain (loss) (22.9) 20.2 – –
Balance – end of year 410.6 387.1 – –
Funded status of plans – surplus (deficit) (102.7) (44.6) (67.1) (64.9)Unamortized net actuarial loss 91.2 38.2 12.5 13.7Unamortized past service costs 1.7 2.6 (7.9) (9.0)Unamortized transitional obligation (9.5) (10.8) 9.2 10.3
Accrued benefit asset (liability) (19.3) (14.6) (53.3) (49.9)
Plan assets consist of:Fixed income securities 274.4 227.7 – –Equity securities 107.5 124.5 – –Real estate 20.4 18.7 – –Other 8.3 16.2 – –
410.6 387.1 – –
The accumulated benefit obligation for the defined pension plans noted above is $456.2 and$446.3 at December 31, 2005 and December 31, 2004, respectively. Plans with accumulatedbenefit obligations in excess of the fair value of plan assets are $45.6 and $76.5 at December 31,2005 and December 31, 2004, respectively.
Plans with accrued benefit obligations in excess of the fair value of plan assets are as follows:
Defined Benefit Post RetirementPension Plans Benefit Plans
2005 2004 2005 2004
Accrued benefit obligation (513.3) (335.4) (67.1) (64.9)Fair value of plan assets 410.6 278.9 – –
(102.7) (56.5) (67.1) (64.9)
38
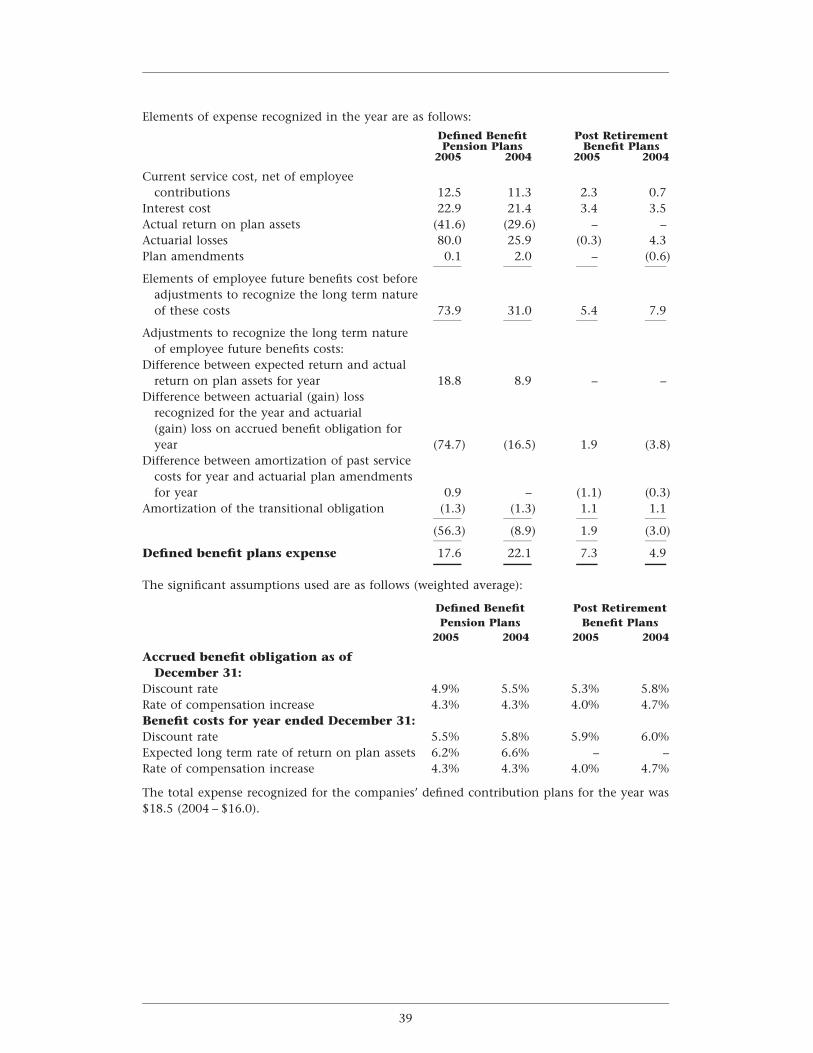
Elements of expense recognized in the year are as follows:
Defined Benefit Post RetirementPension Plans Benefit Plans
2005 2004 2005 2004
Current service cost, net of employeecontributions 12.5 11.3 2.3 0.7
Interest cost 22.9 21.4 3.4 3.5Actual return on plan assets (41.6) (29.6) – –Actuarial losses 80.0 25.9 (0.3) 4.3Plan amendments 0.1 2.0 – (0.6)
Elements of employee future benefits cost beforeadjustments to recognize the long term natureof these costs 73.9 31.0 5.4 7.9
Adjustments to recognize the long term natureof employee future benefits costs:
Difference between expected return and actualreturn on plan assets for year 18.8 8.9 – –
Difference between actuarial (gain) lossrecognized for the year and actuarial(gain) loss on accrued benefit obligation foryear (74.7) (16.5) 1.9 (3.8)
Difference between amortization of past servicecosts for year and actuarial plan amendmentsfor year 0.9 – (1.1) (0.3)
Amortization of the transitional obligation (1.3) (1.3) 1.1 1.1
(56.3) (8.9) 1.9 (3.0)
Defined benefit plans expense 17.6 22.1 7.3 4.9
The significant assumptions used are as follows (weighted average):
Defined Benefit Post RetirementPension Plans Benefit Plans
2005 2004 2005 2004
Accrued benefit obligation as ofDecember 31:
Discount rate 4.9% 5.5% 5.3% 5.8%Rate of compensation increase 4.3% 4.3% 4.0% 4.7%Benefit costs for year ended December 31:Discount rate 5.5% 5.8% 5.9% 6.0%Expected long term rate of return on plan assets 6.2% 6.6% – –Rate of compensation increase 4.3% 4.3% 4.0% 4.7%
The total expense recognized for the companies’ defined contribution plans for the year was$18.5 (2004 – $16.0).
39
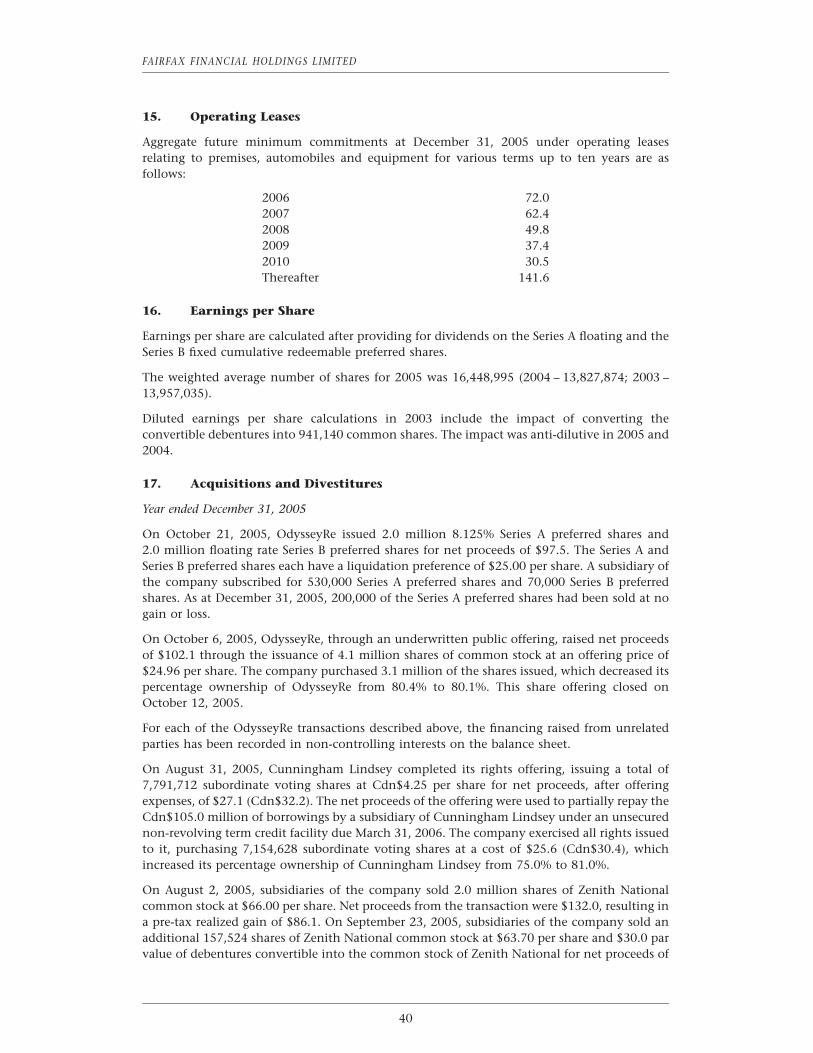
FAIRFAX FINANCIAL HOLDINGS LIMITED
15. Operating Leases
Aggregate future minimum commitments at December 31, 2005 under operating leasesrelating to premises, automobiles and equipment for various terms up to ten years are asfollows:
2006 72.02007 62.42008 49.82009 37.42010 30.5Thereafter 141.6
16. Earnings per Share
Earnings per share are calculated after providing for dividends on the Series A floating and theSeries B fixed cumulative redeemable preferred shares.
The weighted average number of shares for 2005 was 16,448,995 (2004 – 13,827,874; 2003 –13,957,035).
Diluted earnings per share calculations in 2003 include the impact of converting theconvertible debentures into 941,140 common shares. The impact was anti-dilutive in 2005 and2004.
17. Acquisitions and Divestitures
Year ended December 31, 2005
On October 21, 2005, OdysseyRe issued 2.0 million 8.125% Series A preferred shares and2.0 million floating rate Series B preferred shares for net proceeds of $97.5. The Series A andSeries B preferred shares each have a liquidation preference of $25.00 per share. A subsidiary ofthe company subscribed for 530,000 Series A preferred shares and 70,000 Series B preferredshares. As at December 31, 2005, 200,000 of the Series A preferred shares had been sold at nogain or loss.
On October 6, 2005, OdysseyRe, through an underwritten public offering, raised net proceedsof $102.1 through the issuance of 4.1 million shares of common stock at an offering price of$24.96 per share. The company purchased 3.1 million of the shares issued, which decreased itspercentage ownership of OdysseyRe from 80.4% to 80.1%. This share offering closed onOctober 12, 2005.
For each of the OdysseyRe transactions described above, the financing raised from unrelatedparties has been recorded in non-controlling interests on the balance sheet.
On August 31, 2005, Cunningham Lindsey completed its rights offering, issuing a total of7,791,712 subordinate voting shares at Cdn$4.25 per share for net proceeds, after offeringexpenses, of $27.1 (Cdn$32.2). The net proceeds of the offering were used to partially repay theCdn$105.0 million of borrowings by a subsidiary of Cunningham Lindsey under an unsecurednon-revolving term credit facility due March 31, 2006. The company exercised all rights issuedto it, purchasing 7,154,628 subordinate voting shares at a cost of $25.6 (Cdn$30.4), whichincreased its percentage ownership of Cunningham Lindsey from 75.0% to 81.0%.
On August 2, 2005, subsidiaries of the company sold 2.0 million shares of Zenith Nationalcommon stock at $66.00 per share. Net proceeds from the transaction were $132.0, resulting ina pre-tax realized gain of $86.1. On September 23, 2005, subsidiaries of the company sold anadditional 157,524 shares of Zenith National common stock at $63.70 per share and $30.0 parvalue of debentures convertible into the common stock of Zenith National for net proceeds of
40
$86.5, resulting in a pre-tax realized gain of $53.3. These two transactions reduced thecompany’s ownership of Zenith National from 24.4% to 10.3% at year-end. Subsequent toyear-end, subsidiaries of the company sold the remaining 3.8 million shares (adjusted for athree-for-two stock split) of Zenith National common stock at $50.38 per share for netproceeds of $193.8, resulting in a realized pre-tax gain of $137.3.
On June 3, 2005, Advent, through an underwritten public offering, raised gross proceeds of$118.4 (£65.0): $72.9 (£40.0) of equity at $0.64 (35 pence) per share and $45.5 (£25.0) of debt.Concurrent with the equity issue, the shares were listed on the Alternative Investments Marketof the London Stock Exchange. The company maintained its 46.8% interest in Advent bypurchasing its pro rata share of this equity at a total cost of $34.1 (£18.7).
Subsequent to year end, Advent raised an additional $51.5 (£30.0) of equity at $0.34 (20 pence)per share with the company purchasing its pro rata share at a cost of $24.0 (£14.0), therebymaintaining its 46.8% interest in Advent.
On December 29, 2004, the company agreed to acquire 100% of the issued and outstandingcommon shares of Compagnie de Reassurance d’Ile de France (‘‘Corifrance’’), a Frenchreinsurance company, for $59.8 (444.0) payable on April 7, 2005. As at January 11, 2005 (thedate of acquisition), the fair value of assets and liabilities acquired was $122.2 (489.9) and$62.4 (445.9) respectively, resulting in no goodwill. In addition, the seller agreed to indemnifythe company, up to the purchase price, for any adverse development on acquired net reserves.
Year ended December 31, 2004
On November 15, 2004, OdysseyRe acquired Overseas Partners U.S. Reinsurance Company, areinsurance company domiciled in the state of Delaware, for $43.0. The fair value of assets andliabilities acquired was $237.8 and $194.8 respectively, resulting in no goodwill.
Subsidiaries of the company sold 3.1 million shares of common stock of Zenith National at$43 per share, in an underwritten public offering which closed on July 30, 2004, resulting in apre-tax realized gain after expenses of $62.5.
On May 18, 2004, the company recorded a pre-tax realized gain of $40.1 (Cdn$53.5) on thesale of 6.0 million common shares of its Northbridge subsidiary in an underwritten secondaryoffering at a price of Cdn$25.60 per share, generating net proceeds of $104.8 (Cdn$146.0) andreducing the company’s ownership of Northbridge from 71.0% to 59.2%.
On March 14, 2004, Cunningham Lindsey completed the sale of its U.S. third party claimsadministration business for a cash payment by Cunningham Lindsey of $22.0. The dispositionof this business resulted in a charge to earnings of $13.4, consisting of a $3.6 loss on the sale ofthe business and other related accruals, including lease termination costs, of $9.8.
Year ended December 31, 2003
On May 28 and June 10, 2003, Northbridge, the Canadian holding company for LombardCanada Ltd., Commonwealth Insurance Company, Markel Insurance Company of Canada andFederated Holdings of Canada Ltd. and their respective subsidiaries, issued an aggregate of14,740,000 common shares in an initial public offering at Cdn$15 (US$10.82) per share. Netproceeds (after expenses of issue) were $148.9 (Cdn$206.4). After the offering, Fairfax held36.1 million (71.0%) of Northbridge’s common shares. Fairfax recorded a $5.7 (Cdn$8.0) gainon its effective sale of a 29.0% interest in Northbridge which is included in realized gains oninvestments in the consolidated statement of earnings.
On May 30, 2003, Cunningham Lindsey acquired all of the outstanding common shares ofRSKCo Services, Inc. (‘‘RSKCo’’), a claims management service provider in the U.S. The
41
FAIRFAX FINANCIAL HOLDINGS LIMITED
purchase price payable was $10.1 and the fair value of the assets acquired, including goodwillof approximately $4.7, and liabilities assumed were both $37.7.
On March 3, 2003, the company purchased an additional 4.3 million outstanding commonshares of OdysseyRe for $18.15 per share, increasing its interest in OdysseyRe from 73.8% to80.6%. As consideration, the company issued seven-year 3.15% notes exchangeable inNovember 2004 and February 2005 into the same number of OdysseyRe shares purchased.
18. Purchase Consideration Payable
On December 16, 2002, the company acquired Xerox’s 72.5% economic interest in TRG, theholding company of International Insurance Company (‘‘IIC’’), in exchange for payments overthe next 15 years of $424.4 ($203.9 at December 16, 2002 using a discount rate of 9.0% perannum), payable approximately $5.0 a quarter from 2003 to 2017 and approximately $128.2on December 16, 2017. Upon this acquisition, Xerox’s non-voting shares were amended tomake them mandatorily redeemable for the payments described above and to eliminateXerox’s participation in the operations of IIC, and a direct contractual obligation waseffectively created from the company to Xerox. On December 16, 2002, TIG merged with IIC.
19. Segmented Information
The company is a financial services holding company which, through its subsidiaries, isprimarily engaged in property and casualty insurance conducted on a direct and reinsurancebasis. The runoff business segment comprises nSpire Re (which fully reinsures the U.K. andinternational runoff operations, conducted primarily through RiverStone (UK)) and theU.S. runoff company formed on the merger of TIG and IIC combined with Old Lyme. The U.K.and international runoff operations have reinsured their reinsurance portfolios to nSpire Re toprovide consolidated investment and liquidity management services, with the RiverStoneGroup retaining full responsibility for all other aspects of the business. Included in the runoffsegment is Group Re which, through CRC (Bermuda) (Canadian business), Wentworth(international business) and nSpire Re (U.S. business), writes and retains insurance businesswritten by other Fairfax subsidiaries. The company also provides claims adjusting, appraisaland loss management services. The segmented information has been revised to reflect theimpact of the restatement adjustments in note 2.
42
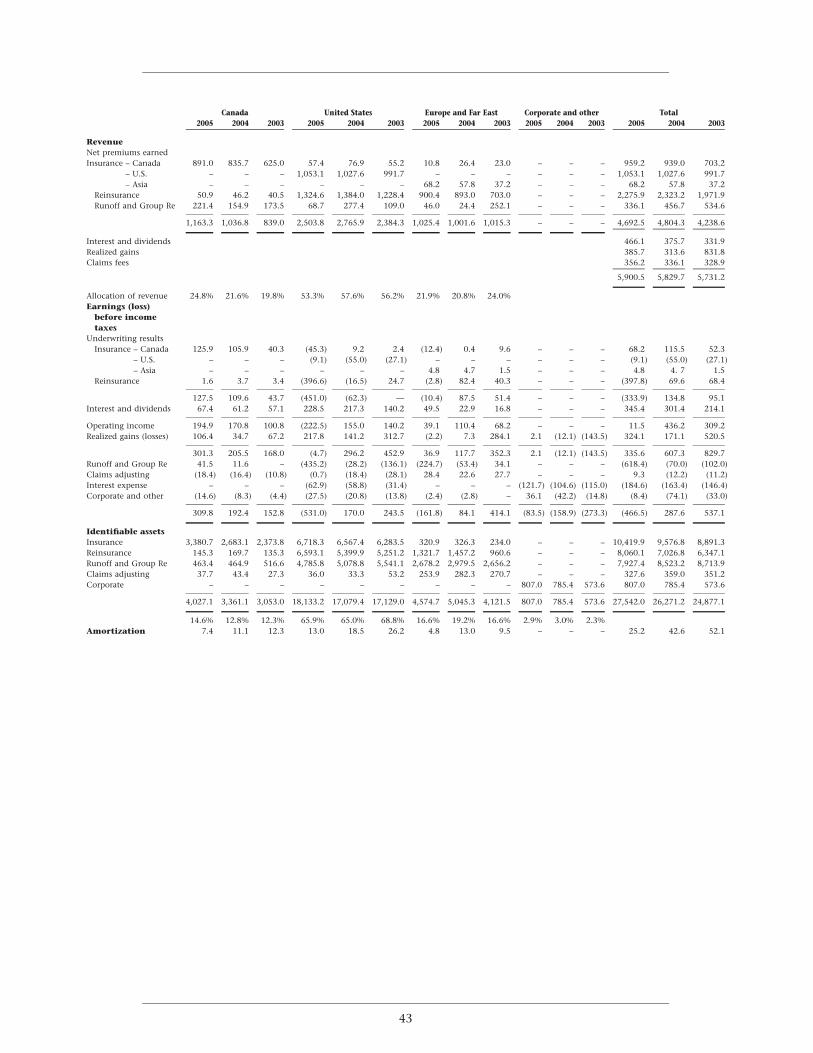
Canada United States Europe and Far East Corporate and other Total2005 2004 2003 2005 2004 2003 2005 2004 2003 2005 2004 2003 2005 2004 2003
RevenueNet premiums earnedInsurance – Canada 891.0 835.7 625.0 57.4 76.9 55.2 10.8 26.4 23.0 – – – 959.2 939.0 703.2
– U.S. – – – 1,053.1 1,027.6 991.7 – – – – – – 1,053.1 1,027.6 991.7– Asia – – – – – – 68.2 57.8 37.2 – – – 68.2 57.8 37.2
Reinsurance 50.9 46.2 40.5 1,324.6 1,384.0 1,228.4 900.4 893.0 703.0 – – – 2,275.9 2,323.2 1,971.9Runoff and Group Re 221.4 154.9 173.5 68.7 277.4 109.0 46.0 24.4 252.1 – – – 336.1 456.7 534.6
1,163.3 1,036.8 839.0 2,503.8 2,765.9 2,384.3 1,025.4 1,001.6 1,015.3 – – – 4,692.5 4,804.3 4,238.6
Interest and dividends 466.1 375.7 331.9Realized gains 385.7 313.6 831.8Claims fees 356.2 336.1 328.9
5,900.5 5,829.7 5,731.2
Allocation of revenue 24.8% 21.6% 19.8% 53.3% 57.6% 56.2% 21.9% 20.8% 24.0%Earnings (loss)
before incometaxes
Underwriting resultsInsurance – Canada 125.9 105.9 40.3 (45.3) 9.2 2.4 (12.4) 0.4 9.6 – – – 68.2 115.5 52.3
– U.S. – – – (9.1) (55.0) (27.1) – – – – – – (9.1) (55.0) (27.1)– Asia – – – – – – 4.8 4.7 1.5 – – – 4.8 4. 7 1.5
Reinsurance 1.6 3.7 3.4 (396.6) (16.5) 24.7 (2.8) 82.4 40.3 – – – (397.8) 69.6 68.4
127.5 109.6 43.7 (451.0) (62.3) — (10.4) 87.5 51.4 – – – (333.9) 134.8 95.1Interest and dividends 67.4 61.2 57.1 228.5 217.3 140.2 49.5 22.9 16.8 – – – 345.4 301.4 214.1
Operating income 194.9 170.8 100.8 (222.5) 155.0 140.2 39.1 110.4 68.2 – – – 11.5 436.2 309.2Realized gains (losses) 106.4 34.7 67.2 217.8 141.2 312.7 (2.2) 7.3 284.1 2.1 (12.1) (143.5) 324.1 171.1 520.5
301.3 205.5 168.0 (4.7) 296.2 452.9 36.9 117.7 352.3 2.1 (12.1) (143.5) 335.6 607.3 829.7Runoff and Group Re 41.5 11.6 – (435.2) (28.2) (136.1) (224.7) (53.4) 34.1 – – – (618.4) (70.0) (102.0)Claims adjusting (18.4) (16.4) (10.8) (0.7) (18.4) (28.1) 28.4 22.6 27.7 – – – 9.3 (12.2) (11.2)Interest expense – – – (62.9) (58.8) (31.4) – – – (121.7) (104.6) (115.0) (184.6) (163.4) (146.4)Corporate and other (14.6) (8.3) (4.4) (27.5) (20.8) (13.8) (2.4) (2.8) – 36.1 (42.2) (14.8) (8.4) (74.1) (33.0)
309.8 192.4 152.8 (531.0) 170.0 243.5 (161.8) 84.1 414.1 (83.5) (158.9) (273.3) (466.5) 287.6 537.1
Identifiable assetsInsurance 3,380.7 2,683.1 2,373.8 6,718.3 6,567.4 6,283.5 320.9 326.3 234.0 – – – 10,419.9 9,576.8 8,891.3Reinsurance 145.3 169.7 135.3 6,593.1 5,399.9 5,251.2 1,321.7 1,457.2 960.6 – – – 8,060.1 7,026.8 6,347.1Runoff and Group Re 463.4 464.9 516.6 4,785.8 5,078.8 5,541.1 2,678.2 2,979.5 2,656.2 – – – 7,927.4 8,523.2 8,713.9Claims adjusting 37.7 43.4 27.3 36.0 33.3 53.2 253.9 282.3 270.7 – – – 327.6 359.0 351.2Corporate – – – – – – – – – 807.0 785.4 573.6 807.0 785.4 573.6
4,027.1 3,361.1 3,053.0 18,133.2 17,079.4 17,129.0 4,574.7 5,045.3 4,121.5 807.0 785.4 573.6 27,542.0 26,271.2 24,877.1
14.6% 12.8% 12.3% 65.9% 65.0% 68.8% 16.6% 19.2% 16.6% 2.9% 3.0% 2.3%Amortization 7.4 11.1 12.3 13.0 18.5 26.2 4.8 13.0 9.5 – – – 25.2 42.6 52.1
43
FAIRFAX FINANCIAL HOLDINGS LIMITED
Interest and dividend income for the Canadian Insurance, U.S. Insurance, Asian Insurance andReinsurance segments is $65.7, $105.0, $7.5 and $167.2, respectively (2004 – $60.9, $81.3, $2.9and $156.3) (2003 – $50.8, $72.7, $0.7 and $89.9). Included in interest and dividend incomefor Canadian Insurance, U.S. Insurance, Asian Insurance and Reinsurance segments are equityearnings (losses) of $1.7, ($16.8), nil and ($12.6), respectively (2004 – $2.5, $1.5, nil and$4.1)(2003 – $4.1, $8.2, nil and $11.7).
Realized gains for the Canadian Insurance, U.S. Insurance, Asian Insurance and Reinsurancesegments are $104.0, $113.9, $1.0 and $103.2, respectively (2004 – $22.6, $85.0, nil and $75.1)(2003 – $67.2, $308.8, $3.8 and $284.1).
Interest expense for the Canadian Insurance, U.S. Insurance, Asian Insurance and Reinsurancesegments is nil, $32.9, nil and $30.0, respectively (2004 – nil, $33.2, nil and $25.6) (2003 – nil,$18.7, nil and $12.7).
Geographic premiums are determined based on the domicile of the various subsidiaries andwhere the primary underlying risk of the business resides.
Corporate and other includes the company’s interest expense and corporate overhead.Corporate assets include cash and short term investments and miscellaneous other assets in theholding company.
20. Fair Value
Information on the fair values of financial instruments of the company, including where thosevalues differ from their carrying values in the financial statements at December 31, 2005,include:
Note Carrying EstimatedReference Value Fair Value
Marketable securities at holding company 4 278.5 284.5
Portfolio investments 5 15,010.7 15,569.1
Securities sold but not yet purchased 5 700.3 700.3
Long term debt 7 2,234.6 2,198.6
Trust preferred securities of subsidiaries 8 52.4 42.2
Purchase consideration payable 18 192.1 192.1
The amounts above do not include the fair value of underlying lines of business. While fairvalue amounts are designed to represent estimates of the amounts at which instruments couldbe exchanged in current transactions between willing parties, certain of the company’sfinancial instruments lack an available trading market. Therefore, these instruments have beenvalued on a going concern basis. Fair value information on the provision for claims andreinsurance recoverables are not determinable.
These fair values have not been reflected in the financial statements.
21. US GAAP Reconciliation
Restatement of Financial Results
The effects of the restatement of the company’s previously reported consolidated financialstatements described in note 2, including the additional US GAAP corrections relating to thecompany’s US GAAP reconciliation, are reflected below. Under US GAAP, the total after-taxcumulative impact of the restatement through December 31, 2005 is to decrease shareholders’equity by $384.3, comprised of the decrease in Canadian GAAP shareholders’ equity referred toin note 2 of $261.7, an increase in the cumulative reduction in net earnings under US GAAP of$91.4 and a decrease in accumulated other comprehensive income under US GAAP of $31.2.
44
The previously reported column included within this note reflects the US GAAP financialresults as originally released on March 31, 2006 and unless otherwise stated all otherrestatement adjustments comprise adjustments announced as part of the August 31, 2006restatement.
The US GAAP corrections relate to:
(i) The accounting treatment for convertible bond securities and other fixed incomesecurities with embedded derivatives which are held as investments. The securities thatare subject to the restatement were held as investments by the company and werepurchased between 2001 and 2005. These securities were carried at fair value inaccordance with Statement of Financial Accounting Standard No. 115 ‘‘Accounting forCertain Investments in Debt and Equity Securities’’ due to their designation asavailable for sale, with corresponding changes in their fair value recorded as acomponent of other comprehensive income within shareholders’ equity. Thetreatment for these investments was restated to correct for the application ofFAS No. 133 ‘‘Accounting for Derivative Instruments and Hedging Activities’’(‘‘FAS 133’’). Under FAS 133, changes in the fair value attributable to the embeddedoption in a convertible bond or other security is required to be recognized in incomethrough realized gains or losses rather than unrealized gains and losses, a componentof shareholders’ equity, as previously reported by the company. The corrections hadno cumulative effect on shareholders’ equity as at December 31, 2005 or December 31,2004, and had the net effect of decreasing the 2005 net loss by $29.3, decreasing the2004 net loss by $8.0, and increasing 2003 net earnings by $6.5. For each such period,there is a corresponding offsetting change in other comprehensive income.
(ii) Recording the minimum pension liability under US GAAP which previously hadbeen considered immaterial. The corrections resulted in a $12.2 after-tax cumulativedecrease in shareholders’ equity as at December 31, 2005, and had the net effect ofincreasing the 2005 other comprehensive loss by $10.9, increasing 2004 othercomprehensive income by $1.4 and increasing 2003 other comprehensive incomeby $0.3.
(iii) The accounting treatment of the Swiss Re Cover. In reviewing the accounting for thecontemplated commutation of the Swiss Re Cover, the company identified that ithad incorrectly calculated the deferred gain, which ultimately impacted theamortization thereof recorded in each period. In addition, the company identifiedthat on the assignment of this cover to nSpire Re, its subsidiary in Ireland, thedeferred tax asset recorded for purposes of US GAAP had not been properly adjustedto recognize the differential in statutory income tax rates between Canada andIreland. These corrections resulted in a $113.6 after-tax cumulative decrease inshareholders’ equity as at December 31, 2005 and a $123.1 cumulative decrease inshareholders’ equity as at December 31, 2004, and had the net effect of decreasingthe 2005 net loss by $9.5 including a reversal of income tax expense of $3.6,increasing 2004 net earnings by $23.2 including a reversal of income tax expense of$12.4, decreasing 2003 net earnings by $36.9 including a reversal of income taxrecovery of $17.7 and decreasing the net earnings of 2002 and prior years by $109.4.In addition, these corrections resulted in an increase in the deferred gain by $33.4and $40.5 as at December 31, 2005 and 2004 respectively, and a decrease in futureincome taxes of $80.2 and $82.6, as at December 31, 2005 and 2004 respectively.
(iv) Timing differences as described in section (i) of note 2 which are related to insurancecontracts which have also been restated to use deposit accounting under US GAAP(formerly retroactive reinsurance and prospective accounting). The corrections hadno cumulative effect on shareholders’ equity as at December 31, 2005 and
45
FAIRFAX FINANCIAL HOLDINGS LIMITED
December 31, 2004, and had the net effect of decreasing 2004 net earnings by $33.2,decreasing 2003 net earnings by $9.4, and increasing the net earnings of 2002 andprior years by $42.6.
(v) Foreign exchange losses from a hedge contract recorded as goodwill for purposes ofCanadian GAAP as described in section (x) of note 2 are not considered a hedge forpurposes of US GAAP. As a result, these foreign exchange losses have been reclassifiedfrom goodwill as a charge to opening retained earnings for US GAAP.
(vi) In addition, from the company’s review of its embedded derivatives for the three andnine months ended September 30, 2006 and 2005, management identified anadditional error in its previously reported restated results as at and for the year endedDecember 31, 2005. In the original restatement for FAS 133 described in (i) above,management incorrectly calculated the net income and other comprehensive incomecomponents for certain instruments sold during the year. The corrections had theeffect of increasing the 2005 net loss by $26.8 with offsetting increases in theunrealized net appreciation of investments included in other comprehensiveincome (loss).
The consolidated financial statements of the company have been prepared in accordance withCanadian GAAP which are different in some respects from those applicable in the UnitedStates, as described below.
Consolidated Statements of Earnings GAAP differences
For the years ended December 31, 2005, 2004 and 2003, significant differences betweenconsolidated net earnings under Canadian GAAP and consolidated net earnings under USGAAP as previously reported were as follows:
(a) Under Canadian GAAP, recoveries on certain stop loss reinsurance treaties (includingwith Swiss Re) protecting Fairfax, Crum & Forster and TIG are recorded at the sametime as the claims incurred are ceded. Under US GAAP, these recoveries, which areconsidered to be retroactive reinsurance, are recorded up to the amount of thepremium paid with the excess of the ceded liabilities over the premium paid recordedas a deferred gain. The deferred gain is amortized to income over the estimatedsettlement period over which the company expects to receive the recoveries and isrecorded in accounts payable and accrued liabilities.
(b) Other than temporary declines are recorded in earnings. Declines in fair values aregenerally presumed to be other than temporary if they have persisted over a period oftime and factors indicate that recovery is uncertain. Under Canadian GAAP, otherthan temporary declines in the value of investment securities to fair value arerecorded in earnings. Under US GAAP, securities are written down to quoted marketvalue when an other than temporary decline occurs.
46
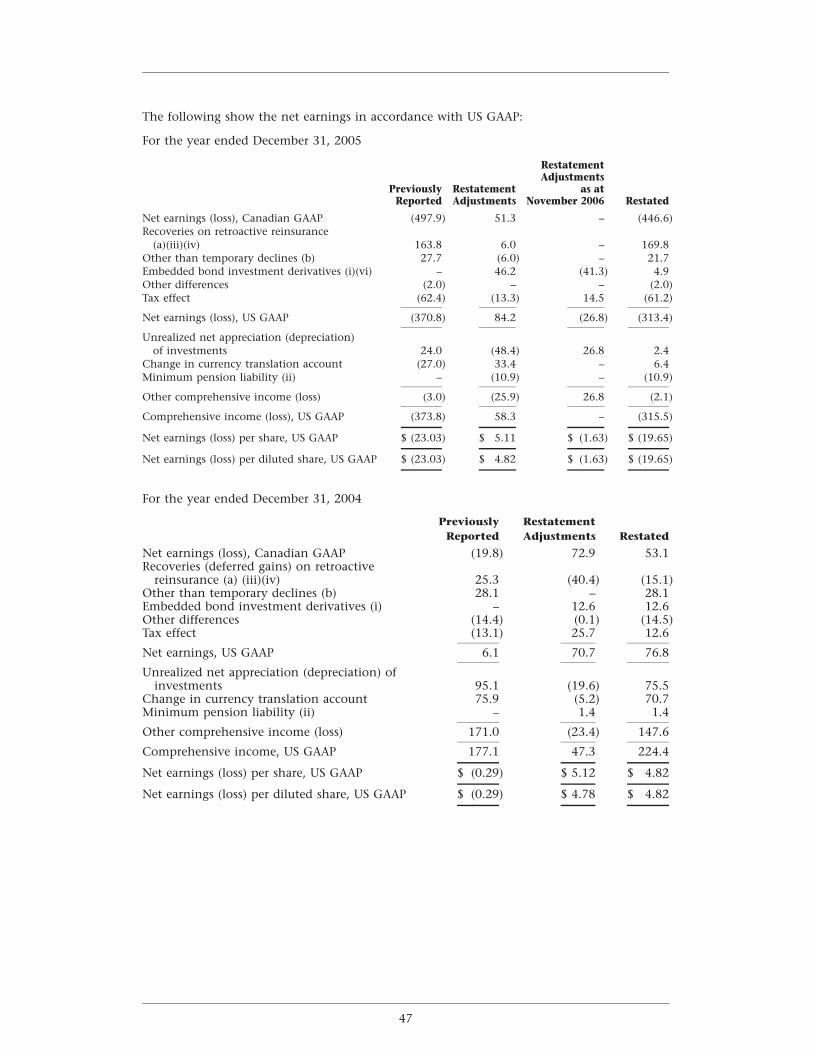
The following show the net earnings in accordance with US GAAP:
For the year ended December 31, 2005
RestatementAdjustments
Previously Restatement as atReported Adjustments November 2006 Restated
Net earnings (loss), Canadian GAAP (497.9) 51.3 – (446.6)Recoveries on retroactive reinsurance
(a)(iii)(iv) 163.8 6.0 – 169.8Other than temporary declines (b) 27.7 (6.0) – 21.7Embedded bond investment derivatives (i)(vi) – 46.2 (41.3) 4.9Other differences (2.0) – – (2.0)Tax effect (62.4) (13.3) 14.5 (61.2)
Net earnings (loss), US GAAP (370.8) 84.2 (26.8) (313.4)
Unrealized net appreciation (depreciation)of investments 24.0 (48.4) 26.8 2.4
Change in currency translation account (27.0) 33.4 – 6.4Minimum pension liability (ii) – (10.9) – (10.9)
Other comprehensive income (loss) (3.0) (25.9) 26.8 (2.1)
Comprehensive income (loss), US GAAP (373.8) 58.3 – (315.5)
Net earnings (loss) per share, US GAAP $ (23.03) $ 5.11 $ (1.63) $ (19.65)
Net earnings (loss) per diluted share, US GAAP $ (23.03) $ 4.82 $ (1.63) $ (19.65)
For the year ended December 31, 2004
Previously RestatementReported Adjustments Restated
Net earnings (loss), Canadian GAAP (19.8) 72.9 53.1Recoveries (deferred gains) on retroactive
reinsurance (a) (iii)(iv) 25.3 (40.4) (15.1)Other than temporary declines (b) 28.1 – 28.1Embedded bond investment derivatives (i) – 12.6 12.6Other differences (14.4) (0.1) (14.5)Tax effect (13.1) 25.7 12.6
Net earnings, US GAAP 6.1 70.7 76.8
Unrealized net appreciation (depreciation) ofinvestments 95.1 (19.6) 75.5
Change in currency translation account 75.9 (5.2) 70.7Minimum pension liability (ii) – 1.4 1.4
Other comprehensive income (loss) 171.0 (23.4) 147.6
Comprehensive income, US GAAP 177.1 47.3 224.4
Net earnings (loss) per share, US GAAP $ (0.29) $ 5.12 $ 4.82
Net earnings (loss) per diluted share, US GAAP $ (0.29) $ 4.78 $ 4.82
47
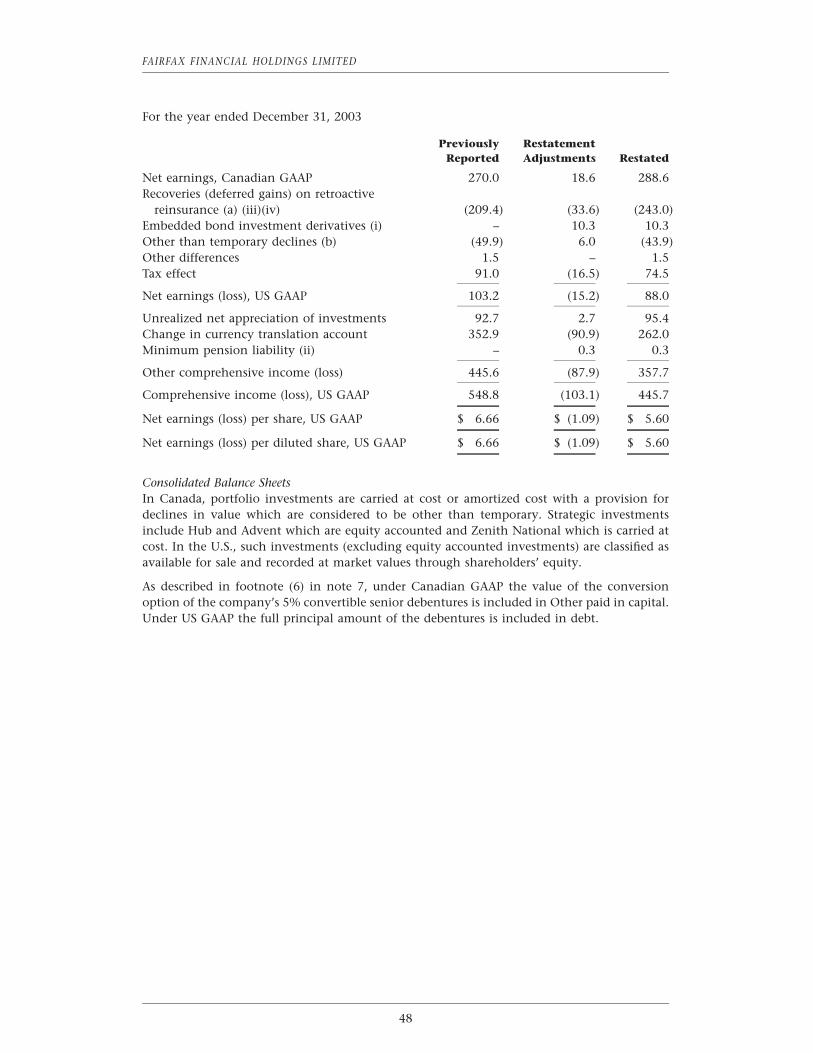
FAIRFAX FINANCIAL HOLDINGS LIMITED
For the year ended December 31, 2003
Previously RestatementReported Adjustments Restated
Net earnings, Canadian GAAP 270.0 18.6 288.6Recoveries (deferred gains) on retroactive
reinsurance (a) (iii)(iv) (209.4) (33.6) (243.0)Embedded bond investment derivatives (i) – 10.3 10.3Other than temporary declines (b) (49.9) 6.0 (43.9)Other differences 1.5 – 1.5Tax effect 91.0 (16.5) 74.5
Net earnings (loss), US GAAP 103.2 (15.2) 88.0
Unrealized net appreciation of investments 92.7 2.7 95.4Change in currency translation account 352.9 (90.9) 262.0Minimum pension liability (ii) – 0.3 0.3
Other comprehensive income (loss) 445.6 (87.9) 357.7
Comprehensive income (loss), US GAAP 548.8 (103.1) 445.7
Net earnings (loss) per share, US GAAP $ 6.66 $ (1.09) $ 5.60
Net earnings (loss) per diluted share, US GAAP $ 6.66 $ (1.09) $ 5.60
Consolidated Balance SheetsIn Canada, portfolio investments are carried at cost or amortized cost with a provision fordeclines in value which are considered to be other than temporary. Strategic investmentsinclude Hub and Advent which are equity accounted and Zenith National which is carried atcost. In the U.S., such investments (excluding equity accounted investments) are classified asavailable for sale and recorded at market values through shareholders’ equity.
As described in footnote (6) in note 7, under Canadian GAAP the value of the conversionoption of the company’s 5% convertible senior debentures is included in Other paid in capital.Under US GAAP the full principal amount of the debentures is included in debt.
48
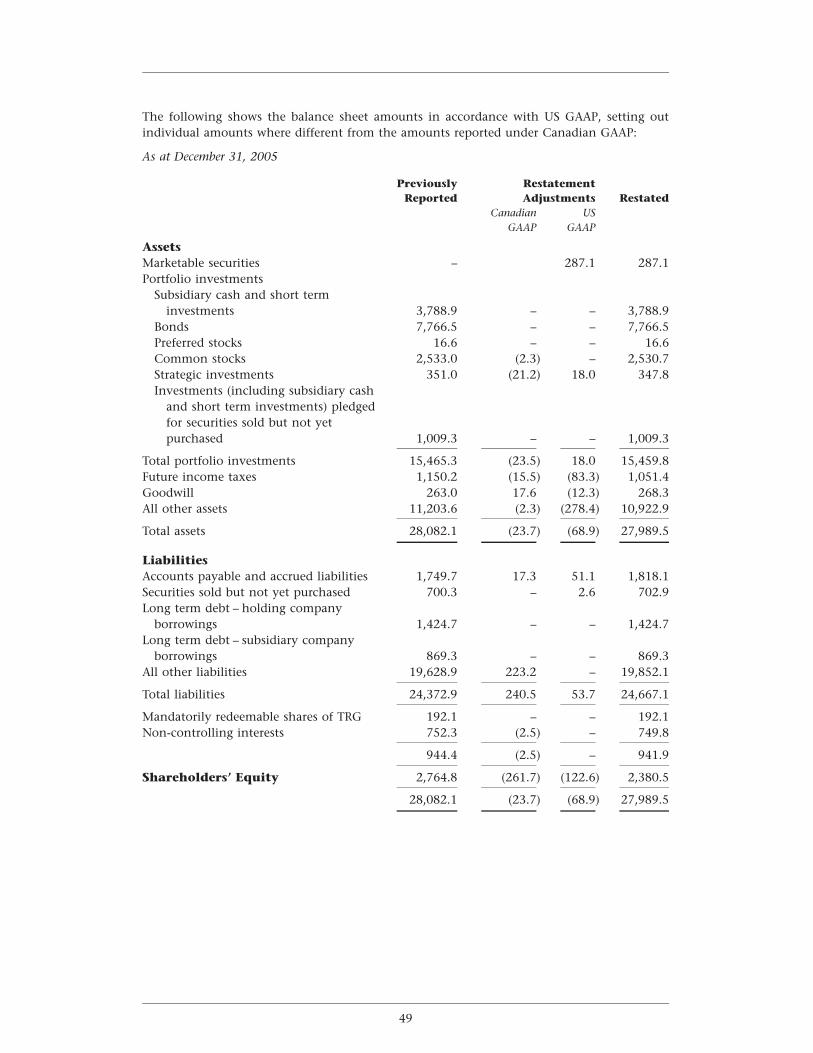
The following shows the balance sheet amounts in accordance with US GAAP, setting outindividual amounts where different from the amounts reported under Canadian GAAP:
As at December 31, 2005
Previously RestatementReported Adjustments Restated
Canadian USGAAP GAAP
AssetsMarketable securities – 287.1 287.1Portfolio investments
Subsidiary cash and short terminvestments 3,788.9 – – 3,788.9
Bonds 7,766.5 – – 7,766.5Preferred stocks 16.6 – – 16.6Common stocks 2,533.0 (2.3) – 2,530.7Strategic investments 351.0 (21.2) 18.0 347.8Investments (including subsidiary cash
and short term investments) pledgedfor securities sold but not yetpurchased 1,009.3 – – 1,009.3
Total portfolio investments 15,465.3 (23.5) 18.0 15,459.8Future income taxes 1,150.2 (15.5) (83.3) 1,051.4Goodwill 263.0 17.6 (12.3) 268.3All other assets 11,203.6 (2.3) (278.4) 10,922.9
Total assets 28,082.1 (23.7) (68.9) 27,989.5
LiabilitiesAccounts payable and accrued liabilities 1,749.7 17.3 51.1 1,818.1Securities sold but not yet purchased 700.3 – 2.6 702.9Long term debt – holding company
borrowings 1,424.7 – – 1,424.7Long term debt – subsidiary company
borrowings 869.3 – – 869.3All other liabilities 19,628.9 223.2 – 19,852.1
Total liabilities 24,372.9 240.5 53.7 24,667.1
Mandatorily redeemable shares of TRG 192.1 – – 192.1Non-controlling interests 752.3 (2.5) – 749.8
944.4 (2.5) – 941.9
Shareholders’ Equity 2,764.8 (261.7) (122.6) 2,380.5
28,082.1 (23.7) (68.9) 27,989.5
49
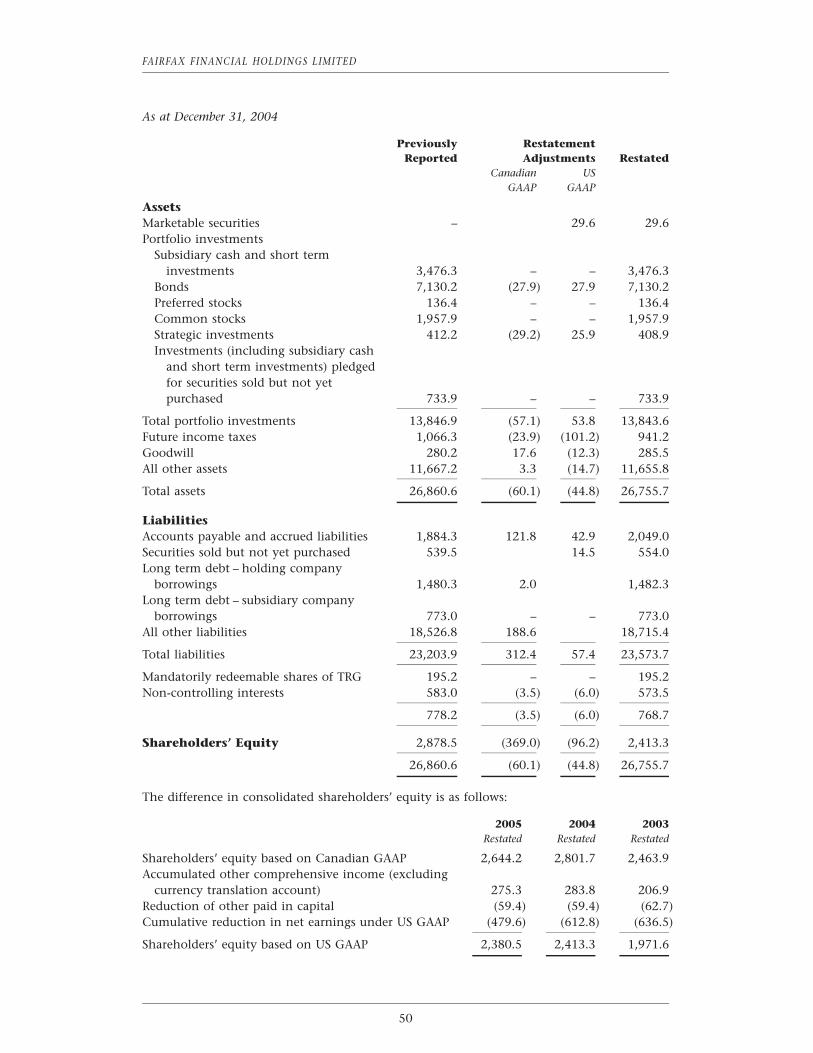
FAIRFAX FINANCIAL HOLDINGS LIMITED
As at December 31, 2004
Previously RestatementReported Adjustments Restated
Canadian USGAAP GAAP
AssetsMarketable securities – 29.6 29.6Portfolio investments
Subsidiary cash and short terminvestments 3,476.3 – – 3,476.3
Bonds 7,130.2 (27.9) 27.9 7,130.2Preferred stocks 136.4 – – 136.4Common stocks 1,957.9 – – 1,957.9Strategic investments 412.2 (29.2) 25.9 408.9Investments (including subsidiary cash
and short term investments) pledgedfor securities sold but not yetpurchased 733.9 – – 733.9
Total portfolio investments 13,846.9 (57.1) 53.8 13,843.6Future income taxes 1,066.3 (23.9) (101.2) 941.2Goodwill 280.2 17.6 (12.3) 285.5All other assets 11,667.2 3.3 (14.7) 11,655.8
Total assets 26,860.6 (60.1) (44.8) 26,755.7
LiabilitiesAccounts payable and accrued liabilities 1,884.3 121.8 42.9 2,049.0Securities sold but not yet purchased 539.5 14.5 554.0Long term debt – holding company
borrowings 1,480.3 2.0 1,482.3Long term debt – subsidiary company
borrowings 773.0 – – 773.0All other liabilities 18,526.8 188.6 18,715.4
Total liabilities 23,203.9 312.4 57.4 23,573.7
Mandatorily redeemable shares of TRG 195.2 – – 195.2Non-controlling interests 583.0 (3.5) (6.0) 573.5
778.2 (3.5) (6.0) 768.7
Shareholders’ Equity 2,878.5 (369.0) (96.2) 2,413.3
26,860.6 (60.1) (44.8) 26,755.7
The difference in consolidated shareholders’ equity is as follows:
2005 2004 2003Restated Restated Restated
Shareholders’ equity based on Canadian GAAP 2,644.2 2,801.7 2,463.9Accumulated other comprehensive income (excluding
currency translation account) 275.3 283.8 206.9Reduction of other paid in capital (59.4) (59.4) (62.7)Cumulative reduction in net earnings under US GAAP (479.6) (612.8) (636.5)
Shareholders’ equity based on US GAAP 2,380.5 2,413.3 1,971.6
50
Statement of Financial Accounting Standards No. 130, ‘‘Reporting Comprehensive Income’’,requires the company to disclose items of other comprehensive income in a financialstatement and to disclose accumulated balances of other comprehensive income in the equitysection of financial statements. A new Canadian GAAP standard will require this presentationto be adopted in 2007 (see Future accounting changes in note 3). Other comprehensive incomeincludes (besides the currency translation account, which is disclosed under Canadian GAAP)unrealized gains and losses on investments and other items, as follows:
2005 2004 2003Restated Restated Restated
Unrealized gain on investments available for sale 447.0 436.5 327.0Minimum pension liability (17.6) (2.0) (4.2)Related deferred income taxes (154.1) (150.7) (115.9)
275.3 283.8 206.9
The November 2006 restatement had no net effect on shareholders’ equity but resulted in acorrection within shareholders’ equity, increasing accumulated other comprehensive income(excluding currency translation account) and decreasing cumulative reduction in net earningsunder US GAAP as at December 31, 2005 by $26.8, respectively. The cumulative reduction innet earnings under US GAAP of $479.6 at December 31, 2005 relates primarily to the deferredgain on retroactive reinsurance ($533.9 after tax) which is amortized into income as theunderlying claims are paid.
Disclosure of Interest and Income Taxes PaidThe aggregate amount of interest paid for the years ended December 31, 2005, 2004 and 2003was $198.4, $175.1 and $140.9, respectively. The aggregate amount of income taxes paid forthe years ended December 31, 2005, 2004 and 2003 was $102.4, $132.6 and $42.9, respectively.
Statement of Cash FlowsThere are no significant differences on the statement of cash flows under US GAAP ascompared to Canadian GAAP.
51
FAIRFAX FINANCIAL HOLDINGS LIMITED
Management’s Discussion and Analysis of Financial Condition andResults of Operations (as of March 31, 2006 except as otherwise indicated)(Figures and amounts are in US$ and $ millions except per share amounts and as otherwiseindicated. Figures may not add due to rounding.)
Notes: (1) Readers of the Management’s Discussion and Analysis of Financial Condition andResults of Operations should review the entire Annual Report for additionalcommentary and information. Additional information relating to the Company,including its annual information form, can be found on SEDAR at www.sedar.com,which can also be accessed from the company’s website www.fairfax.ca.
(2) Management analyzes and assesses the underlying insurance, reinsurance andrunoff operations and the financial position of the consolidated group in variousways. Certain of these measures provided in this Annual Report, which have beenused historically and disclosed regularly in Fairfax’s Annual Reports and interimfinancial reporting, are non-GAAP measures; these measures include tablesshowing the company’s sources of net earnings with Cunningham Lindsey equityaccounted. Where non-GAAP measures are provided, descriptions are clearlyprovided in the commentary as to the nature of the adjustments made.
(3) The combined ratio – which may be calculated differently by different companiesand is calculated by the company as the sum of the loss ratio (claims losses and lossadjustment expenses expressed as a percentage of net premiums earned) and theexpense ratio (commissions, premium acquisition costs and other underwritingexpenses as a percentage of net premiums earned) – is the traditional measure ofunderwriting results of property and casualty companies, but is regarded as a non-GAAP measure.
(4) References to other documents or certain websites do not constitute incorporationfor reference in this MD&A of all or any portion of those documents or websites.
(5) References in this MD&A to Fairfax’s insurance and reinsurance operations do notinclude Fairfax’s runoff and other operations.
Restatement of Consolidated Financial Statements
As disclosed in note 2 to the consolidated financial statements, the company has restated itspreviously reported consolidated financial statements as at and for the years endedDecember 31, 2001 through 2005 and all related disclosures. The restatement of the company’sconsolidated financial statements followed an internal review of the company’s consolidatedfinancial statements and accounting records that was undertaken in contemplation of thecommutation of the Swiss Re Cover and the 2006 third quarter review and that identified anoverstatement of the consolidated net assets of the company as at December 31, 2005 and 2004and errors in accounting in the periodic consolidated earnings statements. The effects of therestatement are reflected in the company’s consolidated financial statements andaccompanying notes included herein. Accordingly, where appropriate the effects of therestatement, including the correction of all errors are reflected in management’s discussion andanalysis.
In connection with the restatement, management identified material weaknesses in its internalcontrol over financial reporting which management concluded existed at December 31, 2005.See Management’s Report on Internal Control Over Financial Reporting presented onpage 118.
52
Sources of Revenue
Revenue reflected in the consolidated financial statements for the past three years is shown inthe table below (claims adjusting fees are from Cunningham Lindsey).
2005 2004 2003
Net premiums earnedInsurance – Canada (Northbridge) 959.2 939.0 703.2Insurance – U.S. 1,053.1 1,027.6 991.7Insurance – Asia (Fairfax Asia) 68.2 57.8 37.2Reinsurance (OdysseyRe) 2,275.9 2,323.2 1,971.9Runoff and other 336.1 456.7 534.6
4,692.5 4,804.3 4,238.6Interest and dividends 466.1 375.7 331.9Realized gains 385.7 313.6 831.8Claims fees 356.2 336.1 328.9
5,900.5 5,829.7 5,731.2
Revenue in 2005 increased to $5,900.5 from $5,829.7 in 2004, principally as a result ofincreased investment income and net realized gains, offset by lower earned premiums. During2005, net premiums written by Northbridge, Crum & Forster and OdysseyRe, expressed in localcurrency, decreased 5.0%, 0.3% and 1.9%, respectively, from 2004. Consolidated net premiumswritten in 2005 decreased by 1.9% to $4,694.6 from $4,785.7 in 2004. Net premiums earnedfrom the insurance and reinsurance operations increased by 0.2% to $4,356.4 in 2005 from$4,347.6 in 2004.
Claims fees for 2005 increased by 6.0% over 2004, principally reflecting growth ininternational and U.S. revenues offset by declining revenues in Europe (including foreignexchange movements against the U.S. dollar).
As shown in note 19 to the consolidated financial statements, on a geographic basis, UnitedStates, Canadian, and Europe and Far East operations accounted for 53.3%, 24.8% and 21.9%,respectively, of net premiums earned in 2005 compared with 57.6%, 21.6% and 20.8%,respectively, in 2004.
The significant changes in net premiums earned for 2005 compared with 2004 in the variousgeographic areas were caused by the following factors:
(a) The growth in Canadian net premiums earned from $1,036.8 in 2004 to $1,163.3 in2005 was due primarily to the strengthening of the Canadian dollar against theU.S. dollar in respect of the Northbridge premiums and to increased Canadian-basedbusiness in Group Re.
(b) The decrease in U.S. net premiums earned by Runoff and Group Re from $277.4 in2004 to $68.7 in 2005 was due primarily to a reduction of earned premiums inU.S. runoff and less third party reinsurance business in Group Re.
(c) The increase in Europe and Far East net premiums earned by Runoff and Group Refrom $24.4 in 2004 to $46.0 in 2005 was due primarily to the acquisition ofCompagnie de Reassurance d’Ile de France by the Runoff group.
Net Earnings
Combined ratios and sources of net earnings (with Cunningham Lindsey equity accounted) forthe past three years are as set out beginning on page 54. Commentary on combined ratios and
53
FAIRFAX FINANCIAL HOLDINGS LIMITED
on operating income on a segment by segment basis is provided under Underwriting andOperating Income beginning on page 61.
The following table shows the combined ratios and underwriting and operating results for eachof the company’s insurance and reinsurance operations and, as applicable, for its runoff andother operations, as well as the earnings contributions from its claims adjusting, appraisal andloss management services. In that table, interest and dividends and realized gains on theconsolidated statements of earnings are broken out so that those items are shown separately asthey relate to the insurance and reinsurance operating results, and are comprised in Runoff andother as they relate to that segment.
2005 2004 2003
Combined ratios (1)(2)
Insurance – Canada (Northbridge) 92.9% 87.7% 92.6%– U.S. 100.9% 105.4% 102.7%– Asia (Fairfax Asia) 93.0% 91.9% 96.0%
Reinsurance (OdysseyRe) 117.5% 97.0% 96.5%
Consolidated 107.7% 96.9% 97.4%
Sources of net earningsUnderwriting
Insurance – Canada (Northbridge) 68.2 115.5 52.3– U.S. (9.1) (55.0) (27.1)– Asia (Fairfax Asia) 4.8 4.7 1.5
Reinsurance (OdysseyRe) (397.8) 69.6 68.4
Underwriting income (loss) (333.9) 134.8 95.1Interest and dividends 345.4 301.4 214.1
Operating income 11.5 436.2 309.2Realized gains 324.1 171.1 520.5Runoff and other (618.4) (70.0) (102.0)Claims adjusting (Fairfax portion) 5.4 (15.4) (12.3)Interest expense (184.6) (163.4) (146.4)Corporate overhead and other (8.4) (74.1) (33.0)
Pre-tax income (loss) (470.4) 284.4 536.0Taxes 68.9 (146.5) (180.1)Non-controlling interests (45.1) (84.8) (67.3)
Net earnings (loss) (446.6) 53.1 288.6
(1) The 2005 combined ratios include 7.9 combined ratio points for Canadian insurance, 8.9combined ratio points for U.S. insurance, 19.2 combined ratio points for reinsurance and 14.0consolidated combined ratio points, arising from the 2005 hurricane losses.
(2) The 2004 combined ratios include 2.9 combined ratio points for Canadian insurance, 9.4combined ratio points for U.S. insurance, 4.2 combined ratio points for reinsurance and 5.1consolidated combined ratio points, arising from the 2004 third quarter hurricane losses.
The company’s insurance and reinsurance operations incurred an underwriting loss of $333.9,reflecting the impact of $609.9 of net losses from Hurricanes Katrina, Rita and Wilma (‘‘the2005 hurricanes’’). Prior to giving effect to these losses, those operations would have generatedan underwriting profit of $276.0. The consolidated combined ratio of the company’s insuranceand reinsurance operations was 107.7%. Prior to giving effect to the 2005 hurricane losses,those operations would have had a consolidated combined ratio of 93.7%, reflecting continuedstrong underwriting performance prior to the impact of the hurricane losses. By comparison,the company’s insurance and reinsurance operations had a net underwriting profit of $134.8 in
54
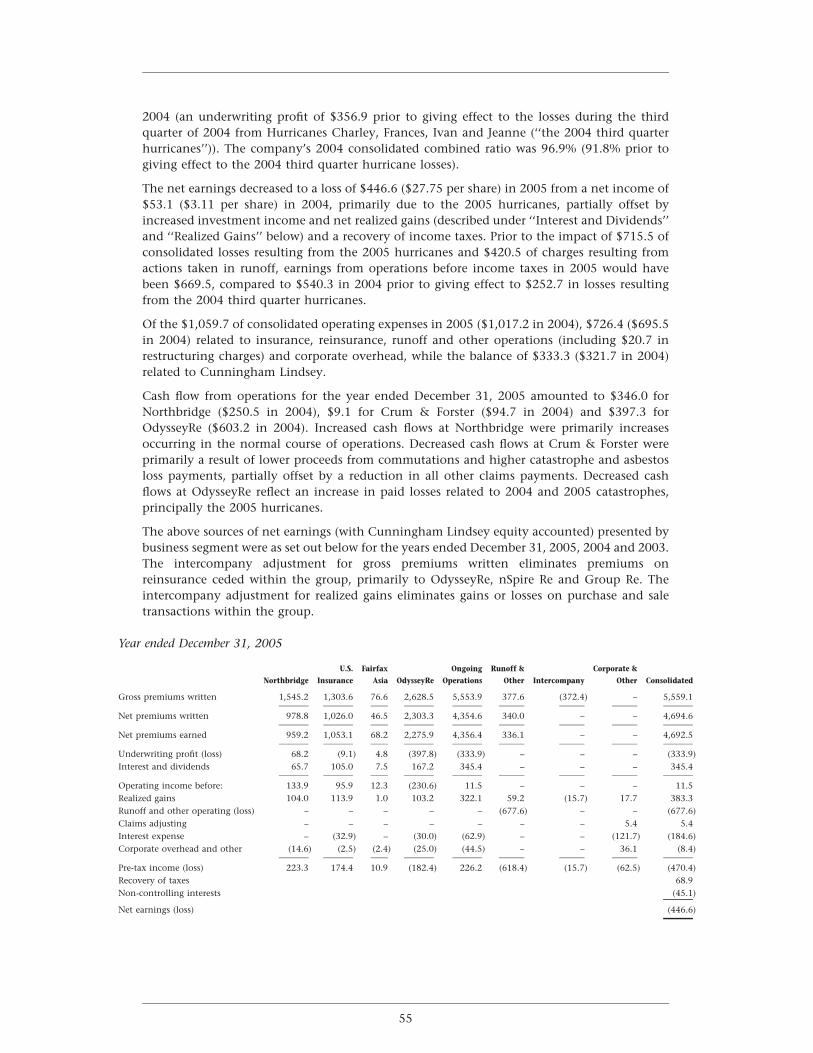
2004 (an underwriting profit of $356.9 prior to giving effect to the losses during the thirdquarter of 2004 from Hurricanes Charley, Frances, Ivan and Jeanne (‘‘the 2004 third quarterhurricanes’’)). The company’s 2004 consolidated combined ratio was 96.9% (91.8% prior togiving effect to the 2004 third quarter hurricane losses).
The net earnings decreased to a loss of $446.6 ($27.75 per share) in 2005 from a net income of$53.1 ($3.11 per share) in 2004, primarily due to the 2005 hurricanes, partially offset byincreased investment income and net realized gains (described under ‘‘Interest and Dividends’’and ‘‘Realized Gains’’ below) and a recovery of income taxes. Prior to the impact of $715.5 ofconsolidated losses resulting from the 2005 hurricanes and $420.5 of charges resulting fromactions taken in runoff, earnings from operations before income taxes in 2005 would havebeen $669.5, compared to $540.3 in 2004 prior to giving effect to $252.7 in losses resultingfrom the 2004 third quarter hurricanes.
Of the $1,059.7 of consolidated operating expenses in 2005 ($1,017.2 in 2004), $726.4 ($695.5in 2004) related to insurance, reinsurance, runoff and other operations (including $20.7 inrestructuring charges) and corporate overhead, while the balance of $333.3 ($321.7 in 2004)related to Cunningham Lindsey.
Cash flow from operations for the year ended December 31, 2005 amounted to $346.0 forNorthbridge ($250.5 in 2004), $9.1 for Crum & Forster ($94.7 in 2004) and $397.3 forOdysseyRe ($603.2 in 2004). Increased cash flows at Northbridge were primarily increasesoccurring in the normal course of operations. Decreased cash flows at Crum & Forster wereprimarily a result of lower proceeds from commutations and higher catastrophe and asbestosloss payments, partially offset by a reduction in all other claims payments. Decreased cashflows at OdysseyRe reflect an increase in paid losses related to 2004 and 2005 catastrophes,principally the 2005 hurricanes.
The above sources of net earnings (with Cunningham Lindsey equity accounted) presented bybusiness segment were as set out below for the years ended December 31, 2005, 2004 and 2003.The intercompany adjustment for gross premiums written eliminates premiums onreinsurance ceded within the group, primarily to OdysseyRe, nSpire Re and Group Re. Theintercompany adjustment for realized gains eliminates gains or losses on purchase and saletransactions within the group.
Year ended December 31, 2005
U.S. Fairfax Ongoing Runoff & Corporate &Northbridge Insurance Asia OdysseyRe Operations Other Intercompany Other Consolidated
Gross premiums written 1,545.2 1,303.6 76.6 2,628.5 5,553.9 377.6 (372.4) – 5,559.1
Net premiums written 978.8 1,026.0 46.5 2,303.3 4,354.6 340.0 – – 4,694.6
Net premiums earned 959.2 1,053.1 68.2 2,275.9 4,356.4 336.1 – – 4,692.5
Underwriting profit (loss) 68.2 (9.1) 4.8 (397.8) (333.9) – – – (333.9)Interest and dividends 65.7 105.0 7.5 167.2 345.4 – – – 345.4
Operating income before: 133.9 95.9 12.3 (230.6) 11.5 – – – 11.5Realized gains 104.0 113.9 1.0 103.2 322.1 59.2 (15.7) 17.7 383.3Runoff and other operating (loss) – – – – – (677.6) – – (677.6)Claims adjusting – – – – – – – 5.4 5.4Interest expense – (32.9) – (30.0) (62.9) – – (121.7) (184.6)Corporate overhead and other (14.6) (2.5) (2.4) (25.0) (44.5) – – 36.1 (8.4)
Pre-tax income (loss) 223.3 174.4 10.9 (182.4) 226.2 (618.4) (15.7) (62.5) (470.4)Recovery of taxes 68.9Non-controlling interests (45.1)
Net earnings (loss) (446.6)
55
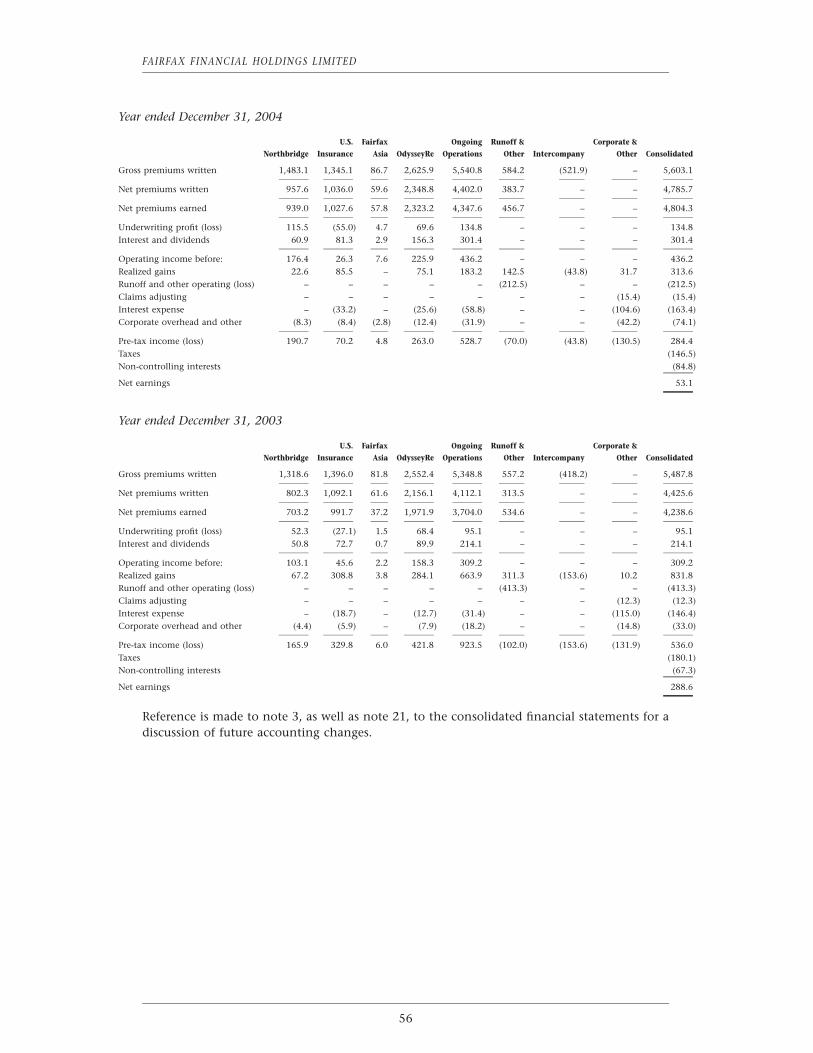
FAIRFAX FINANCIAL HOLDINGS LIMITED
Year ended December 31, 2004
U.S. Fairfax Ongoing Runoff & Corporate &Northbridge Insurance Asia OdysseyRe Operations Other Intercompany Other Consolidated
Gross premiums written 1,483.1 1,345.1 86.7 2,625.9 5,540.8 584.2 (521.9) – 5,603.1
Net premiums written 957.6 1,036.0 59.6 2,348.8 4,402.0 383.7 – – 4,785.7
Net premiums earned 939.0 1,027.6 57.8 2,323.2 4,347.6 456.7 – – 4,804.3
Underwriting profit (loss) 115.5 (55.0) 4.7 69.6 134.8 – – – 134.8Interest and dividends 60.9 81.3 2.9 156.3 301.4 – – – 301.4
Operating income before: 176.4 26.3 7.6 225.9 436.2 – – – 436.2Realized gains 22.6 85.5 – 75.1 183.2 142.5 (43.8) 31.7 313.6Runoff and other operating (loss) – – – – – (212.5) – – (212.5)Claims adjusting – – – – – – – (15.4) (15.4)Interest expense – (33.2) – (25.6) (58.8) – – (104.6) (163.4)Corporate overhead and other (8.3) (8.4) (2.8) (12.4) (31.9) – – (42.2) (74.1)
Pre-tax income (loss) 190.7 70.2 4.8 263.0 528.7 (70.0) (43.8) (130.5) 284.4Taxes (146.5)Non-controlling interests (84.8)
Net earnings 53.1
Year ended December 31, 2003
U.S. Fairfax Ongoing Runoff & Corporate &Northbridge Insurance Asia OdysseyRe Operations Other Intercompany Other Consolidated
Gross premiums written 1,318.6 1,396.0 81.8 2,552.4 5,348.8 557.2 (418.2) – 5,487.8
Net premiums written 802.3 1,092.1 61.6 2,156.1 4,112.1 313.5 – – 4,425.6
Net premiums earned 703.2 991.7 37.2 1,971.9 3,704.0 534.6 – – 4,238.6
Underwriting profit (loss) 52.3 (27.1) 1.5 68.4 95.1 – – – 95.1Interest and dividends 50.8 72.7 0.7 89.9 214.1 – – – 214.1
Operating income before: 103.1 45.6 2.2 158.3 309.2 – – – 309.2Realized gains 67.2 308.8 3.8 284.1 663.9 311.3 (153.6) 10.2 831.8Runoff and other operating (loss) – – – – – (413.3) – – (413.3)Claims adjusting – – – – – – – (12.3) (12.3)Interest expense – (18.7) – (12.7) (31.4) – – (115.0) (146.4)Corporate overhead and other (4.4) (5.9) – (7.9) (18.2) – – (14.8) (33.0)
Pre-tax income (loss) 165.9 329.8 6.0 421.8 923.5 (102.0) (153.6) (131.9) 536.0Taxes (180.1)Non-controlling interests (67.3)
Net earnings 288.6
Reference is made to note 3, as well as note 21, to the consolidated financial statements for adiscussion of future accounting changes.
56
Segmented Balance Sheet
The company’s segmented balance sheets as at December 31, 2005 and 2004 are presented todisclose the assets and liabilities of, and the capital invested by the company in, each of thecompany’s major segments. The segmented balance sheets have been prepared on thefollowing basis:
(a) The balance sheet for each segment is on a legal entity basis for the subsidiarieswithin the segment (except for nSpire Re in Runoff and Other, which excludesbalances related to U.S. acquisition financing), prepared in accordance withCanadian GAAP and Fairfax’s accounting policies and basis of accounting.Accordingly, these segmented balance sheets differ from those published by Crum &Forster and OdysseyRe due to differences between Canadian and US GAAP.
(b) Investments in affiliates, which are carried at cost, are disclosed in the businesssegments on pages 60 to 79. Affiliated insurance and reinsurance balances, includingpremiums receivable, reinsurance recoverable, deferred premium acquisition costs,funds withheld payable to reinsurers, provision for claims and unearned premiumsare not shown separately but are eliminated in Corporate and Other.
(c) Corporate and Other includes Fairfax entity and its subsidiary intermediate holdingcompanies as well as the consolidating and eliminating entries required underCanadian GAAP to prepare consolidated financial statements. The most significant ofthose entries derive from the elimination of intercompany reinsurance (primarilyconsisting of normal course reinsurance provided by Group Re and normal coursereinsurance between OdysseyRe and the primary insurers or created as a result of pre-acquisition reinsurance relationships), which affects Recoverable from reinsurers,Provision for claims and Unearned premiums. The $1,602.3 corporate and other longterm debt as at December 31, 2005 consists primarily of Fairfax debt of $1,365.3 (seenote 7 to the consolidated financial statements), TIG trust preferred securities of$52.4 (see note 8 to the consolidated financial statements) and purchaseconsideration payable of $192.1 (related to the TRG acquisition referred to in note 18to the consolidated financial statements).
57
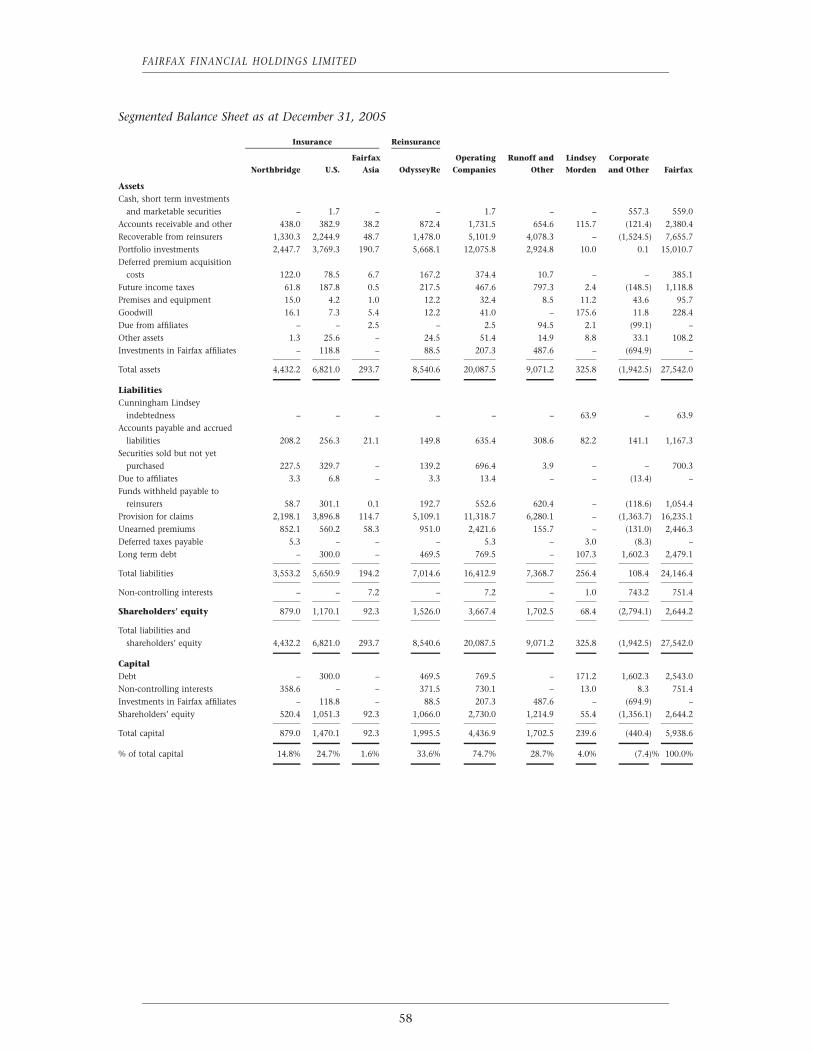
FAIRFAX FINANCIAL HOLDINGS LIMITED
Segmented Balance Sheet as at December 31, 2005
ReinsuranceInsurance
Fairfax Operating Runoff and Lindsey CorporateNorthbridge U.S. Asia OdysseyRe Companies Other Morden and Other Fairfax
AssetsCash, short term investments
and marketable securities – 1.7 – – 1.7 – – 557.3 559.0Accounts receivable and other 438.0 382.9 38.2 872.4 1,731.5 654.6 115.7 (121.4) 2,380.4Recoverable from reinsurers 1,330.3 2,244.9 48.7 1,478.0 5,101.9 4,078.3 – (1,524.5) 7,655.7Portfolio investments 2,447.7 3,769.3 190.7 5,668.1 12,075.8 2,924.8 10.0 0.1 15,010.7Deferred premium acquisition
costs 122.0 78.5 6.7 167.2 374.4 10.7 – – 385.1Future income taxes 61.8 187.8 0.5 217.5 467.6 797.3 2.4 (148.5) 1,118.8Premises and equipment 15.0 4.2 1.0 12.2 32.4 8.5 11.2 43.6 95.7Goodwill 16.1 7.3 5.4 12.2 41.0 – 175.6 11.8 228.4Due from affiliates – – 2.5 – 2.5 94.5 2.1 (99.1) –Other assets 1.3 25.6 – 24.5 51.4 14.9 8.8 33.1 108.2Investments in Fairfax affiliates – 118.8 – 88.5 207.3 487.6 – (694.9) –
Total assets 4,432.2 6,821.0 293.7 8,540.6 20,087.5 9,071.2 325.8 (1,942.5) 27,542.0
LiabilitiesCunningham Lindsey
indebtedness – – – – – – 63.9 – 63.9Accounts payable and accrued
liabilities 208.2 256.3 21.1 149.8 635.4 308.6 82.2 141.1 1,167.3Securities sold but not yet
purchased 227.5 329.7 – 139.2 696.4 3.9 – – 700.3Due to affiliates 3.3 6.8 – 3.3 13.4 – – (13.4) –Funds withheld payable to
reinsurers 58.7 301.1 0.1 192.7 552.6 620.4 – (118.6) 1,054.4Provision for claims 2,198.1 3,896.8 114.7 5,109.1 11,318.7 6,280.1 – (1,363.7) 16,235.1Unearned premiums 852.1 560.2 58.3 951.0 2,421.6 155.7 – (131.0) 2,446.3Deferred taxes payable 5.3 – – – 5.3 – 3.0 (8.3) –Long term debt – 300.0 – 469.5 769.5 – 107.3 1,602.3 2,479.1
Total liabilities 3,553.2 5,650.9 194.2 7,014.6 16,412.9 7,368.7 256.4 108.4 24,146.4
Non-controlling interests – – 7.2 – 7.2 – 1.0 743.2 751.4
Shareholders’ equity 879.0 1,170.1 92.3 1,526.0 3,667.4 1,702.5 68.4 (2,794.1) 2,644.2
Total liabilities andshareholders’ equity 4,432.2 6,821.0 293.7 8,540.6 20,087.5 9,071.2 325.8 (1,942.5) 27,542.0
CapitalDebt – 300.0 – 469.5 769.5 – 171.2 1,602.3 2,543.0Non-controlling interests 358.6 – – 371.5 730.1 – 13.0 8.3 751.4Investments in Fairfax affiliates – 118.8 – 88.5 207.3 487.6 – (694.9) –Shareholders’ equity 520.4 1,051.3 92.3 1,066.0 2,730.0 1,214.9 55.4 (1,356.1) 2,644.2
Total capital 879.0 1,470.1 92.3 1,995.5 4,436.9 1,702.5 239.6 (440.4) 5,938.6
% of total capital 14.8% 24.7% 1.6% 33.6% 74.7% 28.7% 4.0% (7.4)% 100.0%
58
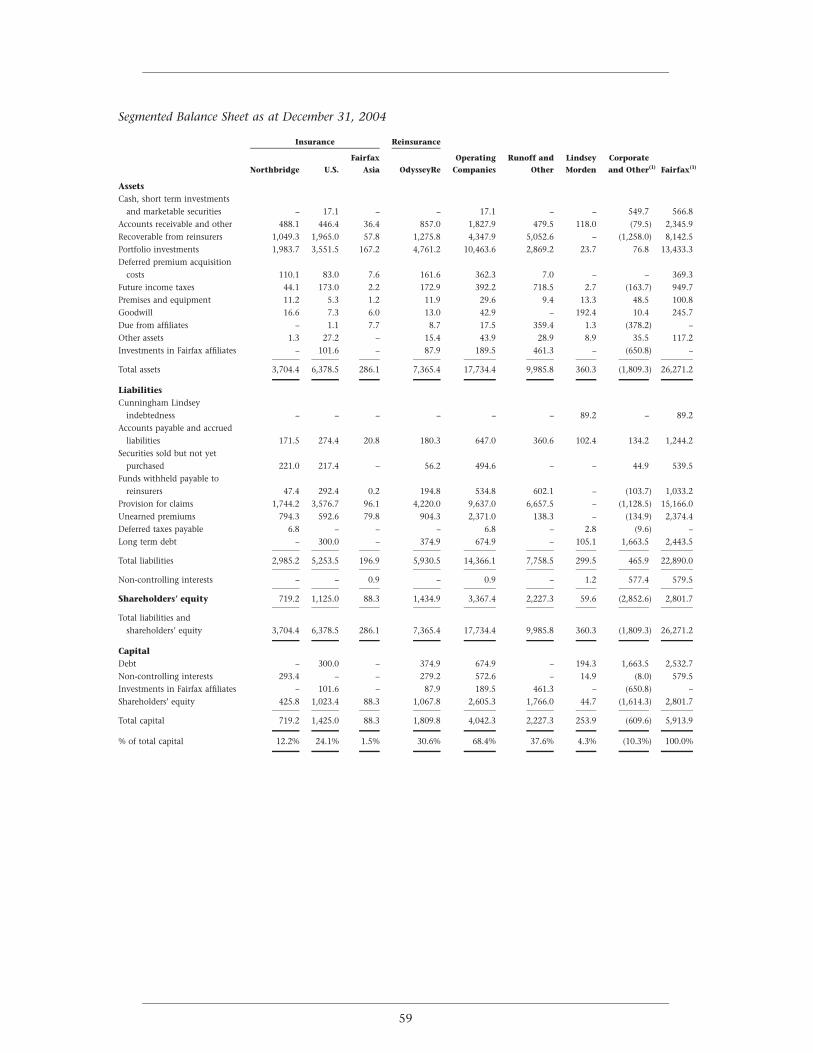
Segmented Balance Sheet as at December 31, 2004
Insurance Reinsurance
Fairfax Operating Runoff and Lindsey CorporateNorthbridge U.S. Asia OdysseyRe Companies Other Morden and Other(1) Fairfax(1)
AssetsCash, short term investments
and marketable securities – 17.1 – – 17.1 – – 549.7 566.8Accounts receivable and other 488.1 446.4 36.4 857.0 1,827.9 479.5 118.0 (79.5) 2,345.9Recoverable from reinsurers 1,049.3 1,965.0 57.8 1,275.8 4,347.9 5,052.6 – (1,258.0) 8,142.5Portfolio investments 1,983.7 3,551.5 167.2 4,761.2 10,463.6 2,869.2 23.7 76.8 13,433.3Deferred premium acquisition
costs 110.1 83.0 7.6 161.6 362.3 7.0 – – 369.3Future income taxes 44.1 173.0 2.2 172.9 392.2 718.5 2.7 (163.7) 949.7Premises and equipment 11.2 5.3 1.2 11.9 29.6 9.4 13.3 48.5 100.8Goodwill 16.6 7.3 6.0 13.0 42.9 – 192.4 10.4 245.7Due from affiliates – 1.1 7.7 8.7 17.5 359.4 1.3 (378.2) –Other assets 1.3 27.2 – 15.4 43.9 28.9 8.9 35.5 117.2Investments in Fairfax affiliates – 101.6 – 87.9 189.5 461.3 – (650.8) –
Total assets 3,704.4 6,378.5 286.1 7,365.4 17,734.4 9,985.8 360.3 (1,809.3) 26,271.2
LiabilitiesCunningham Lindsey
indebtedness – – – – – – 89.2 – 89.2Accounts payable and accrued
liabilities 171.5 274.4 20.8 180.3 647.0 360.6 102.4 134.2 1,244.2Securities sold but not yet
purchased 221.0 217.4 – 56.2 494.6 – – 44.9 539.5Funds withheld payable to
reinsurers 47.4 292.4 0.2 194.8 534.8 602.1 – (103.7) 1,033.2Provision for claims 1,744.2 3,576.7 96.1 4,220.0 9,637.0 6,657.5 – (1,128.5) 15,166.0Unearned premiums 794.3 592.6 79.8 904.3 2,371.0 138.3 – (134.9) 2,374.4Deferred taxes payable 6.8 – – – 6.8 – 2.8 (9.6) –Long term debt – 300.0 – 374.9 674.9 – 105.1 1,663.5 2,443.5
Total liabilities 2,985.2 5,253.5 196.9 5,930.5 14,366.1 7,758.5 299.5 465.9 22,890.0
Non-controlling interests – – 0.9 – 0.9 – 1.2 577.4 579.5
Shareholders’ equity 719.2 1,125.0 88.3 1,434.9 3,367.4 2,227.3 59.6 (2,852.6) 2,801.7
Total liabilities andshareholders’ equity 3,704.4 6,378.5 286.1 7,365.4 17,734.4 9,985.8 360.3 (1,809.3) 26,271.2
CapitalDebt – 300.0 – 374.9 674.9 – 194.3 1,663.5 2,532.7Non-controlling interests 293.4 – – 279.2 572.6 – 14.9 (8.0) 579.5Investments in Fairfax affiliates – 101.6 – 87.9 189.5 461.3 – (650.8) –Shareholders’ equity 425.8 1,023.4 88.3 1,067.8 2,605.3 1,766.0 44.7 (1,614.3) 2,801.7
Total capital 719.2 1,425.0 88.3 1,809.8 4,042.3 2,227.3 253.9 (609.6) 5,913.9
% of total capital 12.2% 24.1% 1.5% 30.6% 68.4% 37.6% 4.3% (10.3%) 100.0%
59
FAIRFAX FINANCIAL HOLDINGS LIMITED
Reinsurance recoverables decreased to $7,655.7 from $8,142.5 in 2004, notwithstandingan increase in reinsurance recoverables in 2005 due to ceded losses from the 2005 hurricanes.
Future income taxes represent amounts expected to be recovered in future years. AtDecember 31, 2005 future income taxes of $1,118.8 (of which $897.6 related to Fairfax Inc.,Fairfax’s U.S. holding company, and subsidiaries in its U.S. consolidated tax group) consistedof $624.8 of capitalized operating and capital losses, and temporary differences of $494.0which represent primarily expenses recorded in the financial statements but not yet deductedfor income tax purposes. The capitalized operating losses, after certain adjustments andintercompany reallocations, relate primarily to Fairfax Inc. and its U.S. subsidiaries ($405.7),where all of the losses expire after 2018, the Canadian holding company ($42.3) and Europeanrunoff ($127.5), with the remainder relating primarily to Cunningham Lindsey.
To facilitate the utilization of its future U.S. income taxes asset and to optimize the cash flowfrom U.S. tax sharing payments, the company increased its interest in OdysseyRe to in excessof 80% in 2003, to permit OdysseyRe to be included in Fairfax’s U.S. consolidated tax group.
The portion of Fairfax’s future income taxes asset consisting of capitalized operating andcapital losses related to its U.S. consolidated tax group increased by $103.2 in 2005, primarilyas a result of losses from the 2005 hurricanes. Future income taxes for the consolidated groupincreased by $169.1 in 2005 as a result of changes in the ordinary course for temporarydifferences as a result of increased business volumes, and changes in the non-U.S. componentsof this asset, including the impact of foreign exchange.
The company’s valuation allowance on its future income taxes asset as at December 31, 2005was $99.9, of which approximately half related to losses incurred primarily in the U.K. andIreland, and the remainder related to losses incurred at Cunningham Lindsey. Differencesbetween expected and actual future operating results could adversely impact the company’sability to realize the future income taxes asset within a reasonable period of time given theinherent uncertainty in projecting operating company earnings and industry conditions. Thecompany expects to realize the benefit of these capitalized losses from future profitableoperations.
In determining the need for a valuation allowance, management considers primarily currentand expected profitability of the companies. Management reviews the recoverability of thefuture income taxes asset and the valuation allowance on a quarterly basis. The temporarydifferences principally relate to insurance-related balances such as claims, deferred premiumacquisition costs and unearned premiums; such temporary differences are expected tocontinue for the foreseeable future in light of the company’s ongoing operations.
Portfolio investments include investments in 25.9%-owned Hub International Limited($108.4), 10.3%-owned Zenith National Insurance Corp. ($56.2) (subsequently sold for a$137.3 pre-tax gain) and 46.8%-owned Advent Capital Holdings PLC ($62.0), all of which arepublicly listed companies.
Goodwill decreased to $228.4 (of which $175.6 relates to Cunningham Lindsey) atDecember 31, 2005 from $245.7 at December 31, 2004, due principally to the weakening of thepound sterling against the U.S. dollar during 2005.
60
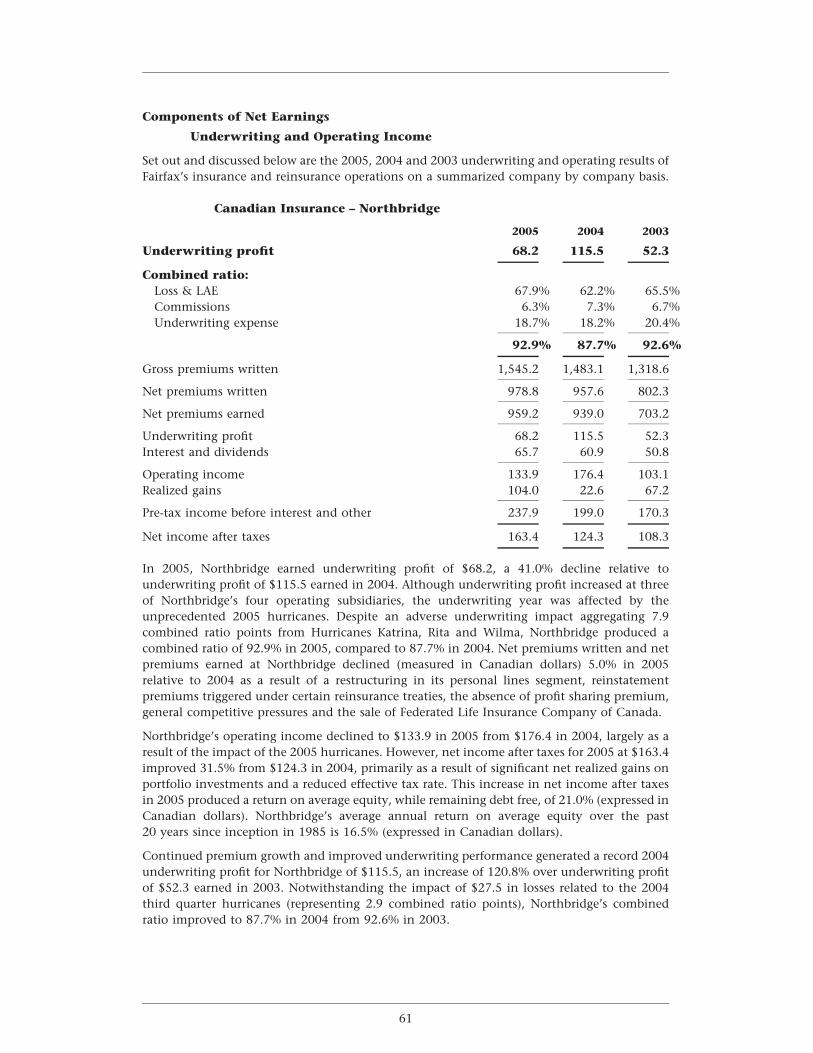
Components of Net Earnings
Underwriting and Operating Income
Set out and discussed below are the 2005, 2004 and 2003 underwriting and operating results ofFairfax’s insurance and reinsurance operations on a summarized company by company basis.
Canadian Insurance – Northbridge
2005 2004 2003
Underwriting profit 68.2 115.5 52.3
Combined ratio:Loss & LAE 67.9% 62.2% 65.5%Commissions 6.3% 7.3% 6.7%Underwriting expense 18.7% 18.2% 20.4%
92.9% 87.7% 92.6%
Gross premiums written 1,545.2 1,483.1 1,318.6
Net premiums written 978.8 957.6 802.3
Net premiums earned 959.2 939.0 703.2
Underwriting profit 68.2 115.5 52.3Interest and dividends 65.7 60.9 50.8
Operating income 133.9 176.4 103.1Realized gains 104.0 22.6 67.2
Pre-tax income before interest and other 237.9 199.0 170.3
Net income after taxes 163.4 124.3 108.3
In 2005, Northbridge earned underwriting profit of $68.2, a 41.0% decline relative tounderwriting profit of $115.5 earned in 2004. Although underwriting profit increased at threeof Northbridge’s four operating subsidiaries, the underwriting year was affected by theunprecedented 2005 hurricanes. Despite an adverse underwriting impact aggregating 7.9combined ratio points from Hurricanes Katrina, Rita and Wilma, Northbridge produced acombined ratio of 92.9% in 2005, compared to 87.7% in 2004. Net premiums written and netpremiums earned at Northbridge declined (measured in Canadian dollars) 5.0% in 2005relative to 2004 as a result of a restructuring in its personal lines segment, reinstatementpremiums triggered under certain reinsurance treaties, the absence of profit sharing premium,general competitive pressures and the sale of Federated Life Insurance Company of Canada.
Northbridge’s operating income declined to $133.9 in 2005 from $176.4 in 2004, largely as aresult of the impact of the 2005 hurricanes. However, net income after taxes for 2005 at $163.4improved 31.5% from $124.3 in 2004, primarily as a result of significant net realized gains onportfolio investments and a reduced effective tax rate. This increase in net income after taxesin 2005 produced a return on average equity, while remaining debt free, of 21.0% (expressed inCanadian dollars). Northbridge’s average annual return on average equity over the past20 years since inception in 1985 is 16.5% (expressed in Canadian dollars).
Continued premium growth and improved underwriting performance generated a record 2004underwriting profit for Northbridge of $115.5, an increase of 120.8% over underwriting profitof $52.3 earned in 2003. Notwithstanding the impact of $27.5 in losses related to the 2004third quarter hurricanes (representing 2.9 combined ratio points), Northbridge’s combinedratio improved to 87.7% in 2004 from 92.6% in 2003.
61
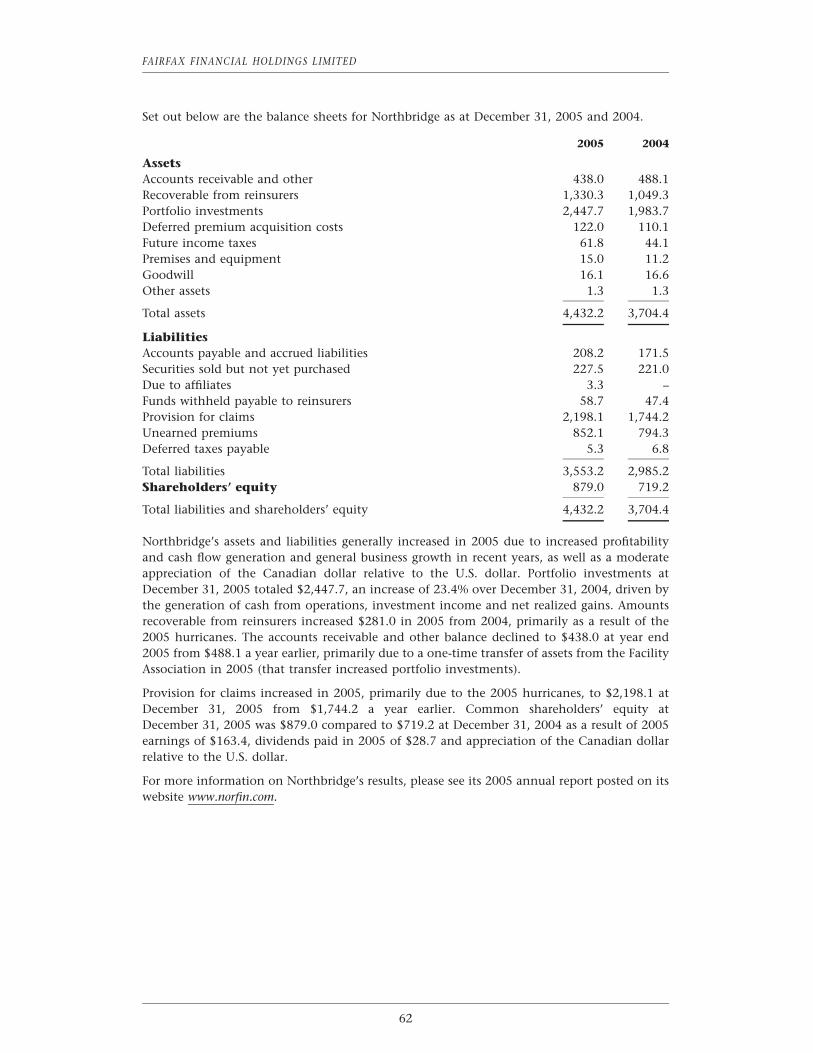
FAIRFAX FINANCIAL HOLDINGS LIMITED
Set out below are the balance sheets for Northbridge as at December 31, 2005 and 2004.
2005 2004
AssetsAccounts receivable and other 438.0 488.1Recoverable from reinsurers 1,330.3 1,049.3Portfolio investments 2,447.7 1,983.7Deferred premium acquisition costs 122.0 110.1Future income taxes 61.8 44.1Premises and equipment 15.0 11.2Goodwill 16.1 16.6Other assets 1.3 1.3
Total assets 4,432.2 3,704.4
LiabilitiesAccounts payable and accrued liabilities 208.2 171.5Securities sold but not yet purchased 227.5 221.0Due to affiliates 3.3 –Funds withheld payable to reinsurers 58.7 47.4Provision for claims 2,198.1 1,744.2Unearned premiums 852.1 794.3Deferred taxes payable 5.3 6.8
Total liabilities 3,553.2 2,985.2Shareholders’ equity 879.0 719.2
Total liabilities and shareholders’ equity 4,432.2 3,704.4
Northbridge’s assets and liabilities generally increased in 2005 due to increased profitabilityand cash flow generation and general business growth in recent years, as well as a moderateappreciation of the Canadian dollar relative to the U.S. dollar. Portfolio investments atDecember 31, 2005 totaled $2,447.7, an increase of 23.4% over December 31, 2004, driven bythe generation of cash from operations, investment income and net realized gains. Amountsrecoverable from reinsurers increased $281.0 in 2005 from 2004, primarily as a result of the2005 hurricanes. The accounts receivable and other balance declined to $438.0 at year end2005 from $488.1 a year earlier, primarily due to a one-time transfer of assets from the FacilityAssociation in 2005 (that transfer increased portfolio investments).
Provision for claims increased in 2005, primarily due to the 2005 hurricanes, to $2,198.1 atDecember 31, 2005 from $1,744.2 a year earlier. Common shareholders’ equity atDecember 31, 2005 was $879.0 compared to $719.2 at December 31, 2004 as a result of 2005earnings of $163.4, dividends paid in 2005 of $28.7 and appreciation of the Canadian dollarrelative to the U.S. dollar.
For more information on Northbridge’s results, please see its 2005 annual report posted on itswebsite www.norfin.com.
62
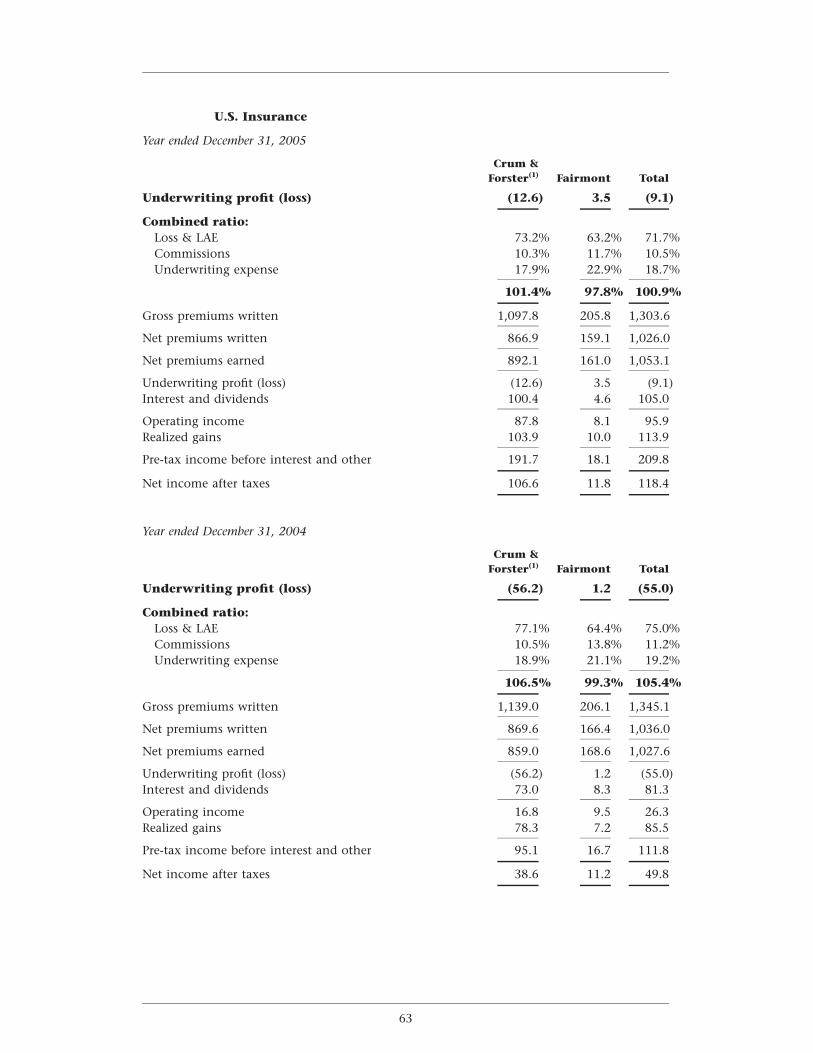
U.S. Insurance
Year ended December 31, 2005
Crum &Forster(1) Fairmont Total
Underwriting profit (loss) (12.6) 3.5 (9.1)
Combined ratio:Loss & LAE 73.2% 63.2% 71.7%Commissions 10.3% 11.7% 10.5%Underwriting expense 17.9% 22.9% 18.7%
101.4% 97.8% 100.9%
Gross premiums written 1,097.8 205.8 1,303.6
Net premiums written 866.9 159.1 1,026.0
Net premiums earned 892.1 161.0 1,053.1
Underwriting profit (loss) (12.6) 3.5 (9.1)Interest and dividends 100.4 4.6 105.0
Operating income 87.8 8.1 95.9Realized gains 103.9 10.0 113.9
Pre-tax income before interest and other 191.7 18.1 209.8
Net income after taxes 106.6 11.8 118.4
Year ended December 31, 2004
Crum &Forster(1) Fairmont Total
Underwriting profit (loss) (56.2) 1.2 (55.0)
Combined ratio:Loss & LAE 77.1% 64.4% 75.0%Commissions 10.5% 13.8% 11.2%Underwriting expense 18.9% 21.1% 19.2%
106.5% 99.3% 105.4%
Gross premiums written 1,139.0 206.1 1,345.1
Net premiums written 869.6 166.4 1,036.0
Net premiums earned 859.0 168.6 1,027.6
Underwriting profit (loss) (56.2) 1.2 (55.0)Interest and dividends 73.0 8.3 81.3
Operating income 16.8 9.5 26.3Realized gains 78.3 7.2 85.5
Pre-tax income before interest and other 95.1 16.7 111.8
Net income after taxes 38.6 11.2 49.8
63
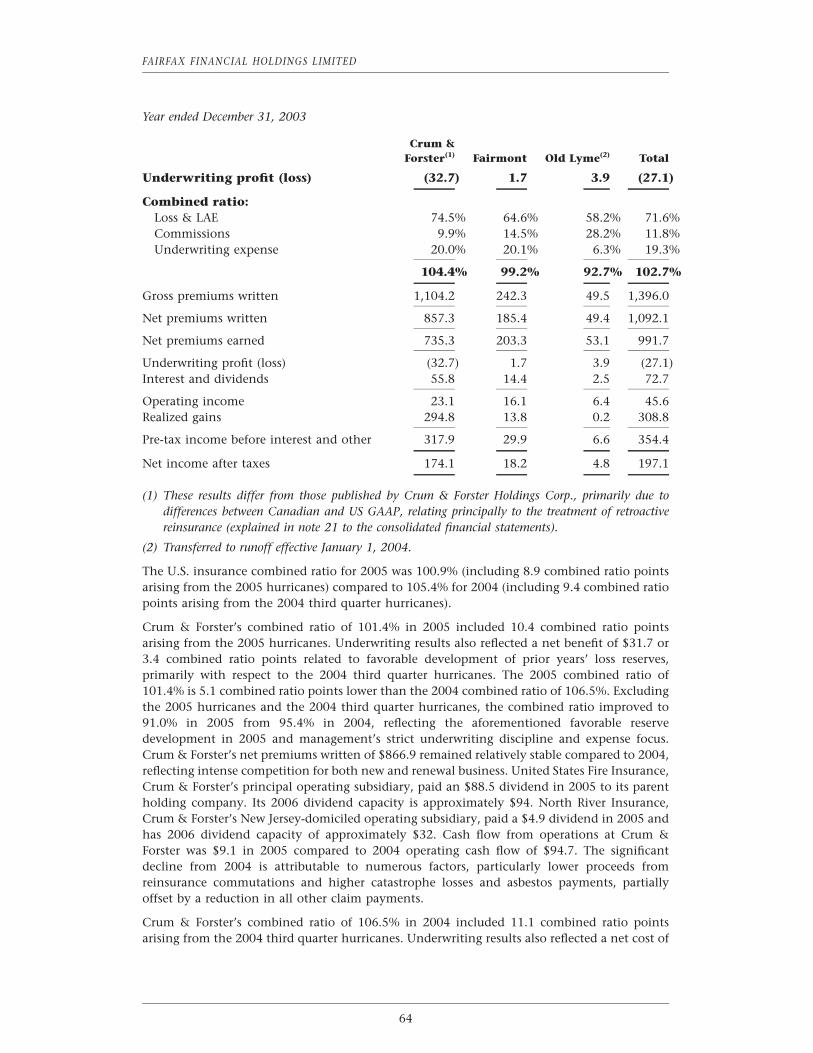
FAIRFAX FINANCIAL HOLDINGS LIMITED
Year ended December 31, 2003
Crum &Forster(1) Fairmont Old Lyme(2) Total
Underwriting profit (loss) (32.7) 1.7 3.9 (27.1)
Combined ratio:Loss & LAE 74.5% 64.6% 58.2% 71.6%Commissions 9.9% 14.5% 28.2% 11.8%Underwriting expense 20.0% 20.1% 6.3% 19.3%
104.4% 99.2% 92.7% 102.7%
Gross premiums written 1,104.2 242.3 49.5 1,396.0
Net premiums written 857.3 185.4 49.4 1,092.1
Net premiums earned 735.3 203.3 53.1 991.7
Underwriting profit (loss) (32.7) 1.7 3.9 (27.1)Interest and dividends 55.8 14.4 2.5 72.7
Operating income 23.1 16.1 6.4 45.6Realized gains 294.8 13.8 0.2 308.8
Pre-tax income before interest and other 317.9 29.9 6.6 354.4
Net income after taxes 174.1 18.2 4.8 197.1
(1) These results differ from those published by Crum & Forster Holdings Corp., primarily due todifferences between Canadian and US GAAP, relating principally to the treatment of retroactivereinsurance (explained in note 21 to the consolidated financial statements).
(2) Transferred to runoff effective January 1, 2004.
The U.S. insurance combined ratio for 2005 was 100.9% (including 8.9 combined ratio pointsarising from the 2005 hurricanes) compared to 105.4% for 2004 (including 9.4 combined ratiopoints arising from the 2004 third quarter hurricanes).
Crum & Forster’s combined ratio of 101.4% in 2005 included 10.4 combined ratio pointsarising from the 2005 hurricanes. Underwriting results also reflected a net benefit of $31.7 or3.4 combined ratio points related to favorable development of prior years’ loss reserves,primarily with respect to the 2004 third quarter hurricanes. The 2005 combined ratio of101.4% is 5.1 combined ratio points lower than the 2004 combined ratio of 106.5%. Excludingthe 2005 hurricanes and the 2004 third quarter hurricanes, the combined ratio improved to91.0% in 2005 from 95.4% in 2004, reflecting the aforementioned favorable reservedevelopment in 2005 and management’s strict underwriting discipline and expense focus.Crum & Forster’s net premiums written of $866.9 remained relatively stable compared to 2004,reflecting intense competition for both new and renewal business. United States Fire Insurance,Crum & Forster’s principal operating subsidiary, paid an $88.5 dividend in 2005 to its parentholding company. Its 2006 dividend capacity is approximately $94. North River Insurance,Crum & Forster’s New Jersey-domiciled operating subsidiary, paid a $4.9 dividend in 2005 andhas 2006 dividend capacity of approximately $32. Cash flow from operations at Crum &Forster was $9.1 in 2005 compared to 2004 operating cash flow of $94.7. The significantdecline from 2004 is attributable to numerous factors, particularly lower proceeds fromreinsurance commutations and higher catastrophe losses and asbestos payments, partiallyoffset by a reduction in all other claim payments.
Crum & Forster’s combined ratio of 106.5% in 2004 included 11.1 combined ratio pointsarising from the 2004 third quarter hurricanes. Underwriting results also reflected a net cost of
64
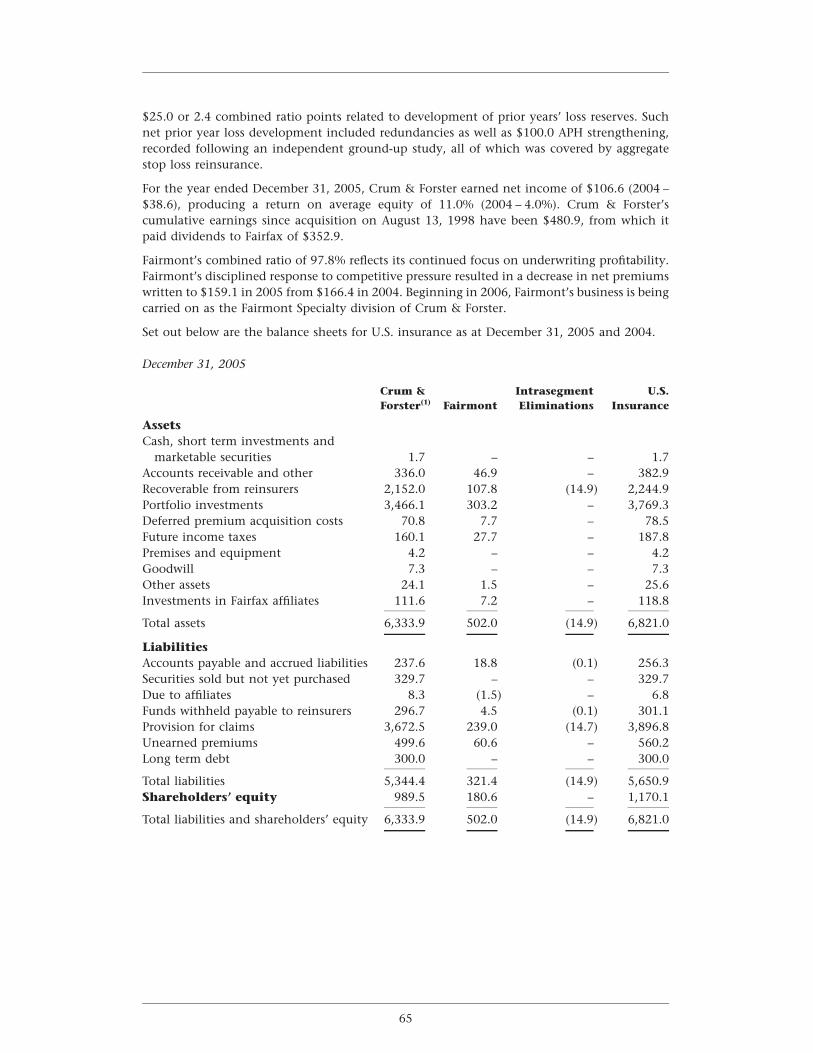
$25.0 or 2.4 combined ratio points related to development of prior years’ loss reserves. Suchnet prior year loss development included redundancies as well as $100.0 APH strengthening,recorded following an independent ground-up study, all of which was covered by aggregatestop loss reinsurance.
For the year ended December 31, 2005, Crum & Forster earned net income of $106.6 (2004 –$38.6), producing a return on average equity of 11.0% (2004 – 4.0%). Crum & Forster’scumulative earnings since acquisition on August 13, 1998 have been $480.9, from which itpaid dividends to Fairfax of $352.9.
Fairmont’s combined ratio of 97.8% reflects its continued focus on underwriting profitability.Fairmont’s disciplined response to competitive pressure resulted in a decrease in net premiumswritten to $159.1 in 2005 from $166.4 in 2004. Beginning in 2006, Fairmont’s business is beingcarried on as the Fairmont Specialty division of Crum & Forster.
Set out below are the balance sheets for U.S. insurance as at December 31, 2005 and 2004.
December 31, 2005
Crum & Intrasegment U.S.Forster(1) Fairmont Eliminations Insurance
AssetsCash, short term investments and
marketable securities 1.7 – – 1.7Accounts receivable and other 336.0 46.9 – 382.9Recoverable from reinsurers 2,152.0 107.8 (14.9) 2,244.9Portfolio investments 3,466.1 303.2 – 3,769.3Deferred premium acquisition costs 70.8 7.7 – 78.5Future income taxes 160.1 27.7 – 187.8Premises and equipment 4.2 – – 4.2Goodwill 7.3 – – 7.3Other assets 24.1 1.5 – 25.6Investments in Fairfax affiliates 111.6 7.2 – 118.8
Total assets 6,333.9 502.0 (14.9) 6,821.0
LiabilitiesAccounts payable and accrued liabilities 237.6 18.8 (0.1) 256.3Securities sold but not yet purchased 329.7 – – 329.7Due to affiliates 8.3 (1.5) – 6.8Funds withheld payable to reinsurers 296.7 4.5 (0.1) 301.1Provision for claims 3,672.5 239.0 (14.7) 3,896.8Unearned premiums 499.6 60.6 – 560.2Long term debt 300.0 – – 300.0
Total liabilities 5,344.4 321.4 (14.9) 5,650.9Shareholders’ equity 989.5 180.6 – 1,170.1
Total liabilities and shareholders’ equity 6,333.9 502.0 (14.9) 6,821.0
65
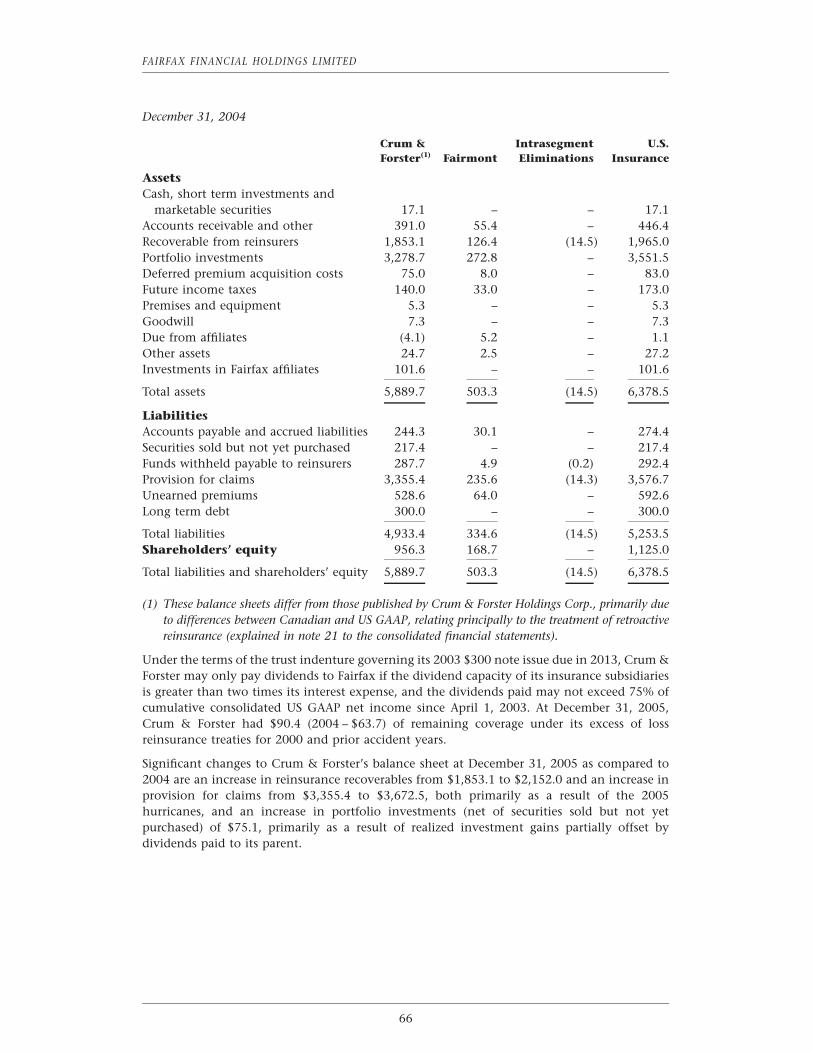
FAIRFAX FINANCIAL HOLDINGS LIMITED
December 31, 2004
Crum & Intrasegment U.S.Forster(1) Fairmont Eliminations Insurance
AssetsCash, short term investments and
marketable securities 17.1 – – 17.1Accounts receivable and other 391.0 55.4 – 446.4Recoverable from reinsurers 1,853.1 126.4 (14.5) 1,965.0Portfolio investments 3,278.7 272.8 – 3,551.5Deferred premium acquisition costs 75.0 8.0 – 83.0Future income taxes 140.0 33.0 – 173.0Premises and equipment 5.3 – – 5.3Goodwill 7.3 – – 7.3Due from affiliates (4.1) 5.2 – 1.1Other assets 24.7 2.5 – 27.2Investments in Fairfax affiliates 101.6 – – 101.6
Total assets 5,889.7 503.3 (14.5) 6,378.5
LiabilitiesAccounts payable and accrued liabilities 244.3 30.1 – 274.4Securities sold but not yet purchased 217.4 – – 217.4Funds withheld payable to reinsurers 287.7 4.9 (0.2) 292.4Provision for claims 3,355.4 235.6 (14.3) 3,576.7Unearned premiums 528.6 64.0 – 592.6Long term debt 300.0 – – 300.0
Total liabilities 4,933.4 334.6 (14.5) 5,253.5Shareholders’ equity 956.3 168.7 – 1,125.0
Total liabilities and shareholders’ equity 5,889.7 503.3 (14.5) 6,378.5
(1) These balance sheets differ from those published by Crum & Forster Holdings Corp., primarily dueto differences between Canadian and US GAAP, relating principally to the treatment of retroactivereinsurance (explained in note 21 to the consolidated financial statements).
Under the terms of the trust indenture governing its 2003 $300 note issue due in 2013, Crum &Forster may only pay dividends to Fairfax if the dividend capacity of its insurance subsidiariesis greater than two times its interest expense, and the dividends paid may not exceed 75% ofcumulative consolidated US GAAP net income since April 1, 2003. At December 31, 2005,Crum & Forster had $90.4 (2004 – $63.7) of remaining coverage under its excess of lossreinsurance treaties for 2000 and prior accident years.
Significant changes to Crum & Forster’s balance sheet at December 31, 2005 as compared to2004 are an increase in reinsurance recoverables from $1,853.1 to $2,152.0 and an increase inprovision for claims from $3,355.4 to $3,672.5, both primarily as a result of the 2005hurricanes, and an increase in portfolio investments (net of securities sold but not yetpurchased) of $75.1, primarily as a result of realized investment gains partially offset bydividends paid to its parent.
66
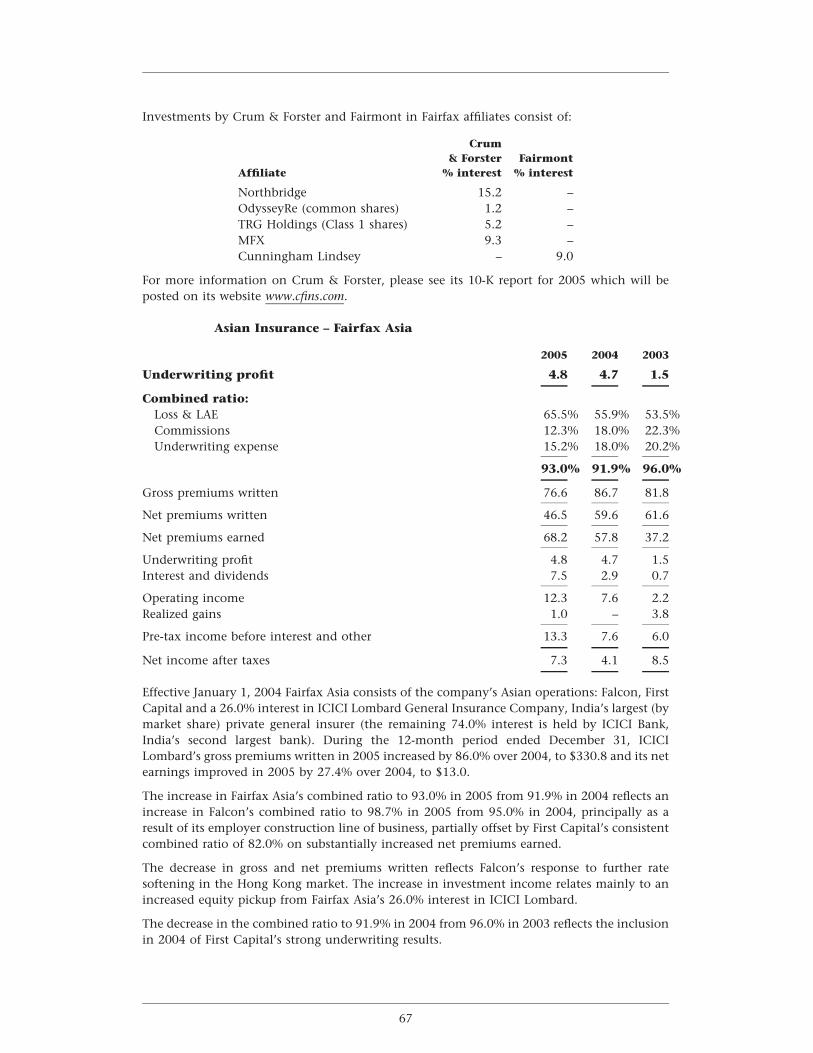
Investments by Crum & Forster and Fairmont in Fairfax affiliates consist of:
Crum& Forster Fairmont
Affiliate % interest % interest
Northbridge 15.2 –OdysseyRe (common shares) 1.2 –TRG Holdings (Class 1 shares) 5.2 –MFX 9.3 –Cunningham Lindsey – 9.0
For more information on Crum & Forster, please see its 10-K report for 2005 which will beposted on its website www.cfins.com.
Asian Insurance – Fairfax Asia
2005 2004 2003
Underwriting profit 4.8 4.7 1.5
Combined ratio:Loss & LAE 65.5% 55.9% 53.5%Commissions 12.3% 18.0% 22.3%Underwriting expense 15.2% 18.0% 20.2%
93.0% 91.9% 96.0%
Gross premiums written 76.6 86.7 81.8
Net premiums written 46.5 59.6 61.6
Net premiums earned 68.2 57.8 37.2
Underwriting profit 4.8 4.7 1.5Interest and dividends 7.5 2.9 0.7
Operating income 12.3 7.6 2.2Realized gains 1.0 – 3.8
Pre-tax income before interest and other 13.3 7.6 6.0
Net income after taxes 7.3 4.1 8.5
Effective January 1, 2004 Fairfax Asia consists of the company’s Asian operations: Falcon, FirstCapital and a 26.0% interest in ICICI Lombard General Insurance Company, India’s largest (bymarket share) private general insurer (the remaining 74.0% interest is held by ICICI Bank,India’s second largest bank). During the 12-month period ended December 31, ICICILombard’s gross premiums written in 2005 increased by 86.0% over 2004, to $330.8 and its netearnings improved in 2005 by 27.4% over 2004, to $13.0.
The increase in Fairfax Asia’s combined ratio to 93.0% in 2005 from 91.9% in 2004 reflects anincrease in Falcon’s combined ratio to 98.7% in 2005 from 95.0% in 2004, principally as aresult of its employer construction line of business, partially offset by First Capital’s consistentcombined ratio of 82.0% on substantially increased net premiums earned.
The decrease in gross and net premiums written reflects Falcon’s response to further ratesoftening in the Hong Kong market. The increase in investment income relates mainly to anincreased equity pickup from Fairfax Asia’s 26.0% interest in ICICI Lombard.
The decrease in the combined ratio to 91.9% in 2004 from 96.0% in 2003 reflects the inclusionin 2004 of First Capital’s strong underwriting results.
67
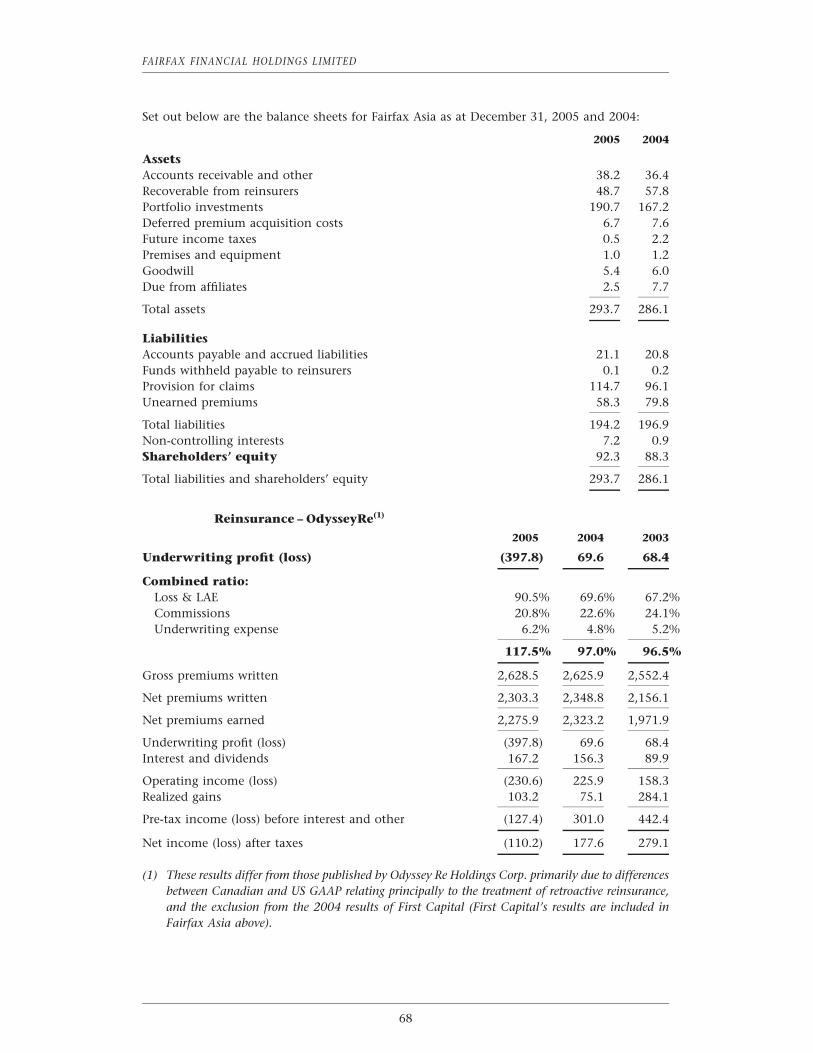
FAIRFAX FINANCIAL HOLDINGS LIMITED
Set out below are the balance sheets for Fairfax Asia as at December 31, 2005 and 2004:
2005 2004
AssetsAccounts receivable and other 38.2 36.4Recoverable from reinsurers 48.7 57.8Portfolio investments 190.7 167.2Deferred premium acquisition costs 6.7 7.6Future income taxes 0.5 2.2Premises and equipment 1.0 1.2Goodwill 5.4 6.0Due from affiliates 2.5 7.7
Total assets 293.7 286.1
LiabilitiesAccounts payable and accrued liabilities 21.1 20.8Funds withheld payable to reinsurers 0.1 0.2Provision for claims 114.7 96.1Unearned premiums 58.3 79.8
Total liabilities 194.2 196.9Non-controlling interests 7.2 0.9Shareholders’ equity 92.3 88.3
Total liabilities and shareholders’ equity 293.7 286.1
Reinsurance – OdysseyRe(1)
2005 2004 2003
Underwriting profit (loss) (397.8) 69.6 68.4
Combined ratio:Loss & LAE 90.5% 69.6% 67.2%Commissions 20.8% 22.6% 24.1%Underwriting expense 6.2% 4.8% 5.2%
117.5% 97.0% 96.5%
Gross premiums written 2,628.5 2,625.9 2,552.4
Net premiums written 2,303.3 2,348.8 2,156.1
Net premiums earned 2,275.9 2,323.2 1,971.9
Underwriting profit (loss) (397.8) 69.6 68.4Interest and dividends 167.2 156.3 89.9
Operating income (loss) (230.6) 225.9 158.3Realized gains 103.2 75.1 284.1
Pre-tax income (loss) before interest and other (127.4) 301.0 442.4
Net income (loss) after taxes (110.2) 177.6 279.1
(1) These results differ from those published by Odyssey Re Holdings Corp. primarily due to differencesbetween Canadian and US GAAP relating principally to the treatment of retroactive reinsurance,and the exclusion from the 2004 results of First Capital (First Capital’s results are included inFairfax Asia above).
68
In 2005, a year of unprecedented catastrophes, OdysseyRe’s combined ratio was 117.5%, whichincluded 19.2 combined ratio points ($436.0 of pre-tax losses, net of applicable reinstatementpremiums and reinsurance) arising from Hurricanes Katrina, Rita and Wilma. This compares toa combined ratio of 97.0% in 2004, which included 4.2 combined ratio points arising from the2004 third quarter hurricanes. OdysseyRe’s combined ratio in 2005 also included 8.3 combinedratio points ($189.0 of net pre-tax losses) in adverse loss development from prior period losses(7.4 combined ratio points in 2004). Gross premiums written were virtually unchanged in2005, following an average annual increase of 34.0% from 2002 to 2004. For 2005, grosspremiums written in the United States represented 55% of the total, with non-U.S. premiumsrepresenting 45%. In 2005, OdysseyRe produced a net loss of $110.2 as compared to netincome of $177.6 in 2004, primarily driven by losses from the 2005 hurricanes.
OdysseyRe’s combined ratio was 97.0% in 2004 (including 4.2 combined ratio points arisingfrom the 2004 third quarter hurricanes). Net premiums written increased by 8.9% in 2004,which followed increases of 31.2% in 2003 and 71.8% in 2002. During this three year period,OdysseyRe significantly expanded its presence in the global marketplace through a deliberatestrategy of product and geographic diversification. The diversification of activity OdysseyRehas achieved was responsible for its ability to produce an underwriting profit in 2004 despiteincurring losses from the 2004 third quarter hurricanes.
OdysseyRe’s net operating cash flow was $397.3 in 2005 as compared to $603.2 in 2004,reflecting an increase in paid losses related to 2004 and 2005 catastrophes, principally the 2005hurricanes.
OdysseyRe announced its decision in February 2006 to restate its financial results for the years2000 through 2004, as well as its results for the nine months ended September 30, 2005. Theprimary reason for the restatement was to correct the accounting treatment (relating primarilyto the timing of recognition of premiums and unearned profit commissions) for certaincontract features of seven ceded and two assumed reinsurance contracts, to correct theaccounting treatment of ceding commissions relating to three ceded aggregate excess of losscontracts, to correct the accounting treatment for one assumed reinsurance contract (to bedeposit accounted rather than reinsurance accounted as a result of Odyssey’s inability toconclude that there is a reasonable possibility of a loss under the contract), and to record otheradjustments to reflect unrelated items of an immaterial nature. In addition, OdysseyRe re-evaluated the accounting for a reinsurance contract entered into on the purchase of a businessfrom Skandia Insurance Company Ltd. (Skandia) in 1995. This contract was assigned bySkandia to nSpire Re in 1999 and accordingly is eliminated on consolidation at Fairfax. As aresult, the restatement of the Skandia reinsurance contract at the OdysseyRe level had noimpact on the Fairfax consolidated results. Fairfax has included all adjustments in OdysseyRe’srestatement except for the Skandia reinsurance contract noted above in this restatement.
69
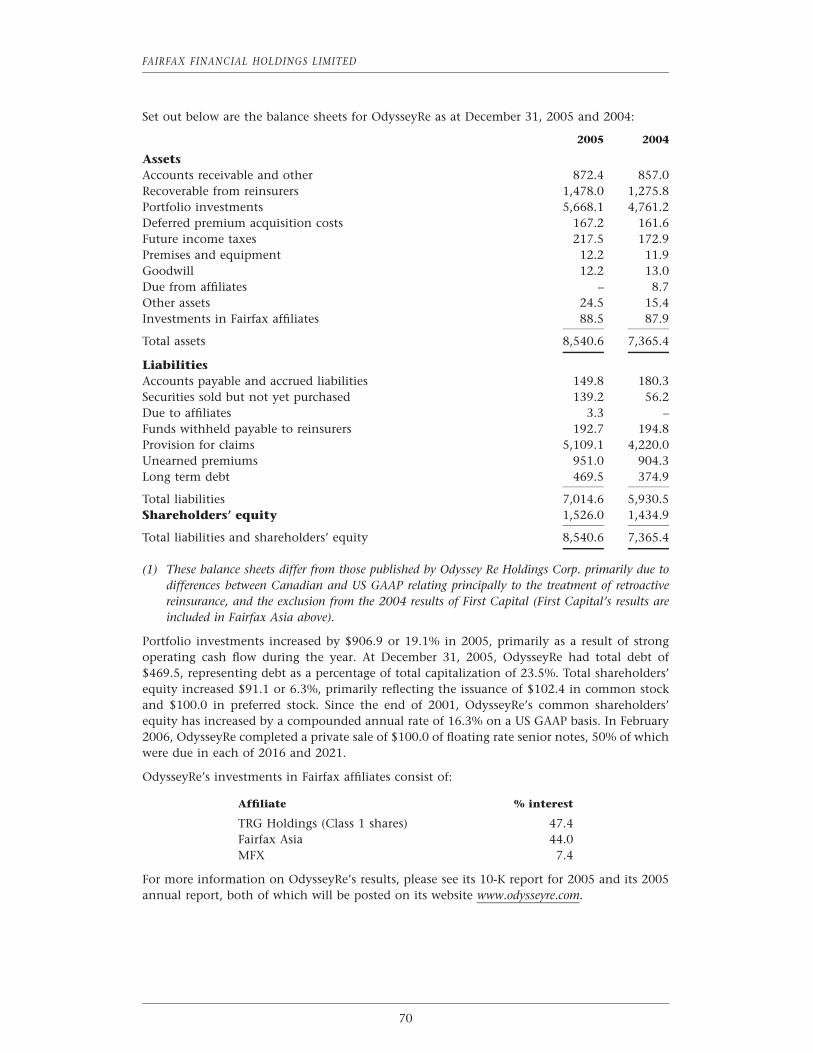
FAIRFAX FINANCIAL HOLDINGS LIMITED
Set out below are the balance sheets for OdysseyRe as at December 31, 2005 and 2004:
2005 2004
AssetsAccounts receivable and other 872.4 857.0Recoverable from reinsurers 1,478.0 1,275.8Portfolio investments 5,668.1 4,761.2Deferred premium acquisition costs 167.2 161.6Future income taxes 217.5 172.9Premises and equipment 12.2 11.9Goodwill 12.2 13.0Due from affiliates – 8.7Other assets 24.5 15.4Investments in Fairfax affiliates 88.5 87.9
Total assets 8,540.6 7,365.4
LiabilitiesAccounts payable and accrued liabilities 149.8 180.3Securities sold but not yet purchased 139.2 56.2Due to affiliates 3.3 –Funds withheld payable to reinsurers 192.7 194.8Provision for claims 5,109.1 4,220.0Unearned premiums 951.0 904.3Long term debt 469.5 374.9
Total liabilities 7,014.6 5,930.5Shareholders’ equity 1,526.0 1,434.9
Total liabilities and shareholders’ equity 8,540.6 7,365.4
(1) These balance sheets differ from those published by Odyssey Re Holdings Corp. primarily due todifferences between Canadian and US GAAP relating principally to the treatment of retroactivereinsurance, and the exclusion from the 2004 results of First Capital (First Capital’s results areincluded in Fairfax Asia above).
Portfolio investments increased by $906.9 or 19.1% in 2005, primarily as a result of strongoperating cash flow during the year. At December 31, 2005, OdysseyRe had total debt of$469.5, representing debt as a percentage of total capitalization of 23.5%. Total shareholders’equity increased $91.1 or 6.3%, primarily reflecting the issuance of $102.4 in common stockand $100.0 in preferred stock. Since the end of 2001, OdysseyRe’s common shareholders’equity has increased by a compounded annual rate of 16.3% on a US GAAP basis. In February2006, OdysseyRe completed a private sale of $100.0 of floating rate senior notes, 50% of whichwere due in each of 2016 and 2021.
OdysseyRe’s investments in Fairfax affiliates consist of:
Affiliate % interest
TRG Holdings (Class 1 shares) 47.4Fairfax Asia 44.0MFX 7.4
For more information on OdysseyRe’s results, please see its 10-K report for 2005 and its 2005annual report, both of which will be posted on its website www.odysseyre.com.
70
Interest and Dividends
Interest and dividend income earned by the company’s insurance and reinsurance operationsin 2005 increased to $345.4 from $301.4 in 2004, due primarily to higher short term interestrates and increased investment portfolios reflecting positive cash flow from operations,partially offset by the company’s share of Advent’s $45.1 hurricane-affected loss. Increasesfrom 2003 to 2004 were due primarily to an increase in yield resulting from the reinvestmentof a significant portion of cash and short term investments, primarily in U.S. treasury bonds,and to increased investment portfolios.
Realized Gains
Net realized gains earned by the company’s insurance and reinsurance operations increased in2005 to $324.1 (despite $114.9 of non-trading losses resulting from mark to marketadjustments) from $171.1 in 2004. Consolidated net realized gains of $385.7 included netrealized gains of $59.2 in the runoff segment and net realized gains at Cunningham Lindsey.The consolidated net realized gains included $158.7 of non-trading losses, consisting of $46.5of mark to market adjustments, recorded as realized losses, related to the economic hedges putin place by the company against a decline in the equity markets and $112.2 of mark to marketadjustments, recorded as realized losses, arising from other derivatives in the company’sinvestment portfolio, primarily credit default swaps. Included in consolidated net realizedgains for 2005 was a provision of $48.5 (2004 – $31.6) for other than temporary losses andwritedowns of certain bonds and common stocks.
Net realized gains earned by the company’s insurance and reinsurance operations decreased in2004 to $171.1, after $90.3 of non-trading losses, from $520.5 in 2003. The $97.7 of non-trading losses consisted of $63.3 of mark to market changes in fair value, recorded as realizedlosses, primarily relating to the economic hedges put in place by the company against a declinein the equity markets, and $27.0 of costs, recorded as realized losses, in connection with thecompany’s repurchase of outstanding debt at a premium to par.
Runoff and Other
The runoff business segment was formed with the acquisition on August 11, 1999 of thecompany’s interest in The Resolution Group (TRG), which was comprised of the outstandingrunoff management expertise and experienced, highly respected personnel of TRG, and awholly-owned insurance subsidiary in runoff, International Insurance Company (IIC). TheRunoff and other segment currently consists of three groups: the U.S. runoff group, consistingprimarily of TIG Insurance Company (TIG); the European runoff group (RiverStoneInsurance UK and nSpire Re); and Group Re, which predominantly constitutes theparticipation by CRC (Bermuda), Wentworth (based in Barbados) and nSpire Re in thereinsurance of Fairfax’s subsidiaries, by quota share or through participation in thosesubsidiaries’ third party reinsurance programs. The U.S. and European runoff groups aremanaged by the dedicated TRG runoff management operation, now usually identified underthe RiverStone name, which has 547 employees in the U.S. and Europe. Group Re’s activitiesare managed by Fairfax.
U.S. runoff group
The U.S. runoff group consists of TIG Insurance Company (and Old Lyme Insurance, which isnot significant). TIG, as it exists today, is the result of its merger with IIC, which was acquiredvia the TRG acquisition, 27.5% in 1999 and 72.5% in 2002. For a detailed description of thehistory of the U.S. runoff group, please refer to page 62 of Fairfax’s 2004 Annual Report.
During 2005, the trust established for the benefit of TIG at the commencement of TIG’s runoffin December 2002 was terminated and the remaining assets in the trust were released. The
71
FAIRFAX FINANCIAL HOLDINGS LIMITED
assets released were all the shares of the Fairmont companies and the remaining 2 millionshares of OdysseyRe.
Effective December 31, 2005, all the shares of the Fairmont companies were transferred to TIGfrom its immediate parent company in exchange for 7.7 million shares of OdysseyRe (with amarket value of $193.1 at December 31, 2005). Concurrently, the historical business written byFairmont was placed into runoff and will be reported as U.S. runoff effective January 1, 2006(as noted previously, Fairmont’s business continued, beginning in 2006, as a division ofCrum & Forster).
European runoff group
The European runoff group consists principally of RiverStone Insurance UK and nSpire Re.
RiverStone Insurance UK includes Sphere Drake Insurance and Syndicate 3500. Sphere DrakeInsurance ceased underwriting and was put into runoff in 1999. In 2004, substantially all ofSphere Drake Insurance’s insurance and reinsurance portfolio was amalgamated intoRiverStone Insurance UK, forming the unified European runoff platform. RiverStoneInsurance UK resulted from the amalgamation during 2002 of RiverStone Stockholm, SphereDrake Bermuda and CTR’s non-life operations, all of which ceased underwriting and were putinto runoff between 1999 and 2001. In November 2003, RiverStone formed a new runoffsyndicate at Lloyd’s of London, Syndicate 3500, to provide reinsurance-to-close for the 2000and prior underwriting years of Kingsmead syndicates 271 and 506 for which TIG, along withthird party capital providers, had provided underwriting capacity for 2000 and priorunderwriting years. In 2005, gross and net provisions for claims of $32.7 and $20.2,respectively, were transferred to Syndicate 3500 as a result of the reinsurance-to-close of the2001 year of account of Syndicate 506. RiverStone Insurance UK reinsures the insurance andreinsurance portfolio of Syndicate 3500. This transaction allowed RiverStone to integrate directmanagement of these liabilities into the European runoff platform.
During 2005, RiverStone Insurance UK obtained U.S. court sanction for the previously English-court approved transfer of certain obligations from an affiliate, to facilitate its carrying on theEuropean runoff as described above. The obtaining of these approvals will not result in theacceleration of the making or payment of claims or have any other material effect on theoperation of the European runoff.
nSpire Re, headquartered in Ireland, reinsures the insurance and reinsurance portfolios ofRiverStone Insurance UK and benefits from the protection provided by the Swiss Re Cover(described commencing on page 72) from aggregate adverse development of claims anduncollectible reinsurance on 1998 and prior net reserves. nSpire Re’s insurance and reinsuranceobligations are guaranteed by Fairfax. RiverStone Insurance UK, with 136 employees in itsoffices in the United Kingdom, provides the management (including claims handling) ofnSpire Re’s insurance and reinsurance liabilities and the collection and management of itsreinsurance assets. nSpire Re provides consolidated investment and liquidity managementservices to the European runoff group. In addition to its role in the consolidation of theEuropean runoff companies, nSpire Re also has two other mandates, described in the followingparagraph and under Group Re below.
nSpire Re served as the entity through which Fairfax primarily provided financing for theacquisition of its U.S. insurance and reinsurance companies. nSpire Re’s capital and surplusincludes $1.6 billion of equity in Fairfax’s U.S. holding company and company debt resultingfrom those acquisitions. For each of its U.S. acquisitions, Fairfax financed the acquisition, atthe Canadian holding company, with an issue of subordinate voting shares and long termdebt. The proceeds of this long term financing were invested in nSpire Re’s capital which thenprovided the acquisition financing to Fairfax’s U.S. holding company to complete theacquisition.
72
Related party transactions of nSpire Re, including its provision of reinsurance to affiliates, iseffected on market terms and at market prices, and require approval by nSpire Re’s board ofdirectors, three of whose five members are unrelated to Fairfax. nSpire Re’s accounts areaudited annually by PricewaterhouseCoopers LLP, and its reserves are certified annually byMilliman USA and are included in the consolidated reserves on whichPricewaterhouseCoopers LLP provides an annual valuation actuary’s report.
In January 2005, the European runoff group purchased Compagnie de Reassurance d’Ile deFrance (Corifrance), a French reinsurance company in runoff, for $59.8 (444.0). The purchaseprice was the amount by which the $122.2 (489.9) fair value of Corifrance’s assets exceeded the$62.4 (445.9) fair value of Corifrance’s liabilities. As part of the consideration for the purchase,the European runoff group received an indemnity from the seller, capped at the amount of thepurchase price, for any adverse development of the net reserves acquired.
During 2005, the simplification of Fairfax’s European runoff structure continued, with theelimination of various European holding companies.
Group Re
Consistent with the company’s objective of retaining more business for its own account infavourable market conditions, CRC (Bermuda), Wentworth and nSpire Re participate in thereinsurance of Fairfax’s subsidiaries, by quota share or through participation in thosesubsidiaries’ third party reinsurance programs on the same terms, including pricing, as thethird party reinsurers. The provision of such reinsurance, which varies by program and bysubsidiary, is shown separately as ‘‘Group Re’’. Since 2004, Group Re, through nSpire Re, hasalso written third party business. Group Re’s cumulative pre-tax income since its inception in2002 is $20.1, notwithstanding its hurricane-related $80.0 pre-tax loss in 2005.
Swiss Re Cover
As part of its acquisition of TIG effective April 13, 1999, Fairfax purchased a $1 billioncorporate insurance cover ultimately reinsured with a Swiss Re subsidiary (the Swiss Re Cover),protecting it, on an aggregate basis, from adverse development of claims and uncollectiblereinsurance above the aggregate reserves set up by all of its subsidiaries (including TIG, but notincluding other subsidiaries acquired after 1998) at December 31, 1998. At December 31, 2005,the company had ceded losses under this cover utilizing the full $1 billion limit of that cover($1 billion at December 31, 2004).
As of December 31, 2002, Fairfax assigned the full benefit of the Swiss Re Cover to nSpire Rewhich had previously provided the indirect benefit of the Swiss Re Cover to TIG and theEuropean runoff companies. Although Fairfax remains legally liable for its original obligationswith respect to the Swiss Re Cover, under the terms of the assignment agreement, nSpire Re isresponsible to Fairfax for all premium and interest payments after 2002 for any additionallosses ceded to the Swiss Re Cover. At December 31, 2005, there remains no unused protectionunder the Swiss Re Cover (nil at December 31, 2004; $3.9 at December 31, 2003). AtDecember 31, 2005, the premiums plus interest paid or earned on the Swiss Re Coveraggregated $564.2.
In December 2003, an affiliate of nSpire Re entered into a $300 revolving letter of credit facilitywith 11 banks which is used to provide letters of credit for reinsurance contracts of nSpire Reprovided for the benefit of other Fairfax subsidiaries. The facility was increased to $450 during2004. The facility is effectively secured by the assets held in trust derived from the premiumson the Swiss Re Cover and the interest thereon. The lenders have the ability, in the event of adefault, to cause the commutation of this cover, thereby gaining access to the trust accountassets. The aggregate amount of letters of credit issued from time to time under this facility
73
FAIRFAX FINANCIAL HOLDINGS LIMITED
may not exceed the agreed margined value of the assets in the trust account. Currently, thereare $450 of letters of credit issued under this facility.
With the Odyssey Re Holdings IPO, effective June 14, 2001 further adverse development inOdyssey America Re’s and Odyssey Reinsurance Corporation’s claims and uncollectiblereinsurance was no longer protected by the Swiss Re Cover. Similarly, with the NorthbridgeIPO, effective May 28, 2003 further adverse development in the claims and uncollectiblereinsurance of the subsidiaries of Northbridge was no longer protected by the Swiss Re Cover.In each case, at the date of the IPO, ultimate reserves and claim payout patterns werecontractually ‘‘fixed’’ for purposes of the Swiss Re Cover.
The premiums and interest paid for the Swiss Re Cover are placed into a trust account for thebenefit of Swiss Re and are guaranteed by Fairfax to earn 7% per annum. The trust assets aremanaged by Hamblin Watsa and to the extent they earn less than 7% per annum, or themarket value of the trust account assets falls below the required level, top-up payments intothe trust account are required. For the year ended December 31, 2005, investment income(including realized gains and losses) from the assets in the trust account was $3.9 less than thecontractual 7% per annum rate of interest. Since inception of the trust account in 1999, thecumulative investment income (including realized gains and losses) has exceeded thecumulative contractual 7% per annum rate of interest by $6.4.
The cessions to the Swiss Re Cover since inception have resulted from adverse development atthe various operating segments, as follows:
2004 2003 2002 2001 2000 1999 Cumulative
Canadian insurance – 0.9 (0.1) 11.3 (9.7) (3.2) (0.8)U.S. insurance 3.9 85.8 2.9 94.9 166.6 186.1 540.2Reinsurance – – – – 22.6 53.3 75.9Runoff and other – 176.9 2.3 97.6 93.0 14.9 384.7
Total 3.9 263.6 5.1 203.8 272.5 251.1 1,000.0
The majority of the cumulative cessions to the Swiss Re Cover resulted from reservedeficiencies of $438.3 for TIG, $232.7 for the European runoff group and $193.1 for Crum &Forster. TIG is included in the Runoff segment since 2002 and U.S. insurance prior thereto.
Commutations
During 2005, in pursuance of Fairfax’s goal of simplifying its runoff structure and inrecognition of the strength and stability achieved by TIG (U.S. runoff) since thecommencement of TIG’s runoff in December 2002, TIG commuted the adverse developmentcovers provided to it by Chubb Re and nSpire Re soon after the commencement of its runoff,and agreed to commute the adverse development cover provided to IIC (with which TIGmerged soon after the commencement of its runoff) by Ridge Re (a subsidiary of Xerox) at thetime of Xerox’s restructuring of its financial services businesses in 1992.
The Chubb Re/nSpire Re commutations resulted in a $103.1 operating loss taken in the secondquarter of 2005 (the inception of Chubb Re cover had resulted in an $89.2 operating gain in2003), while the Ridge Re commutation had no material effect on income. Normal effects ofthe commutations were that TIG’s net loss reserves (provision for claims) were increased by theamount of reserves which were formerly reinsured, and TIG’s cash was increased by the cash itreceived on the commutations – approximately $197 from the second quarter ChubbRe/nSpire Re commutations and approximately $373 from the Ridge Re commutation, whichwas agreed to during the fourth quarter and which closed at the beginning of March 2006. The$373 cash proceeds received on closing at the beginning of March 2006 was included inAccounts receivable and other at December 31, 2005.
74
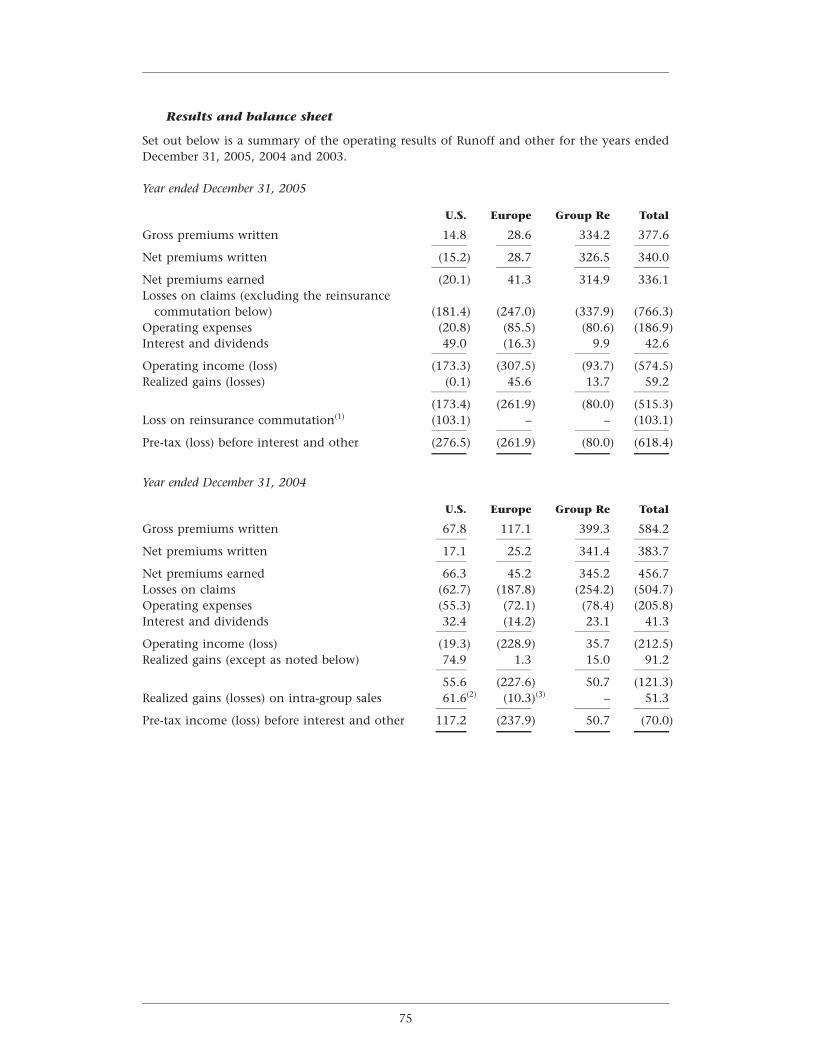
Results and balance sheet
Set out below is a summary of the operating results of Runoff and other for the years endedDecember 31, 2005, 2004 and 2003.
Year ended December 31, 2005
U.S. Europe Group Re Total
Gross premiums written 14.8 28.6 334.2 377.6
Net premiums written (15.2) 28.7 326.5 340.0
Net premiums earned (20.1) 41.3 314.9 336.1Losses on claims (excluding the reinsurance
commutation below) (181.4) (247.0) (337.9) (766.3)Operating expenses (20.8) (85.5) (80.6) (186.9)Interest and dividends 49.0 (16.3) 9.9 42.6
Operating income (loss) (173.3) (307.5) (93.7) (574.5)Realized gains (losses) (0.1) 45.6 13.7 59.2
(173.4) (261.9) (80.0) (515.3)Loss on reinsurance commutation(1) (103.1) – – (103.1)
Pre-tax (loss) before interest and other (276.5) (261.9) (80.0) (618.4)
Year ended December 31, 2004
U.S. Europe Group Re Total
Gross premiums written 67.8 117.1 399.3 584.2
Net premiums written 17.1 25.2 341.4 383.7
Net premiums earned 66.3 45.2 345.2 456.7Losses on claims (62.7) (187.8) (254.2) (504.7)Operating expenses (55.3) (72.1) (78.4) (205.8)Interest and dividends 32.4 (14.2) 23.1 41.3
Operating income (loss) (19.3) (228.9) 35.7 (212.5)Realized gains (except as noted below) 74.9 1.3 15.0 91.2
55.6 (227.6) 50.7 (121.3)Realized gains (losses) on intra-group sales 61.6(2) (10.3)(3) – 51.3
Pre-tax income (loss) before interest and other 117.2 (237.9) 50.7 (70.0)
75
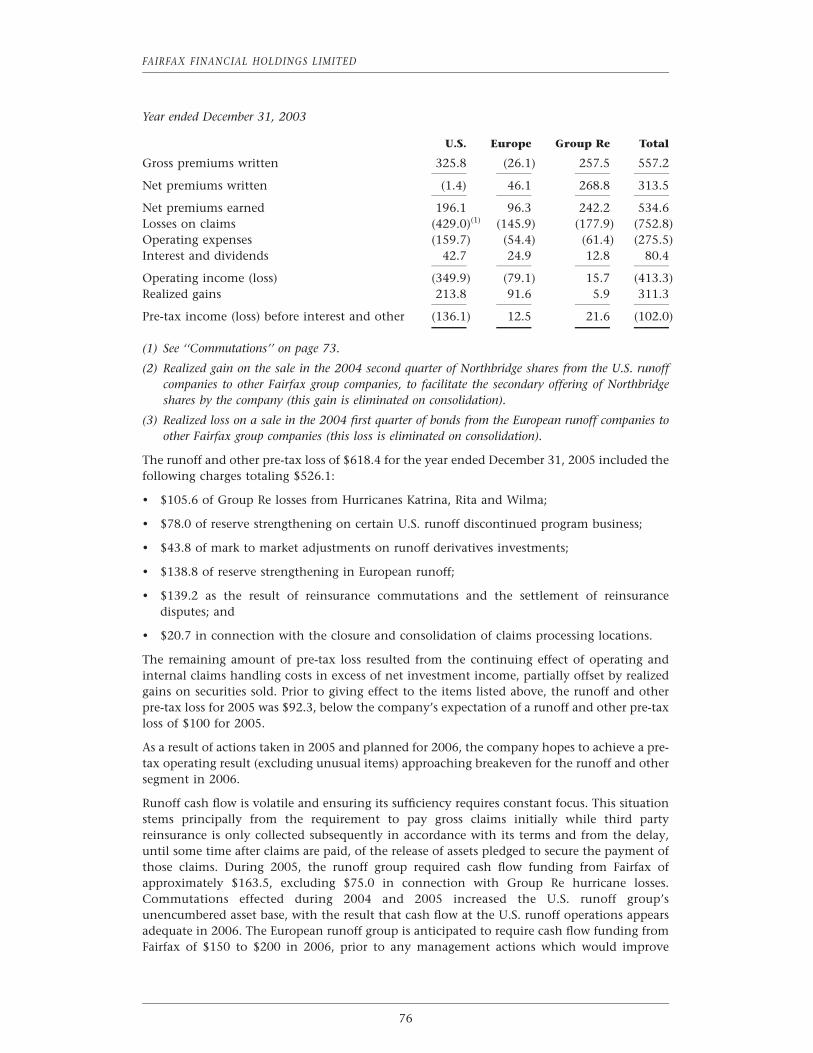
FAIRFAX FINANCIAL HOLDINGS LIMITED
Year ended December 31, 2003
U.S. Europe Group Re Total
Gross premiums written 325.8 (26.1) 257.5 557.2
Net premiums written (1.4) 46.1 268.8 313.5
Net premiums earned 196.1 96.3 242.2 534.6Losses on claims (429.0)(1) (145.9) (177.9) (752.8)Operating expenses (159.7) (54.4) (61.4) (275.5)Interest and dividends 42.7 24.9 12.8 80.4
Operating income (loss) (349.9) (79.1) 15.7 (413.3)Realized gains 213.8 91.6 5.9 311.3
Pre-tax income (loss) before interest and other (136.1) 12.5 21.6 (102.0)
(1) See ‘‘Commutations’’ on page 73.
(2) Realized gain on the sale in the 2004 second quarter of Northbridge shares from the U.S. runoffcompanies to other Fairfax group companies, to facilitate the secondary offering of Northbridgeshares by the company (this gain is eliminated on consolidation).
(3) Realized loss on a sale in the 2004 first quarter of bonds from the European runoff companies toother Fairfax group companies (this loss is eliminated on consolidation).
The runoff and other pre-tax loss of $618.4 for the year ended December 31, 2005 included thefollowing charges totaling $526.1:
) $105.6 of Group Re losses from Hurricanes Katrina, Rita and Wilma;
) $78.0 of reserve strengthening on certain U.S. runoff discontinued program business;
) $43.8 of mark to market adjustments on runoff derivatives investments;
) $138.8 of reserve strengthening in European runoff;
) $139.2 as the result of reinsurance commutations and the settlement of reinsurancedisputes; and
) $20.7 in connection with the closure and consolidation of claims processing locations.
The remaining amount of pre-tax loss resulted from the continuing effect of operating andinternal claims handling costs in excess of net investment income, partially offset by realizedgains on securities sold. Prior to giving effect to the items listed above, the runoff and otherpre-tax loss for 2005 was $92.3, below the company’s expectation of a runoff and other pre-taxloss of $100 for 2005.
As a result of actions taken in 2005 and planned for 2006, the company hopes to achieve a pre-tax operating result (excluding unusual items) approaching breakeven for the runoff and othersegment in 2006.
Runoff cash flow is volatile and ensuring its sufficiency requires constant focus. This situationstems principally from the requirement to pay gross claims initially while third partyreinsurance is only collected subsequently in accordance with its terms and from the delay,until some time after claims are paid, of the release of assets pledged to secure the payment ofthose claims. During 2005, the runoff group required cash flow funding from Fairfax ofapproximately $163.5, excluding $75.0 in connection with Group Re hurricane losses.Commutations effected during 2004 and 2005 increased the U.S. runoff group’sunencumbered asset base, with the result that cash flow at the U.S. runoff operations appearsadequate in 2006. The European runoff group is anticipated to require cash flow funding fromFairfax of $150 to $200 in 2006, prior to any management actions which would improve
76
European runoff cash flow and prior to the ultimate cash flow implications of the collateralsubstitution described in the next sentence. In connection with the restatement of the Skandiareinsurance contract referred to on page 68, in March 2006, nSpire Re replaced $78 of letters ofcredit with cash funding to OdysseyRe which required approximately $16 of additionalfunding from Fairfax in the first quarter of 2006.
Excluding the Northbridge gain, the U.S. runoff group’s pre-tax income of $55.6 in 2004reflected operating and internal claims handling costs in excess of net investment income,substantially offset by realized gains (including the gain on the sale of Zenith National sharesof $59.5).
Excluding the footnoted item, for the year ended December 31, 2004, the European runoffgroup had a pre-tax loss of $227.6, of which $75.0 reflected a strengthening of constructiondefect reserves, $22.5 related to various costs and losses allocated to the European runoff groupand the remainder was primarily attributable to operating and internal claims handling costsin excess of net investment income and the investment income being reduced as a result offunds withheld requirements under the Swiss Re Cover.
77
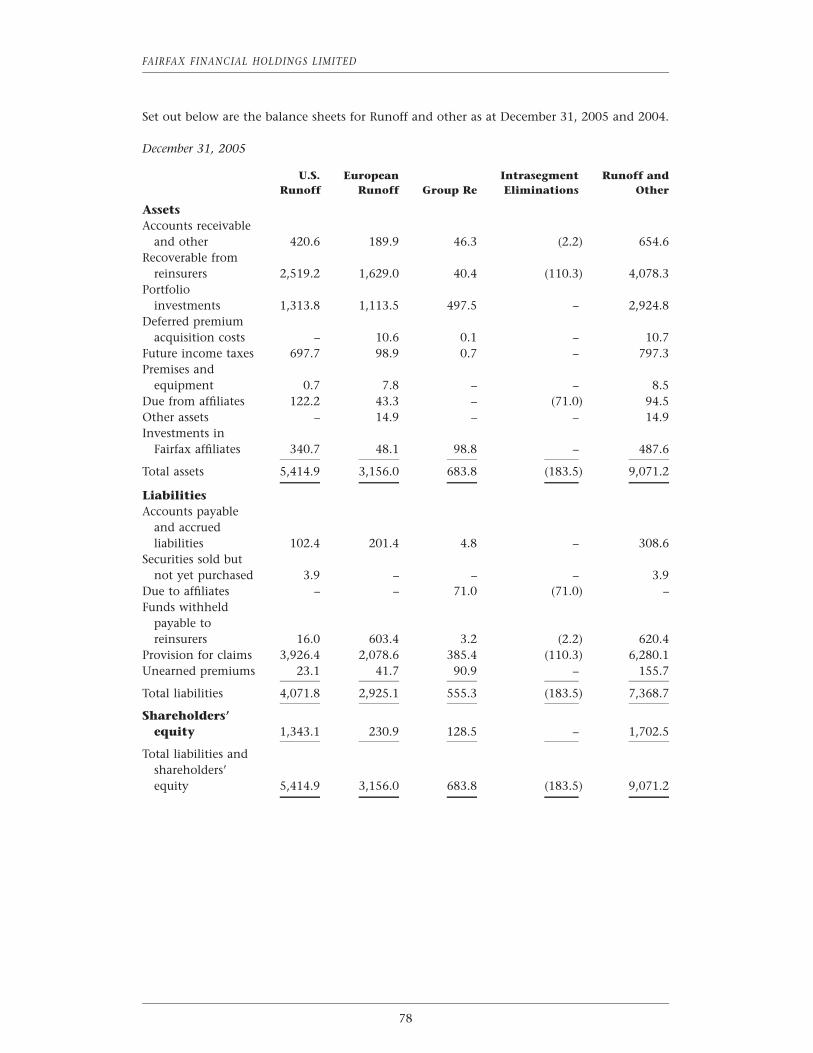
FAIRFAX FINANCIAL HOLDINGS LIMITED
Set out below are the balance sheets for Runoff and other as at December 31, 2005 and 2004.
December 31, 2005
U.S. European Intrasegment Runoff andRunoff Runoff Group Re Eliminations Other
AssetsAccounts receivable
and other 420.6 189.9 46.3 (2.2) 654.6Recoverable from
reinsurers 2,519.2 1,629.0 40.4 (110.3) 4,078.3Portfolio
investments 1,313.8 1,113.5 497.5 – 2,924.8Deferred premium
acquisition costs – 10.6 0.1 – 10.7Future income taxes 697.7 98.9 0.7 – 797.3Premises and
equipment 0.7 7.8 – – 8.5Due from affiliates 122.2 43.3 – (71.0) 94.5Other assets – 14.9 – – 14.9Investments in
Fairfax affiliates 340.7 48.1 98.8 – 487.6
Total assets 5,414.9 3,156.0 683.8 (183.5) 9,071.2
LiabilitiesAccounts payable
and accruedliabilities 102.4 201.4 4.8 – 308.6
Securities sold butnot yet purchased 3.9 – – – 3.9
Due to affiliates – – 71.0 (71.0) –Funds withheld
payable toreinsurers 16.0 603.4 3.2 (2.2) 620.4
Provision for claims 3,926.4 2,078.6 385.4 (110.3) 6,280.1Unearned premiums 23.1 41.7 90.9 – 155.7
Total liabilities 4,071.8 2,925.1 555.3 (183.5) 7,368.7
Shareholders’equity 1,343.1 230.9 128.5 – 1,702.5
Total liabilities andshareholders’equity 5,414.9 3,156.0 683.8 (183.5) 9,071.2
78
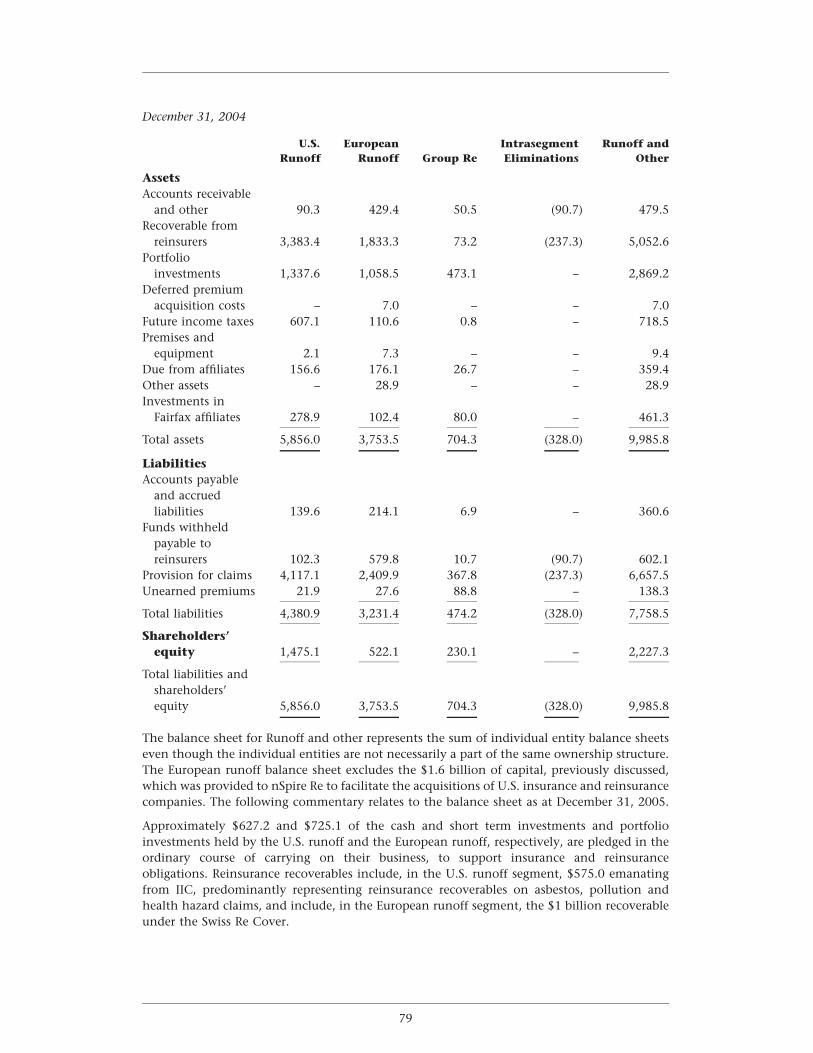
December 31, 2004
U.S. European Intrasegment Runoff andRunoff Runoff Group Re Eliminations Other
AssetsAccounts receivable
and other 90.3 429.4 50.5 (90.7) 479.5Recoverable from
reinsurers 3,383.4 1,833.3 73.2 (237.3) 5,052.6Portfolio
investments 1,337.6 1,058.5 473.1 – 2,869.2Deferred premium
acquisition costs – 7.0 – – 7.0Future income taxes 607.1 110.6 0.8 – 718.5Premises and
equipment 2.1 7.3 – – 9.4Due from affiliates 156.6 176.1 26.7 – 359.4Other assets – 28.9 – – 28.9Investments in
Fairfax affiliates 278.9 102.4 80.0 – 461.3
Total assets 5,856.0 3,753.5 704.3 (328.0) 9,985.8
LiabilitiesAccounts payable
and accruedliabilities 139.6 214.1 6.9 – 360.6
Funds withheldpayable toreinsurers 102.3 579.8 10.7 (90.7) 602.1
Provision for claims 4,117.1 2,409.9 367.8 (237.3) 6,657.5Unearned premiums 21.9 27.6 88.8 – 138.3
Total liabilities 4,380.9 3,231.4 474.2 (328.0) 7,758.5
Shareholders’equity 1,475.1 522.1 230.1 – 2,227.3
Total liabilities andshareholders’equity 5,856.0 3,753.5 704.3 (328.0) 9,985.8
The balance sheet for Runoff and other represents the sum of individual entity balance sheetseven though the individual entities are not necessarily a part of the same ownership structure.The European runoff balance sheet excludes the $1.6 billion of capital, previously discussed,which was provided to nSpire Re to facilitate the acquisitions of U.S. insurance and reinsurancecompanies. The following commentary relates to the balance sheet as at December 31, 2005.
Approximately $627.2 and $725.1 of the cash and short term investments and portfolioinvestments held by the U.S. runoff and the European runoff, respectively, are pledged in theordinary course of carrying on their business, to support insurance and reinsuranceobligations. Reinsurance recoverables include, in the U.S. runoff segment, $575.0 emanatingfrom IIC, predominantly representing reinsurance recoverables on asbestos, pollution andhealth hazard claims, and include, in the European runoff segment, the $1 billion recoverableunder the Swiss Re Cover.
79
FAIRFAX FINANCIAL HOLDINGS LIMITED
The $797.3 future income taxes asset consists of $697.7 in the U.S. runoff segment, $98.9 inthe European runoff segment, an $0.7 in Group Re. The $697.7 future income taxes asset onthe U.S. runoff balance sheet consists principally of $217.5 of capitalized U.S. operating lossesremaining available for use, approximately $163.4 of temporary differences and approximately$316.8 of capitalized U.S. operating losses which have already been used by other Fairfaxsubsidiaries within the U.S. consolidated tax return (and have therefore been eliminated in thepreparation of the consolidated balance sheet) but which remain with the U.S. runoffcompanies on a stand-alone basis. The unused portion of the future income taxes asset may berealized (as it has been in recent years) by filing a consolidated tax return whereby TIG’s netoperating loss carryforwards are available to offset taxable income at Crum & Forster,OdysseyRe and other Fairfax subsidiaries within the U.S. consolidated tax return.
Runoff and other’s investments in Fairfax affiliates consist of:
Affiliate % interest
OdysseyRe (TIG) 15.8Cunningham Lindsey (nSpire Re, CRC (Bermuda), TIG) 71.9Fairfax Asia (Wentworth) 56.0TRG Holdings (Class 1 shares) (nSpire Re/Wentworth) 47.4Fairmont (TIG) 100.0
Funds withheld payable to reinsurers at the European runoff includes $564.2, held in a trustaccount, under the Swiss Re Cover.
U.S. runoff’s consolidated GAAP shareholders’ equity of $1,343.1 as at December 31, 2005,shown in the balance sheet above, differs from TIG’s standalone statutory surplus of $597.3primarily because it includes future income taxes (TIG’s standalone $606.4 of the U.S. runoff’sconsolidated $697.7 of future income taxes) and the reinsurance recoverables which areeliminated from the statutory surplus pursuant to a statutory schedule F penalty ($99.9,principally reinsurance due from non-U.S. reinsurers which are not licensed in the UnitedStates).
Interest expense
Interest expense increased to $184.6 for the year ended December 31, 2005 compared to$163.4 in 2004, reflecting interest expense on the net additional debt issued by Fairfax during2004 and the OdysseyRe debt issued in the second quarter of 2005. Prior year interest expenseat Fairfax was reduced as a result of the release of deferred interest rate swap gains on thebuyback of debt discussed in note 7 to the consolidated financial statements. Increases ininterest expense in 2004 as compared to 2003 relate to the timing of debt issues at Crum &Forster and OdysseyRe. The interest expense comprises the following:
2005 2004 2003
Fairfax 121.7 104.6 115.0Crum & Forster 32.9 33.2 18.7OdysseyRe 30.0 25.6 12.7
184.6 163.4 146.4
Corporate overhead and other
Corporate overhead and other consists of the expenses of all of the group holding companiesnet of the company’s investment management and administration fees and investment
80
income on Fairfax’s cash, short term investments and marketable securities, and comprises thefollowing:
2005 2004 2003
Fairfax corporate overhead (net of investmentincome) 25.6 56.9 16.1
Investment management and administrationfees (55.8) (32.7) (36.5)
Corporate overhead of subsidiary holdingcompanies 44.5 31.9 18.2
Internet and technology expenses 2.8 9.6 19.1Other (8.7) 8.4 16.1
8.4 74.1 33.0
Corporate overhead in 2005 decreased at Fairfax from the prior year due to increasedinvestment income, and increased at the subsidiary holding companies due primarily toadditional professional fees, including for reviews pursuant to Sarbanes-Oxley, and personnelretirement costs. Investment management and administration fees increased due to the growthof investment assets and higher performance fees for investment management. Internet andtechnology expenses decreased in 2005 as over one-third of the revenues of MFX, thecompany’s technology subsidiary, were derived from a significant number of third partyclients.
Increases in 2004 corporate overhead as compared to 2003 related primarily to additionalprofessional fees, personnel retirement costs and the inclusion of charitable donations inoverhead.
Taxes
The company recorded an income tax recovery of $66.3 on its consolidated statement ofearnings in 2005 due to the significant losses in the year. This income tax benefit is lower thanmight be expected principally due to runoff losses incurred in jurisdictions with lower incometax rates, certain expenses which are not deductible for tax and certain runoff losses on whichno tax benefits have been recognized.
Non-controlling interests
The non-controlling interests on the company’s consolidated statements of earnings representthe public minority interests in the net income or loss of Northbridge, OdysseyRe andCunningham Lindsey, as summarized in the table below.
2005 2004 2003
Northbridge 66.7 48.5 12.4OdysseyRe (21.6) 36.2 56.3Cunningham Lindsey 1.3 (5.1) (4.2)
46.4 79.6 64.5
Non-controlling interests on the consolidated balance sheet as at December 31, 2005 representthe minority shareholders’ 40.8% share of the underlying net assets of Northbridge ($358.6),19.9% share of the underlying net assets of OdysseyRe ($371.5) and 19.0% share of theunderlying net assets of Cunningham Lindsey ($13.0). All of the assets and liabilities,including long term debt, of these companies are included in the company’s consolidatedbalance sheet.
81
FAIRFAX FINANCIAL HOLDINGS LIMITED
Provision for Claims
Since 1985, in order to ensure so far as possible that the company’s provision for claims (oftencalled ‘‘reserves’’) is adequate, management has established procedures so that the provisionfor claims at the company’s insurance, reinsurance and runoff operations are subject to severalreviews, including by one or more independent actuaries. The reserves are reviewed separatelyby, and must be acceptable to, internal actuaries at each operating company, the chief actuaryat Fairfax’s head office, and one or more independent actuaries, including an independentvaluation actuary whose report appears in each Annual Report.
In the ordinary course of carrying on their business, Fairfax’s insurance, reinsurance and runoffcompanies pledge their own assets as security for their own obligations to pay claims or tomake premium (and accrued interest) payments. Common situations where assets are sopledged, either directly, or to support letters of credit issued for the following purposes, areregulatory deposits (such as with states for workers’ compensation business), deposits of fundsat Lloyd’s in support of London market underwriting, and the provision of security as a non-admitted company, as security for claims assumed or to support funds withheld obligations.Generally, the pledged assets are released as the underlying payment obligation is fulfilled. The$2.2 billion of cash and investments pledged by the company’s subsidiaries, referred to innote 5 to the consolidated financial statements, has been pledged in the ordinary course ofbusiness to support the pledging subsidiary’s own obligations, as described in this paragraph(these pledges do not involve the cross-collateralization by one group company of anothergroup company’s obligations).
Claim provisions are established by the case method as claims are reported. The provisions aresubsequently adjusted as additional information on the estimated amount of a claim becomesknown during the course of its settlement. A provision is also made for management’scalculation of factors affecting the future development of claims including IBNR (incurred butnot reported) based on the volume of business currently in force and the historical experienceon claims.
As time passes, more information about the claims becomes known and provision estimates areconsequently adjusted upward or downward. Because of the estimation elements encompassedin this process, and the time it takes to settle many of the more substantial claims, several yearsare required before a meaningful comparison of actual losses to the original provisions can bedeveloped.
The development of the provision for claims is shown by the difference between estimates ofreserves as of the initial year-end and the re-estimated liability at each subsequent year-end.This is based on actual payments in full or partial settlement of claims, plus re-estimates of thereserves required for claims still open or claims still unreported. Favourable development(redundancies) means that subsequent reserve estimates are lower than originally indicated,while unfavourable development means that the original reserve estimates were lower than
82
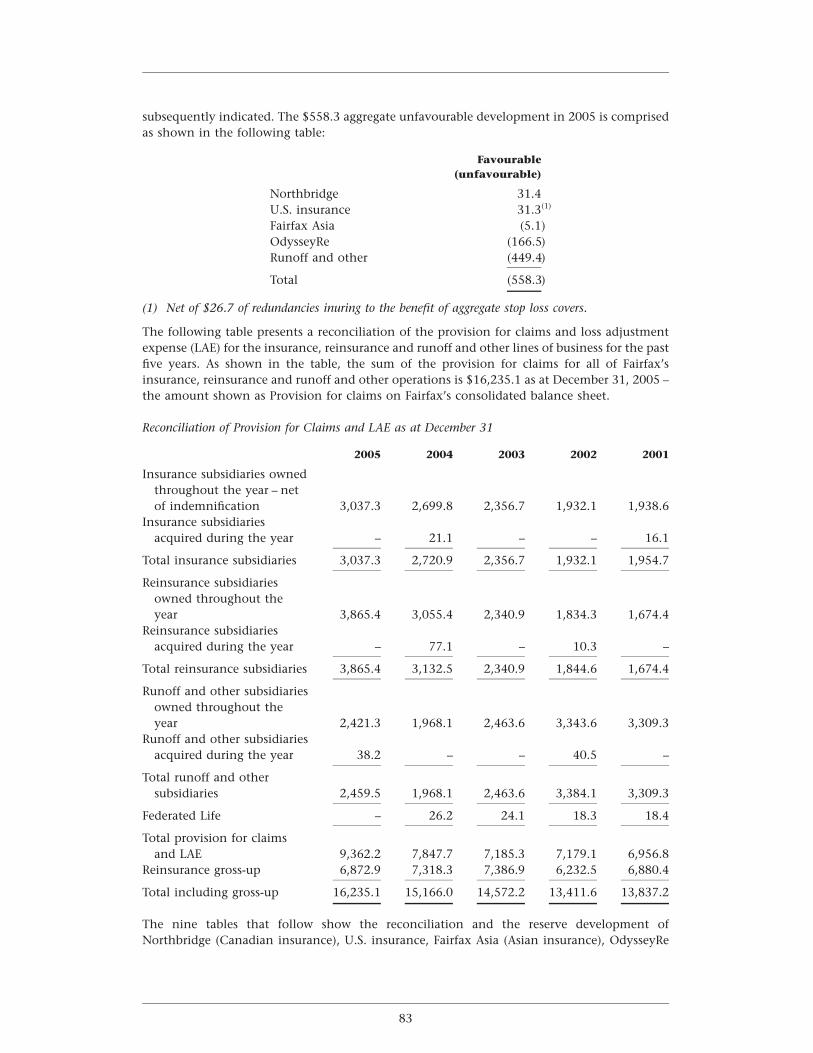
subsequently indicated. The $558.3 aggregate unfavourable development in 2005 is comprisedas shown in the following table:
Favourable(unfavourable)
Northbridge 31.4U.S. insurance 31.3(1)
Fairfax Asia (5.1)OdysseyRe (166.5)Runoff and other (449.4)
Total (558.3)
(1) Net of $26.7 of redundancies inuring to the benefit of aggregate stop loss covers.
The following table presents a reconciliation of the provision for claims and loss adjustmentexpense (LAE) for the insurance, reinsurance and runoff and other lines of business for the pastfive years. As shown in the table, the sum of the provision for claims for all of Fairfax’sinsurance, reinsurance and runoff and other operations is $16,235.1 as at December 31, 2005 –the amount shown as Provision for claims on Fairfax’s consolidated balance sheet.
Reconciliation of Provision for Claims and LAE as at December 31
2005 2004 2003 2002 2001
Insurance subsidiaries ownedthroughout the year – netof indemnification 3,037.3 2,699.8 2,356.7 1,932.1 1,938.6
Insurance subsidiariesacquired during the year – 21.1 – – 16.1
Total insurance subsidiaries 3,037.3 2,720.9 2,356.7 1,932.1 1,954.7
Reinsurance subsidiariesowned throughout theyear 3,865.4 3,055.4 2,340.9 1,834.3 1,674.4
Reinsurance subsidiariesacquired during the year – 77.1 – 10.3 –
Total reinsurance subsidiaries 3,865.4 3,132.5 2,340.9 1,844.6 1,674.4
Runoff and other subsidiariesowned throughout theyear 2,421.3 1,968.1 2,463.6 3,343.6 3,309.3
Runoff and other subsidiariesacquired during the year 38.2 – – 40.5 –
Total runoff and othersubsidiaries 2,459.5 1,968.1 2,463.6 3,384.1 3,309.3
Federated Life – 26.2 24.1 18.3 18.4
Total provision for claimsand LAE 9,362.2 7,847.7 7,185.3 7,179.1 6,956.8
Reinsurance gross-up 6,872.9 7,318.3 7,386.9 6,232.5 6,880.4
Total including gross-up 16,235.1 15,166.0 14,572.2 13,411.6 13,837.2
The nine tables that follow show the reconciliation and the reserve development ofNorthbridge (Canadian insurance), U.S. insurance, Fairfax Asia (Asian insurance), OdysseyRe
83
FAIRFAX FINANCIAL HOLDINGS LIMITED
(reinsurance) and Runoff and other’s net provision for claims. Because business is written invarious locations, there will necessarily be some distortions caused by foreign exchangefluctuations. The insurance operations’ tables are presented in Canadian dollars forNorthbridge (Canadian insurance) and in U.S. dollars for U.S. and Asian insurance. TheOdysseyRe (reinsurance) and Runoff and other tables are presented in U.S. dollars as thereinsurance and runoff businesses are substantially transacted in that currency.
In all cases, the company strives to establish adequate provisions at the original valuation date,so that if there is any development from the past, it will be favourable development. Thereserves will always be subject to upward or downward development in the future, and futuredevelopment could be significantly different from the past due to many unknown factors.
With regard to the four tables below showing claims reserve development, note that when inany year there is a redundancy or reserve strengthening for a prior year, the amount of thechange in favourable (unfavourable) development thereby reflected for that prior year is alsoreflected in the favourable (unfavourable) development for each year thereafter.
84
Canadian Insurance – Northbridge
The following table shows for Northbridge (excluding Federated Life, which was sold in 2005)the provision for claims liability for unpaid losses and LAE as originally and as currentlyestimated for the years 2001 through 2005. The favourable or unfavourable development fromprior years is credited or charged to each year’s earnings.
Reconciliation of Provision for Claims – Northbridge
2005 2004 2003 2002 2001(In Cdn $)
Provision for claims and LAE atJanuary 1 1,153.9 855.4 728.9 621.9 585.5
Incurred losses on claims and LAEProvision for current accident
year’s claims 825.9 736.3 619.6 525.5 456.0Foreign exchange effect on claims (5.8) (13.3) (27.2) (1.5) –Increase (decrease) in provision
for prior accident years’ claims (38.1) 15.0 19.2 8.2 32.4
Total incurred losses on claims andLAE 782.0 738.0 611.6 532.2 488.4
Payments for losses on claims andLAEPayments on current accident
year’s claims (248.1) (206.1) (211.4) (224.5) (228.3)Payments on prior accident years’
claims (279.1) (233.4) (273.7) (200.7) (223.7)
Total payments for losses on claimsand LAE (527.2) (439.5) (485.1) (425.2) (452.0)
Provision for claims and LAE atDecember 31 1,408.7 1,153.9 855.4 728.9 621.9
Exchange rate 0.8561 0.8347 0.7738 0.6330 0.6264Provision for claims and LAE at
December 31 converted toU.S. dollars 1,205.9 963.1 661.9 461.4 389.6
85
FAIRFAX FINANCIAL HOLDINGS LIMITED
The following table shows for Northbridge (excluding Federated Life, which was sold in 2005)the original provision for claims reserves including LAE at each calendar year-end commencingin 1995, the subsequent cumulative payments made from these years and the subsequent re-estimated amount of these reserves.
Provision for Northbridge’s Claims Reserve Development
As atDecember 31 1995 1996 1997 1998 1999 2000 2001 2002 2003 2004 2005
(In Cdn$)
Provision for claims including LAE 532.7 552.8 569.0 593.3 603.3 585.5 621.9 728.9 855.4 1,153.9 1,408.7
Cumulative payments as of:
One year later 178.8 195.0 193.5 196.8 218.9 223.7 200.7 273.7 233.4 279.1
Two years later 280.4 298.2 294.4 315.9 334.4 333.8 366.6 396.9 377.9
Three years later 348.1 369.6 377.0 393.3 417.8 458.2 451.4 500.1
Four years later 400.8 428.6 441.1 455.4 516.9 525.3 527.2
Five years later 437.5 470.3 487.2 533.1 566.7 573.9
Six years later 468.5 498.4 545.6 567.4 600.7
Seven years later 487.2 547.0 572.2 590.4
Eight years later 528.3 567.1 588.4
Nine years later 544.3 579.4
Ten years later 553.6
Reserves re-estimated as of:
One year later 516.1 550.3 561.5 573.9 596.7 617.9 630.1 724.8 864.8 1,114.6
Two years later 526.2 551.2 556.6 574.1 621.6 634.3 672.3 792.1 880.8
Three years later 528.7 552.2 561.0 593.3 638.0 673.9 721.8 812.2
Four years later 529.0 556.6 580.7 607.3 674.9 717.2 741.6
Five years later 528.5 567.2 592.3 644.6 711.8 724.5
Six years later 537.3 579.3 624.8 673.5 714.0
Seven years later 547.6 607.5 650.8 674.4
Eight years later 574.9 630.8 652.2
Nine years later 596.0 631.8
Ten years later 596.6
Favourable (unfavourable)
development (63.9) (79.0) (83.2) (81.1) (110.7) (139.0) (119.7) (83.3) (25.4) 39.3
(Amounts in this paragraph are in Canadian dollars.) The strengthening of the Canadian dollaragainst the U.S. dollar during 2005 had a favourable impact of $5.8 (of which $1.2 related toprior years) on Commonwealth’s (and thus Northbridge’s) reserves. Excluding the currencytranslation effect, Northbridge experienced $38.1 in favourable reserve development during2005. The net amount of $38.1 is comprised of favourable reserve development at Lombard($7.9), Federated ($1.8), Markel ($2.7) and Commonwealth ($25.7). The favourabledevelopment relates generally to better than expected development on property lines in themost recent accident years.
As shown in Northbridge’s annual report, on an accident year basis (under which all claimsattribute back to the year of loss, regardless of when they are reported or adjusted),Northbridge’s annual weighted average reserve development during the last ten accident yearshas been favourable (redundant) by 4.8%.
86
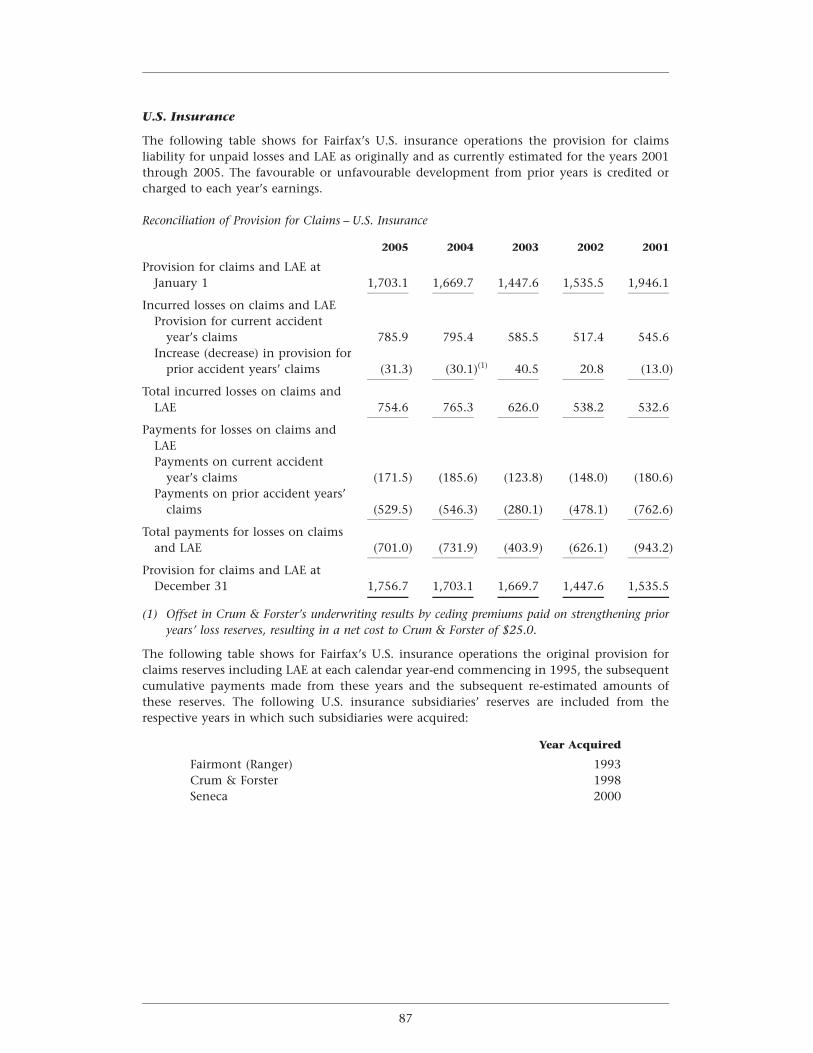
U.S. Insurance
The following table shows for Fairfax’s U.S. insurance operations the provision for claimsliability for unpaid losses and LAE as originally and as currently estimated for the years 2001through 2005. The favourable or unfavourable development from prior years is credited orcharged to each year’s earnings.
Reconciliation of Provision for Claims – U.S. Insurance
2005 2004 2003 2002 2001
Provision for claims and LAE atJanuary 1 1,703.1 1,669.7 1,447.6 1,535.5 1,946.1
Incurred losses on claims and LAEProvision for current accident
year’s claims 785.9 795.4 585.5 517.4 545.6Increase (decrease) in provision for
prior accident years’ claims (31.3) (30.1)(1) 40.5 20.8 (13.0)
Total incurred losses on claims andLAE 754.6 765.3 626.0 538.2 532.6
Payments for losses on claims andLAEPayments on current accident
year’s claims (171.5) (185.6) (123.8) (148.0) (180.6)Payments on prior accident years’
claims (529.5) (546.3) (280.1) (478.1) (762.6)
Total payments for losses on claimsand LAE (701.0) (731.9) (403.9) (626.1) (943.2)
Provision for claims and LAE atDecember 31 1,756.7 1,703.1 1,669.7 1,447.6 1,535.5
(1) Offset in Crum & Forster’s underwriting results by ceding premiums paid on strengthening prioryears’ loss reserves, resulting in a net cost to Crum & Forster of $25.0.
The following table shows for Fairfax’s U.S. insurance operations the original provision forclaims reserves including LAE at each calendar year-end commencing in 1995, the subsequentcumulative payments made from these years and the subsequent re-estimated amounts ofthese reserves. The following U.S. insurance subsidiaries’ reserves are included from therespective years in which such subsidiaries were acquired:
Year Acquired
Fairmont (Ranger) 1993Crum & Forster 1998Seneca 2000
87
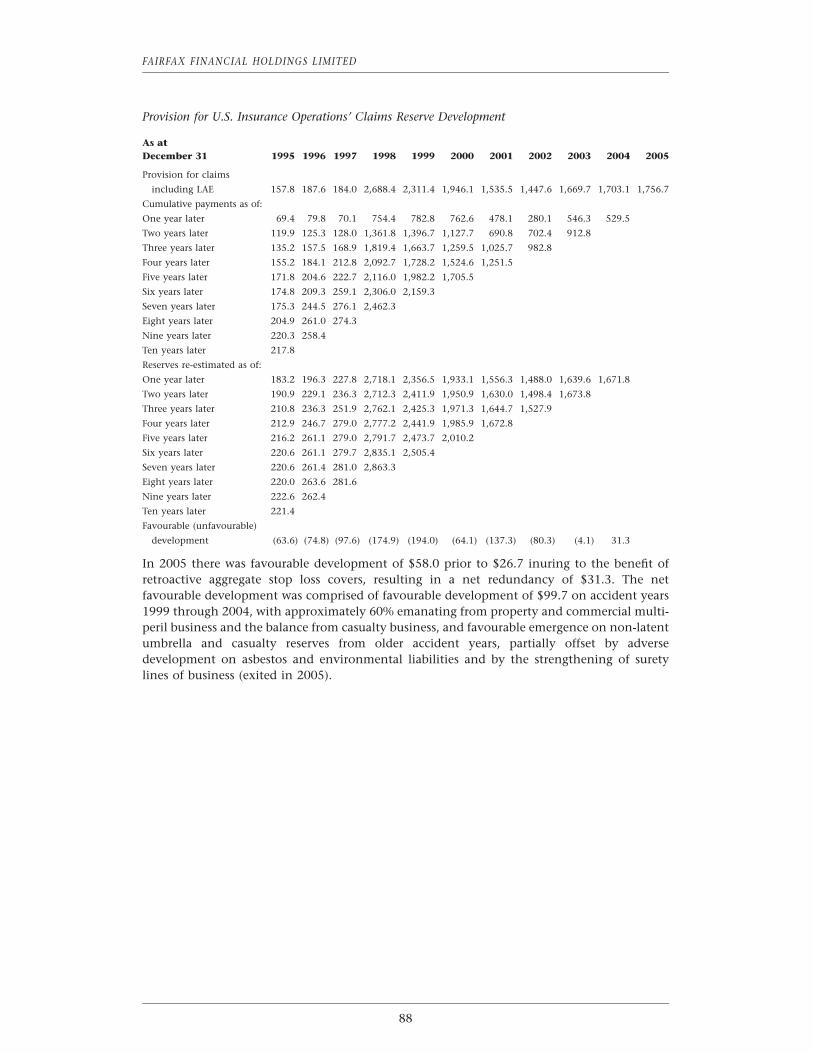
FAIRFAX FINANCIAL HOLDINGS LIMITED
Provision for U.S. Insurance Operations’ Claims Reserve Development
As atDecember 31 1995 1996 1997 1998 1999 2000 2001 2002 2003 2004 2005
Provision for claims
including LAE 157.8 187.6 184.0 2,688.4 2,311.4 1,946.1 1,535.5 1,447.6 1,669.7 1,703.1 1,756.7
Cumulative payments as of:
One year later 69.4 79.8 70.1 754.4 782.8 762.6 478.1 280.1 546.3 529.5
Two years later 119.9 125.3 128.0 1,361.8 1,396.7 1,127.7 690.8 702.4 912.8
Three years later 135.2 157.5 168.9 1,819.4 1,663.7 1,259.5 1,025.7 982.8
Four years later 155.2 184.1 212.8 2,092.7 1,728.2 1,524.6 1,251.5
Five years later 171.8 204.6 222.7 2,116.0 1,982.2 1,705.5
Six years later 174.8 209.3 259.1 2,306.0 2,159.3
Seven years later 175.3 244.5 276.1 2,462.3
Eight years later 204.9 261.0 274.3
Nine years later 220.3 258.4
Ten years later 217.8
Reserves re-estimated as of:
One year later 183.2 196.3 227.8 2,718.1 2,356.5 1,933.1 1,556.3 1,488.0 1,639.6 1,671.8
Two years later 190.9 229.1 236.3 2,712.3 2,411.9 1,950.9 1,630.0 1,498.4 1,673.8
Three years later 210.8 236.3 251.9 2,762.1 2,425.3 1,971.3 1,644.7 1,527.9
Four years later 212.9 246.7 279.0 2,777.2 2,441.9 1,985.9 1,672.8
Five years later 216.2 261.1 279.0 2,791.7 2,473.7 2,010.2
Six years later 220.6 261.1 279.7 2,835.1 2,505.4
Seven years later 220.6 261.4 281.0 2,863.3
Eight years later 220.0 263.6 281.6
Nine years later 222.6 262.4
Ten years later 221.4
Favourable (unfavourable)
development (63.6) (74.8) (97.6) (174.9) (194.0) (64.1) (137.3) (80.3) (4.1) 31.3
In 2005 there was favourable development of $58.0 prior to $26.7 inuring to the benefit ofretroactive aggregate stop loss covers, resulting in a net redundancy of $31.3. The netfavourable development was comprised of favourable development of $99.7 on accident years1999 through 2004, with approximately 60% emanating from property and commercial multi-peril business and the balance from casualty business, and favourable emergence on non-latentumbrella and casualty reserves from older accident years, partially offset by adversedevelopment on asbestos and environmental liabilities and by the strengthening of suretylines of business (exited in 2005).
88
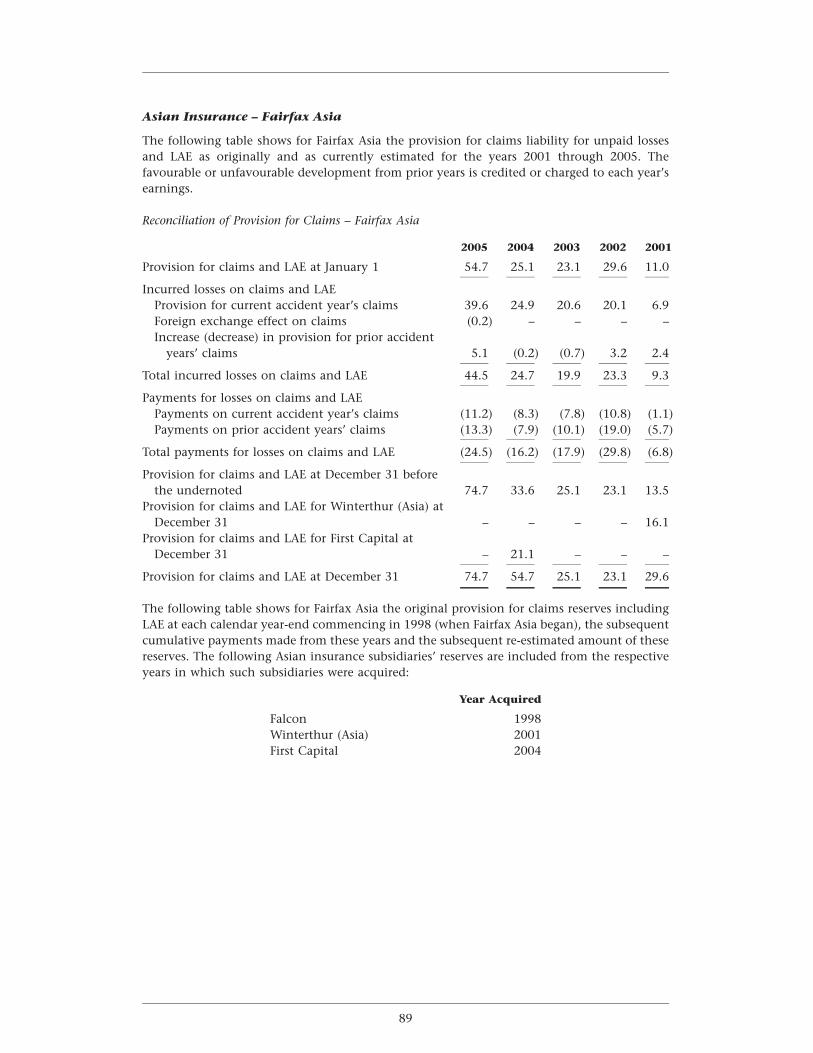
Asian Insurance – Fairfax Asia
The following table shows for Fairfax Asia the provision for claims liability for unpaid lossesand LAE as originally and as currently estimated for the years 2001 through 2005. Thefavourable or unfavourable development from prior years is credited or charged to each year’searnings.
Reconciliation of Provision for Claims – Fairfax Asia
2005 2004 2003 2002 2001
Provision for claims and LAE at January 1 54.7 25.1 23.1 29.6 11.0
Incurred losses on claims and LAEProvision for current accident year’s claims 39.6 24.9 20.6 20.1 6.9Foreign exchange effect on claims (0.2) – – – –Increase (decrease) in provision for prior accident
years’ claims 5.1 (0.2) (0.7) 3.2 2.4
Total incurred losses on claims and LAE 44.5 24.7 19.9 23.3 9.3
Payments for losses on claims and LAEPayments on current accident year’s claims (11.2) (8.3) (7.8) (10.8) (1.1)Payments on prior accident years’ claims (13.3) (7.9) (10.1) (19.0) (5.7)
Total payments for losses on claims and LAE (24.5) (16.2) (17.9) (29.8) (6.8)
Provision for claims and LAE at December 31 beforethe undernoted 74.7 33.6 25.1 23.1 13.5
Provision for claims and LAE for Winterthur (Asia) atDecember 31 – – – – 16.1
Provision for claims and LAE for First Capital atDecember 31 – 21.1 – – –
Provision for claims and LAE at December 31 74.7 54.7 25.1 23.1 29.6
The following table shows for Fairfax Asia the original provision for claims reserves includingLAE at each calendar year-end commencing in 1998 (when Fairfax Asia began), the subsequentcumulative payments made from these years and the subsequent re-estimated amount of thesereserves. The following Asian insurance subsidiaries’ reserves are included from the respectiveyears in which such subsidiaries were acquired:
Year Acquired
Falcon 1998Winterthur (Asia) 2001First Capital 2004
89
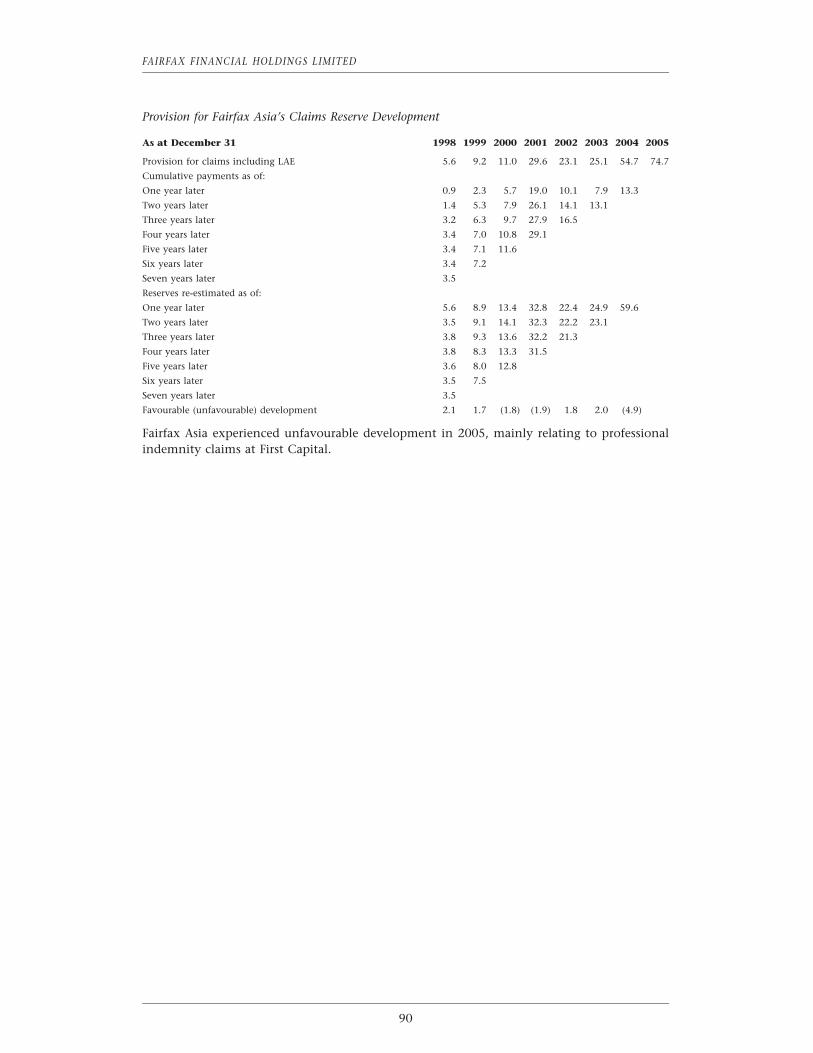
FAIRFAX FINANCIAL HOLDINGS LIMITED
Provision for Fairfax Asia’s Claims Reserve Development
As at December 31 1998 1999 2000 2001 2002 2003 2004 2005
Provision for claims including LAE 5.6 9.2 11.0 29.6 23.1 25.1 54.7 74.7
Cumulative payments as of:
One year later 0.9 2.3 5.7 19.0 10.1 7.9 13.3
Two years later 1.4 5.3 7.9 26.1 14.1 13.1
Three years later 3.2 6.3 9.7 27.9 16.5
Four years later 3.4 7.0 10.8 29.1
Five years later 3.4 7.1 11.6
Six years later 3.4 7.2
Seven years later 3.5
Reserves re-estimated as of:
One year later 5.6 8.9 13.4 32.8 22.4 24.9 59.6
Two years later 3.5 9.1 14.1 32.3 22.2 23.1
Three years later 3.8 9.3 13.6 32.2 21.3
Four years later 3.8 8.3 13.3 31.5
Five years later 3.6 8.0 12.8
Six years later 3.5 7.5
Seven years later 3.5
Favourable (unfavourable) development 2.1 1.7 (1.8) (1.9) 1.8 2.0 (4.9)
Fairfax Asia experienced unfavourable development in 2005, mainly relating to professionalindemnity claims at First Capital.
90
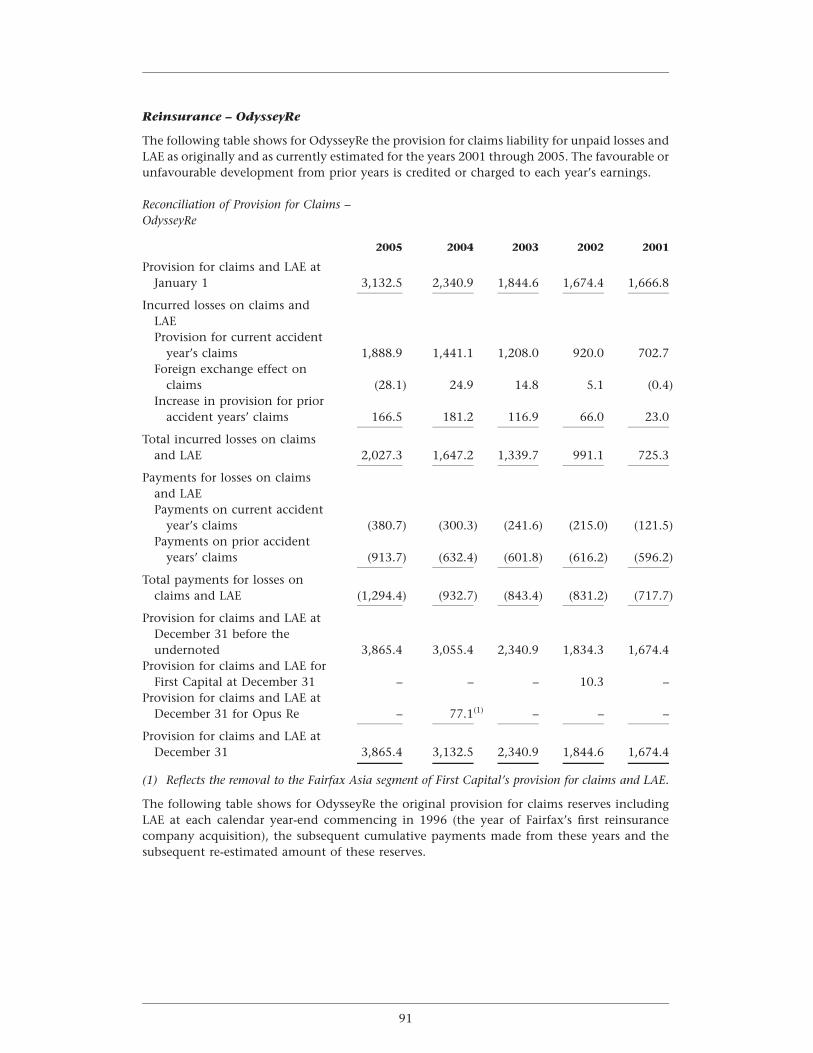
Reinsurance – OdysseyRe
The following table shows for OdysseyRe the provision for claims liability for unpaid losses andLAE as originally and as currently estimated for the years 2001 through 2005. The favourable orunfavourable development from prior years is credited or charged to each year’s earnings.
Reconciliation of Provision for Claims –OdysseyRe
2005 2004 2003 2002 2001
Provision for claims and LAE atJanuary 1 3,132.5 2,340.9 1,844.6 1,674.4 1,666.8
Incurred losses on claims andLAEProvision for current accident
year’s claims 1,888.9 1,441.1 1,208.0 920.0 702.7Foreign exchange effect on
claims (28.1) 24.9 14.8 5.1 (0.4)Increase in provision for prior
accident years’ claims 166.5 181.2 116.9 66.0 23.0
Total incurred losses on claimsand LAE 2,027.3 1,647.2 1,339.7 991.1 725.3
Payments for losses on claimsand LAEPayments on current accident
year’s claims (380.7) (300.3) (241.6) (215.0) (121.5)Payments on prior accident
years’ claims (913.7) (632.4) (601.8) (616.2) (596.2)
Total payments for losses onclaims and LAE (1,294.4) (932.7) (843.4) (831.2) (717.7)
Provision for claims and LAE atDecember 31 before theundernoted 3,865.4 3,055.4 2,340.9 1,834.3 1,674.4
Provision for claims and LAE forFirst Capital at December 31 – – – 10.3 –
Provision for claims and LAE atDecember 31 for Opus Re – 77.1(1) – – –
Provision for claims and LAE atDecember 31 3,865.4 3,132.5 2,340.9 1,844.6 1,674.4
(1) Reflects the removal to the Fairfax Asia segment of First Capital’s provision for claims and LAE.
The following table shows for OdysseyRe the original provision for claims reserves includingLAE at each calendar year-end commencing in 1996 (the year of Fairfax’s first reinsurancecompany acquisition), the subsequent cumulative payments made from these years and thesubsequent re-estimated amount of these reserves.
91
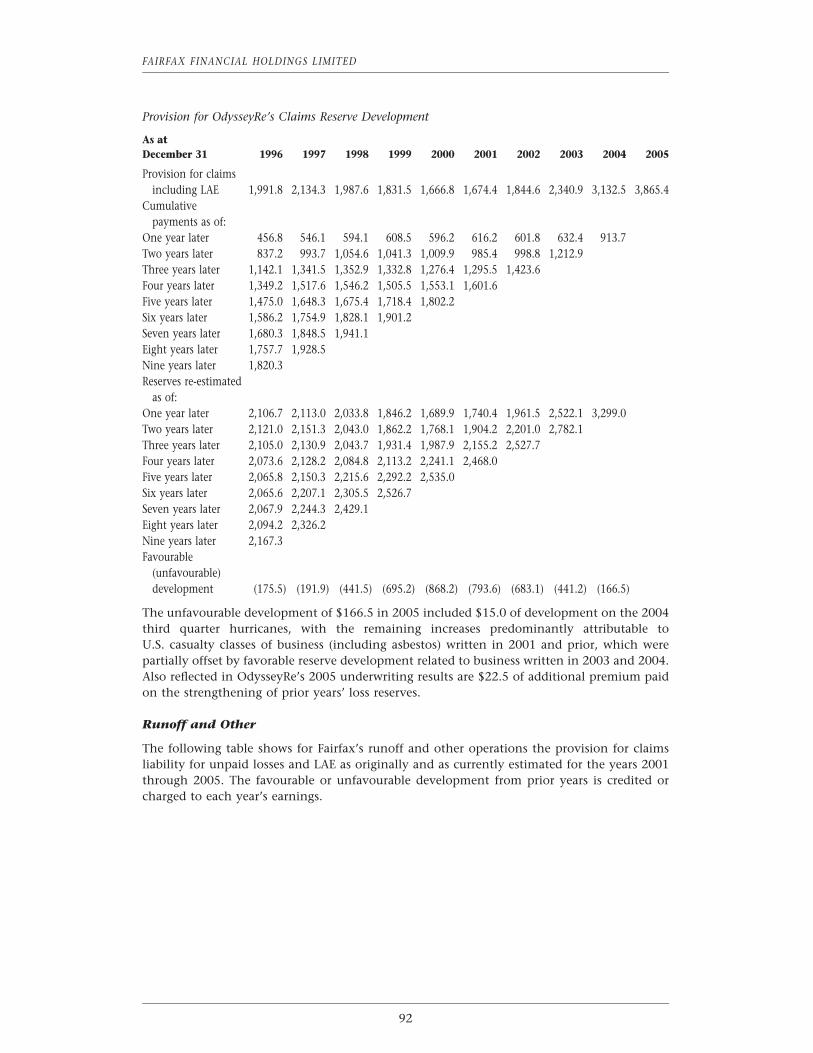
FAIRFAX FINANCIAL HOLDINGS LIMITED
Provision for OdysseyRe’s Claims Reserve Development
As atDecember 31 1996 1997 1998 1999 2000 2001 2002 2003 2004 2005
Provision for claimsincluding LAE 1,991.8 2,134.3 1,987.6 1,831.5 1,666.8 1,674.4 1,844.6 2,340.9 3,132.5 3,865.4
Cumulativepayments as of:
One year later 456.8 546.1 594.1 608.5 596.2 616.2 601.8 632.4 913.7Two years later 837.2 993.7 1,054.6 1,041.3 1,009.9 985.4 998.8 1,212.9Three years later 1,142.1 1,341.5 1,352.9 1,332.8 1,276.4 1,295.5 1,423.6Four years later 1,349.2 1,517.6 1,546.2 1,505.5 1,553.1 1,601.6Five years later 1,475.0 1,648.3 1,675.4 1,718.4 1,802.2Six years later 1,586.2 1,754.9 1,828.1 1,901.2Seven years later 1,680.3 1,848.5 1,941.1Eight years later 1,757.7 1,928.5Nine years later 1,820.3Reserves re-estimated
as of:One year later 2,106.7 2,113.0 2,033.8 1,846.2 1,689.9 1,740.4 1,961.5 2,522.1 3,299.0Two years later 2,121.0 2,151.3 2,043.0 1,862.2 1,768.1 1,904.2 2,201.0 2,782.1Three years later 2,105.0 2,130.9 2,043.7 1,931.4 1,987.9 2,155.2 2,527.7Four years later 2,073.6 2,128.2 2,084.8 2,113.2 2,241.1 2,468.0Five years later 2,065.8 2,150.3 2,215.6 2,292.2 2,535.0Six years later 2,065.6 2,207.1 2,305.5 2,526.7Seven years later 2,067.9 2,244.3 2,429.1Eight years later 2,094.2 2,326.2Nine years later 2,167.3Favourable
(unfavourable)development (175.5) (191.9) (441.5) (695.2) (868.2) (793.6) (683.1) (441.2) (166.5)
The unfavourable development of $166.5 in 2005 included $15.0 of development on the 2004third quarter hurricanes, with the remaining increases predominantly attributable toU.S. casualty classes of business (including asbestos) written in 2001 and prior, which werepartially offset by favorable reserve development related to business written in 2003 and 2004.Also reflected in OdysseyRe’s 2005 underwriting results are $22.5 of additional premium paidon the strengthening of prior years’ loss reserves.
Runoff and Other
The following table shows for Fairfax’s runoff and other operations the provision for claimsliability for unpaid losses and LAE as originally and as currently estimated for the years 2001through 2005. The favourable or unfavourable development from prior years is credited orcharged to each year’s earnings.
92
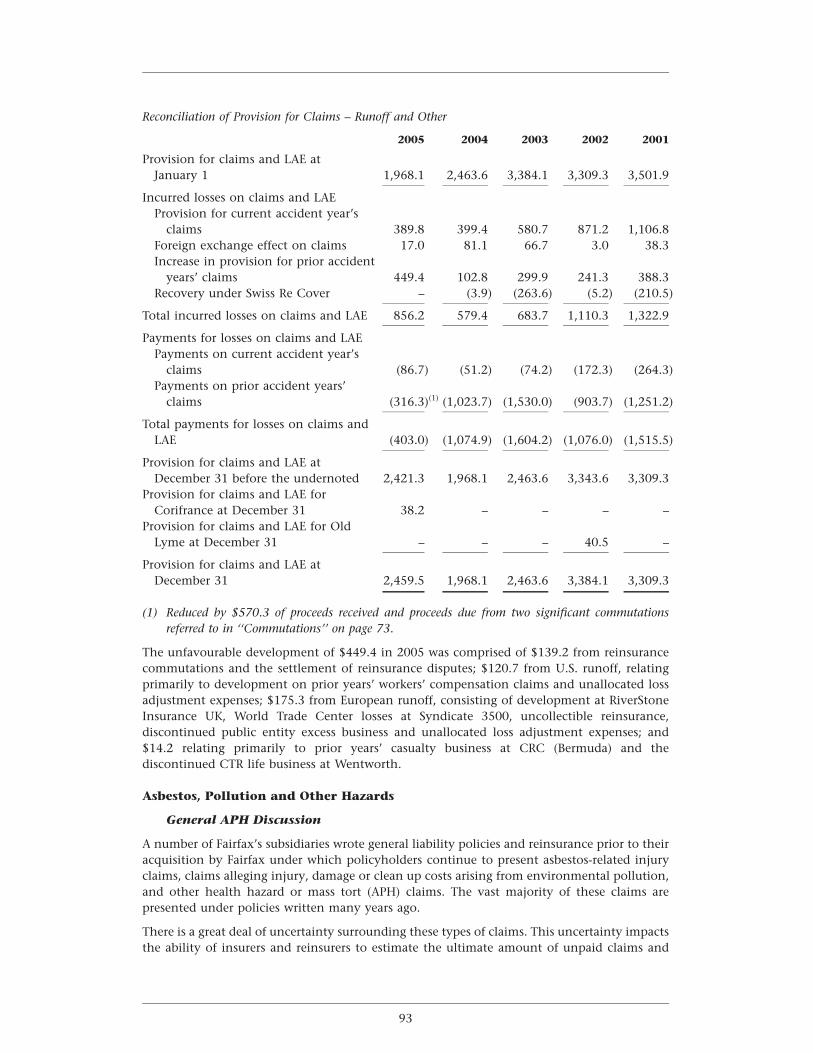
Reconciliation of Provision for Claims – Runoff and Other
2005 2004 2003 2002 2001
Provision for claims and LAE atJanuary 1 1,968.1 2,463.6 3,384.1 3,309.3 3,501.9
Incurred losses on claims and LAEProvision for current accident year’s
claims 389.8 399.4 580.7 871.2 1,106.8Foreign exchange effect on claims 17.0 81.1 66.7 3.0 38.3Increase in provision for prior accident
years’ claims 449.4 102.8 299.9 241.3 388.3Recovery under Swiss Re Cover – (3.9) (263.6) (5.2) (210.5)
Total incurred losses on claims and LAE 856.2 579.4 683.7 1,110.3 1,322.9
Payments for losses on claims and LAEPayments on current accident year’s
claims (86.7) (51.2) (74.2) (172.3) (264.3)Payments on prior accident years’
claims (316.3)(1) (1,023.7) (1,530.0) (903.7) (1,251.2)
Total payments for losses on claims andLAE (403.0) (1,074.9) (1,604.2) (1,076.0) (1,515.5)
Provision for claims and LAE atDecember 31 before the undernoted 2,421.3 1,968.1 2,463.6 3,343.6 3,309.3
Provision for claims and LAE forCorifrance at December 31 38.2 – – – –
Provision for claims and LAE for OldLyme at December 31 – – – 40.5 –
Provision for claims and LAE atDecember 31 2,459.5 1,968.1 2,463.6 3,384.1 3,309.3
(1) Reduced by $570.3 of proceeds received and proceeds due from two significant commutationsreferred to in ‘‘Commutations’’ on page 73.
The unfavourable development of $449.4 in 2005 was comprised of $139.2 from reinsurancecommutations and the settlement of reinsurance disputes; $120.7 from U.S. runoff, relatingprimarily to development on prior years’ workers’ compensation claims and unallocated lossadjustment expenses; $175.3 from European runoff, consisting of development at RiverStoneInsurance UK, World Trade Center losses at Syndicate 3500, uncollectible reinsurance,discontinued public entity excess business and unallocated loss adjustment expenses; and$14.2 relating primarily to prior years’ casualty business at CRC (Bermuda) and thediscontinued CTR life business at Wentworth.
Asbestos, Pollution and Other Hazards
General APH Discussion
A number of Fairfax’s subsidiaries wrote general liability policies and reinsurance prior to theiracquisition by Fairfax under which policyholders continue to present asbestos-related injuryclaims, claims alleging injury, damage or clean up costs arising from environmental pollution,and other health hazard or mass tort (APH) claims. The vast majority of these claims arepresented under policies written many years ago.
There is a great deal of uncertainty surrounding these types of claims. This uncertainty impactsthe ability of insurers and reinsurers to estimate the ultimate amount of unpaid claims and
93
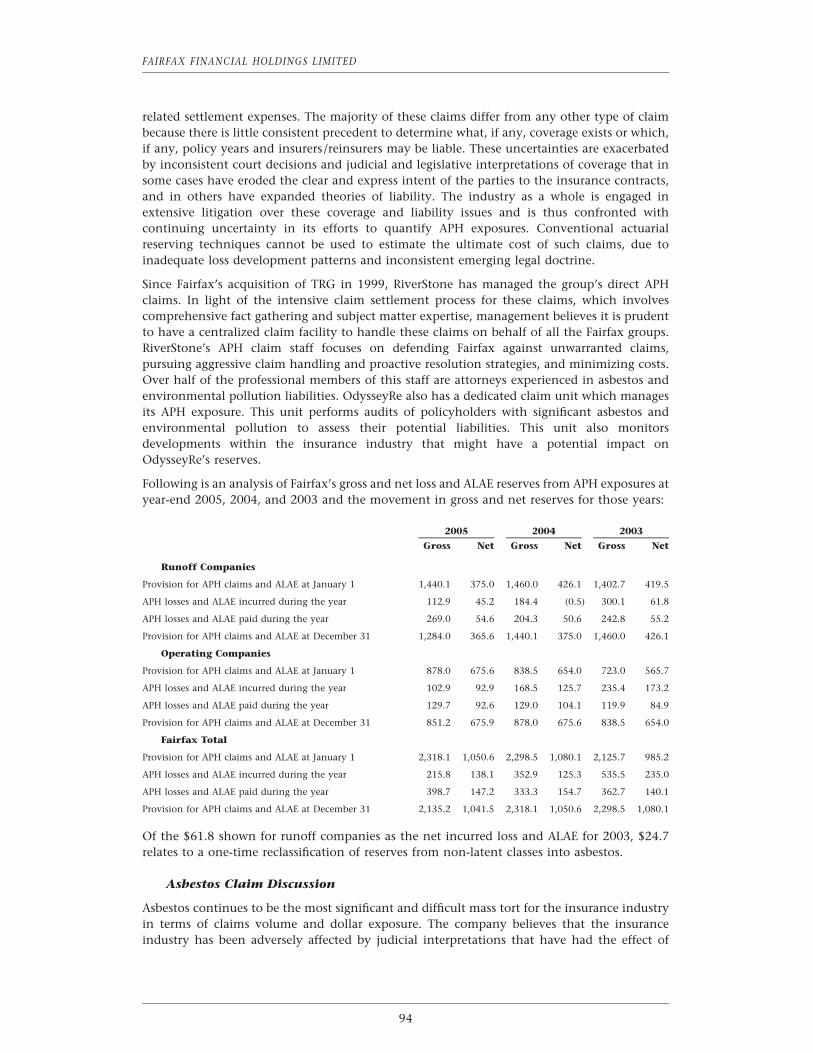
FAIRFAX FINANCIAL HOLDINGS LIMITED
related settlement expenses. The majority of these claims differ from any other type of claimbecause there is little consistent precedent to determine what, if any, coverage exists or which,if any, policy years and insurers/reinsurers may be liable. These uncertainties are exacerbatedby inconsistent court decisions and judicial and legislative interpretations of coverage that insome cases have eroded the clear and express intent of the parties to the insurance contracts,and in others have expanded theories of liability. The industry as a whole is engaged inextensive litigation over these coverage and liability issues and is thus confronted withcontinuing uncertainty in its efforts to quantify APH exposures. Conventional actuarialreserving techniques cannot be used to estimate the ultimate cost of such claims, due toinadequate loss development patterns and inconsistent emerging legal doctrine.
Since Fairfax’s acquisition of TRG in 1999, RiverStone has managed the group’s direct APHclaims. In light of the intensive claim settlement process for these claims, which involvescomprehensive fact gathering and subject matter expertise, management believes it is prudentto have a centralized claim facility to handle these claims on behalf of all the Fairfax groups.RiverStone’s APH claim staff focuses on defending Fairfax against unwarranted claims,pursuing aggressive claim handling and proactive resolution strategies, and minimizing costs.Over half of the professional members of this staff are attorneys experienced in asbestos andenvironmental pollution liabilities. OdysseyRe also has a dedicated claim unit which managesits APH exposure. This unit performs audits of policyholders with significant asbestos andenvironmental pollution to assess their potential liabilities. This unit also monitorsdevelopments within the insurance industry that might have a potential impact onOdysseyRe’s reserves.
Following is an analysis of Fairfax’s gross and net loss and ALAE reserves from APH exposures atyear-end 2005, 2004, and 2003 and the movement in gross and net reserves for those years:
2005 2004 2003
Gross Net Gross Net Gross Net
Runoff Companies
Provision for APH claims and ALAE at January 1 1,440.1 375.0 1,460.0 426.1 1,402.7 419.5
APH losses and ALAE incurred during the year 112.9 45.2 184.4 (0.5) 300.1 61.8
APH losses and ALAE paid during the year 269.0 54.6 204.3 50.6 242.8 55.2
Provision for APH claims and ALAE at December 31 1,284.0 365.6 1,440.1 375.0 1,460.0 426.1
Operating Companies
Provision for APH claims and ALAE at January 1 878.0 675.6 838.5 654.0 723.0 565.7
APH losses and ALAE incurred during the year 102.9 92.9 168.5 125.7 235.4 173.2
APH losses and ALAE paid during the year 129.7 92.6 129.0 104.1 119.9 84.9
Provision for APH claims and ALAE at December 31 851.2 675.9 878.0 675.6 838.5 654.0
Fairfax Total
Provision for APH claims and ALAE at January 1 2,318.1 1,050.6 2,298.5 1,080.1 2,125.7 985.2
APH losses and ALAE incurred during the year 215.8 138.1 352.9 125.3 535.5 235.0
APH losses and ALAE paid during the year 398.7 147.2 333.3 154.7 362.7 140.1
Provision for APH claims and ALAE at December 31 2,135.2 1,041.5 2,318.1 1,050.6 2,298.5 1,080.1
Of the $61.8 shown for runoff companies as the net incurred loss and ALAE for 2003, $24.7relates to a one-time reclassification of reserves from non-latent classes into asbestos.
Asbestos Claim Discussion
Asbestos continues to be the most significant and difficult mass tort for the insurance industryin terms of claims volume and dollar exposure. The company believes that the insuranceindustry has been adversely affected by judicial interpretations that have had the effect of
94
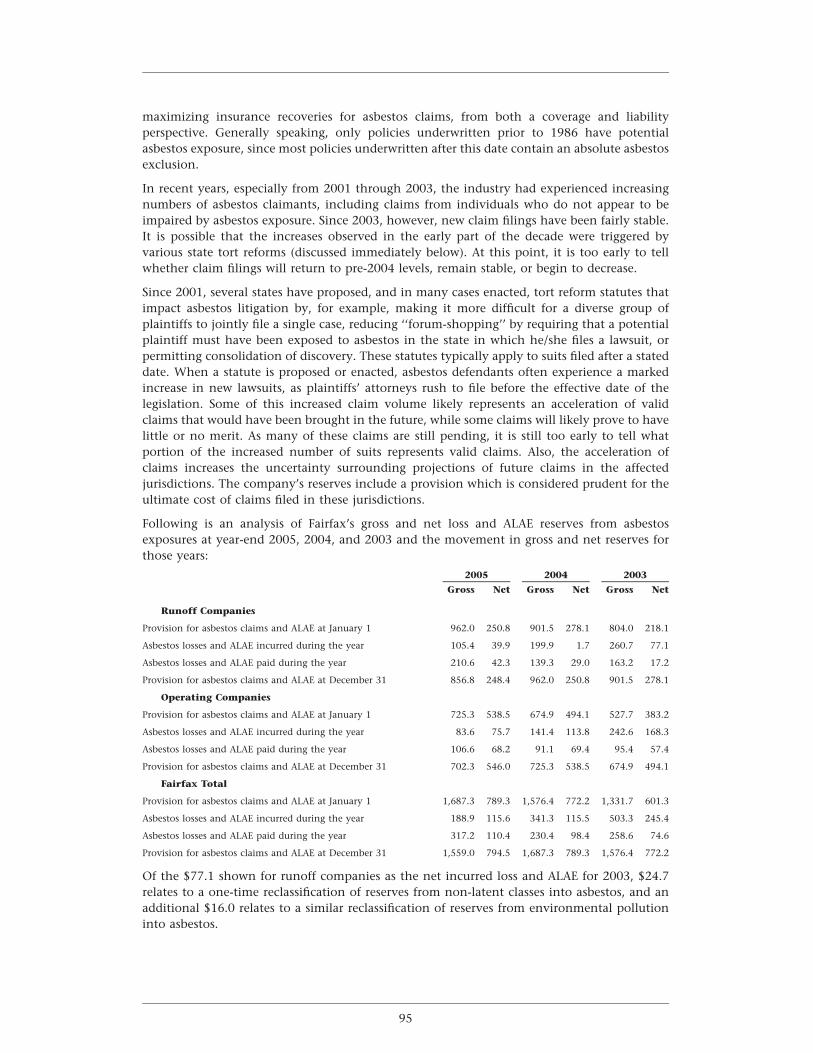
maximizing insurance recoveries for asbestos claims, from both a coverage and liabilityperspective. Generally speaking, only policies underwritten prior to 1986 have potentialasbestos exposure, since most policies underwritten after this date contain an absolute asbestosexclusion.
In recent years, especially from 2001 through 2003, the industry had experienced increasingnumbers of asbestos claimants, including claims from individuals who do not appear to beimpaired by asbestos exposure. Since 2003, however, new claim filings have been fairly stable.It is possible that the increases observed in the early part of the decade were triggered byvarious state tort reforms (discussed immediately below). At this point, it is too early to tellwhether claim filings will return to pre-2004 levels, remain stable, or begin to decrease.
Since 2001, several states have proposed, and in many cases enacted, tort reform statutes thatimpact asbestos litigation by, for example, making it more difficult for a diverse group ofplaintiffs to jointly file a single case, reducing ‘‘forum-shopping’’ by requiring that a potentialplaintiff must have been exposed to asbestos in the state in which he/she files a lawsuit, orpermitting consolidation of discovery. These statutes typically apply to suits filed after a stateddate. When a statute is proposed or enacted, asbestos defendants often experience a markedincrease in new lawsuits, as plaintiffs’ attorneys rush to file before the effective date of thelegislation. Some of this increased claim volume likely represents an acceleration of validclaims that would have been brought in the future, while some claims will likely prove to havelittle or no merit. As many of these claims are still pending, it is still too early to tell whatportion of the increased number of suits represents valid claims. Also, the acceleration ofclaims increases the uncertainty surrounding projections of future claims in the affectedjurisdictions. The company’s reserves include a provision which is considered prudent for theultimate cost of claims filed in these jurisdictions.
Following is an analysis of Fairfax’s gross and net loss and ALAE reserves from asbestosexposures at year-end 2005, 2004, and 2003 and the movement in gross and net reserves forthose years:
2005 2004 2003
Gross Net Gross Net Gross Net
Runoff Companies
Provision for asbestos claims and ALAE at January 1 962.0 250.8 901.5 278.1 804.0 218.1
Asbestos losses and ALAE incurred during the year 105.4 39.9 199.9 1.7 260.7 77.1
Asbestos losses and ALAE paid during the year 210.6 42.3 139.3 29.0 163.2 17.2
Provision for asbestos claims and ALAE at December 31 856.8 248.4 962.0 250.8 901.5 278.1
Operating Companies
Provision for asbestos claims and ALAE at January 1 725.3 538.5 674.9 494.1 527.7 383.2
Asbestos losses and ALAE incurred during the year 83.6 75.7 141.4 113.8 242.6 168.3
Asbestos losses and ALAE paid during the year 106.6 68.2 91.1 69.4 95.4 57.4
Provision for asbestos claims and ALAE at December 31 702.3 546.0 725.3 538.5 674.9 494.1
Fairfax Total
Provision for asbestos claims and ALAE at January 1 1,687.3 789.3 1,576.4 772.2 1,331.7 601.3
Asbestos losses and ALAE incurred during the year 188.9 115.6 341.3 115.5 503.3 245.4
Asbestos losses and ALAE paid during the year 317.2 110.4 230.4 98.4 258.6 74.6
Provision for asbestos claims and ALAE at December 31 1,559.0 794.5 1,687.3 789.3 1,576.4 772.2
Of the $77.1 shown for runoff companies as the net incurred loss and ALAE for 2003, $24.7relates to a one-time reclassification of reserves from non-latent classes into asbestos, and anadditional $16.0 relates to a similar reclassification of reserves from environmental pollutioninto asbestos.
95
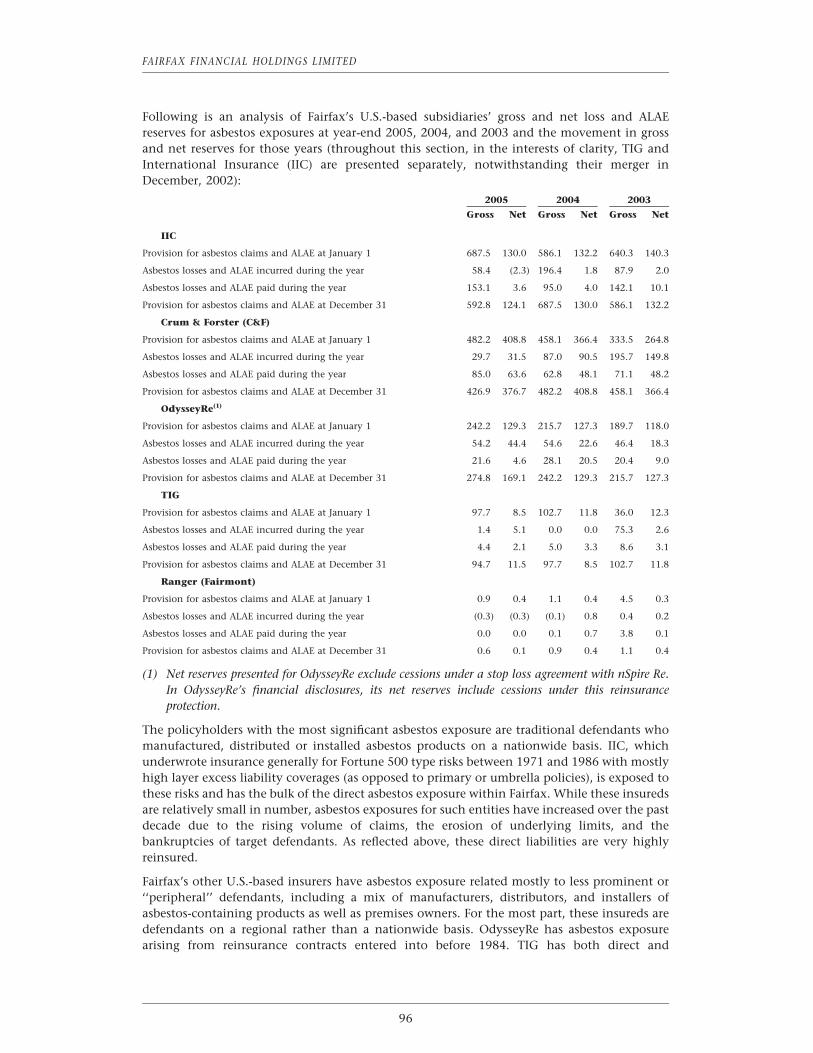
FAIRFAX FINANCIAL HOLDINGS LIMITED
Following is an analysis of Fairfax’s U.S.-based subsidiaries’ gross and net loss and ALAEreserves for asbestos exposures at year-end 2005, 2004, and 2003 and the movement in grossand net reserves for those years (throughout this section, in the interests of clarity, TIG andInternational Insurance (IIC) are presented separately, notwithstanding their merger inDecember, 2002):
2005 2004 2003
Gross Net Gross Net Gross Net
IIC
Provision for asbestos claims and ALAE at January 1 687.5 130.0 586.1 132.2 640.3 140.3
Asbestos losses and ALAE incurred during the year 58.4 (2.3) 196.4 1.8 87.9 2.0
Asbestos losses and ALAE paid during the year 153.1 3.6 95.0 4.0 142.1 10.1
Provision for asbestos claims and ALAE at December 31 592.8 124.1 687.5 130.0 586.1 132.2
Crum & Forster (C&F)
Provision for asbestos claims and ALAE at January 1 482.2 408.8 458.1 366.4 333.5 264.8
Asbestos losses and ALAE incurred during the year 29.7 31.5 87.0 90.5 195.7 149.8
Asbestos losses and ALAE paid during the year 85.0 63.6 62.8 48.1 71.1 48.2
Provision for asbestos claims and ALAE at December 31 426.9 376.7 482.2 408.8 458.1 366.4
OdysseyRe(1)
Provision for asbestos claims and ALAE at January 1 242.2 129.3 215.7 127.3 189.7 118.0
Asbestos losses and ALAE incurred during the year 54.2 44.4 54.6 22.6 46.4 18.3
Asbestos losses and ALAE paid during the year 21.6 4.6 28.1 20.5 20.4 9.0
Provision for asbestos claims and ALAE at December 31 274.8 169.1 242.2 129.3 215.7 127.3
TIG
Provision for asbestos claims and ALAE at January 1 97.7 8.5 102.7 11.8 36.0 12.3
Asbestos losses and ALAE incurred during the year 1.4 5.1 0.0 0.0 75.3 2.6
Asbestos losses and ALAE paid during the year 4.4 2.1 5.0 3.3 8.6 3.1
Provision for asbestos claims and ALAE at December 31 94.7 11.5 97.7 8.5 102.7 11.8
Ranger (Fairmont)
Provision for asbestos claims and ALAE at January 1 0.9 0.4 1.1 0.4 4.5 0.3
Asbestos losses and ALAE incurred during the year (0.3) (0.3) (0.1) 0.8 0.4 0.2
Asbestos losses and ALAE paid during the year 0.0 0.0 0.1 0.7 3.8 0.1
Provision for asbestos claims and ALAE at December 31 0.6 0.1 0.9 0.4 1.1 0.4
(1) Net reserves presented for OdysseyRe exclude cessions under a stop loss agreement with nSpire Re.In OdysseyRe’s financial disclosures, its net reserves include cessions under this reinsuranceprotection.
The policyholders with the most significant asbestos exposure are traditional defendants whomanufactured, distributed or installed asbestos products on a nationwide basis. IIC, whichunderwrote insurance generally for Fortune 500 type risks between 1971 and 1986 with mostlyhigh layer excess liability coverages (as opposed to primary or umbrella policies), is exposed tothese risks and has the bulk of the direct asbestos exposure within Fairfax. While these insuredsare relatively small in number, asbestos exposures for such entities have increased over the pastdecade due to the rising volume of claims, the erosion of underlying limits, and thebankruptcies of target defendants. As reflected above, these direct liabilities are very highlyreinsured.
Fairfax’s other U.S.-based insurers have asbestos exposure related mostly to less prominent or‘‘peripheral’’ defendants, including a mix of manufacturers, distributors, and installers ofasbestos-containing products as well as premises owners. For the most part, these insureds aredefendants on a regional rather than a nationwide basis. OdysseyRe has asbestos exposurearising from reinsurance contracts entered into before 1984. TIG has both direct and
96
reinsurance assumed asbestos exposures. TIG’s net retention on its direct exposure is protectedby an $89 APH reinsurance cover provided by Pyramid Insurance Company (owned by Aegon)which is fully collateralized and reflected in the above table. Additionally, TIG’s assumedexposure is 100% reinsured by ARC Insurance Company (also owned by Aegon); thisreinsurance is fully collateralized and reflected in the above table.
Reserves for asbestos cannot be estimated using traditional loss reserving techniques that relyon historical accident year loss development factors. Because each insured presents differentliability and coverage issues, IIC and C&F, which have the bulk of Fairfax’s asbestos liabilities,evaluate their asbestos exposure on an insured-by-insured basis. Since the mid-1990s theseentities have utilized a sophisticated, non-traditional methodology that draws upon companyexperience and supplemental databases to assess asbestos liabilities on reported claims. Themethodology utilizes a comprehensive ground-up, exposure-based analysis that constitutesindustry ‘‘best practice’’ approach for asbestos reserving. The methodology was initiallycritiqued by outside legal and actuarial consultants and the results are annually reviewed byindependent actuaries, all of whom have consistently found the methodology comprehensiveand the results reasonable.
In the course of the insured-by-insured evaluation, the following factors are considered:available insurance coverage, including any umbrella or excess insurance that has been issuedto the insured; limits, deductibles, and self-insured retentions; an analysis of each insured’spotential liability; the jurisdictions involved; past and anticipated future asbestos claim filingsagainst the insured; loss development on pending claims; past settlement values of similarclaims; allocated claim adjustment expenses; and applicable coverage defences. Theevaluations are based on current trends without any consideration of potential federal asbestoslegislation in the future. (See ‘‘Asbestos Legislative Reform Discussion’’ below.)
In addition to estimating liabilities for reported asbestos claims, IIC and C&F estimate reservesfor additional claims to be reported in the future as well as the reopening of any claim closed inthe past. This component of the total IBNR reserve is estimated using information as to thereporting patterns of known insureds, historical settlement costs per insured, andcharacteristics of insureds such as limits exposed, attachment points, and the number ofcoverage years.
Since their asbestos exposure is considerably less than that of IIC and C&F, OdysseyRe, TIG andRanger do not use the above methodology to establish asbestos reserves. Case reserves areestablished where sufficient information has been developed to indicate the involvement of aspecific insurance policy, and at Odyssey Re may include an additional amount as determinedby that company’s dedicated asbestos and environmental pollution claims unit based on theclaims audits of cedants. In addition, bulk IBNR reserves based on various methods such as lossdevelopment or market share, utilizing industry benchmarks of ultimate liability, areestablished to cover additional exposures on both reported and unasserted claims as well as forallocated claim adjustment costs.
The early part of this decade saw a rash of bankruptcies stemming from an increase in asbestosclaims. As the rate of new claim filings has stabilized, so has the number of defendants seekingbankruptcy protection. Asbestos-related bankruptcies now total approximately 72 companies,
97
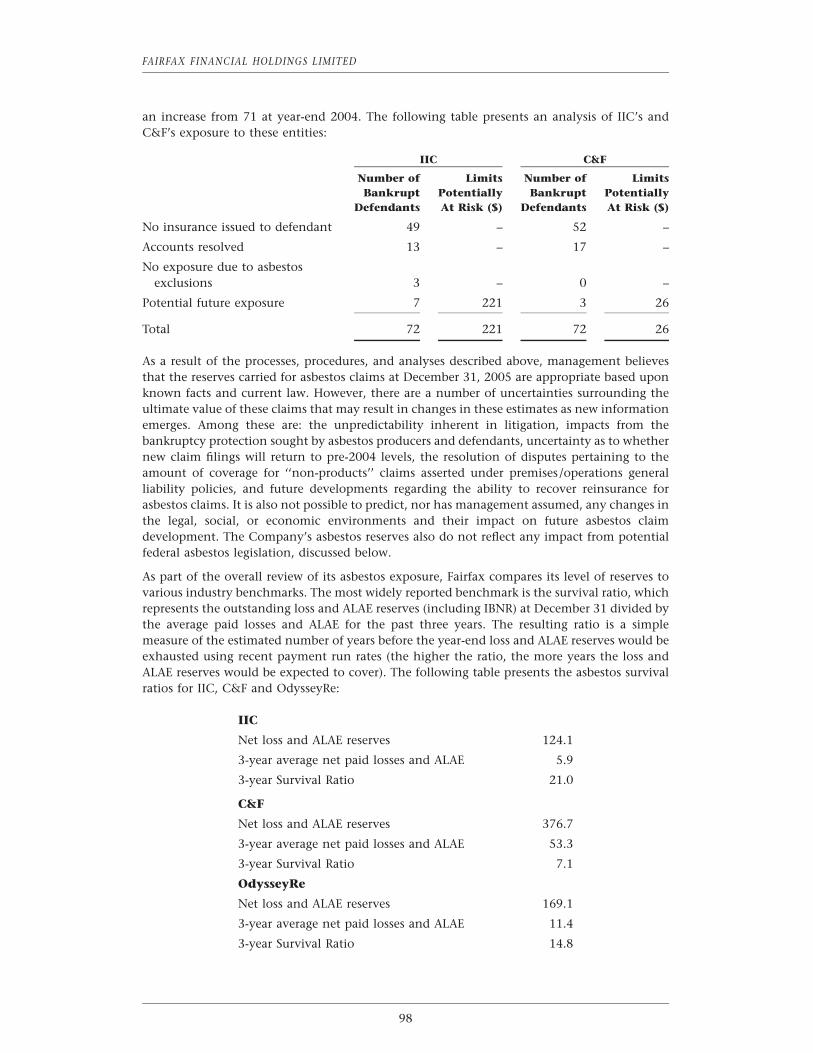
FAIRFAX FINANCIAL HOLDINGS LIMITED
an increase from 71 at year-end 2004. The following table presents an analysis of IIC’s andC&F’s exposure to these entities:
IIC C&F
Number of Limits Number of LimitsBankrupt Potentially Bankrupt Potentially
Defendants At Risk ($) Defendants At Risk ($)
No insurance issued to defendant 49 – 52 –
Accounts resolved 13 – 17 –
No exposure due to asbestosexclusions 3 – 0 –
Potential future exposure 7 221 3 26
Total 72 221 72 26
As a result of the processes, procedures, and analyses described above, management believesthat the reserves carried for asbestos claims at December 31, 2005 are appropriate based uponknown facts and current law. However, there are a number of uncertainties surrounding theultimate value of these claims that may result in changes in these estimates as new informationemerges. Among these are: the unpredictability inherent in litigation, impacts from thebankruptcy protection sought by asbestos producers and defendants, uncertainty as to whethernew claim filings will return to pre-2004 levels, the resolution of disputes pertaining to theamount of coverage for ‘‘non-products’’ claims asserted under premises/operations generalliability policies, and future developments regarding the ability to recover reinsurance forasbestos claims. It is also not possible to predict, nor has management assumed, any changes inthe legal, social, or economic environments and their impact on future asbestos claimdevelopment. The Company’s asbestos reserves also do not reflect any impact from potentialfederal asbestos legislation, discussed below.
As part of the overall review of its asbestos exposure, Fairfax compares its level of reserves tovarious industry benchmarks. The most widely reported benchmark is the survival ratio, whichrepresents the outstanding loss and ALAE reserves (including IBNR) at December 31 divided bythe average paid losses and ALAE for the past three years. The resulting ratio is a simplemeasure of the estimated number of years before the year-end loss and ALAE reserves would beexhausted using recent payment run rates (the higher the ratio, the more years the loss andALAE reserves would be expected to cover). The following table presents the asbestos survivalratios for IIC, C&F and OdysseyRe:
IIC
Net loss and ALAE reserves 124.1
3-year average net paid losses and ALAE 5.9
3-year Survival Ratio 21.0
C&F
Net loss and ALAE reserves 376.7
3-year average net paid losses and ALAE 53.3
3-year Survival Ratio 7.1
OdysseyRe
Net loss and ALAE reserves 169.1
3-year average net paid losses and ALAE 11.4
3-year Survival Ratio 14.8
98
Asbestos Legislative Reform Discussion
The United States Congress has been unsuccessful for three decades in its efforts to create afederal solution to address the flood of asbestos litigation across the country and the associatedcorporate bankruptcies. There are two major competing plans for asbestos reform: medicalcriteria reform and a trust fund.
Medical criteria reform would establish uniform, tighter medical standards that asbestosclaimants would be required to satisfy in order to succeed in an asbestos lawsuit. Advocates ofthis approach contend that such criteria would eliminate the vast numbers of claims from‘‘unimpaired’’ plaintiffs, who can recover damages under existing tort law in most states. (An‘‘unimpaired’’ claimant is generally defined to be a person who demonstrates some physicalchange that is consistent with asbestos caused injuries, but is not physically impaired as aresult of that change.) The medical criteria approach would leave claims in the tort system, andalso would not impact the relatively limited number of very expensive mesothelioma claimsseen each year. (Mesothelioma is a cancer that is generally associated with asbestos exposure.)
The trust fund concept is more sweeping. In theory, it would replace the present state law-based tort system with a federal administrative system to pay asbestos claimants. Usingmedical criteria and pre-scheduled payment amounts or ranges, the trust fund would payasbestos claimants and all tort remedies would be eliminated.
A federal trust fund solution received serious attention beginning in 2003 and the effort toenact such legislation continued in 2004 and 2005. In May of 2005, the Senate JudiciaryCommittee, on a largely party-line vote (Republicans in support, Democrats in opposition),reported out the Fairness in Asbestos Injury Resolution Act (S.852), commonly known as the‘‘FAIR Act’’.
S.852 would create a trust fund of up to $140 billion to pay asbestos injury claimants, fundedby defendant companies and their insurers. It is the Senate Leadership’s position that this levelof funding would provide substantially more money to asbestos claimants than the existingtort system, largely through the elimination of transactional costs and attorney fees. Concernsfirst voiced in the summer of 2003, i.e., lack of finality and certainty by significant componentsof both the insurance industry and asbestos defendant groups on the one hand, andinadequate funding for claimants by representatives of organized labor, on the other hand,continue today.
The insurance industry’s contribution to the fund would be $46 billion. Allocation of theindustry’s contribution among individual companies would be left to a legislatively createdcommission directed to consider a variety of factors, including, but not limited to, historicalpayments and carried reserves, to establish a company’s required contribution to the fund.
President Bush continues to call on Congress to enact legislation to ‘‘halt baseless asbestoslitigation and concentrate on providing awards to workers who are truly sick from asbestosexposure.’’ His office issued a statement in support of the passage of S.852. The statementadvised that the Administration had serious concerns with certain provisions of the bill, butwas looking ‘‘forward to working with Congress in order to strengthen and improve thisimportant legislation before it is presented to the President for his signature.’’
Debate on a federal trust fund solution to this issue began on the United States Senate floor inFebruary 2006. If the Senate passes the legislation, the United States House of Representativeswill then address it. As of this writing, it is not possible to predict whether federal asbestosreform will be enacted in 2006. It cannot be reasonably predicted what effect, if any, theenactment of some form of legislation would have on the financial position of the company.As stated above, the company’s asbestos reserves do not reflect any impact from potentialfuture legislative reforms.
99
FAIRFAX FINANCIAL HOLDINGS LIMITED
Environmental Pollution Discussion
Environmental pollution claims represent another significant exposure for Fairfax. However,pollution losses have been developing as expected over the past few years as a result of stableclaim trends. Claims against Fortune 500 companies are declining, and while insureds withsingle-site exposures are still active, the Company has resolved the majority of disputes withinsureds with a large number of sites. In many cases, claims are being settled for less thaninitially anticipated due to improved site remediation technology and effective policybuybacks.
Despite the stability of recent trends, there remains great uncertainty involved in estimatingliabilities related to these exposures. First, the number of waste sites subject to cleanup isunknown. Today, approximately 1,238 sites are included on the National Priorities List(NPL) of the federal Environmental Protection Agency. State authorities have identified manyadditional sites. Second, the liabilities of the insureds themselves are difficult to estimate. Atany given site, the allocation of remediation cost among the potentially responsible partiesvaries greatly depending upon a variety of factors. Third, different courts have been presentedwith liability and coverage issues regarding pollution claims and have reached inconsistentdecisions. There is also uncertainty as to the federal ‘‘Superfund’’ law itself; at this time, it isnot possible to predict what, if any, reforms to this law might be enacted by Congress, or theeffect of any such changes on the insurance industry.
Following is an analysis of Fairfax’s gross and net loss and ALAE reserves from pollutionexposures at year-end 2005, 2004, and 2003 and the movement in gross and net reserves forthose years:
2005 2004 2003
Gross Net Gross Net Gross Net
Runoff Companies
Provision for pollution claims and ALAE at January 1 384.1 93.9 443.4 114.1 447.9 152.7
Pollution losses and ALAE incurred during the year 6.4 3.0 (17.5) (4.9) 34.1 (23.7)
Pollution losses and ALAE paid during the year 34.4 7.7 41.8 15.4 38.6 14.8
Provision for pollution claims and ALAE at December 31 356.1 89.2 384.1 93.9 443.4 114.2
Operating Companies
Provision for pollution claims and ALAE at January 1 128.5 115.1 135.5 133.2 164.8 154.2
Pollution losses and ALAE incurred during the year 12.8 10.8 27.0 11.9 (8.2) 3.0
Pollution losses and ALAE paid during the year 17.8 20.0 34.0 30.0 21.1 24.0
Provision for pollution claims and ALAE at December 31 123.5 105.9 128.5 115.1 135.5 133.2
Fairfax Total
Provision for pollution claims and ALAE at January 1 512.6 209.0 578.8 247.3 612.6 306.9
Pollution losses and ALAE incurred during the year 19.3 13.8 9.6 7.0 25.9 (20.7)
Pollution losses and ALAE paid during the year 52.2 27.7 75.8 45.4 59.7 38.8
Provision for pollution claims and ALAE at December 31 479.7 195.1 512.6 209.0 578.8 247.4
Of the ($23.7) shown for runoff companies as the net incurred loss and ALAE for 2003, ($16.0)relates to a reclassification of reserves from environmental pollution into asbestos.
100
Following is an analysis of Fairfax’s U.S.-based subsidiaries’ gross and net loss and ALAEreserves from pollution exposures at year-end 2005, 2004, and 2003 and the movement ingross and net reserves for those years:
2005 2004 2003
Gross Net Gross Net Gross Net
IIC
Provision for pollution claims and ALAE at January 1 263.0 63.7 291.2 73.0 303.1 81.1
Pollution losses and ALAE incurred during the year 0.6 1.4 (8.3) (0.6) 6.7 (6.1)
Pollution losses and ALAE paid during the year 15.1 1.6 19.9 8.7 18.6 2.0
Provision for pollution claims and ALAE at December 31 248.5 63.5 263.0 63.7 291.2 73.0
C&F
Provision for pollution claims and ALAE at January 1 92.6 85.2 98.2 98.9 114.1 105.8
Pollution losses and ALAE incurred during the year 6.6 6.6 20.8 10.0 (6.7) 2.0
Pollution losses and ALAE paid during the year 18.0 17.6 26.4 23.7 9.2 8.9
Provision for pollution claims and ALAE at December 31 81.2 74.2 92.6 85.2 98.2 98.9
OdysseyRe(1)
Provision for pollution claims and ALAE at January 1 29.9 28.2 33.2 33.0 45.7 46.2
Pollution losses and ALAE incurred during the year 9.7 4.4 2.8 0.4 (3.4) (0.8)
Pollution losses and ALAE paid during the year (0.8) 1.9 6.2 5.1 9.1 12.4
Provision for pollution claims and ALAE at December 31 40.4 30.7 29.9 28.2 33.2 33.0
TIG
Provision for pollution claims and ALAE at January 1 102.1 16.0 116.0 17.4 88.2 28.5
Pollution losses and ALAE incurred during the year (2.2) (6.6) 1.3 1.3 46.5 1.6
Pollution losses and ALAE paid during the year 6.7 (3.4) 15.2 2.7 18.7 12.7
Provision for pollution claims and ALAE at December 31 93.2 12.8 102.1 16.0 116.0 17.4
Ranger (Fairmont)
Provision for pollution claims and ALAE at January 1 6.0 1.7 4.0 1.5 5.0 2.3
Pollution losses and ALAE incurred during the year (3.5) (0.3) 3.5 1.4 1.9 1.9
Pollution losses and ALAE paid during the year 0.6 0.6 1.4 1.2 2.9 2.7
Provision for pollution claims and ALAE at December 31 1.9 0.8 6.0 1.7 4.0 1.5
(1) Net reserves presented for OdysseyRe exclude cessions under a stop loss agreement with nSpire Re. InOdysseyRe’s financial disclosures, its net reserves include cessions under this reinsurance protection.
As with asbestos reserves, exposure for pollution cannot be estimated with traditional lossreserving techniques that rely on historical accident year loss development factors. Becauseeach insured presents different liability and coverage issues, the methodology used by Fairfax’ssubsidiaries to establish pollution reserves is similar to that used for asbestos liabilities. IIC andC&F evaluate the exposure presented by each insured and the anticipated cost of resolutionutilizing ground-up, exposure-based analysis that constitutes industry ‘‘best practice’’ approachfor pollution reserving. As with asbestos reserving, this methodology was initially critiqued byoutside legal and actuarial consultants and the results are annually reviewed by independentactuaries, all of whom have consistently found the methodology comprehensive and theresults reasonable.
In the course of performing these individualized assessments, the following factors areconsidered: the insured’s probable liability and available coverage, relevant judicialinterpretations, the nature of the alleged pollution activities of the insured at each site, thenumber of sites, the total number of potentially responsible parties at each site, the nature ofenvironmental harm and the corresponding remedy at each site, the ownership and generaluse of each site, the involvement of other insurers and the potential for other availablecoverage, and the applicable law in each jurisdiction. A provision for IBNR is developed, againusing methodology similar to that for asbestos liabilities, and an estimate of ceded reinsurance
101
FAIRFAX FINANCIAL HOLDINGS LIMITED
recoveries is calculated. At OdysseyRe, TIG, and Ranger, a bulk reserving approach is employedbased on industry benchmarks of ultimate liability to establish reserves for both reported andunasserted claims as well as for allocated claim adjustment costs.
The following table presents the environmental pollution survival ratios on net loss and ALAEreserves for IIC, C&F, and OdysseyRe:
IIC C&F OdysseyRe
Net loss and ALAE reserves***************************** 63.5 74.2 30.73-year average net paid loss and ALAE ****************** 4.1 16.7 6.53-year Survival Ratio*********************************** 15.5 4.4 4.7
Other Mass Tort/Health Hazards Discussion
In addition to asbestos and pollution, Fairfax faces exposure to other types of mass tort orhealth hazard claims. Such claims include breast implants, pharmaceutical products, chemicalproducts, lead-based paint, noise-induced hearing loss, tobacco, mold, welding fumes, etc. As aresult of its historical underwriting profile and its focus of excess liability coverage on Fortune500 type entities, IIC has the bulk of these potential exposures within Fairfax. Presently,management believes that tobacco, silica, and to a lesser extent, lead paint and mold are themost significant health hazard exposures facing Fairfax.
Tobacco companies have not aggressively pursued insurance coverage for tobacco bodily injuryclaims. One notable exception is a Delaware state court coverage action, in which the SupremeCourt of Delaware held in favor of the insurers on four issues: 1) tobacco health hazardexclusions, 2) products hazard exclusions, 3) advertising liability and 4) named insuredprovision. There are no active claims submitted by tobacco manufacturers to IIC. One tobaccomanufacturer and its parent company have submitted notices of tobacco-related claims to TIG.One smokeless tobacco manufacturer has submitted notices of tobacco-related claims to C&Fand has brought a declaratory judgment action. This matter has been settled. A small numberof notices from distributors/retailers have also been submitted to TIG and C&F. In mostinstances, these distributors/retailers have reported that they have secured indemnificationagreements from tobacco manufacturers.
Claims against manufacturers related to tobacco products include both individual and classactions alleging personal injury or wrongful death from tobacco exposure (including exposureto second-hand smoke); actions alleging risk of future injury; consumer protection actionsalleging that the use of the terms ‘‘light’’ or ‘‘ultra light’’ constitutes deceptive and unfair tradepractices; health care cost recovery actions brought by governmental and non-governmentalplaintiffs seeking reimbursement for health care expenditures allegedly caused by cigarettesmoking, and/or disgorgement of profits; and suits alleging violations of the civil RICO statute,including a suit taken through trial by the U.S. Department of Justice. The tobaccomanufacturers generally continue to vigorously defend all claims. We are aware of onesettlement by a manufacturer with an individual smoker for a bodily injury claim, but theterms of the settlement were not made public. Although significant judgments have beenentered against various tobacco manufacturers, with few exceptions, the judgments are underappellate review.
Fairfax subsidiaries saw a decrease in the number of silica claims presented in 2005. RiverStonereceived silica claims on 34 new accounts in 2005 and reopened four accounts as a result ofadditional silica claims being filed. This is down from 70 new and five reopened silica accountsin 2004.
Two major developments in 2005 have made the pursuit of silica claims more difficult for theplaintiff bar. First, a number of doctors that were routinely used by plaintiff attorneys to screenpotential clients for silica related injuries came under the scrutiny of a Texas Federal Court. In
102
hearings before that Court, several diagnosing doctors openly disclaimed their prior findings ofsilicosis upon questioning by the judge and after being unable to explain how permanent signsof asbestosis that they diagnosed years earlier for the same patients had now disappeared.Secondly, tort reform was enacted in Mississippi in 2004 and in Texas in 2005. Many of thesilica claims filed against Fairfax’s insureds are filed in these two states. The Mississippi reformsdeter multi-plaintiff filings, establish strict venue rules, and cap punitive and non-economicdamages. The Texas reforms establish objective medical criteria for silica cases and allow onlythose claimants who are actually impaired to pursue their claims in the judicial system whiledeferring the claims of those who are not impaired. They also prevent the ‘‘bundling’’ ofmultiple plaintiffs for trial. These reforms will likely lead to a decrease in the number of silicacases filed in Texas and Mississippi. Fairfax continues to monitor the impact of these twosignificant developments on its pending silica accounts as well as on new silica loss reports.
Fairfax saw a significant decrease in the number of new mold claims in 2005. To date, theseclaims have not presented a significant exposure to Fairfax subsidiaries. This is largely becauseof the failure of plaintiffs to prove a causal relationship between bodily injury and exposure tomold.
Fairfax subsidiaries have received notices of lead paint claims from former lead paintmanufacturers. Two paint manufacturers brought coverage actions against their respectiveinsurers, including certain Fairfax subsidiaries which issued excess policies. While Fairfaxsubsidiaries have been dismissed from one of these actions, there is potential exposure in theother litigation. In addition to individual actions, governmental actions have been broughtagainst the paint industry alleging former lead paint companies are responsible for abating thepresence of lead paint in buildings and for health care and educational costs for residentsexposed to lead. Major developments in 2005 have changed the legal landscape for former leadpaint manufacturers. The Wisconsin Supreme Court relieved plaintiffs of their burden ofproving product identification and allowed a ‘‘risk contribution’’ approach, and courts inseveral other states have permitted governments to sue the paint manufacturers on a publicnuisance theory. The former lead paint companies continue to vigorously defend these claims.
Following is an analysis of IIC’s and C&F’s gross and net reserves from health hazard exposuresat year-end 2005, 2004, and 2003 and the movement in gross and net reserves for those years:
2005 2004 2003
Gross Net Gross Net Gross Net
IIC
Provision for health hazards claims and ALAE at January 1 94.0 30.4 115.2 33.9 150.8 48.7
Health hazards losses and ALAE incurred during the year 1.1 2.2 2.0 2.7 5.3 8.5
Health hazards losses and ALAE paid during the year 24.0 4.6 23.2 6.2 40.9 23.3
Provision for health hazards claims and ALAE at December 31 71.1 28.0 94.0 30.4 115.2 33.9
C&F
Provision for health hazards claims and ALAE at January 1 24.2 22.0 28.2 26.6 30.5 28.3
Health hazards losses and ALAE incurred during the year 6.5 6.5 0.0 0.0 1.1 1.8
Health hazards losses and ALAE paid during the year 5.3 4.4 4.0 4.7 3.4 3.5
Provision for health hazards claims and ALAE at December 31 25.4 24.1 24.2 22.0 28.2 26.6
Similar to asbestos and pollution, traditional actuarial techniques cannot be used to estimateultimate liability for these exposures. Some claim types were first identified ten or more yearsago, for example, breast implants and specific pharmaceutical products. For these exposures,the reserve estimation methodology at IIC is similar to that for asbestos and pollution, i.e., anexposure-based approach based on all known, pertinent facts underlying the claim. Thismethodology cannot at the present time be applied to other claim types such as tobacco orsilica as there are a number of significant legal issues yet to be resolved, both with respect topolicyholder liability and the application of insurance coverage. For these claim types, a bulk
103
FAIRFAX FINANCIAL HOLDINGS LIMITED
IBNR reserve is developed based on benchmarking methods utilizing the ultimate costestimates of more mature health hazard claims. The bulk reserve also considers the possibilityof entirely new classes of health hazard claims emerging in the future. C&F uses benchmarkingmethods such as survival ratios to set reserves.
Summary
Management believes that the APH reserves reported at December 31, 2005 are reasonableestimates of the ultimate remaining liability for these claims based on facts currently known,the present state of the law and coverage litigation, current assumptions, and the reservingmethodologies employed. These APH reserves are continually monitored by management andreviewed extensively by independent consulting actuaries. New reserving methodologies anddevelopments will continue to be evaluated as they arise in order to supplement the ongoinganalysis and reviews of the APH exposures. However, to the extent that future social,economic, legal, or legislative developments alter the volume of claims, the liabilities ofpolicyholders or the original intent of the policies and scope of coverage, particularly as theyrelate to asbestos and pollution claims, additional increases in loss reserves may emerge infuture periods.
Reinsurance Recoverables
Fairfax’s subsidiaries purchase certain reinsurance so as to reduce their liability on theinsurance and reinsurance risks which they write. Fairfax strives to minimize the credit risk ofpurchasing reinsurance through adherence to its internal reinsurance guidelines. To be anongoing reinsurer of Fairfax, a company must have high A.M. Best and/or Standard & Poor’sratings and maintain capital and surplus exceeding $500. Most of the reinsurance balances forreinsurers rated B++ and lower or which are not rated were inherited by Fairfax on acquisitionof a subsidiary, including IIC.
Recoverable from reinsurers on the consolidated balance sheet ($7,655.7 in 2005) consists offuture recoverables on unpaid claims ($6.9 billion), reinsurance receivable on paid losses($535.3) and unearned premiums from reinsurers ($241.1). This $6.9 billion of futurerecoverables from reinsurers on unpaid claims is reduced from $7.2 billion at December 31,2004, notwithstanding an increase in such recoverables in 2005 due to ceded losses from the2005 hurricanes.
The following table shows Fairfax’s top 50 reinsurance groups (based on gross reinsurancerecoverable net of specific provisions for uncollectible reinsurance) at December 31, 2005.These 50 reinsurance groups represent 86.0% of Fairfax’s total reinsurance recoverable. In the
104
following table and the other tables in this section ending on page 107, reinsurancerecoverables are reported net of intercompany reinsurance.
A.M. BestRating Gross Net
(or S&P Reinsurance ReinsuranceGroup Principal Reinsurer equivalent)(1) Recoverable(2) Recoverable(3)
Swiss Re European Reinsurance Co. of Zurich A+ 2,017.2 1,083.6Munich Re American Reinsurance A 830.0 418.4Lloyd’s Lloyd’s of London Underwriters A 455.1 406.5General Electric Employers Reinsurance Company A 284.7 252.0Berkshire Hathaway General Reinsurance Corp. A++ 278.0 253.0Nationwide Nationwide Mutual Insurance A+ 272.5 272.4Aegon ARC Re (4) 221.0 9.2HDI Hannover Ruckversicherungs A 214.6 140.2AIG Transatlantic Re A+ 173.0 155.1AXA AXA Reinsurance A 153.3 106.0Ace Insurance Co. of North America A+ 150.2 145.9St. Paul Travelers Indemnity Co. A+ 114.8 96.8Everest Everest Reinsurance Co. A+ 112.4 106.0Arch Capital Arch Reinsurance Ltd. A- 108.6 22.6Chubb Federal Insurance Co. A++ 102.5 65.4Great West Life London Life & General Re A 102.0 0.2Global Re Global International Reinsurance Co. NR 97.2 42.3PartnerRe Partner Reinsurance Co. of US A+ 95.9 69.4White Mountains Folksamerica Reinsurance Co. A 92.2 64.2CNA Continental Casualty A 77.0 68.5XL XL Reinsurance America Inc. A+ 75.5 61.3SCOR SCOR Canada Reinsurance Co. B++ 74.4 67.1Sompo Sompo Japan Insurance Inc. A+ 57.0 48.5Hartford New England Re A+ 55.8 54.1Aioi Aioi Insurance Co. Ltd. A 54.8 45.0Converium Converium Reins. North America Inc. B– 50.2 27.6Zurich Re Zurich Specialties London Ltd. NR 40.4 23.8Allstate Allstate Insurance Co. A+ 37.1 37.1Platinum Underwriters Platinum Underwriters Reinsurance Co. A 36.0 24.3IPC IPC Re A 33.8 –Manulife Manufacturers P&C Barbados NR 32.6 17.2Inter-Ocean Inter-Ocean Reinsurance Co. Ltd. NR 32.5 –QBE QBE Reinsurance Corp. A 32.1 19.4Liberty Mutual Liberty Mutual Insurance Co. A 31.9 30.8Glacier Glacier Re AG A– 31.7 –American Financial Great American Assurance Co. A 30.5 30.5FM Global Factory Mutual Insurance Co. A+ 26.6 26.6PMA PMA Capital Insurance Co. B+ 26.4 23.9Allianz Allianz Cornhill Insurance PLC A+ 25.8 21.9Axis Axis Reinsurance Co. A 24.4 18.9Duke’s Place Seaton Insurance Co. NR 23.4 22.6RBC Royal Bank of Canada Insurance A 21.6 0.2KKR Alea North America Insurance NR 21.2 20.4WR Berkley Berkley Insurance Co. A 20.7 19.6PXRE PXRE Reinsurance Co. B+ 19.8 7.2Toa Re Toa Reinsurance Co. America A 19.3 16.9CCR Caisse Centrale de Reassurance A+ 18.8 14.3Wustenrot Wurttembergische Versicherung NR 18.0 16.1Tawa CX Reinsurance NR 18.0 14.6
105
FAIRFAX FINANCIAL HOLDINGS LIMITED
A.M. BestRating Gross Net
(or S&P Reinsurance ReinsuranceGroup Principal Reinsurer equivalent)(1) Recoverable(2) Recoverable(3)
Aon Aon Indemnity(5) B+ 17.3 17.3Other reinsurers 1,128.4 1,009.6
Total reinsurance recoverable 8,088.2 5,514.5Provisions for uncollectible reinsurance 432.5 432.5
Total reinsurance recoverable after provisions for uncollectiblereinsurance 7,655.7 5,082.0
(1) Of principal reinsurer (or, if principal reinsurer is not rated, of group)
(2) Before specific provisions for uncollectible reinsurance
(3) Net of outstanding balances for which security is held, but before specific provisions for uncollectible reinsurance
(4) Aegon is rated A+ by S&P; ARC Re is not rated
(5) Indemnitor; rating is S&P credit rating of group
The decrease in the provisions for uncollectible reinsurance from those provisions atDecember 31, 2004 relate principally to the release of excess general provisions due to reducednet unsecured exposure (especially for B++ and lower or not rated reinsurers) and better thanexpected collections.
The following table shows the classification of the $7,655.7 gross reinsurance recoverableshown above by credit rating of the responsible reinsurers. Pools & associations, shownseparately, are generally government or similar insurance funds carrying very little credit risk.
Consolidated Reinsurance Recoverables
Outstanding SpecificA.M. Best Balances Provisions NetRating Gross for which for Unsecured(or S&P Reinsurance Security Uncollectible Reinsuranceequivalent) Recoverable is Held Reinsurance Recoverable
A++ 408.7 78.8 0.3 329.6
A+ 3,383.0 1,055.8 7.8 2,319.4
A 2,410.7 834.2 6.9 1,569.6
A– 278.6 163.0 2.0 113.6
B++ 165.5 30.5 0.4 134.6
B+ 86.0 17.6 0.2 68.2
B 71.5 10.7 3.2 57.6
Lower than B 134.3 5.3 90.5 38.5
Not rated 1,013.3 371.6 266.3 375.4
Pools &
associations 136.6 6.1 – 130.5
8,088.2 2,573.6 377.6 5,137.0
Provisions for uncollectible
reinsurance
– specific 377.6
– general 54.9
Net reinsurance recoverable 7,655.7
106
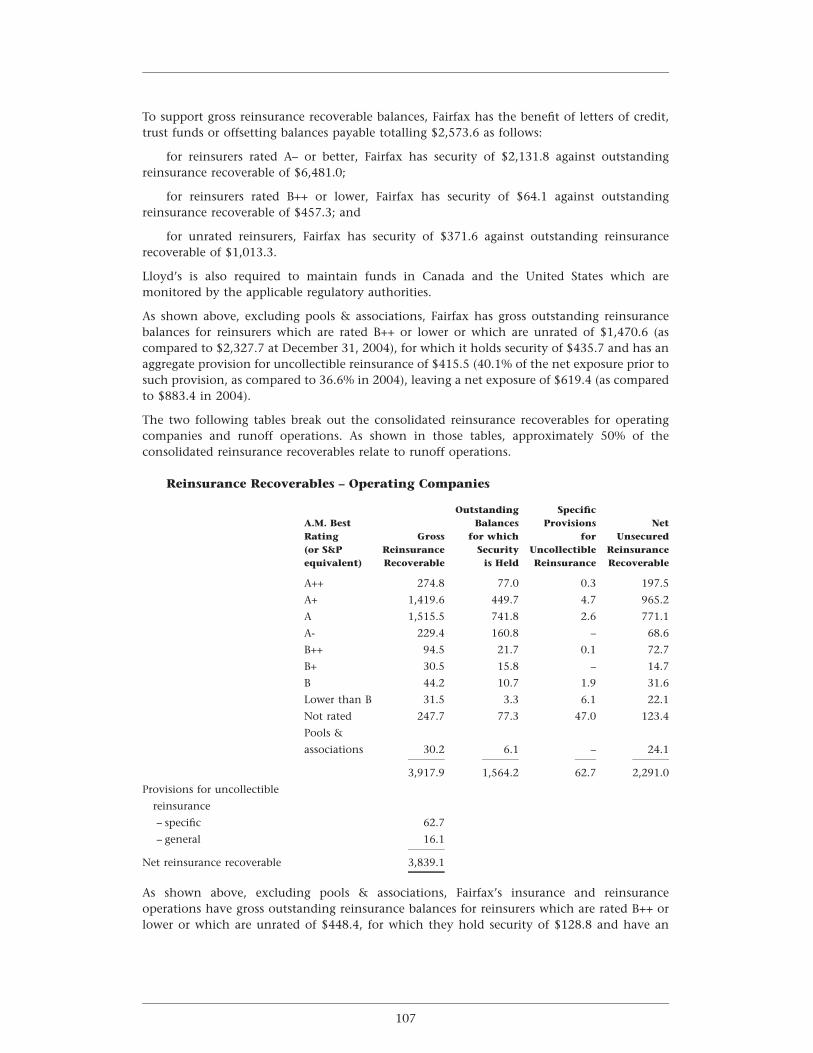
To support gross reinsurance recoverable balances, Fairfax has the benefit of letters of credit,trust funds or offsetting balances payable totalling $2,573.6 as follows:
for reinsurers rated A– or better, Fairfax has security of $2,131.8 against outstandingreinsurance recoverable of $6,481.0;
for reinsurers rated B++ or lower, Fairfax has security of $64.1 against outstandingreinsurance recoverable of $457.3; and
for unrated reinsurers, Fairfax has security of $371.6 against outstanding reinsurancerecoverable of $1,013.3.
Lloyd’s is also required to maintain funds in Canada and the United States which aremonitored by the applicable regulatory authorities.
As shown above, excluding pools & associations, Fairfax has gross outstanding reinsurancebalances for reinsurers which are rated B++ or lower or which are unrated of $1,470.6 (ascompared to $2,327.7 at December 31, 2004), for which it holds security of $435.7 and has anaggregate provision for uncollectible reinsurance of $415.5 (40.1% of the net exposure prior tosuch provision, as compared to 36.6% in 2004), leaving a net exposure of $619.4 (as comparedto $883.4 in 2004).
The two following tables break out the consolidated reinsurance recoverables for operatingcompanies and runoff operations. As shown in those tables, approximately 50% of theconsolidated reinsurance recoverables relate to runoff operations.
Reinsurance Recoverables – Operating Companies
Outstanding SpecificA.M. Best Balances Provisions NetRating Gross for which for Unsecured(or S&P Reinsurance Security Uncollectible Reinsuranceequivalent) Recoverable is Held Reinsurance Recoverable
A++ 274.8 77.0 0.3 197.5
A+ 1,419.6 449.7 4.7 965.2
A 1,515.5 741.8 2.6 771.1
A- 229.4 160.8 – 68.6
B++ 94.5 21.7 0.1 72.7
B+ 30.5 15.8 – 14.7
B 44.2 10.7 1.9 31.6
Lower than B 31.5 3.3 6.1 22.1
Not rated 247.7 77.3 47.0 123.4
Pools &
associations 30.2 6.1 – 24.1
3,917.9 1,564.2 62.7 2,291.0
Provisions for uncollectible
reinsurance
– specific 62.7
– general 16.1
Net reinsurance recoverable 3,839.1
As shown above, excluding pools & associations, Fairfax’s insurance and reinsuranceoperations have gross outstanding reinsurance balances for reinsurers which are rated B++ orlower or which are unrated of $448.4, for which they hold security of $128.8 and have an
107
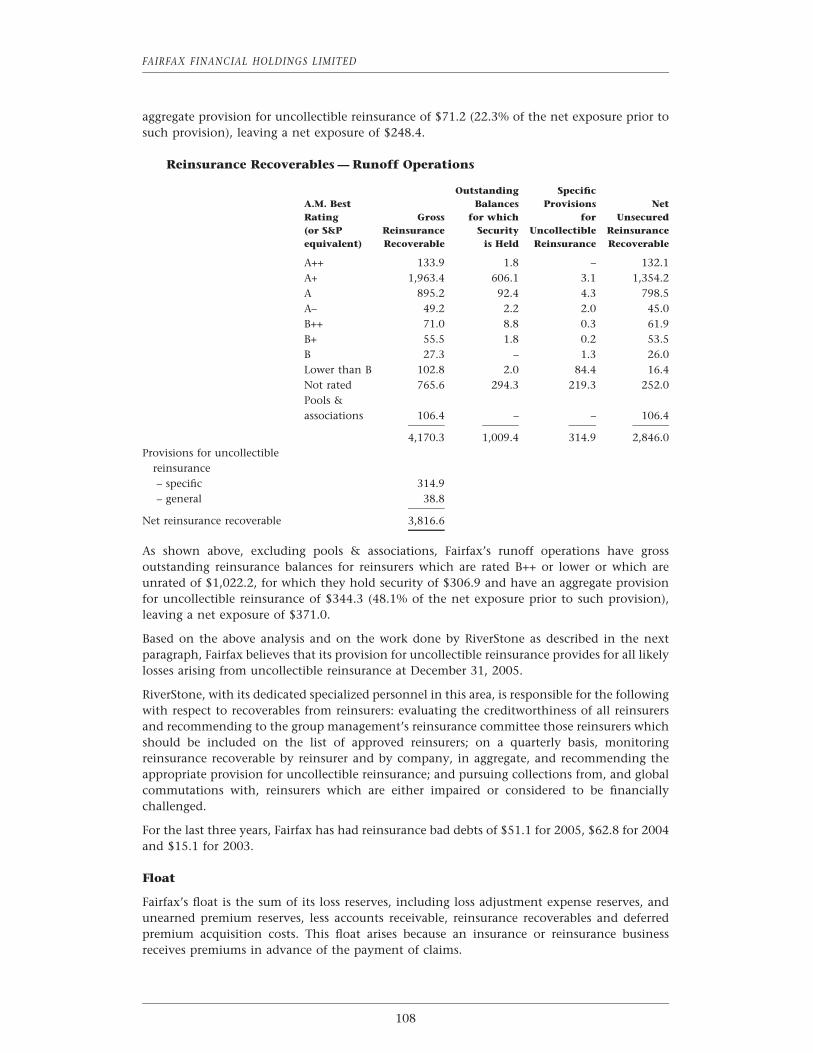
FAIRFAX FINANCIAL HOLDINGS LIMITED
aggregate provision for uncollectible reinsurance of $71.2 (22.3% of the net exposure prior tosuch provision), leaving a net exposure of $248.4.
Reinsurance Recoverables — Runoff Operations
Outstanding SpecificA.M. Best Balances Provisions NetRating Gross for which for Unsecured(or S&P Reinsurance Security Uncollectible Reinsuranceequivalent) Recoverable is Held Reinsurance Recoverable
A++ 133.9 1.8 – 132.1A+ 1,963.4 606.1 3.1 1,354.2A 895.2 92.4 4.3 798.5A– 49.2 2.2 2.0 45.0B++ 71.0 8.8 0.3 61.9B+ 55.5 1.8 0.2 53.5B 27.3 – 1.3 26.0Lower than B 102.8 2.0 84.4 16.4Not rated 765.6 294.3 219.3 252.0Pools &associations 106.4 – – 106.4
4,170.3 1,009.4 314.9 2,846.0Provisions for uncollectible
reinsurance – specific 314.9 – general 38.8
Net reinsurance recoverable 3,816.6
As shown above, excluding pools & associations, Fairfax’s runoff operations have grossoutstanding reinsurance balances for reinsurers which are rated B++ or lower or which areunrated of $1,022.2, for which they hold security of $306.9 and have an aggregate provisionfor uncollectible reinsurance of $344.3 (48.1% of the net exposure prior to such provision),leaving a net exposure of $371.0.
Based on the above analysis and on the work done by RiverStone as described in the nextparagraph, Fairfax believes that its provision for uncollectible reinsurance provides for all likelylosses arising from uncollectible reinsurance at December 31, 2005.
RiverStone, with its dedicated specialized personnel in this area, is responsible for the followingwith respect to recoverables from reinsurers: evaluating the creditworthiness of all reinsurersand recommending to the group management’s reinsurance committee those reinsurers whichshould be included on the list of approved reinsurers; on a quarterly basis, monitoringreinsurance recoverable by reinsurer and by company, in aggregate, and recommending theappropriate provision for uncollectible reinsurance; and pursuing collections from, and globalcommutations with, reinsurers which are either impaired or considered to be financiallychallenged.
For the last three years, Fairfax has had reinsurance bad debts of $51.1 for 2005, $62.8 for 2004and $15.1 for 2003.
Float
Fairfax’s float is the sum of its loss reserves, including loss adjustment expense reserves, andunearned premium reserves, less accounts receivable, reinsurance recoverables and deferredpremium acquisition costs. This float arises because an insurance or reinsurance businessreceives premiums in advance of the payment of claims.
108
The table below shows the float that Fairfax’s insurance and reinsurance operations havegenerated and the cost of that float. As the table shows, the average float increased 23.2% in2005 to $6.6 billion, but at a cost of 5.0% due to the unprecedented hurricane activity.
Average longBenefit term Canada
Underwriting (Cost) treasury bondYear profit (loss) Average float of float yield
1986 2.5 21.6 11.6% 9.6%↕
2001 (627.1) 4,719.1 (13.3%) 5.8%2002 (31.9) 4,402.0 (0.7%) 5.7%2003 95.1 4,443.2 2.1% 5.4%2004 134.8 5,371.4 2.5% 5.2%2005 (333.9) 6,615.7 (5.0%) 4.4%Weighted average since inception (4.5%) 5.7%Fairfax weighted average financing differential since inception: 1.2%
The table below shows the breakdown of total year-end float for the past five years.
TotalInsurance
Canadian U.S. Asian andInsurance Insurance Insurance Reinsurance Reinsurance Runoff Total
2001 384.0 2,677.4 – 1,548.9 4,610.3 1,201.9 5,812.22002 811.7 1,552.6 59.2 1,770.2 4,193.7 1,781.8 5,975.52003 1,021.1 1,546.9 88.0 2,036.7 4,692.7 1,905.4 6,598.12004 1,404.2 1,657.1 119.7 2,869.0 6,050.0 1,371.0 7,421.02005 1,461.8 1,884.9 120.2 3,714.4 7,181.3 1,575.3 8,756.6
In 2005, the Canadian insurance float increased by 4.1% (at no cost), the U.S. insurance floatincreased by 13.7% (at a cost of 0.5%), the Asian insurance float remained constant (at no cost)and the reinsurance float increased by 29.5% (at a cost of 12.1%). The runoff float increased by14.9%, due primarily to the receipt of funds on commutations. Taking all these componentstogether, total float increased by 18.0% to $8.8 billion at the end of 2005.
Insurance Environment
The property and casualty insurance and reinsurance industry continues to report reasonablecore underwriting income, excluding the significant hurricane activity in the past two years.Insurers have benefited from the compounded annual rate increases that began in 2002.Combined ratios in 2005 for Canada, for U.S. commercial lines and for U.S. reinsurers areexpected to be approximately 93.4%, 102.5% and 138.5%, respectively. Excludingcatastrophes, U.S. commercial lines’ and U.S. reinsurers’ combined ratios are expected to beapproximately 96.6% and 101.2%, respectively. Rates began to decline in 2004 and 2005, butthe unprecedented 2005 hurricane losses have stabilized rates in general, with catastropheexposed property rates increasing sharply.
SEC Subpoenas
On September 7, 2005, the company announced that it had received a subpoena from theU.S. Securities and Exchange Commission (the ‘‘SEC’’) requesting documents regarding anynon-traditional insurance or reinsurance product transactions entered into by the entities inthe consolidated group and any non-traditional insurance or reinsurance products offered bythe entities in that group. On September 26, 2005, the company announced that it hadreceived a further subpoena from the SEC as part of its investigation into such loss mitigationproducts, requesting documents regarding any transactions in the company’s securities, the
109
FAIRFAX FINANCIAL HOLDINGS LIMITED
compensation for such transactions and the trading volume or share price of such securities.Previously, on June 24, 2005, the company announced that the company’s Fairmontsubsidiary had received a subpoena from the SEC requesting documents regarding any non-traditional insurance product transactions entered into by Fairmont with General ReCorporation or affiliates thereof. The U.S. Attorney’s office for the Southern District of NewYork is reviewing documents produced by the company to the SEC and is participating in theinvestigation of these matters. The company is cooperating fully with these requests. Thecompany has prepared presentations and provided documents to the SEC and theU.S. Attorney’s office, and its employees, including senior officers, have attended or have beenrequested to attend interviews conducted by the SEC and the U.S. Attorney’s office.
The company and Prem Watsa, the company’s Chief Executive Officer, received subpoenasfrom the SEC in connection with the answer to a question on the February 10, 2006 investorconference call concerning the review of the company’s finite insurance contracts. In the fall of2005, Fairfax and its subsidiaries prepared and provided to the SEC a list intended to identifycertain finite contracts and contracts with other non-traditional features of all Fairfax groupcompanies. As part of the 2005 year-end reporting and closing process, Fairfax and itssubsidiaries internally reviewed all of the contracts on the list provided to the SEC and someadditional contracts as deemed appropriate. That review led to the restatement by OdysseyRereferred to on page 68. That review also led to some changes in accounting for certain contractsat nSpire Re which were immaterial at the consolidated Fairfax level. The company continuesto respond to requests for information from the SEC and there can be no assurance that theSEC’s review of documents provided will not give rise to further adjustments.
The company understands that the SEC has issued subpoenas to various third parties involvedin the matters which are the subject of the SEC subpoenas issued to the company, includingthe company’s independent auditors (which in Canada received a letter requestingcooperation and in the U.S. received a subpoena) and a shareholder (that has previouslydisclosed receipt of a subpoena). In addition, it is possible that other governmental andenforcement agencies will seek to review information related to these matters, or that thecompany, or other parties with whom it interacts, such as customers or shareholders, maybecome subject to direct requests for information or other inquiries by such agencies.
These inquiries are ongoing and the company continues to comply with requests forinformation from the SEC and the U.S. Attorney’s office. At the present time the companycannot predict the outcome from these continuing inquiries, or the ultimate effect on itsbusiness, which effect could be material and adverse. The financial cost to the company toaddress these matters has been and is likely to continue to be significant. The company expectsthat these matters will continue to require significant management attention, which coulddivert management’s attention away from the company’s business. In addition, the companycould be materially adversely affected by negative publicity related to these inquiries or anysimilar proceedings. Any of the possible consequences noted above, or the perception that anyof them could occur, could have an adverse effect upon the market price for the company’ssecurities.
Investments
The majority of interest and dividend income is earned by the insurance, reinsurance andrunoff companies.
110
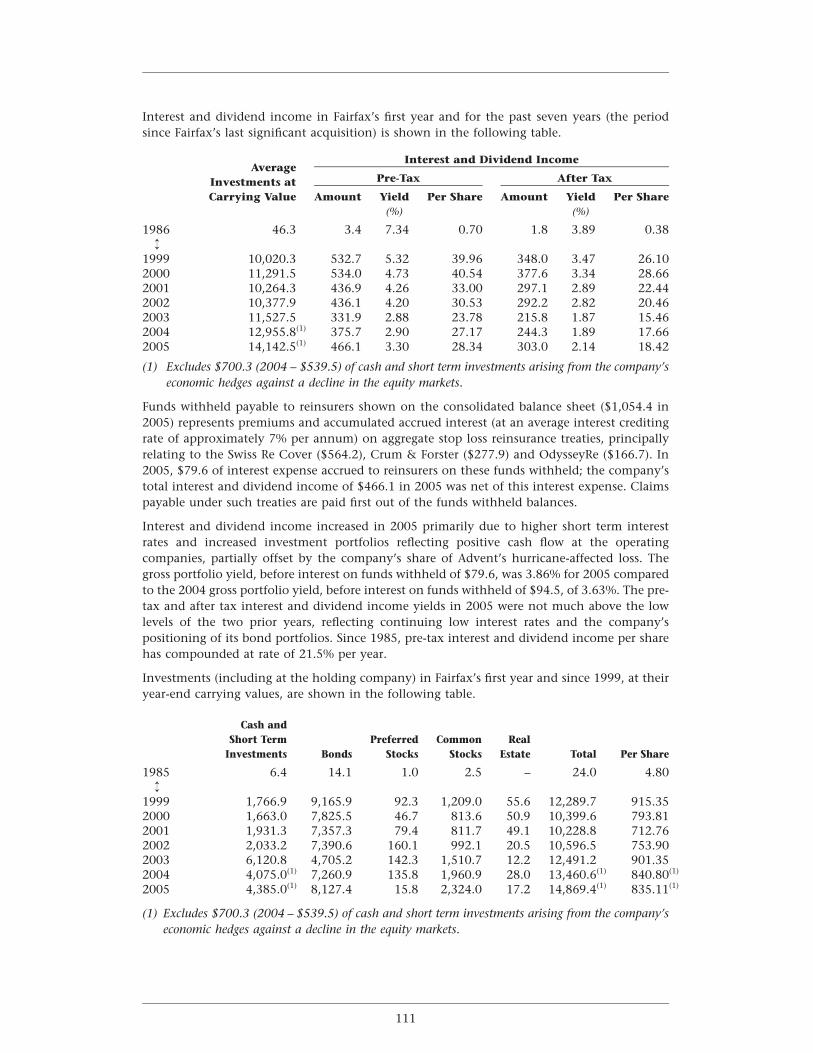
Interest and dividend income in Fairfax’s first year and for the past seven years (the periodsince Fairfax’s last significant acquisition) is shown in the following table.
Interest and Dividend IncomeAverage
Pre-Tax After TaxInvestments atCarrying Value Amount Yield Per Share Amount Yield Per Share
(%) (%)
1986 46.3 3.4 7.34 0.70 1.8 3.89 0.38↕
1999 10,020.3 532.7 5.32 39.96 348.0 3.47 26.102000 11,291.5 534.0 4.73 40.54 377.6 3.34 28.662001 10,264.3 436.9 4.26 33.00 297.1 2.89 22.442002 10,377.9 436.1 4.20 30.53 292.2 2.82 20.462003 11,527.5 331.9 2.88 23.78 215.8 1.87 15.462004 12,955.8(1) 375.7 2.90 27.17 244.3 1.89 17.662005 14,142.5(1) 466.1 3.30 28.34 303.0 2.14 18.42
(1) Excludes $700.3 (2004 – $539.5) of cash and short term investments arising from the company’seconomic hedges against a decline in the equity markets.
Funds withheld payable to reinsurers shown on the consolidated balance sheet ($1,054.4 in2005) represents premiums and accumulated accrued interest (at an average interest creditingrate of approximately 7% per annum) on aggregate stop loss reinsurance treaties, principallyrelating to the Swiss Re Cover ($564.2), Crum & Forster ($277.9) and OdysseyRe ($166.7). In2005, $79.6 of interest expense accrued to reinsurers on these funds withheld; the company’stotal interest and dividend income of $466.1 in 2005 was net of this interest expense. Claimspayable under such treaties are paid first out of the funds withheld balances.
Interest and dividend income increased in 2005 primarily due to higher short term interestrates and increased investment portfolios reflecting positive cash flow at the operatingcompanies, partially offset by the company’s share of Advent’s hurricane-affected loss. Thegross portfolio yield, before interest on funds withheld of $79.6, was 3.86% for 2005 comparedto the 2004 gross portfolio yield, before interest on funds withheld of $94.5, of 3.63%. The pre-tax and after tax interest and dividend income yields in 2005 were not much above the lowlevels of the two prior years, reflecting continuing low interest rates and the company’spositioning of its bond portfolios. Since 1985, pre-tax interest and dividend income per sharehas compounded at rate of 21.5% per year.
Investments (including at the holding company) in Fairfax’s first year and since 1999, at theiryear-end carrying values, are shown in the following table.
Cash andShort Term Preferred Common Real
Investments Bonds Stocks Stocks Estate Total Per Share
1985 6.4 14.1 1.0 2.5 – 24.0 4.80↕
1999 1,766.9 9,165.9 92.3 1,209.0 55.6 12,289.7 915.352000 1,663.0 7,825.5 46.7 813.6 50.9 10,399.6 793.812001 1,931.3 7,357.3 79.4 811.7 49.1 10,228.8 712.762002 2,033.2 7,390.6 160.1 992.1 20.5 10,596.5 753.902003 6,120.8 4,705.2 142.3 1,510.7 12.2 12,491.2 901.352004 4,075.0(1) 7,260.9 135.8 1,960.9 28.0 13,460.6(1) 840.80(1)
2005 4,385.0(1) 8,127.4 15.8 2,324.0 17.2 14,869.4(1) 835.11(1)
(1) Excludes $700.3 (2004 – $539.5) of cash and short term investments arising from the company’seconomic hedges against a decline in the equity markets.
111
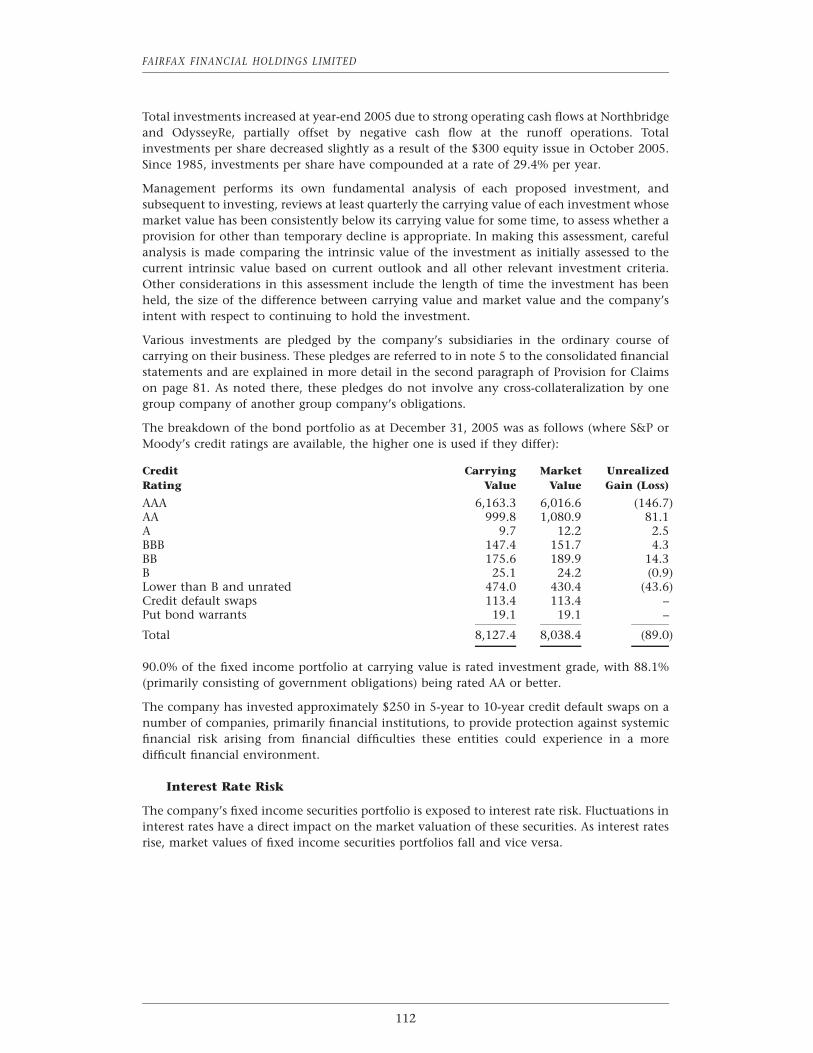
FAIRFAX FINANCIAL HOLDINGS LIMITED
Total investments increased at year-end 2005 due to strong operating cash flows at Northbridgeand OdysseyRe, partially offset by negative cash flow at the runoff operations. Totalinvestments per share decreased slightly as a result of the $300 equity issue in October 2005.Since 1985, investments per share have compounded at a rate of 29.4% per year.
Management performs its own fundamental analysis of each proposed investment, andsubsequent to investing, reviews at least quarterly the carrying value of each investment whosemarket value has been consistently below its carrying value for some time, to assess whether aprovision for other than temporary decline is appropriate. In making this assessment, carefulanalysis is made comparing the intrinsic value of the investment as initially assessed to thecurrent intrinsic value based on current outlook and all other relevant investment criteria.Other considerations in this assessment include the length of time the investment has beenheld, the size of the difference between carrying value and market value and the company’sintent with respect to continuing to hold the investment.
Various investments are pledged by the company’s subsidiaries in the ordinary course ofcarrying on their business. These pledges are referred to in note 5 to the consolidated financialstatements and are explained in more detail in the second paragraph of Provision for Claimson page 81. As noted there, these pledges do not involve any cross-collateralization by onegroup company of another group company’s obligations.
The breakdown of the bond portfolio as at December 31, 2005 was as follows (where S&P orMoody’s credit ratings are available, the higher one is used if they differ):
Credit Carrying Market UnrealizedRating Value Value Gain (Loss)
AAA 6,163.3 6,016.6 (146.7)AA 999.8 1,080.9 81.1A 9.7 12.2 2.5BBB 147.4 151.7 4.3BB 175.6 189.9 14.3B 25.1 24.2 (0.9)Lower than B and unrated 474.0 430.4 (43.6)Credit default swaps 113.4 113.4 –Put bond warrants 19.1 19.1 –
Total 8,127.4 8,038.4 (89.0)
90.0% of the fixed income portfolio at carrying value is rated investment grade, with 88.1%(primarily consisting of government obligations) being rated AA or better.
The company has invested approximately $250 in 5-year to 10-year credit default swaps on anumber of companies, primarily financial institutions, to provide protection against systemicfinancial risk arising from financial difficulties these entities could experience in a moredifficult financial environment.
Interest Rate Risk
The company’s fixed income securities portfolio is exposed to interest rate risk. Fluctuations ininterest rates have a direct impact on the market valuation of these securities. As interest ratesrise, market values of fixed income securities portfolios fall and vice versa.
112
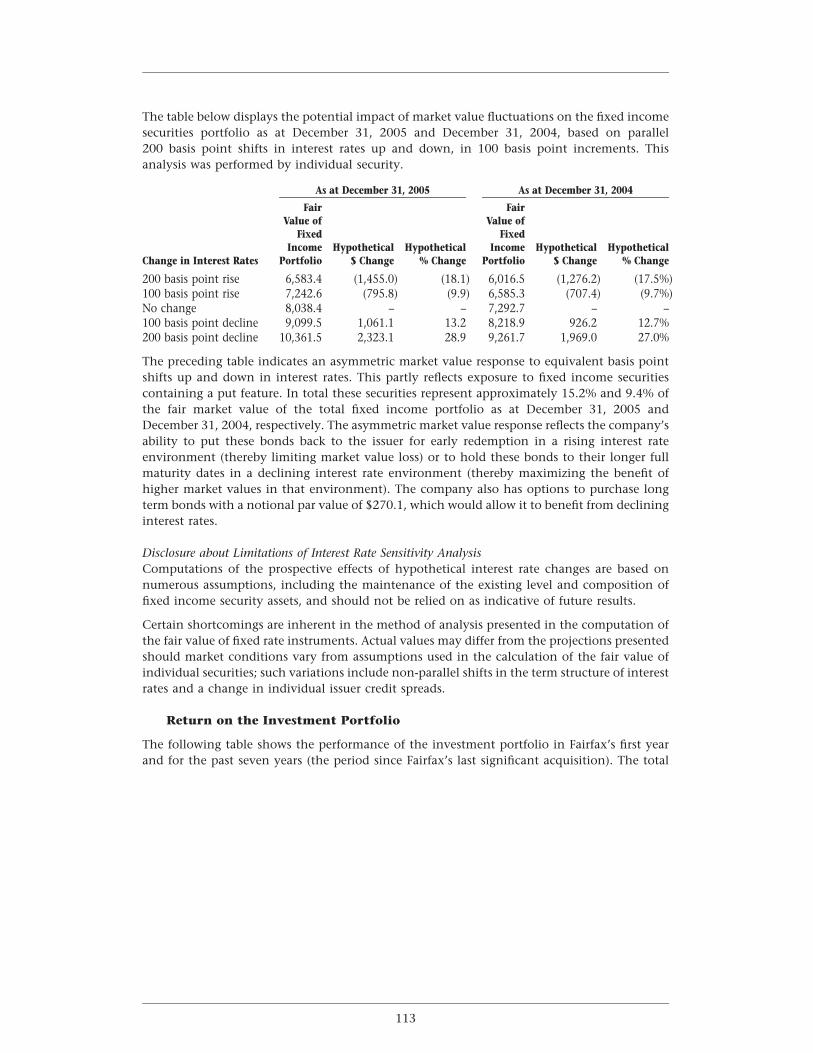
The table below displays the potential impact of market value fluctuations on the fixed incomesecurities portfolio as at December 31, 2005 and December 31, 2004, based on parallel200 basis point shifts in interest rates up and down, in 100 basis point increments. Thisanalysis was performed by individual security.
As at December 31, 2005 As at December 31, 2004
Fair FairValue of Value of
Fixed FixedIncome Hypothetical Hypothetical Income Hypothetical Hypothetical
Change in Interest Rates Portfolio $ Change % Change Portfolio $ Change % Change
200 basis point rise 6,583.4 (1,455.0) (18.1) 6,016.5 (1,276.2) (17.5%)100 basis point rise 7,242.6 (795.8) (9.9) 6,585.3 (707.4) (9.7%)No change 8,038.4 – – 7,292.7 – –100 basis point decline 9,099.5 1,061.1 13.2 8,218.9 926.2 12.7%200 basis point decline 10,361.5 2,323.1 28.9 9,261.7 1,969.0 27.0%
The preceding table indicates an asymmetric market value response to equivalent basis pointshifts up and down in interest rates. This partly reflects exposure to fixed income securitiescontaining a put feature. In total these securities represent approximately 15.2% and 9.4% ofthe fair market value of the total fixed income portfolio as at December 31, 2005 andDecember 31, 2004, respectively. The asymmetric market value response reflects the company’sability to put these bonds back to the issuer for early redemption in a rising interest rateenvironment (thereby limiting market value loss) or to hold these bonds to their longer fullmaturity dates in a declining interest rate environment (thereby maximizing the benefit ofhigher market values in that environment). The company also has options to purchase longterm bonds with a notional par value of $270.1, which would allow it to benefit from declininginterest rates.
Disclosure about Limitations of Interest Rate Sensitivity AnalysisComputations of the prospective effects of hypothetical interest rate changes are based onnumerous assumptions, including the maintenance of the existing level and composition offixed income security assets, and should not be relied on as indicative of future results.
Certain shortcomings are inherent in the method of analysis presented in the computation ofthe fair value of fixed rate instruments. Actual values may differ from the projections presentedshould market conditions vary from assumptions used in the calculation of the fair value ofindividual securities; such variations include non-parallel shifts in the term structure of interestrates and a change in individual issuer credit spreads.
Return on the Investment Portfolio
The following table shows the performance of the investment portfolio in Fairfax’s first yearand for the past seven years (the period since Fairfax’s last significant acquisition). The total
113
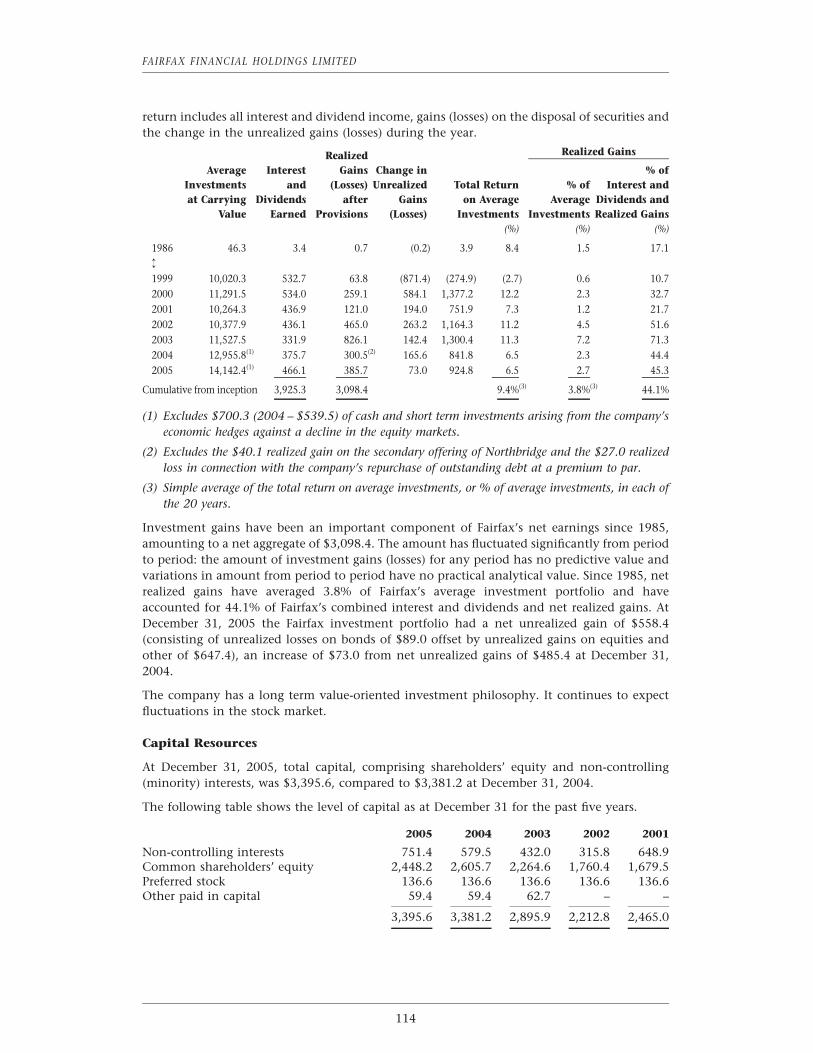
FAIRFAX FINANCIAL HOLDINGS LIMITED
return includes all interest and dividend income, gains (losses) on the disposal of securities andthe change in the unrealized gains (losses) during the year.
Realized GainsRealizedAverage Interest Gains Change in % of
Investments and (Losses) Unrealized Total Return % of Interest andat Carrying Dividends after Gains on Average Average Dividends and
Value Earned Provisions (Losses) Investments Investments Realized Gains(%) (%) (%)
1986 46.3 3.4 0.7 (0.2) 3.9 8.4 1.5 17.1↕
1999 10,020.3 532.7 63.8 (871.4) (274.9) (2.7) 0.6 10.72000 11,291.5 534.0 259.1 584.1 1,377.2 12.2 2.3 32.72001 10,264.3 436.9 121.0 194.0 751.9 7.3 1.2 21.72002 10,377.9 436.1 465.0 263.2 1,164.3 11.2 4.5 51.62003 11,527.5 331.9 826.1 142.4 1,300.4 11.3 7.2 71.32004 12,955.8(1) 375.7 300.5(2) 165.6 841.8 6.5 2.3 44.42005 14,142.4(1) 466.1 385.7 73.0 924.8 6.5 2.7 45.3
Cumulative from inception 3,925.3 3,098.4 9.4%(3) 3.8%(3) 44.1%
(1) Excludes $700.3 (2004 – $539.5) of cash and short term investments arising from the company’seconomic hedges against a decline in the equity markets.
(2) Excludes the $40.1 realized gain on the secondary offering of Northbridge and the $27.0 realizedloss in connection with the company’s repurchase of outstanding debt at a premium to par.
(3) Simple average of the total return on average investments, or % of average investments, in each ofthe 20 years.
Investment gains have been an important component of Fairfax’s net earnings since 1985,amounting to a net aggregate of $3,098.4. The amount has fluctuated significantly from periodto period: the amount of investment gains (losses) for any period has no predictive value andvariations in amount from period to period have no practical analytical value. Since 1985, netrealized gains have averaged 3.8% of Fairfax’s average investment portfolio and haveaccounted for 44.1% of Fairfax’s combined interest and dividends and net realized gains. AtDecember 31, 2005 the Fairfax investment portfolio had a net unrealized gain of $558.4(consisting of unrealized losses on bonds of $89.0 offset by unrealized gains on equities andother of $647.4), an increase of $73.0 from net unrealized gains of $485.4 at December 31,2004.
The company has a long term value-oriented investment philosophy. It continues to expectfluctuations in the stock market.
Capital Resources
At December 31, 2005, total capital, comprising shareholders’ equity and non-controlling(minority) interests, was $3,395.6, compared to $3,381.2 at December 31, 2004.
The following table shows the level of capital as at December 31 for the past five years.
2005 2004 2003 2002 2001
Non-controlling interests 751.4 579.5 432.0 315.8 648.9Common shareholders’ equity 2,448.2 2,605.7 2,264.6 1,760.4 1,679.5Preferred stock 136.6 136.6 136.6 136.6 136.6Other paid in capital 59.4 59.4 62.7 – –
3,395.6 3,381.2 2,895.9 2,212.8 2,465.0
114
Non-controlling interests increased in 2005 due primarily to the offerings by OdysseyRe of itspreferred shares and common shares and the non-controlling interest share of Northbridge’snet earnings for the year, partially offset by the non-controlling interest share of OdysseyRe’snet loss for the year.
Fairfax’s common shareholders’ equity decreased from $2,605.7 at December 31, 2004 to$2,448.2 at December 31, 2005, principally as a result of the net loss for the year (significantlyresulting from losses from the unprecedented 2005 hurricanes), partially offset by the issue of$300.0 of common shares. Holding company liquidity remained strong, while holdingcompany debt decreased slightly during 2005 and its maturity profile remained unchanged,with no significant debt maturities until 2012.
The company has issued and repurchased common shares over the last five years as follows:
Number of Averagesubordinate issue/repurchase Net proceeds/
Date voting shares price per share (repurchase cost)
2001 – issue of shares 1,250,000 125.52 156.02002 – repurchase of shares (210,200) 79.32 (16.7)2003 – repurchase of shares (240,700) 127.13 (30.6)2004 – issue of shares 2,406,741 124.65 299.72004 – repurchase of shares (215,200) 146.38 (31.5)2005 – issue of shares 1,843,318 162.75 299.82005 – repurchase of shares (49,800) 148.59 (7.4)
Fairfax’s indirect ownership of its own shares through The Sixty Two Investment CompanyLimited results in an effective reduction of shares outstanding by 799,230, and this reductionhas been reflected in the earnings per share and book value per share figures.
A common measure of capital adequacy in the property and casualty industry is the premiumsto surplus (or common shareholders’ equity) ratio. This is shown for the insurance andreinsurance subsidiaries of Fairfax for the past five years in the following table:
Net Premiums Written to Surplus(Common Shareholders’ Equity)
2005 2004 2003 2002 2001
InsuranceNorthbridge (Canada) 1.1 1.3 1.5 1.5 1.5Crum & Forster (U.S.) 0.9 0.9 0.8 0.7 0.5Fairmont (U.S.)(1) 0.9 1.0 1.5 1.1 0.9Fairfax Asia(2) 0.5 0.6 2.2 2.1 0.4
ReinsuranceOdysseyRe 1.5 1.6 1.7 1.6 1.0
Canadian insurance industry 1.1 1.2 1.6 1.4 1.4U.S. insurance industry 1.0 1.1 1.2 1.3 1.1
(1) Fairmont since 2003, only Ranger for prior years.
(2) Fairfax Asia in 2004, only Falcon for prior years.
In Canada, property and casualty companies are regulated by the Office of the Superintendentof Financial Institutions on the basis of a minimum supervisory target of 150% of a minimumcapital test (MCT) formula. At December 31, 2005, Northbridge’s subsidiaries had a weightedaverage MCT ratio of 237% of the minimum statutory capital required, compared to 227% atDecember 31, 2004, well in excess of the 150% minimum supervisory target.
In the U.S., the National Association of Insurance Commissioners (NAIC) has developed amodel law and risk-based capital (RBC) formula designed to help regulators identify property
115
FAIRFAX FINANCIAL HOLDINGS LIMITED
and casualty insurers that may be inadequately capitalized. Under the NAIC’s requirements, aninsurer must maintain total capital and surplus above a calculated threshold or face varyinglevels of regulatory action. The threshold is based on a formula that attempts to quantify therisk of a company’s insurance, investment and other business activities. At December 31, 2005,the U.S. insurance, reinsurance and runoff subsidiaries had capital and surplus in excess of theregulatory minimum requirement of two times the authorized control level – each subsidiaryhad capital and surplus in excess of 3.8 times the authorized control level, except for TIG (2.1times). As part of the TIG reorganization described on page 70, Fairfax has guaranteed that TIGwill have capital and surplus of at least two times the authorized control level at each year-end.
Fairfax and its insurance and reinsurance subsidiaries are rated as follows by the respectiverating agencies:
StandardA.M. Best & Poor’s Moody’s DBRS
Fairfax bb+ BB Ba3 BB (high)Commonwealth A– BBB – –Crum & Forster A– BBB Baa3 –
Falcon – A– – –Federated A– BBB – –Lombard A– BBB – –
Markel A– BBB – –OdysseyRe A A– A3 –
Liquidity
The purpose of liquidity management is to ensure that there is sufficient cash to meet allfinancial commitments and obligations as they fall due.
The company believes that its cash position alone provides adequate liquidity to meet all of thecompany’s obligations in 2006. Besides this cash, the holding company expects to continue toreceive management fees, investment income on its holdings of cash, short term investmentsand marketable securities, tax sharing payments and dividends from its insurance andreinsurance subsidiaries. Tax sharing payments received in 2006 may decline somewhat as aresult of the 2005 hurricane losses. For 2006, the holding company’s obligations (other thaninterest and overhead expenses) consist of repayment of the $60.6 of senior notes maturing inMarch and the continuing obligation to fund negative cash flow at the company’s Europeanrunoff operations (anticipated to be between $150 and $200 in 2006, prior to any managementactions which would improve that cash flow and prior to the ultimate cash flow implicationsof the collateral substitution described in the next sentence). In connection with therestatement of the Skandia reinsurance contract referred to on page 68, in March 2006, nSpireRe replaced $78 of letters of credit with cash funding to OdysseyRe which requiredapproximately $16 of additional funding from Fairfax in the first quarter of 2006.
Compliance with Corporate Governance Rules
Fairfax is a Canadian reporting issuer with securities listed on the Toronto Stock Exchange andthe New York Stock Exchange (the ‘‘NYSE’’). It has in place corporate governance practices thatcomply with all applicable rules and substantially comply with all applicable guidelines andpolicies of the Canadian Securities Administrators and the practices set out therein. In thecontext of its listing on the NYSE, Fairfax also substantially complies with the corporategovernance standards prescribed by the NYSE even though, as a ‘‘foreign private issuer’’, it isnot required to comply with most of those standards. The only significant difference betweenFairfax’s corporate governance practices and the standards prescribed by the NYSE relates toshareholder approval of the company’s equity compensation plans, which would be required
116
by NYSE standards but is not required under applicable Canadian rules as the plans involveonly outstanding shares purchased in the market and do not involve newly issued securities.
In 2005 Fairfax’s Board of directors, in consultation with outside experts retained by the Board,reviewed the company’s corporate governance practices and took a number of initiativesintended to retain and enhance its existing principles and practices. The Board formallyadopted a set of Corporate Governance Guidelines (which include a written mandate of theBoard), established a Governance and Nominating Committee and a CompensationCommittee (in addition to the previously established Audit Committee), approved writtencharters for all of its committees and approved a Code of Business Conduct and Ethicsapplicable to all directors, officers and employees of the company. The company continues tomonitor developments in the area of corporate governance as well as its own procedures.
Contractual Obligations
The following table provides a payment schedule of current and future obligations as atDecember 31, 2005:
Less than More thanTotal 1 year 1 – 3 years 3 – 5 years 5 years
Net claims liability 9,362.2 3,047.0 3,422.0 1,637.1 1,256.1Long term debt
obligations – principal 2,234.6 100.6 213.2 114.4 1,806.4Long term debt
obligations – interest 1,459.8 152.4 288.3 266.8 752.3Operating leases –
obligations 393.7 72.0 112.2 67.9 141.6Other long term
liabilities – principal 244.5 3.7 8.4 10.0 222.4Other long term
liabilities – interest 273.5 21.1 41.2 39.6 171.6
13,968.3 3,396.8 4,085.3 2,135.8 4,350.4
For further detail on Fairfax’s net claims liability, long term debt principal and interestpayments, operating lease payments and other long term liability payments, please see notes 6,7, 15, and 7 and 18, respectively, of the company’s consolidated financial statements.
The company manages its debt levels based on the following financial measurements andratios:
2005 2004 2003 2002 2001
Cash, short term investments andmarketable securities 559.0 566.8 410.2 327.7 519.1
Holding company debt 1,365.3 1,422.9 1,307.1 1,206.0 1,337.2Subsidiary debt 933.2 862.2 783.8 303.2 150.0Purchase consideration payable 192.1 195.2 200.6 205.5 –RHINOS due February 2003 – – – 136.0 136.0Trust preferred securities of
subsidiaries 52.4 52.4 79.8 79.8 90.0
Total debt 2,543.0 2,532.7 2,371.3 1,930.5 1,713.2Net debt 1,984.0 1,965.9 1,961.1 1,602.8 1,194.1
117
FAIRFAX FINANCIAL HOLDINGS LIMITED
2005 2004 2003 2002 2001
Common shareholders’ equity 2,507.6 2,665.1 2,327.3 1,760.4 1,679.5Preferred equity 136.6 136.6 136.6 136.6 136.6Non-controlling interests 751.4 579.5 432.0 315.8 648.9
Total equity and non-controllinginterests 3,395.6 3,381.2 2,895.9 2,212.8 2,465.0
Net debt/total capital 36.9% 36.8% 40.4% 42.0% 32.6%Total debt/total capital 42.8% 42.8% 45.0% 46.6% 41.0%Interest coverage N/A 2.6x 4.5x 5.1x N/A
At December 31, 2005, Fairfax had $559.0 of cash, short term investments and marketablesecurities at the holding company level. Net debt increased to $1,984.0 at December 31, 2005from $1,965.9 at December 31, 2004, and the net debt to equity and net debt to total capitalratios increased slightly, due to the net loss for the year and the $125.0 of additional long termdebt issued by OdysseyRe during the second quarter, offset somewhat by the proceeds receivedon an offering by the company of its subordinate voting shares, offerings by OdysseyRe ofpreferred shares and common shares (which increased the OdysseyRe non-controllinginterest), and the repayment of the TIG senior notes upon maturity, and other opportunisticdebt repurchases made, during 2005.
Management’s Evaluation of Disclosure Controls and Procedures (Restated)
As discussed in note 2 to the audited consolidated financial statements, the company hasrestated its consolidated financial statements as at and for the years ended December 31, 2001through 2005 and all related disclosures. The restatement of the company’s consolidatedfinancial statements followed an internal review of the company’s consolidated financialstatements and accounting records that was undertaken in contemplation of the commutationof the company’s $1 billion corporate insurance cover ultimately reinsured with a Swiss Resubsidiary (the ‘‘Swiss Re Cover’’). That review identified an overstatement of the consolidatednet assets of the company and errors in accounting for the periodic consolidated earningsstatements. The effects of the restatement are reflected in the company’s consolidated financialstatements and accompanying notes included herein. In connection with this restatement, thecompany’s management identified material weaknesses in its internal control over financialreporting.
Under the supervision and with the participation of our management, including our ChiefExecutive Officer (CEO) and Chief Financial Officer (CFO), we conducted an evaluation of theeffectiveness of our disclosure controls and procedures as required by Canadian securitieslegislation as of December 31, 2005. Disclosure controls and procedures are designed to ensurethat the information required to be disclosed by us in the reports we file or submit under thesecurities legislation is recorded, processed, summarized, and reported on a timely basis andthat such information is accumulated and reported to management, including our CEO andCFO, as appropriate, to allow timely disclosures regarding required disclosures.
At the time of the filing of the Annual Report on Form 40-F for the year ended December 31,2005, our CEO and CFO concluded that our disclosure controls and procedures were effectiveas of December 31, 2005. Subsequent to that evaluation, our CEO and CFO concluded that ourdisclosure controls and procedures were not effective as of December 31, 2005 because of thematerial weaknesses discussed below. Based upon the substantial work performed during therestatement process, the company’s management has concluded that the financial statementsincluded herein fairly present in all material respects the company’s financial position, resultsof operations and cash flows for the periods presented in conformity with generally acceptedaccounting principles.
118
Management’s Report on Internal Control over Financial Reporting (Restated)
Our management is responsible for establishing and maintaining adequate internal controlover financial reporting (as defined in Rule 13a-15(f) under the Exchange Act). Our internalcontrol over financial reporting is a process designed to provide reasonable assurance regardingthe reliability of financial reporting and the preparation of financial statements for externalpurposes in accordance with generally accepted accounting principles. A company’s internalcontrol over financial reporting includes those policies and procedures that (i) pertain to themaintenance of records that, in reasonable detail, accurately and fairly reflect the transactionsand dispositions of the assets of the company; (ii) provide reasonable assurance thattransactions are recorded as necessary to permit preparation of financial statements inaccordance with generally accepted accounting principles, and that receipts and expendituresof the company are being made only in accordance with authorizations of management anddirectors of the company; and (iii) provide reasonable assurance regarding prevention ortimely detection of unauthorized acquisition, use, or disposition of the company’s assets thatcould have a material effect on the financial statements.
Because of its inherent limitations, internal control over financial reporting may not prevent ordetect misstatements. Also, projections of any evaluation of effectiveness to future periods aresubject to the risk that controls may become inadequate because of changes in conditions, orthat the degree of compliance with the policies or procedures may deteriorate.
Our management assessed the effectiveness of our internal control over financial reporting asof December 31, 2005. In making this assessment, our management used the criteria set forthby the Committee of Sponsoring Organizations of the Treadway Commission (‘‘COSO’’) inInternal Control-Integrated Framework.
A material weakness is a control deficiency, or combination of control deficiencies, that resultsin more than a remote likelihood that a material misstatement of the annual or interimfinancial statements will not be prevented or detected. As of December 31, 2005, the followingmaterial weaknesses have been identified and included in management’s assessment:
1. The company did not maintain an appropriate accounting and financial reportingorganizational structure and a sufficient complement of accounting personnel tosupport the activities of the company. Specifically, lines of communication betweenour operations and accounting and finance personnel and subsidiaries were notadequate to raise issues to the appropriate level of accounting personnel. Further, thecompany did not maintain personnel with an appropriate level of accountingknowledge, experience and training to support the size and complexity of theorganization and its financial reporting requirements. This control deficiency resultedin the restatement of the company’s consolidated financial statements for the yearsended December 31, 2001 through 2005 and related disclosures. This controldeficiency contributed to each of the material weaknesses discussed in 2 through 4below.
2. The company did not maintain effective controls over the completeness and accuracyof period-end financial reporting and period-end close processes at the Fairfax headoffice consolidation level. Specifically, the company did not maintain effective reviewand monitoring processes and documentation relating to the (i) recording of recurringand non-recurring journal entries, (ii) recording of intercompany and related companyeliminations and reconciliations and (iii) translation of foreign currency transactionsand subsidiary company results. This control deficiency resulted in the restatement ofthe company’s consolidated financial statements for the years ended December 31,2001 through 2005 and related disclosures to correct significant accounts anddisclosures.
119
FAIRFAX FINANCIAL HOLDINGS LIMITED
3. The company did not maintain effective controls over the accounting for certainderivative instruments in accordance with FAS 133. Specifically, the company did notmaintain appropriate controls over the processes to account for convertible bondsecurities and to identify embedded derivatives in other fixed income securities inaccordance with US GAAP. This control deficiency resulted in the restatement of thecompany’s US GAAP net earnings (loss) with an offsetting amount in othercomprehensive income for each of the three years ended December 31, 2005.
4. The company did not maintain effective controls over the completeness and accuracyof the calculation and review of income taxes, including the determination of incometaxes payable, future income tax assets and liabilities and the related income taxprovision including the impact on US GAAP information. Specifically, the companydid not maintain appropriate controls over tax effecting certain permanentdifferences, temporary differences and US GAAP differences. This control deficiencyresulted in the restatement of the company’s consolidated financial statements for theyears ended December 31, 2001 through 2005 and related disclosures.
Each of the control deficiencies described in 1 to 4 above could result in misstatements of anyof the company’s financial statement accounts and disclosures that would result in a materialmisstatement to the annual or interim consolidated financial statements that would not beprevented or detected.
Accordingly, management has determined that each of the control deficiencies constitutes amaterial weakness.
In Management’s Report on Internal Control over Financial Reporting included in our originalAnnual Report on Form 40-F for the year ended December 31, 2005, our management,including our CEO and CFO, concluded that we maintained effective internal control overfinancial reporting as of December 31, 2005. Our CEO and CFO have subsequently concludedthat the material weaknesses described above existed as of December 31, 2005. As a result, theynow have concluded that we did not maintain effective internal control over financialreporting as of December 31, 2005, based on the criteria in Internal Control-IntegratedFramework issued by the COSO. Accordingly, management has restated its report on internalcontrol over financial reporting.
Management’s assessment of the effectiveness of the company’s internal control over financialreporting as of December 31, 2005, has been audited by PricewaterhouseCoopers LLP, anindependent registered public accounting firm, as stated in their report which appears herein.
Remediation Activities
To address the material weaknesses, management will implement a remediation plan whichwill supplement the existing controls of the company. Detailed action plans will be developedby December 31, 2006 in all areas where material weaknesses have been identified. Theremediation plan will address the following elements:
Financial Reporting Organizational Structure and Personnel
) Hire additional accounting personnel at head office and subsidiaries with the requisitetraining, skills and experience appropriate to their job requirements and the complexity ofthe organization.
) Increase frequency of communication between head office accounting and finance staff andsubsidiaries to discuss relevant issues including stressing the importance of controls.
) Improve procedures to test and evaluate key controls at head office by having internal auditreview the processes on a rotational basis.
120
) Conduct regular meetings to monitor the progress of the remediation efforts andcommunicate progress to the Audit Committee.
Head Office Consolidation Controls
) Establish a working group to evaluate and identify root causes of the control deficiencies inthis area and then develop detailed policies and procedures.
) Strengthen procedures over the reconciliation of the translation adjustment account.
) Enhance the documentation, review and sign-off procedures for recurring and non-recurringconsolidation journal entries.
) Improve procedures designed to reconcile intercompany differences in a timely mannerthrough increased collaboration with subsidiaries.
Investment Accounting US GAAP
) Increase the coordination and understanding of accounting personnel of key investmenttransactions through proactive and timely discussion with subsidiaries.
) In collaboration with HWIC investment managers, prepare accounting memos as necessaryat the inception of each new investment documenting accounting requirements underCanadian GAAP, US GAAP and statutory accounting.
Accounting for Income Taxes
) Implement mandatory pre-transaction reviews of significant transactions in collaborationwith the company’s tax personnel.
) Improve coordination of the tax and accounting personnel in determination and review ofthe tax provision for Canadian and US GAAP.
The material weaknesses will be fully remediated when, in the opinion of the company’smanagement, the revised control processes have been operating for a sufficient period of timeto provide reasonable assurance as to their effectiveness. The remediation and ultimateresolution of the company’s material weaknesses will be reviewed by the Audit Committee ofthe company’s Board of Directors. The company will disclose any further developments arisingas a result of its remediation efforts in future filings.
Issues and Risks
The following issues and risks, among others, should also be considered in evaluating theoutlook of the company. For a fuller detailing of issues and risks relating to the company,please see Risk Factors in Fairfax’s Supplemental and Base Shelf Prospectus filed onSeptember 28, 2005 with the securities regulatory authorities in Canada and the United States,which is available on SEDAR and EDGAR.
Claims Reserves
The major risk that all property and casualty insurance and reinsurance companies face is thatthe provision for claims is an estimate and may be found to be deficient, perhaps verysignificantly, in the future as a result of unanticipated frequency or severity of claims or for avariety of other reasons including unpredictable jury verdicts, expansion of insurance coverageto include exposures not contemplated at the time of policy issue (e.g. asbestos and pollution)and poor weather. Fairfax’s gross provision for claims was $16,235.1 at December 31, 2005.
121
FAIRFAX FINANCIAL HOLDINGS LIMITED
Latent Claims
The company has established loss reserves for asbestos, environmental and other latent claimsthat represent its best estimate of ultimate claims and claims adjustment expenses based uponknown facts and current law. As a result of significant issues surrounding liabilities of insurers,risks inherent in major litigation and diverging legal interpretations and judgments indifferent jurisdictions, actual liability for these types of claims could exceed the loss reserves setby the company by an amount that could be material to its operating results and financialcondition in future periods.
Reinsurance Recoverables
Most insurance and reinsurance companies reduce their liability for any individual claim byreinsuring amounts in excess of the maximum they want to retain. This third partyreinsurance does not relieve the company of its primary obligation to the insured. Reinsurancerecoverables can become an issue mainly due to solvency credit concerns, given the long timeperiod over which claims are paid and the resulting recoveries are received from the reinsurers,or policy disputes. Fairfax had $7,655.7 recoverable from reinsurers as at December 31, 2005.
Catastrophe Exposure
Insurance and reinsurance companies are subject to losses from catastrophes such asearthquakes, hurricanes and windstorms, hailstorms or terrorist attacks, which areunpredictable and can be very significant.
Prices
Prices in the insurance and reinsurance industry are cyclical and can fluctuate quitedramatically. With under-reserving, competitors can price below underlying costs for manyyears and still survive. The property and casualty insurance and reinsurance industry is highlycompetitive.
Foreign Exchange
The company has assets, liabilities, revenue and costs that are subject to currency fluctuations.These currency fluctuations have been and can be very significant and can affect the statementof earnings or, through the currency translation account, shareholders’ equity.
Cost of Revenue
Unlike most businesses, the insurance and reinsurance business can have enormous costs thatcan significantly exceed the premiums received on the underlying policies. Similar to shortselling in the stock market (selling shares not owned), there is no limit to the losses that canarise from most insurance policies, even though most contracts have policy limits.
Regulation
Insurance and reinsurance companies are regulated businesses which means that except aspermitted by applicable regulation, Fairfax does not have access to its insurance andreinsurance subsidiaries’ net income and shareholders’ capital without the requisite approvalof applicable insurance regulatory authorities.
Taxation
Realization of the company’s future income taxes asset is dependent upon the generation oftaxable income in those jurisdictions where the relevant tax losses and other timing differencesexist. The major component of the company’s future income taxes asset of $1,118.8 at
122
December 31, 2005 is $897.6 relating to the company’s U.S. consolidated tax group. Failure toachieve projected levels of profitability in the U.S. could lead to a writedown in this futureincome taxes asset if the expected recovery period for capitalized loss carryforwards becomeslonger than anticipated.
Bond and Common Stock Holdings
The company has bonds and common stocks in its portfolio. The market value of bondsfluctuates with changes in interest rates and credit outlook. The market value of commonstocks is exposed to fluctuations in the stock market.
Goodwill
Most of the goodwill on the balance sheet comes from Cunningham Lindsey, particularly itsU.K. operations. Continued profitability is essential for there to be no impairment in thecarrying value of the goodwill.
Ratings
The company has claims paying and debt ratings by the major rating agencies in NorthAmerica. As financial stability is very important to its customers, the company is vulnerable todowngrades by the rating agencies.
Holding Company
Being a small holding company, Fairfax is very dependent on strong operating management,which makes it vulnerable to management turnover.
Financial Strength
Fairfax strives to be soundly financed. If the company requires additional capital or liquiditybut cannot obtain it at all or on reasonable terms, its business, operating results and financialcondition would be materially adversely affected.
Cost of Reinsurance and Adequate Protection
The availability and cost of reinsurance are subject to prevailing market conditions, both interms of price and available capacity, which can affect the company’s business volume andprofitability. Many reinsurance companies have begun to exclude certain coverages from thepolicies they offer. In the future, alleviation of risk through reinsurance arrangements maybecome increasingly difficult.
Information Requests or Proceedings by Government Authorities
On September 7, 2005, the company announced that it had received a subpoena from theU.S. Securities and Exchange Commission (the ‘‘SEC’’) requesting documents regarding anynon-traditional insurance or reinsurance product transactions entered into by the entities inthe consolidated group and any non-traditional insurance or reinsurance products offered bythe entities in that group. On September 26, 2005, the company announced that it hadreceived a further subpoena from the SEC as part of its investigation into such loss mitigationproducts, requesting documents regarding any transactions in the company’s securities, thecompensation for such transactions and the trading volume or share price of such securities.Previously, on June 24, 2005, the company announced that the company’s Fairmontsubsidiary had received a subpoena from the SEC requesting documents regarding any non-traditional insurance product transactions entered into by Fairmont with General ReCorporation or affiliates thereof. The U.S. Attorney’s office for the Southern District of New
123
FAIRFAX FINANCIAL HOLDINGS LIMITED
York is reviewing documents produced by the company to the SEC and is participating in theinvestigation of these matters. The company is cooperating fully with these requests. Thecompany has prepared presentations and provided documents to the SEC and theU.S. Attorney’s office, and its employees, including senior officers, have attended or have beenrequested to attend interviews conducted by the SEC and the U.S. Attorney’s office.
The company and Prem Watsa, the company’s Chief Executive Officer, received subpoenasfrom the SEC in connection with the answer to a question on the February 10, 2006 investorconference call concerning the review of the company’s finite insurance contracts. In the fall of2005, Fairfax and its subsidiaries prepared and provided to the SEC a list intended to identifycertain finite contracts and contracts with other non-traditional features of all Fairfax groupcompanies. As part of the 2005 year-end reporting and closing process, Fairfax and itssubsidiaries internally reviewed all of the contracts on the list provided to the SEC and someadditional contracts as deemed appropriate. That review led to the restatement by OdysseyRereferred to on page 69. That review also led to some changes in accounting for certain contractsat nSpire Re which were immaterial at the consolidated Fairfax level. The Company continuesto respond to requests for information from the SEC and there can be no assurance that theSEC’s review of documents provided will not give rise to further adjustments.
The company understands that the SEC has issued subpoenas to various third parties involvedin the matters which are the subject of the SEC subpoenas issued to the company, includingthe company’s independent auditors (which in Canada received a letter requestingcooperation and in the U.S. received a subpoena) and a shareholder (that has previouslydisclosed receipt of a subpoena). In addition, it is possible that other governmental andenforcement agencies will seek to review information related to these matters, or that thecompany, or other parties with whom it interacts, such as customers or shareholders, maybecome subject to direct requests for information or other inquiries by such agencies.
These inquiries are ongoing and the company continues to comply with requests forinformation from the SEC and the U.S. Attorney’s office. At the present time the companycannot predict the outcome from these continuing inquiries, or the ultimate effect on itsbusiness, which effect could be material and adverse. The financial cost to the company toaddress these matters has been and is likely to continue to be significant. The company expectsthat these matters will continue to require significant management attention, which coulddivert management’s attention away from the company’s business. In addition, the companycould be materially adversely affected by negative publicity related to these inquiries or anysimilar proceedings. Any of the possible consequences noted above, or the perception that anyof them could occur, could have an adverse effect upon the market price for the company’ssecurities.
Critical Accounting Estimates and Judgments
In the preparation of the company’s consolidated financial statements, management has madea number of estimates and judgments, the more critical of which are discussed below.
Provision for Claims
For Fairfax’s reinsurance subsidiaries, provisions for claims are established based on reports andindividual case estimates provided by the ceding companies. For Fairfax’s subsidiaries thatwrite direct insurance, provisions for claims are based on the case method as they are reported.Case estimates are reviewed on a regular basis and are updated as new information is received.An additional provision over and above those provisions established under the case method isestablished for claims incurred but not yet reported, potential future development on knownclaims and closed claims that may reopen (IBNR reserves). The actuaries establish the IBNRreserves based on estimates derived from reasonable assumptions and appropriate actuarial
124
methods. Typically, actuarial methods use historical experience to project the future; thereforethe actuary must use judgment and take into consideration potential changes, such as changesin the underlying book of business, in law and in cost factors.
In order to ensure that the estimated consolidated provision for claims included in thecompany’s financial statements is adequate, the provisions at the company’s insurance,reinsurance and runoff operations are subject to several reviews, including by one or moreindependent actuaries. The reserves are reviewed separately by, and must be acceptable to,internal actuaries at each operating company, the chief actuary at Fairfax’s head office, and oneor more independent actuaries, including an independent valuation actuary whose reportappears in each Annual Report.
Provision for Uncollectible Reinsurance Recoverables
Fairfax establishes provisions for uncollectible reinsurance recoverables on a centralized basis,which are based on a detailed review of the credit risk of each underlying reinsurer.Considerations involved in establishing these provisions include the balance sheet strength ofthe reinsurer, its liquidity (or ability to pay), its desire to pay (based on prior history), ratings asdetermined by external rating agencies and specific disputed amounts based on contractinterpretations which occur from time to time. The company monitors these provisions andreassesses them on a quarterly basis, or more frequently if necessary, updating them as newinformation becomes available.
Provision for Other than Temporary Impairment in the Value of Investments
Fairfax reviews its investments on a quarterly basis and focuses its attention on investments forwhich the fair value has been at least 20% below cost for six months and on investmentswhich have experienced sharp declines in the market based on critical events, even if thoseinvestments have been below cost for less than a six month period. In considering whether ornot an impairment is other than temporary, the company assesses the underlying intrinsicvalue of the investment as of the review date as compared to the date of the originalinvestment and considers the impact of any changes in the underlying fundamentals of theinvestment. The company also considers the issuer’s financial strength and health, thecompany’s ability and intent to hold the security to maturity for fixed income investments, theissuer’s performance as compared to its competitors, industry averages, views published bythird party analysts and the company’s expectations for recovery in value in a reasonable timeframe. Provisions are reviewed on a regular basis and, if appropriate, are increased if additionalnegative information becomes available; these provisions are only released on the sale of thesecurity.
Valuation Allowance for Recovery of Future Income Taxes
In determining the need for a valuation allowance (which is based on management’s bestestimate) for the recovery of future income taxes, management considers primarily current andexpected profitability of the companies and their ability to utilize the losses fully within thenext few years. Fairfax reviews the recoverability of its future income taxes asset and thevaluation allowance on a quarterly basis, taking into consideration the underlying operation’sperformance as compared to plan, the outlook for the business going forward, changes to taxlaw, the ability of the company to refresh tax losses and the expiry date of the tax losses.
Assessment of Goodwill for Potential Impairment
Goodwill on the company’s balance sheet arises primarily from Cunningham Lindsey and issubject to impairment tests annually or when significant changes in operating expectationsoccur. Management estimates the fair value of each of the company’s operations using
125
FAIRFAX FINANCIAL HOLDINGS LIMITED
discounted expected future cash flows, which requires the making of a number of estimates,including estimates about future revenue, net earnings, corporate overhead costs, capitalexpenditures, cost of capital, and the growth rate of the various operations. The discountedcash flows supporting the goodwill in the reporting unit are compared to its book value. If thediscounted cash flows supporting the goodwill in the reporting unit are less than its bookvalue, a goodwill impairment loss is recognized equal to the excess of the book value of thegoodwill over the fair value of the goodwill. Given the variability of the future-orientedfinancial information, a sensitivity analysis of the goodwill impairment test is performed byvarying the discount and growth rates to enable management to conclude whether or not thegoodwill balance has been impaired. As at December 31, 2005, goodwill in the amount of$133.7 arose from Cunningham Lindsey’s U.K. operations; this goodwill is sensitive to changesin future profitability as well as to the discount rates used in the assessment.
Forward-Looking Statements
Certain statements contained herein may constitute forward-looking statements and are madepursuant to the ‘‘safe harbor’’ provisions of the United States Private Securities LitigationReform Act of 1995. Such forward-looking statements are subject to known and unknownrisks, uncertainties and other factors which may cause the actual results, performance orachievements of Fairfax to be materially different from any future results, performance orachievements expressed or implied by such forward-looking statements.
Such factors include, but are not limited to: a reduction in net income if the reserves of thecompany’s subsidiaries (including reserves for asbestos, environmental and other latent claims)are insufficient; underwriting losses on the risks these subsidiaries insure that are higher orlower than expected; the lowering or loss of one of these subsidiaries’ financial or claimspaying ability ratings; an inability to realize the company’s investment objectives; exposure tocredit risk in the event the company’s subsidiaries’ reinsurers or insureds fail to makepayments; a decrease in the level of demand for these subsidiaries’ products, or increasedcompetition; an inability to obtain reinsurance coverage at reasonable prices or on terms thatadequately protect these subsidiaries; an inability to obtain required levels of capital; aninability to access cash of the company’s subsidiaries; risks associated with requests forinformation from the Securities and Exchange Commission or other regulatory bodies; risksassociated with current government investigations of, and class action litigation related to,insurance industry practice; the passage of new legislation; and the failure to realize futureincome tax assets. Additional risks and uncertainties are described on pages 118 to 121 and inFairfax’s Supplemental and Base Shelf Prospectus (under ‘‘Risk Factors’’) filed on September 28,2005 with the securities regulatory authorities in Canada and the United States, which isavailable on SEDAR and EDGAR. Fairfax disclaims any intention or obligation to update orrevise any forward-looking statements.
Quarterly Data (unaudited)
Years ended December 31
First Second Third Fourth FullQuarter Quarter Quarter Quarter Year
2005Revenue 1,480.1 1,513.2 1,547.5 1,359.7 5,900.5Net earnings (loss) 47.2 22.9 (208.6) (308.1) (446.6)Net earnings (loss) per share 2.80 1.29 (13.19) (17.51) (27.75)Net earnings (loss) per diluted share 2.74 1.29 (13.19) (17.51) (27.75)
126
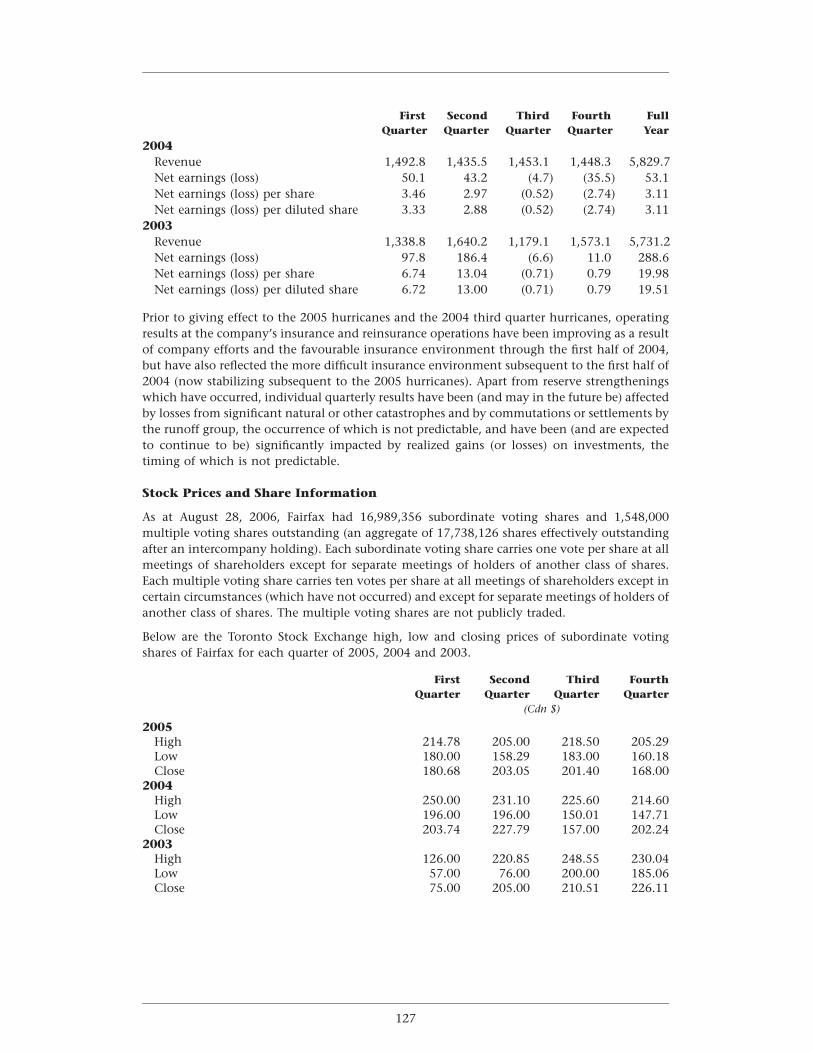
First Second Third Fourth FullQuarter Quarter Quarter Quarter Year
2004Revenue 1,492.8 1,435.5 1,453.1 1,448.3 5,829.7Net earnings (loss) 50.1 43.2 (4.7) (35.5) 53.1Net earnings (loss) per share 3.46 2.97 (0.52) (2.74) 3.11Net earnings (loss) per diluted share 3.33 2.88 (0.52) (2.74) 3.11
2003Revenue 1,338.8 1,640.2 1,179.1 1,573.1 5,731.2Net earnings (loss) 97.8 186.4 (6.6) 11.0 288.6Net earnings (loss) per share 6.74 13.04 (0.71) 0.79 19.98Net earnings (loss) per diluted share 6.72 13.00 (0.71) 0.79 19.51
Prior to giving effect to the 2005 hurricanes and the 2004 third quarter hurricanes, operatingresults at the company’s insurance and reinsurance operations have been improving as a resultof company efforts and the favourable insurance environment through the first half of 2004,but have also reflected the more difficult insurance environment subsequent to the first half of2004 (now stabilizing subsequent to the 2005 hurricanes). Apart from reserve strengtheningswhich have occurred, individual quarterly results have been (and may in the future be) affectedby losses from significant natural or other catastrophes and by commutations or settlements bythe runoff group, the occurrence of which is not predictable, and have been (and are expectedto continue to be) significantly impacted by realized gains (or losses) on investments, thetiming of which is not predictable.
Stock Prices and Share Information
As at August 28, 2006, Fairfax had 16,989,356 subordinate voting shares and 1,548,000multiple voting shares outstanding (an aggregate of 17,738,126 shares effectively outstandingafter an intercompany holding). Each subordinate voting share carries one vote per share at allmeetings of shareholders except for separate meetings of holders of another class of shares.Each multiple voting share carries ten votes per share at all meetings of shareholders except incertain circumstances (which have not occurred) and except for separate meetings of holders ofanother class of shares. The multiple voting shares are not publicly traded.
Below are the Toronto Stock Exchange high, low and closing prices of subordinate votingshares of Fairfax for each quarter of 2005, 2004 and 2003.
First Second Third FourthQuarter Quarter Quarter Quarter
(Cdn $)
2005High 214.78 205.00 218.50 205.29Low 180.00 158.29 183.00 160.18Close 180.68 203.05 201.40 168.00
2004High 250.00 231.10 225.60 214.60Low 196.00 196.00 150.01 147.71Close 203.74 227.79 157.00 202.24
2003High 126.00 220.85 248.55 230.04Low 57.00 76.00 200.00 185.06Close 75.00 205.00 210.51 226.11
127
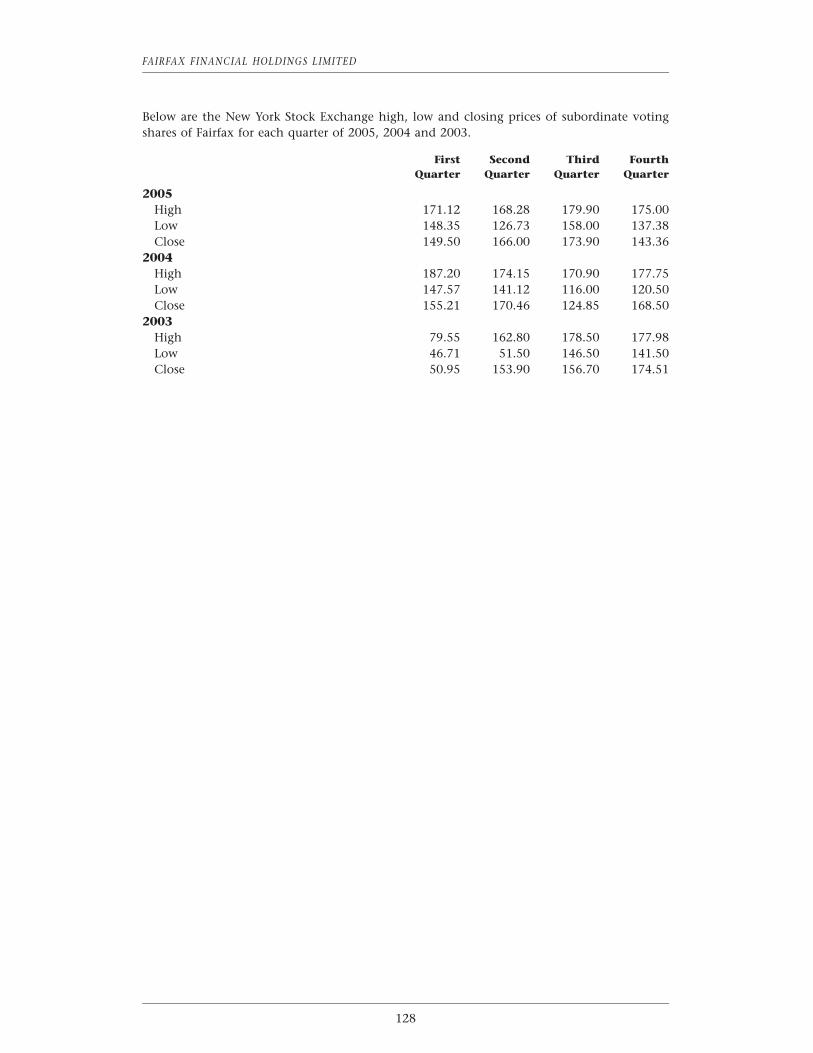
FAIRFAX FINANCIAL HOLDINGS LIMITED
Below are the New York Stock Exchange high, low and closing prices of subordinate votingshares of Fairfax for each quarter of 2005, 2004 and 2003.
First Second Third FourthQuarter Quarter Quarter Quarter
2005High 171.12 168.28 179.90 175.00Low 148.35 126.73 158.00 137.38Close 149.50 166.00 173.90 143.36
2004High 187.20 174.15 170.90 177.75Low 147.57 141.12 116.00 120.50Close 155.21 170.46 124.85 168.50
2003High 79.55 162.80 178.50 177.98Low 46.71 51.50 146.50 141.50Close 50.95 153.90 156.70 174.51
128
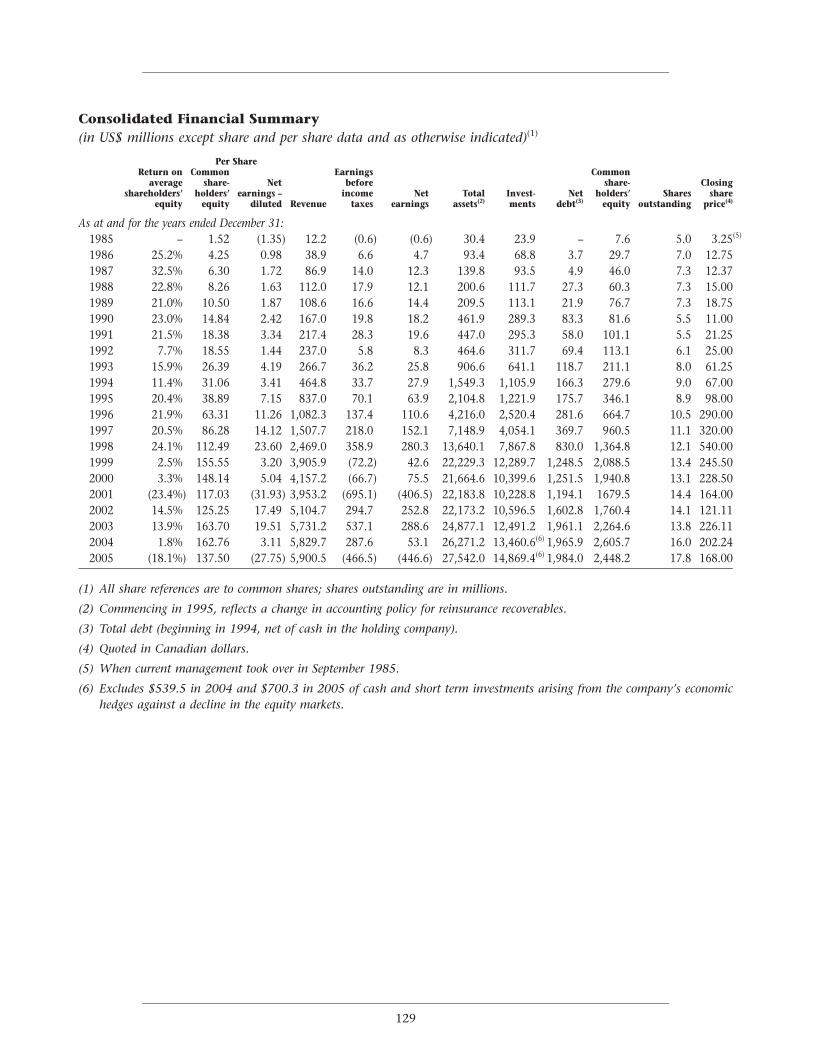
Consolidated Financial Summary(in US$ millions except share and per share data and as otherwise indicated)(1)
Per ShareReturn on Common Earnings Common
average share- Net before share- Closingshareholders’ holders’ earnings – income Net Total Invest- Net holders’ Shares share
equity equity diluted Revenue taxes earnings assets(2) ments debt(3) equity outstanding price(4)
As at and for the years ended December 31:1985 – 1.52 (1.35) 12.2 (0.6) (0.6) 30.4 23.9 – 7.6 5.0 3.25(5)
1986 25.2% 4.25 0.98 38.9 6.6 4.7 93.4 68.8 3.7 29.7 7.0 12.751987 32.5% 6.30 1.72 86.9 14.0 12.3 139.8 93.5 4.9 46.0 7.3 12.371988 22.8% 8.26 1.63 112.0 17.9 12.1 200.6 111.7 27.3 60.3 7.3 15.001989 21.0% 10.50 1.87 108.6 16.6 14.4 209.5 113.1 21.9 76.7 7.3 18.751990 23.0% 14.84 2.42 167.0 19.8 18.2 461.9 289.3 83.3 81.6 5.5 11.001991 21.5% 18.38 3.34 217.4 28.3 19.6 447.0 295.3 58.0 101.1 5.5 21.251992 7.7% 18.55 1.44 237.0 5.8 8.3 464.6 311.7 69.4 113.1 6.1 25.001993 15.9% 26.39 4.19 266.7 36.2 25.8 906.6 641.1 118.7 211.1 8.0 61.251994 11.4% 31.06 3.41 464.8 33.7 27.9 1,549.3 1,105.9 166.3 279.6 9.0 67.001995 20.4% 38.89 7.15 837.0 70.1 63.9 2,104.8 1,221.9 175.7 346.1 8.9 98.001996 21.9% 63.31 11.26 1,082.3 137.4 110.6 4,216.0 2,520.4 281.6 664.7 10.5 290.001997 20.5% 86.28 14.12 1,507.7 218.0 152.1 7,148.9 4,054.1 369.7 960.5 11.1 320.001998 24.1% 112.49 23.60 2,469.0 358.9 280.3 13,640.1 7,867.8 830.0 1,364.8 12.1 540.001999 2.5% 155.55 3.20 3,905.9 (72.2) 42.6 22,229.3 12,289.7 1,248.5 2,088.5 13.4 245.502000 3.3% 148.14 5.04 4,157.2 (66.7) 75.5 21,664.6 10,399.6 1,251.5 1,940.8 13.1 228.502001 (23.4%) 117.03 (31.93) 3,953.2 (695.1) (406.5) 22,183.8 10,228.8 1,194.1 1679.5 14.4 164.002002 14.5% 125.25 17.49 5,104.7 294.7 252.8 22,173.2 10,596.5 1,602.8 1,760.4 14.1 121.112003 13.9% 163.70 19.51 5,731.2 537.1 288.6 24,877.1 12,491.2 1,961.1 2,264.6 13.8 226.112004 1.8% 162.76 3.11 5,829.7 287.6 53.1 26,271.2 13,460.6(6) 1,965.9 2,605.7 16.0 202.242005 (18.1%) 137.50 (27.75) 5,900.5 (466.5) (446.6) 27,542.0 14,869.4(6) 1,984.0 2,448.2 17.8 168.00
(1) All share references are to common shares; shares outstanding are in millions.
(2) Commencing in 1995, reflects a change in accounting policy for reinsurance recoverables.
(3) Total debt (beginning in 1994, net of cash in the holding company).
(4) Quoted in Canadian dollars.
(5) When current management took over in September 1985.
(6) Excludes $539.5 in 2004 and $700.3 in 2005 of cash and short term investments arising from the company’s economichedges against a decline in the equity markets.
129