restarting japan’s nuclear power plants: a cost – …economic analysis of public policy 2015 -...
TRANSCRIPT

Economic Analysis of Public Policy 2015 - Final Report
Restarting Japan’s Nuclear Power Plants:
A Cost – Benefit Analysis
Authors: H.K Chamari Buddhika
Rachel Olanoff
Suryo Ariyanto Nugroho
Zhuoxiang Yang
5th of August 2015
Graduate School of Public Policy, University of Tokyo

Executive Summary
Nuclear energy had been Japan’s national strategic priority since 1973 and it has contributed to nearly a
third of Japan’s electricity generation. However, in 2011, all of the nuclear power plants have been
shutdown for safety concerns following the Fukushima Daiichi nuclear disaster. Since then, Japan has
largely depended on the import of fossil fuel in order to maintain its electricity generation in the absence
of nuclear energy, which has led to a trade deficit of ¥23.25 trillion from April, 2011 to the end of March,
2014.
Currently, there is an ongoing debate about restarting the nuclear power plants in order to maintain the
electricity generation in Japan. Proponents believe that nuclear power can be safely monitored and is a
stable energy supply that reduces carbon emissions, while the opponents contend that nuclear power
generation poses threats to the environment and human safety. Therefore, this report tries to provide a
cost-benefit analysis for the issue of restarting the nuclear power plants in Japan with the aim to
contribute some insights and recommendations, which might be useful for policy makers.
The analysis starts by defining three alternatives that will be analyzed in this report, which are:
1. Alternative 1 - With the restart of 24 Japan’s nuclear power plants (energy mix: 12% for nuclear,
28% for coal, 38% for LNG, 9.8% for oil, 9% for hydro, and 3.2% for solar, wind, and geothermal).
2. Alternative 2 - Japanese Energy Mix 2030 (energy mix: 21% of nuclear, 26% of coal, 27% of LNG,
3% of oil and 17% of hydro, and 6% of solar, wind, and geothermal).
3. Alternative 3 - Without the restart of Japan’s nuclear power plants (energy mix: 0% for nuclear,
31% for coal, 46.2% for LNG, 10.6% for oil, 9% for hydro, and 3.2% for solar, wind, and
geothermal).
The next phase of this report is to develop several assumptions as a baseline scenario for the analysis,
which includes:
1. The analysis’ time horizon of 20 years and the social discount rate equal to 5%.
2. All the existing nuclear power plants will function in their full capacity as was before the
Fukushima Daiichi incident without any additional cost after restarting, except for the cost incurred
by the additional safety measures.
3. All of the nuclear power plants will continue to operate for the full time horizon of 20 years without
any decommissioning occurring in between.
4. There will not be any construction of new nuclear power plants during the full 20-year period, using
solely the existing plants to meet the energy demand.
5. The prices of other sources of energy (LNG, oil, coal) and the generation costs of nuclear power, as

well as the price of electricity remain unchanged during the 20-year period.
In this Cost-Benefit Analysis, in order to determine the best policy alternative that should be implemented
by the Japanese government, this report will provide the description and analysis of the cost and benefit
components under the baseline scenario, which can be seen in the summary table below.
Alternative 1 Alternative 2 Alternative 3 Benefits (2017 - 2037) Undiscounted Value Reduction in CO2 emission 130,470,334,224,000 155,865,182,160,000 112,714,210,416,000 Increasing security in energy supply 37,209,635,081,600 118,186,641,716,000 2,332,520,772,800
Total Benefit 167,679,969,305,600 274,051,823,876,000 115,046,731,188,800 Costs (2017 - 2037) Undiscounted Value
Fuel life cycle cost 152,318,544,302,400 102,175,125,002,000 172,275,399,122,400 Upgrading and safety regulations compliance cost 458,690,400,000 802,708,200,000 - Operational and Maintenance Cost 50,784,672,120,000 73,256,679,300,000 45,528,844,620,000 Decommissioning cost 1,712,749,953,600 1,915,032,420,000 1,158,804,847,200 Risk of Reactors’ accident 550,428,480,000 963,249,840,000 -
Total Cost 205,825,085,256,000 179,112,794,762,000 218,963,048,589,600 Net Benefit -38,145,115,950,400 94,939,029,114,000 -103,916,317,400,800
The final result of the cost benefit analysis in this report will be represented by the net present value
(NPV) and benefit-cost ratio (BCR), which are estimated separately in the three alternatives mentioned
above. This NPV and BCR are calculated based on the discounted value of the benefit and cost
components for the time horizon of 20 years. In addition to this, for the sensitivity analysis, three
scenarios have been developed, which are baseline, optimistic, and pessimistic scenario. These three
scenarios are developed based on certain assumptions that will be adjusted in the sensitivity analysis,
which are the value of discount rate, social cost of carbon, and also the risk of reactor’s accident cost.
Alternative 1 Alternative 2 Alternative 3 Baseline Scenario NPV -27,462,590,065,934 55,942,289,141,933 -68,681,105,995,033 BCR 0.79 1.49 0.51 Optimistic Scenario NPV 15,327,762,234,192 123,870,274,043,094 -40,396,293,441,875 BCR 1.10 1.92 0.76 Pessimistic Scenario NPV -61,504,373,796,598 -12,508,285,235,130 -83,425,401,567,113 BCR 0.35 0.85 0.16
Based on the NPV, BCR, and sensitivity analysis, it is suggested that the government of Japan should aim
to implement the alternative 2, which is the Japan energy mix 2030. By implementing this alternative, the
government can maintain Japan’s greenhouse gas emission, and most importantly, the government can
reduce the dependency on the import of fossil fuels, which has greatly burdened its trade balance. By
improving its trade balance, hopefully Japan can improve its economic condition in the future.
Nevertheless, alternative 1 (restarting 24 nuclear power plants) can be used as a starting point towards
implementing alternative 2, since alternative 1 can be easily implemented in the short-run by giving an
approval to restart these 24 nuclear power plants, which have already applied for the safety review
assessment.

Table of Contents
1. INTRODUCTION .................................................................................................................. 2
1.1 BACKGROUND OF THE STUDY ................................................................................................................................ 2 1.2 RESEARCH OBJECTIVES AND POLICY ALTERNATIVES ................................................................................... 3
2. METHODOLOGY ................................................................................................................. 4
2.1 ASSESSMENT OF POLICY INSTRUMENTS ............................................................................................................. 4 2.2 ASSESSMENT PROCEDURES ..................................................................................................................................... 4 2.3 ASSUMPTIONS .............................................................................................................................................................. 6 2.4 MAJOR BENEFITS AND COST COMPONENTS ...................................................................................................... 7
3. ANALYSIS OF COSTS AND BENEFITS ............................................................................... 7
3.1 BENEFITS COMPONENTS ........................................................................................................................................... 7 3.1.1 Reduction in CO2 emission and pollution ..................................................................................................... 7 3.1.2 Increasing the security in energy supply .................................................................................................... 10
3.2 COST COMPONENTS ................................................................................................................................................. 12 3.2.1 Fuel life cycle cost ............................................................................................................................................... 12 3.2.2 Upgrading and safety regulations compliance cost ............................................................................... 13 3.2.3 Upgrading and safety regulations compliance cost ............................................................................... 13 3.2.4 Decommissioning Cost ...................................................................................................................................... 14 3.2.5 Risk of Reactors’ accident ................................................................................................................................ 14
4. ANALYSIS AND POLICY RECOMMENDATION .............................................................. 15
4.1 COST – BENEFIT ANALYSIS ................................................................................................................................... 15 4.1.1 Alternative 1 (Restarting 24 Nuclear Power Plants) ............................................................................. 15 4.1.2 Alternative 2 (Japan Energy Mix 2030) ...................................................................................................... 17 4.1.3 Alternative 3 (Without Restarting Nuclear Power Plants) .................................................................. 18
4.2 SENSITIVITY ANALYSIS .......................................................................................................................................... 20 4.3 POLICY RECOMMENDATION .................................................................................................................................. 21
5. CONCLUSION ..................................................................................................................... 22
REFERENCES ........................................................................................................................... 24

List of Figures
Figure 1. The Increase of Fossil Fuel Import After Fukushima Incident ...................................................... 2
Figure 2. Sensitivity Analysis Matrix .......................................................................................................... 20
List of Tables
Table 1. Status of Reactors that are Operable to Restart ............................................................................... 5
Table 2. Summary of Major Benefits and Cost Components ........................................................................ 7
Table 3. Greenhouse Gas Emission of Each Type of Power plants .............................................................. 8
Table 4. Social Cost of Carbon from 2015-2050 under different discount rates ........................................... 8
Table 5. Monetary Value of the Benefits for CO2 Emission Reduction (Per Year) .................................... 10
Table 6. Japan’s Energy Import Component in 2005 .................................................................................. 10
Table 7. Risk Index of Japan’s Energy Import ............................................................................................ 11
Table 8. Monetary Value of the Benefits for Increasing Energy Supply Security (Per Year) .................... 12
Table 9. Fuel Life Cycle Cost ...................................................................................................................... 13
Table 10. Operational and Maintenance Cost ............................................................................................. 13
Table 11. Decommissioning Cost ................................................................................................................ 14
Table 12. NPV and BCR for Alternative 1 .................................................................................................. 16
Table 13. NPV and BCR for Alternative 2 .................................................................................................. 17
Table 14. NPV and BCR for Alternative 3 .................................................................................................. 19
Table 15. Assumptions for Sensitivity Analysis ......................................................................................... 20


Restarting Japan’s Nuclear Power Plants
2
1. Introduction
1.1 Background of the Study
At present, Japan is heavily dependent on its imports to meet the country's domestic energy demand.
Nuclear energy generation was a national strategic priority since 1973 and contributed to nearly a third of
its electrical power generation. However, after the earthquake and Fukushima Daiichi nuclear disaster on
March 2011, all nuclear reactors have been gradually shut down for safety concerns.
Figure 1. The Increase of Fossil Fuel Import After Fukushima Incident
There is a hot debate about nuclear power currently. Proponents believe that nuclear power can be safely
monitored and is a stable energy supply that reduces carbon emissions. Opponents contend that nuclear
power generation poses threats to the environment and human safety. Data from Japan’s Ministry of
Economy, Trade, and Industry (METI) reported that the shutdown of nuclear reactors had increased fuel
imports by around ¥4 trillion per year, which led to a trade deficit of ¥23.25 trillion from April, 2011 to
the end of March, 2014, compared to trade surpluses in previous years prior to 2011 of at least ¥2.5
trillion. Due to the shutdown of nuclear power plants, the cost of electricity generation increased to 56%

A Cost Benefit Analysis
3
from ¥8.6 per kWh to become ¥13.5 per kWh in 2012, which led to a loss across utilities for about ¥1
trillion per year.
In terms of the effect on climate change, the shutdown of those nuclear reactors has raised the CO2
emission of Japan’s electricity generation from 350 g/kWh before up until March 2011, to 487 g/kWh in
2012. This condition became a big challenge for Japan’s climate change goal, which aimed to reduce CO2
emissions by 334 g/kWh over five years from 2008 - 2012.
Currently, there are 48 nuclear power plant units in Japan, where 43 reactors have been judged as
operable and able to be restarted should the government give the clearance to commence nuclear power
production again at these plants. However, considering new safety standards, of the operable nuclear
reactors, only 24 are under additional review for being restarted by the Nuclear Regulation Authority
(NRA).
1.2 Research Objectives and Policy Alternatives
The objective of this report is to assess the costs and benefits of restarting Japan’s nuclear power plants. It
also examines effects of the secondary market, renewable energy, in contributing to Japan’s energy mix.
As the renewable energy market is still being developed, increasing the percentage of renewables’
contribution to the energy mix strongly depends on coupling this energy with nuclear energy. Thus, the
relative costs and benefits of renewables are considered together with the variable policy alternatives for
nuclear. Therefore, for the purposes of this cost-benefit analysis the policy alternatives considered here
are;
1. Alternative 1 - With the restart of 24 Japan’s nuclear power plants
2. Alternative 2 - Japanese Energy Mix 2030
3. Alternative 3 - Without the restart of Japan’s nuclear power plants
In Alternative 1, Japan will introduce a policy to restart its nuclear power plants, which makes the energy
mix consist of liquefied natural gas (LNG), coal, petroleum, and nuclear. By introducing this policy,
Japan can revert back to its energy mix percentage just as before the Fukushima incident in 2011, which
was 12% for nuclear, 28% for coal, 38% for LNG, 9.8% for oil, 9% for hydro, and 3.2% for solar, wind,
and geothermal.
Alternative 2 considers the energy mix, which has been anticipated by the government of Japan to be in
place by the year 2030. This policy has placed a high importance on the contribution of the renewable
energy sources to the national grid which has been raised to approximately one fourth of the total energy
supply, while decreasing the dependency on oil as a source of electricity generation. The percentages of

Restarting Japan’s Nuclear Power Plants
4
the energy mix under this alternative would be 21% of nuclear, 26% of coal, 27% of LNG, 3% of oil and
17% of hydro, and 6% of solar, wind, and geothermal.
However, in Alternative 3, there will not be any initiative to restart the nuclear power plants in Japan,
hence it is assumed that the energy demand in the country is met solely by fossil fuels, which includes
liquefied natural gas, coal and petroleum. Hence the percentage of energy mix will be 0% for nuclear,
31% for coal, 46.2% for LNG, 10.6% for oil, 9% for hydro, and 3.2% for solar, wind, and geothermal
(METI, 2013).
2. Methodology
2.1 Assessment of Policy Instruments
In this Cost-Benefit Analysis, in order to determine the best policy alternative that should be implemented
by the Japanese government, the net present value (NPV) and benefit-cost ratio (BCR) are estimated
separately in the three alternatives mentioned above.
Costs and benefits of the three alternatives will be discounted over a period of 20 years, which is the time
horizon of operation, in order to calculate NPV and BCR for the purposes of comparison between the
three alternative cases. For benefit and cost components that may not have a direct monetary value,
‘shadow prices’ in quasi markets such as standardized calculation for the social cost of carbon, will be
utilized.
2.2 Assessment Procedures
The three alternatives were assessed in the following manner.
1. The time horizon for the whole analysis was set up as 20 years which was decided in the
following manner: Out of the 43 reactors operational in Japan, planned shutdown time of 5
reactors (Fukushima II-2, Ikata 2, Onagawa 1, Takahama 1 and 2) and their respective
commercial operation times are known. Then their durations of services were obtained as: 40, 40,
40, 50 and 50 years. And the latter two reactors, Takahama 1 and 2, are potentially able to restart.
Based on this known information, an assumption was made that the service periods for other
reactors are 45 years. Based on this, planned shutdown year was obtained and the average
shutdown time for the 24 reactors that are operable to restart was derived as the year 2035.75.
Therefore, the time horizon of this operation is 20 years.

A Cost Benefit Analysis
5
Table 1. Status of Reactors that are Operable to Restart
Reactor Type Net
capacity (MWe)
Utility Commercial Operation
Planned shutdown
(Assumption) Genkai 3 PWR 1127 Kyushu March, 1994 2039 Genkai 4 PWR 1127 Kyushu July, 1997 2042
Hamaoka 3 BWR 1056 Chubu August, 1987 2032
Hamaoka 4 BWR 1092 Chubu Sep-93 2038 Higashidori 1 Tohoku BWR 1067 Tohoku Dec-05 2050
Ikata 3 PWR 846 Shikoku Dec-94 2039 Kashiwazaki-Kariwa 6 ABWR 1315 TEPCO Nov-96 2041
Kashiwazaki-Kariwa7 ABWR 1315 TEPCO Jul-97 2042
Mihama 3 PWR 780 Kansai Dec-76 2021 Ohi 3 PWR 1127 Kansai Dec-91 2036 Ohi 4 PWR 1127 Kansai Feb-93 2038 Onagawa 2 BWR 796 Tohoku Jul-95 2040 Sendai 1 PWR 846 Kyushu Jul-84 2029 Sendai 2 PWR 846 Kyushu Nov-85 2030 Shika 2 ABWR 1304 Hokuri Mar-06 2051 Shimane 2 BWR 791 Chugoku Feb-89 2034 Takahama 1 PWR 780 Kansai Nov-74 2024 (known) Takahama 2 PWR 780 Kansai Nov-75 2025 (known) Takahama 3 PWR 830 Kansai Jan-85 2030 Takahama 4 PWR 830 Kansai Jun-85 2030 Tokai 2 BWR 1060 JAPC Nov-78 2023 Tomari 1 PWR 55 Hokkaido Jun-89 2034 Tomari 2 PWR 550 Hokkaido April, 1991 2036 Tomari 3 PWR 866 Hokkaido Dec-09 2054
Total: 24 reactors Total: 22808 AVERAGE: 2035.75
Note: PWR: Pressurized Water Reactor; ABWR: Advanced Boiling Water Reactor; BWR: Boiling Water Reactor.
2. Social discount rates were set up for the analysis.
3. Costs and benefits of the three alternatives were calculated in the following manner.
• For the first alternative (i.e. if it is decided to restart all the existing nuclear power plants
as they were prior to the Fukushima Daiichi incident in 2011), all the costs and benefits
are calculated for a possible energy mix of 12% for nuclear, 28% for coal, 38% for LNG,
9.8% for oil, 9% for hydro, and 3.2% for solar, wind, and geothermal.
• For the second alternative (i.e. if it is decided to adhere to energy mix 2030, proposed by
the Government), all the costs and benefits are calculated for a possible energy mix of

Restarting Japan’s Nuclear Power Plants
6
21% of nuclear, 26% of coal, 27% of LNG, 3% of oil and 17% of hydro, and 6% of solar,
wind, and geothermal; and
• For the third alternative (i.e. if it is decided not to restart nuclear power plants then the
situation will be similar to the current energy generation status), all the costs and benefits
are calculated for a possible energy mix of 0% for nuclear, 31% for coal, 46.2% for LNG,
10.6% for oil, 9% for hydro, and 3.2% for solar, wind, and geothermal.
4. The costs and benefits in all three alternatives will be discounted over a period of 20 years.
5. Then, the NPV and BCR values are calculated for each of the above cases and compared as
follows in order to arrive at a conclusion.
• If the NPV and BCR values of the first alternative are the highest then restarting
nuclear power plants is considered to be a viable policy decision.
• If those values of the second alternative are the highest then the best policy option
would be to adhere to the energy mix anticipated by the government.
• However, if the said values are the highest in the third alternative then the best
decision would be not to restart the existing nuclear power plants but to meet the
energy demand through a mix of oil, LNG and coal, as is done currently.
2.3 Assumptions
The following assumptions are made in this study:
1. All the existing nuclear power plants;
a. will have the capacity to be restarted without any additional cost at the beginning, except for
the cost incurred by the additional safety measures mandated by METI after the Fukushima
Daiichi incident;
b. will continue to operate for the full time horizon of 20 years without any decommissioning
occurring in between (because average remaining life span of all plants was calculated and
assumed to be approximately 20 years); and
c. will function in their full capacity as was before the Fukushima Daiichi incident in 2011 (at
present 43 plants have been judged as “operable,” although at the moment only 24 are under
review for additional safety upgrades in line with new regulation).
2. No new plants are constructed during the full 20-year period and the energy demand is solely met
by the existing plants, may it be nuclear power or otherwise; thus no investment costs in relation
to building new plants.
3. The prices of other sources of energy (LNG, oil, coal) and the generation costs of nuclear power,

A Cost Benefit Analysis
7
as well as the price of electricity remain unchanged during the 20-year period.
4. Social discount rate for the baseline scenario is 5%.
2.4 Major Benefits and Cost Components
There are several major benefits and cost components of implementing the policy for restarting Japan’s
nuclear power plants, and it can be briefly summarized as follows:
Table 2. Summary of Major Benefits and Cost Components
Benefits Cost
Reduction in CO2 emission and pollution
Fuel life cycle cost
Upgrading and safety regulations compliance cost
Operational and Maintenance Cost
Increasing the security in energy supply Decommissioning Cost
Risk of Reactors’ accident
3. Analysis of Costs and Benefits
3.1 Benefits Components
3.1.1 Reduction in CO2 emission and pollution
Nuclear power generation is environmentally friendly as it does not release the six key greenhouse gases
(GHGs) that contribute to climate change: carbon dioxide (CO2), methane (CH4), nitrous oxide (N2O),
hydro fluorocarbons (HFCs), perfluoro carbons (PFCs) and sulphur hexafluoride (SF6). But from the
perspective of life-cycle, a small amount of GHGs may be produced from mining, processing the fuel,
disposal of used fuel and other waste byproducts, etc.
From a “Comparison of Lifecycle Greenhouse Gas Emissions of Various Electricity Generation Sources”
study by World Nuclear Association (2011), it is possible to derive two observations:
• Greenhouse gas emissions of nuclear power plants are among the lowest of any electricity
generation method and on a lifecycle basis are comparable to wind, hydroelectric.
• Lifecycle emissions of natural gas, oil and coal generation are separately 17, 25 and 30 times
greater than nuclear.
To evaluate the reduction cost of GHGs, we compare the GHGs emissions with alternative fossil fuels.
Their data are in the following table.

Restarting Japan’s Nuclear Power Plants
8
Table 3. Greenhouse Gas Emission of Each Type of Power plants
Source: WNA Report (2011)
About the cost of carbon, we use social cost of carbon (SCC), which is the marginal cost of emitting one
extra ton of carbon, conventionally in a given year. To calculate it, the impacts of climate change must be
estimated. However the underlying uncertainties in the science of climate change cause estimates of SCC
to be highly variable. Tol (2009) summarized 232 published estimates and found the mode estimate is
only $13 per metric ton of carbon, but the mean estimate, which is driven by some very large estimates, is
$105 per metric ton of carbon (in 1995 dollars).
This analysis uses the SCC estimates from US Environmental Protection Agency (EPA) (Table 4). The
first reason to choose its estimates is because EPA estimates the SCC using three integrated assessment
models (IAM) and the results are close to mainstream estimates. The second reason is for convenience of
anlaysis. The three column values in Table 4 are based on the average SCC from three IAMs under
different scenarios. Since the amount of carbon in the atmosphere accumulates over time, the SCC should
also increase.
Table 4. Social Cost of Carbon from 2015-2050 under different discount rates
Social Cost of CO2, 2015 - 2050 (in 2011 dollars)
Year Scenario Pessimistic Baseline Optimistic
2015 12 39 61 2020 13 46 68 2025 15 50 74 2030 17 55 80 2035 20 60 85
A Cost Benefit Analysis
9
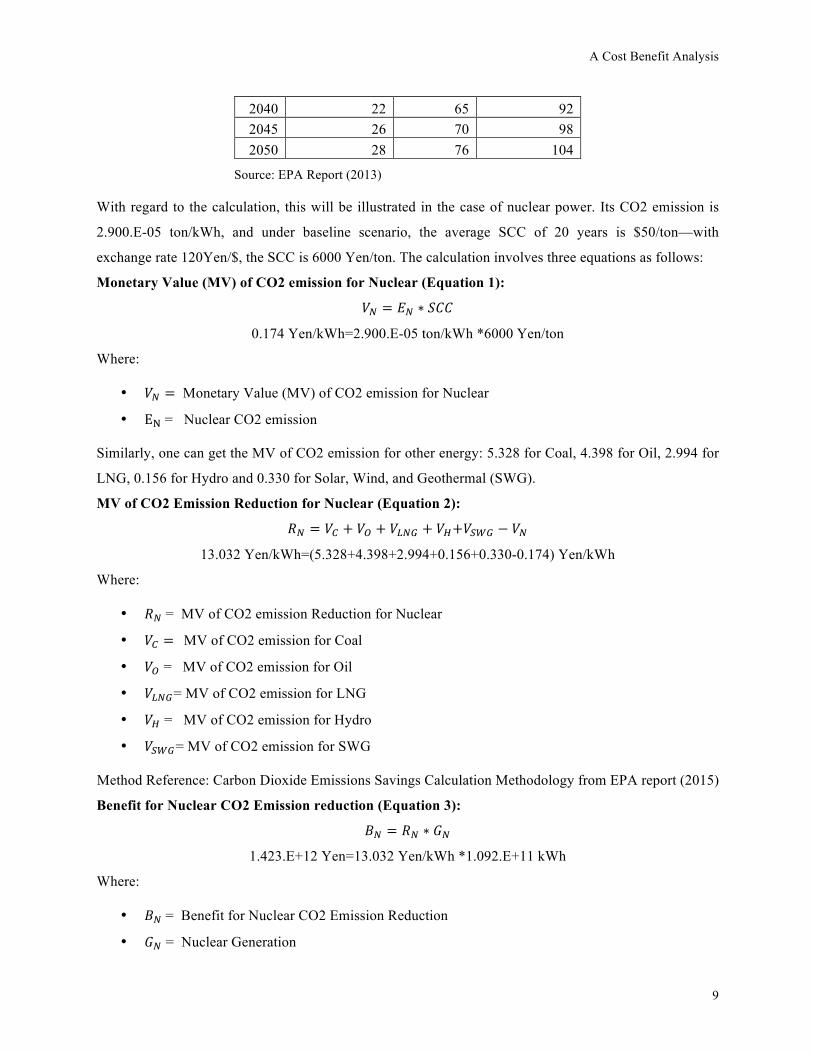
2040 22 65 92 2045 26 70 98 2050 28 76 104
Source: EPA Report (2013)
With regard to the calculation, this will be illustrated in the case of nuclear power. Its CO2 emission is
2.900.E-05 ton/kWh, and under baseline scenario, the average SCC of 20 years is $50/ton—with
exchange rate 120Yen/$, the SCC is 6000 Yen/ton. The calculation involves three equations as follows:
Monetary Value (MV) of CO2 emission for Nuclear (Equation 1):
𝑉! = 𝐸! ∗ 𝑆𝐶𝐶
0.174 Yen/kWh=2.900.E-05 ton/kWh *6000 Yen/ton
Where:
• 𝑉! = Monetary Value (MV) of CO2 emission for Nuclear
• E! = Nuclear CO2 emission
Similarly, one can get the MV of CO2 emission for other energy: 5.328 for Coal, 4.398 for Oil, 2.994 for
LNG, 0.156 for Hydro and 0.330 for Solar, Wind, and Geothermal (SWG).
MV of CO2 Emission Reduction for Nuclear (Equation 2):
𝑅! = 𝑉! + 𝑉! + 𝑉!"# + 𝑉!+𝑉!"# − 𝑉!
13.032 Yen/kWh=(5.328+4.398+2.994+0.156+0.330-0.174) Yen/kWh
Where:
• 𝑅! = MV of CO2 emission Reduction for Nuclear
• 𝑉! = MV of CO2 emission for Coal
• 𝑉! = MV of CO2 emission for Oil
• 𝑉!"#= MV of CO2 emission for LNG
• 𝑉! = MV of CO2 emission for Hydro
• 𝑉!"#= MV of CO2 emission for SWG
Method Reference: Carbon Dioxide Emissions Savings Calculation Methodology from EPA report (2015)
Benefit for Nuclear CO2 Emission reduction (Equation 3):
𝐵! = 𝑅! ∗ 𝐺!
1.423.E+12 Yen=13.032 Yen/kWh *1.092.E+11 kWh
Where:
• 𝐵! = Benefit for Nuclear CO2 Emission Reduction
• 𝐺! = Nuclear Generation

Restarting Japan’s Nuclear Power Plants
10
The final results are shown in Table 5.
Table 5. Monetary Value of the Benefits for CO2 Emission Reduction (Per Year)
Type
CO2 emission
(ton CO2e/KWh)
CO2 Emission Reduction
(Yen/KWh)
Alternative 1 Alternative 2 Alternative 3 Benefit of CO2
Emission Reduction (Yen)
Benefit of CO2 Emission
Reduction (Yen)
Benefit of CO2 Emission
Reduction (Yen) Nuclear 0.000029 13.032 1,423,250,784,000 2,490,688,872,000 - Coal 0.000888 2.724 694,151,472,000 644,569,224,000 644,569,224,000 LNG 0.000499 7.392 2,556,434,496,000 1,816,413,984,000 3,108,086,150,400 Oil 0.000733 4.584 408,846,043,200 125,156,952,000 442,221,230,400 Hydro 0.000026 13.068 1,070,386,812,000 2,021,841,756,000 1,070,386,812,000 Solar, Wind, Geothermal 0.000055 12.72 370,447,104,000 694,588,320,000 370,447,104,000
Total Benefit 6,523,516,711,200 7,793,259,108,000 5,635,710,520,800
3.1.2 Increasing the security in energy supply
Energy security refers to being able to secure energy in the necessary quantity for social activities at
affordable prices. The scarcity of energy resources in Japan has led to severe vulnerabilities. It has to
import substantial amounts of fossil fuel every year. In 2005, Japan imported 90.3% of oil from Middle
East, 58.9% of Natural Gas from Asia and 57.8% of Coal from Pacific (Table 6). This uneven distribution
of energy supplies led to a significant energy security problem, which can lead to electricity generation
shortage and the worst case will be the event of blackout. The most well-known case is in 1973, the Arab
oil embargo which caused oil prices to rise from $3 to $12 per barrel. Besides, the economic and political
instability of energy export countries and accidents, terrorism also poses threats on supply security.
Table 6. Japan’s Energy Import Component in 2005
Data Source: Central Research Institute of Electric Power Industry (2008)

A Cost Benefit Analysis
11
According to “A Valuation Study of Fuel Supply Stability of Nuclear Energy” Report (2008), the area
risks are quantified and are given in parentheses (Table 8). The risk index for Middle East is 0.35. If this
risk index is multiplied by its import ratio 90.3%, the risk for oil importing from Middle East can be
obtained, i.e. 31.7%. Summing up the first column, the total risk for oil import can be acquired, i.e.
37.6%.
The area risk for Russia, Africa and Asia are quite high because of geopolitical reasons: all of them are
over 0.50. However, risk for North America, Pacific and Europe are only 0.10. As nuclear power does not
have to be obtained from such high risk areas, it has the lowest risk, 10.7%.
Table 7. Risk Index of Japan’s Energy Import
Data Source: Central Research Institute of Electric Power Industry (2008)
With regard to the calculation, this report again uses the example of nuclear power. Additionally the risk
for renewables is assumed to be 0 since it is domestically supplied. This report uses the outage cost from
Caves et al’s paper (1992), which is about $1.27 per kWh for Industry and $0.02 for households. Outage
cost is the cost that have to be paid by the industries or households when they are experiencing electricity
blackout. For the industries, without the electricity they cannot produce their products and it will lead to
loss in sales, while for the households, the impact will be smaller than the industries, however it will still
affect their daily life. On average, the outage cost is $0.645/kWh—with exchange rate 120 Yen/$, that is
77.4 Yen/kWh. The electricity price for households is 24.33 Yen/kWh and for industry is 17.5
Yen/kWh—this report uses the average of this as 21 Yen/kWh. The calculation involves the following
two equations and final results are in Table 8.

Restarting Japan’s Nuclear Power Plants
12
Monetary Value of Power Outage Cost for Nuclear (Equation 4):
𝑃𝑂! = 𝑅𝑆! ∗ 𝐺! ∗ 𝑂𝐶
9.045.E+11 Yen=10.7%*1.092.E+11 kWh*77.4 Yen/kWh
Where:
• 𝑃𝑂! = Monetary Value (MV) of Power Outage Cost for Nuclear
• 𝑅𝑆! = Risk of Supply Security for Nuclear
• 𝐺! = Nuclear Generation
• OC = Outage Cost
Benefit of Power Secured for Nuclear (Equation 5):
𝑩𝑺𝑵 = 𝑮𝑵 ∗ 𝑬𝑷 − 𝑷𝑶𝑵
1.380.E+12 Yen=1.092.E+11 kWh*21 Yen/kWh -9.045.E+11 Yen
Where:
• 𝐵𝑆! = Benefit of Power Secured for Nuclear
• 𝐸𝑃 = Electricity Price
Table 8. Monetary Value of the Benefits for Increasing Energy Supply Security (Per Year)
Type Risk of Supply
Security
Alternative 1 Alternative 2 Alternative 3 Benefit of Power
Secured (Yen) Benefit of Power
Secured (Yen) Benefit of Power
Secured (Yen) Nuclear 10.7% 1,379,697,038,400 2,414,469,817,200 - Coal 24.0% 596,042,692,000 553,468,214,000 659,904,409,000 LNG 33.4% -1,707,263,870,800 -1,213,055,908,200 -2,075,673,442,920 Oil 37.6% -730,232,568,520 -223,540,582,200 -789,843,390,440 Hydro 0.0% 1,713,126,735,000 3,235,906,055,000 1,713,126,735,000 Solar, Wind, Geothermal 0.0% 609,111,728,000 1,142,084,490,000 609,111,728,000
3.2 Cost Components
3.2.1 Fuel life cycle cost
‘Fuel Life Cycle’ in the context of this analysis refers to all front end and back end costs of various
energies including procurement, distribution, refinement/storage, and disposal. For example, for the case
of nuclear power generation, disposal cost is an important consideration since nuclear waste can be
hazardous to human health and the environment, and must be stored safely. This report uses estimates

A Cost Benefit Analysis
13
from the Advisory Committee on Energy and Natural Resources presentation, June 2015 (発電コスト検
証ワーキンググループ) .
Table 9. Fuel Life Cycle Cost
Type Cost (Yen / KWh) Nuclear 1.50 Coal 5.50 LNG 10.80 Oil 21.70 Hydro 0.1 Solar, Wind, Geothermal 0.317
3.2.2 Upgrading and safety regulations compliance cost
This refers to the cost associated with additional safety precautions/upgrades to comply with new
regulation after the Fukushima accident and thus applies only to nuclear power generation in the context
of this report. Due to increased public concern about nuclear disaster, current facilities, in order to be
restarted, have to undergo stricter safety regulations, requiring additional cost of various upgrades to
nuclear power plants (Matsuo 2012). This cost is estimated to be 0.2 Yen/ kWh nuclear energy produced,
and since this regulation only applies to nuclear power plants, this additional upgrade cost will not be
applied to power generation in the case of other energy plants.
3.2.3 Upgrading and safety regulations compliance cost
For all forms of energy, it is necessary to factor in the various costs of maintaining and operating
equipment, including labor cost, to produce power for energy production. Here also, estimates from the
Advisory Committee on Energy and Natural Resources presentation, June 2015 (発電コスト検証ワーキ
ンググループ) are used as reference in calculating comparative energy costs.
Table 10. Operational and Maintenance Cost
Type Cost (Yen / KWh) Nuclear 3.30 Coal 1.70 LNG 0.60 Oil 2.60 Hydro 12.80 Solar, Wind, Geothermal 4.70

Restarting Japan’s Nuclear Power Plants
14
3.2.4 Decommissioning Cost
All power plants, regardless of the energy source, have a finite life because it will not be economically
feasible to operate them after some years—as such, ‘decommissioning cost’ is the cost associated with
dismantling a plant once running the plant is no longer economically feasible.
For the purposes of this report, decommissioning cost is strictly defined as the cost of dismantling a
plant—all other waste disposal related costs in this report have been included under fuel cycle costs so as
to highlight ‘decommissioning cost’ as a high cost particularly associated with nuclear power. For
renewables, although these energies don’t require a fuel source to generate power, all disposal related
costs have also been included as part of ‘fuel life cycle’ costs (for renewables, according to the data
collected, there is no separate measure of plant dismantling cost) (発電コスト検証ワーキンググルー
プ) .
Table 11. Decommissioning Cost
Type Cost (Yen / KWh) Nuclear 0.3000 Coal 0.084 LNG 0.04 Oil 0.152 Hydro - Solar, Wind, Geothermal -
3.2.5 Risk of Reactors’ accident
Like other industries, there is a potential hazard of accidents. In the case of nuclear power, although the
design and operation process aims to minimize the likelihood of a catastrophic nuclear meltdown, there
have been three major nuclear accidents in history- Three Mile Island, Chernobyl and Japan’s Fukushima.
While all energy plants may carry some fatality or accident risk, this report seeks to emphasize the
additional cost associated with risk of catastrophic accident, which is small but with high consequence
when considering nuclear power, and is a major point of dissent among debates about nuclear power
expansion. As such, for purpose of this report’s analysis, this is an additional cost associated only with
nuclear power.
According to the Japan Atomic Energy Commission (JAEC), the accident cost for nuclear power at 70%
operation depends on the assumed standard for frequency of severe accident risk—according to IAEA
safety standard for early large release from existing reactor, this cost is 0.007 yen/kWh; if the severe
accident frequency of the world’s commercial reactors is assumed to be once every fifty-seven years, this

A Cost Benefit Analysis
15
cost is 0.24 yen/kWh; if the severe accident frequency of domestic commercial reactors is assumed to be
once every ten years, then this cost is 1.4 yen/kWh. Accordingly, this report uses these three values to
form the basis of sensitivity analysis based on assumed severe accident frequency, with 0.007 yen/kWh as
optimistic scenario, 0.24 yen/kWh as the base scenario, and 1.4 yen/kWh for the pessimistic scenario.
4. Analysis and Policy Recommendation
4.1 Cost – Benefit Analysis
The result the cost benefit analysis (CBA) in this report will be represented by the net present value
(NPV) and also benefit-cost ratio (BCR). Net present value is defined as the sum of discounted net benefit
(benefit minus cost) over the period, and when properly calculated, it can be a relatively objective method
of determining the improvement in national wealth resulting from the proposed policy alternatives
(Boardman, Greenberg, Vining, & Weimer, 2010). A policy alternative with a higher NPV is more
desirable to be implemented compared to that with a lesser value. The net present value can be calculated
by using this formula:
𝐵!(1 + 𝑖)!
!
!!!
− 𝐶!
(1 + 𝑖)!
!
!!!
Where:
• 𝐵!: Benefit at year t
• 𝐶!: Cost at year t
• 𝑡: Year at which the benefit and cost occur
• 𝑖: Social discount rate
Moreover, there is one more value that will be analyzed in the CBA, which is the value of benefit-cost
ratio (BCR). By definition, BCR is the ratio of the benefits of a policy alternative, expressed in monetary
terms, relative to its costs, also expressed in monetary terms (Boardman, Greenberg, Vining, & Weimer,
2010). Policy alternatives with a higher BCR are more desirable to be implemented compared to those
with lesser values. The below formula can be used in order to calculate the BCR:
𝐵𝑒𝑛𝑒𝑓𝑖𝑡 𝐶𝑜𝑠𝑡 𝑅𝑎𝑡𝑖𝑜 =𝑇𝑜𝑡𝑎𝑙 𝐵𝑒𝑛𝑒𝑓𝑖𝑡𝑇𝑜𝑡𝑎𝑙 𝐶𝑜𝑠𝑡
The general result of this cost benefit analysis will be represented by assuming a baseline scenario where
the social cost of carbon equals to $50 per KWh (6000 yen per KWh), social discount rate of 5%, and risk
of reactor accident that equals to 0.24 yen per KWh. This general result will be explained in each

Restarting Japan’s Nuclear Power Plants
16
alternative, by using the calculation of their net present values and also benefit cost ratios.
4.1.1 Alternative 1 (Restarting 24 Nuclear Power Plants)
In this alternative, as has been explained in chapter 1, the government will give an approval for 24 nuclear
power plants that had applied for safety review procedures. These 24 nuclear power plants will represent
12% of the electricity generation or energy mix, while the rest of the energy mix will be fulfilled by coal,
LNG, oil, hydro, and SWG (solar, wind, and geothermal), with the percentage of 28%, 38%, 9.8%, 9%,
and 3.2% respectively.
Based on this energy mix, the calculation of the net present value and benefit cost ratio of this alternative
can be calculated as follows:
Table 12. NPV and BCR for Alternative 1
Year Discount Factor
Discounted Values Benefit (Yen) Cost (Yen) Net Benefit (Yen)
0 1 - 9,801,194,536,000 -9,801,194,536,000 1 0.952380952 7,984,760,443,124 9,334,470,986,667 -1,349,710,543,543 2 0.907029478 7,604,533,755,356 8,889,972,368,254 -1,285,438,612,898 3 0.863837599 7,242,413,100,339 8,466,640,350,718 -1,224,227,250,379 4 0.822702475 6,897,536,286,037 8,063,467,000,684 -1,165,930,714,647 5 0.783526166 6,569,082,177,178 7,679,492,381,604 -1,110,410,204,425 6 0.746215397 6,256,268,740,170 7,313,802,268,194 -1,057,533,528,024 7 0.71068133 5,958,351,181,114 6,965,525,969,709 -1,007,174,788,594 8 0.676839362 5,674,620,172,490 6,633,834,256,865 -959,214,084,376 9 0.644608916 5,404,400,164,276 6,317,937,387,491 -913,537,223,215
10 0.613913254 5,147,047,775,501 6,017,083,226,182 -870,035,450,681 11 0.584679289 4,901,950,262,382 5,730,555,453,506 -828,605,191,125 12 0.556837418 4,668,524,059,411 5,457,671,860,482 -789,147,801,071 13 0.530321351 4,446,213,389,915 5,197,782,724,269 -751,569,334,353 14 0.505067953 4,234,488,942,777 4,950,269,261,208 -715,780,318,432 15 0.481017098 4,032,846,612,168 4,714,542,153,532 -681,695,541,364 16 0.458111522 3,840,806,297,303 4,490,040,146,221 -649,233,848,918 17 0.436296688 3,657,910,759,336 4,276,228,710,686 -618,317,951,350 18 0.415520655 3,483,724,532,701 4,072,598,772,082 -588,874,239,381 19 0.395733957 3,317,832,888,287 3,878,665,497,221 -560,832,608,934 20 0.376889483 3,159,840,845,987 3,693,967,140,211 -534,126,294,223
Total 104,483,152,385,852 138,052,969,847,575 -27,462,590,065,934 NPV (Yen) -27,462,590,065,934
BCR 0.79

A Cost Benefit Analysis
17
As it can be seen from the above table, the result for the net present value for alternative 1 is minus
27,462,590,065,934 yen, which makes this alternative not feasible to be executed since the cost is bigger
than the benefit. The benefit cost ratio also indicates that the cost of this alternative is bigger than its
alternative, with the BCR of 0.76, which also makes the implementation of this alternative not feasible.
This result reflects that, in fact, to restart 24 nuclear power plants is not sufficient to achieve a good NPV
and BCR result, which means this alternative is not economically viable. It happens because in this
alternative, the energy mix is still dominated by fossil fuels, which have a higher carbon emission, less
energy supply security, and higher fuel life cycle cost. These factors drive down the monetary value of its
benefit and at the same time increasing the monetary value of its cost. Besides this, renewable energy still
plays a minor role in this alternative, which lowers the benefits of carbon emission reduction as well as
the benefits of energy supply security—this is because renewable energy is low on greenhouse gas
emission (GHG) and it can also be produced domestically, which reduce the dependency on importing
fossil fuel and increase the energy supply security.
4.1.2 Alternative 2 (Japan Energy Mix 2030)
According to Ishii (2015)’s article, the Subcommittee on Long-term Energy Supply-demand Outlook,
under the Advisory Committee for Natural Resources and Energy, approved a report based on the
Japanese government’s plan to set the energy mix in 2030 to become 21% nuclear, 26% coal, 27% LNG,
3% oil, 17% hydro, and 6% solar, wind, and geothermal. This government plan for energy mix 2030 will
be considered as alternative 2, with the calculation of NPV and BCR as follows:
Table 13. NPV and BCR for Alternative 2
Year Discount Factor
Discounted Values Benefit (Yen) Cost (Yen) Net Benefit (Yen)
0 1 - 8,530,931,562,000 -8,530,931,562,000 1 0.952380952 13,050,086,851,238 8,122,945,866,667 4,927,140,984,571 2 0.907029478 12,428,654,144,036 7,736,138,920,635 4,692,515,223,401 3 0.863837599 11,836,813,470,511 7,367,751,352,986 4,469,062,117,525 4 0.822702475 11,273,155,686,201 7,016,906,050,463 4,256,249,635,738 5 0.783526166 10,736,338,748,763 6,682,767,667,107 4,053,571,081,655 6 0.746215397 10,225,084,522,631 6,364,540,635,340 3,860,543,887,291 7 0.710681330 9,738,175,735,839 6,061,467,271,753 3,676,708,464,087 8 0.676839362 9,274,453,081,752 5,772,825,973,098 3,501,627,108,654 9 0.644608916 8,832,812,458,811 5,497,929,498,188 3,334,882,960,623
10 0.613913254 8,412,202,341,725 5,236,123,331,608 3,176,079,010,117 11 0.584679289 8,011,621,277,833 4,986,784,125,341 3,024,837,152,492 12 0.556837418 7,630,115,502,698 4,749,318,214,610 2,880,797,288,088

Restarting Japan’s Nuclear Power Plants
18
13 0.530321351 7,266,776,669,236 4,523,160,204,391 2,743,616,464,846 14 0.505067953 6,920,739,684,987 4,307,771,623,229 2,612,968,061,758 15 0.481017098 6,591,180,652,369 4,102,639,641,171 2,488,541,011,198 16 0.458111522 6,277,314,907,018 3,907,275,848,734 2,370,039,058,284 17 0.436296688 5,978,395,149,541 3,721,215,094,032 2,257,180,055,508 18 0.415520655 5,693,709,666,229 3,544,014,375,269 2,149,695,290,960 19 0.395733957 5,422,580,634,504 3,375,251,785,970 2,047,328,848,534 20 0.376889483 5,164,362,509,051 3,214,525,510,448 1,949,836,998,603
Total 170,764,573,694,972 114,822,284,553,039 55,942,289,141,933 NPV (Yen) 55,942,289,141,933
BCR 1.49
The result of the net present value for this alternative is 55,942,289,141,933 yen, which suggests that this
alternative can be implemented by the government, since the NPV is positive. It is also supported by the
result of the benefit cost ratio with 1.49, which reflects that when the government invests 1 yen in this
alternative, they will get 1.49 yen in return.
This alternative gives a good NPV and BCR result, because the energy mix 2030 that had been announced
by the government consists of a higher percentage of nuclear and renewable energy, while the percentage
of the fossil fuel in the energy mix will be reduced. This energy mix 2030 represents the intention of the
government to restart 43 of its currently inactive nuclear power plants as well as to focus on developing
the technology for renewable energy. These factors will increase the benefits of carbon emission
reduction, since the government will use more nuclear and renewable energy, which have almost zero
greenhouse gas emission. Besides this, as has been explained in chapter 3, nuclear has a low risk of
supply failure, while the risk of supply failure for renewable energy is simply zero, because it can be
produced domestically, thus it can increase the benefits of energy supply security.
4.1.3 Alternative 3 (Without Restarting Nuclear Power Plants)
The third alternative will be where the government will not restart any nuclear power plants or not
increasr the percentage of renewable energy in its energy mix, which means the energy mix will be quite
similar to as it was in 2014. The 2014 energy mix consisted of 0% nuclear, 31% coal, 46.2% LNG, 10.6%
oil, 9% hydro, and 3.2% solar, wind, and geothermal. The calculation of the NPV and BCR for this
alternative will be as follows:

A Cost Benefit Analysis
19
Table 14. NPV and BCR for Alternative 3
Year Discount Factor
Discounted Values Benefit (Yen) Cost (Yen) Net Benefit (Yen)
0 1 - 10,426,811,837,600 -10,426,811,837,600 1 0.952380952 5,478,415,770,895 9,930,296,988,190 -4,451,881,217,295 2 0.907029478 5,217,538,829,424 9,457,425,703,039 -4,239,886,873,615 3 0.863837599 4,969,084,599,451 9,007,072,098,132 -4,037,987,498,680 4 0.822702475 4,732,461,523,287 8,578,163,902,983 -3,845,702,379,696 5 0.783526166 4,507,106,212,654 8,169,679,907,603 -3,662,573,694,948 6 0.746215397 4,292,482,107,290 7,780,647,531,050 -3,488,165,423,760 7 0.710681330 4,088,078,197,419 7,410,140,505,762 -3,322,062,308,343 8 0.676839362 3,893,407,807,066 7,057,276,672,154 -3,163,868,865,089 9 0.644608916 3,708,007,435,301 6,721,215,878,242 -3,013,208,442,942
10 0.613913254 3,531,435,652,667 6,401,157,979,278 -2,869,722,326,611 11 0.584679289 3,363,272,050,159 6,096,340,932,646 -2,733,068,882,487 12 0.556837418 3,203,116,238,247 5,806,038,983,472 -2,602,922,745,225 13 0.530321351 3,050,586,893,569 5,529,560,936,640 -2,478,974,043,072 14 0.505067953 2,905,320,851,018 5,266,248,511,086 -2,360,927,660,068 15 0.481017098 2,766,972,239,064 5,015,474,772,463 -2,248,502,533,399 16 0.458111522 2,635,211,656,252 4,776,642,640,441 -2,141,430,984,189 17 0.436296688 2,509,725,386,907 4,549,183,467,087 -2,039,458,080,180 18 0.415520655 2,390,214,654,197 4,332,555,682,940 -1,942,341,028,743 19 0.395733957 2,276,394,908,759 4,126,243,507,562 -1,849,848,598,803 20 0.376889483 2,167,995,151,199 3,929,755,721,487 -1,761,760,570,288
Total 71,686,828,164,824 140,367,934,159,857 -68,681,105,995,033 NPV (Yen) -68,681,105,995,033
BCR 0.51
Based on the calculation, it turns out that the result of NPV of the alternative 3 is the worst among these
three alternatives, with minus 68,681,105,995,033 yen. Besides this, the benefit cost ratio is below 1
(0.51), which shows that when the government invests 1 yen in this alternative, they will get a return of
0.51 yen (which shows that the government loses 0.39 yen). This happens because the benefit of this
alternative is really low, due to the dependency of the fossil fuel import, which lowers the benefits of
energy supply security. In addition, by implementing this policy alternative, fossil fuel will still be the
major energy sources for Japan’s electricity generation, which increases carbon emission (thus it will
reduce the benefits of carbon emission reduction). And from the cost side, since oil’s proportion is still
quite significant in this alternative’s energy mix, therefore the total fuel life cycle cost will be high,
because oil’s fuel life cycle cost is the highest among the other energy sources, with 21.7 yen per KWh.

Restarting Japan’s Nuclear Power Plants
20
4.2 Sensitivity Analysis
According to Boardman, Greenberg, Vining, & Weimer (2010), the purpose of sensitivity analysis is to
recognize the uncertainty of the cost benefit analysis’s result, which can be shown by how sensitive the
projected result is to the change in scenarios or assumptions. In this analysis, three scenarios have been
developed, which are baseline, optimistic, and pessimistic scenario. These three scenarios are developed
based on some certain assumptions that will be changed in order to analyze the sensitivity of each
alternative under a certain circumstance. The assumptions that will be changed in this sensitivity analysis
are the value of discount rate, social cost of carbon, and also the risk of reactor’s accident cost, which can
be seen from the table below.
Table 15. Assumptions for Sensitivity Analysis
Input Pessimistic Baseline Optimistic Social Discount Rate 10% 5% 3% Social Cost of Carbon (Yen / ton of CO2e) 1,848 6,000 8,832 Risk of Reactor Accident (Yen / KWh) 1.4 0.24 0.007
Using the assumptions from table 15, a calculation has been done with the result as follows:
Figure 2. Sensitivity Analysis Matrix
From the above matrix, the most feasible alternative is alternative 2, which is the Japan energy mix 2030.
This alternative is feasible under the baseline and optimistic scenario, while in the pessimistic scenario
Baseline Scenario
Alternative 1 (Restarting 24 Nuclear Reactors)
Alternative 2 (Japan Energy Mix 2030)
Alternative 3 (Japan’s Current Energy Mix - w/o nuclear)
Optimistic Scenario
Pessimistic Scenario
1. NPV = -27,462,590,065,934 Yen
2. BCR= 0.79
1. NPV = 55,942,289,141,933 Yen
2. BCR= 1.49
1. NPV = -68,681,105,995,033 Yen
2. BCR= 0.51
1. NPV = 15,327,762,234,192 Yen
2. BCR= 1.10
1. NPV = 123,870,274,043,094 Yen
2. BCR= 1.92
1. NPV = -40,396,293,441,875 Yen
2. BCR= 0.76
1. NPV = -61,504,373,796,598 Yen
2. BCR= 0.35
1. NPV = -12,508,285,235,130 Yen
2. BCR= 0.85
1. NPV = -83,425,401,567,113 Yen
2. BCR= 0.16
Feasible
Not Feasible

A Cost Benefit Analysis
21
this alternative is not feasible with the NPV of minus 12,508,285,235,130 yen and BCR of 0.85.
Alternative 2 becomes the most feasible alternative due to its bigger proportion of nuclear and renewable
energy in the energy mix. As has been explained before, a bigger percentage of nuclear and renewable
energy means that benefit of CO2 emission reduction and also energy supply security will be bigger as
well, which is why alternative 2 gives a good result for its NPV and also BCR.
As for alternative 1 (restarting 24 nuclear power plants), it is only feasible under the optimistic scenario
with the NPV of 15,327,762,234,192 yen and BCR of 1.10. It happens because the proportion of the
energy contribution from the 24 nuclear power plants represents just 12% of the total energy mix, while
fossil fuel energy still becomes the biggest energy source under this alternative, comprising more than
70% of the total energy mix. This factor causes both benefits of CO2 emission reduction and energy
supply security to be less in comparison to alternative 2.
In this sensitivity analysis, alternative 3 appears to have the worst NPV and BCR results, which makes it
unfeasible under any scenario. Thus is due to this policy alternative’s huge dependency on fossil fuels,
which significantly reduces the benefit of CO2 emission reduction as well as the benefit of energy supply
security.
4.3 Policy Recommendation
Based on the cost benefit analysis and also the sensitivity analysis that has been done in the previous sub-
chapter, it is clear that the government of Japan should aim to implement policy alternative 2, which is the
Japan energy mix 2030. By implementing this alternative, the government can maintain Japan’s
greenhouse gas emission, and most importantly, the government can reduce the dependency on the import
of fossil fuels, which has greatly burdened Japan’s trade balance. By improving its trade balance,
hopefully Japan can improve its economic condition in the future.
Alternative 1 (restarting 24 nuclear power plants) can be used a starting point towards implementing
alternative 2, since alternative 1 can be easily implemented in the short-run by giving an approval to
restart these 24 nuclear power plants, which have already applied for the safety review assessment.
However, after the government will have restarted those 24 nuclear power plants, they should continue to
restart the other 19 nuclear power plants in order to fulfill the proportion of nuclear energy in the Japan
energy mix 2030, which is 21% or 43 nuclear power plants. Beside nuclear energy, the government
should further develop renewable energy technology to generate electricity, which can reduce greenhouse
gas emissions and can be produced domestically, thus it can reduce the dependency on import of fossil
fuels.

Restarting Japan’s Nuclear Power Plants
22
5. Conclusion
Although concerns about safety after the Fukushima Disaster have forced Japan to suspend operation of
all its nuclear reactors currently, it is clear that without nuclear energy, Japan is heavily dependent on fuel
imports to meet the country's domestic energy demand, which has significantly contributed to Japan’s
trade deficit and to rising costs of electricity. Another consequence of Japan’s current fossil fuel
dependence is a reduction in energy supply security, such as the geopolitical instability of the oil market.
In addition, without nuclear power as part of the energy mix, a relatively ‘clean’ energy source compared
to fossil fuels, Japan will have difficulty capping carbon emissions and meeting environmental targets.
Nevertheless, critics of a return to nuclear energy use in Japan point to additional costs of safety upgrades
for power plants to meet new safety requirements, the small but ‘high consequence’ risk of another severe
accident occurring, and the expensive nature of plant decommissioning- all costs primarily associated
with nuclear energy despite its relatively lower fuel cycle costs and other benefits.
Considering the various costs and benefits of nuclear power in Japan, this report analyzes three policy
alternatives in order to make a policy recommendation about exclusion or inclusion of nuclear energy in
Japan’s energy mix: Alternative 1 –the “with” case of restarting 24 Japan’s nuclear power plants,
Alternative 2 - Japanese Energy Mix 2030 as set by the government which affords a greater contribution
of renewables to supplying Japan’s energy needs, and Alternative 3 – maintaining Japan’s current
situation, the “without” restart of Japan’s nuclear power plants case.
After performing cost benefit analysis along with sensitivity analysis along the parameters of variable
social discount rate, social cost of carbon, and accident risk, this report concludes the following:
1) In the baseline scenario, Alternative 1, restart of 24 nuclear power plants, is not sufficient to
achieve a good NPV and BCR result, which means this alternative is not economically viable, as
the domination by fossil fuels in the energy mix, with little contribution from renewable energy,
outweighs any benefits of including nuclear energy.
2) Alternative 2, Energy mix 2030 as announced by the government, has a high NPV and BCR
result due to the higher percentage of renewable energy contribution in addition to nuclear, and
the reduced dependence on fossil fuels in the energy mix. These factors will increase the benefits
of carbon emission reduction, as well as taking advantage of increased energy supply security by
incorporating renewable and nuclear energy into the mix.
3) Alternative 3, without restart, has the worst NPV and BCR results in all scenarios of the
sensitivity analysis. Again, a strong dependency on oil, with the highest fuel life cycle cost
among all energy sources, and other fossil fuels without nuclear energy, means overall net

A Cost Benefit Analysis
23
benefits are greatly reduced—this mix excludes nuclear energy’s benefit of CO2 emission
reduction and increased energy supply security.
Based on these results, in the short term, the government should continue with restart of the 24 nuclear
power plants but as this is not yet economically feasible in the baseline scenario, in the longer term the
Japanese government should continue to restart the other 19 nuclear power plants in order to fulfill the
proportion of nuclear energy in the Japan energy mix 2030, which is 21%. Besides nuclear energy, to
fulfill its targets for Japan Energy Mix 2030, the government should further prepare for the
implementation of renewable energy technologies—this would reduce greenhouse gas emissions and, as
these energies can be produced domestically, further reduce dependency on fossil fuel imports.
However, despite supporting evidence for this paper’s cost benefit analysis, several limitations need to be
addressed for a more accurate and descriptive analysis of Japan’s future energy supply situation. Firstly,
in the analysis, time horizon was determined by aggregating the operation span and decommissioning
costs of all power plants together, although in actuality each plant has different operation span and
various upgrading/decommissioning costs—thus, to deliver a more ‘fine-tuned’ analysis it would be
better to calculate the time horizon and decommissioning cost separately for each power plant.
Additionally, it may be possible to determine an equation that more accurately models shadow prices such
as the social cost of carbon and security in energy supply. Finally, a significant limitation of this study is
accurately appraising the various costs and benefits of the secondary market, renewable energy, due to its
limited technology development and implementation in current energy schemes. Once renewables
become more widely and successfully used in national energy supply design, economies of scale and
other factors will greatly change their economic costs and benefits, which may further effect the relative
cost/benefit contributions of nuclear energy as a ‘clean’ and secure energy alternative.
Nevertheless, it would be possible to improve this analysis by adjusting various benefit and costs of
renewables in the future, as well as calibrating the various costs and benefits to each energy plant rather
than analyzing the aggregate of these measures for nuclear energy. Similarly, by using more well-defined
calculations for various shadow prices detailing the benefits of nuclear energy, it is possible to improve
the current cost benefit analysis. Additionally, including more values for other contested parameters such
as accident risk, would further strengthen sensitivity analysis and provide a more holistic examination
about the application of nuclear energy to Japan’s energy mix.
Restarting Japan’s Nuclear Power Plants
24
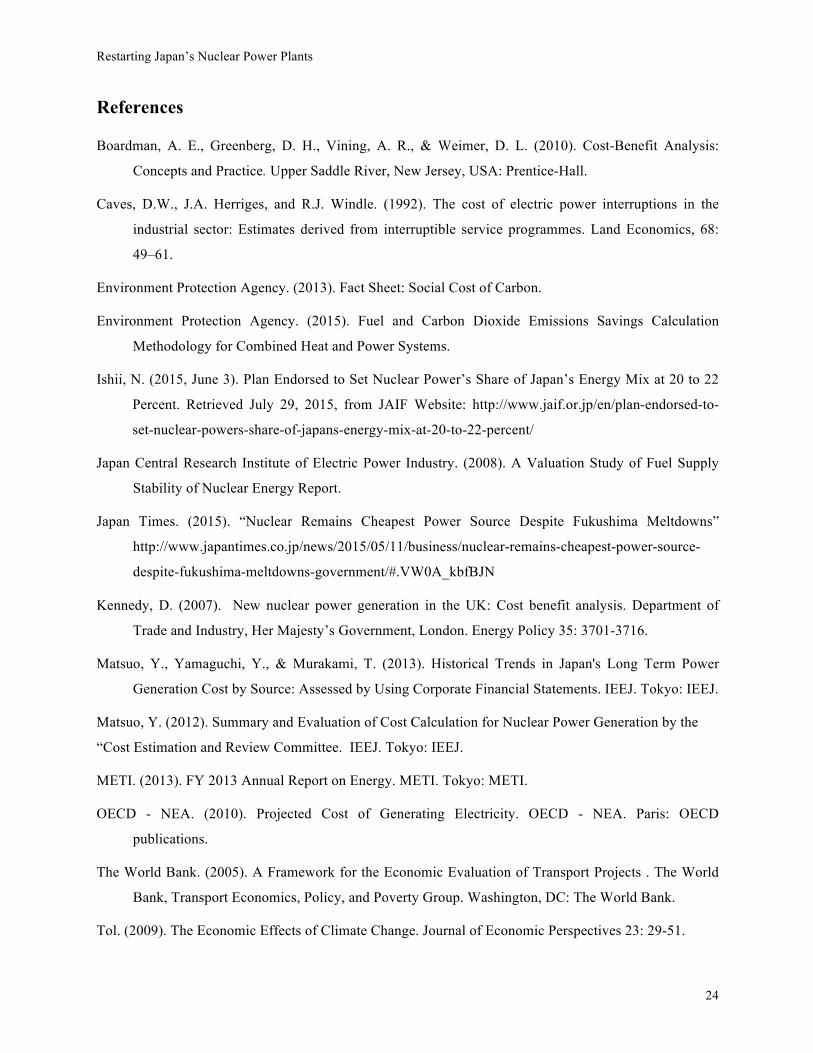
References
Boardman, A. E., Greenberg, D. H., Vining, A. R., & Weimer, D. L. (2010). Cost-Benefit Analysis:
Concepts and Practice. Upper Saddle River, New Jersey, USA: Prentice-Hall.
Caves, D.W., J.A. Herriges, and R.J. Windle. (1992). The cost of electric power interruptions in the
industrial sector: Estimates derived from interruptible service programmes. Land Economics, 68:
49–61.
Environment Protection Agency. (2013). Fact Sheet: Social Cost of Carbon.
Environment Protection Agency. (2015). Fuel and Carbon Dioxide Emissions Savings Calculation
Methodology for Combined Heat and Power Systems.
Ishii, N. (2015, June 3). Plan Endorsed to Set Nuclear Power’s Share of Japan’s Energy Mix at 20 to 22
Percent. Retrieved July 29, 2015, from JAIF Website: http://www.jaif.or.jp/en/plan-endorsed-to-
set-nuclear-powers-share-of-japans-energy-mix-at-20-to-22-percent/
Japan Central Research Institute of Electric Power Industry. (2008). A Valuation Study of Fuel Supply
Stability of Nuclear Energy Report.
Japan Times. (2015). “Nuclear Remains Cheapest Power Source Despite Fukushima Meltdowns”
http://www.japantimes.co.jp/news/2015/05/11/business/nuclear-remains-cheapest-power-source-
despite-fukushima-meltdowns-government/#.VW0A_kbfBJN
Kennedy, D. (2007). New nuclear power generation in the UK: Cost benefit analysis. Department of
Trade and Industry, Her Majesty’s Government, London. Energy Policy 35: 3701-3716.
Matsuo, Y., Yamaguchi, Y., & Murakami, T. (2013). Historical Trends in Japan's Long Term Power
Generation Cost by Source: Assessed by Using Corporate Financial Statements. IEEJ. Tokyo: IEEJ.
Matsuo, Y. (2012). Summary and Evaluation of Cost Calculation for Nuclear Power Generation by the
“Cost Estimation and Review Committee. IEEJ. Tokyo: IEEJ.
METI. (2013). FY 2013 Annual Report on Energy. METI. Tokyo: METI.
OECD - NEA. (2010). Projected Cost of Generating Electricity. OECD - NEA. Paris: OECD
publications.
The World Bank. (2005). A Framework for the Economic Evaluation of Transport Projects . The World
Bank, Transport Economics, Policy, and Poverty Group. Washington, DC: The World Bank.
Tol. (2009). The Economic Effects of Climate Change. Journal of Economic Perspectives 23: 29-51.

A Cost Benefit Analysis
25
World Nuclear Association Report. (2011). Comparison of Lifecycle Greenhouse Gas Emissions of
Various Electricity Generation Sources.
Yoshihiro NAGAOKI. (2013). Estimation of Accident Risk Cost of Nuclear Power Plants. Subcommittee
on Nuclear Power and Nuclear Fuel Cycle Technologies Presentation.
総合資源エネルギー調査会. (2011). 原子力発電所の廃炉に係る料金・会計制度の検証結果と対
応策.
コスト等検証委員会. (2011).コスト等検証委員会報告書. エネルギー・環境会議.
発電コスト検証ワーキンググループ. (2015). 長期エネルギー需給見通し小委員会に対する発電
コスト等の検証に関する報告.