response to intervention: beliefs, … · judy harris-looby, ph.d. ... rti/mtss models 34 ......
TRANSCRIPT

RESPONSE TO INTERVENTION: BELIEFS, PRACTICES, AND SKILLS IN URBAN
SECONDARY STAFF
DISSERTATION
Presented in Partial Fulfillment of the Requirements for
the Degree of Doctor of Philosophy in
Leadership and Education in
the Adrian Dominican School of Education of
Barry University
by
Jennifer J. Lesh, B.S., M.S.
*****
Barry University
2013
Area of Specialization: Exceptional Student Education

ii
RESPONSE TO INTERVENTION: BELIEFS, PRACTICES, AND SKILLS IN URBAN
SECONDARY STAFF
DISSERTATION
by
Jennifer J. Lesh, B.S., M.S.
2013
APPROVED BY:
________________________________
Catherine Roberts, Ph.D.
Chairperson, Dissertation Committee
_______________________________
Lauran Sandals, Ph.D.
Member, Dissertation Committee
_______________________________
Judy Harris-Looby, Ph.D.
Member, Dissertation Committee
_______________________________
James McLeskey, Ph.D.
Outside Member, Dissertation Committee
_______________________________
Terry Piper, Ph.D.
Dean, Adrian Dominican School of Education

iii
Copyright © 2013 by Jennifer J. Lesh
All Rights Reserved
iv
Abstract
Response to Intervention: Beliefs, Practices, and Skills
in Urban Secondary Staff
The purpose of this study was to investigate secondary school staff’s beliefs, practices,
and skills concerning Response to Intervention (RtI), now known as multi-tiered system
of supports (MTSS). The majority of research in RtI/MTSS has focused on the
elementary level; however, little research has addressed its implementation at the
secondary level. Using an exploratory mixed method design, this study explored the
beliefs and perceptions of over 300 secondary school staff currently implementing
RtI/MTSS in a large urban district in south Florida. The first phase, a quantitative
research design, used three surveys developed and vetted by the Florida Statewide
Problem Solving and Response to Intervention Project. The surveys assessed the
RtI/MTSS beliefs of four secondary school groups: administrators, professional support
staff, general education and special education teachers, and measured their
perceptions about their RtI/MTSS skills and practices. The second phase of the study
utilized a qualitative design that included four homogeneous focus groups to address in
depth the issues that had emerged in the quantitative survey phase. In order to reduce
the possibility of Type I error, only statistically significant findings at p <.001 were
reported as there were multiple tests of significance conducted. MANOVA results
showed that secondary special education teachers and administrators had significantly
higher RtI/MTSS beliefs and perceptions of their RtI/MTSS skills than the other two
groups, while secondary general education teachers had the lowest beliefs and
perceptions about their RtI/MTSS skills. There were no significant differences in
perceptions of practices among the four groups of participants. Major themes that
emerged from the focus groups included the need for reorganization of urban secondary

v
school structure, for extensive and intensive professional development, for authentic
collaboration to build trust, for delineation of role clarity, and for improved knowledge
of the RtI/MTSS framework.

vi
Acknowledgments
There are not enough ways to say thank you to my life partner, Michele, for her support,
dedication, and continued words of faith. Because of you Michele, I believed, therefore I
did. Without your stability I could have never attempted this undertaking. I would like to
express my deep gratitude to Dr. Catherine Roberts, the Chair of my dissertation, for her
endless coaching, encouragement, and diligence in keeping me on a strict time schedule.
I will always remember your stories from the Bronx! I would like to thank Sister Phyllis
Superfisky; it is because of you I found courage to pursue this undertaking, and walked
the path. I would like to thank committee members Dr. Judy Harris-Looby and Dr.
Lauren Sandals for their very useful critiques of my work, as well as their enthusiasm for
the process! To Dr. James McLeskey, I feel that my career has come full circle with you
agreeing to be an outside member of my committee. I cannot believe it was 30 years ago
that I was attending your undergraduate course, Introduction to Emotional/Behavioral
Disorders at Indiana University. Thank you Dr. McLeskey, for tying my past special
education endeavors to the present, this has been very special! I would also like to thank
Assistant Superintendent Mr. Keith Oswald and my supervisor at the time Mr.
Christopher Glinton for granting me permission to conduct this study in our school
district. Lastly, I would like to thank all the participants in my survey and the members
of the focus groups, without their valuable input this study would have never been a
reality.

vii
Dedication
To my Mom, Alice, who worked at Indiana University as a secretary and sacrificed so
much so I would have an opportunity to obtain a higher education degree. She instilled in
me the love of education, of teaching others to overcome, and of life-long learning. To
Peterson and Nalu who were my eternal study buddies. To my soul mate, Michele,
without whose encouragement, support, and patience, this endeavor would ever have
come to fruition.
viii
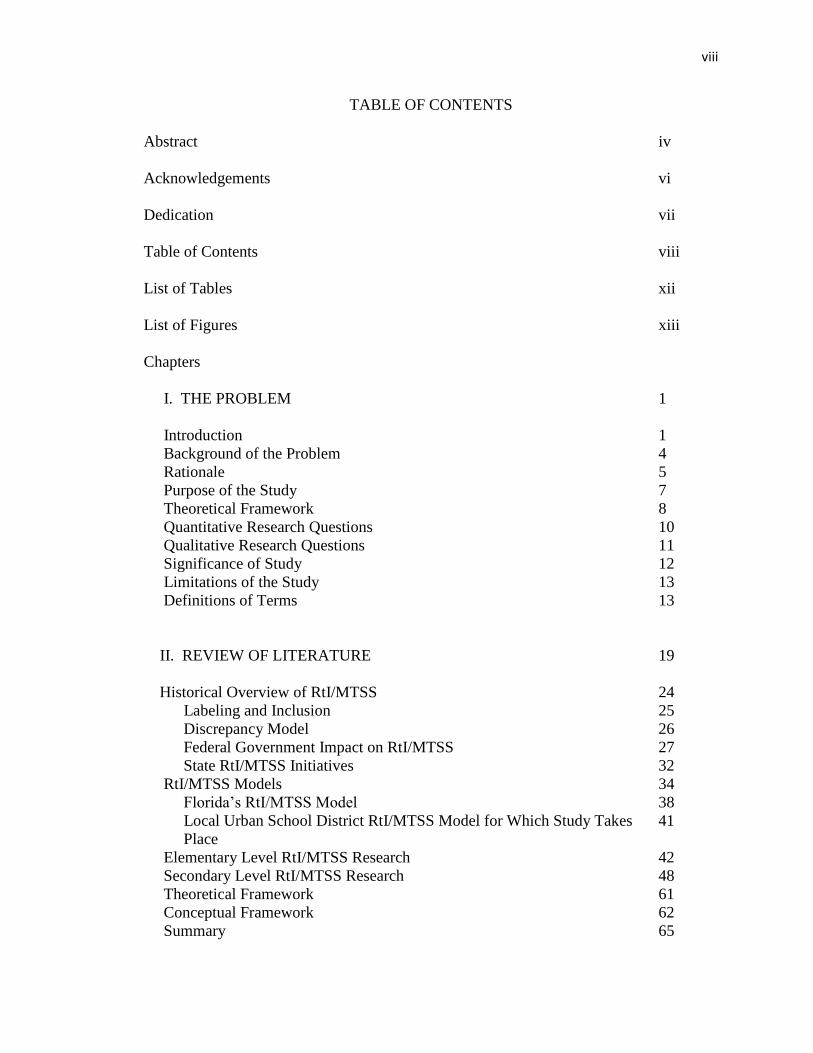
TABLE OF CONTENTS
Abstract
iv
Acknowledgements
vi
Dedication
vii
Table of Contents
viii
List of Tables
xii
List of Figures xiii
Chapters
I. THE PROBLEM 1
Introduction 1
Background of the Problem 4
Rationale 5
Purpose of the Study 7
Theoretical Framework 8
Quantitative Research Questions 10
Qualitative Research Questions 11
Significance of Study 12
Limitations of the Study 13
Definitions of Terms 13
II. REVIEW OF LITERATURE 19
Historical Overview of RtI/MTSS 24
Labeling and Inclusion 25
Discrepancy Model 26
Federal Government Impact on RtI/MTSS 27
State RtI/MTSS Initiatives 32
RtI/MTSS Models 34
Florida’s RtI/MTSS Model 38
Local Urban School District RtI/MTSS Model for Which Study Takes
Place
41
Elementary Level RtI/MTSS Research 42
Secondary Level RtI/MTSS Research 48
Theoretical Framework 61
Conceptual Framework 62
Summary 65

ix
III. METHOD 67
Introduction 67
Philosophical Perspectives 68
Proposed Research 69
Research Design 69
Quantitative Research Questions 70
Sample 71
Quantitative Instrumentation 75
RtI/MTSS Beliefs Survey 75
Perceptions of RtI/MTSS Practices Survey 77
Perceptions of RtI/MTSS Skills Survey 78
Qualitative Instrumentation 79
Quantitative Procedures 79
Pilot Study 79
Procedures for Assessing Survey Online 81
Qualitative Procedures 81
Ethical Issues 82
Quantitative Data Analyses 84
Qualitative Data Analyses 85
Summary 85
IV. RESULTS 87
Quantitative Data 88
Quantitative Participant Demographics 88
Exploratory Data Analysis 92
Recoding of Job Position 92
Missing Data 93
Analysis of Participation 93
Reliability 96
MANOVA Assumptions Tested 97
Research Question #1 99
Research Question #2 103
Research Question #3 107
Research Question #4 108
Research Question #5 109
Research Question #6 110
Research Question #7 111
Research Question #8 112
Research Question #9 113
Summary of Quantitative Results 114
Qualitative Data 115
Qualitative Semi-Structured Interview Questions 116
Qualitative Participants’ Demographics 116

x
Researcher Focus Group Observations 118
Professional Support Staff 118
General Education Teachers 119
Special Education Teachers 120
Administrators 121
Summary of Responses From Focus Groups 122
Question #1 122
Question #2 127
Question #3 131
Question #4 134
Question #5 138
Question #6 141
Question #7 143
Themes 151
Summary 164
V. DISCUSSION 168
Introduction
168
Overview 169
Major Quantitative Findings 170
Major Qualitative Findings 175
Research Question #1 177
Research Question #2 184
Research Question #5 188
Research Question #7 189
Limitations 190
Recommendations for Further Research 192
Implications for Policy and Practice 195
Conclusion 197
References 200
Appendix A. Email To Assistant Superintendent 221
Appendix B. Online Survey Flyer 223
Appendix C. Barry University ADSOE Online Survey Cover Letter 225
Appendix D. RtI/MTSS Survey 227
Appendix E. Focus Group Flyer 247
Appendix F. Focus Group Interview Informed Consent 249
Appendix G. Barry University IRB Approval 251

xi
Appendix H. School District IRB Approval 253
xii
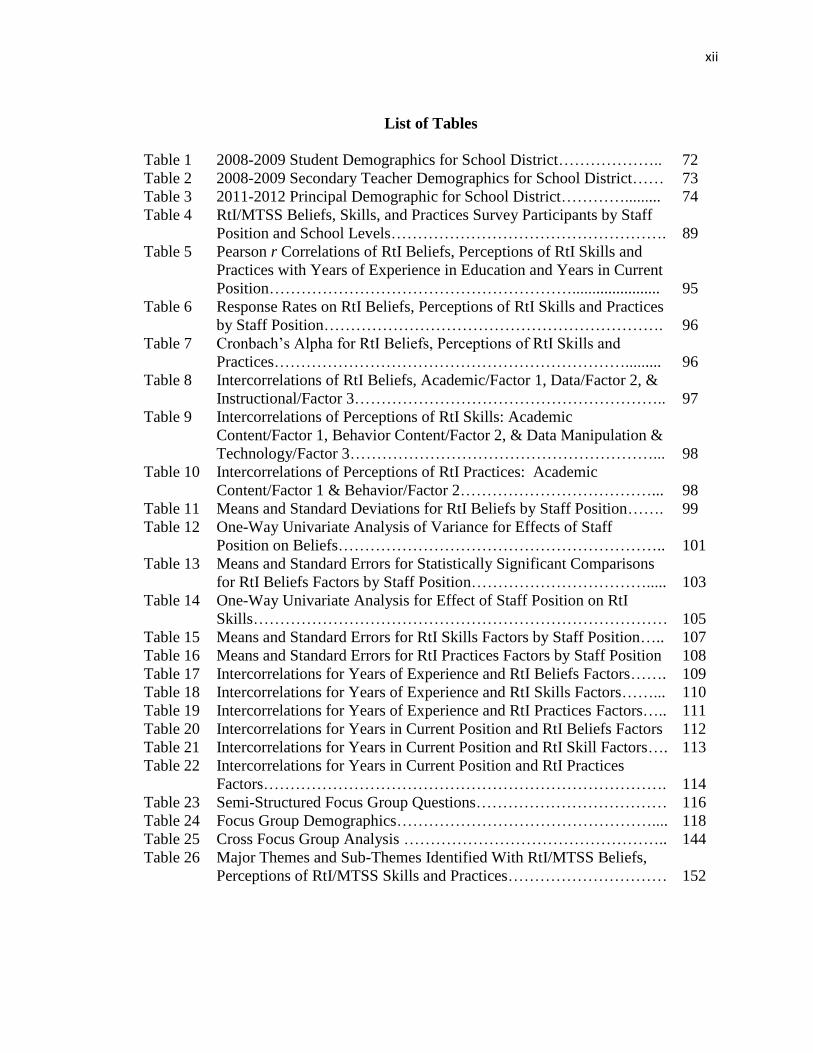
List of Tables
Table 1 2008-2009 Student Demographics for School District……………….. 72
Table 2 2008-2009 Secondary Teacher Demographics for School District…… 73
Table 3 2011-2012 Principal Demographic for School District…………......... 74
Table 4 RtI/MTSS Beliefs, Skills, and Practices Survey Participants by Staff
Position and School Levels…………………………………………….
89
Table 5 Pearson r Correlations of RtI Beliefs, Perceptions of RtI Skills and
Practices with Years of Experience in Education and Years in Current
Position…………………………………………………......................
95
Table 6 Response Rates on RtI Beliefs, Perceptions of RtI Skills and Practices
by Staff Position……………………………………………………….
96
Table 7 Cronbach’s Alpha for RtI Beliefs, Perceptions of RtI Skills and
Practices………………………………………………………….........
96
Table 8 Intercorrelations of RtI Beliefs, Academic/Factor 1, Data/Factor 2, &
Instructional/Factor 3…………………………………………………..
97
Table 9 Intercorrelations of Perceptions of RtI Skills: Academic
Content/Factor 1, Behavior Content/Factor 2, & Data Manipulation &
Technology/Factor 3…………………………………………………...
98
Table 10 Intercorrelations of Perceptions of RtI Practices: Academic
Content/Factor 1 & Behavior/Factor 2………………………………...
98
Table 11 Means and Standard Deviations for RtI Beliefs by Staff Position……. 99
Table 12 One-Way Univariate Analysis of Variance for Effects of Staff
Position on Beliefs……………………………………………………..
101
Table 13 Means and Standard Errors for Statistically Significant Comparisons
for RtI Beliefs Factors by Staff Position…………………………….....
103
Table 14 One-Way Univariate Analysis for Effect of Staff Position on RtI
Skills……………………………………………………………………
105
Table 15 Means and Standard Errors for RtI Skills Factors by Staff Position….. 107
Table 16 Means and Standard Errors for RtI Practices Factors by Staff Position 108
Table 17 Intercorrelations for Years of Experience and RtI Beliefs Factors……. 109
Table 18 Intercorrelations for Years of Experience and RtI Skills Factors……... 110
Table 19 Intercorrelations for Years of Experience and RtI Practices Factors….. 111
Table 20 Intercorrelations for Years in Current Position and RtI Beliefs Factors 112
Table 21 Intercorrelations for Years in Current Position and RtI Skill Factors…. 113
Table 22 Intercorrelations for Years in Current Position and RtI Practices
Factors………………………………………………………………….
114
Table 23 Semi-Structured Focus Group Questions……………………………… 116
Table 24 Focus Group Demographics………………………………………….... 118
Table 25 Cross Focus Group Analysis ………………………………………….. 144
Table 26 Major Themes and Sub-Themes Identified With RtI/MTSS Beliefs,
Perceptions of RtI/MTSS Skills and Practices…………………………
152

xiii
List of Figures
Figure 1 Florida Problem-Solving RtI/MTSS Project Systems Change
Model…………………………………………………………………….
10
Figure 2 Procedural Flowchart of the Study……………………………………… 83
Figure 3 Participants’ Number of Years in Education……………………………. 90
Figure 4 Participants’ Number of Years in Current Position……………….......... 91
Figure 5 Participants’ Level of Education………………………………………… 92

1
CHAPTER I
THE PROBLEM
Introduction
Response to Intervention (RtI), also known as Multi-Tiered System of Supports
(MTSS), has become one of the most discussed and written about school reform
initiatives in decades. Although RtI remains a significant topic of interest, general
education and special education teachers and administrators are grappling with its
implementation in schools. RtI promises a school-wide practice of providing high-
quality instruction and evidenced based interventions to match each student’s academic
and/or behavioral needs; it requires frequent monitoring of progress in order to assist in
making important decisions about changes in each student’s instruction or goals (Batsche
et al., 2005). Although not specifically mentioned in the Elementary and Secondary
Education Act of 2001 (commonly known as No Child Left Behind), the tenets of the RtI
framework are mentioned several times, from the use of research based practices, to
accountability through data, and to provisions for highly qualified teachers for all
students. The mandates of the Individuals with Disabilities Education Improvement Act
(IDEA, 2004) address the critical components and basic principles of RtI. The primary
intent of aligning No Child Left Behind (NCLB, 2001) and IDEA (2004) mandates,
whereby both require evidenced based academic and behavioral practices administered
by highly qualified faculty and staff, was to more accurately identify students with
disabilities and simultaneously decrease the overrepresentation of minority students in
special education, while increasing the accountability of teachers’ instructional delivery
to struggling students (President’s Commission on Excellence in Special Education,

2
2002). The blending of the two acts also required the breakup of two distinct systems by
demanding greater collaboration and communication between general education and
special education personnel. Examples of the lack of communication and the existence of
silos between special educators and general educators include secondary general
education teachers who often believe they are hired to teach only their content and are not
required to assist with remediation or reading instruction; also special education teachers
are frequently not invited to curriculum discussions with general educators and
administrators, nor are they asked how to differentiate instruction for all students
(Gresham, 2007).
The RtI framework is very ambiguously conceptualized. The primary intent and
the basic tenets of RtI are not universally accepted by all RtI research experts (Kavale,
Holdnack, & Mostert, 2006). Two basic approaches for implementing RtI (Jimerson,
Burns, & VanDerHayden, 2007, p. 5) are (a) the problem-solving approach and (b) the
standard protocol approach. Most school districts are utilizing the problem-solving
approach (Batsche, Curtis, Dorman, Castillo, & Porter, 2007). With education
researchers conflicted on a cohesive RtI conceptual framework (Reynolds & Shaywitz,
2009), it is easy to understand how local school districts, administrators, and teachers are
confounded as to which approach to implement, which staff should be implementing the
interventions, and what interventions they should be implementing (Burns, Jacob, &
Wagner, 2008). The questions are endless and to date, the answers are few.
Nonetheless, state educational agencies are moving ahead with their vision such as stated
by the Florida Department of Education Statewide Response to Instruction/Intervention
Implementation Plan (FLDOE, 2008).

3
Based on the latest data from the 2011 United States Department of Education,
Institute of Education Sciences (IES), 45% of middle schools and 29% of high schools
nationally are using RtI at the school level (Bradley et al., 2011). With little research to
guide these secondary schools, questions remain about how secondary schools
operationalize RtI using a problem solving approach, how they overcome implementation
obstacles, and what are the perceptions of faculty and staff members’ Beliefs, Skills, and
Practices involving the RtI process (Deshler & Ehren, 2010; Duffy, 2007; Fisher & Frey,
2011).
In the state of Florida, RtI has been an established initiative since 2004. The
Florida Department of Education educational reform experts have investigated how RtI
can be implemented and integrated into the Florida’s education system (Florida
Department of Education [FLDOE], 2011). In 2008, the Florida Department of
Education scaled up its statewide RtI efforts by publishing the Statewide Response to
Instruction/Intervention Implementation Plan. The intent of this plan was to provide an
initial, official, statewide RtI framework to assist school districts with critical
components, definitions, and applications to support school wide implementations of RtI
(FLDOE, 2011). By July 1, 2010, RtI was the sole identification framework for
eligibility in specific learning disabilities, emotional/behavior disorders, and language
impairment in the state of Florida and was referred to as Multi-Tiered Systems of Student
Support (MTSSS); in 2011 the middle “S” was dropped from the acronym to now read
MTSS for Multi-Tiered Systems of Support (Batsche & Kincaid, 2011; Diamond,
Dorman, Hall-Mills, Van Name Larson, & Wheeler, 2009; Wheeler, 2007). Silos
between special education and general education RtI initiatives still exist. Batsche and

4
Kincaid (2011) argue that there is a need to model a collaborative, integrated Multi-
Tiered System of Supports (MTSS) process at the state level in order to streamline its
effectiveness at the district level. RtI is viewed by federal experts as part of the larger
MTSS. A common language and understanding between all RtI/MTSS efforts must be
established (Batsche & Kincaid, 2011). Yet, secondary RtI/MTSS in the state of Florida
is still an anomaly that few, if any, urban school districts have solved (Batsche &
Kincaid, 2011; Sarlo, Robertson, & Sudduth, 2011).
Background of the Problem
Researching and understanding the concepts that work for RtI/MTSS in secondary
schools has taken a back seat to the research of the elementary RtI/MTSS framework.
The majority of research and development have occurred at the elementary level, but
research on what works is occurring more slowly at the secondary level (Burns, 2008;
Brozo, 2009; Canter, Klotz, & Cowan, 2008; Deshler & Ehren, 2010; Duffy, 2007;
Fisher & Frey, 2011; Fuchs, Fuchs, & Compton, 2010; Johnson & Smith, 2008; Vaughn
et al., 2010). With scant research and little documented success to guide secondary
schools, it falls to the secondary schools themselves to devise RtI/MTSS frameworks and
implementation plans that best suit their needs (Brozo, 2009). Some of the foremost
authorities on RtI at the secondary level, such as the National Center on Response to
Intervention, the Center on Instruction, and the National High School Center, have only
provided technical assistance reports on the implementation of RtI at the secondary level
(National High School Center, National Center on Response to Intervention and Center
on Instruction, 2010). It is ironic that NCLB (2001) stresses research based interventions
and IDEA (2004) emphasizes the use of evidenced based interventions and procedures

5
for the implementation of RtI/MTSS, but there is very little peer reviewed documented
support for its implementation at the secondary level. To date, secondary schools across
the country are moving ahead with the implementation of RtI/MTSS frameworks with
little evidenced based research.
Rationale
The majority of RtI/MTSS research have focused on the elementary level; many
researchers avoid RtI research at the secondary level due to scheduling difficulties,
questions of treatment fidelity, and compliance concerns that can occur when working
with teenagers (Fuchs, Fuchs, & Compton, 2010). According to a joint report, Tiered
Interventions in High Schools: Using Preliminary Lessons Learned to Guide Ongoing
Discussion (2010) by the National High School Center, the National Center on Response
to Intervention, and Center on Instruction, also known as The High School Interventions
Initiative (HSTII), there is an increasing number of RtI/MTSS research studies being
initiated on the secondary level. However, most of this research is preliminary and is
mainly focused on student interventions in the content areas, especially literacy (Deshler,
2009; Vaughn, 2011) rather than on implementation of the RtI framework as a whole by
faculty and staff (Fisher & Frey, 2011; Vaughn et al., 2010). These intervention studies
have been in randomized controlled settings supervised by university researchers funded
from large federal grants focused mainly on struggling readers (Kavale, Kauffman,
Bachmeier, & LeFever, 2008; Vaughn et al., 2010).
The other types of published articles regarding secondary RtI are “how to”
implementation guides (Deshler & Ehren, 2010; Duffy, 2007; Fuchs et al., 2010; National

6
High School Center, National Center on Response to Intervention, & Center on
Instruction, 2010).
Although many studies have investigated the RtI/MTSS Beliefs of elementary
administrators, faculty, and staff, as well as the implementation of evidenced based
practices, there are only three rigorous studies that have investigated these concepts at the
secondary level (Fisher & Frey, 2011; National High School Center et al., 2010; Sansosti,
Noltemeyer, & Goss, 2010). These studies only investigated secondary schools located
in suburban and rural school districts. Urban secondary schools nationwide are
implementing RtI at the individual school level (Bradley et al., 2011) with little or no
guidance from research. Thus, urban secondary schools only have “how-to” guides from
suburban and rural models to assist them in implementing RtI/MTSS.
In order for the RtI/MTSS framework to be successful, the fidelity of
implementation or treatment fidelity must be implemented with integrity by the staff
(Elliott, Witt, Kratochwill, & Stoiber, 2002; Gresham, MacMillan, Beebe-Frankenberger,
& Bocian, 2000). Treatment fidelity is the consistent delivery of instruction as it was
designed to be delivered. However, due to organizational and structural differences
between elementary and secondary schools, faculty, and students limit the treatment
fidelity when implementing RtI/MTSS at the secondary level (Duffy, 2007; Sansosti et
al., 2010). Secondary staff members are more prone to isolate themselves in their content
areas and rely on others to remediate struggling students. They believe that they do not
have the skills or they philosophically believe it is not part of their job descriptions to
remediate struggling students (Deshler, 2009). The essential problem solving and
RtI/MTSS components may be the same, but how they translate into effective practices at

7
the secondary level is different than at the elementary level (Deshler, 2009; National
High School Center, National Center on Response to Intervention, and Center on
Instruction, 2010; Sarlo et al., 2011; Vaughn, 2011).
Educators will implement new practices (such as RtI/MTSS) when they
understand the need for the new practice and perceive that they have the skills and/or
support to implement the new practices (Castillo, Batsche, Stockslager, March, & Minch,
2010). Research has shown that beliefs impact skills and practices (Batsche & Kincaid,
2011). Therefore, it is critical to the success of RtI/MTSS to investigate the perceptions
of secondary faculty and professional support staff members on their Beliefs about
RtI/MTSS and on their ability to implement evidenced based practices and skills with
fidelity (Sansosti et al., 2010). This is particularly important on the secondary level due
to the lack of research on the RtI/MTSS framework at this school level (Castillo et al.,
2010).
Purpose of the Study
RtI/MTSS is an influential school reform that is designed to provide high quality
instruction that is matched to students’ instructional and behavioral needs using data such
as current levels of performance and rates of learning over time (Batsche et al., 2005;
Fuchs & Fuchs, 2006). The data disaggregation is facilitated through a structured
problem solving process to guide important student outcomes, and focused instructional
decisions (National Association of State Directors of Special Education [NASDE], 2005).
As previously described, very little is known about the planning and
implementation of these interventions, what roles faculty and staff take in the RtI/MTSS
framework, and lastly, how the RtI/MTSS framework is implemented in diverse, urban

8
secondary schools (Angelo & Bradley, 2011; Deshler, 2009; Harris, 2011). Moreover,
there are only three studies published on the implementation of the RtI/MTSS framework
in secondary schools (Fisher & Frey, 2011; National High School Center, National
Center on Response to Intervention, and Center on Instruction, 2010; Sansosti et al.,
2010). According to the National High School Center, National Center on Response to
Intervention, and Center on Instruction (2010) authors, their published study is intended
to provide technical assistance to secondary schools wishing to implement the RtI/MTSS
framework. Secondary school personnel must initiate needed research to provide
guidance for implementing the RtI/MTSS framework effectively. Understanding the
Beliefs and perceptions of staff engaged in the RtI/MTSS process will give insight into
the strengths and weaknesses of the framework. Therefore, this study seeks to investigate
and explain the beliefs of urban secondary school staff about RtI/MTSS and their
perceptions on their practices and skills in implementing this framework effectively.
Theoretical Framework
Kurt Lewin’s (1947) change process serves as a theoretical guide in the present
study. Lewin’s change process identifies a three-phase, ongoing process of first:
unfreezing old beliefs and practices; second, moving these beliefs and practices to the
new beliefs and practices; and third, freezing the new beliefs and practices in place. The
underpinnings of Response to Intervention have initiated the unfreezing of the old beliefs
about educating struggling students and students with disabilities, and have begun the
process of eliminating the teacher-centered approach and replacing it with a student-
centered approach. By aligning NCLB (2001) and IDEA (2004), the federal government
has acknowledged the need for change, and the individual states have followed suit, by

9
passing mandates to incorporate, or only use RtI as a means to intervene with struggling
students. Now individual school districts must work on unfreezing old beliefs and
practices of teachers and administrators. Once this unfreezing occurs in school districts,
the critical question that must be asked is how are districts moving from the old teacher-
centered beliefs and practices to the new student-centered beliefs and practices? Is this
change occurring?
In the state of Florida, the systems change model (Fixsen, Naoom, Blasé,
Friedman, & Wallace, 2005) has been identified as the conceptual framework to support
this educational reform. Systems change model (Fixsen et al., 2005) is a sub-theory of
Lewin’s (1947) change process. The systems change model has three stages: consensus
development, infrastructure, and implementation. Similar to the change process,
consensus development refers to convincing stakeholders that a change in the way
teachers and administrators work with struggling students must occur. Infrastructure
refers to building a cadre of teachers and administrators moving to the new set of beliefs
and practices (i.e., moving to student-centered beliefs and practices). Just as refreezing
suggests the new beliefs and practices are embedded in the school culture,
implementation refers to the implementation of the new student-centered beliefs and
practices becoming everyday routines for teachers and administrators.
Lewin’s (1947) change process and the sub-theory systems change model (Fixsen
et al., 2005) serve as the underpinnings of this study. Unfreezing or building consensus
of the need to change old beliefs and practices has occurred nationally and on the state
level. However, a question remains regarding whether this is now occurring at the school

10
level? Figure 1 is a visual representation of Fixsen et al., (2005) systems change model,
which the Florida Problem-Solving RtI/MTSS Project has adapted and adopted.
Figure 1. Visual representation of the Florida Problem-Solving RtI/MTSS Project System
Change Model (Castillo et al., 2010).
Quantitative Research Questions
1. Are there perceived differences in Beliefs about RtI/MTSS among secondary
administrators, general educators, special educators, and professional support staff in
an urban school district?
2. Are there perceived differences in RtI/MTSS Skills among secondary administrators,
general educators, special educators, and professional support staff in an urban school
district?
3. Are there perceived differences in RtI/MTSS Practices among secondary
administrators, general educators, special educators, and professional support staff in
an urban school district?
CONSENSUS
Making a case for
change
INFRASTRUCTURE
Building capacity
IMPELEMENTATION
Ongoing professional development
Figure 1. Florida Problem-Solving RtI/MTSS Project Systems Change Model

11
4. What is the relationship of staff’s (administrators, general educators, special educators,
and support staff) Beliefs about RtI/MTSS and the number of years they have been in
education?
5. What is the relationship of staff’s (administrators, general educators, special educators,
and professional support staff) Skills about RtI/MTSS and the number of years they
have been in education?
6. What is the relationship of staff’s (administrators, general educators, special educators,
and Professional support staff) Practices about RtI/MTSS and the number of years
they have been in education?
7. What is the relationship of staff’s (administrators, general educators, special educators,
and Professional support staff) Beliefs about RtI/MTSS and the number of years they
have been in their current positions?
8. What is the relationship of staff’s (administrators, general educators, special educators,
and Professional support staff) Skills about RtI/MTSS and the number of years they
have been in their current positions?
9. What is the relationship of staff’s (administrators, general educators, special educators,
and Professional support staff) Practices about RtI/MTSS and the number of years
they have been in their current positions?
Qualitative Research Questions
Qualitative research questions were formulated based upon the quantitative data
generated from the self-report survey.

12
Significance of the Study
Little is known about diverse, urban, secondary faculty and staff’s Beliefs about
RtI. What are staff’s Beliefs, perceived Skills and Practices in implementing the RtI
framework? Are there differences in the Beliefs, and perceived Practices and Skills
among urban, secondary administrators, teachers, and professional support staff? Are
there differences between urban, secondary special educators and secondary general
educators? Have the silos of communication and collaboration been broken down
between urban secondary special and general educators? What do these urban, secondary
problem solving teams use to guide them through the problem solving process? What are
effective practices? As posited by Castillo and colleagues (2010), self reports alone
provide a false positive bias; the best study model includes both self reports and
interviews (both quantitative and qualitative measures). This study followed Castillo and
colleagues (2010) argument for a mixed method study. The focus of this study was on
the RtI/MTSS Beliefs and Perceptions of Skills and Practices of urban, secondary
administrators, faculty and professional support staff and how they attempt to effectively
implement the RtI/MTSS framework. Since there are no studies published that are
concerned with the beliefs of urban, secondary administrators, general education
teachers, and special education teachers regarding their perceived Practices and Skills
about RtI/MTSS, the first phase of this study will quantify those beliefs and perceived
Practices and Skills. In the second phase, this study sought to explain those quantified
results through rich, in-depth interviews. The intent of this study is to fill the current void
in the urban, secondary literature on RtI/MTSS.

13
Limitations of the Study
Limitations of the study that identify potential weaknesses of the research include
the following: The study was conducted in South Florida, a large metropolitan area where
the population is very culturally diverse. South Florida is made up of a large percentage
of Hispanics, Caribbean Islanders, Haitians, and other cultures from many countries. As
a result, the findings may not generalize to more homogeneous, mostly European
American, areas of the country. Self-report surveys may elicit positively biased results.
The length of the study may be a limitation as well; for example, a study conducted by
the Florida RtI/Problem Solving Project (Castillo et al., 2010) found many non-
responders in the Perceptions of RtI/MTSS Practices survey. Additional limitations may
be the possibility of non-responders and incomplete surveys, as well as interviewees
having personal affiliation with the interviewer, due to the interviewer’s special education
status in the district.
Definition of Terms
Administration – is the social process of managing human, financial, and material
resources toward the fulfillment of a mission. It is an executive activity different from
policy making; more specifically, it has the responsibility of carrying out policies of the
board of education (Rebore, 2007).
Administrator- the individual who fulfills the requirements of managing human,
financial, and material resources by developing and establishing administrative processes,
procedures, and techniques that harness these resources (Rebore, 2007).
Beliefs – According to the Oxford American College Dictionary (2011), belief is defined
as something one accepts as true or real; a firmly held conviction or opinion. Educators’

14
beliefs about student learning and instructional strategies impact whether they are willing
to implement new practices (Fang, 1996). For this study, beliefs refer to what educators
believe about RtI/MTSS Practices and how they should theoretically be related to the
implementation of the RtI/MTSS model (Castillo, et al. 2010).
Discrepancy Model (Florida) - is defined in State Board Rule 6A-6.03018. Discrepancy
model is a model to identify students for learning disabilities and special education
services. Based upon interventions in the general education setting, the discrepancy
model was found to be ineffective. Evidence of a disorder must be found in one or more
basic psychological processes as determined by at least one standardized instrument that
determines intellectual functioning. Also, evidence of academic achievement
significantly below the level of intellectual functioning must be found in order for a
student to have a specific learning disability. A significant discrepancy is required for
students below the age of seven, a discrepancy of at least one standard deviation is
required for students ages seven through ten, and a discrepancy of one and one half
standard deviations is required for students ages eleven and above (Bureau of Exceptional
Education & Student Services [BEESS], 2006).
Early Warning System – EWS is a program that uses readily available academic and
behavior data to systematically identify students who are at risk of dropping out of high
school. Identified students can then be matched with interventions to help them get on
track for graduation (Sarlo, Robertson, & Sudduth, 2011).
Evidenced based- an intervention for which data from scientific, rigorous research
designs have demonstrated or empirically validated the efficacy of the intervention. For
example, single-subject, experimental, and quasi-experimental designs would all be

15
considered evidenced based research designs (National Center on Response to
Intervention, 2010).
Faculty- the teaching and administrative staff and those members of the administration
having academic rank in an educational institution (Merriam-Webster Dictionary).
Fidelity of intervention implementation (Fidelity of Treatment) - According to Condray,
2007, there is little consensus as to the definition of intervention fidelity, but there are
five aspects that are identified as mandatory for fidelity effective intervention: 1.
Adherence to program components; they are delivered as prescribed. 2. Exposure that
students receive to academic intervention content. 3. Quality of delivery is theory-based
in terms of process and content. 4. Participant responsiveness or engagement of the
students. 5. Program differentiation must contain means that are unique features of the
intervention and are distinguishable from other simultaneous programs.
General Education Teacher – All teachers who give instruction in the core academic
subject areas such as: art, visual arts, drama-theatre, English, foreign languages, language
arts, mathematics, music, reading, science, social studies, and physical education (FL
DOE, 2002).
Learning Disability/Specific Learning Disability- A student would be deemed to have a
learning disability if the student does not make adequate gains/growth for the student’s
age or does not meet state approved grade level standards, when provided with learning
experiences and instruction appropriate for the student’s age or the state approved grade
level standards. The student does not meet grade level expectations in one or more of the
following areas: oral expression; listening comprehension; basic reading skills; reading
fluency skills; reading comprehension; mathematics calculation; or mathematics problem

16
solving (United States Department of Education, Office of Special Education Programs
[OSEP], 2006). The term learning disability was used throughout this study.
Multi-Tiered Systems of Student Support (MTSSS) – The collaborative vision of the
Florida Problem-Solving/Response to Intervention (FL PS/RtI) and the Florida Positive
Behavior Support/Response to Intervention for Behavior (FLPBS/RtI: B) Projects are to:
1. Enhance the capacity of all school districts to successfully implement and
maintain a multi-tiered system of student supports with fidelity in every school;
2. Accelerate and make the most of student academic and behavioral outcomes
through the implementation of data-based problem solving utilized by effective
leadership at all levels of the educational system;
3. Update the improvement, implementation, and ongoing evaluation of an
incorporated, aligned, and sustainable system of service delivery that prepares all
students for post-secondary education (Batsche & Kincaid, 2011). MTSS and RtI
are used interchangeably in this study.
Perceptions of RtI/MTSS Practices – According to the Oxford American College
Dictionary (2011), perceptions are defined by the ability to see, hear or become aware of
something through the senses. Perceptions are the state of being or process of becoming
aware of something in such a way. Perceptions are a way of regarding, understanding,
and interpreting something; (a mental impression). For this study, perceptions of
Practices was defined as educators’ perceptions of the extent to which their schools
implement RtI/ practices (Castillo et al., 2010).
Perceptions of RtI/MTSS Skills - The likelihood of educators embracing new practices
increases when they understand the need for the new practice, and perceive that they

17
either have the skills or will receive support to implement the new practices. For this
study, perceptions of RtI/MTSS Skills was defined as educator perceptions of the current
skills they possess in order to implement RtI/MTSS (Castillo et al., 2010).
Problem Solving – refers to the systematic process based on the scientific method that can
be used to make decisions about the effectiveness of instructional programs and
interventions based on the data. It is essential during each step in the RtI approach.
Structured problem solving involves clearly defining and validating the problem,
analyzing the problem, developing a plan of intervention, implementing the plan, and
evaluating the results (Bureau of Exceptional Education & Student Services [BEESS],
2006).
Research Based – results of studies and programs that incorporate features that have been
researched generally. The intervention or program has not been studied using a rigorous
research design as defined by the Elementary and Secondary Education Act (National
Center on Response to Intervention at the American Institute for Research, 2010).
Response to Intervention (RtI) – RtI is an intervention program that incorporates
evidenced based practices and programs to instruct, and assist students who are
struggling academically and/or behaviorally. RtI integrates assessment and intervention
within a multi-tiered level of prevention system to maximize student achievement and to
reduce behavioral and academic problems (National Center on Response to Intervention,
2010).
Severe Discrepancy- is a criterion established between age appropriate levels of
achievement in the academic areas oral expression, listening comprehension, written
expression, basic reading skills i.e., fluency, phonemic awareness, reading

18
comprehension, mathematics calculations, or mathematical problem solving, and
intellectual ability. A severe discrepancy is said to exist when achievement in one or
more of the above mentioned academic areas falls at or below 50% of the student’s
expected achievement level (Bradley, Danielson, & Hallahan, 2002).
Special Education Teacher – a teacher trained to use various teaching techniques to
promote learning. Depending on the student, teaching methods can include intensive
individualized instruction, problem-solving assignments, and small group work. When
students need special accommodations to learn in the general education environment,
special education teachers ensure that the appropriate accommodations are provided to
the student (United States Department of Labor Occupational Outlook Handbook, 2011).
Staff – the personnel who assist a director in carrying out an assigned task (Merriam-
Webster, n.d.).
Urban- According to Dr. Pat Russo, Coordinator of the Center for Urban Schools (2004),
to be considered an urban school, the school must meet the following criteria:
1. The school is located in a urban area rather than a rural, small town, or suburban area
2. The school has a relatively high rate of poverty (as measured by Free and Reduced
Lunch data provided)
3. The school has a relatively high proportion of students of color (as reported by school
district data)
4. The school has a relatively high proportion of students who are Limited English
Proficient (as reported by school district data)
5. The school has been designated as "High Need" by Title I data
19
CHAPTER II
REVIEW OF LITERATURE
Since the inception of the Education for All Handicapped Children Act (PL94-
142) in 1975 and until school year 2004-2005, there has been a 300% increase in the
identification of students with disabilities (Carlson, Chen, Schroll, & Klein, 2003; Scull
& Winkler, 2011). According to the 2002 President’s Commission on Excellence in
Special Education, 50 billion dollars was spent annually on students with disabilities,
while $27.3 billion was spent on students in general education annually in school year
2000-2001. Despite over thirty years of experience in identifying students for special
education services using the discrepancy model, the only areas that increased were the
number of students identified for special education, the number of personnel needed to
instruct this group of students, and the dollar amount to educate these students, what did
increase were the intended outcomes, and efforts to close the achievement gap between
same age peers and students with disabilities (Denton, Vaughn, & Fletcher, 2003;
Gresham, 2002; Vaughn & Fuchs, 2003). These same reports also indicated that African
American boys represented only 9% of the total student enrollment in public schools, yet
in the category of intellectual disabilities (InD), their enrollment percentage was more
than double (Donovan & Cross, 2002). In other categories, such as emotional
disturbance and learning disabilities (LD), African American males were again overly
represented accounting for 21% and 12% respectively (President’s Commission on
Excellence in Special Education, 2002). Furthermore, the number of students with LD,
emotional/behavioral/disorders (E/BD) totaled almost 4 million in 2000-2001or 62
percent of the total number of students with disabilities, making these categories the

20
highest incidence in special education over the thirty year period (President’s
Commission on Excellence in Special Education, 2002, Scull & Winkler, 2011).
Another seminal report by Lyon et al. (2001) argued that the timing was right to
link special education policy, research and practice in LD. Lyon et al. contended that
eligibility for LD had not been changed or improved upon in forty years, since Samuel
Kirk (1962) had coined the term learning disabilities. This was an atrocity given the fact
that by 1998 LD had the largest eligibility increase (52%) and a 44 percent increase of
students between the ages of 12-17 being identified for LD. Lyon et al. provoked many
concerning questions, the most important of which was what were the underlying factors
for such a disproportionate increase of students between the ages of 12-17 being
identified for LD. They surmised that the use of the discrepancy model to identify
students for LD was fraught with naïve and erroneous assumptions about the accuracy of
an IQ score as an index for potential learning. They stated LD eligibilities based on IQ
scores varied from state to state, and most students had to fall far behind same age
students in order to be evaluated and hope to become eligible for special education
services, coining this scenario a “wait-to-fail” model. Furthermore, they argued that
students made eligible for LD was quite possibly more a detriment than a help. Identified
LD students were being excluded from content experts, and special education teachers
were becoming the “teachers of record” for LD students’ content areas, rather than
focusing on LD students’ deficient reading skills. LD students were never closing the
achievement gap; thus the label became a detriment, rather than a help.
The underpinnings of these many national reports spurred the rewriting of NCLB
(2001) and IDEA (2004); confirmed the need for change in academic accountability for

21
all students, including SWD; heightened the need for use of multilevel approaches to
instruction and classroom management; and targeted changes in the identification
methods and instructional practices for all students indentified with LD, EB/D, and
intellectual disabilities (InD) (Bradley, Danielson, & Hallahan, 2002; Carlson et al.,
2003; Fuchs & Fuchs, 1998; Lyon et al., 2001; President’s Commission on Excellence in
Special Education, 2002; Scull & Winkler, 2011; Vaughn, 2002).
In 2005, almost 6.72 million students or 13.8 percent of the nation’s student
population were labeled as students requiring special education with 43% of the students
being labeled learning disabled (Scull & Winkler, 2011). Not until school year 2006-
2007 was there a decrease in special education identification; participation in special
education programs decreased to 6.48 million students identified with disabilities, or 13.1
percent of all students nationwide (Scull & Winkler, 2011). The highest incidence
disability, LD, with almost 5.75 percent of all school eligible students in school year
2000-2001 declined to 4.78 percent in school year 2008-2009 (McLeskey, Landers,
Hoppey, & Williamson, 2011).
Since the passage of PL94-142, the discrepancy model has been used as the
evaluation model for learning disability eligibilities across the country (Vaughn & Fuchs,
2003). According to federal definition of learning disabilities,
The term means a disorder in one or more of the basic psychological
processes involved in understanding or in using language, spoken or
written which may manifest itself in an inability to listen, speak, read,
write, spell, or do mathematical calculations. A team may determine that a
child has a specific learning disability if: the child does not achieve

22
commensurate with same age peers in one or more areas (oral expression;
listening comprehension; written expression; basic reading skills; reading
comprehension; mathematics calculation or mathematics reasoning. The
child must also have a severe discrepancy between achievement and
intellectual ability in one or more of the above mentioned areas. (In Lyon
et al., p. 263, Assistance to States for Education of Children with
Disabilities Program and Preschool Grants for Children with Disabilities
Final Rule, 34 C.F.R. pts. 300. 30, 1992)
In the mid 20th
century, R. L. Thorndike argued that IQ scores were not an
accurate measure of a student’s academic potential and should not be used for LD
eligibility. By the mid 1990’s, several researchers (Bradley, Danielson, & Hallahan,
2002; Lyon et al., 2001; Patton, 1998) agreed that the validity and reliability of IQ tests
were not an appropriate measure of a struggling student’s capability, and specifically not
an appropriate measure for minority students. They found these IQ instruments to be
unreliable measures for minority students, particularly African American males.
Additional studies by these researchers (Donovan & Cross, 2002; Patton, 1998) found
that non-reliable IQ scores correlated disproportionately with the number of African
American males placed in special education.
According to Lyon et al. (2001), the federal definition of LD has four conceptual
factors that are common across all accepted forms of the LD definition. These factors
include: the heterogeneity of LD; the intrinsic and neurobiological nature of LD; the
significant discrepancy between learning potential and academic performance; and the
exclusion of cultural, educational, environmental, and economic factors; or the possibility

23
of other disabilities. Lyon et al. (2001) contended that these conceptual factors are
seldom examined for validity and that there are several fallacies within these conceptual
factors that constituted a change in the way LD eligibilities were conceptualized and how
educational interventions should be outcome based focused. For example, they iterated
that apparent in the LD heterogeneity factor, LD consists of at least seven areas of
disability, and that the characteristics and learning needs vary. So diagnostics can cover a
wide range of learning difficulties. They recommended separate evidenced based
definitions for each type of LD, which would inform instruction and assessment.
Lyon et al.(2001) argued that a considerable amount of research could be found
on the neurobiological factors for LD, but that intrinsic factors were not only causes of
reading difficulties, but extrinsic (environmental) factors may also hinder reading
proficiency. According to many experts in the field, including Lyon et al., there were
many problems with IQ-achievement discrepancy models. They contended that
assumptions were naïve and flawed, statically and conceptually, and discrepancy
formulas differed from state to state. Therefore, an LD student could technically lose
services if he moved from one state to the next, if his discrepancy scores did not meet
qualifications in the new state. Lyon et al. (2001), along with other prominent
researchers, iterated that a student would have to fall significantly behind his same age
peers before he would be evaluated for special education services; therefore, coining the
“wait-to-fail” model. Lastly, Lyon et al. (2001) suggested that most definitions of LD
included the exclusion clause, which meant that students with emotional/behavioral
disorders, visual/hearing disorders, environmental, cultural, or economic disadvantage
could not be eligible for LD services. Lyon et al. (2001) argued that these are the very
24
students who need the services and need them early in order to have any chance to
academically catch up to same age peers.
In addition to Lyon et al. (2001), several federally funded committees and reports
such as the National Joint Committee on Learning Disabilities (1999), Learning
Disabilities Roundtable (2002), and the President’s Commission on Excellence in Special
Education (2002) reiterated these alarming findings. Clearly, the two prominent
legislative educational acts needed to be reauthorized. Thus, in 2004, the alignment of
No Child Left Behind (NCLB, 2002) and the reauthorization of Individuals with
Disabilities Education Improvement Act (IDEA, 2004) came to fruition. With this
alignment, response to intervention (RtI) or the multi-tiered system of supports (MTSS)
became the latest school reform initiative. At the core of the RtI/MTSS tiered framework
are the requirements for evidenced based instruction, data disaggregation, and
interventions that necessitate differentiated instruction for struggling students
(VanDerHeyden & Witt, 2005). Thus, interventions must meet the needs of struggling
students without placing them in special education (Batsche et al., 2005; Vaughn &
Fuchs, 2003). In part, the intent of the change in these laws was to break down the silos
that had existed between general and special education, to assist struggling learners while
not labeling them, and to create an environment of communication and collaboration
between the special and general education professionals.
Historical Overview of RtI/MTSS
Before the establishment of The Education for All Handicapped Children Act
(1975), better known as Public Law 94-142, there had been controversy concerning how
children have been made eligible for special education services (Sorrells, Rieth, &

25
Sindelar, 2004). Lloyd Dunn’s (1968) seminal work, Special Education for the Mildly
Retarded - - Is Much of it Justifiable?, served as a catalyst for the school reform issues of
wrongfully labeling poor and African American students and segregating them from the
general education population. In the four decades since Dunn (1968), researchers in
special education have continued to show the over- use of the biased discrepancy model,
the overrepresented labeling of minority students, and the exclusion of students with
disabilities in the general education classrooms. It was not until recently that legislators
recognized the validity of the research in special education (Denton et al., 2003; Fuchs &
Fuchs, 1998; Gresham, 2002; Lyon et al., 2001; Patton, 1998; President’s Commission on
Excellence in Special Education, 2002; Speece & Case, 2001; Vaughn & Fuchs, 2003)
which showed the injustices of overrepresentation of minorities in special education, the
lack of inclusive educational settings for students with disabilities (McLeskey &
Waldron, 2011), and the biases incorporated in IQ tests. All of these improprieties
occurred using the discrepancy model (Fuchs & Fuchs, 2008; Gresham, 2002; President’s
Commission on Excellence in Special Education, 2002; Speece & Case, 2001). The
timing was right for the reauthorization of Elementary and Secondary Education Act
([ESEA] 2002), which was renamed No Child Left Behind Act ([NCLB] 2002), and the
Individuals with Disabilities Improvement Act ([IDEA] 2004), in order to address these
injustices. Thus came the latest school reform initiative, response to intervention (RtI),
also known as multiple tiers system of support (MTSS) (Batsche & Kincaid, 2011;
Gresham, 2007).
Labeling and inclusion. Labeling of students with learning disabilities,
intellectual disabilities, or emotional behavior disorders has been a recurring topic in

26
special education for many decades (Kliewer & Biklen, 1996). Many special education
researchers have argued that labeling students is detrimental to learning (Bogdan &
Taylor, 1994); it exacerbates school segregation (Fuchs & Fuchs, 1994), creates low self-
esteem (Biklen & Duchan, 1994), induces low academic outcomes, produces high rates
of high school dropouts, and generates large percentages of unemployment (Lipsky &
Gartner, 1996). This research on the negative effects of labeling fostered the discussion
about students with disabilities not being included in the general education setting and the
need for the inclusion of students with disabilities in the mainstream classroom (Lipsky
& Gartner, 1996).
Lipsky and Gartner (1996) argued that segregated special classrooms created
limited benefits for students with disabilities; their reasons included: inadequacies in
practice, prejudice, and discrimination. Further, Lipsky and Gartner (1996) posited that
at least five factors were contributing to the need for school reform, including concerns
that: poor education outcomes for students with disabilities continued occurring; higher
educational standards for all students were needed; special education court cases had
supported inclusion; insistence on full inclusion by special education advocates was
increasing; and the costs of special education services were spiraling higher. The timing
was right for a reconceptualization of how all struggling students should be serviced in
the educational setting.
Discrepancy model. Just as the labeling and inclusion issues helped set the stage
for a paradigm shift in the organization and structure of schools, so did the introspective
look at the IQ discrepancy model (Kame’enui, 2007). In their report to the National
Research Council, Fuchs and Fuchs (1998) argued for a reconceptualization of the

27
learning disability identification process, because they believed struggling students were
not receiving early interventions using evidenced based practices. Thus, struggling
students were “falling through the educational cracks” and being labeled learning
disabled or emotional/ behavioral disordered prior to receiving suitable academic and/or
behavior interventions. As with most referrals for academic and/or behavior evaluations,
when the interventions fail (as many did), students were referred for evaluation that
consisted of taking an IQ test. Several researchers (Cronbach, 1975; Gresham & Witt,
1997; Reschly & Ysseldyke, 2002) have noted that all cognitive (IQ) ability tests fail to
inform academic or behavioral planning, and are not useful in measuring those academic
or behavioral outcomes (Gresham, 2003). In addition to the lack of inclusion of students
with disabilities in the general education setting, and the negative consequences of
labeling students as learning disabled, intellectually disabled, or emotionally/behaviorally
disordered, and the problems inherent in the use of IQ tests served to create an
educational atmosphere ripe for school reform. The “wait to fail” model was failing; an
alternative mode of academic and behavioral intervention was being demanded by
prominent special education researchers and advocates for school reform (Fuchs &
Fuchs, 2006, Gresham, 2003).
Federal government impact on RtI/MTSS. It was very difficult for the federal
government to ignore the arguments of researchers and special education advocates about
labeling, inclusion, overrepresentation of minority students in special education, and the
flawed IQ test arguments. In addition to these arguments, the LD Initiative (1999), the
LD Summit (2001), and the report entitled The President’s Commission on Excellence in

28
Special Education (2002) provided compelling arguments for the examination of criteria
for eligibility for special education.
The RtI/MTSS concept received its first federal push in May of 1999 at the LD
Initiative. The LD Initiative (1999) was sponsored by the Office of Special Education
Programs (US DOE OSEP), United States Department of Education, and consisted of a
working group of special education researchers and leaders who met in Washington DC
over a two day period to discuss viable alternatives to the IQ-achievement discrepancy
model. Based upon the work that was completed in the LD Initiative (1999), the LD
Summit (2001) national conference, was established two years later and outlined
responsiveness to intervention as an alternative LD eligibility framework (Gresham,
2007). Gresham (2002) had argued that a student’s insufficient response to an
empirically validated intervention implemented with integrity and fidelity should be used
as the criteria to make a student eligible for LD. Others (Fuchs, 2002; Grimes, 2002;
Vaughn, 2002) agreed with Gresham’s (2002) stance. They also posited that RtI/MTSS
was a more viable option for LD identification, especially in light of the consequences
resulting from the use of the IQ-achievement discrepancy model. They argued that the
use of this responsiveness to intervention model would not only decrease the number of
inaccurate LD eligibilities, but would also decrease the overrepresentation of minorities
identified for LD, intellectual disabilities, and emotional behavioral disorders (Gresham,
2007). Furthermore, they affirmed that students would receive academic and behavior
assistance within their general education setting prior to being labeled. Lastly, they stated
that this model would decrease the amount of federal money being spent on special
education services (Fuchs, 2002; Gresham, 2007; Grimes, 2002; Vaughn, 2002).

29
Following the LD Summit, the President’s Commission on Excellence in Special
Education Report reiterated RtI/MTSS as a practical alternative to the IQ-achievement
discrepancy model. This report, entitled A New Era: Revitalizing Special Education for
Children and Their Families, was funded by OSEP, U.S. Department of Education,
(2002). It took the members of the commission 10 months to compile the
recommendations from over 100 special education researchers, education finance experts,
medical experts, parents of children with disabilities, and others with expertise in special
education.
The 2002 President’s Commission on Excellence in Special Education Report
made several recommendations based on these findings. The first recommendation
focused on early intervention, not on the eligibility process, while maintaining procedural
safeguards. Through IDEA (2004), academic expectations for students with disabilities
were to be raised and become results- oriented, not driven by the referral process and
special education litigation. The second recommendation endorsed stronger
accountability through state standards and state standardized assessments. The third
recommendation embraced a model of prevention that emphasized early intervention,
used scientifically based interventions and reformed pre-service teacher training. The
fourth recommendation considered children with disabilities as general education
children first. As such, special education should not be considered as a separate cost
system. General and special education teachers should share the instruction. Funding
should not create an incentive for identification. All resources in a school should be used
to meet the needs of all students. Flexibility in the use of all funds, including IDEA
funds, was considered essential. The last recommendation was included in order to

30
encourage states to eliminate the outdated, biased IQ-discrepancy model that relied upon
the “wait-to-fail” approach (Bradley, Danielson, & Doolittle, 2007) of identifying
learning disabilities and introduced a response to intervention model, to reduce the
overrepresentation of minorities in special education.
Although NCLB (2002) does not specifically mention RtI/MTSS, the basic tenets
of the framework are addressed throughout the document. The document calls for
stronger accountability from school districts to provide adequate yearly progress (AYP)
for each and every student. AYP advocates progress monitoring, and a student outcomes
focus that mirrors RtI/MTSS. NCLB mandates closing the achievement gap among
minorities (i.e., African American and Hispanic students) when compared to European
American students, and is a major tenet of RtI/MTSS. NCLB (2002) refers to school
districts using research based instruction and scientifically based research with fidelity
and integrity to drive curriculum design. This is the same language used in the RtI/MTSS
framework including similar verbiage, (i.e., scientifically based research, peer-reviewed,
evidence-based, fidelity and integrity). Highly qualified teachers are called for in NCLB
(2002) to implement this research based instruction; the same is asked of those
implementing the RtI/MTSS framework in order to ensure its success. Even though the
exact words “response to intervention” is not found in NCLB (2002), it is clear that the
inference is there.
Two years after the reauthorization of NCLB (2002), President Bush signed into
law the reauthorization of IDEA (2004). While taking the recommendations of the 2001
President’s Commission on Excellence in Special Education Report, the clear intent was
to align both NCLB (2002) and IDEA (2004). The reauthorization of IDEA (2004)

31
included the language of highly qualified special education teachers and cross referenced
NCLB (2002). Evidenced based research, which was included in NCLB (2002) was
included throughout the reauthorization of IDEA (2004), and is defined as:
Research that involves the application of rigorous, systematic, and
objective procedures to obtain reliable and valid knowledge relevant to
education activities and programs; and (a) Includes research that (1)
Employs systematic, empirical methods that draw on observation or
experiment; (2) Involves rigorous data analyses that are adequate to test the
stated hypotheses and justify the general conclusions drawn; (3) Relies on
measurements or observational methods that provide reliable and valid data
across evaluators and observers, across multiple measurements and
observations, and across studies by the same or different investigators; (4)
Is evaluated using experimental or quasi-experimental designs in which
individuals, entities, programs, or activities are assigned to different
conditions and with appropriate controls to evaluate the effects of the
condition of interest, with a preference for random-assignment
experiments, or other designs to the extent that those designs contain
within-condition or across-condition controls; (5) Ensures that
experimental studies are presented in sufficient detail and clarity to allow
for replication or, at a minimum, offer the opportunity to build
systematically on their findings; and (6) Has been accepted by a peer-
reviewed journal or approved by a panel of independent experts through a

32
comparably rigorous, objective, and scientific review. (sec. 9101 (37) of
the ESEA [NCLB], 2002)
Inherent in the law was the means for schools districts to legally use up to 15% of
the IDEA funds for early intervention for struggling non-identified students in the general
education setting. Most importantly, the reauthorization of IDEA (2004) added language
regarding alternative methods of LD identification, clearly stating that local education
agents (LEAs) are not required to consider whether a child has a severe discrepancy to be
identified with a learning disability. In addition, the law states that LEAs may choose to
use a framework that determines if a student responds to a scientific research based
intervention. While the reauthorization of IDEA (2004) did not eliminate the IQ-
achievement discrepancy model, it opened the door for individual states to make this
decision.
Recently, President Obama released his blueprint for reauthorization of the
Elementary and Secondary Education Act (ESEA; the original name for NCLB), which
encourages and reemphasizes the need to adopt more rigorous academic standards, and
data based decision making and accountability models. This blueprint not only reiterates
the tenets of NCLB (2002), but also provides incentives for improved educational reform
efforts by rewarding schools that improve student educational outcomes.
State RtI/MTSS initiatives. Currently 45 out of 50 states have a state RtI/MTSS
framework, and over 60 percent use only RtI/MTSS for determining learning disabilities
eligibility (National Center on Response to Intervention [NCRtI], State Database, 2010).
Forty-eight states have RtI/MTSS components in their state performance plan, although
14 states still do not have state RtI/MTSS technical assistance documents (NCRtI, 2010).

33
While 60 percent of states have required school districts to use only RtI/MTSS for
learning disabilities eligibility, many have not provided state level assistance. Many
states have left the decision making and the devising of RtI/MTSS frameworks to local
school districts. This lack of structure in implementing RtI/MTSS has left most districts
looking for direction from national research centers or other states that have a strong
statewide foundation and RtI/MTSS framework.
The Florida Department of Education and the University of South Florida
Problem Solving/Response to Intervention Project have been in the national forefront by
spearheading one of the first statewide initiatives (FLDOE, 2008). The Florida Problem
Solving/Response to Intervention Project is a joint venture between the University of
South Florida and the Florida Department of Education. This partnership was developed
to facilitate and evaluate the scaling-up of RtI/MTSS Practices across the state of Florida
(Castillo et al., 2010). The Florida Problem Solving/Response to Intervention Project
incorporated statewide training delivered to all school districts and then district specific
training to a certain number of districts each school year (Batsche et al., 2007). The
Florida Department of Education has established an RtI/MTSS advisory group, a state
transformation team, a state management team, and district/school based leadership teams
to build RtI/MTSS capacity (FLDOE, 2008). The FLDOE has also collaborated with
other statewide initiatives (i.e. Just Read, Florida; Florida Continuous Improvement
Model; Reading First; Statewide Positive Behavior Support & Early Intervention
Programs) to ensure alignment of professional development and common terminology
across the related initiatives (FLDOE, 2008). The FLDOE provides online professional
development courses on RtI/MTSS. The state revised relevant state statutes, rules, and

34
policies to support RtI/MTSS by making it the only process required for identification of
students with learning disabilities, language impairment, and emotional and behavioral
disorders (FLDOE, 2008). Lastly, the FLDOE evaluates districts’ effectiveness in using
the RtI/MTSS process and activities through the review of student outcomes, and through
professional development training reviews of evidenced based practices.
RtI/MTSS Models
RtI/MTSS is based on the concept of determining whether an adequate change in
behavior or academic performance has been obtained due to the intervention (Gresham,
2002). In an RtI/MTSS approach, decisions regarding changing, or increasing, an
intervention are made based upon how well the student responds to an evidenced based
intervention that has been implemented with integrity and fidelity (Gresham, 2007).
RtI/MTSS presupposes that if a student shows no gains from the most appropriate, best
intervention available, then that student can and should be made eligible for special
education services, and receive an even more intense intervention (Gresham, 2003).
Gresham (2007) argues RtI/MTSS is not a new concept; it has been utilized in
other fields. The field of medicine is one such profession that has used RtI/MTSS for
decades. Physicians employ RtI/MTSS principles in their everyday practices to treat
physical illnesses. For example, if a patient visits his/her doctor for shortness of breath,
the doctor is going to take the patient’s weight, height, blood pressure, as well as have the
patient submit to a blood analysis. The physician takes baseline data, and then
determines the patient’s health issue(s) through a problem solving process. The doctor
asks the patient other questions such as, what does his/her diet consist of, does he/she
smoke, drink alcohol, etc. A prescribed treatment is given to the patient, whether it is a

35
change in diet, smoking cessation classes, a change in exercise regime, or medication.
The patient is required to return to the physician in a specific number of weeks; at that
time, the patient’s vitals will be taken again. The physician keeps a progress monitoring
chart of the patient’s vitals; if the patient has made progress with his/her health issues, the
doctor decreases prescription orders; if the patient has still not made progress, the doctor
will adjust the prescription orders. Gresham (2002) and others (Bradley, Danielson, &
Hallahan, 2002; Fuchs, 2002; Fuchs & Fuchs, 1998; Grimes, 2002; Vaughn, 2002)
posited that the RtI/MTSS principles used in the medical field were suitable for use in
education and should be implemented in making important academic and behavioral
decisions for struggling students.
Two basic approaches to RtI/MTSS have been implemented by schools districts
and as part of state initiatives. The first approach is a problem-solving model; the second
approach is the standard-protocol approach (Fuchs, Mock, Morgan & Young, 2003). A
few districts used a hybrid model, combining the two approaches, particularly within a
multi-tier model of service delivery (Barnett, Daly, Jones, & Lentz, 2004;
VanDerHeyden, Witt, & Naquin, 2003).
The problem solving approach can be traced back to the behavior consultation
model first developed by Bergan (1977), and then updated by Bergan and Kratochwill
(1990). The four phases of the behavioral consultation model include: problem
identification; problem analyses; plan implementation; and plan evaluation. The intent of
the behavioral consultation model is to clearly define the problem in operational terms,
identify environmental conditions exacerbating the problem, design and implement an
intervention plan with fidelity and integrity, and evaluate the effectiveness of the

36
intervention (Bergan & Kratochwill, 1990). Tilly (2002) expanded upon Bergan and
Kratochwill’s (1990) model by formulating four fundamental questions to guide the
identification of school-based academic and behavior interventions: What is the
problem? Why is the problem happening? What should be done about the problem? Did
the intervention work? The problem solving model has been implemented at the
elementary level for many years with success in the Heartland Area Education Agency 11
in Iowa, (Ikeda, Rahn-Blakeslee, Niebling, Gustafson, Allison, & Stumme, 2007), the
Minneapolis Public Schools (Marston, Muyskens, Lau, & Cantor, 2003), and the St.
Croix River Education District in Minnesota (Bollman, Silberglitt, & Gibbons, 2007).
In contrast to the problem solving model, the standard protocol model involves
the implementation of evidenced-based, multi-component programs with strong research
support that are focused on specific skill areas. The intervention program has well-
defined implementation steps that follow a scripted, prescriptive process. The intent is to
have a high probability of academic success when the programs are followed with fidelity
and integrity. Groups are identified by examining the general nature of the student’s
academic problem and matching him/her to the proper protocol (Vaughn, Linan-
Thompson, & Hickman, 2003). Standard protocol may then involve commercial
programs designed to focus on an area of the student’s academic weakness. Many of
these packaged programs provide empirical support from outside researchers (Shapiro,
2009). In addition to packaged programs, standard protocol may include structured
partnered reading activities, such as direct instruction on phonological or phonics skills,
or computer based reinforcement programs (VanDerHeyden, Witt, & Gilbertson, 2007).
A hallmark of the standard protocol model is the delivery of the intervention without in-

37
depth analyses of the students’ academic deficiencies. Interventions are delivered in
moderate size groups, typically from six to twelve students (Shapiro, 2009).
Although the intent of both problem solving and standard protocol models is to
improve student outcomes while both requiring the use of evidenced based interventions,
there are advantages and disadvantages to using either model (Shapiro, 2009). While the
problem solving model focuses on the individual student’s academic and/or behavior
deficit, the standard protocol model is a less exacting, more generalized intervention that
may not reach a student’s specific area of need. Standard protocol models provide
intervention within a larger group of students, typically six to twelve students, while the
problem solving model requires intervention groups that are smaller, typically no more
than five. Standard protocol model interventions focus on reading and math
interventions, while the problem solving model focuses on both academic and behavior,
depending on the student’s deficiency. While the major advantage of the problem
solving model is its individualized intervention focus, it is lacking in integrity and
treatment fidelity (Burns, Vanderwood, & Ruby, 2005). The primary advantage of the
standard protocol model is that the packaged, scripted intervention assures quality control
of instruction; in other words, there is a higher level of integrity and fidelity of
implementation. In addition, when allocation of teacher resources is limited, a greater
number of students can still be provided with interventions through the standard protocol
approach (Fuchs et al., 2003). However, the standard protocol model does present
challenges to addressing the unique learning needs of students who have difficulties with
more severe academic deficits. In essence, the advantages of the problem solving model
are the disadvantages of the standard protocol model and vice versa (Shapiro, 2009).

38
While individual school districts in Minnesota, Pennsylvania, and Iowa have been
implementing the problem solving approach for many years, Florida was one of the first
states to initiate and scale up a state-wide RtI/MTSS framework. Along with Illinois,
Ohio, Pennsylvania, and Texas, Florida established a strong infrastructure for a state-
wide RtI/MTSS framework (Great Lakes Comprehensive Assistance Center, 2006).
Florida has chosen to use the problem solving approach for its state-wide initiative.
Florida’s rationale for using the problem solving approach is that it complements other
state initiatives (such as Positive Behavior Intervention Support, Just Read Florida,
Florida Continuous Improvement Model, etc.) and can be easily dovetailed into the
school districts already established school improvement plans (FLDOE, 2008).
Florida’s RtI/MTSS model. The Florida RtI/MTSS model uses the problem
solving approach that advocates the practice of providing high quality instruction
matched to individual student needs. RtI/MTSS uses the measure of learning rate over
time and level of performance to make important educational decisions (Fuchs & Fuchs,
2006). Within the RtI/MTSS framework, resources are allocated in direct proportion to
student needs. The RtI/MTSS framework is a three-tier model that uses increasingly
more intense instruction, strategies, and interventions over time. Data collection at each
tier is used to measure the fidelity of the intervention so that meaningful decisions can be
made about which instruction, strategy, and intervention should be maintained or
eliminated (Marston et al., 2003).
Tier I is the foundation of core academics and consists of scientific, research
based instructional and behavioral methodologies, practices, and supports designed for all
students in general education. Tier II consists of supplemental instruction and

39
interventions that are provided in addition to, and in alignment with, effective core
instruction and behavioral supports to groups of targeted students who need additional
instructional and/or behavioral support. Tier III consists of intensive instructional or
behavioral interventions provided in addition to, and in alignment with, effective core
instruction with the goal of increasing an individual student’s rate of progress. Tier III
interventions are developed for individual students using the problem solving process.
Students receiving Tier III level of support may or may not be eligible for special
education and related services as described in IDEA (2004) (Fuchs & Fuchs, 2006;
Gresham, 2003; VanDerHeyden & Witt, 2005). Eighty percent of the general student
population should make adequate learning gains on the Tier I or core academic level. Of
the 20% who do not, 10% will make adequate learning gains with Tier II assistance
(Fuchs & Fuchs, 2008); of the remaining 10% of students not making adequate learning
gains at Tier II, 5% will make adequate gains on Tier III (Fuchs & Fuchs, 2008), and the
remaining 5% will be eligible for special education (Fuchs & Fuchs, 2008). Special
education is not a tier, nor is RtI/MTSS a series of events conducted for the purpose of
identifying a disability. As an alternative, RtI/MTSS is a process used for the purpose of
revealing what works best for groups of students and individual students, regardless of
their educational placement (Vaughn & Fuchs, 2003).
According to the University of South Florida Problem-Solving Project and
FLDOE (2008), the foundational Beliefs of the RtI/MTSS model state that for maximum
student learning gains to occur, the following must be evidenced:
1. Scientifically research based instruction must be delivered by highly qualified
personnel. Curriculum and instructional approaches must have a high probability

40
of success for the majority of students. Differentiated instruction must be
implemented to meet individual learning needs.
2. Assessments used to measure student progress must be reliable, valid, and
instructionally relevant. Screening and data collection must occur for the purpose
of assessing the effectiveness of core instruction and identifying the students in
need of more intensive intervention and support. On-going progress monitoring
to guide instruction and intervention effectiveness must occur, as well as
diagnostic assessments in order to gather information from multiple sources to
determine why students are not benefiting from instruction and what specific
areas of need must be addressed.
3. A problem solving method must be used to make decisions based on a
continuum of student needs. Additionally, a strong core curriculum must be
provided with highly qualified instruction and assessment while providing
increased levels of support based on the greater intensity levels of student needs.
School based and district based problem solving teams must also be in place.
4. Data must be used to guide instructional decisions, to align curriculum and
instruction, and to allocate resources and drive professional development
decisions. Data must be used to create student growth trajectories to target and
develop interventions.
5. Professional development (PD), follow-up modeling, and coaching must be
provided to ensure effective instruction at all academic levels. Ongoing
professional development (PD) and support for all personnel delivering
instruction and interventions to students must occur. Administration must

41
anticipate and be willing to meet the newly emerging needs of instructional
personnel based on student performance. Tools for communicating with parents
and educators must be provided. Administrators must allow regular timeframes
for educators to interact and collaborate to improve instruction and intervention
efforts.
6. Leadership buy-in is vital. Strong administrative support is necessary to
ensure commitment and resources. Strong teacher support is essential in the
common goal of improving instruction. A leadership team must build staff
support, internal capacity, and sustainability over time.
7. All students and their families are part of one proactive and seamless
educational system. The students, staff, and community must believe all students
can learn. All available resources must be used to teach all students. Instructional
time must be used efficiently and effectively. Parents must be continually
informed and involved in meaningful and effective communication concerning
student progress (Batsche et al., 2005; Fuchs & Fuchs, 2008).
Local urban school district RtI plan. The local urban school district where this
study took place began full implementation of the RtI framework in the beginning of
school year 2008-2009. School psychologists were the first leads with the new initiative.
The following school year, the district used American Recovery and Reinvestment Act
(ARRA) funds to purchase and place one RtI facilitator in each elementary school, and
one RtI facilitator for every six secondary schools. These RtI facilitators were to assist in
building RtI consensus at their schools. The ARRA funds were used for two years; in the
third year, the principal had to make a site based decision to purchase the RtI facilitator

42
out of his/her school budget. The district used a hybrid model. The standard protocol
method was used for students who scored level one or two on the state standardized test;
these students were then placed in intensive math and/or reading classes. If students were
still having difficulty, they were referred the school based team, which is the school’s
problem solving team. Each school is required to have a problem solving team.
Elementary Level RtI/MTSS Research
Empirical studies, such as those with experimental or quasi-experimental
designs, are difficult to find in RtI/MTSS literature. Gersten, Baker, Smith-Johnson,
Flojo, and Hagan-Burke (2004) found that the number of experimental designs funded by
OSEP dropped from 26.8 percent in 1987-1988 to 12.9 percent in 1997-1998. In
addition, Gersten et al. (2004) discovered that of the 49 experimental designs recognized
in 1987-1988, only 10 used random assignment of students to treatment conditions. In
1997-1998, Gersten et al. (2004) found only one randomized, experimental design study
out of the 70 funded that year. Seethaler and Fuchs (2005) completed a literature review
of the years 1999-2004, researching five special education research journals (Journal of
Special Education, Exceptional Children, Learning Disabilities Research & Practice, the
Journal of Learning Disabilities, and School Psychology Review). Seethaler and Fuchs
(2005) found 806 relevant articles. Of those pertinent articles, only 44 or 5.46 percent of
them tested a reading or math intervention using a group design. Thirty-four of the 44
group design studies investigated reading interventions and the other 10 investigated
math interventions; all of these studies were at the elementary level. Another 4.22% of
the studies implemented a randomized controlled assignment; again, all studies were at
the elementary level.

43
From 1995- 2005, Wanzek and Vaughn (2010) completed a synthesis of research
and found 31 experimental and quasi-experimental studies where interventions were
implemented with struggling readers in first through fifth grade. In their comparison of
the instructional size of the group, they found in first through third grade interventions,
one-to-one interventions yielded moderate to large effect sizes, while studies with more
students (3-8 students) involved in the small group interventions yielded smaller effects
overall. Wanzek and Vaughn (2010) were not able to find any studies with 2-4 student
intervention groups. The bulk of the studies were for kindergarten and first grade
struggling readers. Wanzek and Vaughn (2010) noted that as the size of the group
decreased, the intensity of the intervention increased. They explained that this research
synthesis indicates that there are several unanswered questions in tiered reading
interventions. They found only one study that examined the quality of Tier I reading
instruction, and only two studies that investigated the effects of a more intensive
intervention for students who had already failed in a tiered intervention model. Lastly,
they noted that students who fail to increase reading skills in Tier I and II interventions
may require more intensive interventions in Tier III; yet at the present time, there are few
studies examining these interventions for severely struggling readers.
Since those literature reviews on empirical intervention studies were published,
there has been minimal increase in the number of randomized controlled studies in the
last six years. VanDerHeyden, Witt, and Gilbertson (2007) conducted a multiple baseline
design to examine the effects of implementation of a standard protocol RtI/MTSS model
entitled System to Enhance Educational Performance (STEEP). Five elementary schools
(grades 1-5) in a suburban school district outside of Tucson, Arizona participated in the

44
study. Only one school had higher than 30% of its students on free and reduced lunch.
Results found that there was an almost 70% decrease in the number of students made
eligible for special education services, and there were no disproportionate findings for
minority students identified for special education.
Fuchs et al. (2008) performed a randomized control design to investigate the
utility of Dynamic Assessment of algebraic learning in predicting third graders
development of mathematics problem solving over a four year period; 510 students from
30 participating classrooms in Title I schools took part in the study. Of the 510 students,
150 were randomly selected to receive the mathematic problem solving intervention.
Findings concluded that Dynamic Assessment was a valid predictor of future
mathematical success, and Fuchs et al. (2008) argued that it should be a relevant tool to
insert into an RtI/MTSS system.
Dion et al. (2011) investigated improving the attention of and preventing reading
difficulties among low income first grade students. Students were assigned to one of two
control groups during reading that received either peer tutoring activities or intervention
groups which were involved in the Good Behavior Game. Fifty-eight first grade
classrooms located in Montreal’s poorest neighborhoods participated in the study. Dion
et al. (2011) found that while generally both these groups of students made reading
progress while receiving the peer tutoring and playing the Good Behavior Game, the
intervention did not make a significant difference in their reading gains as the researchers
had hypothesized. However, the Good Behavior Game significantly improved the
students’ attention span; in fact, this intervention had a very large effect size.

45
Fletcher et al. (2011) examined the cognitive attributes of 258 first grade students
who responded adequately and inadequately to Tier II reading interventions. The sample
of students was derived from two different school districts in Houston and Austin, Texas.
One school district was located in a large urban area and the second district was located
in a smaller suburban area. Phonological awareness, rapid letter naming, oral language
skills, processing speed, vocabulary, and nonverbal problem solving were the cognitive
assessments measured. Fletcher et al. (2011) found that phonological awareness was the
most significant contributor between adequate and inadequate responders of Tier II
reading interventions.
Greenfield, Rinaldi, Proctor, and Cardarelli (2010) asked the question about how
educators view the RtI/MTSS change process. The data gathered was analyzed through a
consensual qualitative methodology. This study took place in an urban elementary
school in the northeastern part of the United States. Eighty-eight percent of the students
were on a free and reduced lunch and 52% of the students were English language
learners. Consensual qualitative approach is commonly reported in the field of
psychology and uses a constructivist approach (Greenfield et al., 2010). Semi-structured
one hour interviews were conducted with 30% of the elementary faculty; half of the
participants were general education teachers and the other half were special education
teachers. A team of three researchers analyzed the data using a consensus method to
determine core ideas for each case and data across the cases to establish generality of
findings. Five themes emerged: assessment and progress monitoring, the link between
intervention and instruction, impact of teacher practice, culture of reform, and special
education referral process for English language learners. In general, the teachers felt that

46
RtI/MTSS increased student achievement because the data showed progress. They
believed that the progress monitoring and targeted instruction indicated change was
necessary, but did not indicate what or how to change instruction. The teachers felt that
they needed more professional development regarding when to move from one tier to the
next. Teaching students in all three tiers at the same time was difficult, but necessary.
As for change, the teachers believe stakeholders were supportive, but with some
hesitation. They believed all teachers had the best interest of the students at heart, and
that change happened, but over a longer period of time. The teachers reported concerns
about reporting English language learners for special education evaluation, given the
concerns that brought RtI/MTSS to the forefront in the latest school reform (i.e.
overrepresentation of minority students in special education) (Greenfield et al., 2010).
The Florida Problem-Solving Response to Intervention Project: Year 3 Evaluation
Report (Castillo, Hines, Batsche, & Curtis, 2011) provided preliminary outcomes of a
four to six year implementation project. Castillo et al. (2011) provided training, technical
assistance, and support on the problem-solving/RtI/MTSS model over a three year period
to 34 pilot elementary schools across the state of Florida. These 34 pilot schools were
representative of elementary schools across the state in terms of size, racial diversity, and
poverty levels. Training modules provided by Castillo et al. (2011) included: legislative
initiatives regarding RtI/MTSS, regulatory and historical reasons that explained the
rationale for implementing RtI/MTSS, how to initiate and partake in the systematic
change process, as well as the knowledge and skills to implement RtI/MTSS. All pilot
schools targeted math, reading, and behavior to implement in the RtI/MTSS process.
Elementary schools with similar demographics were used as a control or comparison

47
group and were not given any training modules. Castillo et al. (2011) used the three stage
systems change model: developing consensus for RtI/MTSS; building infrastructure of
RtI/MTSS framework; and facilitating and supporting the implementation of RtI/MTSS.
Major findings of the Year 3 Evaluation Report (Castillo et al., 2011) included the
following:
1. Increases in district and school participation in and support for RtI/MTSS
implementation are evident. Members of both the leadership teams and the
instructional staff increased levels of agreement with core Beliefs of RtI/MTSS.
2. Improvement in the structures and educator skills essential to supporting
RtI/MTSS implementation was apparent. Ongoing professional development was
found to be critical to building capacity to be able to implement RtI/MTSS with
fidelity.
3. Increases in the use of RtI/MTSS in pilot elementary schools from year one to
year three were marked.
However, Castillo et al. (2011) noted self-report surveys from these pilot
elementary schools seemed to be inflated. When the researchers actually went to the
schools to observe documentation of interventions, these pilot schools did not
demonstrate greater increases across many of the data components. Therefore, the
researchers suggested interpreting this finding with caution.
Castillo et al. (2011) suggest ongoing professional development is critical to
scaling up RtI/MTSS. Both formative and ongoing evaluation of the RtI/MTSS
framework is necessary in order to fine tune the model. Lastly, the researchers believe a

48
minimum of four to six years is necessary before full implementation of RtI/MTSS can
occur.
RtI/MTSS Research in Secondary Schools
Duffy (2007) posits that there is an urgent need to implement RtI/MTSS at the
secondary level. A recent National Assessment of Educational Progress (NAEP) from
the National Center for Education Statistics (2009) reports 70% of eighth graders are
below the basic level in reading comprehension. However, there is minimal empirical
research investigating implementation of tiered interventions for struggling secondary
students (Kamil et al., 2008). According to Fuchs and Fuchs (2010), few researchers
have focused on secondary students when investigating RtI/MTSS in well conceptualized
intervention studies. Fuchs and Fuchs (2010) argue many researchers view secondary
schools as fraught with fidelity of implementation and integrity problems (i.e., scheduling
and compliance issues). To date, there are only two experimentally designed RtI/MTSS
studies using a secondary population. Vaughn et al. (2010) investigated the effectiveness
of Tier II reading interventions on struggling sixth graders when compared to typical
readers from two large urban school districts in southwestern United States. Criterion for
inclusion in the study was the students’ scores from the state standardized assessment of
knowledge and skills; participants needed to score below the 2,100 cutoff mark to be
included in the study. Students enrolled in an alternative program, such as special
education, were eliminated from the study. Seventy-nine percent of the included students
were on free or reduced lunch, 46% of the students were African American, 40 percent
were Hispanic, 12% were Caucasian, and 3% were Asian. Decoding, spelling, fluency,
comprehension, and the Kaufman Brief Intelligence Test-2 were given as pre and post

49
tests. The researchers gave a total of 60 hours of professional development to all teachers
who were providing the interventions to participating students. The professional
development was followed up with bi-weekly study groups facilitated by a researcher
placed at each school site. Interventionists (professionally trained teachers) provided the
reading intervention to groups of 10-15 students for approximately 50 minutes per day,
every school day, from September through May. Researchers observed interventionists
two to three times per month to ensure intervention fidelity. Findings showed students
who received the Tier II interventions outperformed the comparison group on measures
of word attack skills, spelling comprehension, and phonemic decoding; however, gains
were small. Other relations between sight word fluency and passage fluency were
difficult to attribute directly to the reading intervention. Vaughn et al. (2010) admit that
closing the gap between struggling readers and typical readers is overly ambitious for
middle school students, and that, while their findings improved student reading levels,
they did not change dramatically over the course of the year.
Faggella-Luby and Wardwell (2011) examined the outcomes of a Tier II reading
comprehension intervention for 86 at-risk fifth and sixth graders in an urban school
district in the northeastern United States. Students were chosen to participate in the study
based upon their scores on screening tests and the state standardized assessment test
given annually. According to Faggella-Luby and Wardwell (2011), due to study
constraints, a post-test design was implemented. To make the study more robust,
students were randomly assigned to interventions. Interventionists were graduate
students from the local university who were working on their degrees in special
education. Three different reading interventions were implemented with students and

50
included: Story Structure, Typical Practice, and Sustained Silent Reading. The
interventionist to student ratio was one teacher for every five to seven students. The
intervention took place two to three times per week in 30 minute sessions for the first two
quarters of the school year. All students received the intervention between 35 and 48
times during that school year. Findings included significant results with moderate effect
sizes for the sixth grade students in the Typical Practice and Story Structure interventions
as compared to the Silent Sustained Reading intervention. However, results were mixed
and effect sizes small for fifth grade students reading gains. The researchers explain this
difference by proposing the possible need for more explicit instruction for fifth graders
than sixth graders. In addition, Fagella-Luby and Wardwell (2011) posit that RtI/MTSS
is a viable framework for improving secondary student reading outcomes. They believe
more attention should be spent researching the pedagogy of instruction, total amount of
time in the intervention, intensity of time spent in instruction, and levels of explicitness in
the delivery of the intervention.
As previously mentioned, the only extensive national “how to guide” to
implement RtI/MTSS at the secondary level can be found in a qualitative study
conducted by a joint effort of three government research centers, the National Center on
Response to Intervention, the Center on Instruction, and the National High School Center
(HSTII, 2010). HSTII (2010) grounded their conceptual underpinnings by stating that the
framework of secondary RtI/MTSS would consist of the same set of essential
components that elementary schools would consist of, but that the actual interventions
may look different due to a secondary school’s unique culture, structure, and organization

51
(Duffy, 2007). The HSTII (2010) considers the RtI/MTSS core principles and essential
components to include:
the majority of students’ educational needs are met through
research driven practices;
students are screened in order to identify those in need of more
intensive instruction;
progress monitoring provides data to assess students’ learning and
academic performance and to determine whether a specific
intervention is effective or not;
interventions increase with intensity in direct proportion with a
student’s needs;
and data for screening and progress monitoring is essential and
necessary for the special education services eligibility process.
The intent of the HSTII (2010) was to further the RtI/MTSS secondary literature
and the understanding of how tiered intervention frameworks are implemented at the
secondary level. The sample for this study was purposive with each center asking their
regional resource centers to nominate secondary schools that were implementing some
form of tiered interventions. Fifty one schools were initially identified and contacted by
the researchers inquiring if they would be willing to participate in an interview and
potential site visit. Twenty schools responded that they were willing to be interviewed
and to participate in a 45 minute phone interview; all of these schools interviewed had
been implementing some form of RtI/MTSS for one to eight years. On the basis of those
phone interviews, the HSTII researchers chose eight schools to visit. The researchers
52
then conducted training on synthesizing their understanding of RtI/MTSS at the
secondary level. The training was conducted by several national experts in the field of
secondary education; these experts helped guide the researchers in the selections of the
eight site visits, as well as helped establish a unified question protocol and provided a list
of types of RtI/MTSS related artifacts to gather.
The eight school visited included the following: School “A” was from a western
state, located in an urban area with 3,400 students. Sixty-five percent of the students
were Hispanic, 18% were African American, 9% Filipino, 3% Asian, 3% Pacific
Islander, and 2% White; about 75% were socioeconomically disadvantaged. School “B”
was from a southeastern state, a metropolitan area with 2,200 students. Seventy percent
of the students were African American, 24 % White and 52 % were on free or reduced
lunch. School “C” was from a Midwestern state, located in a suburban area with 2,000
students. Sixty-five percent were White students, 3% African-American, 22% Hispanic,
7% were Asian/Pacific Islander, 3% Multiracial/Ethnic; 15% were on a free or reduced
lunch. School “D” was from a Midwestern state, located in a suburban area with 1,100
students. Ninety-five percent were White, and only 15% were on a free or reduced lunch.
School “E” was from a southern state located in a rural area with 450 students. Thirty-
three percent were White, 67% were African-American, and 70% were on a free or
reduced lunch. School “F” was from a western state located in a suburban area with 810
students. Sixty-nine percent were Latino, 28% White, 1% African-American with 62%
on free or reduced lunch. School “G” was from a Midwestern state located in a rural area
with 1,700 students. Forty-five percent were White, 28% were African-American, 9%
Hispanic, 19% other, and 39% were on free or reduced lunch. Lastly, school “H” was

53
from a northeastern state located in a suburban area with 565 students. Eighty-nine
percent were White, 6% were African-American, 3% were Latino and 2% were Asian
with 33% on free and reduced lunch.
During site visits and interviews, researchers discovered several common themes
that supported the essential components of RtI/MTSS. Those themes included
leadership, intervention providers, professional development/coaching, and evaluation.
RtI/MTSS leadership included a variety of stakeholders including administration, content
level leaders, school psychologists, social workers, general education teachers, and
special education teachers. All schools had stakeholders on their leadership team that had
direct involvement with students at risk for dropping out. The researchers also found that
leadership teams were devised based on the purpose of the secondary school’s RtI/MTSS
model. Leadership teams were in charge of creating staff consensus, delivering
professional development, implementing evaluation procedures, allocating resources;
making data based decisions, and creating a sustainable framework.
According to the National High School Center, National Center on Response to
Intervention and Center on Instruction [HSTII] (2010), intervention providers were
observed as being many different professionals in different schools. The researchers
noted that schools may need to devote much time and resources to building staff
consensus for the overall RtI/MTSS framework and to teaching effective collaboration
among different teachers (i.e. co-teaching between special education teachers and general
education teachers). Most schools observed targeted their interventions toward 9th
and
10th
grade students, and interventions typically did not occur in the general education
classroom. In two schools that were visited, general education teachers provided the

54
intervention during a “study hall” type class. Those who provided the intervention more
than likely collected the progress monitoring data as well.
A wide range of professional development (PD) occurred at the observed schools;
most of the schools conducted PD specifically on RtI/MTSS, as well as on research based
instructional strategies. Most times the PD was offered to the entire staff, with frequent
coaching and modeling that was typically provided by content experts or behavior
specialists. Many schools reported they were receiving ongoing professional
development from local universities or from their state departments of education.
Evaluation of problem solving process and tiered interventions were observed at
all school visits. Leadership teams collected data to evaluate the effectiveness of their
schools’ tiered intervention fidelity implementation as well as the efficiency of the
program or procedures.
The HSTII (2010) found four major concerns in the schools they visited: building
staff capacity was difficult, scheduling of interventions was complicated, finding
intervention resources was limited, and implementing fidelity for interventions was
difficult. All schools visited by the researchers reported struggling to build capacity for
the school reform initiative. RtI/MTSS Beliefs, Skills, and Practices had to be an
ongoing learning experience for the framework to be embedded in the culture.
Scheduling of interventions and even time for leadership teams to discuss data were
discussed as experiencing major scheduling/time constraints. All schools recognized the
complexity of creating a flexible schedule so students could fluidly move from content
instruction to intervention. The key, many schools said, was to be flexible and adapt the
master schedule to fit the individual student’s needs. All schools visited expressed the

55
concern of limited resources both of man power and intervention programs. Fidelity of
implementation was seen as a major obstacle by all schools visited; most used state
assessment data and observational data in lieu of more rigorous diagnostic measurements.
Based on their visits, HSTII (2010) created an implementation chart of contextual
factors that can assist secondary schools with their RtI/MTSS implementation. This is a
set of guided questions that leadership teams just starting the framework can use as a
scaffolding instrument. The contextual factors include: School’s primary intervention
focus; in other words, what is the school’s greatest concern (i.e. literacy or dropout rate).
Next on the chart was the school culture, which are the Beliefs, Practices and Skills of the
staff, or the school’s culture aligned with the goals and purposes of the RtI/MTSS
framework. Instructional organization is next with concerns on how staff will adapt or
create time for interventions, collaborate, perform data chats etc. Staff roles are
important, covering such concerns as who will provide the interventions; who will
complete the progress monitoring; how will instructional professional support staff such
as school psychologists, guidance counselors, general education teachers, special
education teachers, and speech/language pathologists fit into the RtI/MTSS framework;
and what will their roles be. Student involvement examined such questions as: will
students be involved with the implementation of interventions, and how will progress
monitoring occur? Graduation requirements are addressed: with what impact will
additional interventions have on a student’s courses or credits toward graduation?
Stakeholder engagement is important covering concerns such as; how will parents be
involved in the RtI/MTSS framework? Implementation and alignment of initiatives is
crucial to the success of RtI/MTSS; how this will be supported has to be answered.

56
Lastly, how will the intervention instruction be assessed is a question that must be
addressed by the RtI/MTSS leadership team, including what data will be used, and what
constitutes fidelity of implementation of an intervention.
Sansosti, Noltemeyer, and Goss (2010) mailed a survey to over 2000 principals
across the United States to measure perceived importance of RtI/MTSS and actual
availability of RtI/MTSS interventions and practices at the high school level. The
researchers based these two dimensions on the Fullan’s (2007) model of educational
change. Of the 2000 emailed surveys sent out to members of the National Association of
Secondary Principals, 482 participants responded; of these, 467 were actually high school
principals. Eight scales were measured with three to six questions in each scale. The
scale domains included: 1. Beliefs of key stakeholders; 2. Knowledge and skills of key
stakeholders; 3. Scheduling and structure factors; 4. Availability of intervention
programs; 5. District policy factors; 6. Accountability methods; 7. Existence of
collaborative teams; and 8. Communication. These scales were chosen after a literature
review of experts in the area of RtI (Batsche et al., 2006; Jimerson et al., 2007). A pilot
study was conducted and Cronbach’s alpha was used to evaluate the internal consistency
of the survey. The internal consistency was high (above α = .79) except for existence of
collaborative teams (α= .60). Therefore, the researchers dropped this scale from the
emailed survey. Wilcoxon signed-ranks tests were used to find overall differences
between Beliefs and Practices, and a Kruskal-Wallis test was used to examine differences
between these two variables and the demographic variables: age range and initial
understanding of RtI/MTSS.
Sansosti et al., (2010) findings included:

57
1. Participants generally reported some knowledge of RtI/MTSS, that
implementing RtI/MTSS in their schools would be more difficult than
implementation in elementary schools, and required many systematic and practice
changes;
2. Participants reported a larger perceived importance for RtI/MTSS than they
were actually implementating it; and
3. Participants with higher levels of RtI/MTSS knowledge tended to report higher
levels of RtI/MTSS implementation in their high schools.
Sansosti et al. (2010) suggested that their findings demonstrate a perceived
discrepancy between the importance of implementing RtI/MTSS and the actual act of
implementing RtI/MTSS. They posit that this discrepancy is significant to achieve
successful school reform. If principals believe the concept of RtI/MTSS is important, but
they have difficulty actually taking the model and implementing it in practice due to all
the barriers, then this school reform is bound to be unsuccessful. Sansosti et al. (2010)
argue that there are major obstacles that must be overcome in order for RtI/MTSS to be a
successful school reform initiative at the secondary level, including a lack of data
collection systems, scheduling issues for problem-solving meetings, and a lack of actual
evidence based interventions.
Fisher and Frey (2011) explored the RtI/MTSS efforts of one small, urban high
school located in the southwestern United States. Fisher and Frey (2011) used qualitative
method case studies to document this high school’s implementation efforts and student
outcomes. Their intent was to find out how intervention and instruction are organized in
a complex high school culture and to collect data on student achievement over a two year

58
period. The high school studied had established relationships with one of the researchers’
university/school for professional development; therefore entry into the school was not
difficult. This easy entry also meant the researchers had prior relationships with the
faculty and staff; therefore, it was necessary for the researchers to bracket their previous
experiences. The school had 444 students, including, 44% African-American, 18%
White, and 16% Asian. Approximately 15% of the students were from military families,
and more than seventy percent spoke another language other than English. All twenty-
three teachers in the school agreed to be part of the researchers’ study. Not all of the
teachers agreed that interventions were part of their job description, but they all did
agreed that the school would be better off if all learned whether the RtI/MTSS would
improve student outcomes. According to Fisher and Frey (2011), RtI/MTSS buy-in was
a continual process. Of the twenty-three teachers, four were in special education; three of
these teachers were providing in class support to the general education teachers and one
special education teacher was serving as the intervention coordinator.
Fisher and Frey’s (2011) qualitative methodology included observations and
interviews. The researchers’ observations included field notes detailing classroom
observations, observations of professional development, and observations of faculty
meetings as well as individual education program (IEP) meetings; these observations
were recorded during random visits to the school. Data collection averaged three days
per school week, for a total of 112 classroom observations, and 55 non-classroom
observations. Interviews of staff were scheduled during the second year of the study.
The teacher interviews focused on essential components of the RtI/MTSS framework, the
teachers’ RtI/MTSS efforts, and the successes and challenges they had experienced.

59
Each teacher was interviewed at least once and some were interviewed for a second time
to clarify previous statements. All interviews were from 30 to 45 minutes long, and
equated to 134 pages of transcribed data. The researchers used a semi structured
interview approach to discuss three main topics: the individual teacher’s teaching
experience, his/her perception of RtI/MTSS at the school, and the teacher’s experiences
with struggling students who attended the school. Fisher and Frey (2011) also used
additional probing questions, such as what supports, services, and resources had the
teacher found to be useful in his/her intervention efforts. Other probing questions
included: how would the teacher describe RtI/MTSS to another teacher; what still needs
to be implemented in RtI/MTSS to make it effective; and what is not working and needs
to be changed in the RtI/MTSS framework.
The researchers independently analyzed all the interview and observation data for
themes. Together the researchers discussed their themes, and in cases where they
disagreed, they would set the data aside and come back to it and continue their
discussions until they could come to a consensus. Fisher and Frey (2011) found five
themes.
Theme One: Focus on quality core instruction; the staff had agreed early
on that their framework consisted of revolving essential elements that
could be started in any order. Purpose and modeling, guided instruction,
productive group work, and independent learning tasks were the four
essential elements.
Theme Two: Competencies and progress monitoring; when the teachers
were asked whether they plan instruction based on student work, several

60
answered with a decisive no! The researchers were initially told by the
teachers that students either do not do the work or they copied from other
students, so to base lessons on what students had completed would be a
waste of time.
Theme Three: Schedule intervention to support, or not to support core
instruction; at the beginning of the study, supplemental instruction was
firmly entrenched in classes after school hours.
Theme Four: Dedicate resources to support intervention efforts; the
school hired a full-time reading specialist who coordinated all
supplemental and intensive reading efforts. By the second year in the
study, this specialist was identifying students in need of additional reading
interventions.
Theme Five: Adopt a school wide approach to RtI/MTSS to maximize
intervention impact; at the beginning of the study, the researchers could
not find one student who was receiving a Tier III intervention. When
teachers were asked about how they felt if a student needed that intensity
in an intervention, they all responded students should have already been
placed in special education. However, by the second year, students were
being placed in online interventions or receiving Tier III interventions
after school.
Based on the little quantitative data Fisher and Frey (2011) collected, it was
apparent students made academic and behavioral gains from one school year to the next.
For example, overall grade point averages (GPA) increased from 2.89 to 3.36. GPA’s of

61
students living in poverty improved from 2.26 to 3.12; GPA’s of students with disabilities
improved from 1.30 to 3.02; attendance increased 5%; and referrals to special education
decreased from seventeen the first year of the study to three referrals the second year.
Based on these findings, Fisher and Frey (2011) support implementing RtI/MTSS at the
secondary level; they note it may be a way to reduce referrals and eligibilities to special
education, and improve the overall achievement of all students on a secondary campus.
The researchers argue that it took the entire school to create this change; the major
breakthrough came from the entire faculty’s decision to develop an intervention system.
In addition, the researchers suggest that a lack of student assessment information leaves
teachers floundering; it was not until the teachers established course competencies that
interventions became meaningful to all involved. For schools wishing to implement
RtI/MTSS with fidelity and build consensus, Fisher and Frey (2011) noted that funding
must be allocated to hire a person who is both adept at working with adults and students
to bring about school reform change.
Theoretical Framework
Kurt Lewin’s (1947) change process serves as a theoretical guide in the present
study. Lewin’s change process identifies a three phase, ongoing process of: first,
unfreezing old Beliefs and Practices; second, moving these Beliefs and Practices to the
new Beliefs and Practices; and third, freezing the new Beliefs and Practices in place.
Lewin (1947) argues that the role of unfreezing old Beliefs and Practices is to
motivate and make individuals and whole groups ready for change. The thawing-out
process is the stage in which individuals now see the need for change. Unfreezing is thus
the breaking down of customs, old Beliefs, and old Practices so that individuals and
62
groups are ready to accept the new alternatives. The moving or changing phase occurs
when individuals and groups are motivated to change; they are ready to listen to the new
Beliefs, Practices, and Skills. This change is more likely to occur when the individuals
and groups ready for change have models they can support and emulate. This sub-phase
is called “internalization” and is more apt to take place when the individuals and groups
are placed in situations in which the new Beliefs, Practices, and Skills are demanded of
them (Hersey, Blanchard, & Johnson, 2001). Compliance can also be a component of the
changing phase, when individuals and groups are forced to change by direct manipulation
of rewards or punishment by authority in positions of power. If compliance is the modus
operandi, then the new Beliefs, Practices, and Skills will be evident when position power
is present, but will regress when position power is absent. The last phase of Lewin’s
change process is the refreezing phase, when the newly acquired Beliefs, Practices, and
Skills become integrated as part of the individuals’ and groups’ patterned behaviors. It is
highly critical that these newly “refreezed” individuals and groups receive continual
support such as on-going professional development in the new Beliefs, Practices, and
Skills. Otherwise these newly trained and reprogrammed individuals and groups will
regress (Hersey et al., 2001).
Conceptual Framework
Lewin’s (1947) change theory is comparable to the systems change model
(Fixsen et al., 2005) that has been used in the conceptual framework that the Florida
Problem-Solving RtI/MTSS Project System Change Model (Castillo et al., 2010) has
adopted and adapted. Castillo and colleagues recognized that Florida pre-kindergarten
through 12th
grade educational system is a social system as defined by the systems

63
change model (Fixsen et al., 2005). There are many connected parts of the social system:
from the governor, legislature, and the Florida Department of Education, to the different
county school districts, all the way down to each school, and each classroom (Batsche et
al., 2007). According to Batsche and colleagues (2007), each part of the social system is
dependent on the other; when one portion of the social system experiences change, the
remainder of the social system will eventually experience the change as well. Previous
school reform initiatives have been futile due to the inability of policy makers to
meaningfully involve educators in decision making. Nor have school reform initiatives
considered the context of school districts in the larger social system (Castillo et al.,
2010). In order for RtI/MTSS to be a successful school reform initiative, it is critical that
principles of the systems change be applied to facilitate implementation of new Beliefs,
Skills, and Practices to all staff throughout the system (Curtis, Castillo, & Cohen, 2008).
According to Batsche and colleagues (2010), the systems change model adopted by the
Florida RtI/MTSS Project has three stages: consensus development, infrastructure, and
implementation. These three stages are similar to Lewin’s (1947) change process.
Consensus development refers to the development of the need for change among
stakeholders, such as principals, teachers, professional support staff, and student services
personnel. According to Curtis et al. (2008), educators will typically embrace new
Beliefs and Practices when they understand the need for change, have the necessary skills
to implement the new initiative, or know that they will receive professional development
in order to implement the new program. Consensus development is similar to the freeze
stage in Lewin’s change process. Stakeholder buy-in must be a continual change process,
and must not be thought of as a one-time event (Batsche et al., 2010).

64
Infrastructure is the phase of creating structures to facilitate and support the
implementation of the RtI/MTSS model. Schools must consider building capacity by
implementing the following structures: develop/adopt a standards-based comprehensive
assessment system; identify what tier (I, II, or III) resources are available to teachers;
align existing policies and procedures with the use of RtI/MTSS Practices across the
tiers; determine what existing meeting times educational staff can use to implement
RtI/MTSS Practices, or what staff schedules must be arranged to create time; and, time to
provide ongoing professional development (Kurns & Tilly, 2008). Professional
development models that include RtI/MTSS coaching are more apt to be successful in
creating the sustainability of evidenced based practices required by RtI/MTSS (Darling-
Hammond & McLaughlin, 1995). Ongoing professional development and coaching are
essential so that the tenets of RtI/MTSS can be rooted in the culture of the school. The
infrastructure stage is similar to Lewin’s change or moving phase. It is also imperative
that professional development be delivered consistently, and a long-term professional
development plan be devised with ongoing evaluation of components, so adjustments can
be made (Batsche et al., 2010).
Implementation is the last phase of the RtI/MTSS system change approach.
Sarason (1990) argues that many education reforms fall short due to the lack of adequate
implementation. This research suggests that the critical components of RtI/MTSS
practices be continually evaluated for integrity and fidelity, prior to making decisions as
to whether they have an impact on student outcomes or not (Batsche et al., 2010). In
order to determine what integrity and fidelity of implementation mean, educators must
first define and measure their meaning (Noell & Gansle, 2006). The implementation

65
stage is similar to Lewin’s refreezing phase, where the new Beliefs, Practices, and Skills
are embedded in the school culture. This defining of integrity and fidelity of
implementation requires educators to identify the vital elements of their RtI/MTSS
framework. Castillo et al. (2010) argue that observation protocols are the most accurate
method to assess implementation fidelity and integrity. Since this method is time
consuming, educators’ self reports are an optional means to collect integrity and fidelity
of implementation data (Castillo et al., 2010). Nevertheless, self-report data tend to be
positively biased (Noell & Gansle, 2006), which decreases the possibility of a reliable
measurement (Castillo et al., 2010). But, taken together, observations, interviews,
permanent products, and educators’ self reports can present valuable data on the extent of
implementation fidelity and integrity and how the implementation relates to student
outcomes (Castillo et al., 2010).
Summary
Educators’ Beliefs of RtI/MTSS, beliefs about student learning, and instructional
strategies are continually changing. Numerous special education researchers (Bradley et
al., 2002; Cronbach, 1975; Donovan & Cross, 2002; Dunn, 1968; Elliott et al., 2002;
Fuchs & Fuchs, 1994; Fuchs et al., 2003; Gresham, 2002; Gresham & Witt, 1997;
Marston et al., 2003; Vaughn, 2002) have conducted or reviewed research that has served
to unfreeze old beliefs about student learning and instructional strategies. These
researchers have denounced labeling of students as learning disabled, intellectually
disabled, and emotionally and behaviorally disordered, and provide extensive evidence
that well designed inclusive classrooms provide an excellent education for a myriad of
students who learn differently (McLeskey & Waldron, 2011).
66
As Lewin’s (1947) change process suggests, these special education researchers
have created a school reform change atmosphere by bringing to light the
overrepresentation of minorities in special education, the inadequacies of the IQ
discrepancy model, the unintended negative consequences of labeling students, and the
labeling of students who should not have been labeled. The leaders of education now
realize the need for change; their belief system has been unfrozen; they are now
motivated to change their beliefs as witnessed by the aligning of NCLB 2002 (ESEA) and
IDEA 2004, as well as the many state RtI/MTSS initiatives enacted in the last few years.
Now these federal, state, and local educational leaders are charged with changing the
Beliefs, perceptions of Practices and Skills of an educational workforce that has been
rooted in teacher-centered pedagogy for decades. This unfreezing of beliefs and
perceptions of past pedagogy, changing to a culture of student outcome focused on their
response to intervention, and then to refreezing these new RtI/MTSS Beliefs, Skills, and
Practices is truly a paradigm shift (Kame’enui, 2007). This change process, or school
reform, is taking the educational system and educators from a teacher-centered focus to a
student-centered focus.

67
CHAPTER III
METHOD
Introduction
To address the previously described research questions, this study used an
explanatory mixed methods design (Creswell & Plano Clark, 2011), which is a
sequential, two-phased mixed method. This mixed method approach is a procedure for
collecting, analyzing, and mixing or integrating both quantitative and qualitative data at
some stage of the research process within a single study (Tashakkori & Teddlie, 2003).
First, administrators and teachers were surveyed regarding their Beliefs, perceptions of
Practices, and perceptions of Skills toward RtI/MTSS; in the second phase,
administrators, teachers, and professional support staff were interviewed, and asked to
explain the results that were obtained from the quantitative survey data.
The first phase, a quantitative research design, used three surveys devised by the
Florida Statewide Problem Solving and Response to Intervention Project (Castillo et al.,
2010). The researcher was granted permission to use the surveys from George Batsche,
Director of the University of South Florida Problem-Solving Project. The first part of the
survey assessed administrators’ and teachers’ Beliefs about RtI/MTSS Practices. The
second part of the survey measured perceptions of administrators, teachers, and
professional support staffs on the extent to which their schools practice or implement
RtI/MTSS. The last portion of the survey was the perceptions of administrators, teachers,
and professional support staffs about the skills they possess in order to implement
RtI/MTSS.

68
The second phase of this investigation, a qualitative design, used focus group
interviews of administrators, teachers, and professional support staff asking them semi-
structured questions based upon the quantitative data results. These questions were
derived from the results of the first quantitative phase of this investigation (Creswell &
Plano Clark, 2011). These beginning questions were then followed up by additional
questions to extend and clarify comments from the focus groups, and to clarify
perspectives on issues that arose in the quantitative survey.
Philosophical perspectives. This researcher embraced more than one worldview
in this study (Creswell & Plano Clark, 2011). For the quantitative design portion of this
study, the researcher viewed the study using a postpositivist lens based on Lewin’s
(1947) framework for the change process. The researcher assumed that some change has
occurred for the administrators, teachers, and professional support staff since the school
district first implemented the RtI/MTSS four years prior. The researcher measured the
beliefs of administrators, teachers, and professional support staffs, their perceptions of
Practices, and their perceptions of Skills about RtI/MTSS, and assumed that there were
significant differences across groups based on the impact of the change process (Lewin,
1947) and systems change model (Fixsen et al., 2005).
During the second qualitative phase, the researcher viewed the study using a
constructivist lens (Creswell & Plano Clark, 2011). To that end, the researcher conducted
focus group interviews to elicit multiple meanings from participants and to build a deeper
understanding than the survey could render alone. The researcher thus shifted from a
postpositivist worldview in the quantitative phase to a constructivist worldview in the
qualitative phase of the investigation.

69
Creswell and Plano Clark (2011) argue that worldviews relate to specific types of
research designs and that these worldviews can change during a study, as they may be
tied to different phases of a study. They contend researchers should honor and write
about their varying worldviews that occur during studies. The overarching purpose for
using this design was to use the qualitative results to further explain the initial
quantitative results. The quantitative results alone would not provide a thorough
understanding of the data obtained or the implications of the findings.
Proposed research. The intent of this study was to investigate the RtI/MTSS
beliefs of secondary administrators, general education teachers, special education
teachers, and professional support staff’s perceptions of their Skills, and perceptions of
their Practices related to RtI/MTSS. To access this information, Beliefs about RtI/MTSS,
Perceptions of RtI/MTSS Practices, and Perceptions of RtI/MTSS Skills survey data were
collected from administrators, general education teachers, special education teachers, and
professional support staff in a southeastern United States urban school district. This
survey investigated whether consensus, infrastructure, and implementation of RtI/MTSS
were perceived differently among administrators, general educators, special educators,
and professional support staff. Follow-up focus group interviews were conducted to
further explain participants’ RtI/MTSS Beliefs and perceptions of their Skills and
Practices.
Research Design
This study used explanatory mixed- methods design (Creswell & Plano Clark,
2011). According to Creswell and Plano Clark (2011), the explanatory mixed method
design occurs in two, sequential, distinct phases. These phases began in this investigation

70
with the collection of quantitative data. This first phase was then followed up with a
second qualitative phase of the study that was designed to build and clarify the results of
the quantitative phase. This design is most useful when the researcher desires not only to
assess trends and relationships with quantitative data, but also attempts to explain the
reasons for the quantitative results (Tashakkori & Teddlie, 2003). To that end, the
explanatory mixed methods design was best suited for this study, because it allowed for
triangulation of data as well as comprehensive complementary results (Greene, Caracelli,
& Graham, 1989). As posited by Castillo (2010) and colleagues, the need for both self
reports of Beliefs, perceptions of Practices, and perceptions of Skills as well as the rich,
in-depth interviews of administrators, general education teachers, special education
teachers, and professional support staff provided the best explanations and informed
further research on secondary RtI/MTSS. This mixed method study allowed the
researcher to combine the empirical precision of the survey with descriptive, rich text
(Onwuegbuzie & Leech, 2005).
Quantitative Research Questions
1. Are there perceived differences in Beliefs about RtI/MTSS among secondary
administrators, general educators, special educators, and professional support staff in
an urban school district?
2. Are there perceived differences in RtI/MTSS Skills among secondary administrators,
general educators, special educators, and professional support staff in an urban school
district?
3. Are there perceived differences in RtI/MTSS Practices among secondary
administrators, general educators, special educators, and professional support staff in

71
an urban school district?
4. What is the relationship of staff’s (administrators, general educators, special educators,
and professional support staff) Beliefs about RtI/MTSS and the number of years they
have been in education?
5. What is the relationship of staff’s (administrators, general educators, special educators,
and Professional support staff) Skills about RtI/MTSS and the number of years they
have been in education?
6. What is the relationship of staff’s (administrators, general educators, special educators,
and Professional support staff) Practices about RtI/MTSS and the number of years
they have been in education?
7. What is the relationship of staff’s (administrators, general educators, special educators,
and professional support staff) Beliefs about RtI/MTSS and the number of years they
have been in their current positions?
8. What is the relationship of staff’s (administrators, general educators, special educators,
and professional support staff) Skills about RtI/MTSS and the number of years they
have been in their current positions?
9. What is the relationship of staff’s (administrators, general educators, special educators,
and professional support staff) Practices about RtI/MTSS and the number of years
they have been in their current positions?
Sample
Currently, there are approximately 70 secondary schools (middle/high) in this
southeastern United States urban school district that have Response to
Intervention/School Based Teams (problem–solving teams). The entire sample was

72
drawn from this large urban district that reflects the demographics of other large urban
cities across the United States with diverse populations. However, this district has an
unusually large population of Haitian Creole students (identified as Black in Table 1)
which is not representative of other large urban cities. Table 1 below identifies the latest
annual demographics for this school district.
Table 1
2008-2009 Student Demographics for School District
Student Demographic s Percentage
Adapted from Florida Department of Education, Florida School Indicators Report, 2008-
09.
Table 2 identifies the latest annual faculty and staff demographics for the school
district; the total number of staff included: 4624 teachers, 156 administrators, and 434
professional support staff. White females represent 63% of the total population and 71%
of the entire sample is white. The representation of demographics in this school district is
White 39.10% Black 28.80% Hispanic 24.10% Multi-Racial 4.90% Asian 2.60% Indian 0.40% Disabled 15.00% Gifted 4.30%
Free/Reduced Lunch 44.10% English Language Learners 14.40% Migrant 1.30% Female 48.50% Male 51.50% Dropout 2.60% Graduation Rate 80.00%
Total Membership 170,756

73
common throughout the U.S. (Guarino, Santibaňez, & Daley, 2006; Strizek,
Pittsonberger, Riordan, Lyter, & Orlofsky, 2006).
Table 2
2008-2009 Secondary Teacher Demographics for School District
Teacher Demographic Total %
Adapted from Florida Department of Education, Florida School Indicators Report, 2008-
09.
Table 3 identifies the latest annual administrator demographics for the school
district. Again, the largest group of administrators are female (56%) and the ethnicity of
the administrators is predominately white (78%). This district’s demographics
representation is common throughout the U.S. (Strizek et al., 2006).
Total Membership (General & Special Education Teachers) 4,624 100.0% White 3,303 71.0% Black 828 18.0% Hispanic 416 9.0% Asian 70 2.0% Indian 7 >.05% Female 2,887 63.0% Male 1,737 37.0%
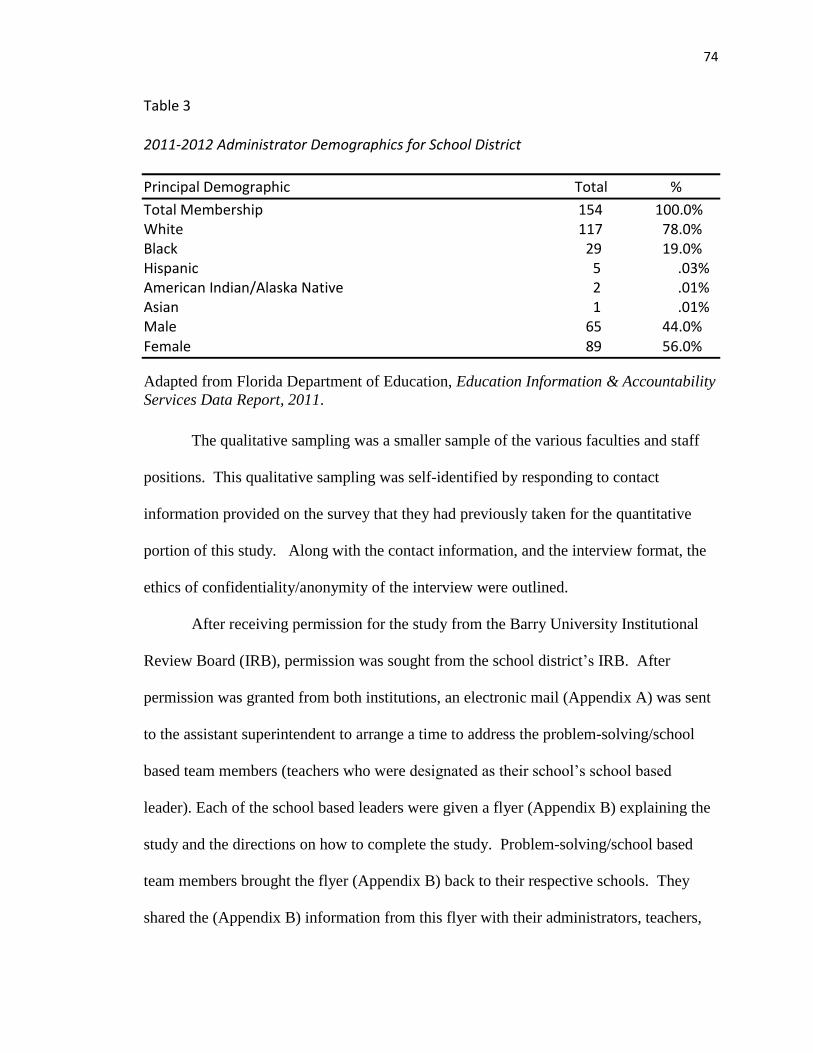
74
Table 3 2011-2012 Administrator Demographics for School District
Principal Demographic Total %
Total Membership 154 100.0% White 117 78.0% Black 29 19.0% Hispanic 5 .03% American Indian/Alaska Native 2 .01% Asian 1 .01% Male 65 44.0% Female 89 56.0%
Adapted from Florida Department of Education, Education Information & Accountability
Services Data Report, 2011.
The qualitative sampling was a smaller sample of the various faculties and staff
positions. This qualitative sampling was self-identified by responding to contact
information provided on the survey that they had previously taken for the quantitative
portion of this study. Along with the contact information, and the interview format, the
ethics of confidentiality/anonymity of the interview were outlined.
After receiving permission for the study from the Barry University Institutional
Review Board (IRB), permission was sought from the school district’s IRB. After
permission was granted from both institutions, an electronic mail (Appendix A) was sent
to the assistant superintendent to arrange a time to address the problem-solving/school
based team members (teachers who were designated as their school’s school based
leader). Each of the school based leaders were given a flyer (Appendix B) explaining the
study and the directions on how to complete the study. Problem-solving/school based
team members brought the flyer (Appendix B) back to their respective schools. They
shared the (Appendix B) information from this flyer with their administrators, teachers,

75
and professional support staff. Administrators, teachers, and professional support staff
were able to access the survey online at a time that was convenient for them. Once
participants had voluntarily taken the online survey and reached the final page, they saw
a note (Appendix E) thanking them for participating in the survey, and then another note
offering them an opportunity to discuss the survey results in an audio-taped interview.
Survey participants had the opportunity to contact the researcher if they were interested
in participating in this in-depth 60 minute audio-taped interview (either as an individual
or as part of a focus group). Four focus groups were formed; they were homogeneous
and consisted of three administrators, four general education teachers, two special
education teachers, and five professional support staff (e.g. school psychologist, speech
language pathologist).
Quantitative Instrumentation
The RtI/MTSS survey contained three original instruments developed by the
University of South Florida Problem Solving/Response to Intervention Project (2010).
The first part of the survey was the Beliefs Survey which included background and
demographic information. The first four questions of the RtI/MTSS Beliefs survey were
job description, highest degree, years of experience in education, and years in current
position. The second part of the survey was the Perceptions of RtI/MTSS Practices; the
third part of survey was the Perceptions of RtI/MTSS Skills. The entire survey contained
135 likert scaled questions that took no longer than 20 minutes to complete.
RtI/MTSS Beliefs Survey. The RtI/MTSS Beliefs Survey is a self-report
measure that evaluates educators’ beliefs about RtI/MTSS. The survey contains 22 likert

76
scale items in three sub scales that measure the educators’: 1. beliefs about service
delivery regarding assessment practices; 2. core instruction, intervention; and
3. determination of special education eligibility. The first instrument contains belief
statements in which the participant is asked to rate the extent of his/her
agreement/disagreement using the following response scale: 1 = Strongly Disagree;
2 = Disagree; 3 = Neutral; 4 = Agree; 5 = Strongly Agree. Examples of questions
include: “Using student-based data to determine intervention effectiveness is more
accurate than using only ‘teacher judgment’; general education classroom teachers should
implement more differentiated and flexible instructional practices to address the needs of
a more diverse student body”.
According to the University of South Florida Problem Solving/RtI Project
(Project Staff Manual) (2010), there are two purposes for the use of the RtI/MTSS Beliefs
Survey. One purpose is to assess the impact of professional development efforts on
educators’ beliefs about RtI/MTSS Practices. The second purpose is to identify
commonly held beliefs among educators.
The USF Project Staff Manual (2010) reviewed relevant literature, instruments,
and evaluation projects in order to develop an instrument representative of beliefs
pertinent to RtI/MTSS. The Project Staff Manual (2010) conducted a pilot study with the
Educator Expert Panel Validation Panel. Both content validity and construct validity
were measured. The Promax Oblique Factor Solution of Statements from the RtI/MTSS
Beliefs Survey measured 72% of common variance. For the subscales of academic
ability and performance of students with disabilities, the factor analysis yielded internal
consistency reliability estimates of α=.87 as measured by Cronbach’s alpha; for data-

77
based decision making (α=.79); and for functions of core and supplemental instruction
(α=.85).
Perceptions of RtI/MTSS Practices Survey. The second part of the survey is the
Perceptions of RtI/MTSS Practices. This part of the survey includes 17 likert scaled
items that assess educators’ perceptions regarding the extent to which RtI/MTSS
Practices are currently being implemented in their school. The instrument contains two
sub scale items that measure educators’ perceptions on the implementation of RtI/MTSS
Practices as they apply to both academic and behavior content across tiers. The likert
scale values are: 1= Never Occurred; 2= Rarely Occurred; 3= Sometimes Occurred;
4=Often Occurred; 5= Always Occurred; 6= Don’t Know. Examples of the questions
include: “Data (e.g., curriculum based measurement, FCAT, Discipline Referrals) were
used to make decisions about necessary changes to the core curriculum or discipline
procedures to increase the percent of students who achieve benchmarks in a) Academics
and b) Behavior. The students identified as at-risk routinely received additional (i.e.,
supplemental) intervention(s) in a) Academics and b) Behavior”.
Content and construct validity on the Perceptions of RtI/MTSS Practices Survey
were conducted in a pilot study by the USF Project team and vetted by the Educator
Expert Validation Panel. A common factor analysis was performed using the responses
of 2,140 educators in 62 schools in the state of Florida. Two factors accounted for 75%
of the common variance in participants’ perceived practices. These two factors are
Perceptions of RtI/MTSS Practices applied to academic content and perceptions of
RtI/MTSS Practices applied to behavior content. The internal consistency reliability
estimates as measured by Cronbach’s alpha yielded the following factor analysis: Factor

78
one (Perceptions of RtI/MTSS Practices applied to academic content): α=.97; Factor two
(perceptions of RtI/MTSS Practices applied to behavior content): α=.96.
Perceptions of RtI/MTSS Skills Survey. The third and final portion of the
survey is the Perceptions of RtI/MTSS Skills. This part of the survey consists of 20 likert
scaled questions that assess educators’ perceptions of the Skills they possess to
implement RtI/MTSS Practices. The instrument contains three sub scales that assess
RtI/MTSS academic Skills, behavior Skills, and data/technology Skills. The instrument
measures the level of support educators perceive is required for them to successfully
implement RtI/MTSS Practices; the likert scale values are: 1= I do not have this skill at
all; 2= I have minimal skills in this area; need substantial support to use it; 3=I have this
skill, but still need some support to use it; 4=I can use this skill with little support; and
5=I am highly skilled in this area and could teach others this skill. Sample questions
include: “1. Access the data necessary to determine the percent of students in core
instruction who are achieving benchmarks in a) Academics b) Behavior. 2. Develop
potential reasons (hypotheses) that a student or group of students is/are not achieving
desired levels of performance (i.e. benchmarks) for: a) Academics b) Behavior”.
Content and construct validity were both conducted on this instrument with a pilot
group of educators versed in RtI/MTSS Practices. The instrument was first vetted by the
Educator Expert Validation Panel and then given to a sample of 2,184 educators in 62
schools in the state of Florida. Three factors accounted for 80% of the common variance.
Internal consistency reliability estimates as measured by Cronbach’s alpha for each of the
three factors established a factor analysis as follows: Factor 1(Perceptions of RtI/MTSS
skills applied to academic content): α=.97; Factor 2(Perceptions of RtI/MTSS Skills

79
applied to behavior content): α=.97; and Factor 3(Perceptions of data manipulation and
technology use skills): α=.94.
Qualitative Instruments
Based upon the significant quantitative survey results, semi-structured questions
were devised for one hour audio-taped interviews for each of the focus groups.
Additional questions were based on particular issues raised by the survey results, as well
as issues raised based on the focus group participants’ comments. The focus groups for
the qualitative sample were gathered from the quantitative participant sampling.
Quantitative participants were informed in writing at the end of answering the survey that
they could contact the researcher after the completion of the survey if they were
interested in participating in a focus group at a later date. Selection of qualitative follow-
up participants was based on the initial quantitative results.
Quantitative Procedures
Pilot study. A pilot study was completed by the researcher with a small sample
of teachers in order to note the length of administration, the clarity of the questions, and
the degree of difficulty of the questions found on the quantitative survey. Informed
consent was provided prior to taking the pilot survey, and staff was gathered by snowball
sampling from a large urban school district. The entire south Florida school district’s
secondary schools were the target population, including secondary administrators,
general education teachers, special education teachers, and professional support staff.
The researcher sought permission of the employing school district to conduct
surveys and interviews with teachers and administrators. After obtaining permission from
the Barry University Institutional Review Board and the school district’s Research and

80
Evaluation Department, the researcher emailed (Appendix A) the Assistant
Superintendent/Director of Safe Schools in charge of the RtI/MTSS school based teams
(SBTs) seeking permission to present the researcher’s request for survey participants
during the next RtI/SBT District meeting for secondary SBT members (teachers from
each secondary school designated to be the SBT leader). At that meeting, the researcher
presented the title of the study, and explained the procedures, and then distributed the
flyer (Appendix B) regarding the survey to all SBT members in attendance. This
procedure took approximately five minutes to explain to the group. The SBT members
were the facilitators of their schools’ problem-solving group and were the ambassadors to
each school in distributing the flyers (Appendix B) and for the posting of the web-site for
SurveyMonkey™ in each school’s computer lab. The SBT members have no
authoritarian or managerial position within their respective schools. The study flyer
(Appendix B) contained the title of the study, as well as any risks and benefits to the
participants. The flyer contained both procedures and the SurveyMonkeyTM code for
accessing the survey. The flyer explicitly stated: “This survey is strictly voluntary and at
any time, the participant can exit the survey and choose not to participate.” The flyer
also noted that failure to participate in the study did not in any way affect his/her
employment with the school district. While there were minimal risks, such as possible
stress from answering questions regarding school issue, there were no direct benefits to
the participants; participants may have enjoyed answering questions regarding their work,
and the knowledge that they may have benefited research in the area of Response to
Intervention in secondary school settings.

81
Procedures for accessing the survey online
These were the instructions for completing the survey on SurveyMonkeyTM:
1. Enter SurveyMonkeyTM web address in the internet search bar
2. Once participants navigate to the SurveyMonkeyTM web-site, they enter the code
found on the flyer into the survey search box and press Enter.
3. This directs them to the researcher’s survey
4. On the first page, they see a cover letter explaining the researcher’s study, with a
note explaining that taking the study is totally anonymous.
5. Second, they see an Informed Consent page; clicking “next” means that they have
agreed to participate in the survey.
6. After agreeing to participate, they are directed to the survey.
7. After taking the survey, they are given a thank you statement, and asked if they
are interested in participating in a 60 minute audio-taped interview to discuss the
results of the survey in-depth and provide explanations of those results. If they are
interested, they can copy the researcher’s contact information and call the
researcher in order to arrange a time to be interviewed.
Qualitative Procedures
All of these self-selected survey participants who contacted the researcher became
participants of the qualitative phase of the study. Three administrators, two special
education teachers, four general education teachers, and five professional support staff
were purposefully selected for four homogeneous focus groups. The researcher selected
a central location that was convenient for interviewees to convene. Prior to beginning the
interview, participants were given two copies of the informed consent letter, one to sign
82
and one to keep for their records. The researcher explained that they would be contacted
via email after the focus group data had been analyzed, and would be asked to check the
accuracy of the reported data (member checking). The researcher also explained that
their names or the names of their schools would not be used in the study. Participants
and their schools were assigned pseudonyms. The researcher explained that at any time
during the interview if a participant felt uncomfortable or did not want to continue in the
interview, the audio-tape would be stopped and they would be free to leave and none of
their comments or quotes would be used in the study. No focus group participants asked
to stop the audio tapes, and none asked to leave and not participate in the focus group.
Two audio-tape devices were used to insure proper functioning of the taped interview.
The transcriptions are stored in a locked cabinet separate from the signed consent forms,
which are also stored in a separate locked cabinet; after five years, the data will be
destroyed.
Ethical Issues
The researcher anticipated minimal to no risks involved with participating in this
study. One possible risk for participation in the qualitative portion of the study could
have been an increased level of stress discussing students, other teachers, or
administrators. No increased levels of stress were noted by participants. To help lessen
this stress, the researcher made every effort to be empathetic toward the participant’s
stress level and provided empathic comfort and reassurance if necessary. If any
participant would have expressed stress, the researcher would have asked the participant
if the interview needed to be terminated. No participants expressed stress; no interviews
were terminated. All data and audio-tapes would have been destroyed in such cases. If

83
needed, the researcher would have identified qualified mental health professionals who
could assist the participant. This was not necessary.
Figure 2. Procedural Flowchart of the Study
Phase/Schedule Procedure Product
-RtI/MTSS Beliefs, Skills, Practices -Numeric data
-MANOVAS, Correlations - Descriptive &
Inferential statistics,
results
-Purposeful sampling - Number of participants
-Development of interview - Interview protocol
questions
-Homogenous focus groups -Textural data
-60 minute audio-taped interviews
-Coding & thematic analysis -Codes & themes
-Member checking -Cross case themes
-Explanation & interpretation of -Discussion, implications
-Quantitative & Qualitative results -Future research
Figure 2. Diagram of timeline of the study on Staffs’ Beliefs, Perceptions of their Skills and
Practices. Adapted from Ivankova and Stick (2007) in Creswell and Plano Clark (2011).
Quantitative Data
Collection
1/26/12-6/20/12
Quantitative Data
Analyses
6/20/12-8/20/12
Focus Group;
interview protocol
development
8/20/12-9/23/12
Qualitative Data
Collection
9/24/12-10/15/12
Qualitative Data
Analysis
10/15/12-12/20/12
Integration of
Qualitative &
Quantitative
Results
12/20/12-01/07/13
84
Quantitative Data Analyses
The researcher conducted descriptive and inferential analyses on the survey data
collected; there is little published research available on secondary staffs’ Beliefs, Skills
and Practices of RtI/MTSS. The quantitative phase of this study consisted of two types
of analyses first, multivariate analyses of variance (MANOVA), and second, a series of
Pearson r correlations. Prior to those analyses, frequencies were run to determine if there
were any missing or incomplete data, then Crosstabs were run to compute central
tendencies and dispersion of the single and multiple groups. Box Plots and P Plots were
performed to determine if there were any outliers in the distribution.
Pearson correlation coefficients were performed to examine the relationships
among administrators, general education teachers, special education teachers,
professional support staff (independent variables) and their RtI/MTSS Beliefs, Skills, and
Practices (dependent variables). Multivariate analyses of variance (MANOVA) were
performed to see if there were significant mean differences for each independent variable
(i.e., administrators, teachers, and professional support staff) and the three dependent
variables (i.e., RtI/MTSS Beliefs, Skills, and Practices). Each dependent variable was
scored in its entirety rather than question by question for each portion of the survey. The
researcher was looking for similarities and differences within and between groups.
Scores from the MANOVA were judged to be significant at p<.001. Pillai’s Trace was
performed to measure error variance. Pillai’s Trace was chosen as the preferred test to
measure error variance because it is the most robust under violations of assumption of
equal covariances (Munro, 2005, p. 183). Univariate F ratio (ANOVA) was performed
on any dependent variable where significance was found either within or between

85
independent variables, this was followed by the Scheffé posthoc test. The Scheffé was
used because it is the most conservative posthoc test and is the best posthoc test for
unequal groups. Statistical analyses program SPSS 20.0 was used to run the data
analyses.
Qualitative Data Analysis
Qualitative data analysis procedures included coding and thematic analyses within
groups based upon questions derived from the quantitative analyses. Once themes were
derived from the qualitative data, member checking occurred, whereby the researcher
emailed the results to the different participants in the focus groups to see if they agreed
with the themes that were identified. The researcher gave one week for the participants
to respond; as there were no responses, the researcher assumed the results were correct.
The results from the quantitative data and the qualitative data were examined for areas of
similarities and differences (Creswell & Plano Clark, 2011).
Summary
This study employed an explanatory, two phased sequential mixed method
approach (Creswell & Plano Clark, 2011) to investigate the RtI/MTSS Beliefs of
administrators, general education teachers, special education teachers, and professional
support staffs, perceived Practices, and perceived Skills about RtI/MTSS. Quantitative
data were collected using a likert scale survey with 135 questions. Quantitative analyses
consisted of Pearson correlation coefficients and MANOVA. Qualitative data were
collected from survey participants after survey analyses and based upon those analyses of
the quantitative data. Homogeneous focus groups were selected based on the quantitative
data analyses. The qualitative data were reported using themes and cross focus group

86
analyses. Qualitative focus group participants were asked to member check themes for
accuracy. Focus group participants as well as their schools were assigned initial
pseudonyms. Quantitative data were triangulated with qualitative data to give a rich in-
depth picture of secondary RtI/MTSS. The underlying principle for using an explanatory
mixed method in this study was to inform the quantitative findings with the qualitative
results (Collins, Onwuegbuzie, & Sutton, 2006); thus, the interpretation of the
quantitative results was expanded in order to help clarify why outcomes did or did not
occur, and to allow comparisons of the results from the quantitative data with the
qualitative findings (i.e. triangulation). Focus groups were chosen as qualitative format
for explaining and triangulating the quantitative data because they were best suited for
addressing questions to inform policy and practice (Brotherson, 1994).

87
CHAPTER IV
RESULTS
The primary purpose of this study was to compare the differences and similarities
of MTSS/RtI Beliefs, perceptions of Skills, and Practices among general education
teachers, special education teachers, professional support staff, and administration.
Secondary analyses were computed to investigate similarities and differences of years of
experience in education, and years in current position among general education teachers,
special education teachers, professional support staff, and administration and their
MTSS/RtI Beliefs, perceptions of Skills, and Practices. Semi-structured interview
questions were derived from the quantitative analyses; and homogeneous focus groups of
general education teachers, special education teachers, professional support staff, and
administrators were interviewed.
This chapter describes the data that were collected and analyzed in order to
investigate the research questions, and presents the results of both the survey and the
focus group analyses. Each quantitative research question is restated and is followed by
the results and analyses pertaining to each question. It should be noted that only
statistically significant results at the p < .001level are reported because there were many
variables requiring multiple tests of significance and a relatively low number of
participants in the study; therefore the conservative significance level was used to
decrease the possibility of type I error. Qualitative semi-structured questions are stated
and are followed by the coding and themes derived from the homogeneous focus group
interview answers.

88
Quantitative Data
Quantitative Participant Demographics
The quantitative portion of the study consisted of participants taking the Beliefs,
Practices, and Skills in RtI/MTSS survey (Appendix D) online. The entire secondary
faculty and staff (administrators, teachers, and professional support staff) from the school
district were included in the sample. Participants were recruited using the school
based/problem-solving team members from each secondary school; they were introduced
to the goals of the study by the researcher during a district level school based/problem-
solving meeting. Table 4 below explains the actual number of participants for the
quantitative portion of the study, and categorizes them (i.e., general education teachers,
special education teachers, etc.). The quantitative phase of the study had 375 total
participants (15% of all possible participants) who started the survey. Table 4 below
represents the number of participants who were kept in the sample after incomplete
surveys were deleted because of insufficient number of responses. How missing data
were handled is explained on page 93. Of the completed surveys, general education
teachers accounted for 143 of the participants or a 45.3% response rate, making them the
largest group who responded to the survey. Participants at the high school level made up
the largest number at 170, or almost 53.8% of all survey participants. All levels are
defined as those participants who work at both the middle school and high school levels.

89
Table 4
RtI/MTSS Beliefs, Skills, and Practices Survey: Participants’ Staff Positions and School Levels
Demographic Variables Total % Actual in District
Total Participants (completed all surveys) 316 100% Staff Position General Education Teachers 143 45.3% 3,616 Special Education Teachers 73 23.1% 1,008 Professional Support Staff 55 17.4% 434 Administration 45 14.2% 156 School Level Middle School Level 104 32.9% High School Level 170 53.8% All Levels 42 13.3% Total Secondary Staff Sample Average Years of Experience in Education 12.25 Range of Years of Experience in Education 1 – 48 Highest Level of Education Bachelors 56.1% Masters 38.5% Ed.S/Doctorate 5.4%
The number of years participants have in education and the number of years in
their current position are reported below in Figure 3. These numbers reflect the final
sample after missing data were calculated. Participants’ years of educational experience
ranged from one year to 41 years. The largest number of participants responding were
those in the 11 to 20 years of education experience category, M = 17.4; SD = 9.91.

90
Figure 3. Participants’ Number of Years in Education
Figure 4 below presents the participants’ number of years in their current position.
Most participants had between one and ten years of experience in their current education
position and with a range from one to 43 years in their current position, M = 7.78, SD =
6.66. It should be noted that the dependent variable “years in current position” was
transformed because the distribution was not normal. The skewedness of the dependent
variable “years in current position” was 1.33, and when divided by the standard error
.137, the value was 9.71. According to Munro (2005), values that are greater than ±1.96
are considered skewed, and thus require a log transformation to satisfy assumptions.

91
Figure 4. Participants’ Number of Years in Current Position
The participants’ level of education is reported below in Figure 5. This figure
shows that participants who had earned a master’s degree and above were over two-thirds
(69%) of the study participants (n = 192). These numbers reflect the actual sample size
after adjustments were made for the missing data.

92
Exploratory Data Analysis
Recoding of job position. On the RtI/MTSS Beliefs, Perceptions of Skills, and
Practices survey, participants had seven different choices for job description, Teacher-
General Education Teacher, Teacher-Special Education Teacher, School Counselor,
School Psychologist, School Social Worker, Assistant Principal, and Principal. For
sample size purposes, this variable was recoded. General Education and Special
Education Teachers remained in their own unique categories. However, School
Counselor, School Psychologist, and Social Worker were all recoded into one variable,
Professional Support Staff. Assistant Principal and Principal were recoded into one
variable, Administration. Therefore, the new staff position/job types were recoded to
form four variables, Teacher-General Education Teacher, Teacher-Special Education
Teacher, Professional Support Staff, and Administration.
49%
31%
16%
4%
MA/MS
BA/BS
EdS
PhD/EdD
Figure 5. Participants’ Level of Education

93
Missing data. Of the 375 survey participants, 303 completed the RtI Beliefs
instrument, 304 completed the Perceptions of Skills instrument, and 119 completed the
Perceptions of Practices instrument. Participants with missing values were eliminated
instrument by instrument. All participants who answered at least 75% of the questions
remained in the sample (Munro, 2005, p. 60). For example, in the RtI Beliefs instrument,
72 participants had missing values. These participants were ranked from most missing
values to the least missing values. Those participants who answered 23 of 27 questions
in the RtI Beliefs instrument were included in the sample. The researcher made the
assumption that the participants inadvertently had missed four or less questions on the RtI
Beliefs instrument. In the Perceptions of RtI Skills instrument, 71 participants had
missing values. There were 57 questions in the Perceptions of RtI Skills instrument;
participants who answered 54 of 57 questions were included in the sample. In the
Perceptions of Practices instrument, 209 participants had missing values. There were 42
questions in the Perceptions of RtI Practices; participants who answered 38 of 42
questions were included in the sample. To correct those missing values by participants
who may have inadvertently missed questions on each instrument, the average responses
by the participant were used to substitute for the participant’s missing values (Munro,
2005; Tabachnick & Fidell, 2001).
Analysis of participation. Since many missing values were found, the researcher
was interested in investigating if there were any correlations among missing values on the
three survey instruments and staff position, number of years in education, and number of
years in current position. Pearson r correlations were run for all continuous variables. A
two-tailed Pearson correlation coefficient was run to investigate any correlations among

94
years of experience in education, and all the variables from the RtI Beliefs, Perceptions of
RtI Skills, and Perceptions of RtI Practices as they pertained to missing values in the
three survey instruments. A two-tailed Pearson correlation coefficient was also run to
investigate any correlations among years of experience in current position, and all the
variables from the RtI Beliefs, Perceptions of RtI Skills, and Perceptions of RtI Practices
as they pertained to missing values in the three survey instruments. Missing values in the
Perceptions of RtI Skills instrument was a predictor for missing values in the Perceptions
of RtI Practices instrument. In other words, if a participant had missing answers in the
Perceptions of RtI Skills instrument, there was a good chance he/she had missing answers
in the Perceptions of RtI Practices instrument. While results of the Pearson r correlations
were statistically significant at p< .001 for years of experience in education and years in
current position (r<.44), RtI Skills and years of experience in education (r< .15), and RtI
Practices and years of experience in education (r< .20), these results were deemed not
clinically significant because of small effect sizes. The participants’ lack of responses
were unrelated to their years of experience in education or years in current position.
Results from Pearson r correlations for RtI Beliefs, Perceptions of RtI Skills, and
Perceptions of RtI Practices with years of experience in education, and years in current
position are reported below in Table 5.
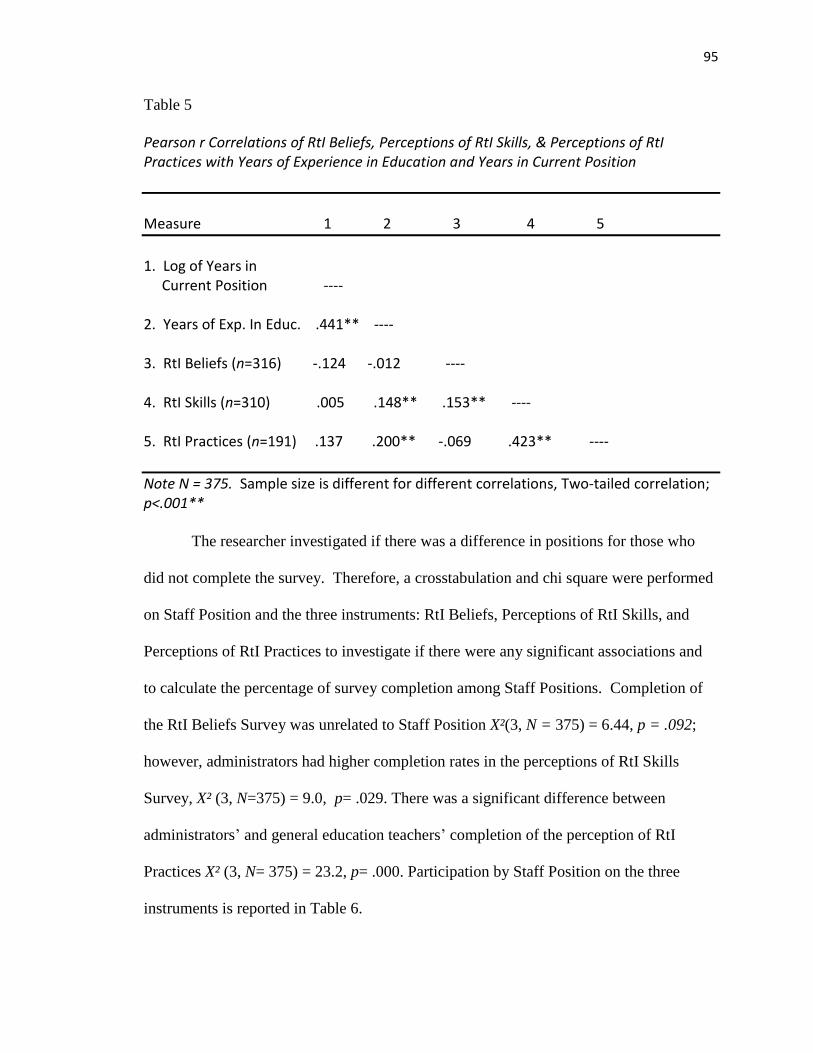
95
Table 5
Pearson r Correlations of RtI Beliefs, Perceptions of RtI Skills, & Perceptions of RtI Practices with Years of Experience in Education and Years in Current Position
Measure 1 2 3 4 5
1. Log of Years in Current Position ---- 2. Years of Exp. In Educ. .441** ----
3. RtI Beliefs (n=316) -.124 -.012 ----
4. RtI Skills (n=310) .005 .148** .153** ----
5. RtI Practices (n=191) .137 .200** -.069 .423** ----
Note N = 375. Sample size is different for different correlations, Two-tailed correlation; p<.001** The researcher investigated if there was a difference in positions for those who
did not complete the survey. Therefore, a crosstabulation and chi square were performed
on Staff Position and the three instruments: RtI Beliefs, Perceptions of RtI Skills, and
Perceptions of RtI Practices to investigate if there were any significant associations and
to calculate the percentage of survey completion among Staff Positions. Completion of
the RtI Beliefs Survey was unrelated to Staff Position X²(3, N = 375) = 6.44, p = .092;
however, administrators had higher completion rates in the perceptions of RtI Skills
Survey, X² (3, N=375) = 9.0, p= .029. There was a significant difference between
administrators’ and general education teachers’ completion of the perception of RtI
Practices X² (3, N= 375) = 23.2, p= .000. Participation by Staff Position on the three
instruments is reported in Table 6.

96
Table 6
Response Rates on RtI Beliefs, Perception of RtI Skills, and Perception of RtI Practices by Staff Position, before and After Missing Data Reported
Gen. Ed. Spec. Ed. Pro. Supp. Staff Admin Total
Raw n (before) (169) (94) (66) (46) (375)
n (before estimating missing data) RtI Beliefs (303) 145 75 56 45 321
Perception Of RtI Skills (304) 139 72 53 44 308 Perception Of RtI Practices (119) 63 49 45 34 191
Reliability. Cronbach’s alphas were computed for each instrument of the RtI
Beliefs instrument, Perceptions of RtI Skills instrument, and the Perceptions of RtI
Practices instrument for those participants who completed the surveys. The RtI Beliefs
instrument was sufficiently reliable, while both the Perceptions of RtI Skills and
Perceptions of RtI Practices were very reliable. The strength of internal consistency of
all three survey instruments is reported in Table 7.
Table 7
Cronbach’s alpha for RtI Beliefs, Perceptions of RtI Skills, & Perceptions of RtI Practices.
Instrument Cronbach’s alpha
N of Items
RtI Beliefs .832 24 Perceptions of RtI Skills .990 57 Perceptions of RtI Practices .983 42
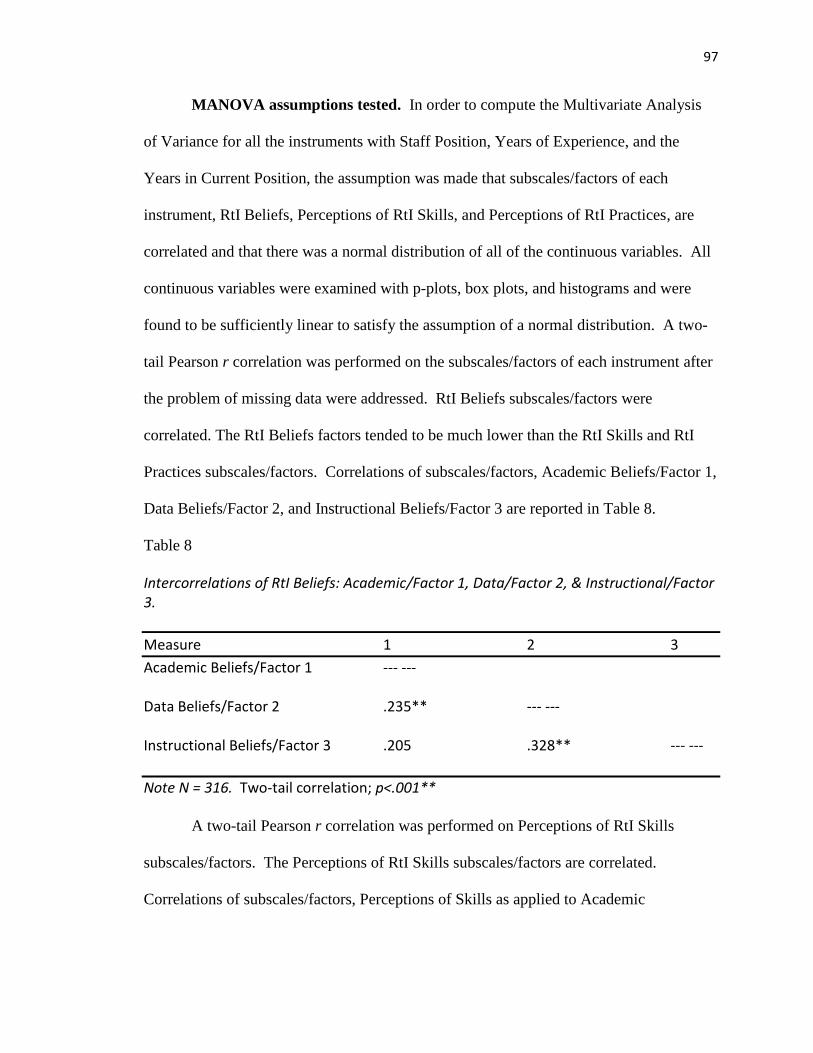
97
MANOVA assumptions tested. In order to compute the Multivariate Analysis
of Variance for all the instruments with Staff Position, Years of Experience, and the
Years in Current Position, the assumption was made that subscales/factors of each
instrument, RtI Beliefs, Perceptions of RtI Skills, and Perceptions of RtI Practices, are
correlated and that there was a normal distribution of all of the continuous variables. All
continuous variables were examined with p-plots, box plots, and histograms and were
found to be sufficiently linear to satisfy the assumption of a normal distribution. A two-
tail Pearson r correlation was performed on the subscales/factors of each instrument after
the problem of missing data were addressed. RtI Beliefs subscales/factors were
correlated. The RtI Beliefs factors tended to be much lower than the RtI Skills and RtI
Practices subscales/factors. Correlations of subscales/factors, Academic Beliefs/Factor 1,
Data Beliefs/Factor 2, and Instructional Beliefs/Factor 3 are reported in Table 8.
Table 8
Intercorrelations of RtI Beliefs: Academic/Factor 1, Data/Factor 2, & Instructional/Factor 3.
Measure 1 2 3
Academic Beliefs/Factor 1 --- ---
Data Beliefs/Factor 2 .235** --- ---
Instructional Beliefs/Factor 3 .205 .328** --- ---
Note N = 316. Two-tail correlation; p<.001**
A two-tail Pearson r correlation was performed on Perceptions of RtI Skills
subscales/factors. The Perceptions of RtI Skills subscales/factors are correlated.
Correlations of subscales/factors, Perceptions of Skills as applied to Academic

98
Content/Factor 1, Perceptions of Skills as applied to Behavioral Content/Factor 2, and
Perceptions of Data manipulation and Technology Skills/Factor 3 are reported in Table 9.
Table 9
Intercorrelations of Perceptions of RtI Skills: Academic Content/Factor 1, Behavior Content/Factor 2, & Data Manipulation & Technology/Factor 3
Measure 1 2 3
Skills: Academic Content/Factor 1 --- ---
Skills: Behavior Content/Factor 2 .845** --- ---
Skills: Data & Technology/Factor 3 .888** .809** --- ---
Note n = 300. Two-tail correlation; p<.001**
A two-tail Pearson r correlation was performed on Perceptions of RtI Practices
subscales/factors. The Perceptions of RtI Practices subscales/factors are highly
correlated. Correlations of subscales/factors, Perceptions of Practices as applied to
Academic Content/Factor 1, and Perceptions of Practices as applied to Behavioral
Content/Factor 2 are reported below in Table 10.
Table 10 Intercorrelations of Perceptions of RtI Practices: Academics Content/Factor 1, & Behavior Content/Factor 2
Measure 1 2
Practices: Academics Content/Factor 1 --- ---
Practices: Behavior Content/Factor 2 .676** --- ---
Note n = 163. Two-tail correlation; p<.001**

99
Quantitative Research Questions
Question 1. Are there perceived differences in Beliefs about RtI/MTSS among secondary
administrators, general educators, special educators, and professional support staff in
an urban school district?
A one-way MANOVA was conducted to evaluate the differences between Staff
Position and RtI Beliefs. The independent variable staff position, the between-subjects
factor, had four levels: general education teacher, special education teacher, professional
support staff, and administration. The three dependent variables, the within subjects
factors, were the Belief factors: academic Beliefs, data Beliefs, and instruction Beliefs.
The means and standard deviations for belief scores by factor and Staff Position are
presented in Table 11.
Table 11
Means and Standard Deviations for RtI Beliefs (Academic, Data, & Instructional) by Staff Position
*Denotes highest
RtI Beliefs Factors Staff Position M SD Academic Data Instructional
General Special
Pro. Staff Administrator
General Special
Pro. Staff Administrator
General Special
Pro. Staff Administrator
15.22 18.01* 15.65 16.11
49.80 52.71 50.07
53.42*
15.09 15.85 15.67
16.18*
3.91 5.22 4.16 4.17
6.13 6.31 6.57 4.66
3.09 3.10 2.60 3.01

100
As required for MANOVA, there was a significant correlation among the three
disciplines (see Table 8). An analysis of the multivariate homogeneity of variance, (i.e.,
equal covariance matrices), indicated multivariate homogeneity of variance was accepted,
Box’s M = 23.899, F(18,130720) = 1.299, p = .176. Using Levene’s test, an analysis
evaluating the univariate homogeneity of variances assumption indicated the assumption
of equal variances was violated for academic Beliefs, F(3,312) = 3.935, p = .009, but not
for data Beliefs, F(3,312) = 1.728, p = .161, and instruction Beliefs, F(3,312) = 1.246, p
= .293. This violation was not serious because the differences in standard deviations were
never greater than two (Munro, 2005).
Significant differences were found among the four staff positions on the
dependent measures, Pillai’s Trace = .112, F(9,936) = 4.018, p < .001. Pillai’s Trace was
chosen as the test statistic because it is the most robust under violations of the assumption
of equal covariances. The effect size measured by the multivariate η2 based on Pillai’s
Trace was small, 0.037 (Cohen, 1988), indicating that only 3.7% of the variance in
Beliefs across the three factors is associated with the Staff Position.
Table 12 depicts the one-way univariate analyses of variance for the effects of
Staff Position on Beliefs. In summary, in academic Beliefs, special education teachers
had moderately higher scores than general education teachers. In data Beliefs, special
education teachers and administrators were significantly higher than general education
teachers. Administrators were significantly higher than professional support staff in data
Beliefs; however, staff position accounted for only a small amount of the variance in
individual Beliefs either across factors or within academic Beliefs. There were no
differences among Staff Positions and RtI/MTSS Instruction Beliefs.

101
Table 12
One-Way Univariate Analyses of Variance for Effects of Staff Position on Beliefs
Variable and Source df SS MS F
Academic Beliefs Between groups 3 387.762 129.254 6.909** Within groups 312 5836.706 18.707
Data Beliefs Between groups 3 729.381 243.127 6.598** Within groups 312 11469.163 36.847
Instruction Beliefs Between groups 3 54.997 18.332 2.033 Within groups 312 2813.848 9.019
** P < .001
The test for academic Beliefs showed significant differences by staff position,
F(3,312) = 6.909, p < .001. The test for data Beliefs also showed significant differences
by staff position, F(3,312) = 6.598, p < .001. The post hoc Scheffe test of pairwise
comparisons showed that mean academic Beliefs were significantly higher for special
education teachers (M = 18.01, SD = 5.22) than for general education teachers (M =
15.22, SD = 3.91). Furthermore, mean academic Beliefs were significantly higher for
special education teachers (M = 18.01, SD = 5.22) than for professional support staff (M
= 15.65, SD = 4.16), see Tables 12 and 13. The standardized difference between special
education and general education teachers, d = 0.63, indicated a moderate effect size. The
standardized difference between special education teachers and professional support staff,
d = 0.53, indicated a moderate effect size. For academic Beliefs, the effect size of staff
position, η2 = .06, was small, indicating that only 6% of the variance in academic Beliefs
was associated with the staff position. While these results were statistically significant,
102
their meaningfulness of significance is small, because 94% of the variance in academic
Beliefs is unaccounted for (Munro, 2005).
Mean Data Beliefs were significantly higher for special education teachers (M =
52.71, SD = 6.31) than for general education teachers (M=49.80, SD=6.13), see Tables 12
and 13. The standardized difference between special education and general education
teachers, d = 0.46, indicated a moderate effect size. Within staff Beliefs (special
education teachers and general education teachers), the effect size of Staff Position, η2 =
.06, was small, indicating that only 6% of the variance in data Beliefs was associated with
the staff position. Mean Data Beliefs were significantly higher for administrators (M =
53.42, SD = 4.66) than for general education teachers (M=49.80, SD=6.13), See Tables
12 and 13. The standardized difference between administrators and general education
teachers, d = .78, indicated a large effect size. Within Data Beliefs, the effect size of staff
position, η2 = .06, was small, indicating that only 6% of the variance in Data Beliefs is
associated with the Staff Position. Mean data Beliefs were significantly higher for
administrators (M = 53.42, SD = 4.66) than for professional support staff (M=50.07,
SD=6.57), see Tables 12 and 13. The standardized difference between administrators and
professional support staff, d = .72, indicated a medium effect size (Cohen, 1988).

103
Table 13
Means and Standard Errors for Statistically Significant Comparisons for RtI Beliefs Factors by Staff Position
Belief Factor Position Mean Std. Error p-value
Academic** General 15.22 .36 <.001 Special 18.01 .51 Pro. Staff 15.66 .58 .015 Special 18.01 .51 Data General 49.80 .51 .006 Special 52.71 .71 Pro. Staff 50.07 .82 .038 Administrator 53.42 .91 Administrator 53.42 .91 .003 General 49.80 .51
Note: Covariates were evaluated by their mean values. ** p < .001
Question 2. Are there perceived differences in RtI/MTSS Skills among secondary
administrators, general educators, special educators, and professional support staff in an
urban school district?
An analysis of the multivariate homogeneity of variance, i.e., equal covariance
matrices, indicated multivariate homogeneity of variance was not rejected, Box’s M =
24.90, F(119833) = 1.342, p = .15. Using Levene’s test, an analysis evaluating the
univariate homogeneity of variances assumption indicated the assumption of equal
variances was satisfied for Academic Skills, F(3,296) = 1.303, p = .274, Behavior Skills,
F(3,296) = 2,574; p = .054; and Data/Technology Skills, F(3,296) = 1,684, p = .170.
104
Significant differences were found among the four staff positions on the
dependent measures, Pillai’s Trace = .219, F(9,888) = 8.034, p < .001. The effect size
measured by the multivariate η² based on Pillai’s Trace was small, 0.060, indicating that
only 6.0% of the variance in RtI Skills across the three factors is associated with the staff
position. While these results were statistically significant, their measure of
meaningfulness in the clinical sense is relatively small (Munro, 2005).
Table 14 depicts one-way univariate analyses of variance for effect of staff
position on RtI Skills. In summary, in RtI Academic Skills, RtI Behavior Skills, and RtI
Data/Technology Skills, special education teachers had moderately higher scores than
either general education teachers or professional support staff. In RtI Academic Skills,
and Behavior Skills, administrators had moderately higher scores than general education
teachers; and in RtI Data/Technology Skills administrators had significantly higher scores
than general education teachers. Professional support staff had moderately higher RtI
Behavior Skills scores than general education teachers; however, Staff Position
accounted for only a small amount of the variance in individual RtI Skills either across
factors or within RtI Academic, RtI Behavior and RtI Data/Technology Skills.

105
Table 14
One-Way Univariate Analyses of Variance for Effects of Staff Position on RtI Skills
Variable and Source df SS MS F
Academic Skills Between groups 3 11388.321 3796.107 6.924** Within groups 306 167768.022 548.262
Behavior Skills Between groups 3 20695.512 6898.504 17.806** Within groups 306 118552.394 387.426
Data/Technology Skills Between groups 3 3360.938 1120.313 7.567** Within groups 306 45301.648 148.045
** p < .001
RtI Academic Skills showed significant differences by Staff Position, F (3,296) =
6.924, p < .001. RtI behavior Skills showed significant differences by Staff Position,
F(3,296) = 17,806, p<.001. RtI Data/Technology Skills showed significant differences
by staff position, F(3,296) = 7.567, p<.001.
The post hoc Scheffe test of pairwise comparisons showed that mean academic
skills were significantly higher for special education teachers (M = 93.11, SD = 20.84)
than for general education teachers (M = 80.92, SD = 24.01). The post hoc Scheffe test
of pairwise comparisons showed that mean academic Skills were significantly higher for
administration (M = 95.87, SD = 22.98) than for general education teachers (M = 80.92,
SD = 24.01) (see Table 15). The post hoc Scheffe test of pairwise comparisons showed
that mean behavior Skills were significantly higher for special education teachers (M =
74.92, SD = 17.85) than for general education teachers (M = 58.34, SD = 20.86). The
post hoc Scheffe test of pairwise comparisons showed that mean behavior Skills were
significantly higher for professional support staff (M = 69.83, SD = 20.34) than for

106
general education teachers (M = 58.34, SD = 20.86).The post hoc Scheffe test of pairwise
comparisons showed that mean behavior Skills were significantly higher for
administration (M = 77.79, SD = 17.71) than for general education teachers (M = 58.34,
SD = 20.86). The post hoc Scheffe test of pairwise comparisons showed that mean
data/technology Skills were significantly higher for special education teachers (M =
41.26, SD = 11.32) than for general education teachers (M = 36.27, SD = 12.31).
Furthermore, mean data/technology Skills were significantly higher for administrators (M
= 45.37, SD = 11.42) than for general educators (M = 36.27, SD = 12.31), (see Tables 14
and 15). The standardized difference between special education and general education
teachers’ RtI academic Skills, d = 0.51, indicated a moderate effect size. The
standardized difference between general education teachers and administrators RtI
academic Skills, d = 0.78, indicated a large effect size. Within RtI academic Skills, the
effect size of staff position, η2 = .06, was small, indicating that only 6% of the variance in
RtI academic Skills is associated with the staff position. While these results are
statistically significant, the measure of meaningfulness is clinically small (Munro, 2005).
The standardized difference between special education and general education
teachers’ RtI behavior Skills, d = 0.78, indicated a large effect size. The standardized
difference between general education teachers and administrators’ RtI behavior Skills, d
= 0.92, indicated a large effect size. The standardized difference between professional
support staff and general education teachers’ RtI behavior Skills, d = 0.55, indicated a
moderate effect size. Within RtI behavior Skills, the effect size of staff position, η2 = .15,
was small, indicating that only 15% of the variance in RtI behavior Skills is associated
with the staff position. The standardized difference between general education teachers’

107
and administrators’ RtI data/technology Skills, d = 0.73, indicated a large effect size. The
standardized difference between general education teachers’ and special education
teachers’ RtI data/technology Skills, d = 0.40, indicated a moderate effect size. Within
RtI data/technology Skills, the effect size of staff position, η2 = .07, was small, indicating
that only 7% of the variance in RtI data/technology Skills is associated with the staff
position. While these results are statistically significant, the measure of meaningfulness is
clinically small (Munro, 2005).
Table 15
Means and Standard Errors for RtI Skills Factors by Staff Position
Skill Factor Position Mean Std. Error p-value
Academic General 80.92 1.97 .002 Administrator 95.87 3.53 Behavior** General 58.34 1.66 <.001 Special 74.92 2.32 Pro. Staff 69.98 2.70 .002 General 58.34 1.66 Administrator 77.79 2.97 <.001 General 58.34 1.66 Data/Technology** General 36.27 1.03 Administrator 45.37 1.83 <.001
Note: Covariates were evaluated at their mean values. ** p < .001
Question 3. Are there perceived differences in RtI/MTSS Practices among secondary
administrators, general educators, special educators, and professional support staff in an
urban school district?

108
An analysis of the multivariate homogeneity of variance (i.e., equal covariance
matrices), indicated multivariate homogeneity of variance was rejected, Box’s M =
42.311, F(162009) = 4.605, p = <.001. Using Levene’s test, an analysis evaluating the
univariate homogeneity of variances assumption indicated the assumption of equal
variances was accepted for Academic Practices, F(3,187) = 1.030, p = .38 and Behavior
Practices, F(3,187) = 2.139 p = .097. There were differences found among the four staff
positions on the dependent measures, Pillai’s Trace = .081, F(6.374) = 2.64, p = .016.
There are differences among groups but not at the p = <.001 level; therefore, results
cannot be reported with confidence as to which group had greater perception of RtI
academic and behavior Practices. Thus the a priori results indicated significant
differences but the posthoc Scheffe did not because it could not control for type I error.
Means and Standard Errors are reported in Table 16.
Table 16
Means and Standard Errors for RtI Practices Factors by Staff Position
Practice Factor Position Mean Std. Error
Academic General 78.75 1.99 Special 83.85 2.25 Pro. Staff 78.39 2.35 Administrator 89.09 2.71 Behavior General 66.47 2.90 Special 70.37 3.29 Pro. Staff 70.58 3.44 Administrator 80.38 3.95
Question 4. What is the relationship of the staff’s (administrators, general educators,
special educators, and professional support staff) Beliefs about RtI/MTSS and the number
of years they have been in education?

109
A correlational analysis was conducted to evaluate the strength of the relationship
between Years of Experience and RtI Beliefs. Three factors of RtI Beliefs were analyzed:
Academic Beliefs, Data Beliefs, and Instruction Beliefs. A Pearson correlation was
calculated examining the relationship between years of experience in education and RtI
Beliefs (Academic, Data, and Instruction). The results of the two-tail correlation tests are
presented in Table 17. Years of Experience in education was not related to RtI Beliefs
(Academic, Data, or Instruction).
Table 17
Intercorrelations for Years of Experience and RtI Beliefs Factors (Academic, Data, & Instruction)
Measure 1 2 3 4
1. Years of Experience ----
2. Academic Beliefs .091 ----
3. Data Beliefs -.084 .235** ----
4. Instructional Beliefs -.002 .205** .328** ----
Note. N = 316. Correlations are two-tail. **p<.001 Question 5. What is the relationship of the staff’s (administrators, general educators,
special educators, and professional support staff) Skills about RtI/MTSS and the number
of years they have been in education?
A correlational analysis was conducted to evaluate the strength of the relationship
between Years of Experience and RtI Skills. Three factors of RtI Skills were analyzed:
Academic Skills, Behavior Skills, and Data/Technology Skills. Pearson correlation
coefficients were computed among the four variables. The results of the two-tail
correlation tests are presented in Table 18. Years of Experience had a small positive
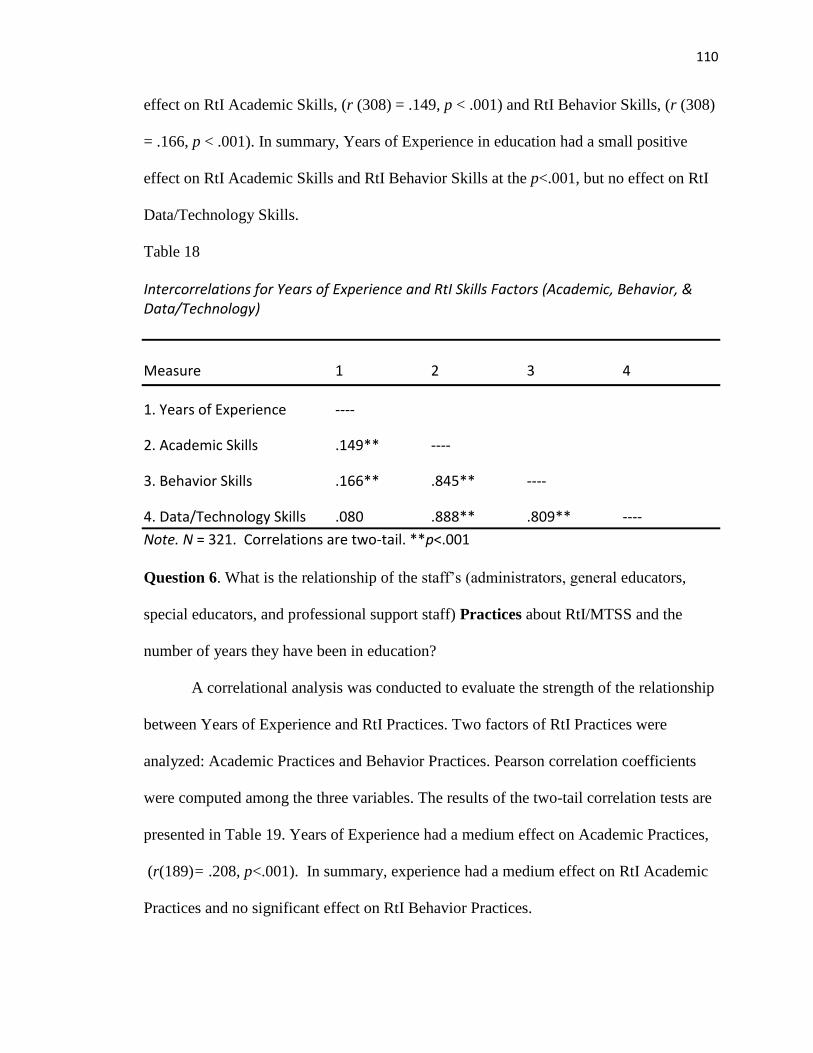
110
effect on RtI Academic Skills, (r (308) = .149, p < .001) and RtI Behavior Skills, (r (308)
= .166, p < .001). In summary, Years of Experience in education had a small positive
effect on RtI Academic Skills and RtI Behavior Skills at the p<.001, but no effect on RtI
Data/Technology Skills.
Table 18
Intercorrelations for Years of Experience and RtI Skills Factors (Academic, Behavior, & Data/Technology)
Measure 1 2 3 4
1. Years of Experience ----
2. Academic Skills .149** ----
3. Behavior Skills .166** .845** ----
4. Data/Technology Skills .080 .888** .809** ----
Note. N = 321. Correlations are two-tail. **p<.001 Question 6. What is the relationship of the staff’s (administrators, general educators,
special educators, and professional support staff) Practices about RtI/MTSS and the
number of years they have been in education?
A correlational analysis was conducted to evaluate the strength of the relationship
between Years of Experience and RtI Practices. Two factors of RtI Practices were
analyzed: Academic Practices and Behavior Practices. Pearson correlation coefficients
were computed among the three variables. The results of the two-tail correlation tests are
presented in Table 19. Years of Experience had a medium effect on Academic Practices,
(r(189)= .208, p<.001). In summary, experience had a medium effect on RtI Academic
Practices and no significant effect on RtI Behavior Practices.
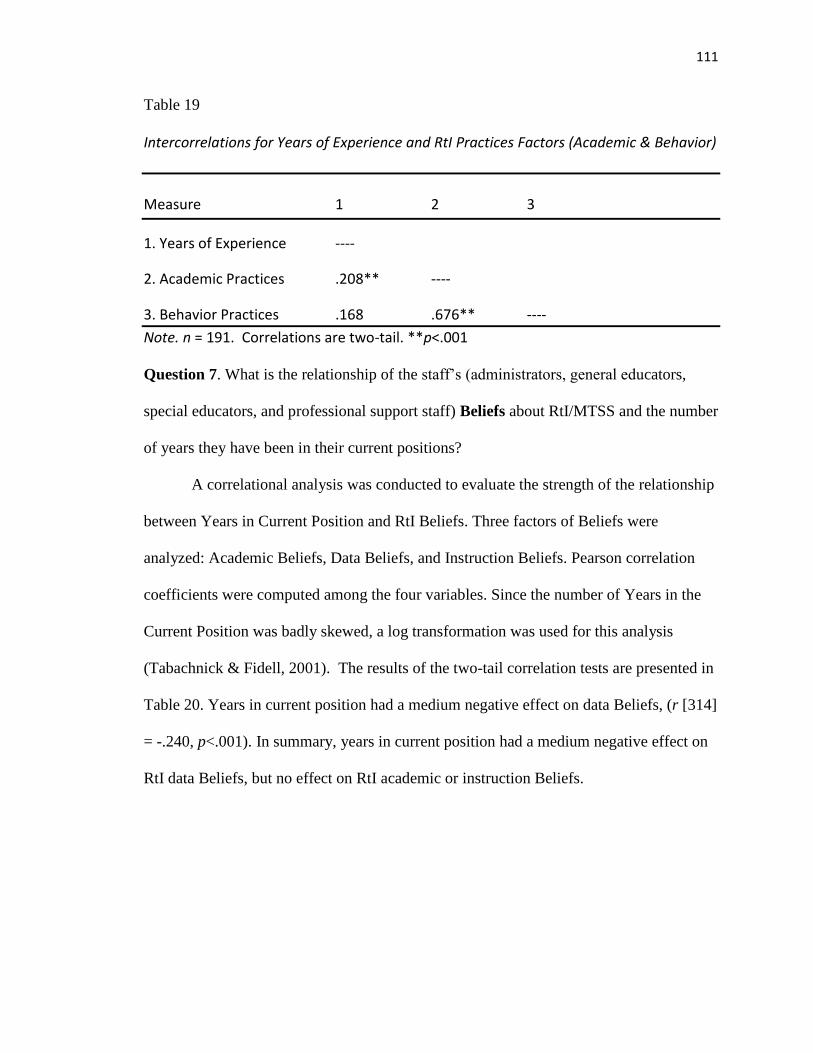
111
Table 19
Intercorrelations for Years of Experience and RtI Practices Factors (Academic & Behavior)
Measure 1 2 3
1. Years of Experience ----
2. Academic Practices .208** ----
3. Behavior Practices .168 .676** ----
Note. n = 191. Correlations are two-tail. **p<.001
Question 7. What is the relationship of the staff’s (administrators, general educators,
special educators, and professional support staff) Beliefs about RtI/MTSS and the number
of years they have been in their current positions?
A correlational analysis was conducted to evaluate the strength of the relationship
between Years in Current Position and RtI Beliefs. Three factors of Beliefs were
analyzed: Academic Beliefs, Data Beliefs, and Instruction Beliefs. Pearson correlation
coefficients were computed among the four variables. Since the number of Years in the
Current Position was badly skewed, a log transformation was used for this analysis
(Tabachnick & Fidell, 2001). The results of the two-tail correlation tests are presented in
Table 20. Years in current position had a medium negative effect on data Beliefs, (r [314]
= -.240, p<.001). In summary, years in current position had a medium negative effect on
RtI data Beliefs, but no effect on RtI academic or instruction Beliefs.
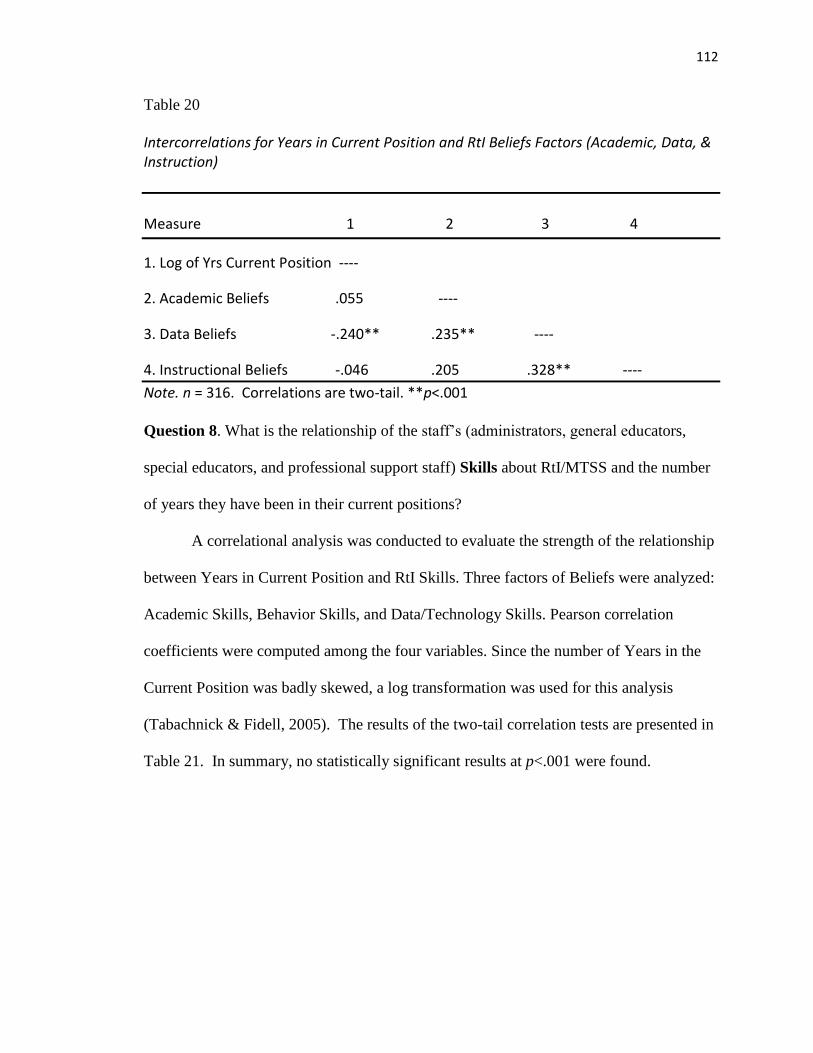
112
Table 20
Intercorrelations for Years in Current Position and RtI Beliefs Factors (Academic, Data, & Instruction)
Measure 1 2 3 4
1. Log of Yrs Current Position ----
2. Academic Beliefs .055 ----
3. Data Beliefs -.240** .235** ----
4. Instructional Beliefs -.046 .205 .328** ----
Note. n = 316. Correlations are two-tail. **p<.001 Question 8. What is the relationship of the staff’s (administrators, general educators,
special educators, and professional support staff) Skills about RtI/MTSS and the number
of years they have been in their current positions?
A correlational analysis was conducted to evaluate the strength of the relationship
between Years in Current Position and RtI Skills. Three factors of Beliefs were analyzed:
Academic Skills, Behavior Skills, and Data/Technology Skills. Pearson correlation
coefficients were computed among the four variables. Since the number of Years in the
Current Position was badly skewed, a log transformation was used for this analysis
(Tabachnick & Fidell, 2005). The results of the two-tail correlation tests are presented in
Table 21. In summary, no statistically significant results at p<.001 were found.

113
Table 21
Intercorrelations for Years in Current Position and RtI Skills Factors (Academic, Behavior, & Data/Technology)
Measure 1 2 3 4
1. Yrs current position ----
2. Academic Skills .025 ----
3. Behavior Skills .030 .845** ----
4. Data/Technology Skills .005 .888** .809** ----
Note. n = 310. Correlations are two-tail. **p<.001
Question 9. What is the relationship of the staff’s (administrators, general educators,
special educators, and professional support staff) Practices about RtI/MTSS and the
number of years they have been in their current positions?
A correlational analysis was conducted to evaluate the strength of the relationship
between Years in Current Position and RtI Practices. Two factors of Practices were
analyzed: Academic Practices and Behavior Practices. Since the number of Years in the
Current Position was badly skewed a log transformation was used for this analysis
(Tabachnick & Fidell, 2005). Pearson correlation coefficients were computed among the
three variables. The results of the two-tail correlation tests are presented in Table 22. In
summary, no statistically significant results were found at the p<.001 level.

114
Table 22
Intercorrelations for Years in Current Position and RtI Practices Factors (Academic & Behavior)
Measure 1 2 3
1. Years of Experience ----
2. Academic Practices .016 ----
3. Behavior Practices .131 .676** ----
Note. n = 191. Correlations are two-tail. **p<.001 Summary of Quantitative Results
Overall, there were fourteen statistically significant results at p<.001. Regarding
the RtI/MTSS Beliefs instrument, special education teachers’ RtI/MTSS Academic
Beliefs were much higher than general education teachers’ Academic Beliefs, as well as
much higher than the Academic Beliefs of the professional support staff. RtI/MTSS Data
Beliefs were much higher for special education teachers than general education teachers.
Administrators had much higher RtI/MTSS data Beliefs than for general education
teachers, as well as higher RtI/MTSS Data Beliefs than professional support staff. Years
in Current Position had a medium negative effect on RtI/MTSS Data Beliefs, but not on
Academic or Instruction Beliefs.
In regards to the Perceptions of RtI/MTSS Skills instrument, special education
teachers’ perceptions of RtI/MTSS Academic Skills were much higher than general
education teachers. Administrators’ perceptions of RtI/MTSS Academic Skills were
much higher than general education teachers. Special education teachers’ perceptions of
RtI/MTSS Behavior Skills were much higher than general education teachers.

115
Professional support staff’s perceptions of RtI/MTSS behavior Skills were much higher
than general education teachers. Administrators’ perceptions of RtI/MTSS Behavior
Skills were much higher than general education teachers. Special education teachers’
perceptions of RtI/MTSS Data/Technology Skills were much higher than general
education teachers. Administrators’ RtI/MTSS Data/Technology Skills were much
higher than general education teachers. Years of Experience had small positive effect on
perceptions of RtI/MTSS Academic and Behavior Skills.
Qualitative Data
Qualitative semi-structured interview questions
Based upon the quantitative results the following questions were derived for the
homogenous focus group interviews. Table 23 displays the semi-structured questions
asked of each focus group.

116
Table 23. Semi-Structured Focus Group Questions
Qualitative Participants’ Demographics
All focus group participants were survey participants who self-selected to be part
of the focus groups. Survey participants were presented with a thank you page
(Appendix E) at the end of the online RtI/MTSS survey. Following the thank you page,
participants were able to respond to a request from the researcher to contact her if he/she
was interested in participating in one of four homogenous focus groups (professional
support staff, general education teachers, special education teachers, and administrators)
to discuss the results of the survey. The participants contacted the researcher by either
email or phone; they expressed an interest in participating further in the study by agreeing
1. How is it that general education teachers do not know more about MTSS/RtI
(why is this the case?)
a. Beliefs?
b. Skills?
c. Practices?
2. How do we assist/support general education teachers in learning/understanding
about MTSS/RtI:
a. Beliefs?
b. Skills?
c. Practices?
d. Is it important for them to know?
3. How did Special Education Teachers know/learn more or have higher RtI/MTSS:
a. Beliefs?
b. Skills?
c. Why did they know/learn more?
4. Data Beliefs were higher for Administrators than for Professional Support Staff
(Why is that the case?)
a. And not as high as special educators?
5. I found that the higher the number of years in current position, the lower the data
beliefs tended to be: Why do you think this occurred?
6. Many respondents did not complete the MTSS/RtI Perceptions of Practices (the
last section of the survey). Why do you think this occurred?
7. How could this survey be improved?

117
to be audio-taped in an interview session as part of a homogenous focus group. The
researcher made arrangements to meet the four focus group members at times and in
locations that were convenient to the members of each group. Each member was
contacted by phone, and confirmed one day prior to the scheduled focus group. Each
focus group was audio-taped for approximately 60 minutes. Two tape recorders were
used in case one malfunctioned. Each participant was given an informed consent.
Informed consents were collected from each focus group participant. Prior to the tape
recording, the researcher asked the members of each focus group if they had any
questions and if they understood the content of the informed consent. All participants
understood; no participants withdrew after the tape recorders commenced taping. All
participants and researcher’s first language was English. At the end of each focus group
interview, participants were given a selection of $25.00 gift certificates that they could
choose from as a token of the researcher’s appreciation for their participation in the
study. The demographics of each member of each focus group are listed below in Table
24. It should be noted that initials are pseudonyms for the participants

118
Table 24
Focus Group Demographics
Group Level (MS or HS) Position
Professional Support Staff
JE Middle School Guidance Counselor & School Based Team Leader KY All levels School Psychologist LA High School ESE Specialist TR High School College & Career Ready Coach TA Secondary Reading Specialist General Education Teachers
NY Middle School PE Teacher MA High School Math Teacher & School Based Team Leader PS High School English Teacher SA High School Reading Teacher Special Education Teachers
BA High School Transition ME Middle School Support Facilitator Administrators JH Middle School Assistant Principal LI High School Assistant Principal TY High School Assistant Principal
Researcher Focus Group Observations
Professional support staff focus group. Based on the respondents from the
survey, four homogenous focus groups were formed (professional support staff, general
education teachers, special education teachers, and administrators); the following section
provides the setting, and the researcher’s perceptions of the verbal and non-verbal
behavior of each of the homogeneous focus groups. The Professional Support Staff focus
group interview took place after school at one of the participant’s high school office. The
high school provided a central location for all of the participants. All participants arrived
on time. The researcher observed genuine eagerness to participate in the focus group.
119
After the Informed Consent was signed and prior to the audio tape being started, the
researcher asked if anyone had any questions; none were noted. The researcher explained
she would ask a question and then allow whoever wished to speak to begin first. The
researcher also stated that it was important for each participant to allow others to finish
their statements and answers prior to his/her responding in order for all voices to be
heard. A tape recorder was placed at one end of the oblong table and another tape
recorder was placed at the opposite end. The tape recorders were then set to “record”.
As the questions unfolded, the dynamics of the group evolved with each question. It is
the researcher’s interpretation that the school psychologist (who had previously been a
general education teacher) and the district reading coach became more agitated as the
conversation focused on the role of the professional support staff in providing
professional development help to the general education teachers. While this cross table
heated discussion ensued, the other members of the group tended to retreat from the
discussion. At the end of the session, when the tape recorders were turned off, and all
members of the professional support staff focus group had left, the ESE specialist stated,
“The district reading person drank the district Kool-Aid”. This phrase is interpreted to
mean that the district person would agree with any initiative that was supported by the
district even if it went against his/her own beliefs.
General education teacher focus group. The Professional General Education
Teacher focus group interview took place mid-morning on a Saturday at one of the
participants’ homes which was centrally located to all participants. All participants
arrived on time. The researcher observed genuine eagerness to participate in the focus
group. After the Informed Consent was signed and prior to the audio tape being started,

120
the researcher asked if anyone had any questions; none were noted. The researcher then
explained she would ask a question and then allow whoever wished to speak to begin
first. The researcher also stated that it was important for each participant to allow others
to finish their statements and answers prior to his/her responding in order for all voices to
be heard. A tape recorder was placed at one end of the oblong table and another tape
recorder was placed at the opposite end. The tape recorders were then set to “record”.
As the questions unfolded, the dynamics of the group evolved with each question. It is
the researcher’s interpretation that the high school language arts teacher was slightly
upset that RtI/MTSS Beliefs, Skills and Practices were the lowest for general education
teachers. She was defensive in her answers and defended the results. The middle school
physical education teacher was summarizing the group’s answers to questions asked in
the focus group, and tried to formulate some conjectures to change future results. The
high school math teacher with school based team experience was codifying the results
and agreeing with the results, based on her own atypical experience of not only being a
math teacher but also being her school’s school based team leader. Lastly, the high
school reading teacher looked at the results through her second career lens; she had
previously worked as a stockbroker, and tended to look for results driven outcomes. At
the end of the session, all members agreed they were now part of a subculture of research
and vowed to keep what had been stated in the day’s focus group session amongst
themselves, and paraphrased the experience in “Las Vegas” slogan, “what happens in
SA’s house stays in SA’s house”.
Special education teacher focus group. The Special Education Teacher focus
group interview took place on the same Saturday as the General Education Teacher focus

121
group, only later in the afternoon. The interview took place at the researcher’s home; the
participants chose this location even though they had to travel a distance. Both
participants arrived on time. The researcher observed genuine eagerness to participate in
the focus group. After the Informed Consent was signed and prior to the audio tape being
started, the researcher asked if either participant had any questions; none were noted.
The researcher explained she would ask a question and then allow whoever wished to
speak to begin first. The researcher also stated that it was important for each participant
to allow others to finish their statements and answers prior to his/her responding in order
for both voices to be heard. A tape recorder was placed at one end of the oblong table
and another tape recorder was placed at the opposite end. The tape recorders were then
set to “record”. As the questions unfolded, the dynamics of the group evolved with each
question. It is the researcher’s interpretation that both participants were in agreement
with all answers, even though both had very different ESE work experiences.
Administrator focus group. The Administrator focus group interview took
place on the following Saturday at the local Panera Bread Restaurant, because the
administrators were attending a workshop in that general vicinity later in the day. TY
and LI arrived on time and JH arrived at the end of question two. The researcher
observed genuine eagerness to participate in the focus group. After the Informed Consent
was signed and prior to the audio tape being started, the researcher asked if anyone had
any questions; none were noted. The researcher explained she would ask a question and
then allow whoever wished to speak to begin first. The researcher also stated that it was
important for each participant to allow others to finish their statements and answers prior
to his/her responding in order for all voices to be heard. JH was given the Informed

122
Consent while TY and LI finished their response to question two. Both tape recorders
were placed in the middle of table. The tape recorders were then set to “record”. The
volume in the restaurant was very loud; crying children could be heard for the first ten
minutes of the taping session. As the questions unfolded, the dynamics of the group
evolved with each question. It is the researcher’s interpretation that all administrators
were in agreement with answers and no tension among them was noted.
Summary of Responses From Focus Groups
Question 1: How is it that general education teachers do not know more about MTSS/RtI
(Beliefs, Skills, and Practices) Why is this the case?
Professional support staff group. Many of the members in the professional
support staff focus group felt that MTSS/RtI had not been properly explained to the
general education teachers. JE, the guidance counselor who is also the school based team
leader, was not comfortable enough explaining the underpinnings and the framework to
the staff even if time was provided to present to the faculty.
“I am not comfortable with explaining it. We expect them to know, but I don’t
think we are explaining it to them. Trying to get time on a faculty agenda is difficult.”
KY, the school psychologist, believes RtI was not rolled out properly when it was
first introduced in the district; people had different roles and the core was not fully
established prior to working on Tier 2 and Tier 3 interventions; therefore, people did not
know how to properly explain RtI/MTSS to the general education teachers, so this is why
they do not know and understand it. KY further explained,
“RtI is a systematic change and I think here we implemented it without changing
the system first, so it does seem like we kind of threw it at the teachers and the teachers
are still trying to figure it out. And when you are going to change an entire construct of
something as large as the school district, you kind of need to explain what the theoretical
purpose behind it is, you have to have buy-in, so I don’t think the teachers ever got why
RtI is necessary, and why RtI is important.”

123
TR, the high school graduation coach, believes general education teachers have
viewed RtI as a special education initiative. TR stated,
“It has been mostly facilitated by special education teachers and the general
education teachers do not really want to do it, accept it, and carry it through. They don’t
really grasp it; they see it as additional paperwork, additional stress, and they may not
feel supported in it.”
For TA, the secondary reading support coach, RtI was never rolled out so teachers
could understand. She explained,
“RtI was never really put in teacher friendly terms where they can understand;
they have no idea what it means. The administration never explained it well. LA, the
ESE specialist, added that most secondary general education teachers believe RtI is an
elementary and ESE initiative.”
LA noted,
“At the high school level, it is perceived as an elementary thing; it should not
have to be done in high school, and it should have already taken place. They should have
already gone through the process. Or they think it is an ESE issue; let ESE take care of
it; they are not in a mind set of what it is that they do not know. They get it at faculty
meetings but they are ‘checking out’. The general education teachers in general are
resistant to working with special education; they refer to them as ‘those’ kids, they’re
‘your kids’, they are everyone’s children. But you know their answer is come get them
from us, just come get em, you do your little thing and then bring them back. Like they
have not (yet) grasped the idea (that) they have to teach all children. And if they changed
some of their teaching practices, it would work for all students.”
General education teacher focus group. The general education teacher focus
group believed that it depended on which geographical location in the county that you
came from, as this has influenced the survey participants’ answers. They argued that
general education teachers from the more affluent schools were less apt to know and
understand RtI/MTSS and they were probably the major portion of the general education
survey participants. SA, a high school intensive reading teacher explained,
“It depends on the type of school and type of students that go to that school,
which affects their experience which therefore reflects the data. Like if it is a Title One

124
urban school, it is going be different than a nice, west school, (a) not so mixed school.
Absolutely, that is a big variable.”
PS, the high school Language Arts teacher agreed,
“We were answering based on what we were experiencing at the time.”
MA, a high school math teacher and school based team (SBT) leader had more of
a global perspective because of her experience as the SBT leader. MA explained,
“I am west, but I will say in my experience as a third year SBT leader involved, I
will say to a teacher that I need to get this tier 2 intervention rolling, I need to collect
data for Tier 2 (and) Tier 3, and they will say what do you mean? I don’t know if they
even understand it. You can’t answer that you agree because you don’t know.”
NY, a middle school physical education teacher with leadership experience
explained,
“I would say exposure to training, number one, and then you would look at the
schools from where everyone came, what kind of support those schools are given, like
your west schools, those non-Title One schools, for example. What kind of support are
they given? They do not get the same support or training.”
The general education focus group also mentioned secondary general education
teachers’ busy schedules and other mandates that are required may prohibit them from
knowing and understanding RtI/MTSS more. For example, PS shared,
“Get in your class, do your job, and don’t worry about the rest. It makes sense that they
were not aware, you know, because I will take care of this and you take care of that. You
are in the classroom.”
MA added,
“And if you are in the trenches every day, and if you aren’t doing something outside
those trenches (where) you get to see and are exposed to it. If not, you are in the
trenches and you have to get through Learning Village, and you have to get through these
benchmarks and that is all you know. You have to do this and all of a sudden you ask me
to collect data. I am just trying to keep these two kids apart from fighting!”
MA, who teaches in the more affluent western suburbs, also stated an interesting
occurrence,
125
“And how fast the demographics are changing; in ten years at this school, the
demographics have changed drastically. If you are Title One, you’re Title One, you’re
Title One. I don’t know how fast that demographic changes, but it is remarkable the
change in our client base, and next year, it will be totally different. Because of
academies, because of whatever choice programs there are, so you are changing,
fluctuating. So you get a bunch of general education teachers that are doing this specific
thing, and they can only do this specific thing. Branching out is difficult because they
were meant to do this, and not this; they say they will try, but they were meant to teach an
academy that is not there anymore.”
Special education focus group. The special education focus group believe
general education teacher’ lack of RtI/MTSS understanding stemmed from their lack of
pedagogy, and lack of desire to learn the pedagogy necessary to assist struggling
students. BA, a high school transition teacher explained,
“At the secondary level, so many teachers are coming from another field; you
take a test; you are certified, so they don’t have the teaching experience or the classes of
strategies - fundamental classes, (like) how to teach reading, how to teach math. In
addition, they teach the way they were taught, which most times were lecture style. So
they have no toolbox of tools to meet the needs of diverse learners. In other general
education areas - science and social studies - knowing that a kid couldn’t read, they
wouldn’t have a toolbox or have ways to help a kid from their college experience; only
through professional development would they learn these things, but there is such a lack
of attention paid during PD. So the tools are being given, but they are not being
received. Because they are busy doing paperwork, grading, drinking coffee, skipping.”
ME, an ESE middle school support facilitation teacher and SBT leader added,
“They just don’t care! Some of the teachers are very veteran teachers, very, very veteran
teachers and I hear them say they cannot be bothered doing this. And that hurts because
at that point you want to say you need to retire. They have so many reasons why they
can’t do it; they are just so busy; they have a large class load.”
Both members of the special education focus group agreed it was more
expeditious for them to do the interventions and progress monitoring for struggling
secondary students. They both argued that it was the only way to make sure interventions
were completed with fidelity. ME stated,
“Unfortunately at my school, it is because we are doing it all; RtI is implemented
by the ESE teachers. The ESE department is doing it, and only because it was more

126
expeditious to do it that way. ME added, “It is often easier to do it that way. Just do it
yourself, rather than trying to teach someone else to do it.”
ME felt,
“When I think of beliefs, I think of having belief that this is a system that works
for them. I think at my school, ya know, I don’t think enough of them have had enough
experience. They don’t even make referrals to school based team because kids are
failing. So they can’t believe in the system because they have never really seen it work.
Cause you gotta see it work.”
Administrator focus group. The administrators believed that general education
teachers were trained basically in their subject area and not in pedagogical skills;
therefore, it was understandable that they did not know more about RtI/MTSS. TY, an
assistant principal in a Title One high school, argued,
“At the high school level, (in) this issue everyone has been primarily trained in
their craft. I got a math degree, someone got a science degree, I don’t think they have
the ability; they haven’t been trained to differentiate, to break things down for the
children. I think they just put their own material out there and the students that are not
being successful I think that is their belief. They are not willing to try anything different
other than how they were taught the material.”
LI, an assistant principal at a non-Title One high school agreed,
“I have seen this at all levels; there is a big difference in high school and you are
teaching a subject, content area and your (students) either get it or they don’t; then at the
elementary level, I did see a lot more teachers making accommodations and
differentiating the instruction, because they were trained. The high school teachers are
not trained this way. I think with teaching at the high school level, you become very
autonomous; you close that door and that’s it. You are your own king in the kingdom.
And a lot of times they don’t venture out. ”
Both TY and LI agreed general education teachers at the secondary level have
many initiatives, requirements, and constraints put upon them that preclude them from
knowing more about RtI/MTSS. LI stated,
“I think that the high school period is shorter, and when they see their students, they
don’t have as much time to differentiate the instruction and give accommodations.”
TY added,
127
“I think it is kind of overwhelming because there is great deal more to have to deal with.
The classroom numbers are greater than elementary school, they may have 20 students,
and she has to differentiate for maybe 2 or 3 students that are not meeting the standards.
You can do that. Where as a high school teacher she may have 100 to 150 students and
for them it is very overwhelming.”
TY made a poignant statement about general education teachers’ beliefs when she
said,
“Again I think it really comes back to teachers not wanting to do things that they are not
experts at; they want to be experts first and I don’t think they’ve really been trained.
They don’t want to try something new, because I would say 70% to most of them teach
the way they were taught, especially at the high school level. I think it comes back to the
success, people aren’t going to do, they are not going to try new things, and they are not
going to do new things if they haven’t experienced success with it. The general education
teachers put out their subject matter and then think that these students are not picking it
up so (the students) are not being successful, where as the special education teacher has
the skill set and knows what strategy to use and to work with the kids to get them to
experience success. So I think that most special teachers have a ‘growth’ mindset. You
look at Carol Dweck and other researchers and you see this. You look at general
education teachers especially at the high school level, (they) have a fixed mindset. They
basically think that the kid is smart or the kid is not smart. That’s why special education
teachers believe it in their hearts because they have seen the success. The general
education teachers are trying to get those kids out of their classes.”
Question 2: How do we assist/support general education teachers in
learning/understanding about MTSS/RtI (Beliefs, Skills, and Practices)?
Professional support staff focus group. The responses from the professional
support staff focus group were mixed in regards to how to support and assist general
education teachers in understanding more about RtI/MTSS. TA, the secondary reading
coach, felt schools should elicit the assistance of the district staff to model how to
differentiate and scaffold instruction within an RtI/MTSS framework.
TA believed, “Most of the teachers when I explained how I used to differentiate, I
have never had a teacher tell me they didn’t want to know more about that. I know there
are a lot of hesitant teacher; I have gone to a lot of different schools, but if you are
passionate, and believe in what you are doing, you are going to get the buy-in from those
teachers; you are going to get 95% of those teachers. You are going to get them on
board on at least learning something.”

128
LA, the ESE specialist felt the assistance should come from site based level.
“If you suggest you go to training for this, this, and this, they will say we are
already going for training for all this other stuff; we can’t be doing all this. It is gonna
have to happen in house, you have to have good people in your school that know how to
do it that can help.”
KY, the guidance counselor, believed, “It is your administration making it a
priority that is what they have to do, they have that full plate, they have to make it a
priority.”
JE, the school psychologist, felt,
“I want someone to come into my class and show me how to do what it is exactly
you are talking about and show me with my kids and show me that it works; that is the
piece that is missing. Because without that you are not going to get buy-in. It is like I am
in the classroom all day with the kids; I know what I am doing within my classroom. It
sounds good; everything sounds good from a theoretical perspective. But for some
teachers, some teachers get dealt a pretty bad hand, those teachers are the ones, and you
kind of end up in that group that looks like you are a bad teacher, you get in that group
that gets dumped on. I want to see that work with my kids.”
JE went on to add,
“If the person who is coming into your classroom to train you is not prepared,
how is the teacher feeling about this? Because that is the person who is going into your
classroom and telling you what you are supposed to do. But when it comes back it looks
like the teacher is not willing to do what it is that they are asking them to do.”
General education teacher focus group. The general education teacher focus
group was in agreement, more professional development, training, and certification was
necessary to understand RtI/MTSS. SA, the intensive reading teacher, shouted,
“Professional development, professional development, professional development.
And more of it, to the teachers directly.”
MA, the math teacher and SBT leader added,
“Why not have an RtI endorsement? If you are going to be a teacher that is going
to be with these kids that need more of everything, they are out there, and they are not
going away. It is only going to (be) more; this area is only going to grow. So why can’t
we make that into some sort of add on. Whatever your certification is, add it on. I would
love to know more about this. Make it a class”

129
NY, the PE teacher, suggested, “so the pieces are there, if you are going to be a
teacher in this district and you are going to maintain your certification, then you are
going to need to take this training.”
Special education teacher focus group. The special education focus group
believed that general education teachers need to see the RtI/MTSS framework and
process work first hand in order to change their belief set. BA, the high school transition
teacher, believed,
“We really need to help them understand their role in RtI. I think at my school,
ya know, I don’t think enough of them have had enough experience.
ME, the ESE support facilitator and SBT leader added, “And they just lack the
confidence to ask for help. I work with some veteran teachers, one just said to me. I am
embarrassed to admit I don’t know how to do a school based team referral, even though
you have drilled it in every year, but she just said I should know how to do this. (I said)
let me show you how to do this. So they may not have the confidence to admit they don’t
know how to do this type of thing.”
Administrator focus group. The administrators were in agreement, professional
development should be provided in small group hands on settings, with ESE teachers
modeling for general education teachers the need is collaboration, differentiation,
scaffolding, TY explained,
“I think that another issue as far as skills, the way we do professional
development (at our school) is the best anywhere. Because you go and you get a bunch
of teachers together and put them together in a room and you tell them all these things
that should work, but you don’t show them how it works with a group of kids. The best
model you can have is what we have at our school, which is to watch an ESE support
facilitator interact with the kids, because they do things and you can actually physically
see them do things and interact with students. Because that is going to change your
beliefs and your skill set because you are going to see it in action. The professional
development is put out there in the exact same way we tell the teachers not to teach.
Because it’s out there with 120 kids, that is not enough; they need to see videos where it
worked. They need to have a small group; they need to be teamed with a special
education support facilitator. If you are fortunate enough to have a team, put one
support facilitator with that team to help. Have them help that team and show them that
these students are being successful, because we’re breaking (complex) things down.”

130
LI added,
“I think the cooperation is more key amongst faculty to give them hands-on
training. To even give them planning time to visit a co-teaching model class. We usually
take one or two teachers to teach the inclusion classes, instead of everyone trained to
teach inclusion.”
Sub Question 2: Is it important for general education teachers to know about RtI/MTSS?
Professional support staff focus group. All members of the Professional
Support Staff Focus Group agreed it was important for general education teachers to
know and understand RtI/MTSS. For example, TA exclaimed,
“Yes, you have to scaffold your instruction.” TR stated, “Well, it is a general
education initiative, so general educators should know what RtI is”
KY added, “Yeah, but it goes back to, in their minds, it is not a gen ed thing.”
LA reacted, “It is a mind shift!”
General education teacher focus group. Most of the general education teachers
were in agreement that knowing and understanding RtI/MTSS was important; however,
PS did not see the need to know,
“I am going to be honest, I don’t think so. Because we have diverse children, it is
not important. Because you have diverse children, it is not important; you should be
flexible, be able to go with the flow, be able to accommodate each child by child by child,
each is different; and I don’t have to know that. I am going to help this child no matter
what. I am going to the limits to the end, no matter what. So it is not important that I
know that. Though, I might feel better that you shared the information with me. You
might have stroked my ego, but it is not important.”
SA, on the other hand stated,
“Absolutely, it is critical, because it helps them in the classroom; it’s how to
respond to behavior, it is part of the whole thing. It is how to handle children like this
because we have such diverse children in our classrooms. I look at it as more
knowledge, another tool to have in my toolbox.”
MA interrupted, “Absolutely!” NY added, “I agree with that.”
131
Special education focus group. The special education focus group was in
agreement. ME explained,
“I think if they knew or understood more, I think they’d begin to practice it more,
because it is not hard. And I would like to assume that if you are a teacher, you are a
teacher because you like working with children. And like children to be successful. I am
not saying that to be funny, because there are some people who do not go into (it)
because they want to see success, they go in to it because they want to pontificate.
Unfortunately, so, I think they would embrace it.”
BA suggested, “At the secondary level, I do think it is important because they do
have students in their class that are not proficient. And those kids deserve a quality
education, whether it is in ESE or general education setting. So that the general
education teacher needs to be able to provide the support that RtI does. Whether it is
leading toward special education identification or not, it is providing support for the
kids.”
Administrator focus group. All administrators were in agreement that it is
important for general education teachers to know and understand RtI/MTSS. LI
exhorted,
“Oh definitely, not only does special ed already work with the labeled child, it
also helps all children learn. We have put it out there as one big model, everyone learns
differently. I myself am a visual learner; I need to see it to understand it. So everybody is
different in the way they learn, and so this helps all students learn.”
TY added,
“Definitely, and there’s a lot of kids that are not labeled, or labeled improperly
and we get a lot of students from other countries that it may take awhile for that process
to begin. If teachers implemented some of these strategies, they would be amazed at their
students’ progress overall.”
Question 3: How did special education teachers know/learn more or have higher
RtI/MTSS Skills, Beliefs, and Practices?
Professional support staff focus group. TR began,
“I think it’s the courses, but it is also the awareness and practice; they are
already experienced with their job. We always have this conversation, that if it looks like
ESE, then it is ESE. So when you get to Tier 3, and you are doing things that kinda of
look like ESE, it looks like things I am already doing in my classroom. You already have

132
been doing some modeling of differentiation because their classes have always been filled
with a variety of levels and exceptionalities.”
LA explained,
“All the ESE teachers have background in differentiating; they are constantly
looking for ways to meet the needs of all of their children. They have tapped into all
kinds of strategies; when RtI came out, it seemed that it was natural for ESE to take the
lead.”
General education focus group. All members of the general education focus
group agreed that the special education teachers possessed the specialized training, so
they also were not surprised with this result from the survey. PS was first to admit,
“I imagine it is due to their exposure to and dealing with certain demographics of
students; they know the paperwork. Their exposure is so much different.”
NY added,
“There is a whole different training; they have been exposed to different types of
training.”
Special education focus group. Both members of the special education focus
group believe they had the appropriate training and courses, and separated themselves
from the special education teachers who just took the certification test. Both special
education focus group participants felt that those who took the special education methods
courses in college had superior pedagogical training that lends itself well to RtI/MTSS.
ME spoke first stating,
“Because RtI is special education instructional practice, my opinion.”
BA added,
“Well, I think that because they are more educated as to how it relates to RtI.
They are better qualified to provide intervention; they are able to scaffold instruction. It
is what ESE teachers do; they say, Hmmm, why is it that you are not getting this? How
can I make sure you get this? And it’s inherent in the special education position, where it
is not inherent in the gen ed position. And it is inherent in the instruction in special

133
education training, well, for those of us who actually studied special education and
originally got our training”.
ME commented,
“And I think that is a big area, but it is probably not touched on in your study, but
the people who just take the test. You can see, you know who did not go through methods
courses in college. You know who did not go through the pedagogical part.”
BA agreed,
“I would agree, and I don’t know why our government allows that to be okay.
They don’t allow a reading teacher; you can’t be certified in reading without a masters
in reading. I don’t get it. For those who went into the profession as special education
teachers and we were trained, it is not surprising because we have the tools. And they
are probably the ones who answered your survey and not the other ones.”
Administrator focus group. The administrators were even more specific in their
praise of special education teachers’ RtI/MTSS Beliefs, Skills, and Practices. JH, a
middle school assistant principal explained,
“I think because they have a strong understanding of the needs of the students
they are servicing. They understand how the services need to be integrated to help the
student be successful. Where general education teachers are more concerned with the
content, I think that special education teachers know that to look beyond the content in
order for students to be successful. They are more apt to embrace a multi-tiered
approach to put systems in place to provide services for those students.”
TY believed,
“I think it comes back to the success; people aren’t going to do, they are not
going to try new things, and they are not going to do new things if they haven’t
experienced success with it. The general education teachers put out their subject matter
and then think that these students are not picking it up so and it is not being successful,
where as the special education teacher has the skill set and knows what strategy to use
and to work with the kids to get them to experience success. So I think that most special
teachers have a growth mindset. You look at Carol Dweck and other researchers and
you see this. You look at general education teachers especially at the high school level
and they have a fixed mindset. They basically think that the kid is smart or the kid is not
smart. That’s why special education teachers believe it in their hearts because they have
seen the success. And the general education teachers are trying to get those kids out of
their classes.”
JH added,

134
“I also think that the needs of the students make the special education teachers
more student-focused, where as the general education teachers are more teacher focused.
You know it is a different approach because they understand that their students and the
environment have to be appropriate for the student to be successful, so they are more
student focused.”
LI agreed,
“I also think the general education teachers haven’t been trained as we said
before. They haven’t been taught how to teach, where the special education teachers
have been trained how to teach struggling students.”
Question 4: Data Beliefs were higher for administrators and special education teachers
than for professional support staff. Why did I get that result?
Professional support staff focus group. The answers from the professional
support group were mixed on this finding. Many felt administrators had to say they know
how to pull data, read data, and use it to make curriculum decisions. For example, TA
stated,
“That doesn’t surprise me. The administrators think everyone is pulling data and
using it, but they don’t do it. And the teachers can pull it but they don’t know how to
interpret it.” KY added, “Or they are given the reports.”
LA exclaimed,
“I think it also started when we had Learning Team Facilitators and there was a
big push on using data; there was lots of training for the principals’ institute for data
training. They sit through hours of data training; they are constantly looking at data.
That is probably why we feel they know it, but there is a difference between having your
data and knowing it. They report that they know it, but do they actually know.”
JE, the school psychologist, questioned who were in the professional support
group and when she was told it was mainly school psychologists and guidance counselors
and there was no difference between those two support staff types, she responded,
“I have sat on a lot of school based teams and a lot people don’t trust the data that
comes to the table. Or you see the data and you try to make heads or tails of the data,
and because you have to look at the student’s progress over time, you may have a day
where there was data, and then for three weeks there was no data, then a one day of data,

135
and you are trying to make something out of it. Because you have wasted all of this time,
you want to get the kid moving, but you are sitting there and you know that the data is not
accurate. But looking at the needs for the kid, do you make the kid suffer because people
recording the data, going back to the first question, the people aren’t well trained as they
should be and so you are getting stuff back at the table that isn’t the greatest as it should
be.”
When asked to give an example, JE responds,
“The teacher brings a progress monitoring log, and people are looking at the right side
where the numbers are and the numbers are all over the place. In actuality, when you
are looking at it, the days and weeks, the weeks where the student didn’t perform well,
the student wasn’t in school all week but the student still got the assessment on Friday.
So it looks like the student didn’t do well, and that is a completely different issue, so now
our RtI issue is an attendance issue, and this needs to be fixed before we can work on the
RtI issue. Or we are looking at the data and the scores are filled out at the end of the
week and nobody signed any of the intervention dates, and that happens a lot more than
anybody should ever see. Just scores on the side of the paper, the progress monitoring
log, no one has signed it, there are no dates, so you don’t know if it was this year or last
year. And we don’t know whether the intervention took place Monday, Wednesday,
Friday, or Tuesday, Thursday, every day? So if you asked me (if) I was confident in the
data that was brought to the table, I would have to say…probably not. As confident as
some of the reports you are getting it is being reported that according to the information
(that) was given to me and that this was accurate data (that was) given to me, but I am
not going to tell you that this was whole heartedly that that child was receiving 30
minutes a day of the intervention each day, but that is what is reflected in the chart.”
General education teacher focus group. The members of the general education
focus all agreed; administrators were in the numbers business, and that they were only
looking for end results which are based on the numbers, so they were not surprised at this
result. SA began,
“Ummm, their evaluations are mainly based on numbers. You know that their
bosses look at numbers mainly.”
MA added,
“They know that there are a lot more to the students than just the FCAT scores.”
PS explained,
“Because at the end of the day, administrators are all business people. It is all
about the numbers for them. And for the support staff, these are people who learn the

136
students as individuals; they learn the nuances of the students, so it is not always, but
they probably get a chance to see the human side, not just what can be produced out of
the human
NY stated,
“They are also asked to produce a different type of data to do their job. I mean
you have to have the information about the kid in order to move the kid, so their job is
about numbers.”
Special education focus group. While the members of the special education
focus group agreed that this result did not surprise them, they were are a lot more pointed
about the school psychologists who did not score high on RtI/MTSS data Beliefs. ME
started by saying,
“They (administrators) like the forms, they like to see it, they like the graphs.
When they look at those graphs and progress monitoring logs, it all looks good, but now
the psychologists, they can tell if you have fudged your progress monitoring data, please
don’t laugh, I am going to be honest, it happens. And they can look at it and say….oh
okay.”
BA added,
“Right but with psychologists, they are, well some of the psychologists that I have
worked with don’t buy into RtI, they still want to test.”
ME agreed, “They do want to test!” BA stated,
“They are from the testing model. So, I would have to say that it is probably part
of the reason they don’t believe the data. Yes, sure, I can see why; I don’t think the
psychologists have bought into RtI.”
ME added enthusiastically,
“Well, it is their jobs; their jobs are on the line, because you don’t have to test.
Up until this year, my psychologist was still testing. You do your RtI, but we are going to
show academic testing, and we are going to show that discrepancy, but your RtI has to be
good, because this didn’t matter; all the hours I spent doing this testing doesn’t matter; it
is this piece that we need. I would say I can make this piece look great.”

137
Administrator focus group. The administrators were a bit more self-gratifying in
stating that they can pull data, understand data, and use it to make academic and behavior
decisions. LI began by stating,
“I think because the administrators deal with the data daily, we are trained to
look at the data, and look to see where students need improvement, where the
professional support staff does not receive that type of training.”
TY added,
“I think there is a longevity piece here too; I think as an administrator, you start
with a student in 9th
grade and you follow them all the way through. Follow them to 10th
and then 11th
and then 12th
. A teacher or support staff may deal with the child one day,
going to nurse’s office or work with child once in awhile. But as an administrator, you
watch the child grow through the RtI process. We see a child grow, where support staff
only works with him once, when he was struggling, and not the successes. As an
administrator you have more than an outside picture of the child; you are watching the
child progress. Where the support staff may work with a child for a semester or a year,
may not come into contact with that child as much. Yes, we’re not just looking at the
gains from this child who receives services; we are looking at the chart of gains, and that
may not be shared with the nurse or the psychologist.”
JH explained,
“I also think sometimes there is a fear of what the data might say, and I don’t
know how to interpret it, analyze it correctly, and lead me where I need to go, and like
you said I am not trained, so it may be a little fearful for me. Administrators have been
trained over time to see that the data is leading somewhere and to lend support to your
instructional staff. The instructional staffs haven’t gotten there yet. So they still fear the
data, especially the professional staff, like the school psychologists, they understand it,
but don’t know what to do with it.”
LI added,
“Yes, they don’t have the resources we have. And the time and this is part of the
job to make sure students are moving. The support staffs have their own specific little job
to do that’s kind of smaller and they don’t see that whole picture, with the data. Again,
the special education teachers are seeing that whole child; they are looking at the whole
growth. And the psychologist or counselors are only looking at a small portion of the
child.”
TY stated this about special education teachers and their high RtI data Beliefs,
138
“They have a growth mindset and they will do whatever it takes to get this student
there. Again, it comes to seeing the student actually being successful in the end. And the
special education teachers see that, where a psychologist may see that for a meeting to
where things aren’t going well. The problem is we don’t have the resources to tell them
the good news. We are only calling her when things are blowing up. I don’t think the
support staff is seeing the end results. I think this is playing on their results on RtI beliefs
and data.”
JH had this to say about special education teachers’ high RtI data Beliefs,
“I have seen a difference when a student has reached the eligibility for ESE
services, the ESE staff is not looking to move the student out of their program, where as
in general education they are still looking at that student as struggling, and looking to
move them somewhere, so that I don’t have full accountability. And that student can
move somewhere and they can take care of him and I don’t have to worry about it. I
think that ESE understands how to use tiered instruction, and put (together) that model
classroom and I think (that) in general education that they are still struggling with what
tiered instruction looks like and how do you differentiate the instruction enough to meet
the needs of that student. One that is struggling hmmmm, if I can get that one to ESE,
they will take care of it.”
Question 5: I found that the higher the number of years in the current position, the lower
the RtI/MTSS data Beliefs tended to be. Why do you think this occurred?
Professional support staff focus group. For the most part, the members of the
professional support staff focus group agreed, and were not surprised with this finding.
LA began by saying,
“It’s kinda like we call them retired in residence teachers, they are still teaching
the same way, they go to the file cabinet get out the old dittos and teach the same stuff.
They have been using the same curriculum, so when it comes to the new strategies, the
new things that come along, they are reluctant to change; so if they have been in the
position a long time, they don’t want to change. They figure this is just something new, it
is going to pass, just hold my breath and keep doing what I am doing; this will pass too.
It will eventually go away, and you have teachers who believe that. I know I have those
types of teachers, I have seen the dittos! So I have students who are now teachers here
who are seeing the same worksheets they had when they were students here when they
were in high school. It happens, so that could be a reason.”
JE, the school psychologist added,
“I think there are three parts to that. From our end, we have and I remember
before RtI was even rolled out, the cohort I was in, in graduate school, we were told the
first year by the time you graduate you will be solely RtI, so most of the stuff they were

139
teaching us, using your test kits we were using wasn’t going to be even relevant to your
job. Even though it is, not so much so, it was incorporated all through all four years (of)
graduate school. The professors who were teaching us said this is supposed to be new,
but it is not new. But the older people were saying we have seen this before; the horse
had a different name. It went away; we did something else and now it is coming back.
We kinda know how it went the first time, so we are kinda skeptical of how it is going to
go this time. And this is basically what I have been hearing and a lot of older teachers
are like that too. We used to do this a long time ago and it was called XYZ and then they
told us that (it) was no good and they told us they wanted us to do dittos, and now they
don’t want us to do dittos anymore; they want us to do XYZ but they want us to call it
ABC, and I am just tired of going back and forth. They just want someone to make their
mind up. And we kinda know what the end result was from when we did it the first time.
I heard that from some of my older colleagues. We have done this before and they are
just calling it something else. And it’s coming around again, and in a few years we will
be back to dittos.”
General education teacher focus group. The general education teacher members
were not surprised by this result. PS started out by saying, “I believe it. I believe it. You
become jaded!” All of the participants agreed and laughed. PS then added,
“If you are constantly exposed to the same thing and you continually get the same results,
the same negative outcome, you lose faith. I can see that is what is happening; you
become jaded; bump school based team, because Joey is not going anywhere. Nothing is
going to happen to Joey, nothing is changing. They become jaded.”
MA concurred, “Things don’t get better, so they figure, it is useless.” PS stated,
“I am going to be honest; I didn’t know the whole process of the school based team. I
honestly thought if I collected enough data and I submit this information about Joey,
someone would start intervening with him, then I see, yes, Joey is on paper for school
based team, but I see no change. So I don’t know what else to do. Once you turn them
over to (the) school based team, as the classroom teacher is that it, your hands are clear?
Is that it for the classroom teacher?”
Special education teacher focus group. The special education teacher focus
group members definitely could believe this finding. ME started out by saying,
“They don’t want to put forth the effort; they don’t want things to change.”
BA agreed, “I would say rigidity, over time; we see it. People who are in the
same position for an extremely long period of time, they, they, they….”

140
Both focus members chime in, “stagnate!”
BA then added,
“They use the same lesson plan, they use the same format, they are on the way
out, and so they are less open to new, different, innovative, and possibly more effective
ways to approach education. Because they have been doing (it) this way for so long and
it has worked this way for so long, ya know. Why change?”
ME concluded,
“They don’t understand why Johnny doesn’t get it? But I taught it, well Johnny
doesn’t learn by lecture, yeah, but I taught it, it’s right here and all my other kids are
getting it.”
Administrator focus group. The administrators felt there were a couple of
reasons that created this result; one, there was a perceptual problem with RtI/MTSS and
also the longer an educator had been in a position the more fixed his/her mindset was.
For example, JH said,
“I think it is a perceptual problem. They tend to want to rush through; they want
the help immediately and so when they realize it is a process that you have to be
committed to over a long period of time, it is frustrating and they may not be willing to be
committed to a long process because before, in the old arena, you could move a student
in like two months, and here we are talking over a year or years, Because it is moving
slowly. This is supposed to move us along, and the longer I see this, I see it doesn’t move
that fast. So I don’t know if this really works.”
TY added,
“I think there is couple (of) different things, if you look at the teachers that have
20 years, 25 years; you are going to get an analogy of the growth versus the fixed
mindset. They are done! You know the majority of them think they know everything,
because they have been doing it for so many years, and I don’t know why this isn’t
working cause it worked 15 years ago, 20 years ago. Ya know I haven’t changed; it has
to be the kids’ fault. A lot of it has to do with that situation being more set in their ways.
I agree with what he said if you wanted to call someone ESE you could say, okay and you
are ESE, two weeks later you are ESE. And that is not the case anymore. Even for
assistant principals who have been assistant principals for 15 or 20 years, I don’t think
that they strongly believe in the process yet, because back in the day, they could get the
kid classified, get the kid over in to ESE and in their mind the kid was successful. I really
don’t think the process has been around long enough yet for some people to truly make
up their mind about it. It is human nature; anytime you have been in a job for any length

141
of time you start to get negative type feelings toward certain areas. So I think even for
assistant principals, nurses, support staff, psychologists, the longer they have been there,
unfortunately it is just different realm we are dealing with and you have experienced
success with it to buy in to something. You are a principal coming out of the classroom,
or someone who taught ESE children, you have a different mindset than someone who
never had that experience.”
Question 6: Many respondents did not complete the MTSS/RtI Perceptions of Practices
(the last section of the survey). Why do you think this occurred?
Professional support staff focus group. The professional support staff focus
group believed that there were a few reasons why participants did not finish the survey.
TA began by saying, “I figure a lack of knowledge, and they probably don’t know.” JE
added,
“They could have had a variety of reasons; they maybe had to go somewhere else,
maybe they had technical reasons. I know my internet sometimes goes in and out, and
maybe they couldn’t get back in. I wouldn’t say there was a whole lot that didn’t finish
because they couldn’t.”
LA felt,
“It could be that maybe they didn’t think it was really anonymous. And how this
is about my school and I don’t know it, or I don’t want my school to get in trouble. Could
it be linked back to me?”
JE agreed,
“Yes, maybe they didn’t want to get their schools in trouble, I do have some
schools that are doing some things while other schools I couldn’t tell you if they were
doing it or not, I couldn’t tell it to save my life; I would have to ask someone. Some
schools I walk in and I can tell right away.”
General Education Focus Group. The general education focus group felt there
were three reasons why participants did not finish the survey. They felt maybe it was too
long; PS had this to say, “I remember now, I kept saying you have got to be kidding me,
another one.” SA added,

142
“No, I did it, I liked it, of course I was interested in it for many reasons. I thought
it was fascinating. It may have been too lengthy. Maybe people peter out at the end.”
NY stated,
“Well, maybe people really didn’t know. But the word was in my school, maybe
they were afraid; because they really don’t know what is going on at their schools
because they are not involved in this.”
PS agreed,
“That could be it too; they did not know what was going on in their school. There
you go again, lack of knowledge, we said it at the beginning; people don’t know!”
Special education teacher focus group. The special education teacher focus
group also believes there were three reasons participants did not finish the survey. BA
summarized,
“All right, there are three possibilities, one, they don’t know; two, they didn’t go back
and forgot the link; three, is they were uncomfortable responding, and examining their
school, or uncomfortable because they truly didn’t know what was happening in their
schools.”
ME added,
“They were trying to be reflective and as they read a bunch of the questions and as they
read more of the questions, they really realized they didn’t know, and that they would
look bad.”
BA concluded,
“And yes, they were going to look bad if they answered these questions. Yeah, I don’t
recall that the survey felt that long.”
ME agreed, “No, I don’t think it was too long either.”
Administrator focus group. The administrators all concurred the survey was too
long and that was why participants did not complete it. TY began,
“I can remember doing the survey and being oh more, oh more, not more.” All
laughed, and LI added,

143
“I would get a call, go away, come back to it, and I would say I will get to it later.”
TY also concluded, “I could see that along those lines, they don’t want that to get back to
their schools that saying this doesn’t work at our schools. They didn’t want that rap as
being a negative person. Or it could be that situation that…”
And all administrators in unison said, “That they really don’t know!”
Question 7: How could this survey be improved?
Professional support staff focus group. No comments were given except for
TA stating, “I think it is fine; you were clear from the beginning how long it was going to
take.”
General education teacher focus group. Two comments were given, “Shorten
it, by giving it in two segments”, explained SA. And being factious PS exclaimed, “Shove
it down their throats; make them take it during a PDD day!”
Special education teacher focus group. This group gave two suggestions, BA
stated,
“I think maybe mixing questions, might give you more information throughout all
your areas, rather than running the risk of someone not coming back and finishing it, and
then you would at least get some responses to all the pieces as opposed to getting zero
responses to one section.”
ME added, “Move the third section to the first, and then they wouldn’t do the
third!”
Administrator focus group. The administrators were adamant to definitely
make it shorter, but then TY added,
“I think embedding those questions general to specific how does this work for
you, school, district, the nation, that is the linear math type piece, I think when you are
going through the survey, you are thinking I already answered this.”

144
Cross Focus Group Analysis
Several different codes emerged from the answers of focus group members to the
quantitative survey questions. Table 25 illustrates the different codes from the cross
focus group analysis.
Table 25. Cross Focus Group Analysis
Focus Group Question
Professional Support Staff Focus Group
General Education Teachers Focus Group
Special Education Teachers Focus Group
Administrators Focus Group
How is it that general education teachers do not know more about MTSS/RtI (why was this the case?)
Lack of PD ESE duty Core not solid Lack of buy-in
Depends on leadership Depends on school/area Not able to change
Lack of PD Lack of pedagogy ESE duty Apathy Not able to change
Trained in content Lack of pedagogy Not able to change Lack of PD-modeling Fixed mindset/Teacher focused
Is it important for them to know?
Yes Yes-3 No- 1
Yes Yes
How do we assist/support general education teachers in learning/understanding about MTSS/RtI?
District help Site based teacher leadership Continuous improvement Passionate PD Meaningful modeling
PD-not train the trainer RtI endorsement Admin RtI endorsement Case studies Informed leadership Collaboration Positive morale
Observing RtI success PD-modeling Collaboration
Collaboration PD-modeling by ESE Student focused, growth mindset Observing RtI success

145
Focus Group Question
Professional Support Staff Focus Group
General Education Teachers Focus Group
Special Education Teachers Focus Group
Administrators Focus Group
How did special education teachers know/learn more or have higher RtI/MTSS?
Coursework Awareness Innate Exposure
Exposure Coursework
RtI is ESE Coursework Innate-for those who took courses
Innate Embrace RtI Have seen success w/RtI Pedagogy lends to RtI Coursework Heavy in research Exposure to different PD
Data Beliefs were higher for administrators than for professional support staff why is that the case?
Admin say they know data Data is fudged Admin trained
Admin evals depend on data Support staff do not see whole child Admin are business/numbers people Inherent in admin.
Admin are numbers people Psychs know data is fudged Psychs do not buy-in to RtI Psychs jobs on the line
Admin see the whole child Support staff do not see the whole child ESE see growth model Fear what data say Admin trained Admin have a big job/support staff little job

146
Focus Group Question
Professional Support Staff Focus Group
General Education Teachers Focus Group
Special Education Teachers Focus Group
Administrators Focus Group
I found that the higher the number of years in current position, the lower the data Beliefs tended to be, why do you think this occurred?
Retired in residence RtI is the same old horse – different name
Jaded Useless data Same negative results-no buy-in No change
Rigidity Stagnate Retired in residence It’s the kids
It’s the kids Fixed mindset Retired in residence New staff/new to position are willing to learn
Many respondents did not complete the MTSS/RtI Perceptions of Practices (the last section of the survey). Why do you think this occurred?
Don’t know Too long Afraid
Too long Afraid Don’t know
Don’t know Afraid Too long
Too long Afraid Don’t know
How could this survey be improved?
Fine Shorten it Mandate it
Mix up the surveys
Shorten it Mix up the surveys
Cross focus group analysis question #1. Overall, focus group question number
one, the professional support staff, special education teacher and administrator focus
groups agreed, the reason for general education teachers’ lower RtI Beliefs, perception of
RtI Skills and Practices was due to their lack of professional development. The lack of
PD was caused by general education teacher apathy (special education focus group),

147
and/or their lack of buy-in to RtI/MTSS (Professional support staff focus group).
Professional support staff and special education teachers agreed that general education
teachers believed RtI/MTSS was the special education teachers’ responsibility. Both the
special education and administrator focus group agreed that general education teachers
lack the RtI/MTSS pedagogical skills. The general education and administrator focus
groups were in agreement that general education teachers were low in RtI/MTSS Beliefs,
perception of skills and practices because they were not able to change; administrator
focus group believed secondary general education teachers have a fixed teacher focused
mindset, that is only concentrating on the content and not the individual student and how
he/she learns. The general education focus group believed the low scores may have
depended on which area of the urban district the teachers were from and if their
leadership embraced RtI/MTSS for PD when the general education teachers answered the
survey. All focus groups agreed that it is important for secondary general education
teachers to know, understand, and to be able to implement RtI/MTSS. One single general
education teacher disagreed; she believed she already knew how to work with a diverse
group of students and did not need the additional RtI/MTSS information.
Cross focus group analysis question #2. As to how to help general education
teachers know, understand, and be able to implement RtI/MTSS, all groups agreed PD
was important. Each focus group had their spin on what type of PD should be given.
The professional support staff focus group believed the PD should be meaningful; small
group; hands-on; not tell me, but show me; and passionate. The general education focus
group believed the PD should not be the train the trainer model. The special education
focus group believed the PD should be in the form of modeling secondary RtI/MTSS; and
148
the administrator focus group believed the modeling should be performed by seasoned
secondary special education teachers/staff. Three groups (general education, special
education, and administrators) believed collaboration among all secondary stakeholders
was important, and less work should occur in silos, so all parties speak the same language
and are striving to achieve the same goals by being on the same page. Both the special
education and administrator focus group agreed that general education teachers needed to
observe secondary RtI/MTSS successes and secondary students involved in successful
interventions. The professional support staff felt there was a need for continuous
evaluation of the secondary RtI/MTSS framework, and that both district leadership and
site based leadership were important to this continuous improvement. The general
education focus group believed there should be a secondary RtI/MTSS endorsement
requirement, similar to the English Speakers of Other Languages endorsement.
Cross focus group analysis question #3. As for the reasons why secondary
special education teachers had higher RtI/MTSS Beliefs, perceptions of Skills and
Practices, all focus groups cited the coursework that special education teachers must take
when obtaining a degree in special education. The special education focus group
reiterated this, but they needed to distinguish between those special educators who took
course work and those who just took the certification test. They believed those who held
a degree in special education were more than likely the special educators who took part in
my survey. All groups except the general education focus group believed RtI/MTSS at
the secondary level was innate in the special education teacher position. All felt that it
was special education teachers’ exposure to diverse, struggling adolescents that shaped
their RtI/MTSS Beliefs, and perceptions of Skills and Practices. Both the special

149
education and administrator focus group felt secondary RtI/MTSS was synonymous with
special education. Administrators added secondary special education teachers embrace
RtI/MTSS, their pedagogical training lends itself to it, and secondary special educators
have seen the successes with struggling students; therefore, they believe RtI/MTSS works
at the secondary level. Lastly, the administrator focus group noted that much of the
research in RtI is from the special education field.
Cross focus group analysis question #4. As for question four, the answers for
why RtI/MTSS data Beliefs were higher for administrators and special education
teachers, answers varied. All groups agreed data was inherent in special education
teachers’ positions. As for the administrators’ higher RtI/MTSS data Beliefs, all agreed
that administrators received the most training on how to read data and use it. However,
that is where the agreements ended. The professional support staff and special education
focus groups agreed that data can be fudged and that school psychologists and school
based team leaders know when the data has been cooked! The professional support staff
focus group also wondered if the administrators taking the survey thought they needed to
say that they knew how to pull data, look at data and use it to make instructional
decisions, but that in fact maybe they do not know as much about data as they say they
do! The special education focus group believed school psychologists did not buy-in to
RtI/MTSS. The participants in the special education focus group believe school
psychologists still wanted to be able to evaluate students using the discrepancy model,
and therefore the school psychologists scored lower on this portion of the survey. The
general education and administrator focus groups agreed that professional support staff
do not see the struggling adolescents in every venue as the administrators do.

150
Administrators see the whole child, while professional support staff sees the students
only when there are problems or concerns. Lastly, administrators felt professional
support staff may fear what the data is actually telling them; therefore, they do not
believe it.
Cross focus group analysis question #5. In regards to the finding that the longer
a secondary educator was in their position, it was found that they believed less in
RtI/MTSS data. The professional support staff, special education teacher, and
administrator focus groups agreed that secondary teachers were retired long before they
were literally retired, meaning they continued to use methods, and materials that they had
used for decades. Both the special education and administrator focus group believed
these secondary educators with low RtI/MTSS data Beliefs were of a fixed, rigid mindset,
and that they believed they were not the problem, but that their struggling adolescents
were actually the problem. The professional support staff felt these veteran respondents
had seen something like RtI before and that they had been around so long that they
believed that they would see this initiative come and go, just as the other reforms which
had not worked. The general education focus group believed these respondents were
jaded, and that they had seen the data and it was useless, so why bother using the data to
inform their instructional decisions. The administrator focus group felt educators new to
positions were more willing to learn new educational initiatives such as RtI/MTSS.
Cross focus group analysis question #6. As for the reasons why only 119
participants completed the Perceptions of Practices survey, all groups came up with the
same three reasons. They believe respondents may not have known what to report; the
survey was too long; or they were afraid that the answers would actually come back to

151
them or they would get their schools in trouble. Order of responses for each group is
listed in Table 25.
Cross focus group analysis question #7. Lastly, each group felt the survey
should be shortened if possible or the survey questions mixed up or reordered so that at
least some of all the surveys would be completed.
Themes
During the thematic analysis of the summary of responses from the semi-
structured questions, the themes were identified and are listed in table 26. Major themes
have been delineated and sub-themes are noted by small letters. Five major themes were
identified while exploring secondary staff members RtI/MTSS Beliefs, Perceptions of
RtI/MTSS Skills, and Perceptions of RtI/MTSS Practices. The five major themes were
Lack of RtI/MTSS Knowledge, Lack of Trust, School Structure, Role Ambiguity, and
Lack of Professional Development. There was overlap among the focus group themes
and the results of the RtI/MTSS survey.

152
Table 26. Major Themes and Sub-Themes Identified With RtI/MTSS Beliefs,
Perceptions of RtI/MTSS Skills and Practices
Major Theme 1: Lack of Professional Development
The lack of appropriate professional development was stated across all focus
groups. All groups mentioned what PD should NOT look like and gave examples of
what they would like to see take place. According to the focus groups, PD should not be
the ‘train the trainer model’; it was expressed that too much is lost in the translation. It
was also expressed that in some instances the wrong people are sent to PD, for example
the assistant principal, or the reading coach, and many times the information never gets
back to the teachers who must implement the program. One general education teacher
commented,
“Well, we have said that when you hear about the coaches getting training and
administrators, I say it is wonderful, they are supposed to bring it back to us, but we are
1. Lack of Professional Development: including types, settings , recipients, and
presenters.
1a. Micro viewpoints
1b. Macro viewpoint
2. School Structure, changing, demographics of teachers
2a. Economic factors
2b. District and political goals of RtI/MTSS
3. Lack of Trust, of data, of other staff members’ RtI/MTSS skills
3a. Lack of pedagogy by general education teachers
3b. Lack of belief in the RtI/MTSS process
4. Role Ambiguity
4a. Silos still exist, need for authentic collaboration, problem solving
4b. Special education takes the lead
5. Lack of Knowledge of RtI/MTSS
5a. Lack of urgency
5b. Fixed vs. growth mindsets
153
the ones that are supposed to know this stuff, we are the ones in the trenches. You cover
our classes. We are the ones that need to know this professional development and be
trained. We are the ones that do teach!”
Another general education focus group member’s response,
“Exactly, they send all the coaches away for training, and when they come back and are
supposed to share, they only share with a select few. And the information which needs to
be shared, it never shared with those who need to know, the ones in the trenches.”
A member of the professional support staff focus group explained,
“If you suggest you go to training for this, this, and this, they will say we are already
going for training for all this other stuff, we can’t be doing all this. It is gonna have to
happen in house; you have to have good people in your school that know how to do it,
that can help.”
A member of the administrator focus group added,
“You get a bunch of teachers together and put them together in a room and you tell them
all these things that should work, but you don’t show them how it works with a group of
kids. The professional development is put out there in the exact same way we tell the
teachers not to teach.”
All focus groups had suggestions for what PD should look like, where it should
happen, and who should be providing it. All groups suggested modeling of differentiated
instruction, scaffolding, inclusive practices, collaboration, and gradual release as types of
PD they would like to observe. Administrators specifically mentioned having special
education teachers model these practices.
One administrator stated,
“The best model you can have is what we have at our school, which is to watch an ESE
support facilitator interact with the kids, because they do things and you can actually
physically see them do things and interact with students. Because that is going to change
your beliefs and your skill set because you are going to see it in action.”
Sub-Theme 1a. micro viewpoints of PD. The general education teacher focus
group and the professional support staff tended to agree about show me how to do the

154
new program in my class with my students; do not send others to a PD to come back and
tell me about it. One professional support staff focus group member stated,
“I have sat through enough professional development where people were talking at me
and not to me. I mean some of my colleagues who are frustrated…that sounds great and
I want to believe in it, now I want someone to come into my class and show me how to do
what it is exactly you are talking about and show me with my kids and show me that it
works that is the piece that is missing. Because without that you are not going to get buy-
in. It is like I am in the classroom all day with the kids; I know what I am doing within
my classroom. It sounds good; everything sounds good from a theoretical perspective.
But for some teachers, some teachers get dealt a pretty bad hand, those teachers are the
ones, and you kind of end up in that group that looks like you are a bad teacher, you get
in that group that gets dumped on. I want to see that work with my kids, I understand the
school population, but I still don’t have the kids that the person next to me has, so I need
you to come into my classroom and show me how this is going to work with my kids. And
show me and not tell me what I need to do.”
This similar viewpoint aligns with their lower survey results when compared with the
administrators and the special education teachers, who suggested the need for specific
modeling by the special education teachers. Another administrator explains,
“If you are fortunate enough to have a team, put one support facilitator with that team to
help. Have them help that team and show them that these students are being successful,
because we’re breaking (complex) things down.”
Sub-Theme 1b. macro viewpoint. All focus groups realized the need to change
the current model of PD because what was currently occurring was not working. One
general education teacher simply stated,
“Professional development, professional development, professional development. And
more of it, to the teachers, direct.”
Theme 2. School Structure, Changing School Demographics
The structure of the typical secondary school is not conducive to the RtI process
and MTSS framework; it does not lend itself well to responsiveness needed for struggling

155
students. Barriers exist regarding scheduling problems, shortened periods, no class
options to do interventions, more students to see each day as opposed to elementary
teachers, content specialists who are not adept at teaching methodologies, and too many
secondary teachers who remain in their positions and become stagnant.
“I think it is kind of overwhelming because there is great deal more to have to deal with.
The classroom numbers are greater than elementary school, they may have 20 students,
and she has to differentiate for maybe 2 or 3 students that are not meeting the standards,
you cannot do that (in high school). Where as a high school teacher she may have 100 to
150 students and for them it is very overwhelming.”
“Yes, and I think the high school period is shorter, and when they see their students they
don’t have as much time to differentiate the instruction.”
“At the high school level the issue is everyone has been primarily trained in their craft.
I got a math degree, someone got a science degree, I don’t think they have the ability;
they haven’t been trained to differentiate, to break (complex) things down for the
children. I think they just put their own material out there and it’s the students that are
not being successful; I think that is their belief. They are not willing to try anything
different other than how they were taught the material.”
“I would say rigidity, over time we see it. People who are in the same position for an
extremely long period of time, they, they, they get stagnant. They use the same lesson
plan, they use the same format, they are on the way out, and so they are less open to new,
different, innovative, and possibly more effective ways to approach education. Because
they have been doing it this way for so long and it has worked this way for so long, ya
know. Why change?”
“Even for assistant principals who have been assistant principals for 15 or 20 years, I
don’t think they strongly believe in the process yet, because back in the day, they could
get the kid classified, get the kid over into ESE and in their mind, the kid was successful.”
The structure of secondary schools is steeped in academies and special industry
certification classes (choice programs), which require having specialty teachers who may
not have that standard teaching background. They may have come right from the
industry, took the certification test, and are now teaching their craft in a school. As the
needs of the school changes i.e. the need for more reading teachers and less electives,

156
these industry teachers need to recreate what they can teach in order to remain at their
current schools. This situation is exacerbated when whole neighborhoods become
unaffordable, and the foreclosure of homes becomes more prevalent. An additional
factor, older teachers who would normally retire are not able to do so; due to the
economic downturn, they are forced to continue working. In actuality these veteran
teachers are jaded, and just going through the motion of teaching. Often times these
conditions create the perfect storm of undesirable teaching conditions.
Sub-Theme 2a. economic factors. The economic downturn, free and reduced
lunch demographics, teachers waiting longer to retire because they cannot afford to retire,
and the need to increase academies to support racially balanced secondary schools are all
factors that are contributing to the changing school structure.
“And how fast the demographics are changing, in ten years at this school the
demographics have changed drastically. If you are Title One, your Title One, your Title
One, I don’t know how fast that demographic changes, but it is remarkable the change in
our client base, and next year it will be totally different. Because of academies, because
of whatever choice programs there are, so you are changing, fluctuating. So you get a
bunch of general education teachers that are doing this specific thing, and they can only
do this specific thing. Branching out is difficult because they were meant to do this, and
not this; they say they will try, but they were meant to teach an academy that is not there
anymore.”
“Well it is kinda like we call them retired in residence teachers, they are still teaching the
same way, they go to the file cabinet, get out the old dittos, and are teaching the same
stuff; they have been teaching the same curriculum, so when it comes to the new
strategies, the new things that come along, they are reluctant to change, so if they have
been in the position a long time they don’t want to change. They figure this is just
something new, it is going to pass, just hold my breath and keep doing what I am doing,
this will pass too. It will eventually go away. You have teachers who believe that. I
know, I have those types of teachers, I have seen the dittos! I have students who are now
teachers here who are seeing the same worksheets they had when they were students here
when they were in high school. It happens!”
Sub-Theme 2b. Political and district goals interfere with RtI/MTSS.
RtI/MTSS requires small group instruction and the opportunity for students to receive the

157
quality instruction over rate of learning in order to close academic deficits. However, the
structure of urban secondary schools (as mandated by law) must provide choice programs
to balance demographics, and assist in improving school scores. They must also not
place English Language Learners in settings based on their level of language, they must
be placed in age appropriate settings. Class size reduction was a ballot issue given to the
voters, and the state government uses this forced (by the voters) requirement as one of the
reasons that there is not more money for schools’ instructional needs. Benchmarks and
passing the FCAT add to the catalog of mandates. This list of constraints continues to
grow. The school district must adhere to these constraints while trying to provide a
responsive supplemental and intensive instruction to students coming from many
countries where the education systems is not as rigorous or where education is not a
number one priority in the culture.
“We haven’t even thrown in the multicultural facet of this yet. The interventions and
things going on for ELL students; that is another area we haven’t even discussed yet (as
a district).”
“I hope as we move (these struggling students in the RtI process) to the end of the year,
and trying to get them to (pass) the state standardized testing and (promoted) into the
next year and (pass) the benchmarks, (they) will increase and now I am still further
behind with this student and you are telling (the school, the teacher) I can’t move this
student out of my classroom, so I begin to think I don’t think this process (RtI/MTSS) is
working. As the administrator is telling you, you have to do more for this student and
they are not sure what more to do. And where are the resources, we have done
everything we know to do. So after a period of time you see people’s confidence go down
thinking we can’t do this; one, we don’t have enough resources; two, not enough people
are trained; three, this process takes far longer than I thought, and we are not planning
from one school year to the next. Let’s say the student is two years below grade level, and
by virtue of grade promotion the gap widens, but there is no planning for that. There is
no intervention planning for the increases of the benchmarks, and gaps. So it gets bigger
and bigger, and people get frustrated because they are further behind.”

158
Theme 3. Lack of Trust, of Data, of Other Staff Members’ RtI/MTSS Skills
The message of RtI/MTSS as it’s nothing new was stated loud and clear from the
school psychologists in the professional support staff focus group. The trust for the data
being brought to the SBT table was questioned.
“The teacher brings a progress monitoring log, and people are looking at the right side
where the numbers are, and the numbers are all over the place. In actuality, when you
are looking at it, the days and weeks, the weeks where the student didn’t perform well
(are where) the student wasn’t in school all week but the student still got the assessment
on Friday. So it looks like the student didn’t do well, and that is a completely different
issue, so now our RtI issue is an attendance issue, and this needs to be fixed before we
can work on the RtI issue. Or we are looking at the data and the scores are filled out at
the end of the week and nobody signed any of the intervention dates, and that happens a
lot more than anybody should ever see. Just scores on the side of the paper, the progress
monitoring log, no one has signed it, there are no dates, so you don’t know if it was this
year or last year. And you don’t know whether the intervention took place Monday,
Wednesday, Friday, or Tuesday, Thursday, everyday? So if you asked me if I was
confident in the data that was brought to the table, I would have to say…probably not.
As confident as some of the reports you are getting it is being reported that according to
the information (that) was given to me and that this was accurate data given to me, but I
am not going to tell you that this was whole heartedly that that child was receiving 30
minutes a day of the intervention each day, but that is what is reflected in the chart.”
Both the special education teacher and professional support staff group shared that data
is fudged.
“Well, when they look at those graphs and progress monitoring logs, it all looks good,
but now the psychologists, they can tell if you have fudged your progress monitoring
data, please don’t laugh, I am going to be honest, it happens. And they can look at it and
say….oh, okay?”
The statement of lack of buy-in for RtI/MTSS was mentioned in three of the focus
groups (not general education).
“But it goes back to how the teachers feel about that. If the person who is coming into
your classroom to train you is not prepared, how is the teacher feeling about this.
Because that is the person who is going into your classroom and telling you what you are
supposed to do. But when it comes back to it, it looks like the teacher is not willing to do
what it is that they are asking them to do. So you kinda get discouraged in your job, so
once teachers get discouraged in their job, it’s hard to get them back.”

159
“Well some of the psychologists that I have worked with don’t buy into RtI; they still
want to test.”
The Special education and administrator focus groups both mentioned that general
education teachers needed to see RtI/MTSS in action being successful at the secondary
level to believe that it actually assists students in closing their achievement gaps.
“I also think the general education teachers haven’t been trained as we said before.
They haven’t been taught how to teach, where the special education teachers have been
trained how to teach struggling students.”
“If you constantly are exposed to the same thing and you continually get the same results,
the same negative outcome, you lose faith. I can see that is what is happening, you
become jaded, bump school based team, because Joey is not going anywhere. Nothing is
going to happen to Joey, nothing is changing. They become jaded.”
General education teachers are also not trusting of the RtI/MTSS process; they have not
observed the positive benefits it can provide students.
“I know a lot of people, teachers who look at the school based team as the ultimate
removal of a student from their home school.”
Sub-Theme 3a. Lack of pedagogy by general education teachers. Both the
special education teacher and administrator focus groups stated the secondary general
education teachers lacked pedagogy in teaching methods. These two groups do not trust
general education teachers’ ability to differentiate and scaffold instruction for struggling
learners. This theme also validates the high RtI/MTSS Beliefs and Perception of
RtI/MTSS scores of the special education teachers and administrators and the low scores
of the general education teachers.
“I would say one reason would be (they) lack of true understanding of what RtI really is;
(they) lack professional development. So we need really to help them understand their
role in RtI and quite possibly their lack of experience in RtI at the secondary level. Lack
of it at the high school level, there is so little of it”

160
“I agree with you, but when I think of beliefs, I think of having belief that this is a system
that works for them. I think at my school, ya know, I don’t think enough of them have had
enough experience. They don’t even make referrals to school based team because kids
are failing. So they can’t believe in the system because they have never really seen it
work. Cause you gotta see it work!”
“I think they just put their own material out there and the students that are not being
successful (it is because of the students) I think that is their belief. They are not willing to
try anything different other than how they were taught.”
Theme 4. Role Ambiguity
While there is much literature in the RtI/MTSS “how to” guides about how to
address emerging and changing roles of special education teachers, general education
teachers, school psychologists, guidance counselors, and administrators, the actual day to
day practice is far removed from this “how to” guide. Each staff position struggles to
find their niche’ within the organization and compound this with the fact that many
people have had a difficult time with role clarity reorganizing and with their
philosophical beliefs about environmental factors, learning styles, teaching
methodologies and the struggling student. This phenomenon has lead many in the
secondary school structure to ask, “Where do I fit in and what is my job?”
“I also think it is a police officer type of situation; police officers are always dealing with
criminals or people doing things in a negative manner, where as an assistant principal
sees all (sides) of children. Whereas a school psychologist, for example, sees children
that are having problems, and once the child is being successful, they don’t see them
anymore. So they just may be they have more of a police officer mindset. That is what
they are dealing with all day long students that are not meeting with success. They don’t
see the success; they don’t have the vision of that.”
“Well it is their jobs; their jobs are on the line, because you don’t have to test. Up until
this year, my psychologist was still testing. You do your RtI, but we are going to show
academic testing, and we are going to show that discrepancy, but your RtI has to be
good, because this didn’t matter- all the hours I spent doing this testing doesn’t matter. It
this piece (RtI) that we need. I would say I can make this (RtI) piece look great.”

161
Sub-Theme 4a. Silos still exist, need for authentic collaboration and problem
solving. There has been literature in the “how to” guides that supports RtI/MTSS as
everyone’s initiative, but in the day to day practice of a large urban district, many
departments and initiatives use their own language, and much is lost in the translation.
General education still believe the students need to go somewhere else for help,
specifically to special education, and the special education teachers believe this is a
general education initiative, but we will reluctantly help because we do not want to see
the struggling student suffer.
“I think as a professional support resource, in carrying out the initiative it has always
been seen as a special education initiative, and it has always been facilitated by special
education teachers, and that general education teachers do not really want to do it,
accept it , carry it through. (They) don’t really grasp it, they see it has additional
paperwork, additional stress, they may not feel supported in it.”
“Well, it is a general education initiative, so general educators should know what RtI is.”
Administrators see the special education teachers coming to assist and attempting to
breakdown a silo.
“I think because they (special education teachers) have a strong understanding of the
needs of the students they are servicing. They understand how the services need to be
integrated to help the student be successful. Where general education teachers are more
concerned with the content, I think that special education teachers know that it is beyond
the content. In order for students to be successful, they are more apt to embrace a multi-
tiered approach to put systems in place to provide services for those students.”
Sub-Theme 4b. Special education takes the lead. All focus groups agreed
special education teachers’ coursework and training are synonymous with RtI/MTSS.
Special education teachers have been writing observable, measureable outcome goals at
multidisciplinary meetings for decades.
“Or the general education teacher thinks once the child is brought to the school based
team that the child should automatically come to ESE. They should be the ones that

162
come out and do the interventions. Again, it goes back to that whole idea; everyone has
to shift.”
“All the ESE teachers have background in differentiating; they are constantly looking for
ways to meet the needs of all of their children. They have tapped into all kinds of
strategies. When RtI came out it seemed that it was natural for ESE to take the lead.
Our school based team was mostly ESE people, they were resource teachers, they were
the ones out of the classroom, (and) it naturally leads that way. RtI it is ESE.”
“When you think about an IEP, you are progress monitoring. I think ESE teachers
already get that, they are already doing that.”
“I think that they (special education teachers) are more open to the meaning of educating
every child. To be driven into special education, you have that desire to really help a
child, where some general education teachers say I couldn’t make it as an accountant so
now I am going to teach math. So instead focusing on the child, they focus on the
subject.”
Theme 5. Lack of Knowledge of RtI/MTSS
All groups acknowledge that there was still work to be done building consensus,
infrastructure, and implementation. While administrators and special education teachers
have embraced the new belief system and begun to build infrastructure, many
professional support staff, and general education teachers have not.
“A teacher I am working with now, because I need data from her, she was very
uncomfortable because she didn’t know what I was asking for, and she was sending
emails saying, ‘Am I the only person doing this, what is this for?’ All my information is
going to change this kid’s (life). This was a very uncomfortable situation for her,
because she didn’t know what she was answering for. She didn’t want to be the only one,
so that is why training would help in that respect; it would help. But to have to know all
of the nuances in that respect, I don’t think so.”
“I also think sometimes there is a fear of what the data might say, and I don’t know how
to interpret it, analyze it correctly, and lead me where I need to go, and like you said I am
not trained, so it may be a little fearful for me.”
“They just lack the confidence to ask for help. I work with some veteran (general
education) teachers. One just said to me, ‘I am embarrassed to admit I don’t know how to
do a school based team referral, even though you have drilled it in every year’ but she
just said, ‘I should know how to do this.’ I replied let me show you how to do this. So
they may not have the confidence to admit they don’t know how to this type of thing.”
163
Others acknowledged a need for increased RtI/MTSS knowledge for all by stating the
need for further training such as a certification or endorsement.
“If you are going to be a teacher that is going to be with these kids that need more of
everything, they are out there, and they are not going away. It is only going to get more;
this area is only going to grow. So why can’t we make that into some sort of add on.
Whatever your certification is, add it on.”
“It is one thing to talk about teachers who are in college, but it is a different thing when
you are talking about teachers already in the classroom. They have a life outside of the
classroom. How do you get them involved, so that they can be exposed to it? But what
are they willing to implement so that this is put in place so we can be exposed, so we can
receive the knowledge. Receive the certification receive the endorsement. What are they
willing to do to make it better, so we can be exposed? Do what it is that is necessary for
us to be exposed.”
Sub-Theme 5a. Lack of urgency to understand RtI/MTSS. Many members of
different focus groups responded that some people just do not want to change, they see
RtI/MTSS as the latest educational fad to come down to practitioners and therefore if
they hold out, it will go away.
“They are resistant. The general education teachers in general are resistant to working
with them; they refer to them as ‘those’ kids, they’re ‘your kids’, they are everyone’s
children. But you know their answer is, ‘Come get them from us, just come get’ em; you
do you’re your little thing and then bring them back.’ Like they have not grasped the idea
they have to teach all children. And if they changed some of their teaching practices, it
would work for all students”
“In addition, they teach the way they were taught, which most times (it is) lecture style.
So they have no toolbox of tools to meet the needs of diverse learners. It is general
education teachers of whom I am speaking. So it is not surprising to me that they could
not read an EDW report and say yes this student is low, but the only areas of
specialization really would be our intensive reading teachers because they are taught
these skills. The other gen ed areas, (in) science and social studies knowing that a kid
couldn’t read they wouldn’t have a toolbox or have ways to help a kid from their college
experience; only through professional development would they learn these things, but
there is such a lack of attention paid during PD. So the tools are being given, but they
are not being received. Because they are busy doing paperwork, grading, drinking coffee,
skipping.”
“I think there are a couple of different things, if you look at the teachers that have 20
years, 25 years, you are going to get an analogy of the growth versus the fixed mindset.

164
They are done! You know the majority of them think they know everything, because they
have been doing it for so many years, and I don’t know why this isn’t working because it
worked 15 years ago, 20 years ago. Ya know I haven’t changed; it has to be the kids’
fault.”
“And it goes back to the core, what you are talking about, our teachers I think aren’t all,
on board, I don’t want to say it, well I am gonna say it, they are not all good teachers!”
Sub-Theme 5b. Fixed versus growth mindsets. Many focus group members
believed that special education teachers had a growth mindset as opposed to other
researchers; specifically general education teachers who have a fixed mindset. Many
believed it was inherent in the special education teacher’s DNA, and that much of the RtI
research has been derived from the special education field.
“And so you know who those teachers are on your campus, and you know who those
teachers are who you want to work with your students. That goes back to what I said
before, that when you find a teacher who will work with you, you know they are going to
make it happen for you and the student. They are going to work the process for the
student. But I have sat in meetings and have thought, hmm, we can’t ask that teacher to
do, they can’t or won’t do it.”
“I have seen a difference when a student has reached the eligibility for ESE services, the
ESE staff is not looking to move the student out of their program, whereas in general
education (they are) still looking at that student as struggling and looking to move them
somewhere, so that I don’t have full accountability. And that student can move
somewhere and they can take care of him and I don’t have to worry about it. I think that
ESE understands how to use tiered instruction, and put that model classroom and I think
that in general education they still struggle at what tiered instructions looks like and how
do you differentiate the instruction enough to meet the needs of that student. One that is
struggling hmmmm, if I can get that one to ESE, they will take care of it.”
Summary
A two phase sequential mixed method design was implemented in this study.
After surveys were reviewed for missing data, 316 secondary staff members had
completed the RtI/MTSS Beliefs instrument, 321 had completed the Perceptions of
RtI/MTSS Skills, and 191 had completed the Perceptions of RtI/MTSS Practices.
Multivariate analysis of variance was conducted for each of the dependent variables

165
(RtI/MTSS Beliefs, Perceptions of RtI/MTSS Skills, and Practices) with each of the four
staff positions surveyed. Statistically significant results included high RtI/MTSS Beliefs
and Perceptions of RtI/MTSS Skills for both special education teachers and
administrators when compared with general education teachers. While many of the
results showed statistical significance individually, review of the effect sizes showed that
overall meaningfulness of statistical significances was small among all results. Pearson r
coefficients were conducted among staff members’ years of experience in education and
years in current position and the dependent variables. As expected, perceptions of
RtI/MTSS Skills were found to be significantly higher in staff members who had
experienced a number of years in education. Interestingly, longer lengths of time that
staff member were in their current positions significantly correlated with their lower
RtI/MTSS data Beliefs. Once again, based on the computed effect size, the
meaningfulness of the statistical significances was small.
Semi-structured questions were developed based on the survey results.
Homogeneous focus groups were interviewed and audio-taped; the following themes and
sub-themes were revealed:
1. Professional Development (PD) needs to be redesigned, with sub-themes: 1a.
Micro Viewpoint of PD - each staff position had a variation on how the PD should look,
and 1b. Macro Viewpoint of PD - all staff positions believed modeling of interventions,
strategies, and differentiation should occur.
2. School Structure – the current organization of the secondary school structure is
not conducive to collaboration, and not the best configuration for students to receive
supplemental and intensive intervention or for focusing on the strengths of many of the
166
types of teachers found on the secondary level. Sub-themes for School Structure were:
2a. Economic Factors - recent economic downturn in US has had effects on local real
estate and schools’ student composition; and 2b. Political and District Goals Interfere
with RtI/MTSS at the Secondary Level - the school district creates academies to assist
with the socio-economic make-up of schools, thus creating situations where
academy/choice program teachers may not be qualified to teach reading within their
content area.
3. No Trust for the Data or Other Staff Members’ RtI/MTSS Skills - special
education teachers and professional support staff believe data brought to the table are
fudged, and these two staff positions do not believe that general education teachers have
the skills to provide intensive intervention or progress monitoring; a Sub-theme was:
Lack of Pedagogy by General Education Teachers - all the other staff member groups
believe secondary general education teachers are content experts and teacher-centered.
4. Role Ambiguity - school psychologists are not sure where they fit in the
RtI/MTSS process and what their actual job consists of. Sub-themes were: 4a. Silos Still
Exist - there is a need for authentic collaboration and problem solving, which is unlikely
to occur within the current secondary school structure; and 4b. Special Education
Teachers Take the Lead - both secondary administrators and special education teachers
believe that secondary special education teachers who have completed college course
requirements have the skill sets and learned abilities to model and intervene on behalf of
struggling students. Special education teachers were especially critical of the knowledge
and skill competencies of those special education teachers who had used the alternate
certification route for their credentialing.

167
5. Knowledge of RtI/MTSS - there is a large disparity among those who
understand RtI/MTSS and those staff members who do not. Sub-themes were: 5a. Lack
of Urgency to Understand RtI/MTSS - many staff members, especially secondary general
education teachers, tended not to realize the importance of teaching reading strategies
and skills to struggling students in their content areas; and 5b. Fixed Versus Growth
Mindsets - secondary administrators and special education teachers tended to be more
outcomes focused, whereas general education teachers tended to teach to the topic and to
blame the students if they do not understand the content the first or second time
presented.

168
CHAPTER V
DISCUSSION
Introduction
The purpose of this study was to investigate and explain the RtI/MTSS Beliefs,
perceptions regarding Skills, and Practices of urban secondary administrators,
professional support staff, general, and special educators. This study sought to discover
any differences and relationships among these groups relative to their number of Years in
Education and Years in their Current Positions. The researcher desired to investigate
how RtI/MTSS was perceived by secondary staff members in a diverse, urban school
district with the hope of providing insight into the strengths and weaknesses of the
RtI/MTSS framework in a secondary school setting.
Discussion of the study results first focuses on an overview of the study, followed
by a discussion of major quantitative and qualitative findings and how they relate to the
change process and systems change model. The change process and systems change
model refer to three stages of change. The first stage is the unfreezing or the consensus
for the need to change old Beliefs, Skills and Practices. The second stage is the building
of the infrastructure of those staff members who believe and understand the new set of
Beliefs, Skills, and Practices or moving the staff members to the new Beliefs, Skills, and
Practices. In the last stage, refreezing or implementation of the new Beliefs, Skills and
Practices is realized and constantly reviewed for improvement and ongoing professional
development.
There were no significant findings for questions three, four and six. For findings
that were significant, the relevancy of their effect sizes will be discussed at the end of this

169
section. Limitations of the study as well as implications for policy, practice and future
research will be presented. Finally, conclusions based on the findings are provided.
Overview
The researcher utilized a sequential, explanatory mixed method design. The first
phase with a quantitative design employed a 135 question, likert scale survey. The
RtI/MTSS Beliefs, Perceptions of RtI/MTSS Skills, and Practices Survey was distributed
to over 4500 secondary administrators, professional support staff, general, and special
education teachers via the computerized SurveyMonkey® link. Three hundred and
seventy-five participants started the survey. Completion of the survey data included, 303
participants who totally completed the RtI/MTSS Beliefs portion of the survey, 304
participants who totally completed the Perceptions of RtI/MTSS Skills portion of the
survey and 119 who totally completed the Perceptions of RtI/MTSS Practices portion of
the survey. The problem of missing data was addressed in the following manner: all
participants who completed at least 75% of each survey were included in the sample.
Thus, after adjusting for missing data, 321 participants completed the RtI Beliefs survey,
308 participants completed the Perceptions of RtI Skills survey, and 191 participants
completed the Perceptions of RtI Practices Survey. It should be noted that the sample
included a very educated population of participants, as 69.3% of the participants had a
master’s level or higher degree. Of those participants included in the sample, there was a
normal distribution of participants’ years of experience in education. However, the
sample was skewed, with 74% of the participants having between one to ten years in their
current position.

170
The secondary phase of the study using a qualitative design, solicited participants
who had completed the survey to contact the researcher and who expressed interest in
being a participant in one of four homogenous (i.e. administrators, professional support
staff, general education teachers, or special education teachers) focus groups. Focus
group questions were derived from the survey analysis. These homogeneous focus
groups included three administrators, five professional support staff, four general
education teachers, and two special education teachers. The focus groups were audio
taped interviewed. The focus group members were provided copies of the transcriptions
to check for verification. The same procedure was followed for the summaries of the
themes.
Major Quantitative Findings
RtI/MTSS Beliefs by Staff Position. The RtI/MTSS Beliefs survey measures
educators’ beliefs about service delivery regarding assessment practices on core,
supplemental, and intensive instruction and intervention. This instrument included three
factors: 1. Academic Ability and Performance of Students with Disabilities; 2. Data-
Based Decision Making; and 3. Functions of Core and Supplemental Instruction.
Academic belief questions included questions, such as: The majority of students with
learning disabilities achieve grade-level benchmarks in a. reading, b. math; and students
with high-incidence disabilities (e.g. SLD, EBD) who are receiving special education
services are capable of achieving grade level benchmarks (i.e. general education
standards in a. reading, b. math. Secondary special education teachers had statistically
significant higher RtI/MTSS Academic Beliefs than general education teachers with an
effect size d = .63. Special education teachers also had statistically significant higher
171
RtI/MTSS Academic Beliefs than professional support staff with an effect size d = .53.
While these results had medium effect sizes, RtI/MTSS Academic Beliefs by staff
position accounted for only 6% of the variability among staff positions.
RtI/MTSS Data Belief questions included: General education classroom teachers
should implement more differentiated and flexible instruction practices to address the
needs of a more diverse student body; and the goal of assessment is to generate and
measure the effectiveness of instruction/interventions. Secondary special education
teachers had statistically significant higher RtI/MTSS data Beliefs than general education
teachers with an effect size d = .46. Secondary administrators had statistically significant
higher RtI/MTSS data Beliefs than general education teachers with an effect size d = .78,
as well as statistically significant higher RtI/MTSS data Beliefs than professional support
staff, effect size d = .72.
Perceptions of RtI/MTSS Skills by Staff Position. The Perceptions of
RtI/MTSS Skills survey measures the skills in applying problem solving and RtI
Practices to academic and behavior content as well as data manipulation and technology
use. The instrument has three factors which include: 1. RtI/MTSS Skills applied to
academic content; 2. RtI/MTSS Skills applied to behavior content; and 3. Data
manipulations and technology use. Examples of Perceptions of RtI/MTSS academic
Skills questions included: Do you have the skill to access the data necessary to
determine the percent of students in core instruction who are achieving benchmarks
(district grade-level standards) in academics; and do you have the skill to use data to
make decisions about individuals and groups for core academic curriculum. Secondary
special education teachers had statistically significant higher perceptions of RtI/MTSS

172
academic Skills than general education teachers with an effect size d = .51.
Administrators had statistically significant higher perceptions of RtI/MTSS Academic
Skills than general education teachers with an effect size d = .78. While these results had
medium and large effect sizes, Perceptions of RtI/MTSS Academic Skills by staff
position accounted for only 6% of the variability among the different staff positions.
Examples of Perceptions of RtI/MTSS Behavior Skills include: Do you have the
skill to identify the most appropriate type of data to use for determining reasons
(hypotheses) that are likely to be contributing to the problem for behavior; and do you
have the skill to provide support necessary to ensure that the intervention is implemented
appropriately for behavior. Secondary administrators had statistically significant higher
perceptions of RtI/MTSS Behavior Skills than general education teachers with an effect
size d = .92. Professional support staff had statistically significant higher perceptions of
RtI/MTSS Behavior Skills than general education teachers with an effect size d = .55.
While these results had medium and large effect sizes, Perceptions of RtI/MTSS
Behavior Skills by Staff Position accounted for 15% of the variability among the
different staff positions.
Examples of questions from the survey Perceptions of RtI/MTSS data Skills
include: Do you have the skill to interpret graphed progress monitoring data to make
decisions about the degree to which a student is responding to interventions; and do you
have the skill to facilitate a problem solving team (Student Support Team, Intervention
Assistance Team, School-Based Intervention Team, Child Study Team) meeting.
Secondary special education teachers had statistically significant higher perceptions of
RtI/MTSS data Skills than general education teachers, effect size d = .46. Secondary

173
administrators had statistically significant higher perceptions of RtI/MTSS data Skills
than general education teachers, effect size d = .73. While these results had medium
effect sizes, Perceptions of RtI/MTSS data Skills by staff position accounted for 7% of
the variability among the different staff positions. Across all Perceptions of RtI/MTSS
Skills factors only 6% of the variability was found among the different staff positions.
Years of Experience in Education and Perceptions of RtI/MTSS Skills and
Practices. The longer a secondary staff member was in education, the higher their
perceptions of their RtI/MTSS academic Skills were, d = .15; also the longer a secondary
staff member was in education, the higher their perceptions of their RtI/MTSS behavior
Skills were, d = .16. The longer a secondary staff member was in education the higher
their perception of RtI/MTSS Practices were, d = .21. An example of questions found in
the Perceptions of RtI/MTSS Academic Practices included: In my school, data (e.g.
curriculum-based measurements, DIBELS, FCAT, Office Discipline Referrals) were used
to determine the percent of students receiving core instruction (general education
classroom only); who achieved benchmarks (district grade level standards) in academics;
and in my school, the teacher of the student referred for problem solving routinely
received staff support to implement the intervention plan developed by the problem
solving team.
Years in Current Position and RtI/MTSS Data Beliefs. The longer a
secondary staff member was in his/her current position, the lower his/her RtI/MTSS data
Beliefs, d = -.24. It should be noted RtI/MTSS data Beliefs measured participants’ data
based decision making beliefs. Examples of the types of questions included: the use of
additional interventions in the general education classroom would result in success for

174
more students; and using student-based data to determine intervention effectiveness is
more accurate than using only “teacher judgment”. This result was the only inverse
correlation found in the study.
Meaningfulness of effect sizes. While many of the differences among individual
factors (i.e., RtI/MTSS Data Beliefs, Perception of RtI/MTSS Academic Skills, etc.) and
the different staff positions had medium or large effect sizes, all RtI/MTSS Beliefs
factors accounted for only 4% to 15% of the variability among the different staff
positions. For example, all RtI/MTSS Beliefs factors accounted for only 3.7% of the
variability among the different staff positions. All perceptions of RtI/MTSS Skills
factors accounted for 6% of the variability among the different staff positions. These
findings may be interpreted to mean that there is a great deal of variability in the different
staff members’ RtI/MTSS Beliefs and perceptions of their RtI/MTSS Skills. This
variability may be partially explained by the nature of self-report surveys which can elicit
inflated scores, and because of the nature of the person who take such surveys (i.e., their
interest in the survey topic either from a doubting/negative perspective or from a
trusting/positive perspective tends to distort the results). While the meaningfulness of
this finding may be small, it should be noted that this study is one of the first to examine
the differences in urban secondary staff members and their RtI/MTSS Beliefs. Therefore,
these effect sizes may establish a baseline for future research (Thompson, Diamond,
McWilliam, Snyder, & Snyder, 2005).
When considering the meaningfulness of the correlations, it could be assumed that
as staff members’ Years in Education increased, so would the level of their RtI/MTSS
Skills; however, it is interesting to note that the effect size for both perceptions of

175
RtI/MTSS Academic (d = .15) and Behavior Skills ( d = .16) were small. Lastly, the
only inverse correlation, the number of Years in Current Position and RtI/MTSS Data
Beliefs was also a small effect size, d = .24.
These findings may be interpreted to mean there is much variability in the
different staff members’ perceptions of their RtI/MTSS Skills and their years in education
and years in current position. Again, the nature of self-report surveys elicit inflated
scores, as well as the nature of people who take such surveys (i.e., the interest in the topic
either from a doubting/negative perspective or from a trusting/positive perspective tends
to distort the results). While the meaningfulness of this finding may be small, it should
be noted that this study is one of the first to examine the relationship of urban secondary
staff members RtI/MTSS Beliefs, Perceptions of RtI/MTSS Skills and Practices, and their
current years in education. Therefore, these effect sizes may establish a guide for future
research (Thompson et al., 2005).
Major Qualitative Findings
Five major themes emerged along with several sub-themes that were found from
the follow-up qualitative phase including:
1. Professional Development (PD) needs to be redesigned, with sub-themes: 1a.
Micro Viewpoint of PD. Each staff position has a variation on how the PD should look;
and 1b. Macro Viewpoint of PD. Participants across all staff positions believed modeling
of interventions, strategies, and differentiation should occur.
2. Secondary School Structure needs to be redesigned. Setup of the secondary
school structure is not conducive to collaboration, nor is it the best configuration for
students to receive supplemental and intensive intervention or provide the types of

176
teachers required. With sub-themes 2a. Economic Factors, recent economic downturn
has had effects on local real estate and the composition of schools; and 2b. Political and
District Goals Interfere with RtI/MTSS at the Secondary Level. The school district
creates academies to assist with the socio-economic make-up of school, thus creating
situations where academy/choice program teachers may not be qualified to now teach
reading.
3. No Trust for the Data or other Staff Members’ RtI/MTSS Skills. Sub-theme 3a.
Distrust by segments of the professional community indicates special education teachers
and professional support staff believe data brought to the table is fudged, and these two
staff positions do not believe general education teachers have the skills to provided
intensive intervention or progress monitoring. Also, the professional support staff and
the special education teachers are leery that while administrators say they have high
RtI/MTSS Beliefs and Skills, in actuality these two groups may not know all they say
about RtI/MTSS. Sub-theme 3b. Lack of Pedagogy of the general education teachers
suggests all the other staff member groups believe secondary teachers are content experts
and teacher-centered with students needing to conform to their format of instruction (i.e.,
lecture, board work, dittos, etc.).
4. Role Ambiguity. School psychologists and guidance counselors are not sure
where they fit in the RtI/MTSS process and what their actual job consists of. Sub-theme
4a. Silos Still Exist, the need is evident for authentic collaboration and problem solving,
which is unlikely to occur within the current secondary school structure; and 4b. Special
Education Teachers Should Take the Lead. Both secondary administrators and special
education teachers believe that secondary special education teachers have the skill set and

177
innate ability to model and intervene on behalf of struggling students. Secondary school
systems need to evaluate how the skills possessed by special education teachers can be
more fully utilized as the reconfigure how RtI/MTSS will be delivered.
5. Knowledge of RtI/MTSS. There is a large disparity between those who
understand RtI/MTSS and those staff members who do not. Sub-theme 5a. Lack of
Urgency to Understand RtI/MTSS reveals many staff members, especially secondary
general education teachers, tended not to realize the importance of having to teach
reading strategies and skills to struggling students in their content areas; and Sub-theme
5b. Fixed Versus Growth Mindsets indicates secondary administrators and special
education teachers tended to be more outcome focused, whereas general education
teachers tended to teach to a topic and believed if the student does not get it the first or
second time, it is the fault of the student.
Interpretations of Major Quantitative/Qualitative Findings
Themes are bolded throughout interpretations of the major quantitative/qualitative
findings section.
Research Question # 1. Are there perceived differences in Beliefs about
RtI/MTSS among secondary administrators, general educators, special educators,
and professional support staff in an urban district? This question explored whether
there were perceived differences in RtI/MTSS Beliefs (academic, instructional, and data)
among secondary administrators, general educators, special educators and professional
support staff. The results indicated differences between general education teachers’
RtI/MTSS academic and data Beliefs and those of special education teachers. Secondary
general education teachers had the lowest RtI/MTSS academic and data Beliefs of all the
178
staff positions. Secondary general education teachers’ lack of RtI/MTSS knowledge
and lack of urgency to understand RtI/MTSS may have led to this finding. The
administrators in the current study felt secondary general education teachers were content
specialists. Deshler and Ehren (2010) argue secondary general education teachers are not
literacy experts. Fisher and Frey (2011) found general education teachers taught with a
fixed mindset prior to their year of RtI professional development and that they lacked
urgency that is needed to intervene with struggling students at the secondary level. This
lack of urgency was delineated by both the special education teachers and administrators
in the current study. The lack of urgency theme is also supported in the literature of
Duffy (2007), who explains urgency, for example, exists when a student comes to high
school and is many years behind in reading. Duffy (2007) also states there is very little
time to intervene on behalf of this at-risk student. Fisher and Frey (2011) found in their
study of one high school that many general education teachers were prone to not giving
students homework because they felt students would not do it; they felt students were
choosing not to do the work or would copy it from other students. The findings of Fisher
and Frey’s study align with this study’s finding concerning the general education
teachers’ low RtI/MTSS Beliefs. In other words, in this study, focus groups argued that
general education teachers’ Beliefs assumed that students who struggled are not capable
of learning grade level content; general education teachers also appeared to have low
perceptions of their own RtI/MTSS Skills to help their students. These findings are
corroborated by the many comments in both the special education teacher and
administrator focus groups regarding general education teachers having a fixed mindset.
It was the perception of other groups that secondary general education teachers believe if

179
the student does not understand the concept the first or second time it is taught, it is the
student’s fault, because he/she cannot read or is not trying. Deshler and Ehren (2010)
explained that when secondary general education teachers think of core instruction they
think of math, science, social studies, English, and not literacy skills. In the current
study, special education teachers believed general education teachers thought RtI/MTSS
was the job of the special education department. Fuchs, Fuchs, and Stecker (2010)
argued that the role of the special education teacher is blurring and that they may be
asked to take on more of a role in the general education teacher’s classroom to assist all
struggling students, not just the students with individualized educational plans. General
education teachers in the current study believed that the low RtI/MTSS Beliefs by their
peers were the result of teachers responding from different regions of the school district
where RtI/MTSS may not be so important or where the secondary school structure was
different. General education teachers in this study’s focus group believed that not all
general education teachers were so disparaging when it came to their RtI/MTSS Beliefs
and Skills. Rather, secondary general education teachers argue school structure was to
blame for their low scores on the survey. For example, they felt that Title One and
academy teachers are one dimensional and not prepared to teach literacy strategies in
their choice programs. Greenfield et al. (2010) found in their study that elementary
general education teachers’ perceptions of RtI were positively mixed; in other words, the
teachers were still working at understanding the key concepts of RtI and how to
implement them. Although the study by Greenfield et al. was conducted on the
elementary school level, it still supports the findings in this study that general education
teachers’ perceptions of RtI are mixed and in flux, and that many of the general education

180
teachers lacked RtI/MTSS knowledge. Thus, secondary general education teachers are
still in the freezing or consensus stage of the systems change model. In addition, the
general education teachers in this study believed that their peers’ low RtI/MTSS Beliefs
could also be due to their peers’ leadership team’s lack of understanding of RtI/MTSS,
and that stating the school based leadership team did not provide appropriate PD to
support the understanding of RtI/MTSS. The Sansosti et al. (2010) study found that high
school principals perceived RtI as an important initiative, but realized how difficult its
implementation would be; the authors noted the many required changes that must occur
to the current secondary school structure to implement RtI. This finding aligns with the
current study, and suggests administrators have built consensus and moved from old
beliefs to the new RtI/MTSS Beliefs, but are struggling with building the necessary
infrastructure. There was no agreement among the focus groups in the current study as to
why secondary general education teachers had the lowest RtI/MTSS Beliefs. Their non-
consensus may lend itself to explain the no trust findings among the staff positions and
that secondary school structure exacerbates silos among the special and general
educators, and the different levels of RtI/MTSS knowledge among the two groups of
teachers. Burns (2008) and Dutton Tillery, Varjas, Meyers, and Smith Collins (2010)
argue that most personnel at the secondary level are content specific and only interested
in students mastering their subject area, which suggests that the secondary school
structure is conducive to building and maintaining silos. This lack of consistency in the
reasons given for no trust and levels of RtI/MTSS knowledge among different staff
members may define the small overall effect sizes in the RtI/MTSS variables.
181
In the current study, special education teachers also had significantly higher
RtI/MTSS academic Beliefs than professional support staff. The majority of the
professional support staff included guidance counselors and school psychologists; it
should be noted that in the school district sampled, guidance counselors tended to be the
majority of the school based/problem solving team leaders. There were no significant
differences between the school psychologists and the guidance counselors’ responses.
The administrator focus group felt the professional support staff, specifically the school
psychologists, were only called in to work with students when the students had
behavioral or academic concerns. In other words, school psychologists did not see these
struggling students when they had overcome their behavioral or academic concerns. The
special education focus group felt school psychologists as well as guidance counselors
who serve as the school based team leader were adept at determining if RtI data had
been misreported or altered when being presented to the problem solving team. The
school psychologist and the guidance counselor who were part of the professional support
focus group corroborated that they could tell when data brought to the table were
“fudged”. O’Donnell and Miller (2011) found that while school psychologists who
worked primarily in elementary schools were apt to have higher levels of RtI
acceptability, those school psychologists who worked primarily in secondary schools
tended to have lower RtI acceptability scores. In Landry’s (2012) unpublished
dissertation on the school psychologists’ changing role, one major theme of the study
found that some school psychologists were more comfortable with the changes than
others. The special education focus group argued that these problem solving leaders felt
that secondary special education staff should be doing the problem solving and delivering

182
interventions. On the secondary level, members of different staff groups in this study
were not sure what their role or job description was, nor did they trust others from
other staff groups enough to work collaboratively for solutions using problem solving.
Therefore, many from the professional support staff were still in the freezing, consensus
building stage of the systems change model. They were still trying to decide if they
believed RtI/MTSS is a viable framework to assist struggling students. They were trying
to determine where they fit into the framework and process. According to National High
School Center, National Center on Response to Intervention, and Center on Instruction
(2010), role clarity at the secondary level is essential in order to have an effective
RtI/MTSS framework.
In the current study, RtI/MTSS data Beliefs were significantly higher for both
special education teachers and administrators when compared to general education
teachers and professional support staff. As mentioned previously, special education
teachers stated that professional support staff do not trust the data that is coming to the
table, and the members of the professional support staff focus group substantiated this
claim. The special education focus group suggested that school psychologists have not
bought into RtI/MTSS and that they still desire to revert to their previous discrepancy
testing model to identify students with disabilities. School psychologists are still in the
freezing, consensus building stage of the systems change model. This statement was
corroborated by the school psychologist in the professional support staff focus group,
who believed many school psychologists, especially the older ones, believed RtI/MTSS
will be gone, just as it had disappeared many years ago. It would appear that they believe
if they wait this initiative out, and wait long enough, it will eventually go away. Their

183
belief can lead to no trust in others, such as general educators’ ability to collect data and
progress monitor with fidelity. This would suggest that school psychologists in urban
secondary schools are still in the freezing/consensus building stage of the systems change
model. In Coubertier’s unpublished dissertation (2012), school psychologists in Florida
were found to be unsure of their role in RtI/MTSS and tended to be apprehensive when it
came to interpreting the RtI data that they had not collected. This finding aligns with the
school psychologists’ statement in the current study of not buying into RtI/MTSS, and
places them squarely in the freezing, consensus building stage of the systems change
model.
Secondary general education teachers also lacked understanding of the
RtI/MTSS data in the current study. Again, administrators felt general education
teachers lacked RtI/MTSS knowledge and tended to have a fixed mindset. Secondary
administrators also felt special education teachers had taken the lead in RtI/MTSS
due to their skill sets and growth mindset. Special education teachers felt general
education teachers thought RtI/MTSS should be implemented by the special education
teachers; this finding tends to substantiate the fact that different staff members are not
knowledgeable about what their role consists of in RtI/MTSS. The Swanson et al.
(2012) study on special education teachers’ perceptions of RtI found that special
education teachers perceived themselves as the staff members most equipped with
knowledge of a myriad of strategies to conduct early intervention with struggling
students. While the Swanson et al. study was conducted in an upper elementary grade
school, the findings are relevant to the perceptions of both administrators and special
education teacher focus groups in this study. This study alignment may show secondary

184
general education teachers are still in the freezing/consensus building stage of the
systems change model, whereas administrators and special education teachers have
moved their RtI/MTSS Beliefs, and are in the infrastructure stage of systems change.
Research Question #2. Are there perceived differences in RtI/MTSS Skills
among secondary administrators, general educators, special educators, and
professional support staff in an urban school district? Secondary special education
teachers and administrators had significantly higher perceptions of their RtI/MTSS
academic and data/technology Skills than their secondary general education teacher
counterparts. While all focus groups agreed that the nature of RtI/MTSS is inherent in
the secondary special education teacher’s repertoire of skills, the special education
teacher focus group explicitly stated that the special education teachers who answered
this study survey were those who had taken methodology coursework, not those special
education teachers who only passed the special education certification test.
Administrators noted special education teachers tended to have a growth mindset, and
worked with students trying to determine solutions to the students’ difficulties rather than
wanting to send them someplace else. According to all focus groups, whether by choice
or by necessity, secondary special education teachers have taken the lead in
RtI/MTSS. Both administrators and special education teachers alike mentioned that
secondary special education teachers understand the urgency to assist struggling
learners, whereas the secondary general education teachers do not have the skill set and
would just like the students to be helped someplace other than their classrooms (i.e.,
resource room). Hoover and Patton (2008) argue that special education teachers should
take on five important roles in RtI; they suggest special educators are or should be skilled

185
at data driven decision making, be able to implement evidenced based interventions,
implement socio-emotional and behavioral supports, differentiate instruction, and be a
collaborator offering to model these skill sets. Swanson et al. (2012) found that RtI
perceptions of special education teachers’ were that they were best equipped
pedagogically to take the lead in RtI/MTSS. Werts, Lambert, and Carpenter (2009)
also found that administrators overwhelmingly agreed (92.9%) that special education
teachers should assume the role of determining whether students are non-responsive to
an intervention as well as be responsible for progress monitoring students in the general
education setting who are struggling.
This study’s findings suggest secondary general education teachers may not have
witnessed success with RtI/MTSS, are content specific, and are of a fixed mindset, while
secondary special education teachers have experienced success with RtI/MTSS,
understand a growth-model, and see the benefits of it. Administrators receive this
training and understand the importance of using the RtI/MTSS framework to problem
solve and move their schools forward; and administrators also understand that secondary
special education teachers have the academic and behavioral strategies to support
supplemental and intensive interventions. Clearly, general education teachers are still in
the freezing, consensus building stage of the systems change model while special
education teachers and administrators have moved to building the infrastructure stage of
the systems change model.
Previous research supports the findings of this study that the school structure at
the secondary level has a tendency to create isolation among general education teachers,
to have them consider themselves experts in only content areas, and to become more

186
teacher centered in their perceptions (Deshler, 2009; Duffy, 2007; Dutton Tillery,
Varjas, Meyers, & Smith Collins, 2010; National High School Center, National Center on
Response to Intervention, and Center on Instruction, 2010; Sarlo et al., 2011); previous
research also supports the finding that administrators understand the importance and
urgency of RtI/MTSS at the secondary level (Sansosti et al., 2010). As in other research
studies, special education teachers were found to believe that RtI/MTSS can be a
successful process for struggling students. Secondary special education teachers have
witnessed the successes, thus adding to their support of the RtI/MTSS model (Duffy,
2007; Dutton Tillery et al., 2010; Hoover & Patton, 2008).
Professional support staff, such as the school psychologists and guidance
counselors, appear to be struggling to redesign their roles in the RtI/MTSS model
(Coubertier, 2012), and may not be flexible in assessing the data (Medina-Pekofsky &
Reid, 2011) or trusting the data (O’Donnell & Miller, 2011) that is used for problem
solving. The current study suggests professional support staff need to understand where
they belong in the RtI/MTSS model.
The findings of this study indicated that secondary special education teachers had
significantly higher perceived RtI/MTSS Skills in all three sub skill (academic, behavior,
and data/technology) categories than the secondary general education teachers. The
focus groups explained these differences as the special education teachers that were
traditionally trained are equipped with RtI/MTSS skills and the coursework they take
in college is built on student-centered, growth model pedagogy, interventions, and
strategies. These findings are supported in the literature. A study by Hoover and Patton
(2008) found that special education teachers believed RtI gave struggling students access

187
to early intervention, met unique student needs, and encouraged collaboration among
different staff members.
Administrators also had significantly higher perceived RtI/MTSS academic and
behavior Skills and significantly higher RtI/MTSS data/technology Skills than general
education teachers. Sansosti et al. (2010) found administrators understood the
importance and urgency of implementing an RtI/MTSS framework. The focus groups
explained this result as secondary general education teachers lack the proper
professional development, lack the appropriate knowledge, are unfamiliar with
collaboration, and are masters of their content and not of pedagogy. Mastery of content
as a criterion for certifying secondary teachers in particularly evident in Florida where
persons become teachers by passing a subject area certification test without having
concomitant pedagogical knowledge and skills (FLDOE, 2002). These findings are also
supported in the literature. Dutton Tillery et al. (2010) found that general education
teachers in the elementary setting were not familiar with RtI and Positive Behavior
Intervention Support, despite having participated in several trainings on the topics. Many
of the participants in the researcher’s focus groups discussed general education teachers’
lack of RtI knowledge and skills, despite the district’s commitment to RtI PD; these
participants cited the general education teachers’ lack of interest, and their inability to
accept responsibility to implement RtI/MTSS. It would appear that after four years of
PD, many general education teachers have not understood the information provided at the
RtI/MTSS presentations. Perhaps high quality PD was not provided; or perhaps they
have too many initiatives to implement and the secondary school structure may prevent
them from implementing all these initiatives with fidelity.

188
The focus groups in the current study also stated that although administrators are
provided with the training and state that they have the knowledge of these skills for
RtI/MTSS, participants from both the professional support staff and special education
teacher focus groups felt that many in the administration do not understand all they
profess to know. This supports findings from National High School Center, National
Center on Response to Intervention, and Center on Instruction (2010) that evaluated
administrative responses from some of their visitation sites and found them to be inflated
compared with what they actually observed after conducting walkthroughs of the schools.
This inflated result could be interpreted to mean that administrators know that RtI/MTSS
is an important initiative, and that their livelihood is dependent upon looking at their data,
informing their instructional decisions using the data, and reviewing the results to change
curriculum. If negative perceptions exist that administrators appear not to understand
RtI/MTSS, they may lose their administrative positions. Sansosti et al. (2010) alludes to
this fact in their electronic survey study, stating that principals perceived the importance
of implementing the components of RtI in their schools, but find it difficult to implement.
Sansosti et al. (2010) also stated that their results should be interpreted with caution,
since self-report surveys measure perception and may not actually represent true
implementation of RtI/MTSS in their schools.
Research Question # 5. What is the relationship of staff’s (administrators,
general educators, special educators, and professional support staff) Skills about
RtI/MTSS and the number of years they have been in education? This research
question explored whether there was a relationship between staff members’ number of
years in education and their perceptions of RtI/MTSS Skills. As was expected, there was
189
a statistically significant but small correlation; the more years that secondary staff
members had in education, the higher their perceptions of their effectiveness of
RtI/MTSS academic and behavior Skills. All focus groups agreed that it should be
expected that the longer a person is in education, the greater the likelihood that they have
received ample professional development and have had enough experience to feel
confident in classroom management and curriculum decision-making. This result is
consistent with pervious self-reporting research, including the study of Castillo et al.
(2011), who found that staff members who received more professional development and
training had higher perceptions of academic and behavior Skills.
Research Question #7. What is the relationship of staff’s (administrators,
general educators, special educators, and professional support staff) Beliefs about
RtI/MTSS and the number of years they have been in their current positions? This
research question explored staff members’ number of years in their current position and
their RtI/MTSS Beliefs. On the sub-scale of RtI/MTSS data Beliefs, there was a
statistically significant inverse correlation; in other words, the longer a staff member was
in his/her current position, the lower his/her RtI/MTSS data Beliefs. The focus groups
were not surprised at this result either. However, they were divided on the reason why
the researcher obtained this result. Special education teachers and the administrators
believed that these educators in the same positions for many years were teaching as if
they were already retired, not willing to change the material they used in class, not
willing to try new strategies. It is also possible that older teachers may not be as
comfortable with an increasingly computerized world; they may be more apt to blame the
students for the students’ academic and behavior struggles; and lastly, these staff
190
members may have beliefs that support a teacher-centered mindset. In contrast, the
professional support staff and general education teachers believe that these staff
members were jaded, had not seen positive results from the RtI/MTSS process, and felt
that this was the reason for their not buying in and not believing the data. They did not
trust the data nor do their fellow staff members believe in their ability to conduct the
progress monitoring with fidelity. This finding aligns with Hardcastle and Justice’s
(2006) and the Greenfield et al. (2010) studies that state that they found that the longer a
teacher was in education, the more difficult it was for him/her to change his/her current
beliefs and practices. Staff members in their current positions for long periods of time
are still in the freezing, consensus building stage of the systems change model. In other
words, they have not seen positive outcomes for struggling students and therefore do not
believe RtI/MTSS is a viable option.
Limitations
Although the findings from this study add to the secondary RtI/MTSS literature,
several limitations should be noted. One major limitation is the low number of
completed Perception of RtI/MTSS Practices surveys. Prior to adjusting for missing data,
304 participants completed the RtI/MTSS Beliefs portion of the survey, 308 participants
completed the Perceptions of RtI/MTSS Skills portion of the survey, but only 119
participants completed the Perceptions of RtI/MTSS Practices portion of the survey.
Focus groups gave three reasons for the lower number of completions; they believed
participants really did not know what RtI/MTSS Practices were occurring on their
campuses, leading to a lack of RtI/MTSS knowledge, while others in the focus groups
believed participants were possibly afraid to answer for fear that they might get their

191
schools in trouble; and lastly, they felt the survey may have been too long. These
responses are consistent with other studies which have utilized these same instruments.
Castillo et al. (2011) found the survey was too long for participants to complete in the
allotted time. The comments that the Perceptions of RtI/MTSS Practices survey was too
long were also consistent with findings from K.M. Stockslager, Ph.D. (personal
communication, October 10, 2012) from the University of South Florida RtI Problem
Solving Project.
Another limitation of the study is the use of self-report surveys which may have
elicited inflated or positively biased scores. This possibility was mentioned by both the
special education teacher and professional support staff focus groups in regards to the
administrators’ high RtI/MTSS Beliefs, perception of RtI/MTSS Skills, and the
perceptions of RtI/MTSS Practices.
A third limitation of this study was potential bias on the part of the researcher
who was a full time educator with 25 years of teaching experience primarily in secondary
special education in the district at the time of the study. Because the researcher wanted to
explore differences amongst staff members and their RtI/MTSS Beliefs, Skills, and
Practices, every effort was made to be objective and not let personal experiences or
perspectives affect the analysis of the qualitative data.
A fourth limitation to this study is that the study was not a requirement;
participants choose on their own volition to take the survey. Therefore, those who were
interested in the subject or had a personal relationship with the researcher may have self-
selected.

192
The education level of the sample was skewed with two-thirds of the sample
having a masters or higher degree. Only 45% of the 4,624 possible population sampled
have a masters or higher degree (see Table 2). This may have been the reason special
education teachers’ beliefs, and skills were higher. Many of the special education
teachers knew the researcher.
A fifth limitation to this study was the need to perform a transformation log on the
number of years in the current position by survey participants, because there was not a
normal distribution in the sample. Most of the participants have been in their current
position for less than ten years, so the sample was skewed, and may have distorted the
results for these study questions.
Lastly, the results of this study may not be generalizable due to the low number of
survey participants; 15% of the total secondary membership completed the first two
portions of the survey. The low survey response rate may make it difficult to generalize
any conclusions from the survey participants to the population as a whole. However,
these survey completion results do mirror results from studies that K.M. Stockslager,
Ph.D. (phone conversation, October 10, 2012) conducted using the same survey
instruments.
Recommendations for Further Research
The findings discussed in this study provide a starting point for the examination
of the RtI/MTSS Beliefs, Perceptions of RtI/MTSS Skills and Practices of secondary
staff. The researcher recommends giving the three surveys (Beliefs, Skills, and Practices)
during separate times or all together during a professional development meeting and

193
incorporating the survey as part of a pre-existing PD and over several days, so that staff
understand that their participation is required.
Based on the statistically significant low RtI/MTSS Beliefs and Perceptions of
RtI/MTSS Skills by secondary general education teachers, the researcher recommends
replicating this study with elementary staff (i.e., general education teachers, special
education teachers, professional support staff and administration) and comparing the
results of the two studies. It would be telling if elementary general education teachers’
RtI/MTSS Beliefs and Perception of RtI/MTSS Skills were as low as secondary general
education teachers. If their Beliefs and perception of Skills were to be statistically and
significantly lower than the other staff members, then this may lead administrative
practitioners to rethink their professional development offerings, and for schools of
education to rethink their programs and methods courses (Kratochwill, Volpiansky,
Clements, & Ball, 2007). Conversely, if elementary staff members’ results were to be
statistically higher, this may suggest that the silos in secondary structure are a factor in
the low RtI/MTSS Beliefs and perceptions of RtI/MTSS Skills.
Another research recommendation would be to add another demographic variable
to track the different methods for certification. For example, is there a difference in the
teachers’ RtI/MTSS Beliefs, Perceptions of RtI/MTSS Skills, and Practices of teachers
who received their certification by just taking the certification test or by teachers who had
taken methodology courses in order to obtain their certification?
An additional recommendation for future research would be to look at other large,
urban districts in the same state, and compare their RtI/MTSS Beliefs, Perceptions of
RtI/MTSS Skills and Practices. The interesting point here would be to consider the

194
different timeframe and manner in which each district has begun to implement this state
mandated initiative. For example, one large district waited three years, until the mandate
was state law before beginning any implementation, while the second district had
demonstration or pilot schools implemented first and brought the other schools on board
when the mandate became law; and of course, the district in this study implemented the
mandate district-wide as soon as the state department of education wrote the bulletin.
This information would help other large, urban districts to strategically plan on how to
build consensus, the infrastructure, and implementation of the RtI/MTSS framework.
Another study worth investigating would be to look at the existing data and
compare one group across the three variables (RtI/MTSS Beliefs, Skills, and Practices).
For example, compare the general education teachers’ RtI/MTSS Beliefs, Perceptions of
RtI/MTSS Skills and Practices to see if there are correlations among the three variables.
We need to be able to understand why the guidance counselors and school
psychologists did not have higher RtI/MTSS Beliefs. School psychologists in many other
smaller districts (Castillo et al., 2011; Landry, 2012; O’Donnell & Miller, 2008) and in
other states have taken the lead in building RtI/MTSS capacity; this was not the case in
this study and a similar study (Coubertier, 2012) conducted in the same region of the
country and in school districts with similar demographics but should be done. This
phenomenon needs to have a clearer understanding. In order to move the professional
support staff from freezing/consensus building stage to the infrastructure/moving stage of
the systems change model, we need to understand why they appear not to have moved.
Lastly, it would be interesting to see the study results from a quasi-experimental
design where pre-tests with the three surveys are administered, and then a year of

195
professional development demonstrating special education teachers modeled
implementation of strategies, differentiated instruction, progress monitoring, and
problem-solving would be provided to general education teachers. After completion of
one year of fidelity modeling and follow-up support given to the general education
teachers, the general education participants in the study would retake the three survey
pieces again to see if there are changes in their RtI/MTSS Beliefs and Perceptions of
RtI/MTSS Skills and Practices.
Implications for Policy and Practice
This study provided an exploration and explanation of the secondary staffs’
RtI/MTSS Beliefs, Perceptions of RtI/MTSS Skills, and Practices in a large urban school
district. While school districts across the country have school psychologists as the leads
in this federal mandate, the school psychologists in this large, urban districts need to re-
tool their skills (Lockman, 2011). No longer can they rely on their standard evaluations
to make decisions. Clearly, professional support staff, specifically school psychologists in
large urban districts, must become proactive collaborators, as well as leaders in the
problem-solving process, otherwise their positions will become outdated. Perhaps this
conflict in roles for school psychologists has impacted their performance (Coubertier,
2012; Landry, 2012; O’Donnell & Miller, 2008). Higher education school psychology
programs should consider incorporating the definition of the school psychologist’s role as
a member of the problem solving team and include approaches to problem solving
appropriate strategies and interventions to meet the needs of struggling students
throughout their course of study.

196
Administrators and those in charge of designing and providing professional
development, especially to those in the field, such as secondary general education
teachers, should rethink how they deliver and provide PD (Fisher & Frey, 2011). Small
group modeling with the teacher’s own students would be the best recommendation.
Based on the findings of the focus groups, it is recommended that PD be brought to the
teacher and students in the classroom which should prove more successful than the
current models, the sit and get model or a train the trainer model. The current study is
supported by the literature. Dunst and Trivette (2012) found that professional
development that actively engaged adult learners in acquiring new knowledge and skills
had the largest effects on learner outcomes. Furthermore, it would make sense to have the
secondary special education teachers provide that modeling to the secondary general
education teachers. Exposing general education teachers to differentiation and explicit
instruction should demonstrate positive results for struggling students. It seems that
many general education teachers, particularly those with a number of years in the
education system, need to witness students being successful when RtI is implemented
with fidelity in order to become advocates of the initiative.
Higher education courses should consider integrating special education
methodology courses within content courses for all teachers. The professors of each area
should model what collaboration looks like, and students should be exposed to data and
related problem solving case studies early in the courses. Explicitly taught reading
strategies should be incorporated into content courses. The data based decision making
and problem solving process should be infused throughout the college courses with
students’ exposed/taught how to deliver evidenced based interventions and strategies with
197
fidelity. Such as University of California, Riverside, which currently offers a 15 credit
hour RtI Certification that provides the conceptual foundations of RtI as well as
assessment and prevention in academic and behavioral areas (University of California,
Riverside, 2013). Thus, upon graduation, they will be equipped with a toolbox full of
evidenced based strategies and interventions, and be familiar with assessment and
evaluation techniques, in order to uncover the exact deficit each student may be
experiencing.
Lastly, implications for policy include requiring an RtI/MTSS endorsement for
each teacher and administrator, similar to the endorsement that must be acquired in order
to instruct English Speakers of Other Languages in the state of Florida. This RtI/MTSS
endorsement should be built around explicit problem-solving, and how to read school-
wide and individual data, and how to determine the needs of the school or individual
student. No longer is it acceptable to conclude that the problem lies with the student;
secondary educators must be accountable for all aspects of the students’ learning.
Conclusion
The results of this study should be interpreted with caution based on several
factors. The first factor that should be considered is the skewedness of the sample;
almost 70% of the sample had obtained a masters degree or above compared to only 45%
of the total possible sample. This finding is congruent with other studies (Goddard &
Villanova, 2006; McCready, 2006) that argue people will participate in surveys when
they have an interest in the topic either positively or negatively. Participants may have
chosen to take the survey because they were positively interested in RtI/MTSS or they
could have chosen to take the survey because they have negative feelings surrounding the

198
implementation of RtI/MTSS. The second factor to consider is the familiarity of the
researcher to some of the focus group participants; some of the focus group members
may have answered questions in a way that they felt the researcher wanted to hear.
While the researcher made every effort to have a flat affect so as to not influence
answers, participants’ work relationships may have been somewhat of a factor. Lastly,
while many medium and some large effect sizes were noted for individual differences
between staff positions, small effect sizes were noted for overall variables. Thus,
meaningful significance was small when explaining the variability in the different staff
positions and their RtI/MTSS Beliefs and Perceptions of their Skills, and Practices.
While the overall meaningfulness of the results are small, this study may provide
some direction for further research on RtI/MTSS at the secondary level as this is one of
the few studies to investigate urban secondary staff RtI/MTSS Beliefs, Perceptions of
Skills, and Practices. This study found many barriers existed and must be overcome
before RtI/MTSS at the secondary level can move past the consensus building (freezing)
stage of RtI/MTSS Beliefs and Perception of Skills and Practices and the infrastructure
stages of change by moving these different staff positions’ RtI/MTSS Beliefs, Skills, and
Practices. The eventual goal is to move the Staffs’ RtI/MTSS Beliefs, Perceptions of
these Skills, and Practices so that the implementation of RtI/MTSS becomes part of the
culture of the school district and the individual secondary schools. Before these changes
can occur, the professional development for secondary staff members should be reviewed
and reconfigured to include team building and collaboration activities as well as the
provision of intervention and strategy training to all staff positions, but particularly
secondary general education teachers. According to Fullan (2001), in order for systems

199
change to adhere and be productive, relationships among leadership and staff must be
trusting and collaborative. Perhaps those secondary special education teachers who have
built consensus and shifted their belief sets should not be apprehensive to take the lead.
Administrators, who understand the urgency of this initiative, should assist with
removing the secondary school structure barriers, facilitating activities to enhance trust
among different staff positions, and providing a pathway for interrelating content that
dismantles current departmental and position silos. With authentic collaboration,
meaningful PD, role clarity, reconfigured secondary school structures, and increased
RtI/MTSS knowledge, secondary administrators and special education teachers should
take the lead and thereby move other secondary staff members’ RtI/MTSS Beliefs, and
Perceptions of their RtI/MTSS Skills and Practices from consensus to implementation of
the systems change model, and in turn prepare ALL students for career and college
readiness.

200
References
Angelo, L., & Bradley, R. (2011, April). From research to implementation of response to
intervention practices. Invited panel presentation at the National Council for
Exceptional Children 2011 Convention & Expo, National Harbor, MD.
Barnett, D., Daly, E., Jones, K., & Lentz, F. E. (2004). Response to intervention:
Empirically-based special service decisions for increasing and decreasing
intensity using single case designs. The Journal of Special Education 38, 66-79.
Batsche, G., Curtis, M. J., Dorman, C., Castillo, J. M., & Porter, L. J. (2007). The Florida
problem-solving/response to intervention model: Implementing a statewide
initiative. In Jimerson, S.R., Burns, M.K. & VanDerHeyden, A. (Eds.), Handbook
of response to intervention: The science and practice of assessment and
intervention (pp. 378-395). New York: Springer Publishing.
Batsche, G., Elliott, J., Graden, J. L., Grimes, J., Kovaleski, J. F., Prasse, D., … Tilly, W.
D. (2005). Response to intervention: Policy considerations and implementation.
Alexandria, VA: National Association of State Directors of Special Education,
Inc.
Batsche, G., & Kincaid, D. (June 22, 2011). Integrating RtI A and B: Critical elements
and resources. Presentation at Leadership Institute on Developing Multi-Tiered
System of Student Supports. Innisbrook Resort & Golf Club, Tarpon Springs, FL.
Beliefs. (2011). In Oxford American college online dictionary. Retrieved from
http://web.ebscohost.com.ezproxy.barry.edu/ehost/dictionary?sid=a69ed780-
8cb1-48b6-b980-9c2ac51ca2b8%40sessionmgr111&vid=5&hid=17
Bergan, J. (1977). Behavioral consultation and therapy. Columbus, OH: Merrill

201
Bergan, J., & Kratochwill, T. R. (1990). Behavioral consultation and therapy. New York,
NY: Plenum Press.
Biklen, D., & Duchan, J. (1994). “I am intelligent”: The social construction of mental
retardation. Journal for Association for Persons with Severe Handicaps, 19(3),
173-184.
Bollman, K. A., Silberglitt, B., & Gibbons, K. A. (2007). The St. Croix educational
district model: Incorporating systems-level organization and a multi-tiered
problem-solving process for intervention delivery. In S. R. Jimerson, M. K.
Burns, & A. M. VanDerHeyden (Eds.), Handbook of response to intervention,
(pp. 319-330). New York, NY: Springer.
Bradley, M. C., Daley, T., Levin, M., O’Reilly, R., Parsad, A., Robertson, A., & Werner,
A. (2011). IDEA National Assessment Implementation Study (NCEE 2011-4027).
Washington, DC: National Center for Education Evaluation and Regional
Assistance, Institute of Education Sciences, U. S. Department of Education.
Bradley, R., Danielson, L., & Doolittle, J. (2007). Responsiveness to intervention: 1997
to 2007. Teaching Exceptional Children, 39(5), 8-12.
Bradley, R., Danielson, L., & Hallahan, D. P. (2002). Identification of learning
disabilities: Research to practice. Mahwah, NJ: Lawrence Erlbaum Associates.
Brotherson, M.J. (1994). Interactive focus group interviewing: A qualitative research
method in early intervention. Topics in Early Childhood Special Education,
14(1), 101-118.
Bureau of Exceptional Education and Student Services (BEESS). (2006). The response
to intervention (RtI) model: Technical assistance paper. (BEESS Paper No.

202
FY2006-8)
Burns, M. (2008). Response to intervention at the secondary level. Principal Leadership,
Middle School Edition, 8(7), 12-15.
Burns, M. K., Jacob, S., & Wagner, A. R. (2008). Ethical and legal issues associated with
using response to intervention to assess learning disabilities. Journal of School
Psychology, 46, 263-279.
Brozo, W. G. (2009-2010). Response to intervention or responsive instruction?
Challenges and possibilities of response to intervention for adolescent literacy.
Journal of Adolescent & Adult Literacy, 53, 277-281.
Burns, M. K., Vanderwood, M., & Ruby, S. (2005). Evaluating the readiness of pre-
referral intervention teams for use in a problem-solving model: Review of three
levels of research. School Psychology Quarterly, 20, 89-105.
Canter, A., Klotz, M., & Cowan, K. (2008). Response to intervention: The future for
secondary schools. Principal Leadership, Middle School Edition, 8(6), 12-15.
Carlson, E., Chen, L., Schroll, K., & Klein, S. (2003). Study of personnel needs in special
education (SPeNSE): Final report. U.S. Department of Education Office of
Special Education. Retrieved from http://ferdig.coe.ufl.edu.spense/finalpaperwork
Castillo, J. M., Batsche, G. M., Stockslager, K., March, A., & Minch, D. (2010).
Problem/solving response to intervention evaluation tool technical assistance
manual. Florida Statewide Problem Solving & Response to Intervention Project.
Retrieved from
http://www.floridarti.usf.edu/resources/program_evaluation/ta_manual/sections/
Castillo, J. M., Hines, C. V., Batsche, G. M., & Curtis, M. J. (2011). The Florida

203
problem solving/response to intervention project: Year 3 evaluation report.
Retrieved from:
http://www.floridarti.usf.edu/resources/format/pdf/yr3_eval_report.pdf
Cohen, J. (1988). Statistical power analysis for the behavioral sciences (2 Ed.).
Hillsdale, NJ: Lawrence Erlbaum Associates.
Collins, K. M. T., Onwuegbuzie, A. J., & Sutton, I. L. (2006). A model incorporating the
rationale and purpose for conducting mixed-methods research in special education
and beyond. Learning Disabilities: A Contemporary Journal, 4(1), 67-100.
Condray, D. S. (June, 2007). Fidelity of intervention implementation. Paper presentation
at The IES Summer Training Institute on Cluster Randomized Control Trials.
Nashville, TN. Retrieved from
ies.ed.gov/ncer/whatsnew/conferences/rct_traininginstitute/.../cordray.ppt
Creswell, J. W., & Plano Clark, V. L. (2011). Designing and conducting mixed methods
research (2nd
Ed.) Thousand Oaks, CA: Sage Publications.
Cronbach, L. J. (1975). Beyond two disciplines of scientific psychology. American
Psychologist, 30, 201-211.
Curtis, M. J., Castillo, J. M., & Cohen, R. M. (2008). Best practices in systems-level
change. In A. Thomas, & J. Grimes (Eds.), Best Practices in School Psychology V
(pp.887-901). Bethesda, MD: NASP Publications.
Darling-Hammond, L., & McLaughlin, M. W. (1995). Policies that support professional
development in an era of reform. Phi Delta Kappan, 76(8), 597-604.
Denton, C. A., Vaughn, S., & Fletcher, J. M. (2003). Bringing research-based practice in
reading intervention to scale. Learning Disabilities Research & Practice, 18, 201-

204
211.
Deshler, D. (2009, October). Ask the expert featuring Don Deshler: What are the major
differences between elementary and secondary RtI? Retrieved from
www.rti4success.org
Deshler, D. D., & Ehren, B. J, (2010). Using the content literacy continuum as a
framework for implementing RTI in secondary schools. Theory Into Practice,
49(4) 315-322. doi: 10.1080/00405841.2010.510760
Diamond, H., Dorman, C., Hall-Mills, S., Van Name Larson, A., & Wheeler, D. (Nov.
2009). SLD rule implementation workshop. Presentation at Regional SLD
Workshop Presentation. Florida Department of Education, Pasco County, FL.
Dion, E., Roux, C., Landry, D., Fuchs, D., Wehby, J., & Dupere, V. (2011). Improving
attention and preventing reading difficulties among low-income first-graders: A
randomized study. Prevention Science 12, 70-79.
doi:10.1007/s11121-010-01825
Donovan, M.S., & Cross, C. T. (2002). Minority students in special and gifted education.
National Research Council. Committee on Minority Representation in Special
Education. Division of Behavioral and Social Sciences in Education. Washington,
DC: U.S. Department of Education.
Duffy, H. (2007). Meeting the needs of significantly struggling learners in high school: A
look at approaches to tiered interventions. Washington, DC: American Institutes
for Research, National High School Center. Retrieved from
http://www.betterhighschools.org/docs/NHSC_RTIBrief_08-02-07.pdf
Dunn, L. M. (1968). Special education for the mildly retarded - - Is much of it

205
justifiable? Exceptional Children 35, 5-22.
Dunst, C. J. & Trivette, C. M. (2012). Moderators of effectiveness of adult learning
method practices. Journal of Social Sciences (15493652), 8(2), 143-148.
Dutton Tillery, A., Varjas, K., Meyers, J., & Smith Collins, A. (2010). General education
teachers’ perceptions of behavior management and intervention strategies.
Journal of Positive Behavior Intervention, 12(86), 86-102.
doi: 10.1177/1098300708330879
Elementary and Secondary Education Act, §3578 (2011).
Elliott, S. N., Witt, J. C., Kratochwill, T. R., & Stoiber, K. C. (2002). Selecting and
evaluating classroom interventions. In M.R. Shinn, H.R. Walker, & G. Stoner
(Eds.), Interventions for academic and behavior problems II: Preventative and
remedial approaches (p. 143-166). Bethesda, MD. The National Association of
School Psychologists Publications.
Faculty. (n.d). In Merriam-Webster’s online dictionary (11th
ed). Retrieved from
http://www.merriam-webster.com/dictionary/faculty
Faggella-Luby, M., & Wardwell, M. (2011). RtI in a middle school: Finding and practical
implications of a tier 2 reading comprehension study. Learning Disabilities
Quarterly, 34(1), 35-49.
Fang, Z. (1996). A review of research of teacher beliefs and practices. Educational
Research, 38, 47-65.
Fisher, D., & Frey, N. (2011). Implementing RtI in a high school: A case study. Journal
of Learning Disabilities, 46(2), 1-16. doi: 10.1177/0022219411407923
Fixsen, D. L., Naoom, S. F., Blasé, K. A., Friedman, R. M., & Wallace, F. (2005).

206
Implementation research: A synthesis of the literature. Tampa, FL: University
of South Florida, Louis de la Parte Florida Mental Health Institute, The National
Implementation Research Network (FMHI Publication #231).
Fletcher, J. M., Stuebing, K. K., Barth, A. E., Denton, C. A., Cirino, P. T., Francis, D. J.,
& Vaughn, S. (2011). Cognitive correlates of inadequate response to reading
intervention. School Psychology Review, 40(1), 3-22.
Florida Department of Education (FLDOE). (2002). Florida Department of Education
DOE information data base requirements highly qualified teacher status
definition. Retrieved from
http://www.fldoe.org/eias/dataweb/database_0607/st170_1.pdf
Florida Department of Education. (2011). Florida response to instruction/intervention:
RtI “fits”in Florida. Retrieved from http://www.florida-rti.org/flMod/fits.htm
Florida Department of Education. (2008-2009). Florida school indicators report
2008-09. Retrieved from http://www.fldoe.org/eias/eiaspubs/0809fsir.asp
Florida Department of Education. (2008). Statewide response to instruction/intervention
(RtI) implementation plan. Bureau of Exceptional Education and Student Services
Clearinghouse, 312955.
Fuchs, L. (2002). Three conceptualizations of “treatment” in a responsiveness-to-
treatment framework for LD identification. In R. Bradley, L. Danielson, & D.
Hallahan (Eds.), Learning Disabilities: Research to Practice (pp. 521-529).
Mahwah, NJ: Lawrence Erlbaum.
Fuchs, D., & Fuchs, L. S. (1994). Inclusive schools movement and the radicalization of
special education reform. Exceptional Children, 60, 294-309.

207
Fuchs, D., & Fuchs, L. S. (2008). What the inclusion movement and responsiveness to
intervention say about high incidence disabilities. Learning Disabilities Research
and Practice, 18, 157-171.
Fuchs, L. S., & Fuchs, D. (1998). Treatment validity: A unifying concept for
reconceptualizing the identification of learning disabilities. Learning Disabilities
Research & Practice, 13, 204-219.
Fuchs, L. S., & Fuchs, D. (2006). Commentary: A framework for building capacity for
responsiveness to intervention. School Psychology Review, 35(4), 621-626.
Fuchs, L. S., Fuchs, D., & Compton, D. (2010). Rethinking response to intervention at
middle and high school. School Psychology Review, 39, 22-28.
Fuchs, D., Fuchs, L. S., & Stecker, P. M. (2010). The “blurring” of special education in a
new continuum of general education placements and services. Exceptional
Children, 76(3). 301-323.
Fuchs, D., Mock, D., Morgan, P., & Young, C. (2003). Responsiveness to intervention:
Definitions, evidence and implications for the learning disabilities construct.
Learning Disabilities Research & Practice, 18, 157-171.
Fullan, M. (2001). The new meaning of educational change (3rd ed.). New York:
Teachers College Press.
Gay, L. R., & Airasian, P. (2003). Educational research: Competencies for analysis and
application, 7th
Ed. Upper Saddle River, NJ: Merrill Prentice Hall.
Gersten, R., Baker, S. K., Smith-Johnson, J., Flojo, J. R., & Hagan-Burke, S. (2004). A
tale of two decades: Trends in support for federally funded experimental research
in special education. Exceptional Children, 66, 55-66.

208
Goddard, R. D., & Villanova, P. (2006). Designing surveys and questionnaires for
research. In J.T. Austin, & F. L. Leong (2nd
Ed.), The psychology research
handbook: A guide for graduate students and research assistants. Thousand
Oaks, CA: Sage Publications.
Great Lakes West Comprehensive Assistance Center. (2006). Implementation of
Response to Intervention (RtI) in 7-PAK States: Approaches and Lessons
Learned. Retrieved from
http://www.doe.virginia.gov/instruction/response_intervention/resources/impleme
ntationrti_7pak.pdf
Greene, J. C., Caracelli, V. J., & Graham, W. F. (1989). Data analysis strategies for
mixed-methods evaluation designs. Educational Evaluation and Policy Analysis
15(2), 195-207.
Greenfield, R., Rinaldi, C., Proctor, C. P., & Cardarelli, A. (2010). Teachers’ perceptions
of a response to intervention (RtI) reform effort in an urban elementary school: A
consensual qualitative analysis. Journal of Disability Policy Studies, 21(1), 47-
63. doi: 10.1177/1044207310365499
Gresham, F. M. (2002). Responsiveness to intervention: An alternative approach to the
identification of learning disabilities. In R. Bradley, L. Danielson, & D. Hallahan
(Eds.), Learning Disabilities: Research to Practice (pp. 467-519). Mahwah, NJ:
Lawrence Erlbaum.
Gresham, F. M. (2003). Responsiveness to intervention: An alternative approach to the
identification of learning disabilities. Education and Treatment of Children, 28,
328-344.
209
Gresham, F. M. (2007). Evolution of the response-to-intervention concept: Empirical
foundations and recent developments. In S. R. Jimerson, M.K. Burns, &
A.VanDerHeyden. (2007). Handbook of response to intervention: The science
and practice of assessment and intervention. (pp. 10-24) New York: Springer
Publishing.
Gresham, F. M., MacMillan, D. L., Beebe-Frankenberger, M. E., & Bocian, K. M.
(2000). Treatment integrity in learning disabilities intervention research: Do we
really know how treatments are implemented? Learning Disabilities Research &
Practice, 15(4), 198–205.
Gresham, F. M., & Witt, J. C. (1997). Utility of intelligences tests for treatment planning,
classification, and placement decisions: Recent empirical findings and future
directions. School Psychology Quarterly, 12, 249-267.
Grimes, J. (2002). Responsiveness to intervention: the next step in special education
identification, service, and exiting decision making. In R. Bradley, L. Danielson,
& D. Hallahan (Eds.), Learning Disabilities: Research to Practice (pp. 531-547).
Mahwah, NJ: Lawrence Erlbaum.
Guarino, C., Santibanez, L., & Daley, G. (2006). Teacher recruitment and retention: A
review of the recent empirical literature. Review of Educational Research, 72(2),
173–208.
Harris, J. (2011, April). Planning tools for high school response to intervention (RTI)
implementation. Panel presentation and demonstration at the National Council for
Exceptional Children 2011 Convention & Expo, National Harbor, MD.
Hardcastle, B. & Justice, K. (2006). RtI and the classroom teacher. Horsham, PA. LRP

210
Publications.
Hersey, P., Blanchard, K. H., & Johnson, D. E. (2001). Management of organizational
behavior: Leading human resources (8th
ed.). Upper Saddle River, New Jersey:
Prentice Hall.
Hoover J. J., & Patton, J. R. (2008). The role of special educators in a multitiered
instructional system. Intervention in School and Clinic, 43(95),195-202.
doi: 10:1177/1053451207310345
HSTII (2010). National High School Center, National Center on Response to
Intervention, and Center on Instruction. Tiered interventions in high
schools: Using preliminary “lessons learned” to guide ongoing discussion.
Washington, DC: American Institutes for Research.
Ikeda, M., Rahn-Blakeslee, A., Niebling, B. C., Gustafson, J. K., Allison, R., & Stumme,
J. (2007). The heartland area education agency problem-solving approach: An
overview and lessons learned. In S.R. Jimerson, M.K. Burns, & A.M.
VanDerHeyden (Eds.), Handbook of response to intervention, (pp. 255-268). New
York, NY: Springer.
Individuals with Disabilities Education Improvement Act. (IDEA, 2004). Public law,
108-446,2004.
Ivankova, N. V., & Stick, S. (2007). Diagram for a study that used the explanatory
design. In J. W. Creswell & V. L. Plano Clark (2011). Designing and
Conducting Mixed Methods Research (2nd
ed.). Los Angeles, CA: Sage.
Jimerson, S. R., Burns, M. K., & VanDerHeyden, A. (2007). Handbook of response to
Intervention: The science and practice of assessment and intervention. New York:

211
Springer Publishing.
Johnson, E., & Smith, L. (2008). Implementation of response to intervention at middle
school: Challenges and potential benefits. Teaching Exceptional Children, 40(3),
46-52.
Kame’enui, E. J. (2007). Responsiveness to intervention: A new paradigm. Teaching
Exceptional Children, 39(5), 6-7.
Kavale, K. A., Holdnack, J. A., & Mostert, M. P. (2006). Responsiveness to intervention
and the identification of specific learning disability: A critique and alternative
proposal. Learning Disability Quarterly, 26(2), 113-127.
Kirk, S. (1962). Educating exceptional children. Boston, MA: Houghton Mifflin, 263
Kliewer, C., & Biklen, D. (1996). Labeling: Who wants to be called retarded? In W.
Stainbeck, & S. Stainbeck (Eds.), Controversial issues confronting special
education: Divergent Perspectives (pp. 83-111). Boston, MA: Allyn and Bacon.
Kratochwill, T.R., Volpiansky, P., Clements, M., & Ball, C. (2007). Professional
development in implementing sustaining multitier prevention models:
Implications for response to intervention. School Psychology Review 36(4),
618-631.
Kurns, S., & Tilly, W. D. (2008). Response to intervention blueprints for
implementation: School level edition. Alexandria, VA: National Association of
State Directors of Special Education.
Landry, D. F. (2012). The changing role of school psychologists in school-wide models
of response to intervention (unpublished doctoral dissertation). University of
Florida, Gainesville, FL.

212
Learning Disabilities Roundtable. (2002, July). Specific learning disabilities: Finding
common ground. Washington, DC: American Institutes for Research. Retrieved
from http://www.ncld.org/advocacy/Common Ground.doc
Lewin, K. (1947). Frontiers in group dynamics: Concept, method and reality in social
sciences; Social equilibrium and social change. Human Relations, June, 1947 (1),
p 5-41. doi: 10.1177/001872674700100103
Lipsky, D. K., & Gartner, A. (1996). Inclusive education and school restructuring. In W.
Stainbeck, & S. Stainbeck (Eds.), Controversial issues confronting special
education: Divergent Perspectives (pp. 3-15). Boston, MA: Allyn and Bacon.
Lockman, B. (2011, June). Florida’s implementation of multi-tiered system of student
supports (MTSSS). Inaugural Leadership Institute on Developing a Multi-Tiered
System of Student Supports. Innisbrook Resort and Golf Club, Tarpon Springs,
FL.
Lyon, G. R., Fletcher, J. M., Shaywitz, S. E., Shaywitz, B. A., Torgesen, J. K., Wood, F.
B., Schulte, A., & Olsen, R. (2001). Rethinking learning disabilities. In C. E.
Finn, Jr., A. J. Rotherham, & C. R. Hokanson, Jr. (Eds.), Rethinking special
education for a new century (pp. 259-287). Washington, DC: Thomas B. Fordham
Foundation. Retrieved:
http://www.dlc.org/documents/SpecialEd_complete_volume.pdf
Marston, D., Muyskens, P., Lau, M., & Cantor, A. (2003). Problem-solving model for
decision-making with high incidence disabilities: The Minneapolis experience.
Learning Disabilities Research and Practice, 18, 187-200.
McLeskey, J., Landers, E., Hoppey, D., & Williamson, P. (2011). Learning disabilities
213
and the LRE mandate: An examination of national and state trends. Learning
Disabilities Research & Practice, 26(2), 60-66. doi: 10.1111/j.1540-
5826.2011.00326.x
McLeskey, J., & Waldron, N. L. (2011). Educational program for elementary students
with learning disabilities: Can they be both effective and inclusive. Learning
Disabilities Research & Practice, 26(1), 48-57. doi:10.1111/j.1540-
5826.2010.00324.x
Medina-Pekofsy, E., & Reid, F. (2011, June). Report on the 2011 Florida MTSS
leadership institute: Developing a multi-tiered system of student support.
Symposium conducted at The Innisbrook Resort, Tarpon Springs, FL.
McCready, W. (2006). Applying sample procedures. In J.T. Austin, & F. L. Leong (2nd
Ed.), The psychology research handbook: A guide for graduate students and
research assistants. Thousand Oaks, CA: Sage Publications.
Munro, B. H. (2005). Statistical methods for health care research, 5th
ed. (pp. 82-83).
Philadelphia, PA: Lippincott Williams & Wilkins.
National Association of School Psychologists, New Roles in Response to Intervention:
Creating Success for Schools and Children (2006). A collaborative project.
Retrieved from:
http://www.nasponline.org/advocacy/New%20Roles%20in%20RTI.pdf
National Association of State Directors of Special Education and Council of
Administrators of Special Education [NASDE]. (2005). Response to intervention:
NASDSE and CASE white paper on RtI. Retrieved from

214
http://www.nasdse.org/Portals/0/Documents/
Download%20Publications/RtIAnAdministratorsPerspective1-06.pdf
National Center for Education Statistics (2009). The nation’s report card: Reading 2009
(NCES 2010-458). Washington DC: U.S. Department of Education, Institute of
Education Sciences. Retrieved from:
http://nces.ed.gov/nationsreportcard/pdf/about/2011471.pdf
National Center on Response to Intervention at the American Institute for Research
(2010). Essential components of RTI-A closer look at response to intervention.
Retrieved from
http://www.cldinternational.org/Articles/rtiessentialcomponents.pdf
National Center on Response to Intervention Website. (2010). RtI state database.
Retrieved
from http://state.rti4success.org/index.php?option=com_chart
National High School Center at the American Institute for Research. (2011). National
high school center early warning system tool v2.0 technical manual. Retrieved
from
http://www.betterhighschools.org/documents/NHSCEWSTechnicalManual.pdf
National High School Center, National Center on Response to Intervention, and Center
on Instruction. (2010). Tiered interventions in high schools: Using preliminary
“lessons learned” to guide ongoing discussion. Washington, DC: American
Institutes for Research.
National Joint Committee on Learning Disabilities. (1999). Professional development for
teachers. In Collective perspectives on issues affecting learning disabilities (2nd

215
ed., pp. 69–78). Austin, TX: Pro-Ed.
No Child Left Behind (NCLB). (2001). Executive summary of the No Child Left Behind
act. Retrieved from www.ed.gov./print/nclb/overview/intro/execssumm.html
Noell, G. H., & Gansle, K. A. (2006). Assuring the form has substance: Treatment plan
implementation as the foundation of assessing response to intervention.
Assessment for Effective Intervention, 32(1), 32-39.
O’Donnell, P.S., & Miller, D. N. (2011). Identifying students with specific learning
disabilities: School psychologists’ acceptability of the discrepancy model versus
response to intervention. Journal of Disability Studies 22(2), 83-94. doi:
10:1177/1044207310395724
Onwuegbuzie, A. J., & Leech, N. L. (2005). On becoming a pragmatist researcher: The
importance of combining quantitative and qualitative research methodologies.
International Journal of Social Research Methodology: Theory & Practice, 8(5),
375-387.
Patton, J. M. (1998). The disproportionate representation of African Americans in special
education: Looking beyond the curtain for understanding and solutions. The
Journal of Special Education, 32(1), 25-31.
Perceptions. (2011). In Oxford American college online dictionary. Retrieved from
http://web.ebscohost.com.ezproxy.barry.edu/ehost/dictionary?sid=a69ed780-
8cb1-48b6-b980-9c2ac51ca2b8%40sessionmgr111&vid=7&hid=17
President’s Commission on Excellence in Special Education. (2002). A new era:
Revitalizing special education for children and their families. Washington D.C.:
U.S. Department of Education.

216
Rebore, R. W. (2007). Human resources administration in education: A management
approach. 8th
ed. Boston, MA Pearson.
Reschly, D. J., & Ysseldyke, J. (2002). Paradigm shift: The past is not the future. In A.
Thomas & J. Grimes (Eds.). Best practices in school psychology – IV (pp. 3-20).
Bethesda, MD: National Association of School Psychologists.
Reynolds, C. R., & Shaywitz, S. E. (2009). Response to intervention: Ready or not? Or
from wait-to-fail to watch-them-fail. School Psychology Quarterly, 24(2), 130-
145.
Russo, P. (2004). What makes any school an urban school? Draft: Position paper.
Retrieved from
http://www.oswego.edu/~prusso1/what_makes_any_school_an_urban_s.htm
Sansosti, F. J., Noltemeyer, A., & Goss, S. (2010). Principals’ perceptions of the
importance and availability of response to intervention practices within high
school settings. School Psychology Review, 39(2), 186-295.
Sarlo, R., Robertson, S., & Sudduth, P. (2011, May). Maximizing student outcomes
through the development of a multi-tiered student support system. Paper
presentation at Florida PS/RtI State Implementation Project Technical Assistance
meeting, West Palm Beach, FL.
Sarason, S. B. (1990). The predictable failure of school reform. San Francisco, CA
Jossey-Bass.
Scull, J., & Winkler, A. (2011). Shifting trends in special education. Thomas B. Fordham
Institution. Retrieved:
http://www.edexcellencemedia.net/publications/2011/20110525

217
Seethaler, P. M., & Fuchs, L. S. (2005). A drop in the bucket: Randomized controlled
trial testing reading and math interventions. Learning Disabilities Research &
Practice, 20(2), 98-102.
Shapiro, E. S. (2009). The two models of RtI: Standard protocol and problem solving.
Bethlehem, PA: Center for Promoting Research to Practice, Lehigh University.
Retrieved from: http://www.doe.virginia.gov/instruction/response
intervention/guidance/two_models.pdf
Staff. (n.d.). In Merriam-Webster’s online dictionary (11th
ed). Retrieved from
http://www.merriam-webster.com/dictionary/staff
Sorrells, A. M., Rieth, H. J., & Sindelar, P.T. (2004). Critical issues in special education.
Boston, MA.: Pearson.
Speece, D., & Case, L. (2001). Classification in context: An alternative approach to
Identifying early reading disability. Journal of Educational Psychology, 93, 735-
749.
Strizek, G. A., Pittsonberger, J. L., Riordan, K. E., Lyter, D. M., & Orlofsky, G. F.
(2006). Characteristics of school districts, teachers, principals, and school
libraries in the United States: 2003-2004 schools and staffing survey (NCES
2006-313). Washington D.C.: National Center for Educational Statistics.
Retrieved from http://nces.ed.gov/pubs2006/2006313_1.pdf
Swanson, E., Solis, M., Ciullo, S., & McKenna, J.W. (2012). Special education teachers’
perceptions and instructional practices in response to intervention. Learning
Disability Quarterly 35(2), 115-126. doi: 10.1177/0731948711432510
Tabachnick, B. G., & Fidell, L. S. (2001). Using multivariate statistics. In B. H. Munro

218
(5th
ed.), Statistical methods for health care research, (pp. 48-49). Philadelphia,
PA: Lippincott Williams & Wilkins.
Tashakkori, A., & Teddlie, C. (2003). Handbook on mixed methods in the behavioral
and social sciences. Thousand Oaks, CA, Sage Publications.
Thompson, B., Diamond, K.E., McWilliam, R., Snyder, P., & Snyder, S.W. (2005).
Evaluating the quality of evidence from correlational research for evidence-based
practice. Exceptional Children 71(2). 181-194.
Tilly, W. D. (2002). Best practices in school psychology as a problem-solving enterprise.
In A. Thomas, & J. Grimes (Eds.), Best Practices in School Psychology-IV (pp.
21-36). Bethesda, MD: National Associations of School Psychologists.
United States Department of Education, Office of Special Education Programs
[US DOE OSEP] (2006). IDEA Regulations. Identification of specific learning
disabilities. Retrieved from
http://idea.ed.gov/explore/view/p/,root,dynamic,TopicalBrief,23
United States Department of Education, Office of Special Education Programs
[US DOE OSEP] (2004). A new era: Revitalizing special education for children
and families. Retrieved from
http://education.ucf.edu/mirc/Research/President's%20Commission%20on%20Ex
cellence%20in%20Special%20Education.pdf
United States Department of Labor, Occupational Outlook Handbook. (2011). Teachers-
special education teachers, nature of the work. Retrieved from
http://www.bls.gov/oco/ocos070.htm
University of California, Riverside (2013). Response to intervention certificate

219
[Website]. Retrieved from
http://www.extension.ucr.edu/academics/certificates/response_to_intervention.
VanDerHeyden, A. M., & Witt, J. C. (2005). Quantifying context in assessment:
Capturing the effect of base rates on teacher referral and a problem-solving
model of identification. School Psychology Review, 34, 161-183.
VanDerHeyden, A. M., Witt, J. C., & Gilbertson, D. (2007). A multi-year evaluation of
the effects of a response to intervention model on identification of children for
special education. Journal of School Psychology, 45, 225-256.
VanDerHeyden, A. M., Witt, J. C., & Naquin, G. (2003). The development and validation
of a process for screening referrals to special education. School Psychology
Review, 32, 204-227.
Vaughn, S. (2002). Using response to treatment for identifying students with learning
disabilities. In R. Bradley, L. Danielson, & D. Hallahan (Eds.),
Learning disabilities: Research to practice (pp. 549-554). Mahwah, NJ:
Lawrence Erlbaum.
Vaughn, S. (2011, April). Response to intervention (RTI) with secondary students. Panel
presentation at the National Council for Exceptional Children 2011 Convention &
Expo, National Harbor, MD.
Vaughn, S., Cirino, P.T., Wanzek, J., Wexler, J., Fletcher, J. M., Denton, C. D.,
…Francis, D. J. (2010). Response to intervention for middle
school students with reading difficulties: Effects of a primary and secondary
intervention. School Psychology Review, 39(1) 3-21.
Vaughn, S., & Fuchs, L. S. (2003). Redefining learning disabilities as inadequate

220
response to instruction: The promise and potential problems. Learning
Disabilities Research and Practice, 18(3), 137-146.
Vaughn, S., Linan-Thompson, S., & Hickman, P. (2003). Response to intervention as a
means of identifying students with reading/learning disabilities. Exceptional
Children, 69, 391-409.
Wanzek, J., & Vaughn, S. (2010). Tier 3 interventions for student s with significant
reading problems. Theory Into Practice, 49, 305-314. doi: 10.1080.00405841
Werts, M. G., Lambert, M., & Carpenter, E. (2009). What special education directors say
about RtI. Learning Disability Quarterly, 32, 245-254.
Wheeler, D. (July, 13, 2007). Emotional/behavioral disabilities rule 6A-6.03016 EBD
informational meeting. Presentation at Bureau of Exceptional Education and
Student Services, Tallahassee, FL.

221
Appendix A
Permission Electronic mail (Email) to Assistant Superintendent of RtI/MTSSS
Sample Email
Dear Mr. Oswald,
I am seeking your permission to address the secondary Response to Intervention
(RtI)/School Based Team (SBT) Leaders at the next secondary RtI/SBT leaders meeting.
As a student in the Leadership and Exceptional Student Doctoral Program, my research
interest is in the area of secondary RtI and Multi-Tiered Systems of Student Support
(MTSSS). The title of my study is: Response to Intervention: Beliefs, Practices, and
Skills in Urban Secondary Staff.
The following are the instruments adapted from the University of South Florida Problem
Solving Project. The instruments include: Demographics questions (4 questions), Beliefs
Survey (22 Likert scale questions), Perceptions of RtI Skills Survey (25 Likert scale
questions), and Perceptions of Practices (21 Likert scale questions) 72 total questions. I
have uploaded the survey to SurveyMonkeyTM. In a pilot test, it took participants no
longer than 15 minutes to complete the survey. Please find a copy of the survey attached
to this email.
In my presentation to the SBT members, I would be asking them to take the flyer about
the survey back to their secondary schools to distribute to their faculties and to post it on
the announcement boards in the staffs’ mailrooms. Please find a copy of the survey
request information attached to this email.
Thank you in advance for your consideration,
Jennifer J. Lesh
561-373-9082

222
As per my conversation with you (Mr. Oswald & Mr. Glinton) earlier this week please find
attached my plan for accessing participants for my dissertation as well as the instruments I am
going to use for the survey, and the flyer to do so. I still have to be approved by Barry
University's Institutional Review Board, and then I know it must go before our school district's
Research and Evaluation department. But I just wanted to you to be aware of what I am
proposing to do.
Thank you in advance for your consideration,
Sincerely,
Jennifer

223
Appendix B
Research
Study participants needed
For Online Survey
Jennifer Lesh, a doctoral student at
Barry University, ADSOE
Who
Secondary Faculty & Staff: volunteers to complete the Response to Intervention (RtI)/Multi-tiered Systems of Support
(MTSS) Beliefs, Practices & Skills Survey What
Responding to a 15 minute online survey regarding their RtI/MTSS Beliefs, Practices & Skills.
Title
Title: Response to Intervention: Beliefs, Practices, and Skills in Urban
Secondary
Staff Benefits and Risks
Benefits & Risks: THIS SURVEY IS STRICTLY VOLUNTARY
This survey is completely anonymous.
There are minimal risks, such as possible stress from answering questions
regarding school issues. At any time, participants can exit the survey and
choose not to participate. Choosing not to participate will not affect
your employment with the school district. There are no benefits;
however, participants may enjoy answering questions regarding their
work. By participating in the study, you will be benefiting research in the
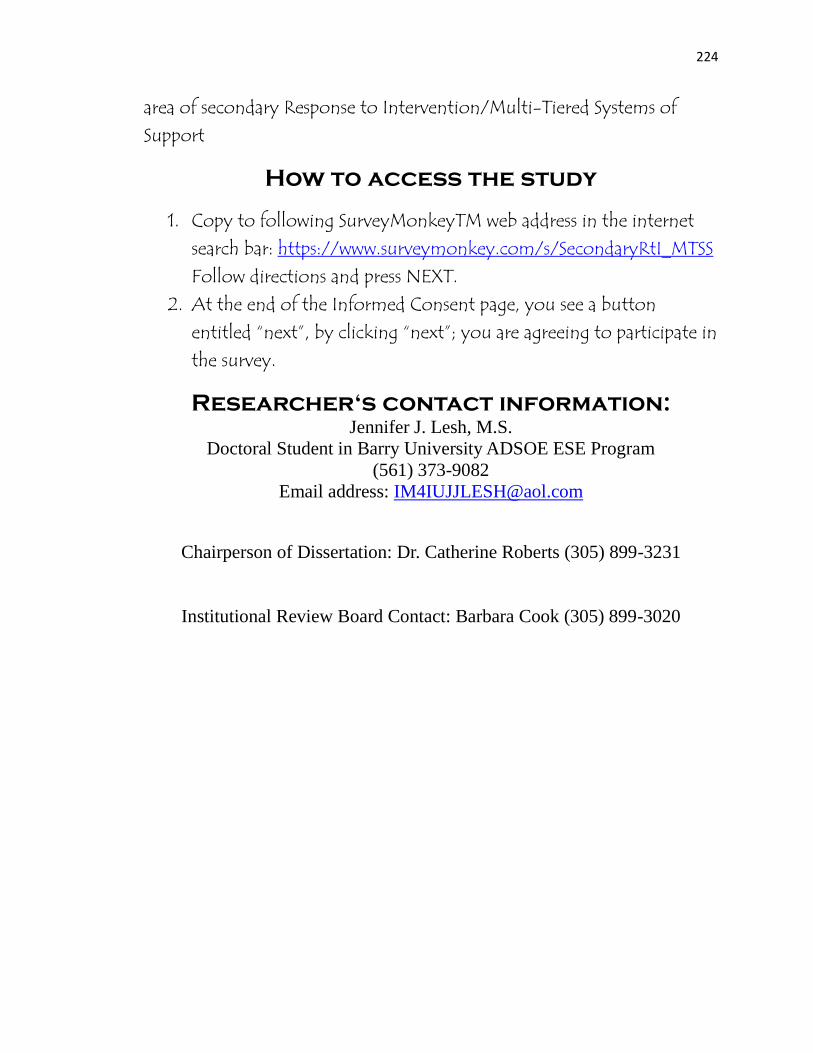
224
area of secondary Response to Intervention/Multi-Tiered Systems of
Support
How to access the study
1. Copy to following SurveyMonkeyTM web address in the internet
search bar: https://www.surveymonkey.com/s/SecondaryRtI_MTSS
Follow directions and press NEXT.
2. At the end of the Informed Consent page, you see a button
entitled “next”, by clicking “next”; you are agreeing to participate in
the survey.
Researcher‘s contact information:
Jennifer J. Lesh, M.S.
Doctoral Student in Barry University ADSOE ESE Program
(561) 373-9082
Email address: [email protected]
Chairperson of Dissertation: Dr. Catherine Roberts (305) 899-3231
Institutional Review Board Contact: Barbara Cook (305) 899-3020
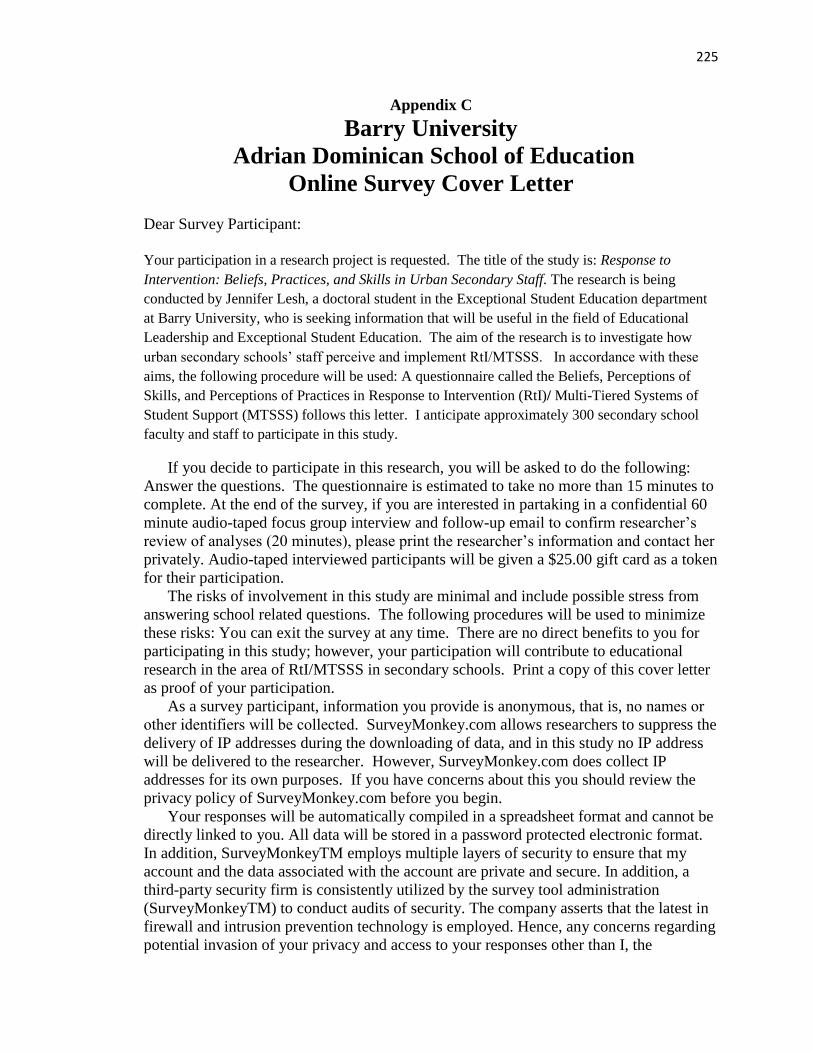
225
Appendix C
Barry University
Adrian Dominican School of Education
Online Survey Cover Letter
Dear Survey Participant:
Your participation in a research project is requested. The title of the study is: Response to
Intervention: Beliefs, Practices, and Skills in Urban Secondary Staff. The research is being
conducted by Jennifer Lesh, a doctoral student in the Exceptional Student Education department
at Barry University, who is seeking information that will be useful in the field of Educational
Leadership and Exceptional Student Education. The aim of the research is to investigate how
urban secondary schools’ staff perceive and implement RtI/MTSSS. In accordance with these
aims, the following procedure will be used: A questionnaire called the Beliefs, Perceptions of
Skills, and Perceptions of Practices in Response to Intervention (RtI)/ Multi-Tiered Systems of
Student Support (MTSSS) follows this letter. I anticipate approximately 300 secondary school
faculty and staff to participate in this study.
If you decide to participate in this research, you will be asked to do the following:
Answer the questions. The questionnaire is estimated to take no more than 15 minutes to
complete. At the end of the survey, if you are interested in partaking in a confidential 60
minute audio-taped focus group interview and follow-up email to confirm researcher’s
review of analyses (20 minutes), please print the researcher’s information and contact her
privately. Audio-taped interviewed participants will be given a $25.00 gift card as a token
for their participation.
The risks of involvement in this study are minimal and include possible stress from
answering school related questions. The following procedures will be used to minimize
these risks: You can exit the survey at any time. There are no direct benefits to you for
participating in this study; however, your participation will contribute to educational
research in the area of RtI/MTSSS in secondary schools. Print a copy of this cover letter
as proof of your participation.
As a survey participant, information you provide is anonymous, that is, no names or
other identifiers will be collected. SurveyMonkey.com allows researchers to suppress the
delivery of IP addresses during the downloading of data, and in this study no IP address
will be delivered to the researcher. However, SurveyMonkey.com does collect IP
addresses for its own purposes. If you have concerns about this you should review the
privacy policy of SurveyMonkey.com before you begin.
Your responses will be automatically compiled in a spreadsheet format and cannot be
directly linked to you. All data will be stored in a password protected electronic format.
In addition, SurveyMonkeyTM employs multiple layers of security to ensure that my
account and the data associated with the account are private and secure. In addition, a
third-party security firm is consistently utilized by the survey tool administration
(SurveyMonkeyTM) to conduct audits of security. The company asserts that the latest in
firewall and intrusion prevention technology is employed. Hence, any concerns regarding
potential invasion of your privacy and access to your responses other than I, the
226
investigator should be allayed due to these protections. I trust you feel confident to
answer the attached survey questions as honestly as you can.
This survey is strictly voluntary; at any time participants can exit the survey (in the
upper right hand corner of the page) and choose not to participate. Choosing not to
participate will not affect their employment with the school district. There are minimal
risks, such as possible stress from answering questions regarding school issues. There
are no benefits; however, participants may enjoy answering questions regarding their
work. They will also be benefiting research in the area of secondary Response to
Intervention (RtI)/Multi-Tiered Systems of Student Support (MTSSS).
By clicking on the “Next” button below and by submitting a completed survey, you are
giving permission to use your data record in this study. Participant must click on the
"Next" button or the "Exit Survey" button, located in the upper right hand corner of the
page. Once the “Next” button is clicked, the participant is directly linked to the Survey. If
you click on the “Exit Survey” button, you will immediately exit this site.
If you have any questions or concerns regarding the study or your participation in the
study, you may contact me, Jennifer Lesh, by phone at (561)373-9082 or by email at
You may also contact the Institutional Review Board point of contact, Barbara Cook, by
phone at (305) 899-3020 or by email at [email protected].
Thank you for your participation.
Sincerely,
Jennifer J. Lesh, M.S.
Print this page if you need proof of participation.
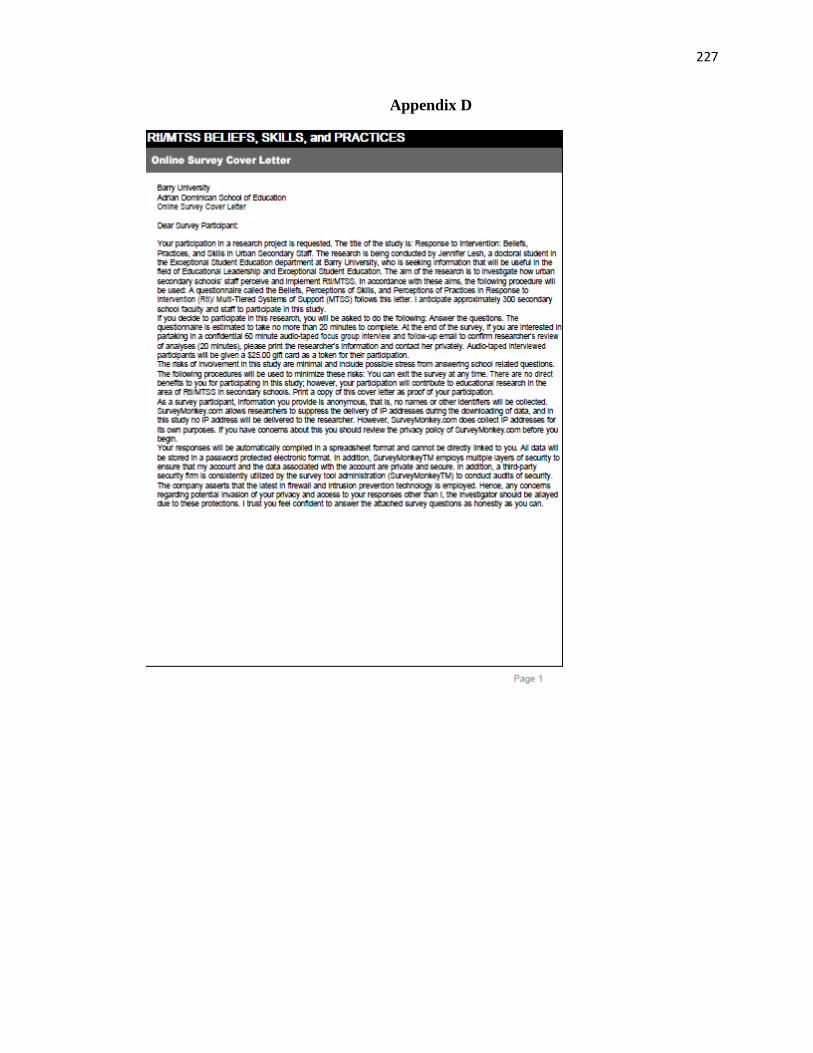
227
Appendix D

228

229
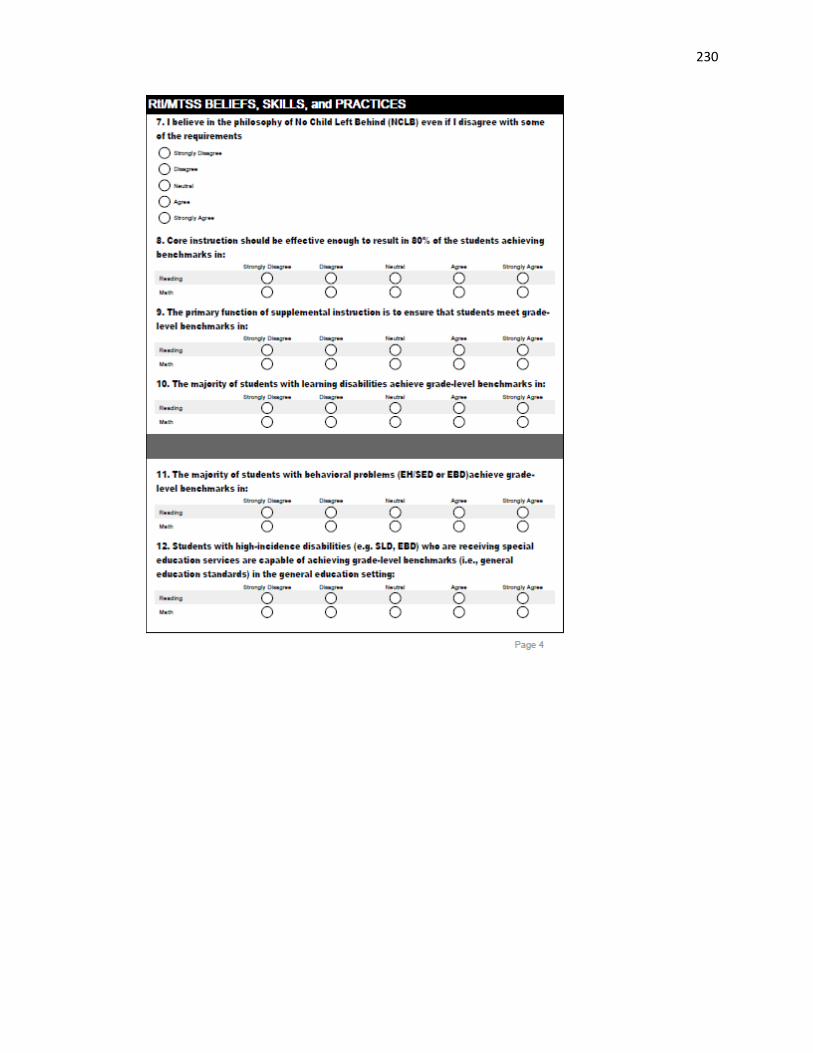
230

231
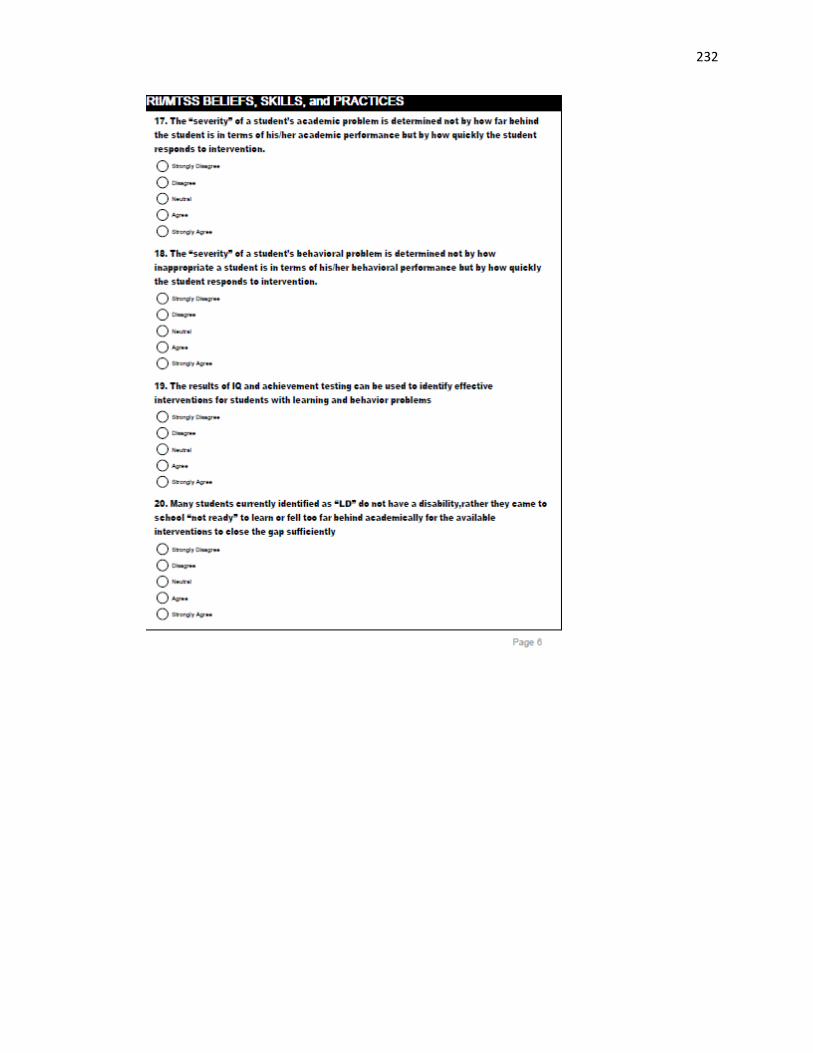
232

233
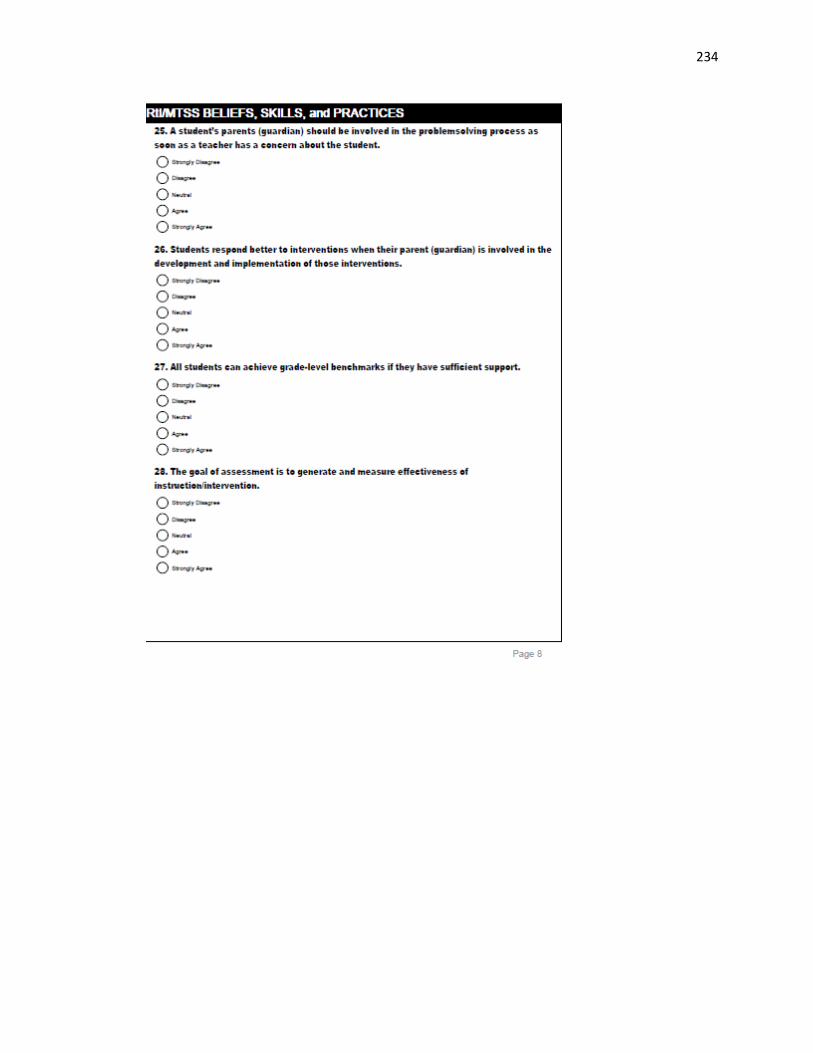
234

235

236

237

238
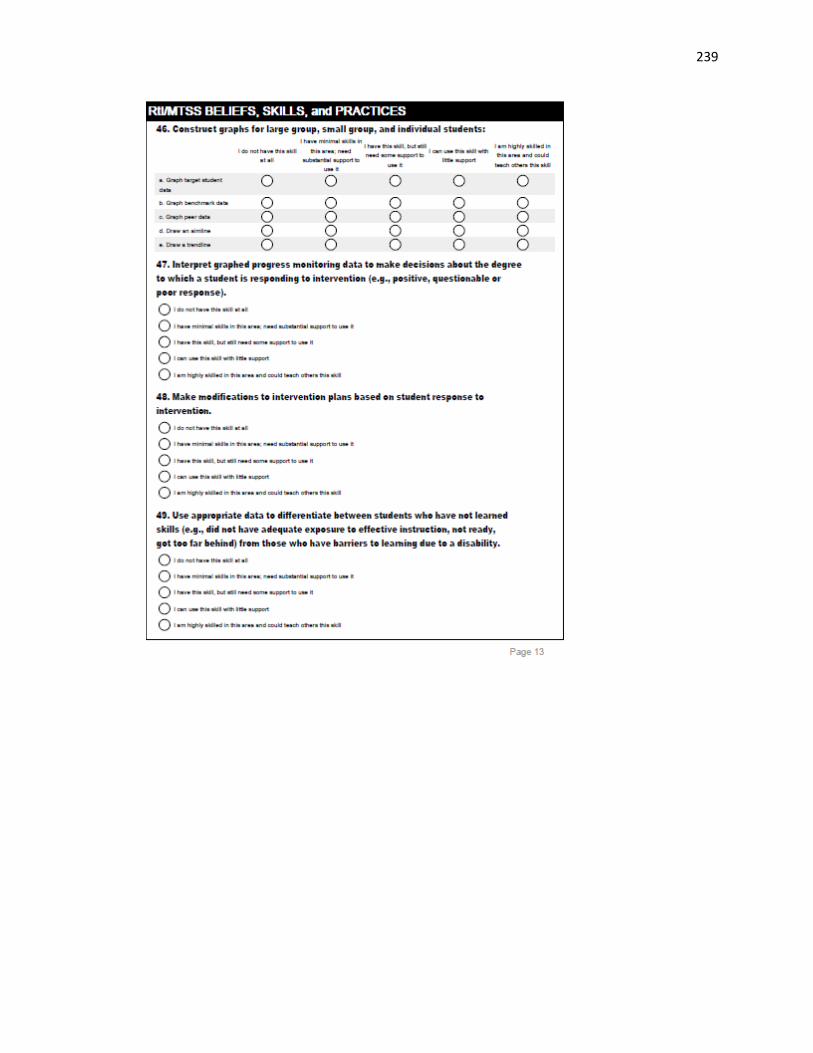
239

240

241

242

243
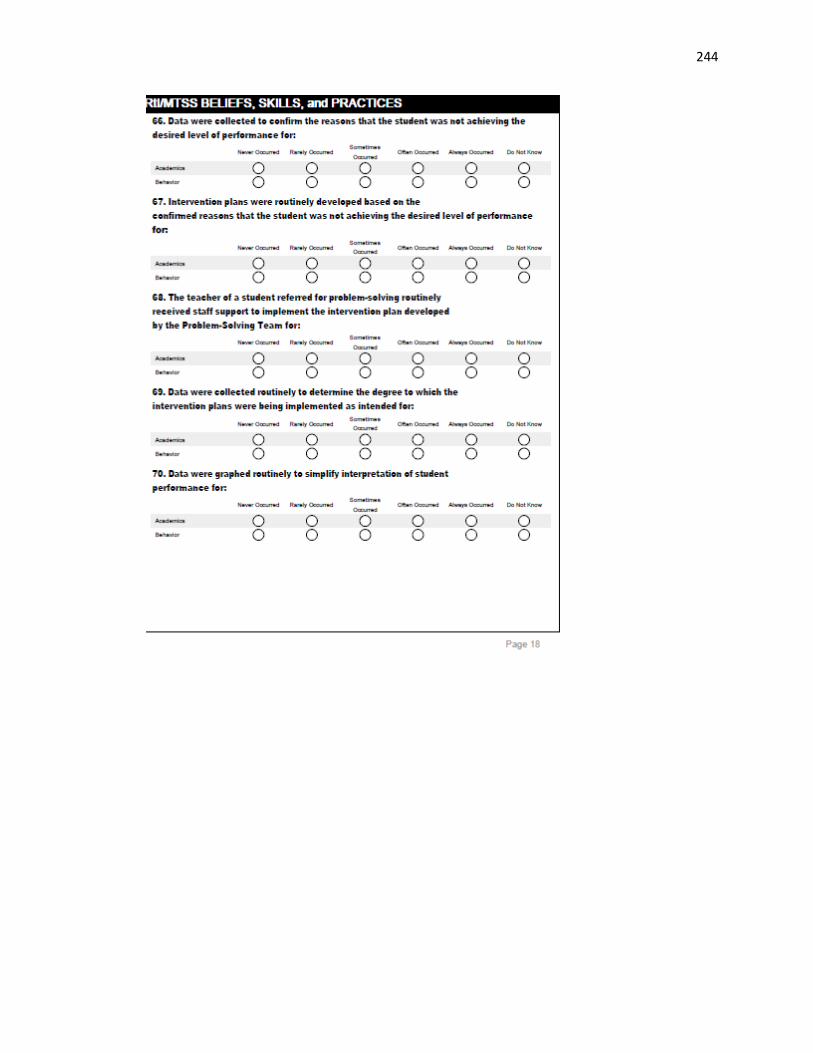
244

245

246

247
Appendix E
THANK YOU FOR COMPLETING THE SURVEY!
Research
Study participants needed for
Focus Group Interviews
Who
Secondary Faculty & Staff: Those who have completed the RtI/MTSSS Beliefs, Skills & Practices Survey
What
Survey participants willing to participate in a 60 minute audio-taped focus group interview with researcher. And an additional 20 minutes
after the initial focus group interview to review analyses of your responses via email communication with researcher.
Title
Title: Response to Intervention: Beliefs, Skills, and Practices in Urban Secondary Staffs
Benefits and Risks
Benefits: Participants may appreciate the opportunity to tell their beliefs, practices and skills about RtI/MTSSS. In addition, their participation may
help educators understand what secondary faculties and staffs believe about the beliefs, practices and skills regarding RtI/MTSSS. The number of participants will be 18, but researcher will take all that respond to this flyer. All survey participants are welcome. Participants will be offered a $25.00 gift card after completing audio-taped focus group interview.
Risks: While risks to the confidentiality cannot be assured, the researcher anticipates minimal risks involved with participating in this study.

248
Researcher‘s contact information:
Jennifer J. Lesh, M.S.
Doctoral Student in Barry University ADSOE ESE Program
(561) 373-9082
Email address: [email protected]
Chairperson of Dissertation: Dr. Catherine Roberts (305) 899-3231
Institutional Review Board Contact: Barbara Cook (305) 899-3020

249
Appendix F
Barry University
Focus Groups Interview
Informed Consent Form
Your participation in a research project is requested. The title of the study is
Response to Intervention: Beliefs, Skills, and Practices in Urban Secondary Staff. The
research is being conducted by Jennifer Lesh, a student in the Exceptional Student
Education department at Barry University, who is seeking information that will be useful
in the field of Educational Leadership and Exceptional Student Education. The aims of
the research are to investigate and explain how urban secondary schools perceive and
implement RtI. In accordance with these aims, the following procedures will be used:
participants who choose to partake in this portion of the study will be asked to arrange a
time and place convenient for them to be interviewed. In order to protect confidentiality,
both the participants and their schools will be given pseudonyms. However, the
confidentiality cannot be assured. The researcher guarantees to maintain confidentiality,
but given the nature of focus groups, cannot guarantee the other members will maintain
confidentiality. The researcher will then conduct a 60 minute audio-taped focus group
interviews. You will be able to request that the audio-taped be stopped and resumed at
any point in the interview. After the researcher’s analyses, you will be asked to check
your responses via email and confirm them with the researcher’s interpretations. The
review of analyses should take no longer than 20 minutes. The researcher anticipates the
number of participants to be approximately 18.
Your consent to be a research participant is strictly voluntary and should you decline
to participate or should you choose to drop out at any time during the study, your data,
transcripts and audio-tape will be destroyed. Also, there will be no adverse effects on
your employment.
The risks of involvement in this study are minimal but may include stress related to
answering questions about educational beliefs, practices, and skills. The following
procedures will be used to minimize these risks: researcher will be empathetic toward
you and if you feel uncomfortable completing the survey you may ask the researcher to
destroy your audio-tape and transcripts immediately. You may however find benefit in
answering questions regarding RtI/MTSSS, and your participation in this study may help
educators’ understanding of RtI/MTSSS at the secondary level.
As a research participant, information you provide will be held in confidence to the
extent permitted by law. Any published results of the research will refer to group
averages only and no names will be used in the study. Data will be kept in a locked file
in the researcher's office. The audio-tapes will destroyed immediately after the
researcher’s transcription and transcriptions will be kept in a different locked cabinet and
the key of names and pseudonyms will be kept separate from transcriptions. All
transcriptions will be destroyed five years after the completion of the study. Only the
researcher will have access to the information collected. A pseudonym, which is not
similar or does not in any way identify the participant, will be assigned to the participant

250
and school. Your signed consent form will be kept separate from the data.
If you have any questions or concerns regarding the study or your participation in the
study, you may contact me, Jennifer Lesh, at (561) 373-9082, the Chairperson of my
dissertation committee, Dr. Roberts, at (305) 899-4829, my supervisor.
You may also contact the Institutional Review Board point of contact, Barbara Cook,
at (305)899-3020. If you are satisfied with the information provided and are willing to
participate in this research, please signify your consent by signing this consent form.
Voluntary Consent I acknowledge that I have been informed of the nature and purposes of this study by
Jennifer Lesh and that I have read and understand the information presented above, and
that I have received a copy of this form for my records. I give my voluntary consent to
participate in this experiment.
_____________________ __________
Signature of Participant Date
_____________________ __________ ______________________
_________
Researcher Date Witness Date (Witness signature is required only if research involves pregnant women, children, other vulnerable populations, or if
more than minimal risk is present.)

251
Appendix G

252
253
Appendix H

254