response of zooplankton to improving water quality in the
TRANSCRIPT
HAL Id: hal-00994778https://hal.archives-ouvertes.fr/hal-00994778
Submitted on 22 May 2014
HAL is a multi-disciplinary open accessarchive for the deposit and dissemination of sci-entific research documents, whether they are pub-lished or not. The documents may come fromteaching and research institutions in France orabroad, or from public or private research centers.
L’archive ouverte pluridisciplinaire HAL, estdestinée au dépôt et à la diffusion de documentsscientifiques de niveau recherche, publiés ou non,émanant des établissements d’enseignement et derecherche français ou étrangers, des laboratoirespublics ou privés.
Response of zooplankton to improving water quality inthe Scheldt estuary (Belgium)
Benoit Mialet, Jérémy Gouzou, Frédéric Azémar, Tom Maris, ClaudineSossou, Nassima Toumi, Stefan van Damme, Patrick Meire, Micky Tackx
To cite this version:Benoit Mialet, Jérémy Gouzou, Frédéric Azémar, Tom Maris, Claudine Sossou, et al.. Response ofzooplankton to improving water quality in the Scheldt estuary (Belgium). Estuarine, Coastal andShelf Science, Elsevier, 2011, vol. 93, pp. 47-57. �10.1016/j.ecss.2011.03.015�. �hal-00994778�

To cite this version :
Mialet, Benoit and Gouzou, Jérémy and Azémar, Frédéric and Maris,
Tom and Sossou, Claudine and Toumi, Nassima and Van Damme,
Stefan and Meire, Patrick and Tackx, Micky Response of zooplankton
to improving water quality in the Scheldt estuary (Belgium). (2011)
Estuarine, Coastal and Shelf Science, vol. 93 (n° 1). pp. 47-57. ISSN
0272-7714
Open Archive TOULOUSE Archive Ouverte (OATAO) OATAO is an open access repository that collects the work of Toulouse researchers and
makes it freely available over the web where possible.
This is an author-deposited version published in : http://oatao.univ-toulouse.fr/
Eprints ID : 11579
To link to this article : DOI:10.1016/j.ecss.2011.03.015
URL : http://dx.doi.org/10.1016/j.ecss.2011.03.015
Any correspondance concerning this service should be sent to the repository
administrator: [email protected]

Response of zooplankton to improving water quality in the Scheldtestuary (Belgium)
B. Mialet a,b,*, J. Gouzou a,b, F. Azémar a,b, T. Maris c, C. Sossou a,b, N. Toumi a,b, S. Van Damme c,P. Meire c, M. Tackx a,b
aUniversité de Toulouse, INP, UPS, EcoLab (Laboratoire Ecologie Fonctionnelle et Environnement), 118 Route de Narbonne, 31062 Toulouse, FrancebCNRS, EcoLab, 31062 Toulouse, FrancecUniversity of Antwerp, Department of Biology, Ecosystem Management Research Group, Universiteitsplein 1C, B-2160 Wilrijk, Belgium
Keywords:
estuariesrestorationScheldtspatio-temporal distributionwater pollutionzooplankton
a b s t r a c t
Data obtained from 14 years of monthly samplings (1996e2009) were used to investigate the response ofthe crustacean zooplankton community to improving water quality in the Scheldt estuary. A strongreduction of poor water quality indicators, such as NH4
þ and BOD5, as well as an increase in oxygen andin chlorophyll a concentrations were observed during the study period. During the study period,important changes were observed in the zooplankton community composition and spatial distribution.From 2007 onwards, most of the calanoid population, previously mainly found in the brackish waterreach of the estuary, moved to the freshwater, where they reached higher abundances than previouslyobserved. Simultaneously, cyclopoids populations strongly decreased in freshwater while cladoceransdid not change their abundance, except during years with high chlorophyll a concentrations. Redundancyanalyses (RDA) showed that the variability within the calanoid population can be explained by theimprovement in water quality. Variability within the cyclopoids and cladoceran community is mainlyexplained by chlorinity and chlorophyll a concentrations. Their presence in the most polluted upstreamarea until 2007 suggests they are more tolerant to poor water quality than calanoids. Several hypothesesto explain the disappearance of cyclopoids after the move of calanoids to the freshwater are presentedand discussed.
1. Introduction
Recent decades have seen an increasing realisation of the needfor maintenance of functional and diverse ecosystems in turnleading to restoration efforts on both terrestrial and aquaticsystems. The response of organisms to restoration is important formanagement and several types of organisms have been long usedto assess water quality. However, to date, in contrast to the effects ofdegradation, the biotic response to restoration is less well-knownand poorly predictable (Hering et al., 2010). Because of theirnatural “funnel” function between land and ocean and intensivehuman use, estuaries are among the most polluted systemsworldwide (Dame et al., 2000; Borja et al., 2010; Meng and Liu,2010). Rates of ecosystem recovery are dependant on the type ofstress applied and most estuaries suffer from multi-stress
degradation. Restoration efforts in estuaries are relatively recent,indeed several recent papers on estuaries report ongoing pollutionrather than restoration, for example the Neuse River and SkidawayRiver estuaries (Paerl et al., 2004; Verity and Borkman, 2010). Atpresent there is little information on the link between (types of)restoration efforts and responses of various estuarine organisms(Borja et al., 2010). Biotic water quality indicators traditionallyinvolve the benthos, phytoplankton and macrophytes, andzooplankton is generally less considered when studying biologicalresponses to restoration. The labour intensity of studyingzooplankton in turbid systems such as estuaries has furtherreduced studies following response of estuarine zooplankton torestoration. For European systems, the fact that zooplankton is notincluded in the Water Framework Directive (WFD) has contributedto this paucity despite the response of zooplankton towater qualitydegradation such as eutrophication being known for estuaries(Verity and Borkman, 2010) suggesting that in reverse, zooplanktonis likely to respond to water quality improvement. In freshwatersystems, the response and potential pivotal role of zooplankton tothe outcome of restoration scenarios has been amply documented
* Corresponding author. Université de Toulouse, INP, UPS, EcoLab (LaboratoireEcologie Fonctionnelle et Environnement), 118 Route de Narbonne, 31062 Toulouse,France.
E-mail address: [email protected] (B. Mialet).
doi:10.1016/j.ecss.2011.03.015

by both field and modelling studies (e.g. Mazumder, 1994;Benndorf, 1995; Zhao et al., 2008; Chen et al., 2009; Peretyatkoet al., 2009; Tadonleke et al., 2009).
The present paper indicates the response of the crustaceanzooplankton (copepods and cladocerans) to improving water qualityin a temperate estuary. The Scheldt estuary (Belgium/TheNetherlands) is one of the few European estuaries that still have anextensive freshwater tidal zone (salinity< 0.5) in its upper reaches(Meireet al., 2005).Havingadrainagebasinwhich isheavily impactedby anthropogenic activity, the Scheldt was considered as one of themost polluted systems in Europe during the second half of the 20thcentury, especially in its freshwater part (Heip, 1988; Baeyens et al.,1998). As a result of substantial emission reduction effortsthroughout the watershed, water quality of the Scheldt estuary hassubstantially improved in the last 2 decades (VanDammeet al., 2005;Cox et al., 2009). Since 1996, this restoration process has beenmonitored by the multi-disciplinary programme “OMES”. The aim isto detect physico-chemical changes occurring in the Scheldt estuaryand to relate them to management efforts and future managementissues, with a focus on their interaction with biotic communities. Inthis context, we hypothesise whether zooplankton (crustaceans androtifers) can detect if the ongoing restoration process influences theirabundance, community composition and spatio-temporal distribu-tion pattern. Such changes may be important to the intra- and inter-specific competition within the zooplankton community and to thetrophic web structure of the estuary. This is also of relevance to thebioindicator potential of the zooplankton community or of certaintaxa within this community.
This paper considers abundance data at phylum level for cope-pods (cyclopoids, calanoids and harpacticoids) and at genera levelfor cladocerans during the 1996e2009 period. The spatio-temporalevolution of this community is related to the changes in the envi-ronmental conditions occurring during this period in the Scheldtestuary. The dominant calanoid copepod species, Eurytemora affinis,is considered separately, in viewof its recently reported response toimproving water quality between 1996 and 2007 in the Scheldtestuary (Mialet et al., 2010).
2. Material and methods
2.1. Study site and data on zooplankton
The Scheldt estuary originates in northern France and runsthrough Belgium to join the North Sea at Vlissingen in theNetherlands (Fig. 1). In contrast to most other temperate estuaries,the Scheldt estuary is characterized by a vertically well-mixedwater column (Baeyens et al., 1998), showing little salinity orcurrent stratification (Heip, 1988). Within the framework of theOMES project, samples have been taken monthly at 16 stations(Fig. 1) from 1996 until present, with an interruption between2000 and 2002. All stations are situated in the brackish(salinity> 0.5 and 12) and freshwater part (salinity< 0.5) of theestuary (Fig. 1).
2.2. Sampling and analysis
At each station, surface water samples were collected in themiddle of the estuary throughout the entire studied period, usingbucket hauls from the vessel. A set of environmental variables weremeasured: 5-day biochemical oxygen demand (BOD5) was esti-mated using a WTW OXI 96 oxymeter; pH and temperature weremeasured using a CONSORT C832 electrode and dissolved oxygenconcentration (O2) a WTWOXI 325, equipped with Clark electrode.Samples were taken for the determination of the concentrations ofchlorine (Cl"), ammonium (NH4
þ-N), nitrates (NO3"-N), nitrites
(NO2"-N), and orthophosphates (PO4-P) within 24 h after
sampling. They were stored at 4 #C, and analyzed colorimetricallyusing a SKALAR SA 5100 segmented flow analyzer. Suspendedparticular matter (SPM) samples were filtered on pre-combustedWhatman GF/C filters. From 1996 to 2001, Chlorophyll a (Chl a)samples were filtered on 45 mm Sartorius filters, extracted in 90%acetone and analyzed using reversed phase HPLC. Van Dammeet al. (1997, 2005) give further details on the methodologiesused. From 2002 to present, Chlorophyll a (Chl a) samples werefiltered over a 25 mm diameter Whatman GF/F glass fibre filter.
Fig. 1. Map of the Scheldt estuary with OMES sampling stations, designated by their distance, in km, upstream from Vlissingen (mouth). Dotted lines indicate limits between marinewater, brackish water and freshwater reaches. Grey arrows indicate the end of tidal influence in the Scheldt and tributaries (Bo: BovenScheldt, De: Dender, Du: Durme, Ru: Rupel).
Pigments were then extracted and analyzed by HPLC according tothe method of Wright and Jeffrey (1997). More details on themethodologies used are presented in Lionard et al. (2008).
The Flemisch Administration for Waterways and MaritimeAffairs provides daily discharge measures (Q) of the BovenScheldt,the Dender and the Rupel. The upstream discharge data at thesestations were used to estimate downstream discharge, taking intoaccount all the physical and geomorphological characteristics of theScheldt estuary (depth, width and relative percentage of eachaffluent in the total discharge). Daily average discharges for 68 kmat the sampling dates are used in our data set. This station is locateddownstream in the study area and integrates discharge values ofupstream stations.
For zooplankton sampling, a volume of 50 l of surface water wascollected at each station using bucket hauls and filtered througha 50 mm net. The collected zooplankton were anaesthetised withcarbohydrated water and subsequently fixed in a formaldehydesolution (4% final concentration). Samples were analyzed withstereomicroscope (90$ magnification) for zooplankton taxacomposition and abundance. For some years (1996, 1997, 1998,2002) data on the abundance are available for all 16 stations. Forthe other years, zooplankton sampling was limited to 6 stations(57.5, 78.5, 98, 121.5, 140 and 155 km) and hence abundance dataare only available for these stations.
2.3. Data analysis
Spatio-temporal trends in the zooplankton community, andtheir relationships to above-cited environmental factors (BOD5, Chla, Cl", NH4
þ-N, NO3"-N, NO2
"-N, PO4-P, O2, pH, SPM, T, Q) wereanalyzed using multivariate statistics. The environmental factorsused are known to be important in structuring the Scheldtzooplankton community (Tackx et al., 2004), and most of themhave changed in recent years. Taxa abundance data were log(xþ 1)transformed prior to multivariate analysis to obtain a normaldistribution. The data contained 1184 samples, 24 taxa and 12environmental factors.
The CANOCO software package, version 4.5 (ter Braak, 1987,1994) was used. The modality of the environmental factors wasfirst analyzed by a Detrended Correspondence Analysis (DCA),using detrending by segments and downweighting for rarespecies. As the total inertia observed was less than 2.6,a predominance of linear species response curves could beexpected; therefore a Principal Components Analysis (PCA) wasused to investigate the relationships among environmental factors(ter Braak and Smilauer, 2002). Then the same DCA for the taxadistribution was performed. As for the environmental factors, thetotal inertia observed was less than 2.6, and so a redundancyanalysis (RDA) was used to investigate the relationships betweenenvironmental factors and taxa composition. Forward selection ofvariables was used to select those most closely associated with thespatio-temporal structure of the zooplankton taxa, and to quantifytheir relative importance. The statistical significance was testedwith Monte Carlo permutation tests (499 unrestricted permuta-tions) (p< 0.05) and a Bonferroni correction for multiple test wasapplied. The minimum model so obtained explains the distribu-tion without colinear extra fitting. For each analysis, the varianceexplanation of each environmental variable (marginal effect), andtheir additional variance explained when included in the model(conditional effect) (ter Braak and Smilauer, 2002) were alsoshown. More specific details about this method are given inBorcard et al. (1992).
Nonparametrical tests and boxplot graphs were performedwithStatistica 6 (version 6.0; Statsoft Inc., Tulsa, USA).
3. Results
3.1. Changes in water quality during the studied period
The evolution of the environmental variables is shown for thebrackish and the freshwater areas separately, using the salinity of0.5 to distinguish the zones (Fig. 2, Table 1). Annual mean BOD5,NH4
þ-N and PO4-P (proxy for organic pollution), as well as NO2"-N,
showed a substantial decrease, especially in the freshwater part.NO3
"-N tended to decrease in brackish water while it increased infreshwater. Chl a concentration showed no clear tendency withtime but increased in freshwater from 2000 to 2004, reachinga maximum annual mean value of 147 mg l"1, then decreasedregularly to an annual mean value of 74 mg l"1 in 2009. O2
concentration increased in both reaches. SPM showed no gradientin the brackish water reach but increased in the freshwater reach(Fig. 2, Table 1). Along the studied period, for most factors associ-ated with water quality (BOD5, NH4
"-N, NO2"-N, PO4-P, O2), the
values observed in the freshwater reach approached the rangeobserved in the brackish reach.
In both zones, considered over the entire 1996e2009 period,Q and T showed no tendency with time, but Q increased stronglyduring the first half of the study period and decreased after that.Cl", as correlated with Q (p< 0.001, Spearman rank test betweenannual mean values) showed the opposite trend with time.
3.2. Changes in zooplankton distribution during the 1996e2009
study period
The evolution of the abundance of planktonic taxa considered(Figs. 3 and 4) shows that few crustaceans were observed in thebrackish water zone, except calanoids. Between 1996 and 2006,Eurytemora affinis was observed mainly downstream of 98.5 kmand during spring, reaching a maximal monthly mean abundanceof 3250 indm"3 during April 2004, considering the entire transect(Fig. 3). E. affinis was occasionally found in freshwater, in relativelow abundances. Its freshwater abundance increased significantlyfrom 1996 to 2009, especially from 2007 onwards (Fig. 4; Table 1),reaching a monthly mean abundance of 27 900 indm"3 duringMarch 2009 (Fig. 3). This increase was associated with an upstreamspreading of populations up to 155 km. Moreover, since 2007E. affinis was also present during summer in the freshwater zone,but not in the brackish water zone.
Other calanoids essentially followed the same evolution asEurytemora affinis (Fig. 3). Between 1996 and 2006, they werefound mainly in freshwater water during winter (Eudiaptomus gra-
cilis) and inbrackishwaterduring summer (Acartia tonsa) in relativelylow abundance (Figs. 3 and 4). From 2007 to 2008, an importantincrease in abundance (Fig. 4; Table 1) and a spreading toward theupstream reach (Fig. 3) were observed. However, they were found invery low numbers in the study area during 2009 (Fig. 4).
Cyclopoids were typically observed in the freshwater zoneupstream from 78.5 km (Fig. 3), mainly during late spring andsummer. They occurred in varying abundance between 1996and 2006 (Figs. 3 and 4) but their freshwater abundancedecreased significantly from 1996 to 2009 (Fig. 4; Table 1),especially from 2007 onwards. No spatial shift was observed forthese taxa (Fig. 3).
As with the cyclopoids, cladocerans also essentially inhabitedthe freshwater reach, upstream of 98.5 km, mainly during latespring and summer (Fig. 3). Along the study period, their fresh-water abundance varied most. However, a marked period of highabundance occurred in the freshwater zone between 2003 and2005 (Fig. 4), reaching maximum abundance in 2004.

3.3. Interactions between zooplankton community and water
quality
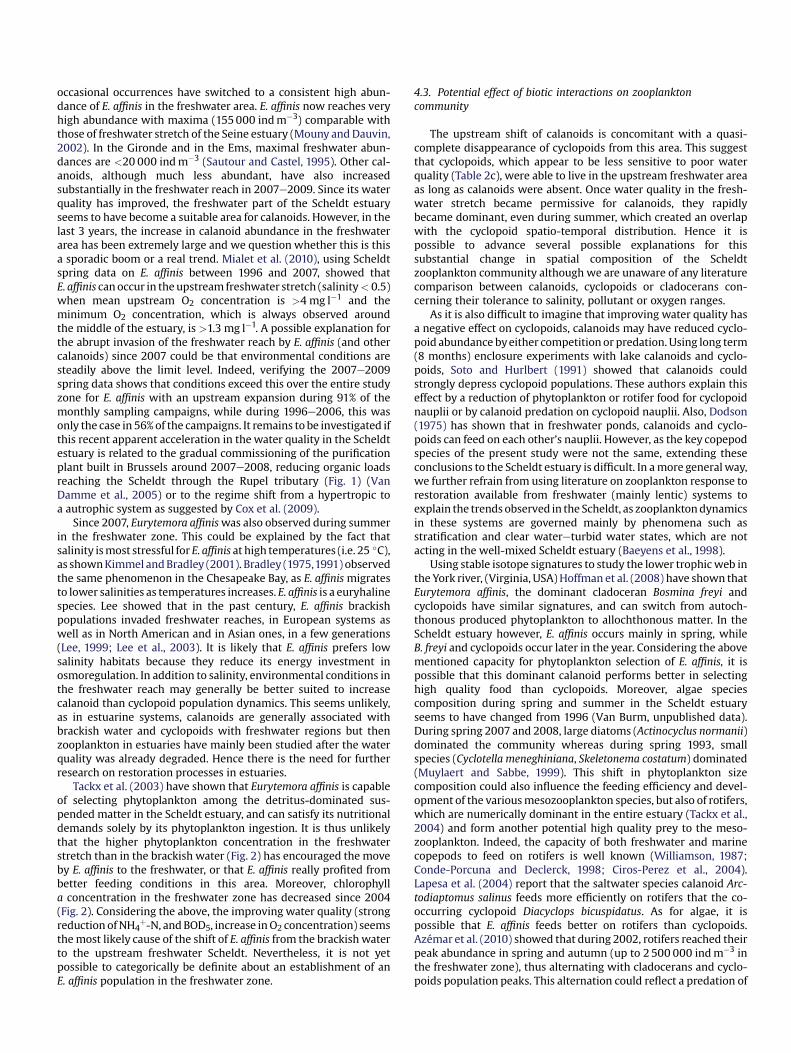
The first RDA, using all environmental factors, explained 27.5% ofthe total variance in the taxa distribution (Fig. 5). The taxa ordina-tion was first explained by Cl" (Table 2a) then by factors repre-senting low water quality (NO2
"-N, PO4-P, NH4"-N, BOD5). Other
factors appeared to play a minor role. The biplot shows a typicalestuarine setting,with Eurytemora affinis and other calanoids placedin the left hand side, positively correlated with Cl" and O2 concen-trations and negatively correlated with factors representing lowwater quality (see above). NO2
"-N, PO4-P, NH4"-N, BOD5, found in
the right-hand side of the biplot, are typical markers for the fresh-water area, wherewater quality is worse than in the brackish part ofthe estuary and Chl a concentrations are higher (Fig. 2). Cyclopoidsare placed on this right-hand zone, negatively correlated with Cl"
andpositively correlatedwithChl a concentration. Total cladoceransshowed the same correlations than cyclopoids, but genera showedvarious affinities, with some taxa more correlated with T (Illyoc-ryptus, Macrothrix), than others. Cladocerans were also associatedwith temperature, typically at maximum values during summermonths. Harpacticoid adults seem correlatedwith Cl". As theywereobserved in low numbers, essentially in the brackish water part, we
have chosen not to show results of an RDA based on this taxa (11.4%of the variance explained). Rare cladocerans genera and harpacti-coid copepodits are located in the centre of the diagram, with noparticular affinities with environmental variables.
Two additional RDAs have been specifically performed forbrackish water and freshwater groups (Table 2b, c). Their graphicrepresentations are not shown as they gave essentially the sameassociations between taxa and environmental factors. The first one(Table 2b) explained 27.1 percent of the total variance of all calanoidadults and copepodits. Their distribution is almost exclusivelynegatively correlated to factors associated with water quality(Fig. 5, Table 2b). Other factors, including Cl", do not appear toexplain their distribution (see conditional effects). The secondanalysis (Table 2c) explained 35.5% of the variance of cladocerans,cyclopoid adults and copepodits. The distribution of these fresh-water species was mainly explained by Cl" then by Chl a (Table 2c)with a positive correlation with Chl a (Fig. 5).
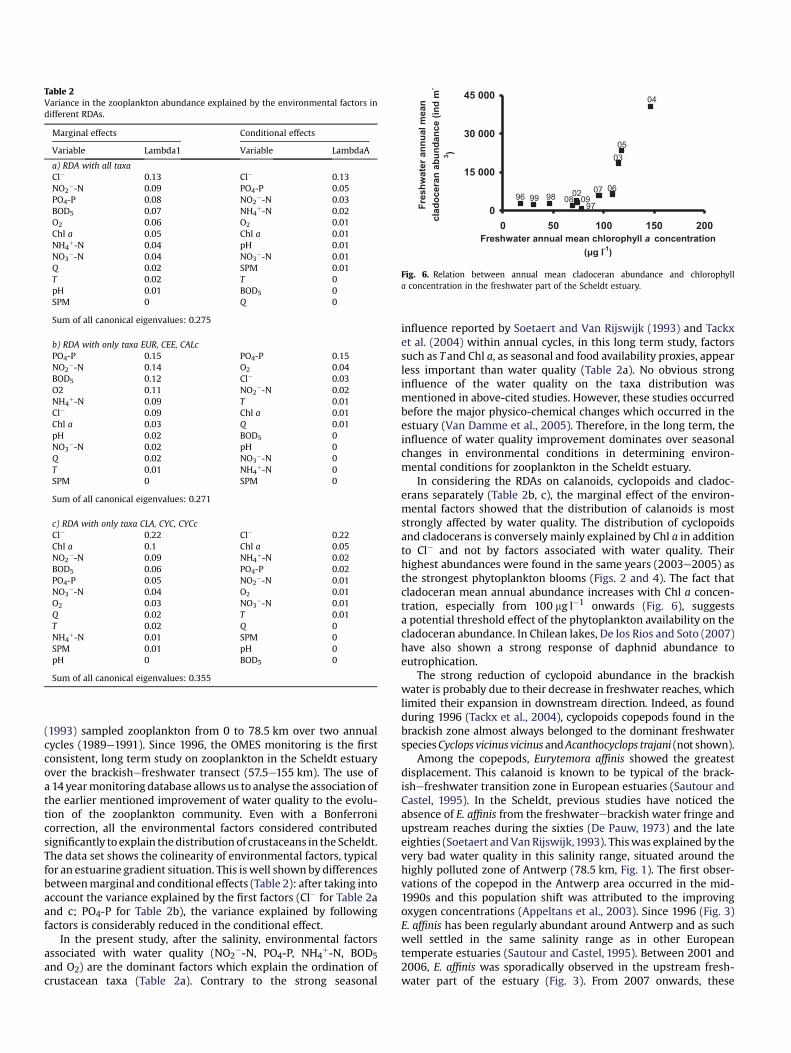
As can be seen from Figs. 2 and 5, during the study period, theabundance of cladocerans in freshwater followed the same patternas chlorophyll a concentration. Fig. 6 confirms an increase in meanannual cladoceran abundance with mean annual chlorophylla concentration (spearman rank test p< 0.001). This increase wasparticularly strong from 100 mg Chl a l"1 onwards.
BOD5 (mg L-1)
NO2--N (mg L-1)
PO4-P (mg L-1)
TDIN (mg L-1)
1996
1998
2000
2002
2004
2006
2008
NH4+-N (mg L-1) NO3
--N (mg L-1)
0
5
10
15
20
0
2
4
6
0
2
4
6
0.0
0.1
0.2
0.3
0.4
0.5
0.0
0.1
0.2
0.3
0.4
0.5
0.0
2.5
5.0
7.5
10.0
0.0
2.5
5.0
7.5
10.0
0.0
0.2
0.4
0.6
0.8
0.0
0.2
0.4
0.6
0.81996
1998
2000
2002
2004
2006
Fig. 2. Evolution of environmental factors in the Scheldt estuary from 1996 to 2009, showing annual mean values (lines) and standard errors (whiskers), in the brackish water part(salinity> 0.5, grey boxes) and in the freshwater part (salinity< 0.5, blank boxes). When present, right Y-axis are for brackish water values.

4. Discussion
4.1. Changes in water quality during the studied period
Since the mid-nineties, the water quality of the Scheldt estuaryhad shown very important changes. Major tendencies observed inthis study confirm those previously observed (Van Damme et al.,1995; Cox et al., 2009). BOD5, NH4
þ-N, NO2"-N and PO4-P
concentrations continue to decrease particularly in the freshwaterreach (Fig. 2), where water quality has always been worse than inthe brackish part (Van Damme et al., 1995). O2 increased regularlyin both the brackish and in the freshwater reaches. The slightincrease of NO3
"-N in the freshwater part can be explained by thefact that since the second half of the seventies, the zone with highnitrification rates moved upstream due to the increase of oxygenconcentrations and caused a substantial impact on the N-load(Soetaert and Herman, 1995).
Cox et al. (2009), using data collected between 1967 and 2008,report a concomitant nutrient concentration decrease and Chla increase for the freshwater 118e155 km stretch and explain thisevolution as a switch between two steady states. From a highnutrientdhypereutrophic statedwhich inhibited phytoplanktonprimary productiond , the Scheldt has recently evolved to a lowernutrientdhigh phytoplankton productiond eutrophic equilib-rium, because NH4
þ concentrations have fell below the primaryproduction inhibiting level. Our study generally confirms thistendency, considering annual mean values between 1996 and 2009
over the entire 57.5e155 stretch. Apart from runoff, Cl", SPM andChl a concentrations, all environmental variables considered fol-lowed a gradual, unidirectional change during the entire studyperiod, either from a certain year onwards in both in the fresh andbrackish water stretch. The pattern observed for Cl" may be
Q (m3 s-1)
Chl a (µg L-1)
Cl- (g L-1)
O2 (mg L-1)
SPM (mg L-1) T (°C)1996
1998
2000
2002
2004
2006
2008
1996
1998
2000
2002
2004
2006
2008
10
12
14
16
18
20
0
2
4
6
8
0
100
200
300
0
1000
2000
3000
4000
5000
0
50
100
150
200
0
10
20
30
40
50
0
50
100
150
200
0
10
20
30
40
50
0
50
100
150
200
0
50
100
150
200
0
50
100
150
200
250
0
50
100
150
200
250
Fig. 2. (continued).
Table 1
Resulting R values of a Spearman rank test for tendencies with time of mean annualvalues of environmental factors and of abundance of zooplankton groups Thevariables considered are presented in Figs. 2 and 4 for both zones (*: p< 0.05;***: p< 0.001; ns: non significant).
Variable Freshwater Brackish water
NH4-N "0.97*** "0.94***NO3 0.79*** "0.58*NO2-N "0.83*** "0.87***TDIN "0.98*** "0.91***PO4 "0.95*** "0.84***BOD5 "0.93*** "0.82***Chl a ns nsO2 0.87*** 0.87***SPM 0.57* nsCL ns nsQ ns nsTEMP ns ns
E. affinis 0.86*** nsCalanoids except E. affinis ns nsCyclopoids "0.63* nsCladocerans ns ns

Fig. 3. Evolution of spatial and temporal distribution of abundance (monthly values for each station) of planktonic crustaceans in the Scheldt estuary, from 1996 to 2009:Eurytemora affinis adults, other calanoid adults, cyclopoid adults and cladoceran adults.
Eurytemora affinis (ind m-3) Calanoids except E. affinis (ind m-3)
Cyclopoids (ind m-3) Cladocerans (ind m-3)
0
3 000
6 000
9 000
12 000
0
3 000
6 000
9 000
12 000
0
250
500
750
1000
0
20 000
40 000
60 000
80 000
0
250
500
750
1000
0
600
1200
1800
1996
1998
2000
2002
2004
2006
2008
1996
1998
2000
2002
2004
2006
2008
Fig. 4. Evolution of the abundance of planktonic crustaceans in the Scheldt estuary, showing annual mean values (lines) and standard errors (whiskers), in the brackish water part(salinity> 0.5, grey boxes) and in the freshwater part (salinity< 0.5, blank boxes). When present, right Y-axis are for brackish water values.

explained by variations in runoff, as mean annual values aresignificantly correlated with mean annual Q values (Spearmanrank, p¼ 0.02). As there is no trend in runoff during the studyperiod, there is no obvious explanation for the increase in SPMconcentration in the freshwater zone. Contrarily to our observa-tions, Cox et al. (2009) observe a quasi continuous increase inannual mean Chl a concentration in the freshwater 118e155 kmstretch between 2001 and 2008. As our study area is considerablymore extended (57.5e155 km), this illustrates the interest ofconsidering detailed spatial trends when monitoring restorationresults. This consideration is however beyond the scope of thispaper.
4.2. Changes in zooplankton distribution during the 1996e2009
period and potential effect of water quality improvement
The spatio-temporal distribution of the zooplankton in theScheldt estuary has been relatively little studied prior to the OMESproject. A first inventory of the spatio-temporal distribution of bothphytoplankton and zooplankton over its entire marineefreshwatertransect (0e155 km) for 1967e1969 was given by De Pauw (1975,unpublished PhD thesis). Published studies concern only thecopepod Eurytemora affinis (De Pauw, 1973) or the zooplanktoncommunity in the brackish water part during short periods (Bakkerand De Pauw, 1975; Bakker et al., 1977). Soetaert and Van Rijswijk
-1.0 0.8
-0
.80
.6
Alo
Acro
Bos
Cer
Chy
DapDia
Dis
Ill
Ley
Mac
Ple
Sca
Sid
Sim
Eur
CEE
CLA
CAL
CYC
HAR
CALc
CYCc
HARc
BOD5
Q
Chl a
CL-
NH4+-N
NO2--N
NO3--N
O2
pH
PO4-P
SPM
T
Cladocerans
Alo Alona sp
Acro Acroperus sp
Bos Bosmina sp
Cer Ceriodaphnia sp
Chy Chydorus sp
Dap Daphnia sp
Dia Diaphonosoma sp
Dis Disparalona sp
Ill Illyocryptus sp
Ley Leydigia sp
Mac Macrothrix sp
Ple Pleuroxus sp
Sca Scapholeberis sp
Sid Sida sp
Sim Simocephalus sp
CLA Total cladocerans adults
Axes 1 2 3 4
Eigenvalues 0.189 0.059 0.012 0.005
Sum of all canonical eigenvalues: 0.275
Copepods
Eur Eurytemora affinis
CEE Calanoids except E. affinis
CAL Total calanoids adults
CYC Total cyclopoids adults
HAR Total harpacticids
CALc Calanoids copepodits
CYCc Cyclopoids copepodits
HARc Harpacticids copepodits
Fig. 5. RDA biplots axis 1 & 2, showing the distribution of planktonic crustaceans (copepods: blank triangles; cladocerans: black circles) in the Scheldt estuary, as a function of theenvironmental factors. See text for the abbreviations of the environmental factors. Taxa CAL and CLA, were added as supplementary data after the analysis, as they already includeseveral taxa.
(1993) sampled zooplankton from 0 to 78.5 km over two annualcycles (1989e1991). Since 1996, the OMES monitoring is the firstconsistent, long term study on zooplankton in the Scheldt estuaryover the brackishefreshwater transect (57.5e155 km). The use ofa 14 yearmonitoring database allowsus to analyse the association ofthe earlier mentioned improvement of water quality to the evolu-tion of the zooplankton community. Even with a Bonferronicorrection, all the environmental factors considered contributedsignificantly to explain thedistribution of crustaceans in the Scheldt.The data set shows the colinearity of environmental factors, typicalfor an estuarine gradient situation. This is well shownby differencesbetweenmarginal and conditional effects (Table 2): after taking intoaccount the variance explained by the first factors (Cl" for Table 2aand c; PO4-P for Table 2b), the variance explained by followingfactors is considerably reduced in the conditional effect.
In the present study, after the salinity, environmental factorsassociated with water quality (NO2
"-N, PO4-P, NH4þ-N, BOD5
and O2) are the dominant factors which explain the ordination ofcrustacean taxa (Table 2a). Contrary to the strong seasonal
influence reported by Soetaert and Van Rijswijk (1993) and Tackxet al. (2004) within annual cycles, in this long term study, factorssuch as T and Chl a, as seasonal and food availability proxies, appearless important than water quality (Table 2a). No obvious stronginfluence of the water quality on the taxa distribution wasmentioned in above-cited studies. However, these studies occurredbefore the major physico-chemical changes which occurred in theestuary (Van Damme et al., 2005). Therefore, in the long term, theinfluence of water quality improvement dominates over seasonalchanges in environmental conditions in determining environ-mental conditions for zooplankton in the Scheldt estuary.
In considering the RDAs on calanoids, cyclopoids and cladoc-erans separately (Table 2b, c), the marginal effect of the environ-mental factors showed that the distribution of calanoids is moststrongly affected by water quality. The distribution of cyclopoidsand cladocerans is conversely mainly explained by Chl a in additionto Cl" and not by factors associated with water quality. Theirhighest abundances were found in the same years (2003e2005) asthe strongest phytoplankton blooms (Figs. 2 and 4). The fact thatcladoceran mean annual abundance increases with Chl a concen-tration, especially from 100 mg l"1 onwards (Fig. 6), suggestsa potential threshold effect of the phytoplankton availability on thecladoceran abundance. In Chilean lakes, De los Rios and Soto (2007)have also shown a strong response of daphnid abundance toeutrophication.
The strong reduction of cyclopoid abundance in the brackishwater is probably due to their decrease in freshwater reaches, whichlimited their expansion in downstream direction. Indeed, as foundduring 1996 (Tackx et al., 2004), cyclopoids copepods found in thebrackish zone almost always belonged to the dominant freshwaterspeciesCyclops vicinus vicinus andAcanthocyclops trajani (not shown).
Among the copepods, Eurytemora affinis showed the greatestdisplacement. This calanoid is known to be typical of the brack-ishefreshwater transition zone in European estuaries (Sautour andCastel, 1995). In the Scheldt, previous studies have noticed theabsence of E. affinis from the freshwaterebrackish water fringe andupstream reaches during the sixties (De Pauw, 1973) and the lateeighties (Soetaert and VanRijswijk,1993). Thiswas explained by thevery bad water quality in this salinity range, situated around thehighly polluted zone of Antwerp (78.5 km, Fig. 1). The first obser-vations of the copepod in the Antwerp area occurred in the mid-1990s and this population shift was attributed to the improvingoxygen concentrations (Appeltans et al., 2003). Since 1996 (Fig. 3)E. affinis has been regularly abundant around Antwerp and as suchwell settled in the same salinity range as in other Europeantemperate estuaries (Sautour and Castel, 1995). Between 2001 and2006, E. affinis was sporadically observed in the upstream fresh-water part of the estuary (Fig. 3). From 2007 onwards, these
Table 2
Variance in the zooplankton abundance explained by the environmental factors indifferent RDAs.
Marginal effects Conditional effects
Variable Lambda1 Variable LambdaA
a) RDA with all taxa
Cl" 0.13 Cl" 0.13NO2
"-N 0.09 PO4-P 0.05PO4-P 0.08 NO2
"-N 0.03BOD5 0.07 NH4
þ-N 0.02O2 0.06 O2 0.01Chl a 0.05 Chl a 0.01NH4
þ-N 0.04 pH 0.01NO3
"-N 0.04 NO3"-N 0.01
Q 0.02 SPM 0.01T 0.02 T 0pH 0.01 BOD5 0SPM 0 Q 0
Sum of all canonical eigenvalues: 0.275
b) RDA with only taxa EUR, CEE, CALc
PO4-P 0.15 PO4-P 0.15NO2
"-N 0.14 O2 0.04BOD5 0.12 Cl" 0.03O2 0.11 NO2
"-N 0.02NH4
þ-N 0.09 T 0.01Cl" 0.09 Chl a 0.01Chl a 0.03 Q 0.01pH 0.02 BOD5 0NO3
"-N 0.02 pH 0Q 0.02 NO3
"-N 0T 0.01 NH4
þ-N 0SPM 0 SPM 0
Sum of all canonical eigenvalues: 0.271
c) RDA with only taxa CLA, CYC, CYCc
Cl" 0.22 Cl" 0.22Chl a 0.1 Chl a 0.05NO2
"-N 0.09 NH4þ-N 0.02
BOD5 0.06 PO4-P 0.02PO4-P 0.05 NO2
"-N 0.01NO3
"-N 0.04 O2 0.01O2 0.03 NO3
"-N 0.01Q 0.02 T 0.01T 0.02 Q 0NH4
þ-N 0.01 SPM 0SPM 0.01 pH 0pH 0 BOD5 0
Sum of all canonical eigenvalues: 0.355
0
15 000
30 000
45 000
0 50 100 150 200
Freshwater annual mean chlorophyll a concentration
(µg l-1
)
Fre
sh
wate
r an
nu
al
mean
cla
do
cera
n a
bu
nd
an
ce
(in
d m
-
3)
96 99 98 0802
0997
07 06
03
05
04
Fig. 6. Relation between annual mean cladoceran abundance and chlorophylla concentration in the freshwater part of the Scheldt estuary.
occasional occurrences have switched to a consistent high abun-dance of E. affinis in the freshwater area. E. affinis now reaches veryhigh abundance with maxima (155000 indm"3) comparable withthose of freshwater stretch of the Seine estuary (Mouny andDauvin,2002). In the Gironde and in the Ems, maximal freshwater abun-dances are <20 000 indm"3 (Sautour and Castel, 1995). Other cal-anoids, although much less abundant, have also increasedsubstantially in the freshwater reach in 2007e2009. Since its waterquality has improved, the freshwater part of the Scheldt estuaryseems to have become a suitable area for calanoids. However, in thelast 3 years, the increase in calanoid abundance in the freshwaterarea has been extremely large and we question whether this is thisa sporadic boom or a real trend. Mialet et al. (2010), using Scheldtspring data on E. affinis between 1996 and 2007, showed thatE. affinis canoccur in theupstream freshwater stretch (salinity< 0.5)when mean upstream O2 concentration is >4 mg l"1 and theminimum O2 concentration, which is always observed aroundthe middle of the estuary, is >1.3 mg l"1. A possible explanation forthe abrupt invasion of the freshwater reach by E. affinis (and othercalanoids) since 2007 could be that environmental conditions aresteadily above the limit level. Indeed, verifying the 2007e2009spring data shows that conditions exceed this over the entire studyzone for E. affinis with an upstream expansion during 91% of themonthly sampling campaigns, while during 1996e2006, this wasonly the case in 56%of the campaigns. It remains to be investigated ifthis recent apparent acceleration in the water quality in the Scheldtestuary is related to the gradual commissioning of the purificationplant built in Brussels around 2007e2008, reducing organic loadsreaching the Scheldt through the Rupel tributary (Fig. 1) (VanDamme et al., 2005) or to the regime shift from a hypertropic toa autrophic system as suggested by Cox et al. (2009).
Since 2007, Eurytemora affiniswas also observed during summerin the freshwater zone. This could be explained by the fact thatsalinity ismost stressful for E. affinis at high temperatures (i.e. 25 #C),as shownKimmel andBradley (2001). Bradley (1975,1991) observedthe same phenomenon in the Chesapeake Bay, as E. affinismigratesto lower salinities as temperatures increases. E. affinis is a euryhalinespecies. Lee showed that in the past century, E. affinis brackishpopulations invaded freshwater reaches, in European systems aswell as in North American and in Asian ones, in a few generations(Lee, 1999; Lee et al., 2003). It is likely that E. affinis prefers lowsalinity habitats because they reduce its energy investment inosmoregulation. In addition to salinity, environmental conditions inthe freshwater reach may generally be better suited to increasecalanoid than cyclopoid population dynamics. This seems unlikely,as in estuarine systems, calanoids are generally associated withbrackish water and cyclopoids with freshwater regions but thenzooplankton in estuaries have mainly been studied after the waterquality was already degraded. Hence there is the need for furtherresearch on restoration processes in estuaries.
Tackx et al. (2003) have shown that Eurytemora affinis is capableof selecting phytoplankton among the detritus-dominated sus-pended matter in the Scheldt estuary, and can satisfy its nutritionaldemands solely by its phytoplankton ingestion. It is thus unlikelythat the higher phytoplankton concentration in the freshwaterstretch than in the brackish water (Fig. 2) has encouraged the moveby E. affinis to the freshwater, or that E. affinis really profited frombetter feeding conditions in this area. Moreover, chlorophylla concentration in the freshwater zone has decreased since 2004(Fig. 2). Considering the above, the improving water quality (strongreduction ofNH4
þ-N, andBOD5, increase inO2 concentration) seemsthemost likely cause of the shift of E. affinis from the brackish waterto the upstream freshwater Scheldt. Nevertheless, it is not yetpossible to categorically be definite about an establishment of anE. affinis population in the freshwater zone.
4.3. Potential effect of biotic interactions on zooplankton
community
The upstream shift of calanoids is concomitant with a quasi-complete disappearance of cyclopoids from this area. This suggestthat cyclopoids, which appear to be less sensitive to poor waterquality (Table 2c), were able to live in the upstream freshwater areaas long as calanoids were absent. Once water quality in the fresh-water stretch became permissive for calanoids, they rapidlybecame dominant, even during summer, which created an overlapwith the cyclopoid spatio-temporal distribution. Hence it ispossible to advance several possible explanations for thissubstantial change in spatial composition of the Scheldtzooplankton community although we are unaware of any literaturecomparison between calanoids, cyclopoids or cladocerans con-cerning their tolerance to salinity, pollutant or oxygen ranges.
As it is also difficult to imagine that improving water quality hasa negative effect on cyclopoids, calanoids may have reduced cyclo-poid abundance byeither competition or predation. Using long term(8 months) enclosure experiments with lake calanoids and cyclo-poids, Soto and Hurlbert (1991) showed that calanoids couldstrongly depress cyclopoid populations. These authors explain thiseffect by a reduction of phytoplankton or rotifer food for cyclopoidnauplii or by calanoid predation on cyclopoid nauplii. Also, Dodson(1975) has shown that in freshwater ponds, calanoids and cyclo-poids can feed on each other’s nauplii. However, as the key copepodspecies of the present study were not the same, extending theseconclusions to the Scheldt estuary is difficult. In amore generalway,we further refrain from using literature on zooplankton response torestoration available from freshwater (mainly lentic) systems toexplain the trends observed in the Scheldt, as zooplanktondynamicsin these systems are governed mainly by phenomena such asstratification and clear watereturbid water states, which are notacting in the well-mixed Scheldt estuary (Baeyens et al., 1998).
Using stable isotope signatures to study the lower trophicweb inthe York river, (Virginia, USA)Hoffman et al. (2008) have shown thatEurytemora affinis, the dominant cladoceran Bosmina freyi andcyclopoids have similar signatures, and can switch from autoch-thonous produced phytoplankton to allochthonous matter. In theScheldt estuary however, E. affinis occurs mainly in spring, whileB. freyi and cyclopoids occur later in the year. Considering the abovementioned capacity for phytoplankton selection of E. affinis, it ispossible that this dominant calanoid performs better in selectinghigh quality food than cyclopoids. Moreover, algae speciescomposition during spring and summer in the Scheldt estuaryseems to have changed from 1996 (Van Burm, unpublished data).During spring 2007 and 2008, large diatoms (Actinocyclus normanii)dominated the community whereas during spring 1993, smallspecies (Cyclotella meneghiniana, Skeletonema costatum) dominated(Muylaert and Sabbe, 1999). This shift in phytoplankton sizecomposition could also influence the feeding efficiency and devel-opment of the variousmesozooplankton species, but also of rotifers,which are numerically dominant in the entire estuary (Tackx et al.,2004) and form another potential high quality prey to the meso-zooplankton. Indeed, the capacity of both freshwater and marinecopepods to feed on rotifers is well known (Williamson, 1987;Conde-Porcuna and Declerck, 1998; Ciros-Perez et al., 2004).Lapesa et al. (2004) report that the saltwater species calanoid Arc-
todiaptomus salinus feeds more efficiently on rotifers that the co-occurring cyclopoid Diacyclops bicuspidatus. As for algae, it ispossible that E. affinis feeds better on rotifers than cyclopoids.Azémar et al. (2010) showed that during 2002, rotifers reached theirpeak abundance in spring and autumn (up to 2500 000 indm"3 inthe freshwater zone), thus alternating with cladocerans and cyclo-poids population peaks. This alternation could reflect a predation of
cyclopoids and/or cladocerans on rotifers. Indeed, the two domi-nant cyclopoids species in the Scheldt estuary, Cyclops vicinus vici-nus and Acanthocyclops trajani, are able to develop to the adult stageon a pure algal diet (Hansen and Santer, 1995; Hopp and Maier,2005), but feed essentially on rotifers as adults (Brandl andFernando, 1978; Brandl, 2005). Rotifer abundance data for theScheldt are not yet available for the complete period studied so it isdifficult to evaluate their potential role in the recent evolution of thezooplankton community in this estuary. Nevertheless, first obser-vations indicate that rotifermean abundanceswere particularly lowin 2008 (about 4 times less than in 2004 and 2 times less than in2002). This raises the hypothesis of a recent rotifers predationfollowing E. affinis’ shift, which could have hampered the devel-opment of cyclopoid populations. Also, there are no data availableon ciliates. As they can contribute to a relatively important part ofthe copepod diet in estuarine systems (Calbet and Saiz, 2005), theycould explain recent changes in mesozooplankton distribution.
In addition, the top down control on the mesozooplanktoncould influence the dominance among taxa, for example by selec-tive predation (De Mott, 1995; Lu and Xie, 2001). During the early1990s, when Eurytemora affinis was still very abundant in thebrackish water part of the Scheldt, the diet of the mysid Neomysis
integer in this zone consisted practically solely of E. affinis (Fockedeyand Mees, 1999). In addition, in the brackish water zone of theScheldt (78.5 km and downstream), E. affinis and various hyper-benthic species form an important food resource for the diet ofjuveniles of dominant fish species such as sprat and herring (Maeset al., 2005). While water quality improvement has resulted inhigher abundance of zooplankton predators in the freshwater area(Verslycke et al., 2004). Within the inventory of fish speciesreported in the Scheldt estuary (Breine et al., 2010), an increase ofspecies richness and abundance has been observed in the fresh-water zone since 2007 (Breine, unpublished PhD thesis data). Thiscould have increased predation pressure on crustaceans, but thereis no obvious reasonwhy these predators would feed selectively oncyclopoids rather than on other copepods.
Contrarily to cyclopoids, cladocerans showed no decrease since2007 and thus are apparently less hampered by biological inter-actions occurring in the freshwater zone than cyclopoids. Whilecapable of selective feeding (Wong et al., 2006), cladocerans aregenerally considered as filter feeders which are less selective thancopepods (De Mott, 1988). Because of this feeding mode, they maynot compete with calanoids and cyclopoids. This can also explainwhy their abundance followed the same trend as Chl a concentra-tion (Figs. 2, 4 and 6).
The fact that changes in some other parameters, not measuredby OMES, could have led to the observed changes in thezooplankton community cannot be excluded: in addition topollutant loads, potential changes in the benthos could interactwith the pelagic community. In a long term study over zooplanktoncommunity of a German lagoon, Feike et al. (2007) observedimportant and rapid changes in calanoid (Eurytemora affinis andAcartia tonsa) and rotifer abundance just after the introduction ofan invasive polychaete species. These authors suggest that thisbenthic species caused the depletion of rotifer resting eggs bygrazing or bioturbation. Hence in the upper Scheldt estuary,improving water quality could have affected the benthic commu-nity and indirectly changed living conditions for the plankton.
In conclusion, it is apparent that the improving water quality inthe Scheldt estuary, and mainly in the freshwater stretch, is par-alleled with major shifts in the spatial distribution of thezooplankton taxa: an increase in calanoid copepod and cladoceranabundance, while cyclopoids are strongly decreasing. Thesechanges in the zooplankton community structure raise a number offundamental questions on tolerance for environmental conditions
and trophic competition between the taxa calanoida, cyclopoidaand cladocera. Unfortunately, little information on water qualitytolerance or biotic interactions among freshwater estuarine crus-tacean plankton taxa is available. Answering these questions willrequire mesocosm experiments using estuarine taxa, combinedwith in situ studies on trophic interactions (stable isotopes, fattyacids, observation of gut contents). Finally, the recent increase indissolved oxygen concentration in the freshwater part may lead tomore intense phytoplanktonic blooms (Cox et al., 2009). The leadsto the need to test the hypothesis that, given changed distributionpatterns, zooplankton can regulate phytoplankton production.
Acknowledgements
This research was conducted within the framework of OMES(Onderzoek MilieueEffecten Sigmaplan financed by the FlemishAdministration for Waterways and Maritime Affairs “ZeeScheldtdivision”). We are indebted to the crews of the vessels Veremansand Scaldis I for assistance during sampling.
References
Appeltans, W., Hannouti, A., Van Damme, S., Soetaert, K., Vanthomme, R., Tackx, M.,2003. Zooplankton in the Schelde estuary (Belgium/The Netherlands). Thedistribution of Eurytemora affinis: effect of oxygen? Journal of PlanktonResearch 25, 1441e1445.
Azémar, F., Maris, T., Mialet, B., Segers, H., Van Damme, S., Meire, P., Tackx, M., 2010.Rotifers in the Schelde estuary (Belgium): a test of taxonomic relevance. Journalof Plankton Research fbq030.
Baeyens, W., Van Eck, B., Lambert, C., Wollast, R., Goeyens, L., 1998. Generaldescription of the Scheldt estuary. Hydrobiologia 366, 1e14.
Bakker, C., De Pauw, N., 1975. Comparison of plankton assemblages of identicalsalinity ranges in estuarine tidal, and stagnant environments II. Zooplankton.Netherlands Journal of Sea Research 9, 145e165.
Bakker, C., Phaff, W.J., Ewijk-Rosier, M.V., De Pauw, N., 1977. Copepod biomass in anestuarine and stagnant brackish environment of the S.W. Netherlands. Hydro-biologia 52, 3e13.
Benndorf, J., 1995. Possibilities and limits for controlling eutrophication bybiomanipulation. Internationale Revue der gesamten Hydrobiologie und Hydro-graphie 80, 519e534.
Borcard, D., Legendre, P., Drapeau, P., 1992. Partialling out the spatial component ofecological variation. Ecology 73, 1045e1055.
Borja, Á., Dauer, D., Elliott, M., Simenstad, C., 2010. Medium- and long-termrecovery of estuarine and coastal ecosystems: patterns, rates and restorationeffectiveness. Estuaries and Coasts 33, 1249e1260.
Bradley, B.P., 1975. The anomalous influence of salinity on temperature tolerances ofsummer and winter populations of the copepod Eurytemora affinis. BiologicalBulletin 148, 26e34.
Bradley, B.P., 1991. Distribution of copepods in coastal zone waters: seasonalsuccession in Chesapeake Bay. Bulletin of Plankton Society of Japan, 129e131.
Brandl, Z., 2005. Freshwater copepods and rotifers: predators and their prey.Hydrobiologia 546, 475e489.
Brandl, Z., Fernando, C.H., 1978. Prey selection by the cyclopoid copepods Meso-cyclops edax and Cyclops vicinus. Internationale Veneinigung fur Theoretischeund Angewandte Limnologie, 2505e2510. Congress in Denmark 1977.
Breine, J., Quataert, P., Stevens, M., Ollevier, F., Volckaert, F.A.M., Van den Bergh, E.,Maes, J., 2010. A zone-specific fish-based biotic index as a management tool forthe Zeeschelde estuary (Belgium). Marine Pollution Bulletin 60, 1099e1112.
Calbet, A., Saiz, E., 2005. The Ciliateecopepod Link in Marine Ecosystems. Inter-Research. Oldendorf/Luhe, Germany. 11 p.
Chen, K.-N., Bao, C.-H., Zhou, W.-P., 2009. Ecological restoration in eutrophic LakeWuli: a large enclosure experiment. Ecological Engineering 35, 1646e1655.
Ciros-Perez, J., Carmona, M.J., Lapesa, S., Serra, M., 2004. Predation as a factormediating resource competition among rotifer sibling species. Limnology andOceanography 49, 40e50.
Conde-Porcuna, J.M., Declerck, S., 1998. Regulation of rotifer species by invertebratepredators in a hypertrophic lake: selective predation on egg-bearing females andinduction of morphological defences. Journal of Plankton Research 20, 605e618.
Cox, T.J.S., Maris, T., Soetaert, K., Conley, D.J., Van Damme, S., Meire, P., Middelburg, J.J.,Vos, M., Struyf, E., 2009. A macro-tidal freshwater ecosystem recovering fromhypereutrophication: the Schelde case study. Biogeosciences 6, 2935e2948.
Dame, R., Alber, M., Allen, D., Mallin, M., Montague, C., Lewitus, A., Chalmers, A.,Gardner, R., Gilman, C., Kjerfve, B., Pinckney, J., Smith, N., 2000. Estuaries of theSouth Atlantic coast of North America: their geographical signatures. Estuariesand Coasts 23, 793e819.
De los Rios, P., Soto, D., 2007. Eutrophication and dominance of daphnids (Crus-tacea) in a deep Patagonian lake (Lake Llanquihue, Chile). Polish Journal ofEcology 55, 191e193.
De Mott, W., 1988. Discrimination between algae and detritus by freshwater andmarine zooplankton. Bulletin of Marine Science 43, 486e499.
De Mott, W., 1995. Optimal foraging by a suspension-feeding copepod: response toshort-term and seasonal variation in food resources. Oecologia 103, 230e240.
De Pauw, N., 1973. On the distribution of Eurytemora affinis (Poppe, 1880) (Cope-poda) in the Westerschelde estuary. Verhandlungen Internationale Vereinigungfür Theoretische und Angewandte Limnologie 18, 1462e1472.
Dodson, S.I., 1975. Predation rates of zooplankton in arctic ponds. Limnology andOceanography 20, 426e433.
Feike, M., Heerkloss, R., Rieling, T., Schubert, H., 2007. Studies on the zooplanktoncommunity of a shallow lagoon of the Southern Baltic Sea: long-term trends,seasonal changes, and relations with physical and chemical parameters.Hydrobiologia 577, 95e106.
Fockedey, N., Mees, J., 1999. Feeding of the hyperbenthic mysid Neomysis integer inthe maximum turbidity zone of the Elbe, Westerschelde and Gironde estuaries.Journal of Marine Systems 22, 207e228.
Hansen, A.M., Santer, B., 1995. The influence of food resources on the development,survival and reproduction of the 2 cyclopoid copepods: Cyclops vicinus andMesocyclops leuckarti. Journal of Plankton Research 17, 631e646.
Heip, C., 1988. Biota and abiotic environment in the Westerschelde estuary. AquaticEcology 22, 31e34.
Hering, D., Borja, A., Carstensen, J., Carvalho, L., Elliott, M., Feld, C.K., Heiskanen,A.-S., Johnson, R.K., Moe, J., Pont, D., Solheim, A.L., de Bund, W.V., 2010. TheEuropean Water Framework Directive at the age of 10: a critical review of theachievements with recommendations for the future. Science of the TotalEnvironment 408, 4007e4019.
Hoffman, J.C., Bronk, D.A., Olney, J.E., 2008. Organic matter sources supportinglower food web production in the tidal freshwater portion of the York Riverestuary, Virginia. Estuaries and Coasts 31, 898e911.
Hopp, U., Maier, G., 2005. Implication of the feeding limb morphology forherbivorous feeding in some freshwater cyclopoid copepods. FreshwaterBiology 50, 742e747.
Kimmel, D.G., Bradley, B.P., 2001. Specific protein responses in the calanoid copepodEurytemora affinis (Poppe, 1880) to salinity and temperature variation. Journalof Experimental Marine Biology and Ecology 266, 135e149.
Lapesa, S., Snell, T.W., Fields, D.M., Serra, M., 2004. Selective feeding of Arcto-diaptomus salinus (Copepoda, Calanoida) on co-occurring sibling rotifer species.Freshwater Biology 49, 1053e1061.
Lee, C.E., 1999. Rapid and repeated invasions of fresh water by the copepodEurytemora affinis. Evolution 53, 1423e1434.
Lee, C.E., Remfert, J.L., Gelembiuk, G.W., 2003. Evolution of physiological toleranceand performance during freshwater invasions. Integrative and ComparativeBiology 43, 439e449.
Lionard, M., Muylaert, K., Tackx, M., Vyverman, W., 2008. Evaluation of theperformance of HPLC-CHEMTAX analysis for determining phytoplanktonbiomass and composition in a turbid estuary (Schelde, Belgium). EstuarineCoastal and Shelf Science 76, 809e817.
Lu, M., Xie, P., 2001. Impacts of filter-feeding fishes on the long-term changes ofcrustacean zooplankton in a eutrophic subtropical Chinese lake. Journal ofFreshwater Ecology 16, 219e228.
Maes, J., Stevens, M., Ollevier, F., 2005. The composition and community structure ofthe ichthyofauna of the upper Scheldt estuary: synthesis of a 10-year datacollection (1991e2001). Journal of Applied Ichthyology 21, 86e93.
Mazumder, A., 1994. Phosphorusechlorophyll Relationships under ContrastingHerbivory and Thermal Stratification: Predictions and Patterns. NationalResearch Council of Canada, Ottawa, ON, Canada.
Meire, P., Ysebaert, T., Van Damme, S., Van den Bergh, E., Maris, T., Struyf, E., 2005.The Scheldt estuary: a description of a changing ecosystem. Hydrobiologia540, 1e11.
Meng, W., Liu, L., 2010. On approaches of estuarine ecosystems health studies.Estuarine, Coastal and Shelf Science 86, 313e316.
Mialet, B., Azémar, F., Maris, T., Sossou, C., Ruiz, P., Lionard, M., Van Damme, S.,Lecerf, A., Muylaert, K., Toumi, N., Meire, P., Tackx, M., 2010. Spatial springdistribution of the copepod Eurytemora affinis (Copepoda, Calanoida) ina restoring estuary, the Scheldt (Belgium). Estuarine, Coastal and Shelf Science88, 116e124.
Mouny, P., Dauvin, J.C., 2002. Environmental control of mesozooplanktoncommunity structure in the Seine estuary (English Channel). Oceanologica Acta25, 13e22.
Muylaert, K., Sabbe, K., 1999. Spring phytoplankton assemblages in and around themaximum turbidity zone of the estuaries of the Elbe (Germany), the Schelde(Belgium/The Netherlands) and the Gironde (France). Journal of MarineSystems 22, 133e149.
Paerl, H.W., Valdes, L.M., Joyner, A.R., Piehler, M.F., Lebo, M.E., 2004. Solving prob-lems resulting from solutions: evolution of a dual nutrient managementstrategy for the eutrophying Neuse River Estuary, North Carolina. Environ-mental Science & Technology 38, 3068e3073.
Peretyatko, A., Teissier, S., De Backer, S., Triest, L., 2009. Restoration potential ofbiomanipulation for eutrophic peri-urban ponds: the role of zooplankton sizeand submerged macrophyte cover. Hydrobiologia 634, 125e135.
Sautour, B., Castel, J., 1995. Comparative spring distribution of zooplankton in threemacrotidal European estuaries. Hydrobiologia 311, 139e151.
Soetaert, K., Van Rijswijk, P., 1993. Spatial and temporal patterns of the zooplanktonin the Westerschelde estuary. Marine Ecology Progress Series 97, 47e59.
Soetaert, K., Herman, P.J.M., 1995. Nitrogen dynamics in the Westerschelde estuary(S.W. Netherlands) estimated by means of the ecosystem model MOSES.Hydrobiologia 311, 225e246.
Soto, D., Hurlbert, S.H., 1991. Long-term experiments on calanoid cyclopoid inter-actions. Ecological Monographs 61, 245e265.
Tackx, M., De Pauw, N., Van Mieghem, R., Azémar, F., Hannouti, A., Van Damme, S.,Fiers, F., Daro, N., Meire, P., 2004. Zooplankton in the Schelde estuary, Belgiumand The Netherlands. Spatial and temporal patterns. Journal of PlanktonResearch 26, 133e141.
Tackx, M.L.M., Herman, P.M.J., Gasparini, S., Irigoien, X., Billiones, R., Daro, M.H.,2003. Selective feeding of Eurytemora affinis (Copepoda, Calanoida) intemperate estuaries: model and field observations. Estuarine, Coastal and ShelfScience 56, 305e311.
Tadonleke, R.D., Lazzarotto, J., Anneville, O., Druart, J.-C., 2009. Phytoplanktonproductivity increased in Lake Geneva despite phosphorus loading reduction.Journal of Plankton Research 31, 1179e1194.
ter Braak, C.J.F., 1987. Ordination. In: Jongman, R.H.G., ter Braak, C.J.F., VanTongeren, O.F.R. (Eds.), Data Analysis in Community and Landscape Ecology.Pudoc, Wageningen, Netherlands, pp. 91e173.
ter Braak, C.J.F., 1994. Canonical community ordination. Part I: basic theory andlinear methods. Ecoscience 1, 127e140.
ter Braak, C.J.F., Smilauer, P., 2002. CANOCO Reference Manual and CanoDraw forWindows User’s Guide: Software for Canonical Community Ordination (Version4.5). Microcomputer Power, Ithaca, NY, USA. 500 p.
Van Damme, S., Meire, P., Maeckelberghe, H., Verdievel, M., Bourgoing, L.,Taverniers, E., Ysebaert, T., Wattel, G., 1995. De waterkwaliteit van de Zee-schelde: evolutie in de voorbije dertig jaar. Water 14, 244e256.
Van Damme, S., Van Cleemput, O., Meire, P., 1997. Research Environmental EffectsSigmaplan (OMES): Denitrification. Report AMIS DS7.4. University of Gent(Belgium), Faculty of Agricultural and Applied Biological Sciences.
Van Damme, S., Struyf, E., Maris, T., Ysebaert, T., Dehairs, F., Tackx, M., Heip, C.,Meire, P., 2005. Spatial and temporal patterns of water quality along the estu-arine salinity gradient of the Scheldt estuary (Belgium and The Netherlands):results of an integrated monitoring approach. Hydrobiologia 540, 29e45.
Verity, P.G., Borkman, D.G., 2010. A decade of change in the Skidaway River estuary.III. Plankton. Estuaries and Coasts 33, 513e540.
Verslycke, T., Ghekiere, A., Janssen, C.R., 2004. Seasonal and spatial patterns incellular energy allocation in the estuarine mysid Neomysis integer (Crustacea:Mysidacea) of the Scheldt estuary (The Netherlands). Journal of ExperimentalMarine Biology and Ecology 306, 245e267.
Williamson, C.E., 1987. Predatoreprey interactions between omnivorous diaptomidcopepods and rotifers e the role of prey morphology and behavior. Limnologyand Oceanography 32, 167e177.
Wong, C.K., Liu, X.J., Siu, Y.Y., Hwang, J.S., 2006. Study of selective feeding in themarine cladoceran Penilia avirostris by HPLC pigment analysis. Journal ofExperimental Marine Biology and Ecology 331, 21e32.
Wright, S.W., Jeffrey, S.W., 1997. High-resolution HPLC system for chlorophylls andcarotenoids of marine phytoplankton. In: Jeffrey, S.W.E. (Ed.), PhytoplanktonPigments in Oceanography: Guidelines to Modern Methods. United NationsEducational Scientific and Cultural Organization (UNESCO), Paris/FR, pp.327e341.
Zhao, J., Ramin, M., Cheng, V., Arhonditsis, G.B., 2008. Plankton community patternsacross a trophic gradient: the role of zooplankton functional groups. EcologicalModelling 213, 417e436.