response of north pacific atmospheric rivers to climate
TRANSCRIPT
Response of North Pacific Atmospheric Rivers to Climate Change Conditions
Katerina R. Gonzales1*, Daniel L. Swain1, and Noah S. Diffenbaugh1,2
1Department of Earth System Science, Stanford University, Stanford, CA, 2Woods Institute for the Environment, Stanford University, Stanford, CA
References: Brands, S., Gutiérrez, J.M. & San-Martín, D. Clim Dyn (2016)
Acknowledgements: Funding for this research was provided by the National Science Foundation Graduate
Research Fellowship under Grant No. DGE-114747 and the Stanford VPGE EDGE Fellowship. We would like to thank
Stanford University and the Stanford Research Computing Center for providing computational resources and support that
have contributed to these research.
Motivation and Analytical Framework
Atmospheric rivers (ARs) are known to play an important role in
the global hydrologic cycle and in bringing extreme precipitation
to multiple places around the globe, highlighting the necessity to
understand how these features will be affected by anthropogenic
warming. Numerous previous studies have used global climate
models to analyze projections of AR characteristics, mostly AR
frequency, but we can glean further information available on
observed ARs detected in observational reanalyses to fill in this
picture of expected future AR characteristics and downstream
impacts in conditions expected from climate change.
A warmer earth can alter ARs by both thermodynamical and
dynamical effects, including a) enabling more moisture in the air,
b) changing the sea surface temperatures (SSTs) and thereby the
heat transport between the ocean and atmosphere, and c)
altering the atmospheric circulation patterns under which an AR
occurs. Here we investigate the link between warmer SSTs and
integrated water vapor transport (IVT) during landfalling North
Pacific AR events.
Methods
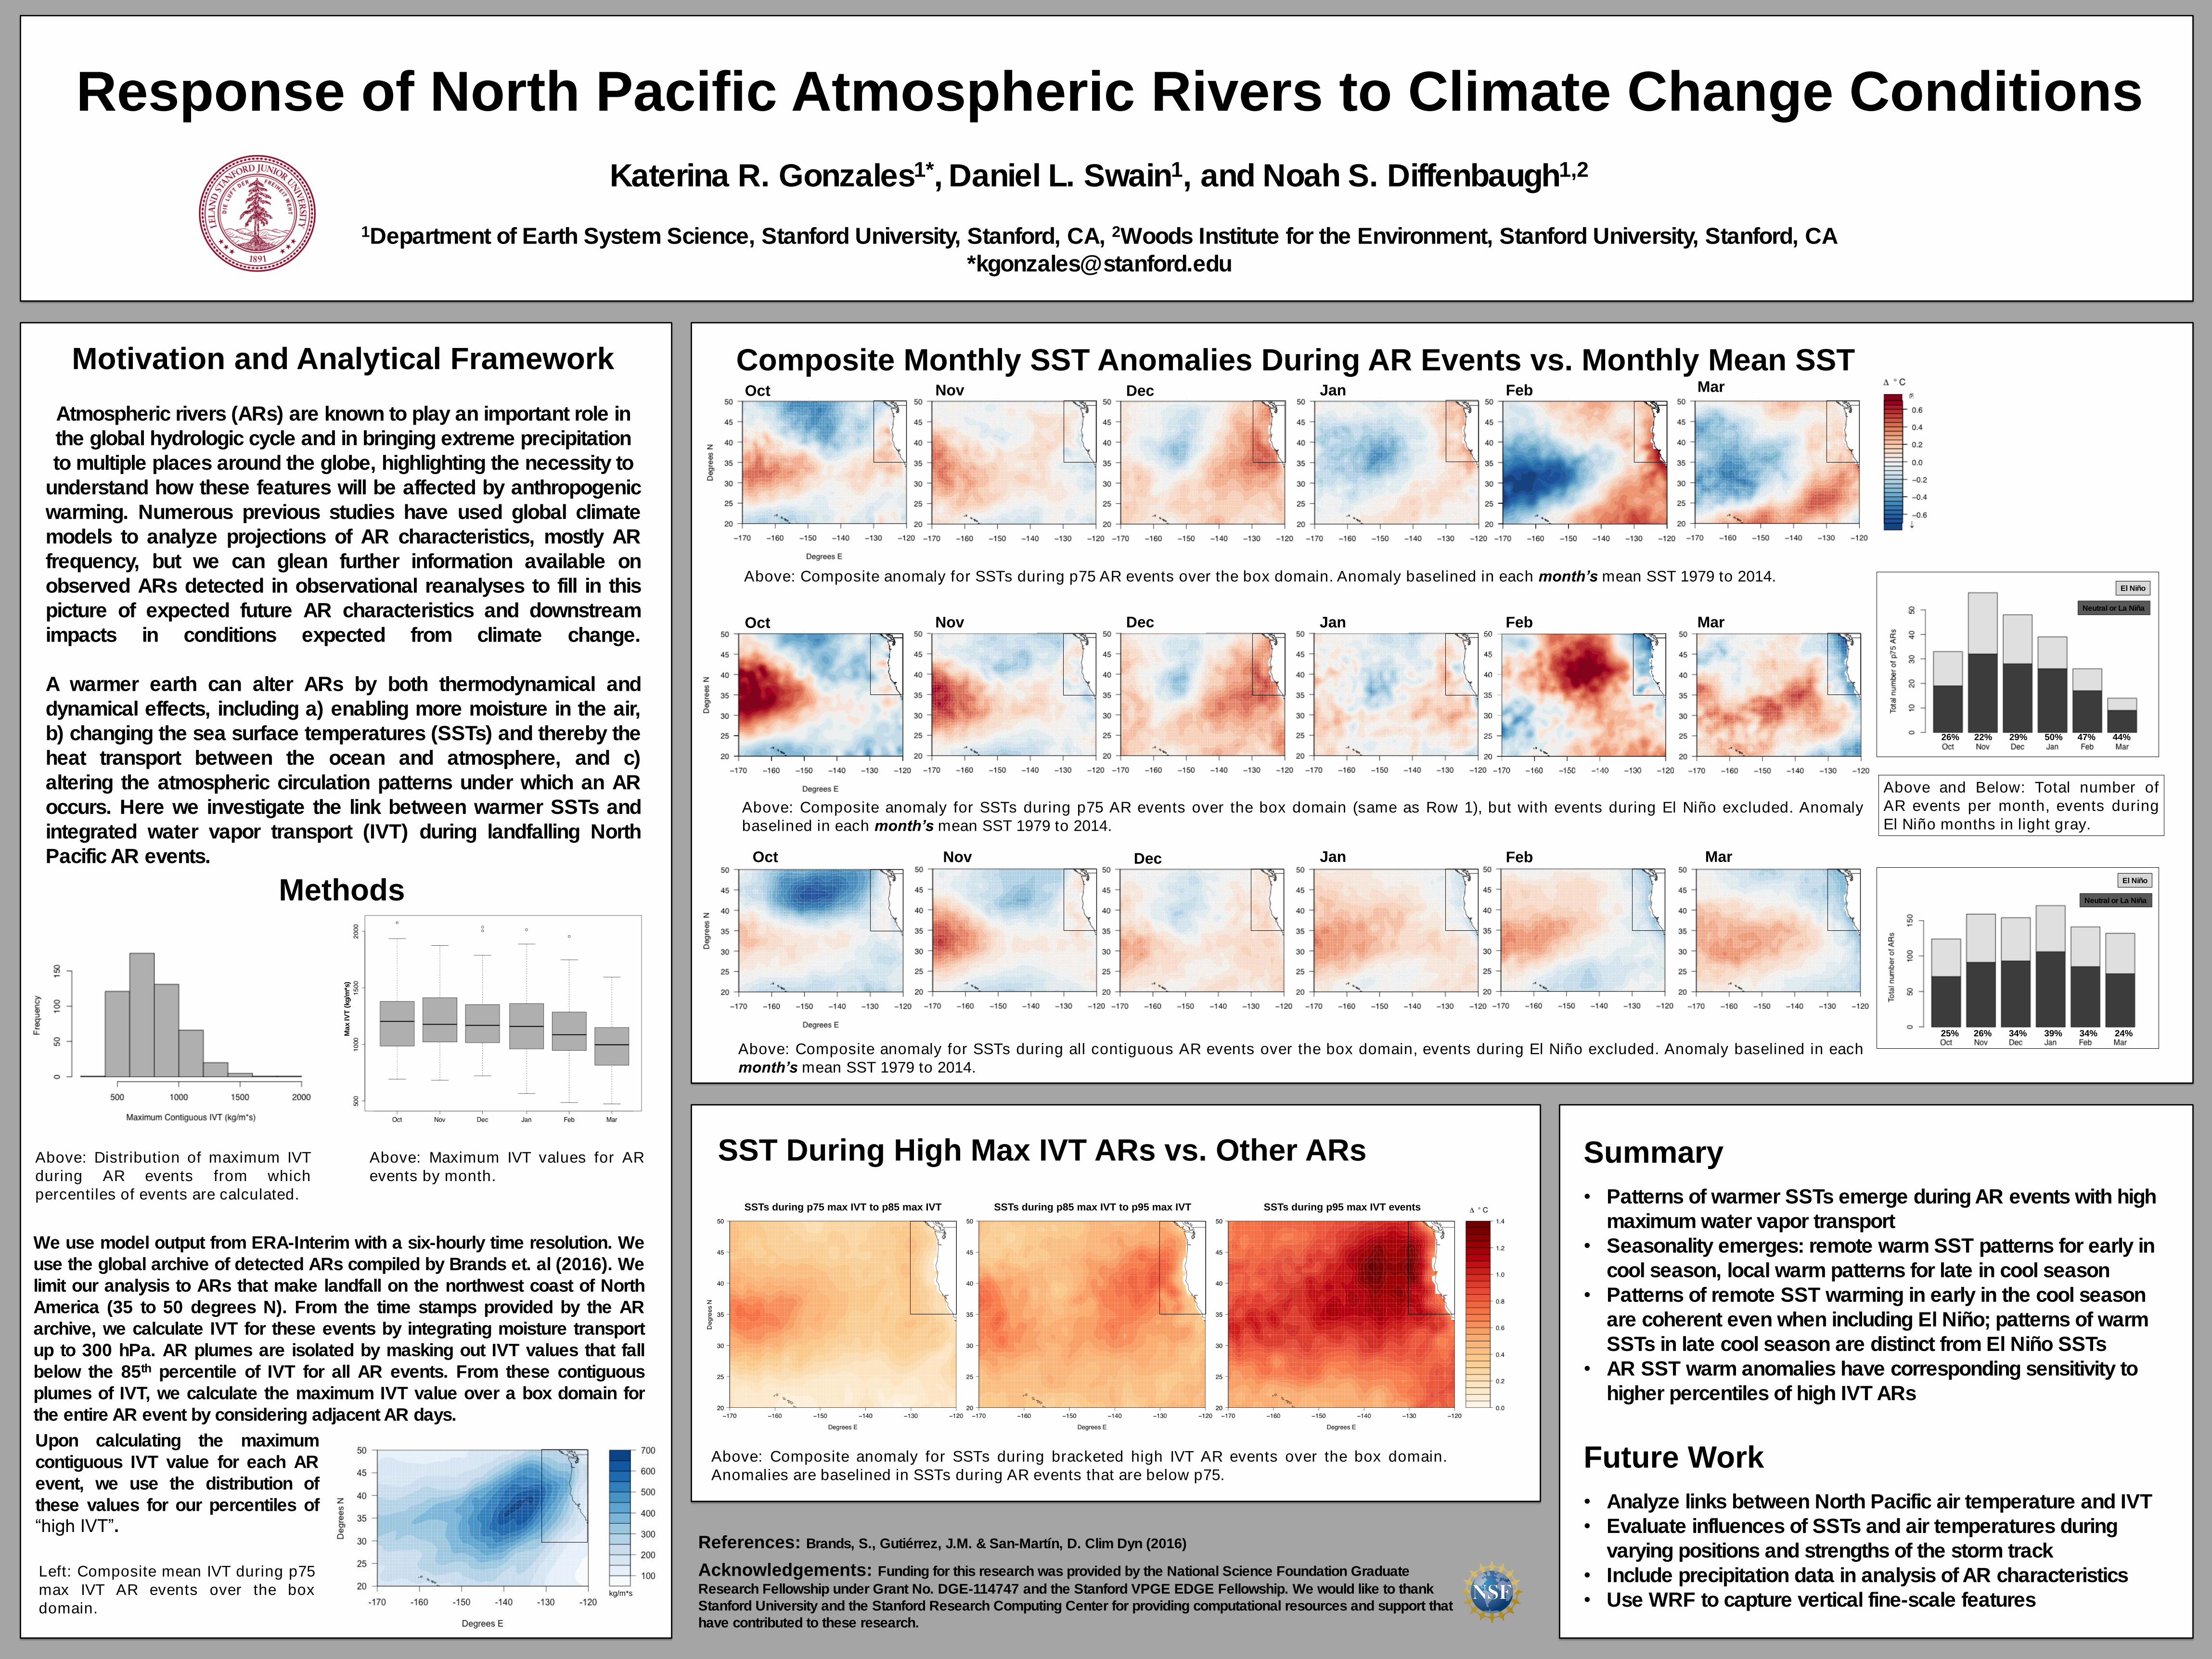
Composite Monthly SST Anomalies During AR Events vs. Monthly Mean SST
Summary
• Patterns of warmer SSTs emerge during AR events with high
maximum water vapor transport
• Seasonality emerges: remote warm SST patterns for early in
cool season, local warm patterns for late in cool season
• Patterns of remote SST warming in early in the cool season
are coherent even when including El Niño; patterns of warm
SSTs in late cool season are distinct from El Niño SSTs
• AR SST warm anomalies have corresponding sensitivity to
higher percentiles of high IVT ARs
Future Work
• Analyze links between North Pacific air temperature and IVT
• Evaluate influences of SSTs and air temperatures during
varying positions and strengths of the storm track
• Include precipitation data in analysis of AR characteristics
• Use WRF to capture vertical fine-scale features
SST During High Max IVT ARs vs. Other ARs
Oct Nov FebJan MarDec
Oct Nov FebJan MarDec
Dec
Above: Distribution of maximum IVT
during AR events from which
percentiles of events are calculated.
Above: Maximum IVT values for AR
events by month.
Left: Composite mean IVT during p75
max IVT AR events over the box
domain.
Above: Composite anomaly for SSTs during all contiguous AR events over the box domain, events during El Niño excluded. Anomaly baselined in each
month’s mean SST 1979 to 2014.
Above: Composite anomaly for SSTs during p75 AR events over the box domain (same as Row 1), but with events during El Niño excluded. Anomaly
baselined in each month’s mean SST 1979 to 2014.
Above: Composite anomaly for SSTs during bracketed high IVT AR events over the box domain.
Anomalies are baselined in SSTs during AR events that are below p75.
Above: Composite anomaly for SSTs during p75 AR events over the box domain. Anomaly baselined in each month’s mean SST 1979 to 2014.
SSTs during p75 max IVT to p85 max IVT SSTs during p85 max IVT to p95 max IVT SSTs during p95 max IVT events
kg/m*s
Ma
x I
VT
(kg
/m*s
)
25% 26% 34% 39% 34% 24%
We use model output from ERA-Interim with a six-hourly time resolution. We
use the global archive of detected ARs compiled by Brands et. al (2016). We
limit our analysis to ARs that make landfall on the northwest coast of North
America (35 to 50 degrees N). From the time stamps provided by the AR
archive, we calculate IVT for these events by integrating moisture transport
up to 300 hPa. AR plumes are isolated by masking out IVT values that fall
below the 85th percentile of IVT for all AR events. From these contiguous
plumes of IVT, we calculate the maximum IVT value over a box domain for
the entire AR event by considering adjacent AR days.
Upon calculating the maximum
contiguous IVT value for each AR
event, we use the distribution of
these values for our percentiles of“high IVT”.
26% 22% 29% 50% 47% 44%
El Niño
Neutral or La Niña
El Niño
Neutral or La Niña
Above and Below: Total number of
AR events per month, events during
El Niño months in light gray.
Oct Nov Jan Feb Mar