response of a depleted sagebrush steppe riparian … · · 2013-05-02united states department of...
TRANSCRIPT
United StatesDepartmentof Agriculture
Forest Service
IntermountainResearch Station
Research PaperINT-RP-492
December 1996
Response of a Depleted SagebrushSteppe Riparian System to GrazingControl and Woody Plantings
Warren P. ClaryNancy L. ShawJonathan G. DudleyVictoria A. SaabJohn W. KinneyLynda C. Smithman

The AuthorsWarren P. Clary is the Project Leader of the Intermoun-tain Research Station’s Riparian-Stream Ecology andManagement Research Work Unit at Boise, ID. He re-ceived a B.S. degree in agriculture from the University ofNebraska, an M.S. degree in range management, anda Ph.D. degree in botany (plant ecology) from ColoradoState University. He joined the Forest Service in 1960 andconducted research on rangelands in Arizona, Louisiana,and Utah. More recently he has focused on riparian-livestock grazing issues in Idaho and adjacent States.
Nancy L. Shaw is a Botanist with the IntermountainResearch Station’s Riparian-Stream Ecology and Man-agement Research Work Unit at the Forestry SciencesLaboratory in Boise, ID. She completed a B.S. degree inzoology at the College of Idaho, an M.S. degree in botanyat Idaho State University, and a Ph.D. degree in cropscience at Oregon State University. She joined the For-est Service in 1979.
Jonathan G. Dudley is a Wildlife Biologist with theIntermountain Research Station at the Forestry SciencesLaboratory in Boise, ID. He received his B.S. degree inwildlife biology from Washington State University in 1988.Jonathan has had a wide range of wildlife experienceincluding positions with USDI Fish and Wildlife Service,Idaho Department of Fish and Game, and Rocky Moun-tain Forest and Range Experiment Station.
Victoria A. Saab is a Research Wildlife Biologist with theIntermountain Research Station’s Riparian-Stream Ecol-ogy and Management Research Work Unit at the ForestrySciences Laboratory in Boise, ID. She completed a B.S.degree in wildlife ecology at Oklahoma State University,an M.S. degree in fish and wildlife management atMontana State University, and a Ph.D. degree in environ-mental biology at the University of Colorado. She joinedthe Forest Service in 1989.
John W. Kinney is a Range Technician with the Inter-mountain Research Station’s Riparian-Stream Ecologyand Management Research Work Unit at Boise, ID. Hereceived a B.S. degree in botany from Weber StateCollege. He joined the Forest Service in 1975 and wasstationed at the Desert Experimental Range in Utah for9 years. He joined the Station’s Riparian-Stream Ecologyand Management Research Work Unit in 1984.
Lynda C. Smithman is a Biological Technician-Plantswith the Intermountain Research Station at the ForestrySciences Laboratory in Boise, ID. She received a B.A.degree in history from the University of Arizona and hascompleted post-graduate courses in botany from theCollege of Idaho. She has had extensive experience asa botanical consultant to both private industry and publicagencies in southern Idaho and eastern Oregon.
Research SummaryConventional wisdom suggests that virtually all ripar-
ian areas respond quickly to improved management or tocomplete protection. To test this assumption a study wasestablished along Pole Creek in the sagebrush steppe ofeastern Oregon. Five management treatments wereexamined: (1) ungrazed and woody species planted, (2)ungrazed, (3) light to moderate spring grazing, (4) light tomoderate fall grazing, and (5) heavy season-long graz-ing. These treatments were evaluated over a 7-yearperiod and the response of riparian and upland plantcommunities, bird and small mammal populations, andstream channel characteristics compared.
Existing herbaceous plant species increased in growthand vigor under reduced grazing (ungrazed and moder-ate grazing treatments), but there was no measurableincrease in occurrence of bank protecting rhizomatouswetland species. A fortuitous flood event occurring at thebeginning of the study provided a favorable seedbed forwillow establishment. These naturally established plantsand those naturally establishing later benefitted fromlight to moderate spring grazing or from complete protec-tion from grazing as compared to light to moderate fallgrazing or heavy season-long grazing, although recov-ery was slowed by wild ungulate use. Significantly im-proved stands of cottonwood and willows developedwhere these species were artificially planted.
After 7 years, populations of nesting birds and smallmammals did not differ among treatments. This lack ofresponse was likely due to the limited habitat improve-ment that occurred during the study. Available literaturesuggests a much more varied bird community was presentearly in the twentieth century.
Stream channel shape (width/depth ratios) appearedto improve somewhat under reduced grazing pressure.However, the lack of rhizomatous grasslike species leftthe streambanks poorly protected. As a result, all treat-ments except those not subjected to grazing experi-enced an increase in width-depth ratios in the latterportion of the study under conditions of extended highstream flows resulting from snowmelt. Recovery of thedegraded uplands and riparian zone of this watershedwill apparently require many years, probably decades.
AcknowledgmentsThis study was made possible by cooperation of local
permittees, landowners, and the U.S. Department of theInterior, Bureau of Land Management, Vale District,Vale, OR.
The authors wish to express their appreciation for thecontributions to the initiation of this study by Dr. Dean E.Medin (deceased).
The use of trade or firm names in this publication is for reader information and does notimply endorsement by the U.S. Department of Agriculture of any product or service.

1
Introduction ____________________Since the mid-1800’s, alteration of low-elevation
streams of the sagebrush steppe by human activities,particularly livestock grazing, has frequently resultedin local loss of wetland plants (Kauffmann and Krueger1984; Thomas and others 1979; US-GAO 1988) andanimal species (Bock and others 1993; Saab and others1995; Sedgwick and Knopf 1987). Riparian (stream-side) areas within the sagebrush ecosystem (see ap-pendix A for plant scientific names) are particularlysusceptible to livestock concentrations and grazingdamage (Berry 1979). Defoliation, soil compaction,and floodplain water table subsidence, due to channelwidening or downcutting, have resulted in loss ofdensely rooted sedges and rushes, as well as willows,cottonwoods, and other woody species (Armour andothers 1994; Berry 1979; Kovalchik and Elmore 1992).Banks are left poorly protected and produce largequantities of sediment as they erode. They may be amajor source of a stream’s sediment load (Hansen1971; Trimble and Mendel 1995). Negative effects ofdestabilized riparian areas on overall watershedstability, water quality, animal populations and habi-tat, human recreation, aesthetic, and economic useshave been extensively documented (Chaney and oth-ers 1990; Platts 1991; Saab and others 1995; US-GAO1988).
Conventional wisdom and general observation sug-gest many degraded riparian areas recover quicklywhen stressful impacts, such as improper grazing, areremoved (Chaney and others 1993; Krueper 1993).Skovlin (1984) suggested that, on average, a 75 per-cent recovery of fish and wildlife habitat conditions
Response of a DepletedSagebrush Steppe RiparianSystem to Grazing Controland Woody Plantings
Warren P. ClaryNancy L. ShawJonathan G. DudleyVictoria A. SaabJohn W. KinneyLynda C. Smithman
could occur in approximately 5 years. However, Szaroand Pase (1983) found little response within a cotton-wood-ash-willow association after 4 years of protec-tion from grazing, and Knopf and Cannon (1982)reported 10 to 12 years were insufficient for riparianwillow communities to recover from excessive grazing.The ability of streams, associated vegetation, andwildlife populations to recover naturally after reduc-tions in grazing stress appear to be situation specificand related to site characteristics, degree of degrada-tion, and availability of native plant materials (Krueper1993; Shaw 1992).
Existing grazing management approaches, however,may not be capable of correcting cattle impacts onriparian habitats (Platts 1991) because response ofriparian areas to grazing practices has been inconsis-tent (Kauffman and Krueger 1984). These inconsis-tencies may result because inadequate site-specificinformation is used in management design or becausea variety of different procedures are often lumpedunder a single “practice” (Marlow and Pogacnik 1985).There are also problems associated with evaluatingsite potential, and therefore, difficulty in interpretingthe degree of response to management changes.
In the current study, we examined the response of adepleted riparian ecosystem to five treatments ap-plied over 7 years; (1) ungrazed/planted, (2) ungrazed,(3) light to moderate grazed in the spring, (4) light tomoderate grazed in the fall, and (5) heavily grazedseason-long. Data are presented on vegetation, bird,small mammal, and channel changes in response tothe five treatments from 1987 to 1993. Further, suc-cess of woody plantings in the ungrazed/planted treat-ment is evaluated.

2
Study Area _____________________The study was conducted in the Pole Creek drainage
of the Poall Creek grazing allotment located in theeastern foothills of the Cottonwood Mountains inMalheur County, OR (44°15'N 117°35'W). Cattle grazethe Poall Creek allotment from April 1 to September30 in even years and from July 1 to October 31 in oddyears (USDI-BLM 1982, 1987). Thus, although springdeferment occurred every other year, the allotmentwas grazed heavily each year.
Climate of the area is semiarid. Annual precipita-tion is 244 mm with 61 percent falling from Octoberthrough March (USDC-NOAA 1986-1993). Annualtemperature at Vale, OR, the nearest reporting sta-tion, is 10 °C; ranging from –3 °C in January to 23 °Cin July. Soils are derived from a combination of basaltand rhyolite, varying from shallow and rocky soils onridges to deep alluvial deposits in former wet meadowsand sandy, gravelly, or cobbly deposits adjacent tostream channels and on flood plains. Upland slopeswithin the study pastures average 33 percent.
Pole Creek is perennial and spring-fed with a 2.5 to3 percent gradient, sinuosity of 1.2, and a relativelyuniform base flow of about 0.03 m3/s. Streamsideelevation ranges from 880 to 975 m. Except for its lowsinuosity, the stream approximates a Rosgen classifi-cation of C3b to C4b (Rosgen 1994). Loss of nativeriparian bank-stabilizing vegetation has resulted inwidening and downcutting of the stream channel—insome cases to bedrock. The incised banks created bythis process are 1 to 3 m or more in height. The narrowflood plain developing between the incised banks gen-erally ranges from 10 to 30 m in width. Flood eventsovertopping the low active-channel banks of the devel-oping flood plain typically result from snowmelt flowsin late winter and from rainstorm events in summer.
The Pole Creek riparian system is considered lessthan stable because uplands are susceptible to severeerosion events during high intensity rainstorms (fig. 1),annual stream channel shifts, and limited protectionprovided by the current weedy streambank vegeta-tion. Unstable sandbars are initially colonized byhorsetail and speedwell species (see appendix A forplant scientific names). Sediments on low banks andterraces support Kentucky bluegrass and creepingbentgrass. Drier benches supporting exotic annualsgrade into the sagebrush community.
A limited description of the area provided by Peck(1911), and remnant plants, logs, and seedlings sug-gest that previous to livestock grazing woody ripariancommunities may have included coyote willow, whip-lash willow, narrow-leaved cottonwood, and blackcottonwood. Remnant shrubs associated with the ri-parian area include blue elderberry, Wood’s rose, andcommon chokecherry. Although a large component ofsedges and rushes, for example Nebraska sedge andBaltic rush, would also normally be expected in ariparian system such as Pole Creek (Crouse andKindschy 1984; Griffiths 1903; Peck 1911), few arepresent.
Uplands within the watershed are steep (25 to 45percent slopes). We would expect potential naturalupland communities in this area to contain a substan-tial component of bluebunch wheatgrass, Sandberg’sbluegrass, Thurber’s needlegrass, needle-and-thread,and some bottlebrush squirreltail (Hironaka and oth-ers 1983). However, these plant communities havebeen substantially depleted. The majority of the up-land sites currently support Wyoming big sagebrush/cheatgrass plant communities. A stiff sagebrush/Sandberg’s bluegrass habitat type is restricted torocky, basalt sites with shallow soils.
Figure 1—Erosional deposits in the riparian area following a high intensity thunderstorm (A), rilling on anupland site that occurred during the same storm (B).
A B

3
Methods _______________________
Pasture Treatments
Ten experimental pastures ranging in area from 4.0to 5.5 ha were established along a 5 km segment ofPole Creek in 1987. Five grazing treatments wereapplied from 1987 to 1993 in a completely randomizeddesign with two replications. Treatments were; (1)ungrazed with plantings of woody species, (2) ungrazed,(3) spring grazing, light to moderate intensity, (4) fallgrazing, light to moderate intensity, and (5) season-long, heavy grazing. All pastures except those grazedseason-long were fenced to exclude domestic livestock,but not large native ungulates such as deer and elk.Pastures grazed season-long were unfenced and weregrazed with the remainder of the allotment. They werelocated approximately 0.5 km from the nearest fencedpastures to avoid a water-gap concentration effect intheir use. Spring (mid-May) and fall (early October)grazing treatments were applied by releasing fourcow/calf pairs into each pasture for about 10 days. Thetreatment objective was to apply grazing pressure, butnot to exceed 50 percent utilization by weight atstreamside, particularly in Kentucky bluegrass andcreeping bentgrass community types. The latter gen-erally represented the most stable communities alongthe degraded riparian system. Some unplanned graz-ing occurred in the ungrazed treatments. Precipita-tion was measured at Brogan, OR, 3 km southeast ofthe study site.
Herbaceous Vegetation and ShrubSampling
Eighty plots within the riparian area of each pasturewere arranged on 20 variable-length transects withfour 50 by 50 cm (0.25 m2) plots per transect. Transectstransversed the stream, and end points were locatedinside perpendicular secondary banks, if present. Inareas with sloping banks, the riparian area border(and end point of the transect) was defined as the pointwhere the bank attained an elevation of 1 m above thenormal summer stream surface. Upland vegetationwas sampled on up to 100 plots located at 20 m intervalswithin a square 4 ha grid centered on the stream. Thissampling grid provided a broad characterizationof the upland pasture vegetation.
Canopy cover (Daubenmire 1959) was ocularly esti-mated for graminoids, forbs, and shrubs in each ripar-ian or upland plot in 1987, 1990, and 1993. Maximumvegetative heights (not flower or seed head heights)were also recorded for graminoids, forbs, and shrubs.In addition, aboveground biomass was estimated byclipping current annual growth of shrubs and herba-ceous vegetation to ground level on temporary 0.25 m2
plots located adjacent to every tenth plot. Regression
relationships between biomass and the product ofplant cover times vegetative height were used toestimate biomass values for all plots (Blankenshipand Smith 1966).
Ocular estimates of percentage forage utilization byweight (Pechanec and Pickford 1937) were taken fromeach plot in grazed pastures following their respectivegrazing periods from 1987 to 1993. Utilization wasestimated to the nearest 5 percent for graminoids,forbs, and shrubs. Six reference cages were placed ineach grazed pasture to serve as a comparison forocular estimates. Cages were relocated at the begin-ning of each grazing period. Average heights of re-sidual plants within each plot were recorded for plantgroups at the end of each grazing period, and in thecase of spring grazed pastures, again at the end ofeach growing season from 1989 through 1993.
Natural Regeneration of Woody RiparianPlants
Natural willow recruitment and growth were evalu-ated annually in early October from 1987 through1993 in each of the four treatments not planted withwoody species (ungrazed, spring grazed, fall grazed,and season-long grazed). Twenty 5 m wide belt transectswere placed perpendicular to the stream in each of theeight pastures receiving one of these treatments.Transect length varied to best encompass the corridorof stream-affected vegetation. Width of active andslack water and total length were recorded for eachtransect. Species, height, number of basal stems, dis-tance from water, dominant understory plant species,substrate texture, and use by livestock or wildlife wererecorded for each willow encountered in each belttransect. In the last year of the study all woodyriparian plants in all treatments, including theungrazed/planted treatment, were counted and stemdiameters measured on 3 by 3 m plots centered overeach of the eighty 0.25 m2 riparian transect plotsestablished for sampling herbaceous vegetation andsmall shrubs.
Woody Plantings
Willow and Cottonwood Plantings—Coyote wil-low and whiplash willow cuttings of current year’sgrowth were harvested in August 1986 from the Wil-low Creek drainage about 8 km northeast of theexperimental pastures. Cuttings were packed in cool-ers and transported to a commercial greenhouse wherethey were planted in 130 cm3 Leach Tubes and rooted.By May 1987, cuttings were well rooted, leafy, andactively growing. Stem heights at planting rangedfrom about 15 to 30 cm.
Willow cuttings of each species were planted on plotswithin the two ungrazed/planted pastures in May

4
1987. Plots were characterized by three separate plantcommunities and conditions; (1) undisturbed overbankareas with a thick Kentucky bluegrass sod, (2) overbankareas from which the Kentucky bluegrass sod wasremoved mechanically, and (3) recent depositionalsurfaces vegetated largely by species of speedwell andhorsetail (speedwell community). Eight coyote willowand eight whiplash willow cuttings were planted ran-domly on approximately 1.7 m centers in each plot.Plot size and shape varied, depending on local distribu-tion of plant communities, and ranged from about 5 by20 m to 8 by 10 m. Planting bars made from 1.2 cmrebar were used to open planting holes as the sub-strate was generally gravelly or stony and highlycompacted. Treatments were replicated three times.
Survival and height of each planted willow cuttingwas measured in June and August 1987. Survival,growth, and understory vegetation associated witheach cutting were also assessed annually in Octoberfrom 1987 through 1990 when the willows were con-sidered established. Annual measurements includedsurvival, height, maximum and minimum crown di-ameter, understory composition (percent cover by spe-cies within 1 m2 willow-centered plots [Daubenmire1959]), and a subjective estimate of use by livestock orbig game.
Supplemental plantings of about 210 coyote willowand 230 whiplash willow cuttings were conducted inthe riparian zone in each of the two ungrazed/plantedpastures. Cuttings of each species were planted ran-domly on approximately 1.7 m centers throughout mostKentucky bluegrass and speedwell communities inthese areas. Planting was interrupted by a high inten-sity rainstorm that uprooted, buried, or physicallydamaged some cuttings, necessitating partial re-planting. Survival and height of the willows weremeasured in June and August 1987.
About 25 dormant rooted cuttings of narrow-leavedcottonwood were planted in each of the two ungrazed/planted pastures in March 1987. Cuttings propagatedin 8-liter containers were purchased from a commer-cial nursery. Stem heights at planting ranged from 50to 75 cm. Cuttings were planted on 1.7 m centers inKentucky bluegrass communities not planted with
rooted willow cuttings. Survival and growth of 16 ofthese cottonwoods planted in four plots of four cut-tings were monitored as described for the willowcuttings planted in experimental plots.
Shrubs—Dormant nursery stock of four native andone introduced nonsalicaceous shrub species commonlyassociated with the border of riparian areas wereplanted in the two ungrazed/planted pastures in March1987 (table 1). Stock was purchased from commercialnurseries as the timeframe for planting precludedcollection and propagation of local plant materials.
Shrubs were planted in plots on three aspects; (1)north slopes, (2) south slopes, and (3) flats. North andsouth aspect plots were located on incised, but slop-ing streambanks. Plots on the flats were located onlow, dry benches within the flood plain. Plot sizes andshapes differed due to local variability in site condi-tions. All sites were dominated by scattered Wyomingbig sagebrush with an understory of cheatgrass andother exotic annuals. Five seedlings of each shrub spe-cies were planted randomly on approximately 1.7 mcenters in a grid within each plot. Each seedling wasplanted in the center of a 1 m2 scalp mechanicallycleared of vegetation. Planting holes were preparedusing a tapered auger (USDA-FS 1988a). Each aspecttreatment was replicated three times. Sixty additionalseedlings of each shrub species were also planted ineach of the two rehabilitation pastures on micrositesdeemed most appropriate for each species.
Plantings were evaluated as described for willowsand cottonwoods planted in experimental plots. Con-tribution of planted willows, cottonwoods, and shrubsto community structure was estimated annually dur-ing the herbage and small shrub sampling in eachpasture and through the woody plant sampling con-ducted in all pastures in 1993.
Birds and Small Mammals
The sampling grid for vegetation provided a frame-work for surveying breeding land birds and smallmammals. Breeding birds were sampled in 4 ha gridsin each pasture using the spot mapping method (Inter-national Bird Census Committee 1970). Seven or eight
Table 1—Native and introduced species of dormant containerized and bareroot nursery stock and height attime of planting in the ungrazed/planted pastures in March 1987.
Local Stem heightSpecies Common name native Planting stock at planting
cmClematis ligusticifolia Western clematis Yes Container (4-liter) Dies backCornus stolonifera Red-osier dogwood Yes Bareroot 60Prunus virginiana Common chokecherry Yes Bareroot 45Rhus trilobata Squawbush No Container (4-liter) 10-15Rosa woodsii Wood’s rose Yes Bareroot 45

5
visits were made to each pasture from May 1 to June13 in 1987, 1990, and 1993. Each visit was conductedfrom 0630 to 1530. Beginning and ending points forsurveys varied between visits to ensure unbiased sitecoverage. At the end of the sampling period, territorieswere mapped for each species. Clusters of observedbreeding activity were studied to indicate approxi-mate territories (International Bird Census Commit-tee 1970). Fractional portions of territories estab-lished along pasture boundaries were included. Thenumber of territories were determined for each speciesto provide an estimate of breeding bird pairs (territo-ries per ha) by treatment. Species richness was alsodetermined for each treatment.
Small mammals were trapped in a 1.6 ha grid ineach pasture centered along the stream and includingupland and riparian vegetation. Forty trap stations,placed 25 m apart, were established within each grid.Two Museum Special mouse traps and one Victor rattrap were set around each station. Traps were baitedwith a mixture of peanut butter and rolled oats duringa 3 consecutive-night trapping period in each pasture.Trapping dates ranged from August 8 to September 11in 1987, 1990, and 1993. Species, gender, and weightwere determined for individuals trapped. Small mam-mal relative abundances (number per trap night) wereestimated for each treatment and species richnessdetermined.
Channel Morphology and StreambankCharacteristics
Channel cross-section measurements were taken ateach of the 20 transect locations per pasture in 1987,1990, and 1993. Measurements included stream wettedwidth, wetted depth, and bank angle (Platts andothers 1987). Stream shape (straight, concave, or con-vex) and stream stability (Kozel and others 1993) werealso rated for each transect. Stream channel gradientwas determined by survey instrument. For each ploton the riparian transects, texture of the soil surface,depth to a gravel (or coarser texture) layer, elevationabove the water surface, and distance from the water’sedge were recorded. Stream classification for the en-tire study reach was estimated from Rosgen (1994).
Gravimetric soil moisture samples from a depth of0 to 15 cm were taken from every fifth plot in the uplandand riparian sampling areas for pastures 1 and 6 in1987, from all plots in the riparian areas of pastures 1,3, 5, and 6 in 1988 to 1989, and from all plots alongevery other riparian transect in all pastures duringlate summer 1994.
Statistical Analysis
Analyses were based on individual grazing treat-ments and upon the following groupings of treatments;
(1) no grazing (ungrazed pastures with and withoutplanting), (2) moderately grazed pastures (light tomoderate spring or fall grazing), and (3) heavily grazedpastures (unfenced and grazed in conjunction with thesurrounding allotment). Analyses of covariance wereperformed using a General Linear Model for quantita-tive characteristics of herbaceous and shrubby vegeta-tion, bird and small mammal densities, and streamchannel cross-section characteristics. The initial read-ing (1987) was used as a covariate to compensate forlarge initial variability among pastures due, in part, toa localized flood in May 1987. Analyses of utilizationdata were conducted without a covariate.
Because of the variability in streamside plant compo-sition, particularly after 1987 floods, production andutilization analyses were made only on sample plotssupporting sod-forming species as these areas ap-peared to have a greater potential to respond to graz-ing management. Sod-forming species included: creep-ing bentgrass, Kentucky bluegrass, common horsetail,and occasionally common threesquare, Baltic rush,and small-winged sedge. An average of 48 plots perpasture were used in these analyses.
Further analyses of vegetation data included anexamination of the frequency of plots dominated byvarious species components. In the riparian area theseincluded plots dominated by the entire group of sod-forming species, known as the “sod-former” group, aswell as plots with sedge or rush dominants or sedge orrush presence only. Tests for upland areas includedchange in numbers of plots dominated by perennialbunch grasses (Sandberg’s bluegrass, bottlebrushsquirreltail, and occasionally bluebunch wheatgrass),those plots dominated by exotic bromes (primarilycheatgrass), those dominated by exotic forbs (such aspale alyssum, Canada thistle, stork’s-bill, hornseedbuttercup, and Jim Hill mustard, among others), andthose dominated by sagebrush or rabbitbrush in re-sponse to the grazing treatments.
Native willow seedling recruitment and growth;survival and growth of planted willows, shrubs, andcottonwoods; and estimates of cover, litter, and bareground on transplant plots were compared by treat-ments and years using two-way, repeated-measuresanalyses of variance. Means and standard errors (±se)are presented for shrub survival and growth measure-ments when low survival or loss of replications pre-cluded statistical analyses. One-way analyses of vari-ance were used to compare shrub and herbaceousunderstory cover by aspect for shrub plantings in1990. Two-way analyses of variance by willow speciesand treatment were used to compare distance of natu-rally occurring willows from active water in 1990, andto compare the proportion of planted (1990) or natu-rally occurring willows (1993) growing beyond reach ofwild ungulates.
6
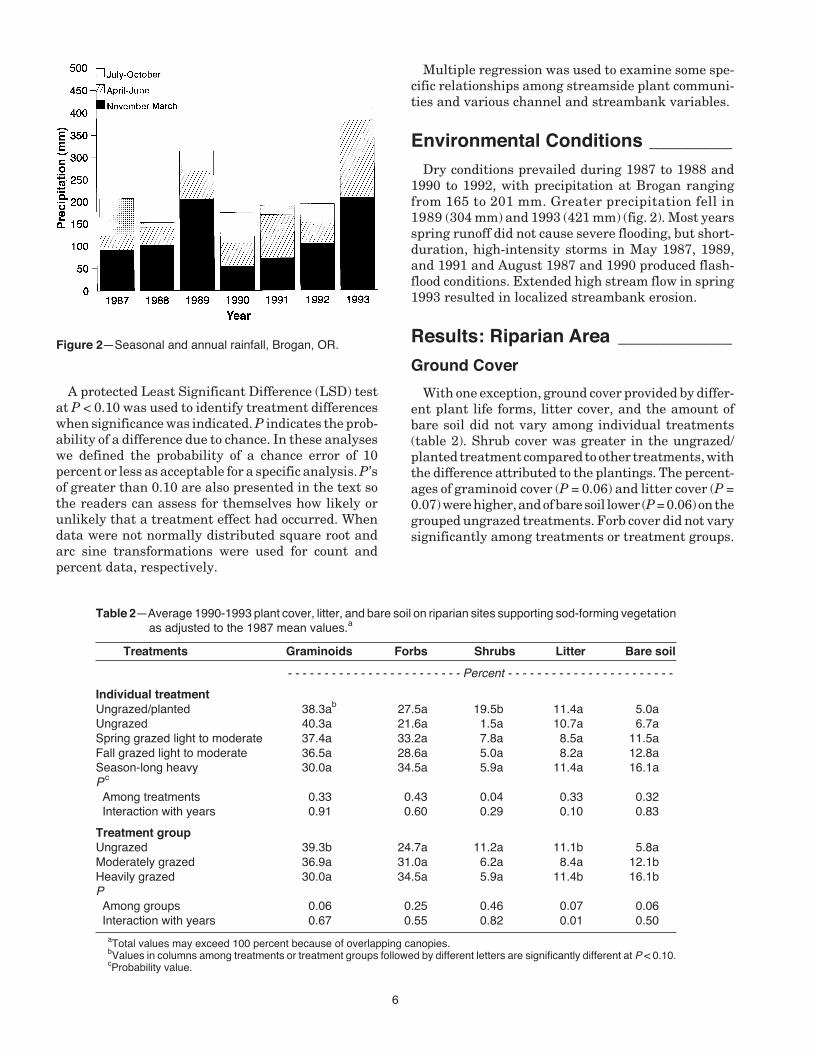
Figure 2—Seasonal and annual rainfall, Brogan, OR.
Multiple regression was used to examine some spe-cific relationships among streamside plant communi-ties and various channel and streambank variables.
Environmental Conditions ________Dry conditions prevailed during 1987 to 1988 and
1990 to 1992, with precipitation at Brogan rangingfrom 165 to 201 mm. Greater precipitation fell in1989 (304 mm) and 1993 (421 mm) (fig. 2). Most yearsspring runoff did not cause severe flooding, but short-duration, high-intensity storms in May 1987, 1989,and 1991 and August 1987 and 1990 produced flash-flood conditions. Extended high stream flow in spring1993 resulted in localized streambank erosion.
Results: Riparian Area ___________
Ground Cover
With one exception, ground cover provided by differ-ent plant life forms, litter cover, and the amount ofbare soil did not vary among individual treatments(table 2). Shrub cover was greater in the ungrazed/planted treatment compared to other treatments, withthe difference attributed to the plantings. The percent-ages of graminoid cover (P = 0.06) and litter cover (P =0.07) were higher, and of bare soil lower (P = 0.06) on thegrouped ungrazed treatments. Forb cover did not varysignificantly among treatments or treatment groups.
Table 2—Average 1990-1993 plant cover, litter, and bare soil on riparian sites supporting sod-forming vegetationas adjusted to the 1987 mean values.a
Treatments Graminoids Forbs Shrubs Litter Bare soil
- - - - - - - - - - - - - - - - - - - - - - - - Percent - - - - - - - - - - - - - - - - - - - - - - -
Individual treatmentUngrazed/planted 38.3ab 27.5a 19.5b 11.4a 5.0aUngrazed 40.3a 21.6a 1.5a 10.7a 6.7aSpring grazed light to moderate 37.4a 33.2a 7.8a 8.5a 11.5aFall grazed light to moderate 36.5a 28.6a 5.0a 8.2a 12.8aSeason-long heavy 30.0a 34.5a 5.9a 11.4a 16.1aP c
Among treatments 0.33 0.43 0.04 0.33 0.32 Interaction with years 0.91 0.60 0.29 0.10 0.83
Treatment groupUngrazed 39.3b 24.7a 11.2a 11.1b 5.8aModerately grazed 36.9a 31.0a 6.2a 8.4a 12.1bHeavily grazed 30.0a 34.5a 5.9a 11.4b 16.1bP Among groups 0.06 0.25 0.46 0.07 0.06 Interaction with years 0.67 0.55 0.82 0.01 0.50
aTotal values may exceed 100 percent because of overlapping canopies.bValues in columns among treatments or treatment groups followed by different letters are significantly different at P < 0.10.cProbability value.
A protected Least Significant Difference (LSD) testat P < 0.10 was used to identify treatment differenceswhen significance was indicated. P indicates the prob-ability of a difference due to chance. In these analyseswe defined the probability of a chance error of 10percent or less as acceptable for a specific analysis. P’sof greater than 0.10 are also presented in the text sothe readers can assess for themselves how likely orunlikely that a treatment effect had occurred. Whendata were not normally distributed square root andarc sine transformations were used for count andpercent data, respectively.

7
Herbaceous Vegetation
Substantial variability in initial conditions occurredwithin and among pastures due to heavy floodingthe first spring and summer of the study (1987). After7 years, some riparian areas still consisted of a braidedstream flowing through dry gravel deposits. In suchareas little improvement in riparian habitat condi-tions occurred under any grazing treatment. Theseareas were typically unvegetated or supported exoticannuals such as cheatgrass, common mullein, bullthistle, and common cocklebur. Species of the sod-former group, listed earlier, characterized the morestable riparian areas.
Forage Utilization—Average utilization rates ofsod-formers (percent of weight removed) over the 1987-1993 period varied from 4 percent across all ungrazedpastures to 70 percent in heavily grazed pastures(table 3). Residual forage stubble heights, measured1989 to 1993, were reduced approximately 80 percentby the heavy grazing treatment. Both utilization andresidual stubble height illustrate substantial differ-ences (P < 0.01) among grazing treatments in theriparian area of Pole Creek, although the response bytreatment was not similar in every year because of1991 unplanned grazing of ungrazed pastures (treat-ment x year interaction, P < 0.01).
Utilization rates for forbs between 1988 to 1993were lower than for sod-forming plants (table 3). Therange of weight removed was approximately 2 percent
Table 3—Average herbage utilization (1987-1993) and residual plant heights (1989-1993) on riparian sites supporting sod-forming species.
Grazing use of sod-formers Grazing use of forbsStubble height Post season
Treatments Utilization Post grazing Post season Utilization stubble height
Percent - - - - - - - - - - cm - - - - - - - - - - - Percent cmIndividual treatmentUngrazed/planted 0.1aa 28.6d 28.6d 0.2a 29.0dUngrazed 8.4b 24.6c 24.6c 2.5a 18.0bSpring grazed light to moderate 21.4c 14.3b 23.3c 5.9b 20.0cFall grazed light to moderate 42.4d 12.4b 12.4b 9.8c 13.5bSeason-long heavy 70.3e 5.2a 6.5a 18.7d 4.0aPb
Among treatments <0.01 <0.01 <0.01 <0.01 <0.01 Interaction with years <0.01 0.03 0.01 <0.01 0.74
Treatment groupUngrazed 4.2a 26.6c 26.6c 1.4a 23.5cModerately grazed 31.9b 13.4b 17.8b 7.8b 16.8bHeavily grazed 70.3c 5.2a 6.5a 18.7c 4.0aP Among groups <0.01 <0.01 <0.01 <0.01 <0.01 Interaction with years 0.34 0.42 0.29 <0.01 0.91
aValues in columns among treatments or treatment groups followed by different letters are significantly different at P < 0.10.bProbability value.
to 19 percent and varied among treatments (P < 0.01).A strong reduction in utilization rates for forbs in thelatter part of the study resulted in a significant inter-action with years (P < 0.01).
Standing Crop Biomass—Both total herbagestanding crop and that produced only by sod-formersdiffered among treatments (P < 0.01); standing crop onungrazed/planted and ungrazed pastures was higherthan on moderately grazed pastures, and all fourtreatments had higher standing crop than the heavilygrazed pastures (table 4).
The greatest amount of increase in standing cropbiomass through time (Treatment[T] x Years[Y], P < 0.01)occurred in pastures with the least amounts of graz-ing—an apparent increase in general vigor of existingplants (fig. 3). A similar, but less consistent, effect onforb biomass standing crop occurred in response tograzing intensity (table 4). The interaction with yearswas not significant (P = 0.33).
Herbaceous Species Composition—We exam-ined the frequency of plots (Hyder and others 1966)whose cover was dominated by “desirable” species,that is, sod-forming species in general, and moreimportantly, rhizomatous wetland species as an indi-cation of response to grazing. The number of plotsdominated by sod-formers, listed earlier, did not varyby treatment (P = 0.57) and treatment means did notdiffer in their response to time (T x Y, P = 0.99) (table 5)(fig. 3). There was no apparent increase in frequency

8
Table 4—Average 1990-1993 herbaceous standing crop onriparian sites supporting sod-forming species asadjusted to the 1987 mean values.
Herbaceous biomassTreatments Total Sod-formers Forbs
- - - - - - - - g/0.25 m2 - - - - - - -Individual treatmentUngrazed/planted 72.8ca 55.6c 17.2bUngrazed 72.1c 59.4c 12.7abSpring grazed
light to moderate 60.2b 43.4b 16.8bFall grazed
light to moderate 57.7b 41.1b 16.6bSeason-long
heavy 31.6a 23.6a 7.0aPb
Among treatments <0.01 <0.01 0.10 Interaction <0.01 <0.01 0.35
with years
Treatment groupUngrazed 72.5c 57.7c 14.8bModerately grazed 59.0b 42.3 b 16.7bHeavily grazed 31.6a 23.6a 7.0aP Among groups <0.01 <0.01 0.04 Interaction
with years <0.01 <0.01 0.33
aValues in columns among treatments or treatment groups followedby different letters are significantly different at P < 0.10.
bProbability value.
of sod-formers related to reduced grazing stress. Like-wise, numbers of plots dominated by members of thewetland families Cyperaceae and Juncaceae (such assedges, bulrushes, and rushes), expected to dominateon wet streamside areas, did not differ (P = 0.96)among treatments (table 5). However, when all plotsthat contained any occurrence of Cyperaceae or
Figure 3—Change in plant vigor, but not in species composition 1987 (A) to 1993 (B) in an ungrazed pasture.
Juncaceae were considered for grouped treatments, amodest improvement trend was noted in the herba-ceous composition of the streamside areas related tograzing treatment (P = 0.09). The presence of wetlandspecies increased on ungrazed pastures compared tothose with moderate or heavy grazing. The proportionof forbs in the biomass composition averaged 30 per-cent. It did not vary significantly among treatments(P = 0.43) and showed no trend of response to treat-ment through time (T x Y, P = 0.55) (fig. 4).
Woody Plants
Naturally Regenerating Willows—In 1987 onlya few small, heavily browsed willows grew within thestudy area. Scattered seed-producing willows occurreddownstream with the nearest, a whiplash willow,growing about 0.5 km below the pastures. Additionalseed sources may be present several kilometers abovethe study area at the head of the watershed. Somenaturally occurring willows in the pastures respondedto treatments and began producing seed by 1990.
New willow seedlings were observed during eachyear of the study. Most seedlings established on open,saturated sediment surfaces; sediments supportingspeedwell or horsetail species; or in slack water. Scat-tered seedlings were observed along dry channels andin Kentucky bluegrass communities. In 1993, about95 percent of all naturally occurring willows grewwithin 1.6 m of active water.
Willow density fluctuated over time with contrast-ing trends developing for coyote willow and whiplashwillow. Few coyote willow seedlings established in1987, but their density increased from 1987 to 1989,remaining generally stable through 1993 (P = 0.01)(fig. 5). Over the 7-year period, coyote willow densityvaried significantly with treatment and was greatest(P = 0.04) in spring-grazed pastures, intermediate in
A B

9
Table 5—Number of plots on which at least 25 percent of the cover was occupied by sod-formersor by Cyperaceae/Juncaceae, and number of plots where Cyperaceae/Juncaceaewere present (n = 80). Average of 1990-1993 as adjusted to the 1987 mean values.
Cyperaceae or Cyperaceae orSod-formers Juncaceae Juncaceae
Treatments dominated dominated present
- - - - - - - - - - - - - - Number/pasture - - - - - - - - - - - - - - -Individual treatmentUngrazed/planted 41.8aa 4.6a 8.3aUngrazed 52.5a 3.1a 11.3aSpring grazed light to moderate 45.1a 2.9a 5.7aFall grazed light to moderate 42.2a 2.9a 4.7aSeason-long heavy 42.3a 2.7a 4.3aPb
Among treatments 0.57 0.96 0.33 Interactions with years 0.99 0.62 0.74
Treatment groupUngrazed 46.8a 3.8a 9.8bModerately grazed 43.2a 2.9a 5.2aHeavily grazed 42.3a 2.7a 4.3aP Among groups 0.68 0.87 0.09 Interaction with years 0.87 0.84 0.40
aValues in columns among treatments or treatment groups followed by different letters are significantlydifferent at P ≤ 0.10.
bProbability value.
Figure 4—A forb-dominated site in a spring-grazed pasture that demonstrated no trend toward establishmentof wetland sod-forming species, 1987 (A) to 1993 (B).
ungrazed pastures, and least in pastures grazed season-long. Density in fall-grazed pastures was statisticallysimilar to density in both the ungrazed pastures andpastures grazed season-long.
Although new seedlings emerged each year, largenumbers of whiplash willow seedlings emerged in1987, possibly due to good seed availability and thepresence of fresh sediments deposited following ahigh-intensity storm in May, shortly before June seed
dispersal (fig. 5). Whiplash willow density generallydeclined through 1991, with no significant changesoccurring from 1991 to 1993 (P = 0.02). Ungrazed andmoderately grazed pastures supported greater seedlingdensities than pastures grazed season-long (P = 0.02).
Height of each willow species increased graduallyover time, with the greatest increase occurring in1993, a wet year (P < 0.01) (fig. 5). During the 7-yearperiod, willow seedling height was significantly greater
A B

10
in ungrazed or moderately grazed pastures comparedto those grazed season-long (P = 0.06 [coyote willow];P = 0.05 [whiplash willow]). By October 1993, however,an average of 8 percent of naturally establishing wil-lows exceeded 1.5 m in height with no differenceamong treatments or between species. Thus the upperportion of most crowns remained within reach of largebrowsing animals.
Number of basal stems for coyote willow increasedfrom 1.6 in 1987 to 3.0 in 1993 (P < 0.01), and from 1.1 to3.7 (P < 0.01) for whiplash willow. Over this period,crown diameter increased from 12 to 27 cm (P < 0.01)for coyote willow and from 11 to 46 cm (P < 0.01) forwhiplash willow with no differences among treat-ments for either species.
Planted Willows and Cottonwoods—A total of93 percent of all coyote willow cuttings and 92 percentof all whiplash willow cuttings planted survived inmid-June 1987, about 1 month following planting.First-year survival of all planted coyote willow de-clined to 68 percent and whiplash willow to 66 percentby mid-August 1987.
Over the 4-year period, survival of both coyote willowand whiplash willow in experimental plots was signifi-cantly greater in cleared Kentucky bluegrass plotsand undisturbed speedwell communities compared toundisturbed Kentucky bluegrass communities (P = 0.02[coyote willow and whiplash willow]) (fig. 6). About 16percent of each willow species died during the firstgrowing season. An additional decline of about 20
Figure 5—Density and height of naturally regenerating coyote willow and whiplash willow in 1987 to 1993by grazing treatment. Treatments followed by different letters are significantly different at P ≤ 0.10.

11
percent occurred in 1988 (P < 0.02 [coyote willow andwhiplash willow]), but survival remained stable there-after through 1990.
Height of coyote willow increased about 6 times(P < 0.01) and crown diameter 12 times (P < 0.01) from1987 to 1990 (fig. 6), however, these variables were notinfluenced by site conditions (P = 0.38 [height]; P =0.35 [crown]). By 1990, whiplash willow heights andcrown diameters varied significantly with the threesite conditions and were greatest in the cleared Ken-tucky bluegrass plots, intermediate in the undisturbed
speedwell communities, and smallest in undisturbedKentucky bluegrass communities where no increasein height or crown diameter occurred over the 4-yearperiod (P = 0.02 [T x Y interaction for height]; P < 0.01[T x Y interaction for crown]) (fig. 6).
Use of both willow species by wild ungulates wasevaluated as moderate for all three planting condi-tions in 1987 and 1988, light to moderate in 1989, andmoderate to heavy in 1990. Thirty-two percent of theplanted coyote willow grew beyond reach of browsinganimals (greater than 1.5 m height) by 1990, compared
Figure 6—Survival and growth (1987 to 1990) of coyote willow andwhiplash willow cuttings planted in the ungrazed/planted pastures inMay 1987 as influenced by plant community and site preparation. A-D: Treatments followed by different letters are significantly different atP ≤ 0.10. E-F: Within years, treatment means with different letters aresignificantly different at P ≤ 0.10.

12
Table 6—Willow cover, understory plant cover, and bare soil(1987 and 1990) on 1-m2 plots planted with rootedwillow cuttings in May 1987 as influenced by plantcommunity and site preparation.
Plant community and site preparationCover Kentucky bluegrass Speedwell
category Cleared Undisturbed undisturbed
- - - - - - - - Cover (percent) - - - - - - - -Bare ground/rock
1987 33Babb 7Aa 8Aa1990 9Aa 11Aa 17Aa
Litter1987 7Aa 10Aa 10Aa1990 37Bb 41Bab 24Ba
Graminoids1987 13Aa 49Ab 29Aa1990 36Ba 45Ab 26Aa
Forbs1987 48Bb 33Ba 47Bb1990 13Aa 9Aa 29Ab
Woody species1987 2Aa 1Aa 2Aa1990 18Bb 6Ba 10BaaValues within cover category and plant community and site
preparation followed by different upper case letters are significantlydifferent at P < 0.10.
bValues within cover category and year followed by different lowercase letters are significantly different at P < 0.10.
to 12 percent for whiplash willow. A significantly great-er proportion of the two willow species (41 percent)exceeded 1.5 m in height in the cleared Kentuckybluegrass plots in 1990, compared to 12 percent inthe undisturbed Kentucky bluegrass and speedwellcommunities.
Understory cover provided by graminoids, primarilyKentucky bluegrass, was significantly greater in theundisturbed Kentucky bluegrass community comparedto the cleared Kentucky bluegrass plots and speed-well communities in 1987 and 1990 (table 6). Follow-ing 4 years of protection from grazing, Kentucky blue-grass cover increased 2.8 times in the cleared Kentuckybluegrass plots, but remained unchanged in the undis-turbed Kentucky bluegrass and speedwell communities.
Ninety-four percent of the narrow-leaved cottonwoodsurvived by 1990. Tree height increased from 69 cmin 1987 to 190 cm in 1990 (P < 0.01), and crowndiameter increased from 49 cm in 1987 to 160 cm in1990 (P < 0.01).
When all riparian woody plants, both naturallyoccurring and planted, were examined in 1993, totalwoody stem densities, stem frequencies, and stemdiameters were higher on planted treatments than onother treatments (table 7; fig. 7). Stem frequencieswere higher on ungrazed and spring-grazed treat-ments than on fall and season-long grazed treatments.
Results: Upland Area ____________
Herbaceous Vegetation and Small Shrubs
Much of the upland area within the study pasturesconsisted of steep slopes, averaging about 33 percent.Although significant differences occurred in utiliza-tion rates of grasses (P < 0.01) the mean utilization onthese upland slopes was low, even on pastures grazedseason-long (table 8). The limited differences in degreeof utilization of the uplands were also reflected in therelative similarity of residual plant heights (table 8).Significant interactions with years occurred becauseof variation in annual utilization intensities.
Standing crop biomass of upland graminoids dif-fered among treatments (P = 0.03) and treatmentgroups (P = 0.01) (table 9). As a group, ungrazed plotssupported higher graminoid biomass in uplands thanother treatments. Further, percentage canopy cover ofgraminoids, forbs, and shrubs was higher and bare soillower on ungrazed and light to moderately grazedtreatments as compared to the season-long heavilygrazed treatment (table 10).
No differences were detected in the frequency ofvarious predominant plant composition componentsin the upland sites during the 7 years of grazingtreatments (table 11).
Table 7—Average density, frequency, and stem diameter in1993 of both naturally occurring and planted willowsand cottonwoods within the riparian area (n = 80).
StemTreatments Density Frequency Diameter
Number/ha Plots/pasture cmIndividual treatmentUngrazed/planted 7,400ba 29.0c 2.3bUngrazed 2,700a 14.5b 0.8aSpring grazed 3,400a 18.2bc 0.7a
light to moderateFall grazed 600a 6.0a 0.8a
light to moderateSeason-long 400a 6.0a 0.9a
heavyPb
Among treatments 0.05 0.02 0.03
Treatment groupUngrazed 5,000a 20.8b 1.6aModerately grazed 2,000a 11.0ab 0.8aHeavily grazed 400a 5.0a 0.9aP Among groups 0.14 0.10 0.29
aValues in columns among treatments or treatment groups followedby different letters are significantly different at P < 0.10.
bProbability value.

13
Figure 7—Typical view of willow response in ungrazed/planted pastures, 1987 (A) to 1993 (B).
Table 9—Upland mid-summer 1990-1993 standing crop biomass as adjusted to the1987 mean values.
Treatments Graminoids Forbs Shrubs Total
- - - - - - - - - - - - - - g/0.25 m2- - - - - - - - - - - - - - -Individual treatmentUngrazed/planted 12.6ca 11.1b 15.8a 39.5aUngrazed 11.3c 6.8a 17.6a 35.7aSpring grazed light to moderate 7.6ab 7.3a 18.0a 32.9aFall grazed light to moderate 10.3bc 7.6a 15.2a 33.1aSeason-long heavy 6.7a 5.7a 14.0a 26.4aPb
Among treatments 0.03 0.10 0.49 0.13 Interaction with years 0.33 0.95 0.95 0.90
Treatment groupUngrazed 11.9b 8.9a 16.6a 37.4bModerately grazed 9.1a 7.4a 16.7a 33.2bHeavily grazed 6.7a 5.7a 14.0a 26.4aP Among groups 0.01 0.13 0.35 0.01 Interaction with years 0.16 0.94 0.85 0.53
aValues in columns among treatments or treatment groups followed by different letters aresignificantly different at P < 0.10.
bProbability value.
A B
Table 8—Average utilization (1987-1993) and residual plant heights (1989-1993) of pasture uplands.
Utilization rates Plant heightsTreatments Graminoids Forbs Shrubs Graminoids Forbs Shrubs
- - - - - - - - - - Percent - - - - - - - - - - - - - - - - - - - - - cm - - - - - - - - - - -
Ungrazed/planted — — — — — —Ungrazed — — — — — —Spring grazed light to moderate 8.3aa 3.2b 0.3a 12.7b 9.6a 44.8aFall grazed light to moderate 9.7b 2.1a 0.0a 12.1a 11.6b 45.6aSeason-long heavy 16.1c 2.4ab 0.2a 11.8a 13.0c 43.0aPb
Among treatments <0.01 0.05 0.15 0.05 <0.01 0.84 Interaction with years <0.01 <0.01 0.24 <0.01 <0.01 0.13
aValues in columns followed by different letters are significantly different at P < 0.10.bProbability value.

14
Table 10—Average 1990-1993 upland plant canopy cover, litter, and bare soil as adjusted tothe 1987 mean values.
Treatments Graminoids Forbs Shrubs Litter Bare
- - - - - - - - - - - - - - - - - - - - - - Percent - - - - - - - - - - - - - - - - - - - - -Individual treatmentUngrazed/planted 33.3aa 14.3a 18.6ab 22.2a 25.8abUngrazed 36.9a 12.2a 21.9c 20.5a 19.8aSpring grazed 31.7a 13.2a 21.4c 20.9a 26.5b
light to moderateFall grazed 34.9a 12.1a 20.8bc 23.1a 23.9ab
light to moderateSeason-long heavy 24.4a 10.5a 16.7a 21.4a 33.4cPb
Among treatments 0.16 0.12 0.04 0.73 0.04 Interaction with years 0.80 0.49 0.61 0.66 0.70
Treatment groupUngrazed 35.0b 13.2b 20.3b 21.3a 22.9aModerately grazed 33.4b 12.9b 21.1b 22.0a 25.0aHeavily grazed 24.4a 10.5a 16.7a 21.4a 33.4bP Among groups 0.03 0.07 0.03 0.89 0.01 Interaction with years 0.49 0.65 0.59 0.97 0.60
aValues in columns among treatments or treatment groups followed by different letters are significantlydifferent at P < 0.10.
bProbability value.
Table 11—Number of upland plots on which at least 25 percent of the cover was occupied by designated vegetation components(n = 80). Average for 1990-1993 as adjusted to the 1987 mean values.
Herbaceous layer Shrub layerPerennial grass Exotic brome Exotic forb Sagebrush Rabbitbrush
Treatments dominateda dominated dominated dominated dominated
- - - - - - - - - - - - - - - - - - - - - - - - - - - - - - Number /pastureb - - - - - - - - - - - - - - - - - - - - - - - - - - - - - -Individual treatmentUngrazed/planted 25.7ac 59.9a 24.2a 51.6a 7.4aUngrazed 27.2a 64.6a 17.3a 57.9a 12.8aSpring grazed 26.4a 66.9a 24.2a 57.0a 16.6a
light to moderateFall grazed 32.7a 58.2a 15.9a 69.9a 9.8a
light to moderateSeason-long heavy 31.4a 59.8a 8.9a 59.2a 14.4aPd
Among treatments 0.47 0.32 0.29 0.23 0.16 Interaction with years 0.77 0.58 0.67 0.92 0.98
Treatment groupUngrazed 26.5a 62.3a 19.7a 54.3a 9.8aModerately grazed 29.4a 62.4a 20.2a 63.0a 12.7aHeavily grazed 31.4a 59.8a 8.9a 59.2a 14.4aP Among groups 0.39 0.86 0.11 0.24 0.22 Interaction with years 0.60 0.71 0.29 0.73 0.95
aContributed at least 25 percent of the plant cover.bBased on 100 upland plots.cValues in columns among treatments or treatment groups followed by different letters are significantly different at P < 0.10.dProbability value.
15
Woody Plantings
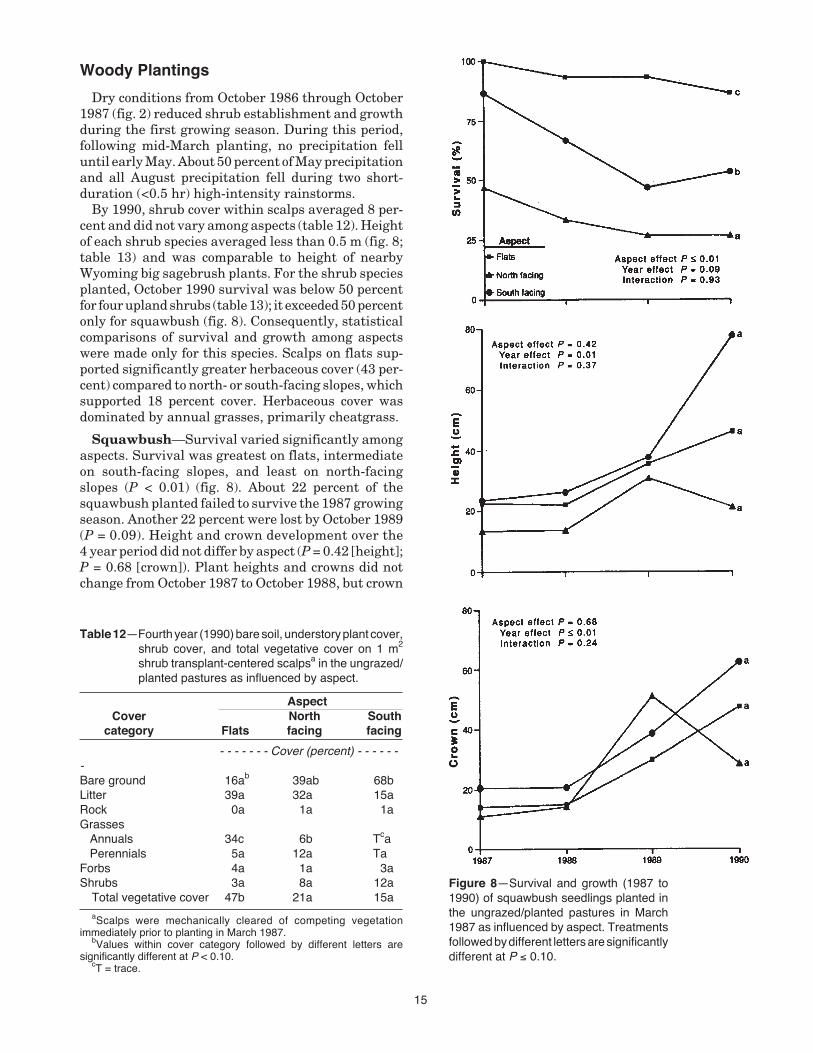
Dry conditions from October 1986 through October1987 (fig. 2) reduced shrub establishment and growthduring the first growing season. During this period,following mid-March planting, no precipitation felluntil early May. About 50 percent of May precipitationand all August precipitation fell during two short-duration (<0.5 hr) high-intensity rainstorms.
By 1990, shrub cover within scalps averaged 8 per-cent and did not vary among aspects (table 12). Heightof each shrub species averaged less than 0.5 m (fig. 8;table 13) and was comparable to height of nearbyWyoming big sagebrush plants. For the shrub speciesplanted, October 1990 survival was below 50 percentfor four upland shrubs (table 13); it exceeded 50 percentonly for squawbush (fig. 8). Consequently, statisticalcomparisons of survival and growth among aspectswere made only for this species. Scalps on flats sup-ported significantly greater herbaceous cover (43 per-cent) compared to north- or south-facing slopes, whichsupported 18 percent cover. Herbaceous cover wasdominated by annual grasses, primarily cheatgrass.
Squawbush—Survival varied significantly amongaspects. Survival was greatest on flats, intermediateon south-facing slopes, and least on north-facingslopes (P < 0.01) (fig. 8). About 22 percent of thesquawbush planted failed to survive the 1987 growingseason. Another 22 percent were lost by October 1989(P = 0.09). Height and crown development over the4 year period did not differ by aspect (P = 0.42 [height];P = 0.68 [crown]). Plant heights and crowns did notchange from October 1987 to October 1988, but crown
Table 12—Fourth year (1990) bare soil, understory plant cover,shrub cover, and total vegetative cover on 1 m2
shrub transplant-centered scalpsa in the ungrazed/planted pastures as influenced by aspect.
AspectCover North South
category Flats facing facing
- - - - - - - Cover (percent) - - - - - --Bare ground 16ab 39ab 68bLitter 39a 32a 15aRock 0a 1a 1aGrasses Annuals 34c 6b Tca Perennials 5a 12a TaForbs 4a 1a 3aShrubs 3a 8a 12a
Total vegetative cover 47b 21a 15aaScalps were mechanically cleared of competing vegetation
immediately prior to planting in March 1987.bValues within cover category followed by different letters are
significantly different at P < 0.10.cT = trace.
Figure 8—Survival and growth (1987 to1990) of squawbush seedlings planted inthe ungrazed/planted pastures in March1987 as influenced by aspect. Treatmentsfollowed by different letters are significantlydifferent at P ≤ 0.10.
16
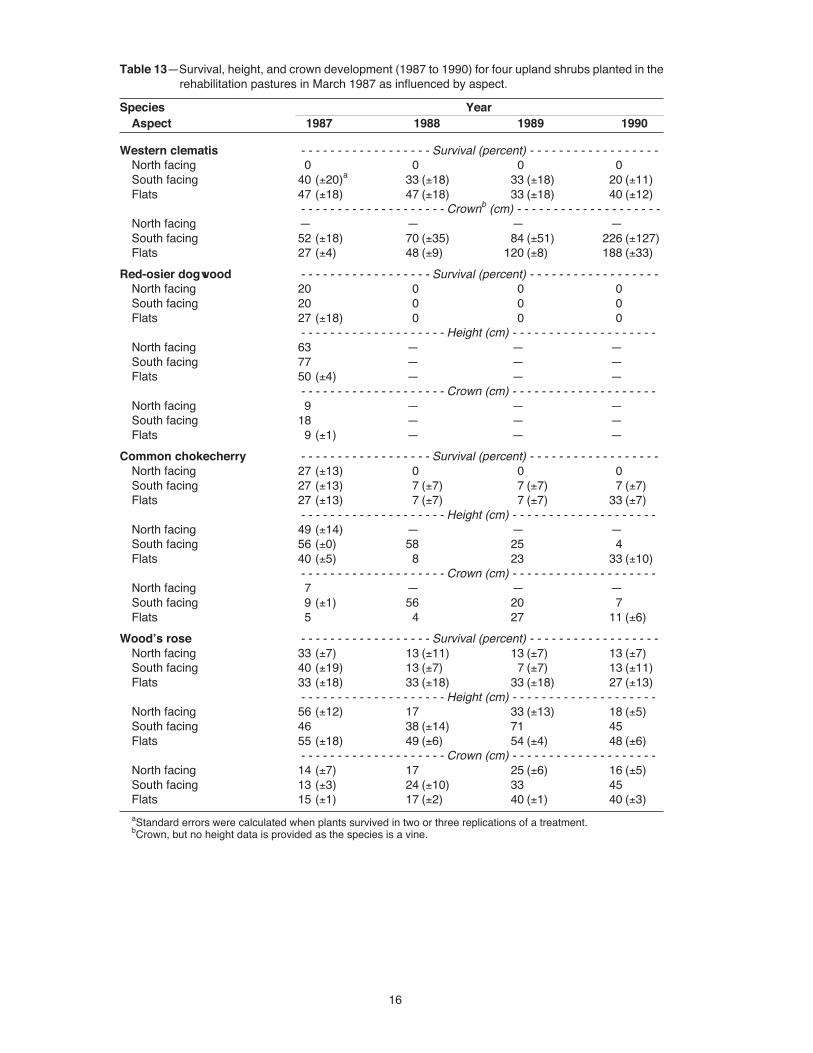
Table 13—Survival, height, and crown development (1987 to 1990) for four upland shrubs planted in therehabilitation pastures in March 1987 as influenced by aspect.
Species YearAspect 1987 1988 1989 1990
Western clematis - - - - - - - - - - - - - - - - - - Survival (percent) - - - - - - - - - - - - - - - - - -North facing 0 0 0 0South facing 40 (±20)a 33 (±18) 33 (±18) 20 (±11)Flats 47 (±18) 47 (±18) 33 (±18) 40 (±12)
- - - - - - - - - - - - - - - - - - - - Crownb (cm) - - - - - - - - - - - - - - - - - - - -North facing — — — —South facing 52 (±18) 70 (±35) 84 (±51) 226 (±127)Flats 27 (±4) 48 (±9) 120 (±8) 188 (±33)
Red-osier dogwood - - - - - - - - - - - - - - - - - - Survival (percent) - - - - - - - - - - - - - - - - - -North facing 20 0 0 0South facing 20 0 0 0Flats 27 (±18) 0 0 0
- - - - - - - - - - - - - - - - - - - - Height (cm) - - - - - - - - - - - - - - - - - - - -North facing 63 — — —South facing 77 — — —Flats 50 (±4) — — —
- - - - - - - - - - - - - - - - - - - - Crown (cm) - - - - - - - - - - - - - - - - - - - -North facing 9 — — —South facing 18 — — —Flats 9 (±1) — — —
Common chokecherry - - - - - - - - - - - - - - - - - - Survival (percent) - - - - - - - - - - - - - - - - - -North facing 27 (±13) 0 0 0South facing 27 (±13) 7 (±7) 7 (±7) 7 (±7)Flats 27 (±13) 7 (±7) 7 (±7) 33 (±7)
- - - - - - - - - - - - - - - - - - - - Height (cm) - - - - - - - - - - - - - - - - - - - -North facing 49 (±14) — — —South facing 56 (±0) 58 25 4Flats 40 (±5) 8 23 33 (±10)
- - - - - - - - - - - - - - - - - - - - Crown (cm) - - - - - - - - - - - - - - - - - - - -North facing 7 — — —South facing 9 (±1) 56 20 7Flats 5 4 27 11 (±6)
Wood’s rose - - - - - - - - - - - - - - - - - - Survival (percent) - - - - - - - - - - - - - - - - - -North facing 33 (±7) 13 (±11) 13 (±7) 13 (±7)South facing 40 (±19) 13 (±7) 7 (±7) 13 (±11)Flats 33 (±18) 33 (±18) 33 (±18) 27 (±13)
- - - - - - - - - - - - - - - - - - - - Height (cm) - - - - - - - - - - - - - - - - - - - -North facing 56 (±12) 17 33 (±13) 18 (±5)South facing 46 38 (±14) 71 45Flats 55 (±18) 49 (±6) 54 (±4) 48 (±6)
- - - - - - - - - - - - - - - - - - - - Crown (cm) - - - - - - - - - - - - - - - - - - - -North facing 14 (±7) 17 25 (±6) 16 (±5)South facing 13 (±3) 24 (±10) 33 45Flats 15 (±1) 17 (±2) 40 (±1) 40 (±3)
aStandard errors were calculated when plants survived in two or three replications of a treatment.bCrown, but no height data is provided as the species is a vine.

17
diameter increased in 1989 and height increased in1990 (P = 0.01 [height]; P < 0.01 [crown]).
Western Clematis—No plants survived the 1987growing season on north-facing slopes (table 13); atotal of 60 percent mortality occurred on south-facingslopes and 53 percent on flats. Average crown spreadof plants surviving in October 1990 exceeded 2 m.
Red-Osier Dogwood—Mortality of red-osier dog-wood planted on the three aspects ranged from 73 to 80percent in 1987 (table 13). Surviving plants exhibitedlittle new growth; none survived the 1988 growingseason.
Common Chokecherry and Wood’s Rose—Sur-vival and growth patterns were somewhat similar forthese two species (table 13). By 1990, survival ofcommon chokecherry did not exceed 33 percent on anyaspect while survival of Wood’s rose did not exceed 27percent. Height and crown diameters did not exceed0.5 m for either species.
Results: Birds and SmallMammals ______________________
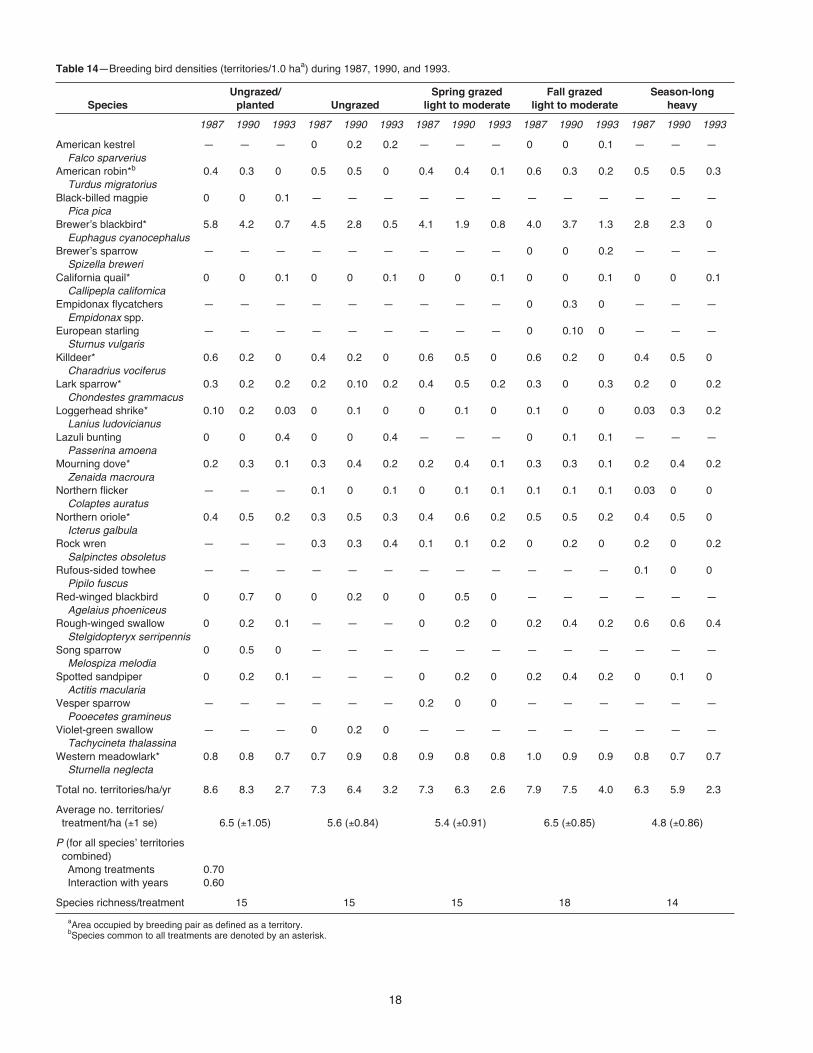
During the three sampling periods (1987, 1990,1993), a total of 24 bird species established breed-ing territories within the five grazing treatments(table 14). Territories were not recorded for transientspecies, wide-ranging raptors, and residents with fewobservations, although species’ presence was notedwithin each treatment (appendix B). Species richnessranged from 14 in the pastures that were grazedseason-long to 18 in the fall-grazed treatment, withnine species common to all treatments (table 14). Aver-age breeding pair (territory) densities over the threesampling periods did not differ significantly (P = 0.70),but ranged from 19 in pastures grazed season-long to25 in both ungrazed/planted pastures and fall-grazedpastures. Intermediate densities were reported forspring-grazed and ungrazed treatments (table 14).Of the 9 species common to all treatments, Brewer’sblackbirds (bird scientific names listed in table 14 andappendix B) were most common (2.6 [±0.34 = 1 se]/ha)and California quail were least common (0.03 [±0.06]/ha)birds nesting in the study area. Combined for all spe-cies, no significant differences in bird densities occurredamong treatments (P = 0.70), but differences weresignificant among years (T < 0.001).
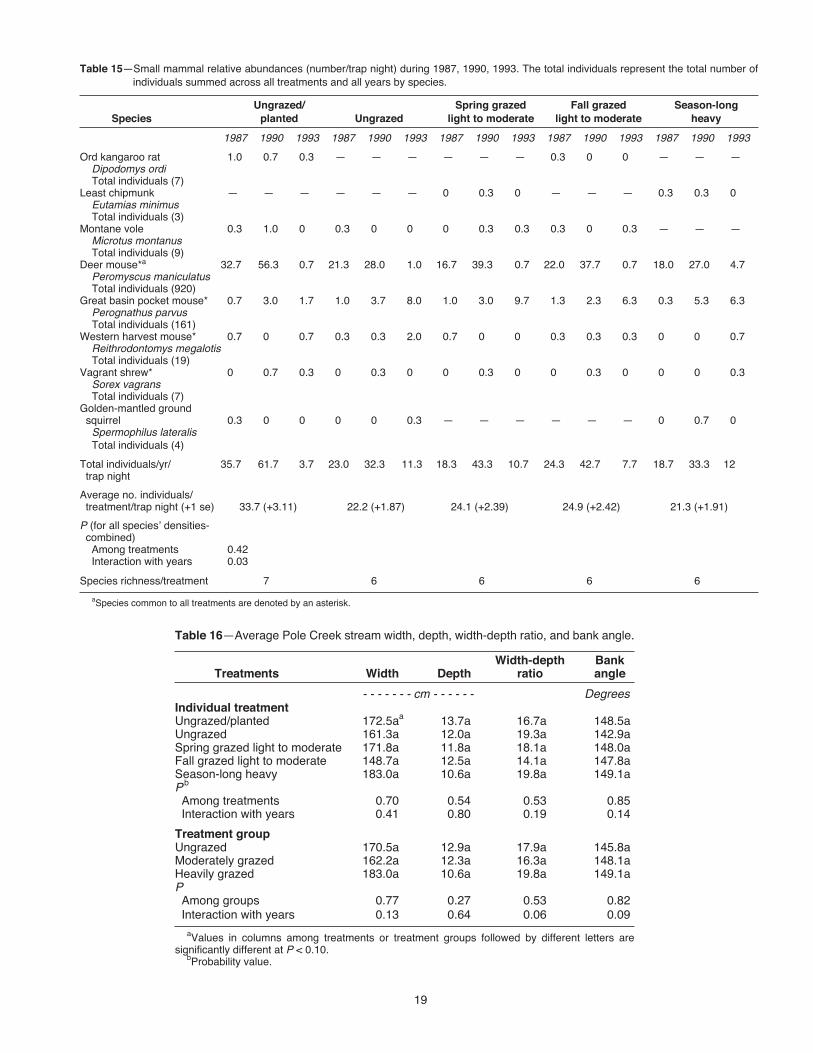
Eight species of small mammals were trapped dur-ing August 1987, 1990, and 1993 (table 15). Fourspecies (deer mouse, Great Basin pocket mouse, west-ern harvest mouse, and vagrant shrew [mammal sci-entific names listed in table 15]) were common to alltreatments. Deer mice were the most commonly cap-tured animal (920 individuals across all treatmentsand years), while least chipmunks were rarely
trapped—three individuals across all treatments andall years) (table 15). Total small mammals trappedover the three periods ranged from 192 individuals inpastures grazed season-long, to 303 individuals inungrazed/planted pastures. Species richness (6 or 7)was similar among treatments (table 15). Small mam-mal densities did not differ among treatments (P =0.42); however, the interaction with year (T x Y, P =0.03) and the year effect (P < 0.001) were significant.
The relative abundances of deer mice differed amongyears (P < 0.001), but did not differ among treatments(P = 0.56). Further, a significant treatment by yearinteraction (T x Y, P = 0.10) indicated that the treat-ments did not respond in a similar manner each year.Average abundances of Great Basin pocket mice dif-fered (P = 0.06) among treatments for all years, withthe highest abundances reported for the spring grazedtreatment. In addition, a significant decline (P = 0.10)in mean captures of pocket mice occurred in theungrazed/planted treatment in 1993. The treatment-year interaction (T x Y, P = 0.01) was significant.
Results: Stream Channel _________Stream channel conditions did not respond to the
treatments in a consistent manner. The stream courseshifted annually in some locations. High intensitysummer rainstorms initiated upland erosion, debrisflows, and stream channel scouring (fig. 1). Somesections of the stream had channel changes appearingalmost annually on aerial and ground level photo-graphs taken between 1979 through 1993. This con-stant state of flux probably increased the difficulty inclassifying the stream type (Rosgen 1994). A decreasedsinuosity from that expected for similar streams and aflood plain in the early stages of recovery from down-cutting contribute to a combination of characteristicsslightly different, perhaps, than might be expected forless impacted streams.
Width-depth ratios did not differ among individualtreatments (P = 0.53) (table 16). However, there was asignificant interaction between time and width-depthratios of the three treatment groups—no grazing,moderate grazing, and heavy grazing (P = 0.06). Thewidth-depth ratio showed a decreasing trend in theungrazed treatment group for the latter portion of thestudy period (1990 to 1993) that was not evident in theother two treatment groups (fig. 9). The streambankconditions of the grazed pastures deteriorated duringthe extended snowmelt runoff of 1993. There was noevidence for a specific change over time among treat-ment groups for stream depth alone (P = 0.64) orstream width alone (P = 0.13).
Bank angles showed little average difference amongtreatments (table 16). A significant interaction withtime (P = 0.09), and an examination of the meanssuggest a greater trend toward improvement in the
18
Table 14—Breeding bird densities (territories/1.0 haa) during 1987, 1990, and 1993.
Ungrazed/ Spring grazed Fall grazed Season-longSpecies planted Ungrazed light to moderate light to moderate heavy
1987 1990 1993 1987 1990 1993 1987 1990 1993 1987 1990 1993 1987 1990 1993
American kestrel — — — 0 0.2 0.2 — — — 0 0 0.1 — — —Falco sparverius
American robin*b 0.4 0.3 0 0.5 0.5 0 0.4 0.4 0.1 0.6 0.3 0.2 0.5 0.5 0.3Turdus migratorius
Black-billed magpie 0 0 0.1 — — — — — — — — — — — —Pica pica
Brewer’s blackbird* 5.8 4.2 0.7 4.5 2.8 0.5 4.1 1.9 0.8 4.0 3.7 1.3 2.8 2.3 0Euphagus cyanocephalus
Brewer’s sparrow — — — — — — — — — 0 0 0.2 — — —Spizella breweri
California quail* 0 0 0.1 0 0 0.1 0 0 0.1 0 0 0.1 0 0 0.1Callipepla californica
Empidonax flycatchers — — — — — — — — — 0 0.3 0 — — —Empidonax spp.
European starling — — — — — — — — — 0 0.10 0 — — —Sturnus vulgaris
Killdeer* 0.6 0.2 0 0.4 0.2 0 0.6 0.5 0 0.6 0.2 0 0.4 0.5 0Charadrius vociferus
Lark sparrow* 0.3 0.2 0.2 0.2 0.10 0.2 0.4 0.5 0.2 0.3 0 0.3 0.2 0 0.2Chondestes grammacus
Loggerhead shrike* 0.10 0.2 0.03 0 0.1 0 0 0.1 0 0.1 0 0 0.03 0.3 0.2Lanius ludovicianus
Lazuli bunting 0 0 0.4 0 0 0.4 — — — 0 0.1 0.1 — — —Passerina amoena
Mourning dove* 0.2 0.3 0.1 0.3 0.4 0.2 0.2 0.4 0.1 0.3 0.3 0.1 0.2 0.4 0.2Zenaida macroura
Northern flicker — — — 0.1 0 0.1 0 0.1 0.1 0.1 0.1 0.1 0.03 0 0Colaptes auratus
Northern oriole* 0.4 0.5 0.2 0.3 0.5 0.3 0.4 0.6 0.2 0.5 0.5 0.2 0.4 0.5 0Icterus galbula
Rock wren — — — 0.3 0.3 0.4 0.1 0.1 0.2 0 0.2 0 0.2 0 0.2Salpinctes obsoletus
Rufous-sided towhee — — — — — — — — — — — — 0.1 0 0Pipilo fuscus
Red-winged blackbird 0 0.7 0 0 0.2 0 0 0.5 0 — — — — — —Agelaius phoeniceus
Rough-winged swallow 0 0.2 0.1 — — — 0 0.2 0 0.2 0.4 0.2 0.6 0.6 0.4Stelgidopteryx serripennis
Song sparrow 0 0.5 0 — — — — — — — — — — — —Melospiza melodia
Spotted sandpiper 0 0.2 0.1 — — — 0 0.2 0 0.2 0.4 0.2 0 0.1 0Actitis macularia
Vesper sparrow — — — — — — 0.2 0 0 — — — — — —Pooecetes gramineus
Violet-green swallow — — — 0 0.2 0 — — — — — — — — —Tachycineta thalassina
Western meadowlark* 0.8 0.8 0.7 0.7 0.9 0.8 0.9 0.8 0.8 1.0 0.9 0.9 0.8 0.7 0.7Sturnella neglecta
Total no. territories/ha/yr 8.6 8.3 2.7 7.3 6.4 3.2 7.3 6.3 2.6 7.9 7.5 4.0 6.3 5.9 2.3
Average no. territories/ treatment/ha (±1 se) 6.5 (±1.05) 5.6 (±0.84) 5.4 (±0.91) 6.5 (±0.85) 4.8 (±0.86)
P (for all species’ territories combined) Among treatments 0.70 Interaction with years 0.60
Species richness/treatment 15 15 15 18 14
aArea occupied by breeding pair as defined as a territory.bSpecies common to all treatments are denoted by an asterisk.
19
Table 16—Average Pole Creek stream width, depth, width-depth ratio, and bank angle.
Width-depth BankTreatments Width Depth ratio angle
- - - - - - - cm - - - - - - DegreesIndividual treatmentUngrazed/planted 172.5aa 13.7a 16.7a 148.5aUngrazed 161.3a 12.0a 19.3a 142.9aSpring grazed light to moderate 171.8a 11.8a 18.1a 148.0aFall grazed light to moderate 148.7a 12.5a 14.1a 147.8aSeason-long heavy 183.0a 10.6a 19.8a 149.1aPb
Among treatments 0.70 0.54 0.53 0.85 Interaction with years 0.41 0.80 0.19 0.14
Treatment groupUngrazed 170.5a 12.9a 17.9a 145.8aModerately grazed 162.2a 12.3a 16.3a 148.1aHeavily grazed 183.0a 10.6a 19.8a 149.1aP Among groups 0.77 0.27 0.53 0.82 Interaction with years 0.13 0.64 0.06 0.09
aValues in columns among treatments or treatment groups followed by different letters aresignificantly different at P < 0.10.
bProbability value.
Table 15—Small mammal relative abundances (number/trap night) during 1987, 1990, 1993. The total individuals represent the total number ofindividuals summed across all treatments and all years by species.
Ungrazed/ Spring grazed Fall grazed Season-longSpecies planted Ungrazed light to moderate light to moderate heavy
1987 1990 1993 1987 1990 1993 1987 1990 1993 1987 1990 1993 1987 1990 1993
Ord kangaroo rat 1.0 0.7 0.3 — — — — — — 0.3 0 0 — — —Dipodomys ordiTotal individuals (7)
Least chipmunk — — — — — — 0 0.3 0 — — — 0.3 0.3 0Eutamias minimusTotal individuals (3)
Montane vole 0.3 1.0 0 0.3 0 0 0 0.3 0.3 0.3 0 0.3 — — —Microtus montanusTotal individuals (9)
Deer mouse*a 32.7 56.3 0.7 21.3 28.0 1.0 16.7 39.3 0.7 22.0 37.7 0.7 18.0 27.0 4.7Peromyscus maniculatusTotal individuals (920)
Great basin pocket mouse* 0.7 3.0 1.7 1.0 3.7 8.0 1.0 3.0 9.7 1.3 2.3 6.3 0.3 5.3 6.3Perognathus parvusTotal individuals (161)
Western harvest mouse* 0.7 0 0.7 0.3 0.3 2.0 0.7 0 0 0.3 0.3 0.3 0 0 0.7Reithrodontomys megalotisTotal individuals (19)
Vagrant shrew* 0 0.7 0.3 0 0.3 0 0 0.3 0 0 0.3 0 0 0 0.3Sorex vagransTotal individuals (7)
Golden-mantled ground squirrel 0.3 0 0 0 0 0.3 — — — — — — 0 0.7 0
Spermophilus lateralisTotal individuals (4)
Total individuals/yr/ 35.7 61.7 3.7 23.0 32.3 11.3 18.3 43.3 10.7 24.3 42.7 7.7 18.7 33.3 12 trap night
Average no. individuals/ treatment/trap night (+1 se) 33.7 (+3.11) 22.2 (+1.87) 24.1 (+2.39) 24.9 (+2.42) 21.3 (+1.91)
P (for all species’ densities- combined) Among treatments 0.42 Interaction with years 0.03
Species richness/treatment 7 6 6 6 6
aSpecies common to all treatments are denoted by an asterisk.

20
Figure 9—Interaction graph of stream width-depth ratio versus years by grazing intensity.
ungrazed and moderately grazed pastures as com-pared to the heavily grazed pastures.
Several attempts were made to identify additionalrelationships among a variety of streamside and chan-nel variables with the intent of reducing uncontrolleddata variance in plant biomass and stream channelcharacteristics. While some significant relationshipswere present, they had limited predictive value.
Discussion _____________________Pole Creek, which transverses public and private
lands, has been subjected to grazing, most likely inten-sive grazing, since settlement in the 1860’s (MalheurCounty Historical Society 1988) as was much of theGreat Basin and interior Northwest (Griffiths 1903;Renner 1936). Historically, Pole Creek, located near alocal population center, was one of the few surfacewater sources (thus aggravating the influence of graz-ing), and provided an early-day local travel route.Early in the twentieth century, erosion in the PoleCreek drainage was apparently severe at times. Abridge (or bridges) spanning the lower end of PoleCreek was flooded and buried in sediment as manyas five times (Mr. Lenard Cole [deceased] as told toBurrell B. Lovell 1991). This past erosional history,current erosional events, and depleted upland plantcommunities suggest that upland as well as riparianareas need improvement. An interdependency existsbetween watershed condition and health of riparianareas. Increases in soil compaction, and decreases inplant cover and soil surface litter, are a common resultof heavy cattle use. Reduced water infiltration capaci-ties of the surrounding uplands and an increase in
animal trails can greatly increase overland flow anderoded material moving into riparian areas (fig. 1)(Trimble and Mendel 1995). Thus, reduced conditionof the surrounding upland slopes, acting to increasesediment-laden flows and stream erosive power, cangreatly impact riparian areas (DeBano and Schmidt1989; Kovalchik and Elmore 1992).
Plant Response
The post-settlement history of human and livestockimpacts on Pole Creek has contributed to a loss ofwetland plant species. A major component of sedgesand rushes would normally be expected in a ripariansystem such as Pole Creek (Crouse and Kindschy1984; Griffiths 1903; Peck 1911). The best indication ofherbaceous plant response to grazing treatment ap-peared to be the frequency of plots (Hyder and others1966) dominated by “desirable” species, that is, sod-forming species in general, and more importantly,rhizomatous wetland species. Even though the sod-former group was dominated by species adapted todisturbance (United States Department of Agricul-ture, Forest Service 1988b), a change in frequency ofthese species related to differences in grazing stresswas not apparent. In addition, frequency of plots domi-nated by sedges, rushes, and similar wetland specieswas only 3 to 4 percent across all treatments, eventhough most of the study area was under no grazingor carefully controlled grazing for 7 years. Availabil-ity of sedges and rushes within much of this streamsystem seems limited at present. A similar historicdepletion of riparian woody plants, such as willowsand cottonwoods, has also occurred along Pole Creek(Shaw and Clary 1995). Other riparian-stream systemsin the Intermountain Region have experienced similardepletions (Chaney and others 1990).
During our study, natural recovery of coyote willowand whiplash willow populations was affected by sea-son and intensity of cattle grazing. Willow density andgrowth were generally enhanced by no or moderategrazing compared to heavy grazing. Greater densitiesin the spring-grazed compared to the ungrazed pas-tures may have been related to availability of micro-sites. Trampling along streambanks during springgrazing is generally limited, but may have createdsome microdisturbances favorable for germinationand establishment of willows as seed was dispersedshortly after spring grazing each year. Lower densi-ties in the fall-grazed pastures and pastures grazedseason-long may be related to heavy use and tram-pling damage within the riparian area (Kovalchik andElmore 1992).
Several additional biotic and abiotic factors affectednatural willow recovery in all pastures. Compositionof recovering willow populations may have reflected

21
availability of seed from offsite sources as willow seedsare not banked in soil (Brinkman 1974). Seeds of bothcoyote and whiplash willow remain viable for only afew days or weeks, thus only those that are quicklydispersed to favorable microsites will germinate(Brinkman 1974). Saturated sediments deposited byhigh-intensity storms prior to seed dispersal providedfavorable microsite conditions (light, moisture, reducedvegetative competition) for establishment of both wil-lows in some years. Flooding at any season, however,also uprooted, buried, or otherwise damaged manysmall seedlings.
Both planted willow species, coyote willow and whip-lash willow, are well-adapted to low elevation ripariandisturbances. Both are early successional species, colo-nizing recent sediment deposits (Argus 1973; Hansenand others 1988; Youngblood and others 1985). Bothspread from seeds carried by wind or water, andoccasionally from small twigs or branches that washdownstream. Although whiplash willow exhibits anupright, multi-stemmed growth habit, coyote willowspreads from root sprouting, forming dense thicketscapable of catching sediments during flooding (Argus1973; Zasada 1986).
Deer browsing in all pastures throughout the grow-ing season severely reduced willow development eachyear. Ability of willows to grow beyond the reach ofbrowsers is essential if recovering stands are to ma-ture, produce seed, and contribute to riparian func-tioning. On Pole Creek, few native willows attainedsuch heights in 7 years, even with protection fromcattle grazing. Kovalchik (1987, 1992) found willowson well-drained sites averaged up to 0.4 m per year inheight growth under shorter growing seasons. Withthe longer growing season at Pole Creek, we wouldexpect a greater net height growth in the absence ofbrowsing.
Although browsing reduced the rate of plantedwillow development, planting did provide a means ofmore rapidly establishing stands that grow beyondthe reach of browsing animals than did natural regen-eration. Reduced grazing or temporary protection fromcattle grazing throughout the Pole Creek watershedmight permit initiation of willow recovery over alarger area, thus diluting deer use. This, in turn, couldresult in more rapid height development of the natu-rally recovering willow stands. By 1990, more thanthree times as many coyote willows (shrubby habit)had grown out of reach of browsing animals (greaterthan 1.5 m height), when compared to whiplash wil-lows (tree-like growth habit) in the experimental plots.This may be related to a number of factors includingdifferences in growth rates, adaptability to the plant-ing site, and palatability to livestock or wild ungulates(Argus 1973; Hansen and others 1988). In addition,the interior stems of developing coyote willow thicketsmay be afforded some protection from browsing.
Although willows planted in cleared scalps withinthe Kentucky bluegrass communities grew rapidly,recovery of Kentucky bluegrass within the scalps anda lack of suitable microsites within the communitymay preclude natural regeneration. Naturally occur-ring willow seedlings were rarely observed within thiscommunity during the study, but coyote willow trans-plants planted in cleared scalps did spread by rootsprouting. Widening of the riparian zone as a result ofstream recovery over time could increase the areaavailable for natural willow regeneration.
Good survival was obtained by planting narrow-leaved cottonwood cuttings rooted in 4-liter containersdirectly into Kentucky bluegrass sod. Narrow-leavedcottonwood is a pioneer species in fresh sedimentdeposits and is adapted to dry riparian situations andfluctuating water tables (Hansen and others 1988;Youngblood and others 1985). Initial disease prob-lems, heavy browsing by deer, and possible competi-tion with Kentucky bluegrass, likely slowed develop-ment of planted cottonwoods. However, rapid growthin 1989, a relatively wet year, permitted most trees togrow beyond reach of browsing animals.
Planting success for transplanted, nonsalicaceousshrubs was likely limited by a number of factors.Limited precipitation during the season of establish-ment likely contributed to shrub mortality in 1987.Microsites favorable for establishment within the floodplain were limited due to frequent flooding that up-rooted some shrub seedlings. Erosion and dry soilconditions on the incised banks also reduced establish-ment. Survival on north slopes was especially low dueto their steep, rocky nature. Moderate to heavy brows-ing by deer throughout each growing season restrictedshrub development, particularly for Wood’s rose, com-mon chokecherry, and red-osier dogwood (Shaw 1990).In addition, the planting stock purchased may nothave been well-adapted to the site.
The greater survival of squawbush compared to theother four shrub species was attributed to the abilityof this species to grow in dry areas and its generallylow palatability to cattle (Dayton 1931; USDA-FS1988b). Although not found growing in the Pole Creekdrainage, squawbush does occur along the course ofthe Snake River and its tributaries in Idaho and ondry, rocky areas in southeastern Oregon (Mozingo1986).
Western clematis, a shrub native to the Pole Creekwatershed, is also adapted to dry situations (Wasser1982); plants surviving to 1990 were large and vigor-ous, providing considerable cover. Western clematisseedlings were observed growing near mature, seed-producing transplants on open, south-facing slopes in1993 (Shaw 1993). Whether seedlings of the othershrubs will be able to establish on the dry slopes orwith competition from invasive annuals on the flatsremains to be seen.

22
In addition to the native shrub species planted,remnant mature and decadent plants of several othershrub species occur within the Pole Creek drainage(appendix A). Reestablishing populations of these spe-cies would substantially improve both the biologicaland structural diversity of the riparian zone, provid-ing niches for a variety of other organisms (Swenson1957; Thornburg 1982; Wasser 1982; Welch and Andrus1977). Many of these species, however, do not spreadreadily from seed or grow rapidly (Thornburg 1982;Wasser 1982). Consequently, spot plantings in appro-priate sites along the length of the stream, and tempo-rary protection from browsing to insure their estab-lishment may be necessary. Planting efforts, however,may be more successful after watershed recovery in-creases the availability of suitable microsites for eachspecies (Briggs and others 1994).
Wildlife Response
Historical changes in habitat conditions at PoleCreek have likely contributed to alterations in birdspecies composition and densities. Peck (1911) de-scribed the bird community of Pole Creek as a placewhere “both species and individuals were abundant.”Although livestock had been in the area for nearly 50years previous to Peck’s survey (Malheur County His-torical Society 1988), his 1911 account remains valu-able as a comparison with respect to the 85 years ofgrazing since that time. Lark and vesper sparrowswere reported as “abundant” or “plentiful” in the sage-brush communities (Peck 1911), but today both spe-cies are rarely observed in uplands surrounding PoleCreek. Song sparrows, warbling vireos, and yellowwarblers, all species that nest in riparian areas, arevirtually nonexistent today, but specifically noted aspresent throughout the breeding season by Peck (1911).The current comparatively depauperate nesting birdcommunity is possibly a result of changes in bothupland and riparian habitat conditions during thiscentury. Earlier discussions in this paper suggestsubstantial vegetation changes have occurred.
Reduction in grazing during this 7-year studychanged the vegetation little, and thus resulted in fewresponses by the bird community. Had treatmentsincreased vegetation structure substantially and en-hanced composition, we would have expected groundand shrub nesting species to increase, particularly inthe ungrazed (Anderson and others 1989; Hunter andothers 1989; Krueper 1993) and fall-grazed treatments(Kauffman and others 1982; Knopf and others 1988;Saab and others 1995; Sedgwick and Knopf 1987).Other studies have demonstrated that fall grazingappears to have the least impact on numbers of migra-tory birds during the breeding season in the short term(Saab and others 1995). Over the long-term, however,early fall grazing could result in degradation of willow
and other shrub communities to herbaceous communi-ties (Kovalchik and Elmore 1992; Uresk and Paintner1985) and the subsequent loss of shrub-nesting birds.
The cumulative impacts of livestock grazing alongPole Creek were reflected in the species compositionand densities of small mammals. Rodent populationsin all pastures were dominated by deer mice, a speciesknown to occupy many vegetation types and condi-tions (Zeveloff 1988). Other grazing studies have re-ported limited deer mouse response to treatment effects(Medin and Clary 1990; Oldenmeyer and Allen-Johnson1988; Samson and others 1988), and positive (Kauffmanand others 1982; Moulton 1978; Schultz and Leininger1991) or negative (Medin and Clary 1989; Rucks 1978)responses of deer mice to grazing disturbances. Deermice densities did not significantly differ among treat-ments, although densities in pastures grazed season-long seemed generally depressed relative to others. In1993, densities of deer mice dropped significantly inall pastures. This dramatic decline may have beeninfluenced by unusually high rainfall during the pre-vious spring and winter (fig. 2) or an encroaching full-moon during the time of trapping. A full moon phasecan reduce activity levels of small mammals (Zeveloff1988), however, Great Basin pocket mice were mostnumerous during this same time period.
Montane voles were rare on Pole Creek. Voles re-quire high amounts of herbaceous cover (especiallygrasses) before resident breeding populations can beestablished (Birney and others 1976), conditions ap-parently not met at Pole Creek. By contrast, highdensities of mountain voles were reported in ungrazedriparian vegetation in shrub-steppe habitats of Idaho(Medin and Clary 1990).
Channel Morphology and StreambankResponse
Streambank stability in many small meadows ishighly dependent upon the permeation and strength ofunderground structures (roots and rhizomes) of wetlandplants. Among herbaceous plants, sedges and rushesprovide this protective stability while species such asKentucky bluegrass are much less effective (Dunawayand others 1994; Manning and others 1989; Platts andNelson 1989). Under severe grazing pressure, streamsthat tend to be laterally unstable are usually charac-terized by widened channels, frequent channel re-alignments, and poorly vegetated banks and flood-plains (Trimble and Mendel 1995; Van Haveren andJackson 1986)—conditions rather similar to those atPole Creek. Although, in most instances, these trendsare expected to reverse quickly after improvement ingrazing management (Armour and others 1994), aver-age channel form changed little during this study.However, a significant interaction of treatment andyears suggested that even carefully controlled grazing
23
may have reduced streambank stability in comparisonwith no grazing. Myers and Swanson (1995) reporteda similar result. Instability of many stream segmentsand the apparent susceptibility of the streambanks toerosion during high snow melt streamflows can belargely attributed to the lack of highly rhizomatousbank-protecting wetland species and the low conditionof the surrounding watershed. A lack of consistentassociation of in-channel characteristics with suchvariables as soil depth, stream gradient, streambankcover, and frequency of woody species was interpretedas additional evidence of an unstable riparian/water-shed system.
Conclusions____________________Past grazing practices likely altered habitat condi-
tions to a point that a wide range of grazing treatments(including no grazing) for 7 years resulted in few dif-ferential responses by plants or animals. The limitedchanges that occurred in these plant and animalcommunities suggest a need for long-term recoveryand perhaps additional efforts to revegetate riparianhabitats. Natural recovery of native riparian vegeta-tion once occurring along the margins of the riparianarea may be extremely slow, even with reductions incattle grazing because of deterioration in physicalconditions of the stream during the last 150 years,dominance of exotic annuals within the riparian area,and loss of native seed sources. Spot plantings ofnative herbaceous species, particularly sedges andrushes, and more extensive shrub plantings may beneeded to expedite vegetation recovery, particularlyin highly disturbed areas.
Careful consideration is required, however, if theappropriate plant materials are to be effectivelymatched to the site conditions of individual streamreaches. For example, in high gradient reaches, adaptedwillows and other woody riparian plants are capableof binding coarse substrates together, while somesedges, rushes, and grasses are better adapted to siteswith more gentle gradients where they stabilize fine-textured substrates (Swanson and Meyers 1994). Insome circumstances, heavy woody materials couldpossibly increase erosive processes under high flowsby increasing local turbulence (Trimble and Mendel1995). Because of the expense of revegetating stream-side areas, perhaps the most cost effective initial strat-egy on many streams with gravelly-cobbly substrates,such as Pole Creek, would be to focus on grazing man-agement approaches that foster the development ofwillow communities to provide initial streambankstability and sediment retention.
Addressing the continuing causes of site degrada-tion is perhaps the most important long-term factor inachieving successful riparian rehabilitation (Briggs
and others 1994). The attraction of the green vegeta-tion, low gradient topography, and proximity to waterin the riparian zone (Ames 1977) was the dominantfactor affecting livestock distribution under virtuallyall situations included in this study. Recovering natu-ral vegetation and plantings require protection fromexcessive grazing or browsing until they are wellestablished. Otherwise, few benefits will accrue. Thealternative would likely be a long and unsure recoveryperiod, raising doubts as to whether this ripariansystem would regain the stability and productivity ofearlier years.
References _____________________Ames, Charles R. 1977. Wildlife conflicts in riparian management:
grazing. In: Johnson, R. Roy; Jones, Dale A., tech. coords. Impor-tance, preservation and management of riparian habitat: a sym-posium; 1977 July 9; Tucson, AZ. Gen. Tech. Rep. RM-43. FortCollins, CO: U.S. Department of Agriculture, Forest Service,Rocky Mountain Forest and Range Experiment Station: 49-51.
Anderson, Bertin W.; Hunter, William C.; Ohmart, Robert D. 1989.Status changes of bird species using revegetated riparian habi-tats on the lower Colorado River from 1977 to 1984. In: Abell,Dana L., tech. coord. Proceedings of the California ripariansystems conference: protection, management, and restoration forthe 1990’s; 1988 September 22-24; Davis, CA. Gen. Tech. Rep.PSW-110. Berkeley, CA: U.S. Department of Agriculture, ForestService, Pacific Southwest Forest and Range Experiment Sta-tion: 325-331.
Argus, George W. 1973. The genus Salix in Alaska and the Yukon.Publications in Botany 2. Ottawa, ON: National Museums ofCanada, National Museum of Natural Sciences. 279 p.
Armour, Carl; Duff, Don; Elmore, Wayne. 1994. The effects of live-stock grazing on western riparian and stream ecosystem. Fisher-ies. 19(9): 9-12.
Barneby, Rupert C. 1989. Fabales. Vol. 3, Part B, Intermountainflora: vascular plants of the Intermountain West, U.S.A. NewYork: New York Botanical Garden. 279.
Berry, Charles R., Jr. 1979. Impact of sagebrush management onriparian and stream habitat. In: The sagebrush ecosystem: asymposium; 1978 April; Logan, UT. Logan, UT: Utah StateUniversity, College of Natural Resources: 192-209.
Birney, Elmer C.; Grant, W. E.; Baird, Donna Day. 1976. Impor-tance of vegetative cover to cycles of Microtus populations. Ecol-ogy. 57(5): 1043-1051.
Blankenship, James O.; Smith, Dixie R. 1966. Indirect estimation ofstanding crop. Journal of Range Management. 19(2): 74-77.
Bock, Carl E.; Saab, Victoria A.; Rich, Terrell D.; Dobkin, David S.1993. Effects of livestock grazing on neotropical migratorylandbirds in western North America. In: Finch, Deborah M.;Stangel, Peter W., eds. Status and management of neotropicalmigratory birds; 1992 September 21-25; Estes Park, CO. Gen.Tech. Rep. RM-229. Fort Collins, CO: U.S. Department of Agricul-ture, Forest Service, Rocky Mountain Forest and Range Experi-ment Station: 296-309.
Briggs, Mark K.; Roundy, Bruce A.; Shaw, William W. 1994. Trialand error: assessing the effectiveness of riparian revegetation inArizona. Restoration & Management Notes. 12(2): 160-167.
Brinkman, Kenneth A. 1974. Salix L. willow. In: Schopmeyer, C. S.,tech. coord. Seeds of woody plants in the United States. Agric.Handb. 450. Washington, DC: U.S. Department of Agriculture,Forest Service: 746-750.
Chaney, Ed; Elmore, Wayne; Platts, William S. 1990. Livestockgrazing on western riparian areas. Report produced for the U.S.Environmental Protection Agency by the Northwest ResourceInformation Center, Inc., Eagle, ID. Denver, CO: U.S. Environ-mental Protection Agency. 45 p.
Chaney, Ed; Elmore, Wayne; Platts, William S. 1993. Managingchange: livestock grazing on western riparian areas. Report
24
produced for the U.S. Environmental Protection Agency by theNorthwest Resource Information Center, Inc. Eagle, ID. Denver,CO: U.S. Environmental Protection Agency. 31 p.
Cronquist, Arthur. 1994. Asterales. Vol. 5, Intermountain flora:vascular plants of the Intermountain West, U.S.A. New York:New York Botanical Garden. 496 p.
Cronquist, Arthur; Holmgren, Arthur H.; Holmgren, Noel H.;Reveal, James L. 1972. Geological and botanical history of theregion, its plant geography and a glossary; the vascular crypto-gams and the gymnosperms. Vol. 1, Intermountain flora: vascu-lar plants of the Intermountain West, U.S.A. New York: HafnerPublishing Company. 270 p.
Cronquist, Arthur; Holmgren, Arthur H.; Holmgren, Noel H.;Reveal, James L.; Holmgren, Patricia K. 1977. The Monocotyle-dons. Vol. 6, Intermountain flora: vascular plants of the Inter-mountain West, U.S.A. New York: Columbia University Press.584 p.
Cronquist, Arthur; Holmgren, Arthur H.; Holmgren, Noel H.;Reveal, James L.; Holmgren, Patricia K. 1984. Subclass Asteridae(except Asteraceae). Vol. 4, Intermountain flora: vascular plantsof the Intermountain West, U.S.A. New York: New York Botani-cal Garden. 573 p.
Crouse, Michael R.; Kindschy, Robert R. 1984. A method for pre-dicting riparian vegetation potential of semiarid rangelands. In:Proceedings 1984 Pacific Northwest range management shortcourse: range watersheds, riparian zones and economics: interre-lationships in management and use. Corvallis: Oregon StateUniversity: 18-24.
Daubenmire, R. 1959. A canopy-coverage method of vegetationalanalysis. Northwest Science. 33(1): 43-64.
Dayton, William A. 1931. Important western browse plants. Misc.Publ. 101. Washington, DC: U.S. Department of Agriculture.214 p.
DeBano, Leonard F.; Schmidt, Larry J. 1989. Interrelationshipbetween watershed condition and health of riparian areas insouthwestern United States. In: Gresswell, Robert E.; Barton,Bruce A.; Kershner, Jeffery L., eds. Practical approaches toriparian resource management: an education workshop. 1989May 8-11; Billings, MT. Billings, MT: U.S. Department of theInterior, Bureau of Land Management: 45-52.
Dunaway, Donette; Swanson, Sherman R.; Wendel, Jeanne; Clary,Warren P. 1994. The effect of herbaceous plant communities andsoil textures on particle erosion of alluvial streambanks. Geomor-phology. 9: 47-56.
Findley, Jean. 1995. [Personal communication]. Vale, OR: U.S.Department of the Interior, Bureau of Land Management, ValeDistrict.
Griffiths, David. 1903. Forage conditions and problems in easternWashington, eastern Oregon, northeastern California, and north-western Nevada. Bull. 38. Washington, DC: U.S. Department ofAgriculture, Bureau of Plant Industry. 51 p.
Hansen, Edward A. 1971. Sediment in a Michigan trout stream: itssource, movement, and some effects on fish habitat. Res. Pap.NC-59. St. Paul, MN: U.S. Department of Agriculture, ForestService, North Central Forest Experiment Station. 14 p.
Hansen, Paul L.; Chadde, Steve W.; Pfister, Robert D. 1988. Ripar-ian dominance types of Montana. Misc. Publ. 49. Missoula, MT:University of Montana, School of Forestry, Montana Forest andConservation Experiment Station. 411 p.
Hironaka, M.; Fosberg, M. A.; Winward, A. H. 1983. Sagebrush-grass habitat types of southern Idaho. Bull. 35. Moscow, ID:University of Idaho, College of Forestry, Wildlife and RangeExperiment Station. 44 p.
Hitchcock, Leo C.; Cronquist, Arthur. 1973. Flora of the PacificNorthwest. Seattle: University of Washington Press. 730 p.
Hunter, William C.; Anderson, Bertin W.; Tollefson, Reed E. 1989.Bird use of natural and recently revegetated cottonwood-willowhabitats on the Kern River. In: Abell, Dana L., tech. coord.Proceedings of the California riparian systems conference: pro-tection, management, and restoration for the 1990’s; 1988 Sep-tember 22-24; Davis, CA. Gen. Tech. Rep. PSW-110. Berkeley,CA: U.S. Department of Agriculture, Forest Service, PacificSouthwest Forest and Range Experiment Station: 332-338.
Hyder, D. N.; Bement, R. E.; Remmenga, E. E.; Terwilliger, C., Jr.1966. Vegetation-soils and vegetation-grazing relations fromfrequency data. Journal of Range Management. 19(1): 11-17.
International Bird Census Committee. 1970. An international stan-dard for a mapping method in bird census work. Audubon FieldNotes. 24(6): 722-726.
Kauffman, J. Boone; Krueger, William C.; Vavra, Martin. 1982.Impacts of a late season grazing scheme on nongame wildlife ina Wallowa Mountain riparian ecosystem. In: Peek, James M.;Dalke, P. D., eds. Wildlife-livestock relationships symposium:Proceedings 10; 1981 April 20-22; Coeur d’Alene, ID. Moscow, ID:University of Idaho, College of Forestry, Wildlife and RangeExperiment Station: 208-220.
Kauffman, J. Boone; Krueger, W. C. 1984. Livestock impacts onriparian ecosystems and streamside management implications—a review. Journal of Range Management. 37(5): 430-438.
Knopf, Fritz L.; Cannon, Richard W. 1982. Structural resilience ofa willow community to changes in grazing practices. In: Peek,James M.; Dalke, P. D., eds. Wildlife-livestock relationshipssymposium: Proceedings 10; 1981 April 20-22; Coeur d’Alene, ID.Moscow, ID: University of Idaho, College of Forestry, Wildlife andRange Experiment Station: 198-207.
Knopf, Fritz L.; Sedgwick, James A.; Cannon, Richard W. 1988.Guild structure of a riparian avifauna relative to seasonal cattlegrazing. Journal of Wildlife Management. 52(2): 280-290.
Kovalchik, Bernard L. 1987. Riparian zone associations: Deschutes,Ochoco, Fremont, and Winema National Forests. R6 ECOL TP-279-87. Portland, OR: U.S. Department of Agriculture, ForestService, Pacific Northwest Region. 171 p.
Kovalchik, Bernard L. 1992. Growth and yield of willows incentral Oregon compared to reports in world literature. In: Clary,Warren P.; McArthur, E. Durant; Bedunah, Don; Wambolt, Carl L.,comps. Proceedings—symposium on ecology and management ofriparian shrub communities; 1991 May 29-31; Sun Valley, ID.Gen. Tech. Rep. INT-289. Ogden, UT: U.S. Department of Agri-culture, Forest Service, Intermountain Research Station: 83-88.
Kovalchik, Bernard L.; Elmore, Wayne. 1992. Effects of cattlegrazing systems on willow-dominated plant associations in cen-tral Oregon. In: Clary, Warren P.; McArthur, E. Durant; Bedunah,Don; Wambolt, Carl L., comps. Proceedings—symposium onecology and management of riparian shrub communities; 1991May 29-31; Sun Valley, ID. Gen. Tech. Rep. INT-289. Ogden, UT:U.S. Department of Agriculture, Forest Service, IntermountainResearch Station: 111-119.
Kozel, Steven J.; Burton, Timothy A.; Reighn, Christopher. 1993.Evaluation of livestock grazing effects on streambank stability,cover, and other habitat features in the Bear Valley watershed,1993. Unpublished report on file at: Boise, ID: U.S. Departmentof Agriculture, Forest Service, Boise National Forest. 108 p.
Krueper, David J. 1993. Effects of land use practices on westernriparian ecosystems. In: Finch, Deborah M.; Stangel, Peter W.,eds. Status and management of neotropical migratory birds; 1992September 21-25; Estes Park, CO. Gen. Tech. Rep. RM-229. FortCollins, CO: U.S. Department of Agriculture, Forest Service,Rocky Mountain Forest and Range Experiment Station: 321-330.
Lovell, Burrell B. 1991. [Personal communication]. Boise, ID: U.S.Department of Agriculture, Forest Service, Intermountain Re-search Station, Forestry Sciences Laboratory.
Malheur County Historical Society. 1988. Malheur County history:Vol. I. Vale, OR: Malheur Historical Society. 499 p.
Manning, Mary E.; Swanson, Sherman R.; Svejcar, Tony; Trent,James. 1989. Rooting characteristics of four intermountainmeadow community types. Journal of Range Management. 42(4):309-312.
Marlow, Clayton B.; Pogacnik, Thomas M. 1985. Time of grazingand cattle-induced damage to streambanks. In: Johnson, R. Roy;Ziebell, Charles D.; Patton, David R.; Ffolliott, Peter F.; Hamre,R. H., tech. coords. Riparian ecosystems and their management:reconciling conflicting uses: first North American riparian con-ference; 1985 April 16-18; Tucson, AZ. Gen. Tech. Rep. RM-120.Fort Collins, CO: U.S. Department of Agriculture, Forest Service,Rocky Mountain Forest and Range Experiment Station: 279-284.

25
Medin, Dean E.; Clary, Warren P. 1989. Small mammal populationsin a grazed and ungrazed riparian habitat in Nevada. Res. Pap.INT-413. Ogden, UT: U.S. Department of Agriculture, ForestService, Intermountain Research Station. 6 p.
Medin, Dean E.; Clary, Warren P. 1990. Bird and small mammalpopulations in a grazed and ungrazed riparian habitat in Idaho.Res. Pap. INT-425. Ogden, UT: U.S. Department of Agriculture,Forest Service, Intermountain Research Station. 8 p.
Moulton, Michael. 1978. Small mammal associations in grazed ver-sus ungrazed cottonwood riparian woodland in eastern Colorado.In: Graul, W. D.; Bisell, S. J., tech. coords. Proceedings lowlandriver and stream habitat in Colorado: a symposium; 1978 October4-5; Greeley, CO. Greeley, CO: Colorado Chapter of the WildlifeSociety and Colorado Audubon Council: 133-139.
Mozingo, H. N. 1986. Shrubs of the Great Basin. Reno, NV: Univer-sity of Nevada Press. 342 p.
Myers, Thomas J.; Swanson, Sherman. 1995. Impact of deferredrotation grazing on stream characteristics in central Nevada: acase study. North American Journal of Fisheries Management.15(2): 428-439.
Oldenmeyer, John L.; Allen-Johnson, Lydia R. 1988. Cattle grazingand small mammals on the Sheldon National Wildlife Refuge,Nevada. In: Szaro, Robert C.; Severson, Kieth E.; Patton, David R.,tech. coords. Management of amphibians, reptiles, and smallmammals in North America: proceedings of the symposium;1988 July 19-21; Flagstaff, AZ. Gen. Tech. Rep. RM-166. FortCollins, CO: U.S. Department of Agriculture, Forest Service,Rocky Mountain Forest and Range Experiment Station: 391-398.
Pechanec, Joseph F.; Pickford, G. D. 1937. A comparison of somemethods of determining percentage utilization of range grasses.Journal of Agricultural Research. 54: 753-765.
Peck, Morton E. 1911. Summer birds of Willow Creek Valley,Malheur County, Oregon. The Condor. 13(2): 63-69.
Platts, W. S. 1991. Livestock grazing. In: Meehan, William R., ed.Influences of forest and rangeland management on salmonidfishes and their habitats. Spec. Publ. 19. Bethesda, MD: Ameri-can Fisheries Society: 389-423.
Platts, William S.; Armour, Carl; Booth, Gordon D; [and others].1987. Methods for evaluating riparian habitats with applicationsto management. Gen. Tech. Rep. INT-221. Ogden, UT: U.S.Department of Agriculture, Forest Service, Intermountain Re-search Station. 177 p.
Platts, William S.; Nelson, Rodger L. 1989. Characteristics ofriparian plant communities and streambanks with respect tograzing in northeastern Utah. In: Gresswell, Robert E.; Barton,Bruce A.; Kershner, Jeffery L., eds. Practical approaches toriparian resource management: an education workshop; 1989May 8-11; Billings, MT. Billings, MT: U.S. Department of theInterior, Bureau of Land Management: 73-81.
Renner, F. G. 1936. Conditions influencing erosion on the BoiseRiver Watershed. Tech. Bull. 528. Washington, DC: U.S. Depart-ment of Agriculture. 32 p.
Rosgen, David L. 1994. A classification of natural rivers. Catena. 22:169-199.
Rucks, Jeffery A. 1978. Comparisons of riparian communities in-fluenced by grazing. In: Graul, W. D.; Bisell, S. J., tech. coords.Proceedings lowland river and stream habitat in Colorado: asymposium; 1978 October 4-5; Greeley, CO. Greeley, CO: ColoradoChapter of the Wildlife Society and Colorado Audubon Council:100-113.
Saab, Victoria A.; Bock, Carl E.; Rich, Terrell D.; Dobkin, David S.1995. Livestock grazing effects in western North America. In:Martin, Thomas E.; Finch, Deborah M., eds. Ecology and man-agement of neotropical migratory birds: a synthesis and reviewof critical issues. Oxford University Press: 311-353.
Samson, Fred B.; Knopf, Fritz L.; Hass, Lisa B. 1988. Small mammalresponse to the introduction of cattle into a cottonwood flood-plain. In: Szaro, Robert C.; Severson, Kieth E.; Patton, David R.,tech. coords. Management of amphibians, reptiles, and smallmammals in North America: proceedings of the symposium; 1988July 19-21; Flagstaff, AZ. Gen. Tech. Rep. RM-166. Fort Collins,CO: U.S. Department of Agriculture, Forest Service, RockyMountain Forest and Range Experiment Station: 432-438.
Schultz, Terri T.; Leininger, Wayne C. 1991. Nongame wildlifecommunities in grazed and ungrazed montane riparian sites.Great Basin Naturalist. 51(3): 286-292.
Sedgwick, James A.; Knopf, Fritz L. 1987. Breeding bird response tocattle grazing of a cottonwood bottomland. Journal of WildlifeManagement. 51(1): 230-237.
Shaw, Nancy L. 1990. Data on file at: U.S. Department of Agricul-ture, Forest Service, Intermountain Research Station, ForestrySciences Laboratory, Boise, ID.
Shaw, Nancy L. 1992. Recruitment and growth of Pacific willowand sandbar willow seedlings in response to season and intensityof cattle grazing. In: Clary, Warren P.; McArthur, E. Durant;Bedunah, Don; Wambolt, Carl L., comps. Proceedings—sympo-sium on ecology and management of riparian shrub communities;1991 May 29-31; Sun Valley, ID. Gen. Tech. Rep. INT-289. Ogden,UT: U.S. Department of Agriculture, Forest Service, Intermoun-tain Research Station: 130-137.
Shaw, Nancy L. 1993. Pole Creek files. Data on file at: U.S.Department of Agriculture, Forest Service, Intermountain Re-search Station, Forestry Sciences Laboratory, Boise, ID.
Shaw, Nancy L.; Clary, Warren P. 1995. Willow establishment inrelation to livestock grazing on an eastern Oregon stream. In:Abstracts: 48th annual meeting; 1995 January 14-20; Phoenix,AZ. Society for Range Management: 58. Abstract.
Skovlin, Jon M. 1984. Impacts of grazing on wetlands and riparianhabitat: a review of our knowledge. In: Developing strategies forrangeland management. Boulder, CO: Westview Press: 1001-1103.
Swanson, Sherman; Meyers, Tom. 1994. Streams, geomorphology,riparian vegetation, livestock, and feedback loops: thoughtsfor riparian grazing management by objectives. In: Marston,Richard A.; Hasfurther, Victor R., eds. Effects of human-inducedchanges on hydrologic systems. Proceedings annual summersymposium of the American Water Resources Association; 1994June 26-29; Jackson Hole, WY. Bethesda, MD: American WaterResources Association: 255-264.
Swenson, W. S. 1957. Squawbush in windbreaks in eastern Colorado.Journal of Soil and Water Conservation. 12: 184-185.
Szaro, Robert C.; Pase, Charles P. 1983. Short-term changes in acottonwood-ash-willow association on a grazed and an ungrazedportion of Little Ash Creek in central Arizona. Journal of RangeManagement. 36(3): 382-384.
Thomas, Jack Ward; Maser, Chris; Rodiek, Jon E. 1979. Wildlifehabitats in managed rangelands—the Great Basin of southeast-ern Oregon: riparian zones. Gen. Tech. Rep. PNW-80. Portland,OR: U.S. Department of Agriculture, Forest Service, PacificNorthwest Forest and Range Experiment Station. 18 p.
Thornburg, Ashley A. 1982. Plant materials for use on surface minedlands in arid regions. T. P. 157; EPA 600-7-79-133. Washington,DC: U.S. Department of Agriculture, Soil Conservation Service.88 p.
Trimble, Stanley W.; Mendel, Alexandra C. 1995. The cow as ageomorphic agent—a critical review. Geomorphology. 13(1995):233-253.
United States Department of Agriculture, Forest Service. 1988a.Improved planting auger. Equip tips. Missoula, MT: U.S. Depart-ment of Agriculture, Forest Service. 2 p.
United States Department of Agriculture, Forest Service. 1988b.Range plant handbook. Republication of the original USDAForest Service work of March 1937. New York: Dover Publica-tions. 816 p.
United States Department of Commerce, National Oceanic andAtmospheric Administration. 1986-1993. Climatological data,Oregon. Vols. 92-99. Asheville, NC: National Climatic DataCenter. n.p.
United States Department of the Interior, Bureau of Land Manage-ment, Vale District. 1982. Poall Creek Allotment ManagementPlan 0103. Unpublished paper on file at: U.S. Department ofAgriculture, Forest Service, Intermountain Research Station,Forestry Sciences Laboratory, Boise ID. n.p.
United States Department of the Interior, Bureau of Land Man-agement, Vale District. 1987. Poall Creek Allotment Evaluation.Unpublished paper on file at: U.S. Department of Agriculture,Forest Service, Intermountain Research Station, Forestry Sci-ences Laboratory, Boise, ID. 3 p.

26
United States General Accounting Office. 1988. Public rangelands:some riparian areas restored but widespread improvement willbe slow. GOA/RCED-88-105. Gaithersburg, MD: U.S. GeneralAccounting Office. 85 p.
Uresk, Daniel W.; Paintner, Wayne W. 1985. Cattle diets in aponderosa pine forest in the northern Black Hills. Journal ofRange Management. 38(5): 440-442.
Van Haveren, Bruce P.; Jackson, William L. 1986. Concepts in streamriparian rehabilitation. In: McCabe, Richard E., ed. Transactions51st North American Wildlife and Natural Resources Confer-ence; 1986 March 21-26; Reno, NV. Washington, DC: WildlifeManagement Institute: 280-289.
Wasser, Clinton H. 1982. Ecology and culture of selected speciesuseful in revegetating disturbed lands in the West. FWS/OBS-82/56.Washington, DC: U.S. Department of the Interior, Fish andWildlife Service, Office of Biological Services, Western Energyand Land Use Team. 347 p.
Welch, Bruce. L.; Andrus, Dean. 1977. Rose hips—a possible high-energy food for wintering mule deer? Res. Note INT-221. Ogden,UT: U.S. Department of Agriculture, Forest Service, Intermoun-tain Forest and Range Experiment Station. 6 p.
Youngblood, Andrew P.; Padgett, Wayne G.; Winward, Alma H.1985. Riparian community type classification of eastern Idaho—western Wyoming. R4-Ecol-85-01. Ogden, UT: U.S. Departmentof Agriculture, Forest Service, Intermountain Region. 78 p.
Zasada, J. 1986. Natural regeneration of trees and tall shrubs onforest sites in interior Alaska. In: Van Cleve, K.; Chapin, F.Stuart, III; Flanagan, P.W.; [and others], eds. Forest ecosystemsin the Alaska taiga: a synthesis of structure and function. NewYork: Springer-Verlag: 43-73.
Zeveloff, Samuel I. 1988. Mammals of the Intermountain West. SaltLake City; University of Utah Press. 365 p.
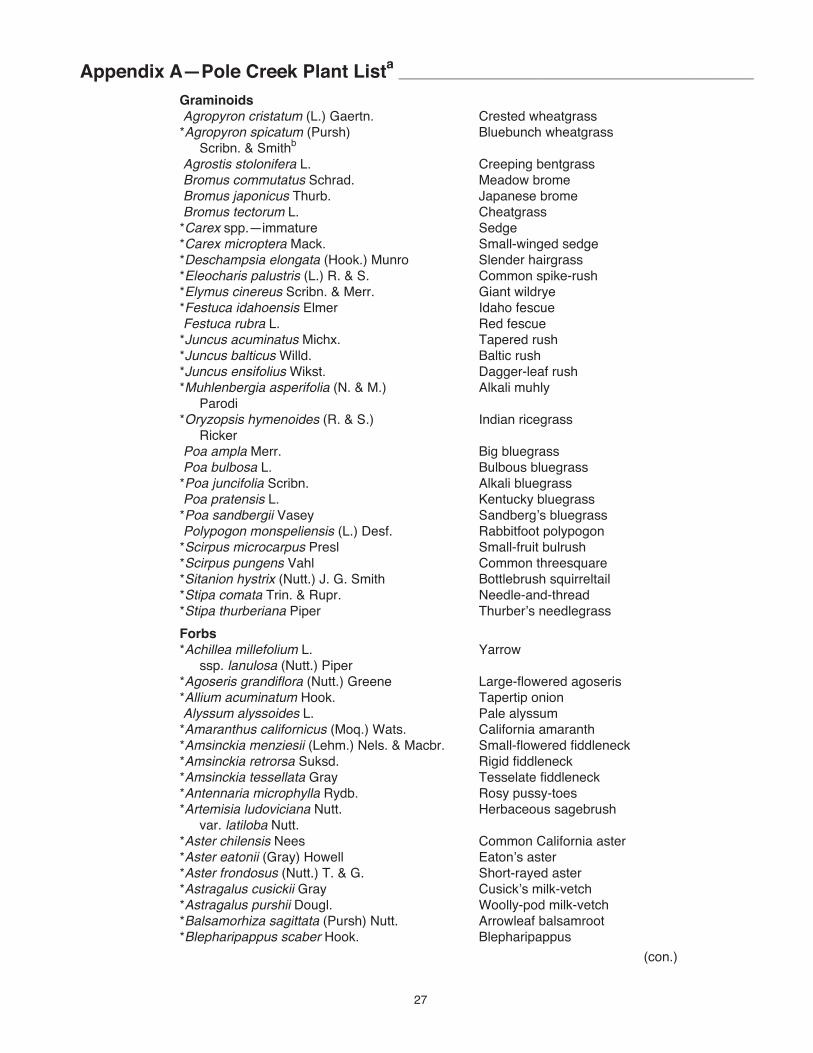
27
Appendix A—Pole Creek Plant Lista_________________________________________________
Graminoids Agropyron cristatum (L.) Gaertn. Crested wheatgrass*Agropyron spicatum (Pursh) Bluebunch wheatgrass
Scribn. & Smithb
Agrostis stolonifera L. Creeping bentgrass Bromus commutatus Schrad. Meadow brome Bromus japonicus Thurb. Japanese brome Bromus tectorum L. Cheatgrass*Carex spp.—immature Sedge*Carex microptera Mack. Small-winged sedge*Deschampsia elongata (Hook.) Munro Slender hairgrass*Eleocharis palustris (L.) R. & S. Common spike-rush*Elymus cinereus Scribn. & Merr. Giant wildrye*Festuca idahoensis Elmer Idaho fescue Festuca rubra L. Red fescue*Juncus acuminatus Michx. Tapered rush*Juncus balticus Willd. Baltic rush*Juncus ensifolius Wikst. Dagger-leaf rush*Muhlenbergia asperifolia (N. & M.) Alkali muhly
Parodi*Oryzopsis hymenoides (R. & S.) Indian ricegrass
Ricker Poa ampla Merr. Big bluegrass Poa bulbosa L. Bulbous bluegrass*Poa juncifolia Scribn. Alkali bluegrass Poa pratensis L. Kentucky bluegrass*Poa sandbergii Vasey Sandberg’s bluegrass Polypogon monspeliensis (L.) Desf. Rabbitfoot polypogon*Scirpus microcarpus Presl Small-fruit bulrush*Scirpus pungens Vahl Common threesquare*Sitanion hystrix (Nutt.) J. G. Smith Bottlebrush squirreltail*Stipa comata Trin. & Rupr. Needle-and-thread*Stipa thurberiana Piper Thurber’s needlegrass
Forbs*Achillea millefolium L. Yarrow
ssp. lanulosa (Nutt.) Piper*Agoseris grandiflora (Nutt.) Greene Large-flowered agoseris*Allium acuminatum Hook. Tapertip onion Alyssum alyssoides L. Pale alyssum*Amaranthus californicus (Moq.) Wats. California amaranth*Amsinckia menziesii (Lehm.) Nels. & Macbr. Small-flowered fiddleneck*Amsinckia retrorsa Suksd. Rigid fiddleneck*Amsinckia tessellata Gray Tesselate fiddleneck*Antennaria microphylla Rydb. Rosy pussy-toes*Artemisia ludoviciana Nutt. Herbaceous sagebrush
var. latiloba Nutt.*Aster chilensis Nees Common California aster*Aster eatonii (Gray) Howell Eaton’s aster*Aster frondosus (Nutt.) T. & G. Short-rayed aster*Astragalus cusickii Gray Cusick’s milk-vetch*Astragalus purshii Dougl. Woolly-pod milk-vetch*Balsamorhiza sagittata (Pursh) Nutt. Arrowleaf balsamroot*Blepharipappus scaber Hook. Blepharipappus
(con.)

28
*Boisduvalia stricta (Gray) Greene Brook spike-primrose*Calochortus macrocarpus Dougl. Sagebrush mariposa*Camissonia boothii (Dougl.) Raven Alyssum-like evening-primrose
ssp. alyssoides (H. & A.) Raven*Castilleja chromosa A. Nels. Desert paintbrush*Chaenactis douglasii (Hook.) H. & A. Hoary chaenactis Chenopodium album L. Lambsquarter Chorispora tenella (Pall.) DC. Chorispora Cirsium arvense (L.) Scop. Canada thistle Cirsium vulgare (Savi) Tenore Bull thistle*Cleome serrulata Pursh Rocky Mountain bee plant*Collomia grandiflora Dougl. Large-flowered collomia*Collomia linearis Nutt. Narrow-leaf collomia Convolvulus arvensis L. Field morning-glory*Conyza canadensis (L.) Cronq. Canada fleabane*Cryptantha pterocarya (Torr.) Greene Winged cryptantha*Delphinium nuttallianum Pritz. Upland larkspur*Descurainia pinnata (Walt.) Britt. Western tansymustard*Descurainia sophia (L.) Webb Flixweed*Epilobium watsonii Barbey Watson’s willow-herb*Equisetum arvense L. Common horsetail*Equisetum laevigatum A. Br. Smooth scouring-rush*Erigeron linearis (Hook.) Piper Line-leaf fleabane*Erigeron pumilus Nutt. Shaggy fleabane
ssp. intermedius Cronq.*Eriogonum ovalifolium Nutt. Oval-leaved eriogonum*Eriogonum umbellatum Torr. Sulfur buckwheat*Eriogonum vimineum Dougl. Broom buckwheat
var. vimineum*Eriophyllum lanatum (Pursh) Forbes Oregon sunshine
var. integrifolium (Hook.) Smiley Erodium cicutarium (L.) L’Her. Stork’s-bill*Euphorbia serpyllifolia Pers. Thyme-leaf spurge*Galium aparine L. Cleavers*Gayophytum diffusum T. & G. Spreading gayophytum*Helianthus annuus L. Common sunflower*Iliamna rivularis (Dougl.) Greene Streambank globemallow Lactuca serriola L. Prickly lettuce Lepidium perfoliatum L. Clasping peppergrass*Lomatium triternatum (Pursh) Nine-leaf lomatium
Coult. & Rose*Lupinus arbustus Dougl. Spur lupine Malva neglecta Wallr. Dwarf mallow Marrubium vulgare L. Horehound Medicago lupulina L. Hop clover Medicago sativa L. Alfalfa Melilotus officinalis (L.) Pallas Common yellow sweet-clover*Mentzelia albicaulis Dougl. Small-flowered mentzelia*Mentzelia laevicaulis (Dougl.) Blazing-star mentzelia
T. & G.*Mimulus guttatus DC. Yellow monkey-flower*Montia perfoliata (Donn) Howell Miner’s lettuce*Navarretia minima Nutt. Least navarretia Onopordum acanthium L. Scotch thistle
Appendix A—(Con.)
(con.)

29
Appendix A—(Con.)
*Penstemon spp. Penstemon*Penstemon speciosus Dougl. Showy penstemon*Perideridia bolanderi (Gray) Bolander’s yampah
Nels. & Macbr.*Phacelia heterophylla Pursh Varileaf phacelia*Phacelia linearis (Pursh) Holz. Threadleaf phacelia*Phlox longifolia Nutt. Long-leaf phlox
var. stansburyi (Torr.) Gray Plantago major L. Common plantain*Potentilla biennis Greene Biennial cinquefoil Ranunculus cymbalaria Pursh Shore buttercup Ranunculus testiculatus Cranz Hornseed buttercup Rumex crispus L. Curly dock*Rumex salicifolius Weinm. Willow dock
var. triangulivalvis Danser Salsola kali L. Russian thistle*Scutellaria angustifolia Pursh Narrow-leaved skullcap*Senecio hydrophiloides Rydb. Sweet-marsh butterweed Sisymbrium altissimum L. Jim Hill mustard Solanum dulcamara L. Climbing nightshade Solanum nigrum L. Black nightshade*Solidago canadensis L. Canada goldenrod Taraxacum officinale Weber Common dandelion Thlaspi arvense L. Field pennycress Trifolium fragiferum L. Strawberry clover Trifolium repens L. Dutch clover*Trifolium variegatum Nutt. White-tip clover*Triteleia grandiflora Lindl. Douglas’ brodiaea*Typha latifolia L. Common cat-tail*Urtica dioica L. Stinging nettle Verbascum thapsus L. Common mullein*Veronica americana Schwein. American brooklime Veronica anagallis-aquatica L. Water speedwell*Viola spp. Violets*Xanthium strumarium L. Common cocklebur
var. canadense (Mill.) T. & G.
Trees and Shrubs*Amelanchier alnifolia Nutt. Western serviceberry*Artemisia rigida (Nutt.) Gray Stiff sagebrush*Artemisia tridentata Nutt. Great Basin big sagebrush
var. tridentata*Artemisia tridentata Nutt. var. Wyoming big sagebrush
wyomingensis (Beetle & A. Young)S. L. Welsh
*Chrysothamnus nauseosus (Pall.) Gray rabbit-brushBritt.
*Chrysothamnus viscidiflorus (Hook.) Green rabbit-brushNutt.
*Clematis ligusticifolia Nutt. Western clematis*Cornus stolonifera Michx. Red-osier dogwood Elaeagnus angustifolia L. Russian olive*Eriogonum microthecum Nutt. Slenderbush buckwheat
var. microthecum(con.)

30
*Grayia spinosa (Hook.) Moq. Spiny hopsage*Juniperus occidentalis Hook. Western juniper*Peraphyllum ramosissimum Nutt. Squaw apple*Philadelphus lewisii Pursh Syringa*Populus angustifolia James Narrow-leaved cottonwood*Populus trichocarpa T. & G. Black cottonwood*Prunus virginiana L. Common chokecherry*Purshia tridentata (Pursh) DC. Bitter-brush Rhus trilobata Nutt. Squawbush*Ribes aureum Pursh Golden currant Rosa canina L. Dog rose*Rosa woodsii Lindl. Wood’s rose*Salix amygdaloides Anderss. Peach-leaf willow*Salix ?lasiolepis Benth. Arroyo willow*Salix exigua Nutt. ssp. exigua Coyote willow*Salix lasiandra Benth. Whiplash willow
var. caudata (Nutt.) Sudw.*Salix lemmonii Bebb Lemmon’s willow*Salix lutea Nutt. Yellow willow*Sambucus cerulea Raf. Blue elderberry*Tetradymia glabrata Gray Little-leaf horsebrush
aScientific nomenclature has been derived from Barneby (1989), Cronquist (1994), Cronquistand others (1972, 1977, 1984), and Hitchcock and Cronquist (1973). The use of common nameshas followed practices employed by Hitchcock and Cronquist (1973) and in a few cases locallyutilized names furnished by Findley (1995).
bNative species are denoted with an asterisk.
Appendix A—(Con.)

31
Appendix B—Presence of Transient Bird Species, Wide-RangingRaptors, and Residents With Few Observations by Grazing Treatmentfor 1987, 1990, 1993 _______________________________________________
Ungrazed/ Spring grazed Fall grazed Season-longSpecies planted Ungrazed light to moderate light to moderate heavy
1987 1990 1993 1987 1990 1993 1987 1990 1993 1987 1990 1993 1987 1990 1993American goldfinch + + + + + + + +
Carduelis tristisAmerican kestrel + + + + + +
Falco sparveriusBarn swallow + + + + + + + + +
Hirundo rusticaBlack-billed magpie + + +
Pica picaBelted kingfisher + + +
Ceryle alcyonBrown-headed cowbird + + + + + + + + + + + + + + +
Molothrus aterBlack-headed grosbeak + +
Pheucticus melanocephalusBrewer’s sparrow + + + + + + + +
Spizella breweriChipping sparrow + + + + +
Spizella passerinaChukar + + + + + + + + + +
Alectoris chukarCliff swallow +
Hirundo pyrrhonotaCooper’s hawk +
Accipiter cooperiiCommon nighthawk + + + + + + +
Chordeiles minorCommon poorwill + +
Phalaenoptilus nuttalliiCommon raven + + + + + + + + + + + + + + +
Corvus coraxEastern kingbird + +
Tyrannus tyrannusEmpidonax flycatchers + + + + + + + + +
Empidonax spp.European starling + + + +
Sturnus vulgarisFerruginous hawk +
Buteo regalisGolden-crowned kinglet +
Regulus satrapaGolden-crowned sparrow +
Zonotrichia atricapillaGolden eagle + + + + + + + + +
Aquila chrysaetosGreen-winged teal +
Anas creccaHermit thrush + +
Catharus guttatusHouse wren + + +
Troglodytes aedonLewis’ woodpecker + + +
Melanerpes lewisLazuli bunting + + + + +
Passerian amoenaMallard + + + + + + + + + + + + + + +
Anas platyrhynchos
(con.)

32
Appendix B—(Con.)
Ungrazed/ Spring grazed Fall grazed Season-longSpecies planted Ungrazed light to moderate light to moderate heavy
1987 1990 1993 1987 1990 1993 1987 1990 1993 1987 1990 1993 1987 1990 1993MacGillivray’s warbler + + + + +
Oporornis philadelphiaNashville warbler +
Vermivora ruficapillaNorthern flicker +
Colaptes auratusNorthern harrier + + + + + +
Circus cyaneusOsprey +
Pandion haliaetusPrairie falcon + +
Falco mexicanusRuby-crowned kinglet + + + + + +
Regulus calendulaRing-necked pheasant +
Phasianus colchicusRock wren +
Salpinctes obsoletusRufous-sided towhee + +
Pipilo fuscusRed-tailed hawk + + +
Buteo jamaicensisRed-winged blackbird + + + +
Agelaius phoeniceusSay’s phoebe +
Sayornis sayaSong sparrow +
Melospiza melodiaSpotted sandpiper +
Actitis maculariaSharp-shinned hawk + + + + + +
Accipiter striatusSwainson’s hawk + + +
Buteo swainsoniTurkey vulture + + + + + + + + + +
Cathartes auraVesper sparrow + + + + + + +
Pooecetes gramineusViolet-green swallow + + + + + +
Tachycineta thalassinaWarbling vireo +
Vireo gilvusWhite-crowned sparrow + + + + + + + + + + +
Zonotrichia leucophrysWestern kingbird + + + + + + + + + + +
Tyrannus verticalisWilson’s warbler + + +
Wilsonia pusillaYellow warbler + +
Dendroica petechiaYellow-rumped warbler + + + + + + + + + + +
Dendroica coronata

Intermountain Research Station324 25th Street
Ogden, UT 84401
Federal Recycling Program Printed on Recycled Paper
You may order additional copies of this publication by sending your mailinginformation in label form through one of the following media. Please specify thepublication title and Research Paper number.
Telephone (801) 625-5437
DG message Pubs:S22A
FAX (801) 625-5129, Attn: Publications
E-mail /s=pubs/[email protected]
Mailing Address Publications DistributionIntermountain Research Station324 25th StreetOgden, UT 84401
Clary, Warren P.; Shaw, Nancy L.; Dudley, Jonathan G.; Saab, Victoria A.; Kinney, John W.;Smithman, Lynda C. 1996. Response of a depleted sagebrush steppe riparian system tograzing control and woody plantings. Res. Pap. INT-RP-492. Ogden, UT: U.S. Departmentof Agriculture, Forest Service, Intermountain Research Station. 32 p.
To find out if a depleted riparian system in the sagebrush steppe of eastern Oregon wouldrespond quickly to improved management, five management treatments were applied for7 years, ranging from ungrazed to heavily grazed treatments, including in some cases,planting of woody species. While the results varied, all treatments were too limited tosignificantly restore the damaged areas within the 7-year span. Although some improvementswere made in woody plant densities, little meaningful change occurred in the frequencies ofherbaceous wetland plants, densities of small wildlife, or stream channel morphology. Weconcluded the restoration would take many years, possibly decades, without increasedrevegetation efforts and continued reductions in grazing in this riparian system damaged over150 years.
Keywords: livestock grazing, riparian restoration, Salix lasiandra, Salix exigua, Poa pratensis,Agrostis stolonifera, small wildlife, stream channel

The Intermountain Research Station provides scientific knowledge and technology to improve manage-ment, protection, and use of the forests and rangelands of the Intermountain West. Research is designed tomeet the needs of National Forest managers, Federal and State agencies, industry, academic institutions,public and private organizations, and individuals. Results of research are made available through publications,symposia, workshops, training sessions, and personal contacts.
The Intermountain Research Station territory includes Montana, Idaho, Utah, Nevada, and westernWyoming. Eighty-five percent of the lands in the Station area, about 231 million acres, are classified as forestor rangeland. They include grasslands, deserts, shrublands, alpine areas, and forests. They provide fiber forforest industries, minerals and fossil fuels for energy and industrial development, water for domestic andindustrial consumption, forage for livestock and wildlife, and recreation opportunities for millions of visitors.
Several Station units conduct research in additional western States, or have missions that are national orinternational in scope.
Station laboratories are located in:
Boise, Idaho
Bozeman, Montana (in cooperation with Montana State University)
Logan, Utah (in cooperation with Utah State University)
Missoula, Montana (in cooperation with the University of Montana)
Moscow, Idaho (in cooperation with the University of Idaho)
Ogden, Utah
Provo, Utah (in cooperation with Brigham Young University)
Reno, Nevada (in cooperation with the University of Nevada)
The United States Department of Agriculture (USDA) prohibits discrimination in its programs on the basisof race, color, national origin, sex, religion, age, disability, political beliefs, and marital or familial status. (Notall prohibited bases apply to all programs.) Persons with disabilities who require alternative means ofcommunication of program information (braille, large print, audiotape, etc.) should contact the USDA Officeof Communications at (202) 720-2791.
To file a complaint, write the Secretary of Agriculture, U.S. Department of Agriculture, Washington, DC20250, or call 1-800-245-6340 (voice) or (202) 720-1127 (TDD). USDA is an equal employment opportunityemployer.