respiratory physiology & neurobiology - laboratoire de ... · respiratory physiology &...
TRANSCRIPT
T
Ma
b
c
d
a
ARR1AA
KDDRC
1
aoLbbdsHqatu2leusC
h10
Respiratory Physiology & Neurobiology 241 (2017) 62–71
Contents lists available at ScienceDirect
Respiratory Physiology & Neurobiology
journa l h om epa ge: www.elsev ier .com/ locate / resphys io l
he Roughton-Forster equation for DLCO and DLNO re-examined
.-Y. Kanga, D. Grebenkova, H. Guénardb, I. Katzc,d, B. Sapovala,∗
Physique de la Matière Condensée, CNRS, Ecole Polytechnique, 91128 Palaiseau, FranceLaboratoire de Physiologie, Université Bordeaux 2, 33076 Bordeaux, FranceMedical R&D, Air Liquide Santé International, Centre de Recherches Paris-Saclay, 78534 Jouy-en-Josas, FranceDepartment of Mechanical Engineering, Lafayette College, Easton, PA 18042, USA
r t i c l e i n f o
rticle history:eceived 22 July 2016eceived in revised form9 December 2016ccepted 28 December 2016vailable online 31 December 2016
a b s t r a c t
Roughton and Forster (RF) proposed to split the lung diffusing capacity into two contributions describingfirst, diffusion to red blood cells (RBC), and second, capture by diffusion from the RBC surface and reactionwith haemoglobin. Solving the diffusion-reaction equations for simplified capillary-RBC structures, weinvestigate the RF interpretation. This reveals first that the conventional extrapolation to zero pressure of1/DLCO on PO2 is not a correct measure of the diffusive component. Consequently the capillary volumesdeduced from this extrapolation are erroneous. Secondly, capture mechanisms are different for CO and
eywords:LCOLNOoughton and Forsterapillary volume
NO: while DLCO characterizes “volume absorption” in the RBC and is correlated with hematocrit, DLNOquantifies “surface absorption” and provide information about the morphology of the space between thealveolar surface and the RBC surfaces. In conclusion, the RF approach may lead to erroneous physiologicalinterpretations of DLCO; nevertheless, the measurement of DLCO and DLNO bring different types ofinformation that give the potential for a better understanding of respiratory diseases.
© 2017 The Authors. Published by Elsevier B.V. This is an open access article under the CC BY-NC-ND
. Introduction
The transport and capture of gaseous molecules by blood is major process for life. As such, the quantitative understandingf oxygen respiration has been a primary scientific quest sinceavoisier in the late 18th century. Furthermore, the capture of car-on monoxide (CO), and more recently of nitric oxide (NO), haseen studied for several reasons: First, to interpret the so-callediffusing capacity of CO (introduced by Marie Krogh in 1915 totudy oxygen diffusion) and NO (Guénard et al., 1987; Borland andigenbottam 1989) that is used in standard lung function tests. Theuantification of CO capture is also important to assess the risks forccidental intoxication, smoking and environmental effects. Fur-hermore, there has been an interest in understanding the possiblese of CO as an anti-inflammatory drug (Motterlini and Otterbein,010; Ryter and Choi, 2013). NO was identified as the endothe-
ial derived relaxing factor (Furchgott and Zawadzki, 1980; Ignarrot al., 1987; Palmer et al., 1987). The vaso-relaxing effect of NO is
sed, through drugs acting as NO donors, for vasodilatation in somepecific indications (Frostell et al., 1991; Griffiths and Evans, 2005;hecchia et al., 2012). Apart from its medical application, NO is also∗ Corresponding author.E-mail address: [email protected] (B. Sapoval).
ttp://dx.doi.org/10.1016/j.resp.2016.12.014569-9048/© 2017 The Authors. Published by Elsevier B.V. This is an open access article
/).
license (http://creativecommons.org/licenses/by-nc-nd/4.0/).
a common air pollutant in the air, coming from cigarette smoke, fuelconsumption or nitrate used as fertilizer in agriculture.
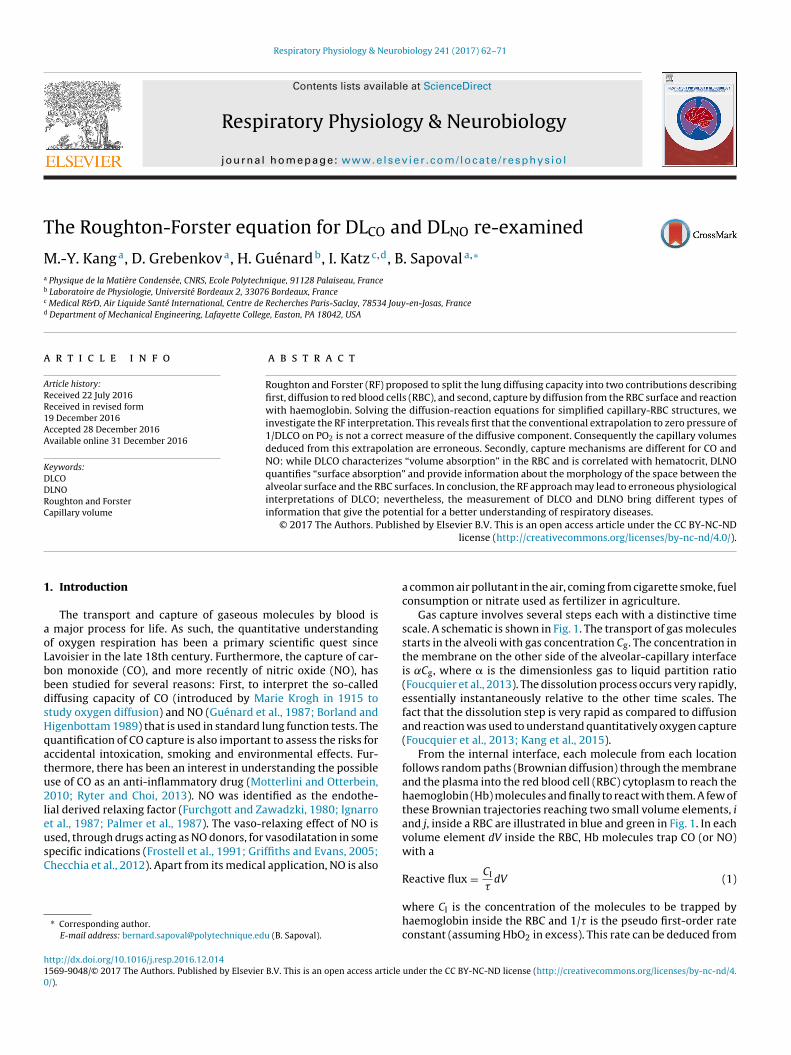
Gas capture involves several steps each with a distinctive timescale. A schematic is shown in Fig. 1. The transport of gas moleculesstarts in the alveoli with gas concentration Cg. The concentration inthe membrane on the other side of the alveolar-capillary interfaceis ˛Cg, where � is the dimensionless gas to liquid partition ratio(Foucquier et al., 2013). The dissolution process occurs very rapidly,essentially instantaneously relative to the other time scales. Thefact that the dissolution step is very rapid as compared to diffusionand reaction was used to understand quantitatively oxygen capture(Foucquier et al., 2013; Kang et al., 2015).
From the internal interface, each molecule from each locationfollows random paths (Brownian diffusion) through the membraneand the plasma into the red blood cell (RBC) cytoplasm to reach thehaemoglobin (Hb) molecules and finally to react with them. A few ofthese Brownian trajectories reaching two small volume elements, iand j, inside a RBC are illustrated in blue and green in Fig. 1. In eachvolume element dV inside the RBC, Hb molecules trap CO (or NO)with a
Reactive flux = CI dV (1)
�where CI is the concentration of the molecules to be trapped byhaemoglobin inside the RBC and 1/� is the pseudo first-order rateconstant (assuming HbO2 in excess). This rate can be deduced from
under the CC BY-NC-ND license (http://creativecommons.org/licenses/by-nc-nd/4.
M.-Y. Kang et al. / Respiratory Physiology & Neurobiology 241 (2017) 62–71 63
List of symbols
Cg; CE; CI Respectively, concentrations of CO or NO in gas,in membrane-plasma external to RBCs, and insideRBCs
DCO; DNO Diffusion coefficients of CO and NO in plasma incm2/s
DLCO; DLNO Lung diffusing capacity for CO and NO inmlstp/(min mmHg)
DMCO; DMNO Diffusive conductance for CO and NO inmlstp/(min mmHg)
Hb Haemoglobin moleculeHct HaematocritLM; LP Thickness of membrane; plasma in �mLRBC/2 Half thickness of a flat RBC in �mLD Penetration depth in �mNRBC Number of RBC in the lungPO2 Oxygen partial pressure in mmHgRBC Red blood cellRF First initials of Roughton and Forsterra; rb Long and short radius of the biconcave RBC in �mrRBC Radius of the spherical RBC in �mS Total gas exchange surface in m2
SRBC RBC surface area in �m2
TD Time-dependent (or time-based) interpretationdV Small volume element in RBCVc Pulmonary capillary volume in mlVRBC Volume of a red blood cell in �m3
W Half distance between periodic RBCs in �m˛CO; ˛NO Gas to liquid partition ratio for CO and NO (dimen-
sionless)� Molecular flux per unit time in s−1
� Specific transfer conductance of gas species in blood�CO; �NO Characteristic reaction times for CO and NO with
c2
sFt
wi“vq
up(tttsaftei
Fig. 1. Schematic representation of the capture process. The gas concentration Cg
drops through extremely rapid dissolution to �Cg on the internal face of the alveolar-capillary interface (� is the dimensionless gas to liquid partition ratio). Then themolecules from any starting point on the interface move along random individualpaths (Brownian diffusion) through the membrane and plasma and into the RBC
Hb molecules in millisecond
hemical kinetics studies (Gibson et al., 1955; Chakraborty et al.,004; Kang and Sapoval, 2016).
In contrast to the micro-dynamics discussed above, a global andteady state interpretation has been proposed by Roughton andorster (1957) hereafter called RF. It is expressed by the RF equa-ion:
1DLCO
= 1DMCO,RF
+ 1�RF · VcRF
(2)
here DLCO is the lung diffusing capacity for CO (the quantity thats measured), 1/DMCO,RF is called the diffusive resistance, �RF is thespecific blood conductance” and VcRF is the pulmonary capillaryolume. The index RF is kept here because we will compare theseuantities with their mathematical equivalents below.
The Roughton and Forster interpretation is the dominant modelsed by the scientific and clinical communities. The physical inter-retation of this scheme is that the global lung capture resistance1/DLCO) is the sum of two resistances in series, the diffusive resis-ance that is supposed to characterize the transfer from the gas tohe external surfaces of the RBCs, and the blood resistance relatedo diffusion and reaction inside RBCs. The RF interpretation is thetandard in this field (see Hughes and Bates, 2003 for a review)nd it is used in published recommendations for CO and NO lungunction testing (MacIntyre et al., 2005). Since the late 1950′s up
o the present there have been a number of contributions thatxamine both experimentally and theoretically this interpretationn different situations (Hughes and Pride, 1999).cytoplasm to reach the Hb molecules and finally react. This random transport isrepresented by the blue and green trajectories. Figure from Kang and Sapoval (2016).
Such a simplified description of this complex phenomenon bytwo independent resistances requires as a necessary (but not suf-ficient) condition that the periphery of a RBC is at a uniformconcentration (iso-concentration) and be the same for all the RBCs.For general RBC morphology (and situations where these cells aremoving in the capillaries, taking different shapes through time andeven forming clusters), this condition is not satisfied.
It should be recalled that the RF equation does not arise from ageneral solution of the mathematical problem illustrated in Fig. 1.So, the fundamental question remains, how does diffusion and reac-tion interact and contribute to the global capture? The answer tothat question is important because a DLCO measurement, if inter-preted by RF, depends on three unknown parameters, VcRF, DMRF,and �RF. This renders the determination of the pertinent physio-logical quantities DMRF and VcRF dependent on the choice of �RF.Different approaches to this choice are discussed in the literature(see for instance the references in Coffman et al., 2016).
Roughton and Forster were conscious of this difficulty and theysolved part of the problem by proposing the measurement of DLCOas a function of the oxygen partial pressure using the assumptionthat 1/�RF is proportional to this pressure as suggested by theirexperiments. This was the invention of the RF extrapolation thatallows, in principle, one to measure DMCO,RF. Later, using the factof a very rapid reaction rate of Hb with NO, Guénard et al. (1987)suggested that the measure of DLNO considered to be very close toDMNO,RF would give an approximate measure of DMCO,RF based onthe scaling of DLNO from CO and NO solubilities and diffusivitiesusing Graham’s and Fick’s laws.
Solving the problem illustrated in Fig. 1 is beyond the scope ofa direct mathematical analysis. Nonetheless, the objective of thiswork is to examine simple cases where exact analytical or precisenumerical values of DLCO and DLNO can be obtained. We will pro-vide solutions to the diffusion-reaction equations for simplified andstatic boundary conditions. One can then check if their dependence
on the reaction rate and capillary volume confirms the RF interpre-tation. Notwithstanding the simplifications here, the results showthat the RF understanding of DLCO and DLNO is inaccurate. At the
64 M.-Y. Kang et al. / Respiratory Physiology & Neurobiology 241 (2017) 62–71
F allel si ction.p
sp
cdoao
2
vd
waraddDmott
i
D
ig. 2. Three geometries of gas-membrane-plasma-RBC structure. (Top) A: Flat parnside a cylindrical capillary represented by the quarter of an axial planar cross-selanar cross-section. (Bottom) 3D illustrations of each geometry.
ame time, this study opens a new perspective for a better inter-retation of these quantities.
Since this study is directed towards the pulmonary physiologyommunity, the details of the calculations will be given in appen-ices and the results will be illustrated through graphs. The rolef mathematics here is not to give results that could directly bepplied to clinical questions but to help to select between the meth-ds of interpretation those that are better founded.
. Methods
During the single-breath (and hold) diffusing capacity manoeu-re, the gas molecule concentration inside the RBC CI follows theiffusion-reaction equation:
∂CI(x, y, z, t)∂t
= D
(∂2 CI(x, y, z, t)
∂x2+ ∂2 CI(x, y, z, t)
∂y2
+∂2CI(x, y, z, t)
∂z2
)− CI(x, y, z, t)
�(3)
here D is the molecular diffusivity in the cytoplasm (taken heres the value in plasma). It is an exact and general mathematicalesult that the solution of the time-dependent Eq. (3) is the sum of
steady-state but space-dependent solution and a series of timeecaying exponentials where the slowest term has a characteristicecay time of order L2/D where L is the size of the system. For usual
values and L of order 1 �m, this time constant is of the order of 1illisecond. This means that after a few milliseconds the solution
f the time-dependent Eq. (3) is, to a very good approximation,he time-independent but space-dependent function. The completeime dependent solution will be discussed in the Section 3.3.
Inside the RBC, the steady state solution satisfies the time-ndependent equation(
∂2 C (x, y, z) ∂2 C (x, y, z) ∂2C (x, y, z)
)C (x, y, z)
I∂x2+ I
∂y2+ I
∂z2− I
�= 0
(4)
tructure of a symmetrical gas-membrane-plasma-RBC geometry. B: Spherical RBCs C: Biconcave RBCs in a cylindrical capillary represented by the quarter of an axial
In the membrane plus plasma region (i.e., outside the RBC withno haemoglobin molecules), the external concentration CE obeysthe simple steady-state diffusion or Laplace equation:(
∂2 CE(x, y, z)∂x2
+ ∂2 CE(x, y, z)∂y2
+ ∂2CE(x, y, z)
∂z2
)= 0 (5)
The gas concentration must also obey boundary conditions: Theconcentration on the internal interface of the capillary is equal to�Cg and the concentrations and fluxes are continuous at the RBCperiphery:(
CE = ˛Cg)
capillary periphery; (CE = CI)RBC periphery;
(dCE
dn= dCI
dn
)RBC periphery
(6)
where n is the normal to the RBC periphery. The continuity of thederivatives is linked to the fact that the diffusivities in plasmaand the RBC cytoplasm can be considered to be approximatelyequal. This point is not trivial as the interior of RBCs is crowdedby haemoglobin molecules that occupy about 30% of the volume.It is well known that in such a situation, like in porous materi-als, diffusion at short distances (or short time) is not perturbedwhile long distance diffusivity is reduced. A recent detailed studyof diffusion in crowded systems (Palombo et al., 2013) showed thatwhen applied to the RBC situation, for distances of order the RBCsize, diffusivity is still within a good approximation the diffusivityin plasma or water. Note that the diffusivities measured in solu-tions which have been recently used in this field (Sakai et al., 2008;Azarov et al., 2011; Borland et al., 2014) are long distance diffusiv-ities. Until now, there exists no measurement of NO diffusivity inconcentrated Hb solution with thicknesses of order 1 �m, whichwould show that the short distance diffusivity is larger than thelong distance value.
Eqs. (4)–(6) define the minimal mathematical description of the
capture problem, i.e., a diffusion-reaction in two different media: apurely diffusion zone limiting a diffusion-reaction region.Diffusivity values of CO and NO found in the literature are varied(see the Appendix A of Kang and Sapoval, 2016 and the refer-
M.-Y. Kang et al. / Respiratory Physiology & Neurobiology 241 (2017) 62–71 65
Table 1Values of geometrical parameters.
A. Flat parallel structure B. Spherical RBC C. Biconcave RBC
LM = 1 �m LM = 1 �m LM = 1 �mLP = 1.5 �m LP = 0.2 �m ra = 3.72 �mLRBC/2 = 1 �m rRBC = 2.88 �m rb = 0.90 �m
W = 1.32 �m W = 1.98 �m
Cc
eDTlsgfaftffFtHafwa
foatoee
sti
pga(
3
nsatDtto
L
i
pto
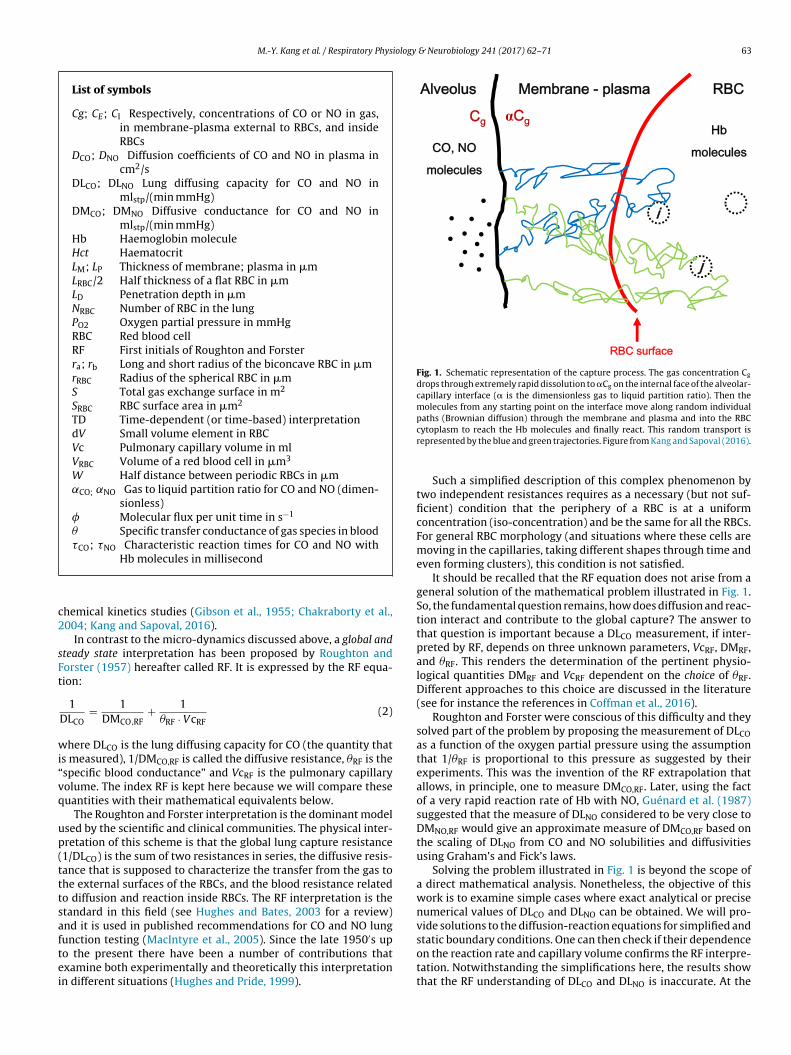
Fig. 3. Spatial concentration distribution of CO (blue) and NO (red). The figure rep-resents a half symmetrical planar RBC membrane plasma geometry. The vertical axisrepresents the concentration normalized to the concentration at the internal inter-face of the gas-membrane frontier. The dotted line represents the concentrationdistribution in the limiting case � = 0. The point A shows normalized concentration
reaction.
ell geometries are chosen to have the volume of RBC VRBC = 100 �m3. LP and Worrespond to a haematocrit Hct = 40%.
nces therein). Many studies have used Graham’s law to obtainNO/DCO but Graham’s law has been proved for gases not for liquids.he problem of diffusivities in liquids is complex. First Graham’saw, stating that the gas diffusion is inversely proportional to thequare root of its molecular weight M, has been demonstrated forases only. In liquids there is also a square root of M, but it is farrom being the dominant difference between these species. Andmong the other physical reasons for different diffusivities, theact that CO and NO are polar molecules that carry different elec-ric dipole moments plays a role. These different electric momentsor CO and NO couple with water molecule dipole moments dif-erently. This is a complex microscopic phenomenon in liquids.or this reason, one has to rely on experimental measurements. Inhis study, we use the interpolated values for 37 ◦C from Wise andoughton (1968): DCO = 3.26 × 10⁻⁵ cm2/s, DNO = 4.80 × 10⁻⁵ cm2/snd DNO/DCO = 1.47. (Wise and Houghton measured NO and CO dif-usivity by following the rate of collapse of bubbles in gas-freeater. Their results should then be considered as an approximate
ssumption for plasma and lung tissues.)The reaction time �CO of CO with Hb in RBC can be obtained
rom chemical kinetics. Kang and Sapoval (2016) deduced previ-usly that �CO = 0.5 ms for 100 mmHg of oxygen partial pressurend that, for larger O2 partial pressures, �CO is linearly proportionalo the pressure. The NO reaction time �NO is of order 5 microsec-nds, i.e., it is shorter than �CO by two orders of magnitude (Sakait al., 2008). The partition ratios �CO = 0.018 and �NO = 0.041 (Cotest al., 2006) were used.
Three different geometries of gas-membrane-plasma-RBCtructures are considered in this study (Fig. 2). A: flat parallel struc-ures; B: spherical RBCs in a cylindrical capillary; C: biconcave RBCsn a cylindrical capillary.
Eqs. (4)–(6) were solved for each case with values of geometricalarameters given in Table 1. The analytical solution for case A isiven in Appendix A. As there is no analytical solution for cases Bnd C, numerical computations based on the Finite Element MethodFEM) were used (see the Appendix B).
. Results and discussion
To qualitatively understand the results, one should recall theotion of “penetration depth during the reaction time”, which mea-ures the order of the distance over which diffusing molecules reactnd disappear. Consider, for example, a planar source at concentra-ion C0 in contact with a diffusion-reaction medium with diffusivity
and reaction time �. The solution of Eq. (4) is a function of the dis-ance x to the source of the form C = C0 exp (-x/(D�)1/2). This meanshat the molecules penetrate the reacting medium to a depth ofrder (D�)1/2 before reacting. For this reason, the length
D =√
D� (7)
s called the penetration depth.
For the case A, the spatial distribution of the concentration com-uted using Eqs. (A.4)–(A.8) is shown in Fig. 3. One observes thathe reaction time determines the penetration depth. For CO, onebtains LD,CO = (DCO�CO)1/2 ≈ 1 �m, which is of order of a typical RBC
of NO at the RBC surface. These results have been calculated from Eqs. (A.4)–(A.8).
half width. For NO, one obtains LD,NO of order 0.1 �m as illustratedin the figure. This justifies the qualitative statement that CO captureis a bulk effect whereas NO capture is a “surface absorption”. Oneshould stress however that there is a small but finite penetrationof NO molecules into the RBC volume.
The fact that the slope of dot-dashed line is slightly smaller thanthat of the dotted line is the consequence of the small penetrationof NO inside the RBC space. The diffusive flux is proportional tothe slope of the straight line in the membrane/plasma region. Forinfinite reaction rate or � = 0 (dotted curve) the flux is proportionalto 1/(LM + LP) and the resistance R is proportional to (LM + LP). ForNO, equating the flux (1-C(LM + LP)/˛Cg)/(LM + LP) to the internal flux(C(LM + LP)/˛Cg)/LD by continuity on the RBC membrane at pointA in Fig. 3, one can compute the increase in apparent resistance�R/R = LD/(LM + LP) in accordance with the data of Fig. 3. Note thatthis resistance increase is not due to any anomalous resistance fromthe RBC morphology as suggested by Borland et al. (2010, 2014) andVaughn et al. (2000) but merely due to finite penetration before
Fig. 4. Spatial distribution of the diffusive flux. The vertical axis represents ratio ofthe diffusive flux to the alveolar gas concentration. The flux is constant up to theRBC surface because there is no reaction there.
66 M.-Y. Kang et al. / Respiratory Physiology & Neurobiology 241 (2017) 62–71
F nd boo re thed = 0.4.
�
wSRivaV
TC
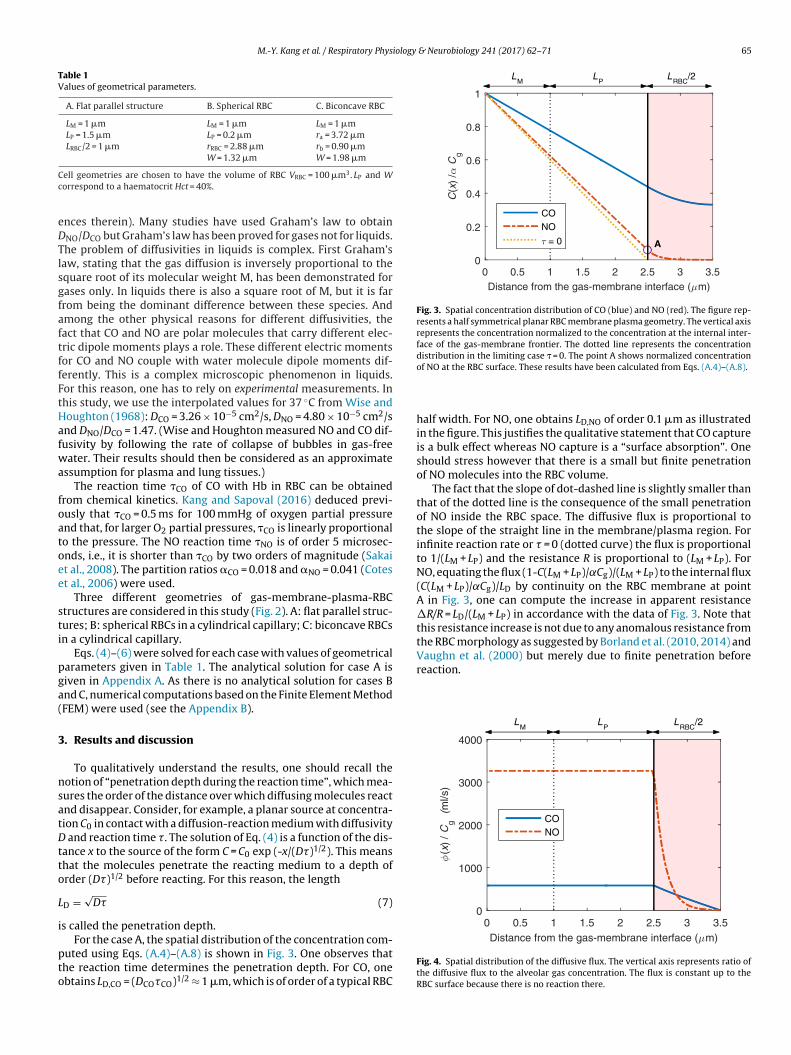
ig. 5. Spatial distribution of CO and NO concentrations for equi-distant RBCs. Top af an RBC axial planar cut inside the cylindrical capillary of Fig. 2. The colored lines aotted line represents the membrane-plasma interface. The data correspond to Hct
The spatial distribution of the diffusive flux is given by Fick’s law
(x) = −DSdC (x)
dx(8)
here S is the total gas exchange surface. One can write = NRBC × SRBC = (VcHct/VRBC) × SRBC where NRBC is the number ofBCs in diffusive contact with the gas, Vc is the pulmonary cap-
llary volume, Hct is haematocrit and VRBC and SRBC are the RBColume and surface area, respectively. In this artificial morphology,
RBC is supposed to be a square box of thickness LRBC = 2 �m andRBC = 100 �m3 giving SRBC = 100 �m2. With VcHct = 44 cm3 (Kang
able 2omputation results for the three morphologies.
Case
DLCO (ml/min/mmHg)
DLNO (ml/min/mmHg)
DLNO/DLCO
DLCO for � = 0(ml/min/mmHg)
True
Extrapolation
Scaling from DLNO
ttom correspond to spherical and biconcave RBCs. The figure represents one fourth loci of isoconcentration with values decreasing from 1 on the upper thick line. The
and Sapoval, 2016), one obtains S = 44 m2. The spatial distributionof the diffusive flux is shown in Fig. 4.
The diffusing capacity DL can be deduced from the global fluxwhich is given by the derivative of the concentration at the gas-membrane interface (see Eqs. (A.9) and (A.11)):
1 = 1DS˛
+ 1( ) (9)
DLLM+LPDS˛LD
tanh LRBC/2LD
where tanh(x) = (1-exp(-2x))/(1 + exp(-2x)) is the hyperbolic tan-gent function. In the usual physiological units, we obtain
A (Flat) B (Sphere) C (Biconcave)
46 63 62258 537 5445.6 8.6 8.882 184 18872 128 12477 160 161
M.-Y. Kang et al. / Respiratory Physiology
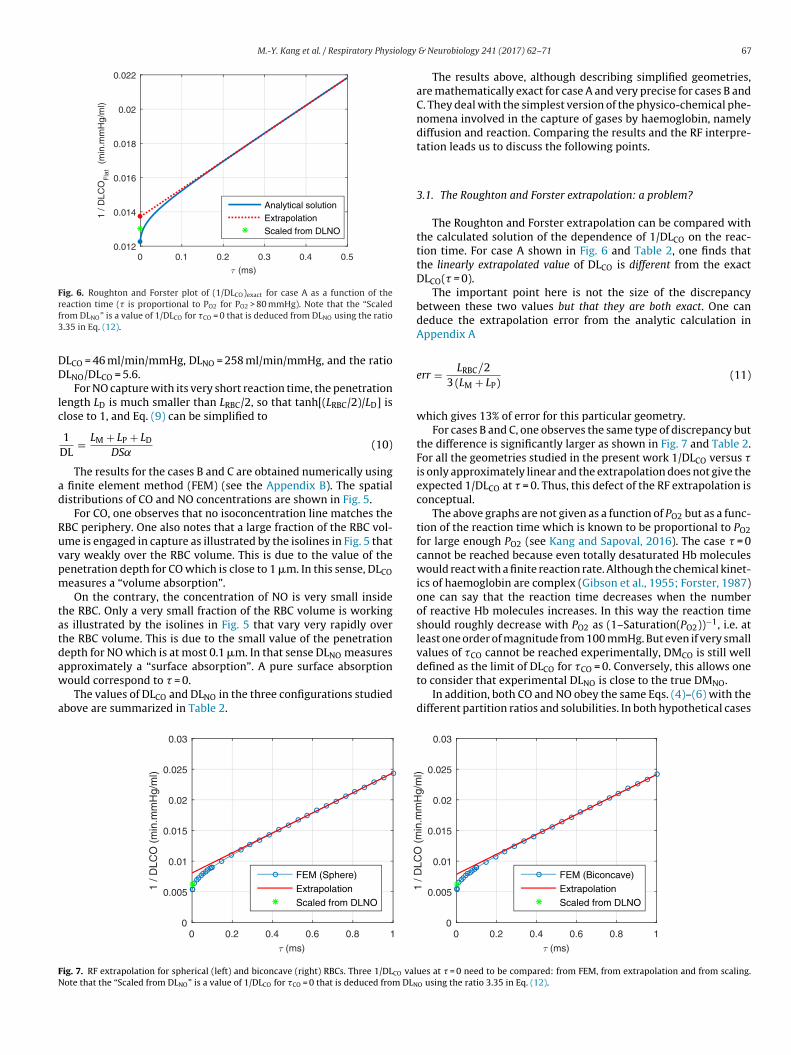
Fig. 6. Roughton and Forster plot of (1/DLCO)exact for case A as a function of therf3
DD
lc
ad
Ruvpm
tatdaw
a
FN
eaction time (� is proportional to PO2 for PO2 > 80 mmHg). Note that the “Scaledrom DLNO” is a value of 1/DLCO for �CO = 0 that is deduced from DLNO using the ratio.35 in Eq. (12).
LCO = 46 ml/min/mmHg, DLNO = 258 ml/min/mmHg, and the ratioLNO/DLCO = 5.6.
For NO capture with its very short reaction time, the penetrationength LD is much smaller than LRBC/2, so that tanh[(LRBC/2)/LD] islose to 1, and Eq. (9) can be simplified to
1DL
= LM + LP + LD
DS˛(10)
The results for the cases B and C are obtained numerically using finite element method (FEM) (see the Appendix B). The spatialistributions of CO and NO concentrations are shown in Fig. 5.
For CO, one observes that no isoconcentration line matches theBC periphery. One also notes that a large fraction of the RBC vol-me is engaged in capture as illustrated by the isolines in Fig. 5 thatary weakly over the RBC volume. This is due to the value of theenetration depth for CO which is close to 1 �m. In this sense, DLCOeasures a “volume absorption”.On the contrary, the concentration of NO is very small inside
he RBC. Only a very small fraction of the RBC volume is workings illustrated by the isolines in Fig. 5 that vary very rapidly overhe RBC volume. This is due to the small value of the penetrationepth for NO which is at most 0.1 �m. In that sense DLNO measures
pproximately a “surface absorption”. A pure surface absorptionould correspond to � = 0.The values of DLCO and DLNO in the three configurations studiedbove are summarized in Table 2.
ig. 7. RF extrapolation for spherical (left) and biconcave (right) RBCs. Three 1/DLCO valote that the “Scaled from DLNO” is a value of 1/DLCO for �CO = 0 that is deduced from DLN
& Neurobiology 241 (2017) 62–71 67
The results above, although describing simplified geometries,are mathematically exact for case A and very precise for cases B andC. They deal with the simplest version of the physico-chemical phe-nomena involved in the capture of gases by haemoglobin, namelydiffusion and reaction. Comparing the results and the RF interpre-tation leads us to discuss the following points.
3.1. The Roughton and Forster extrapolation: a problem?
The Roughton and Forster extrapolation can be compared withthe calculated solution of the dependence of 1/DLCO on the reac-tion time. For case A shown in Fig. 6 and Table 2, one finds thatthe linearly extrapolated value of DLCO is different from the exactDLCO(� = 0).
The important point here is not the size of the discrepancybetween these two values but that they are both exact. One candeduce the extrapolation error from the analytic calculation inAppendix A
err = LRBC/23 (LM + LP)
(11)
which gives 13% of error for this particular geometry.For cases B and C, one observes the same type of discrepancy but
the difference is significantly larger as shown in Fig. 7 and Table 2.For all the geometries studied in the present work 1/DLCO versus �is only approximately linear and the extrapolation does not give theexpected 1/DLCO at � = 0. Thus, this defect of the RF extrapolation isconceptual.
The above graphs are not given as a function of PO2 but as a func-tion of the reaction time which is known to be proportional to PO2for large enough PO2 (see Kang and Sapoval, 2016). The case � = 0cannot be reached because even totally desaturated Hb moleculeswould react with a finite reaction rate. Although the chemical kinet-ics of haemoglobin are complex (Gibson et al., 1955; Forster, 1987)one can say that the reaction time decreases when the numberof reactive Hb molecules increases. In this way the reaction timeshould roughly decrease with PO2 as (1–Saturation(PO2))−1, i.e. atleast one order of magnitude from 100 mmHg. But even if very smallvalues of �CO cannot be reached experimentally, DMCO is still well
defined as the limit of DLCO for �CO = 0. Conversely, this allows oneto consider that experimental DLNO is close to the true DMNO.In addition, both CO and NO obey the same Eqs. (4)–(6) with thedifferent partition ratios and solubilities. In both hypothetical cases
ues at � = 0 need to be compared: from FEM, from extrapolation and from scaling.O using the ratio 3.35 in Eq. (12).
68 M.-Y. Kang et al. / Respiratory Physiology & Neurobiology 241 (2017) 62–71
0 50 100 150 200
Vc (ml)
0
50
100
150
200
250B
lood
con
duct
ance
(m
l/min
/mm
Hg)
Linearly proportional to VcExact solutions
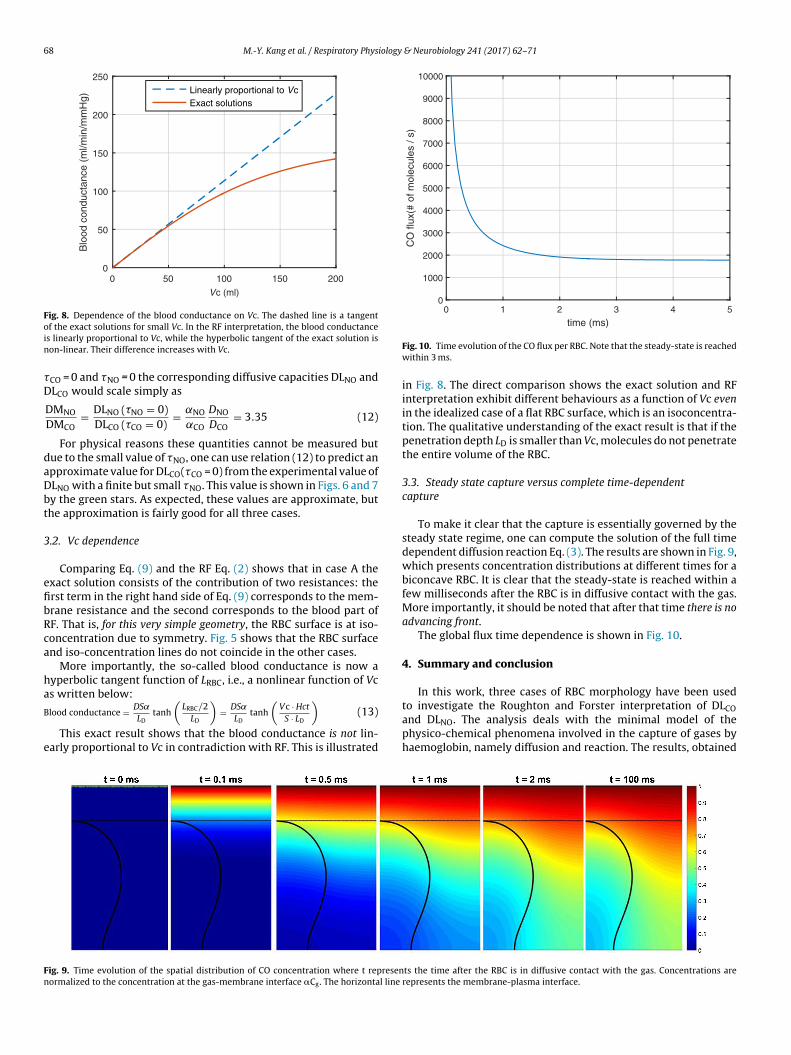
Fig. 8. Dependence of the blood conductance on Vc. The dashed line is a tangentoin
�D
daDbt
3
efibRca
ha
B
e
0 1 2 3 4 5
time (ms)
0
1000
2000
3000
4000
5000
6000
7000
8000
9000
10000
CO
flux
(# o
f mol
ecul
es /
s)
Fn
f the exact solutions for small Vc. In the RF interpretation, the blood conductances linearly proportional to Vc, while the hyperbolic tangent of the exact solution ison-linear. Their difference increases with Vc.
CO = 0 and �NO = 0 the corresponding diffusive capacities DLNO andLCO would scale simply as
DMNO
DMCO= DLNO (�NO = 0)
DLCO (�CO = 0)= ˛NO
˛CO
DNO
DCO= 3.35 (12)
For physical reasons these quantities cannot be measured butue to the small value of �NO, one can use relation (12) to predict anpproximate value for DLCO(�CO = 0) from the experimental value ofLNO with a finite but small �NO. This value is shown in Figs. 6 and 7y the green stars. As expected, these values are approximate, buthe approximation is fairly good for all three cases.
.2. Vc dependence
Comparing Eq. (9) and the RF Eq. (2) shows that in case A thexact solution consists of the contribution of two resistances: therst term in the right hand side of Eq. (9) corresponds to the mem-rane resistance and the second corresponds to the blood part ofF. That is, for this very simple geometry, the RBC surface is at iso-oncentration due to symmetry. Fig. 5 shows that the RBC surfacend iso-concentration lines do not coincide in the other cases.
More importantly, the so-called blood conductance is now ayperbolic tangent function of LRBC, i.e., a nonlinear function of Vcs written below:
lood conductance = DS˛
LDtanh
(LRBC/2
LD
)= DS˛
LDtanh
(Vc · Hct
S · LD
)(13)
This exact result shows that the blood conductance is not lin-arly proportional to Vc in contradiction with RF. This is illustrated
ig. 9. Time evolution of the spatial distribution of CO concentration where t represenormalized to the concentration at the gas-membrane interface �Cg. The horizontal line
Fig. 10. Time evolution of the CO flux per RBC. Note that the steady-state is reachedwithin 3 ms.
in Fig. 8. The direct comparison shows the exact solution and RFinterpretation exhibit different behaviours as a function of Vc evenin the idealized case of a flat RBC surface, which is an isoconcentra-tion. The qualitative understanding of the exact result is that if thepenetration depth LD is smaller than Vc, molecules do not penetratethe entire volume of the RBC.
3.3. Steady state capture versus complete time-dependentcapture
To make it clear that the capture is essentially governed by thesteady state regime, one can compute the solution of the full timedependent diffusion reaction Eq. (3). The results are shown in Fig. 9,which presents concentration distributions at different times for abiconcave RBC. It is clear that the steady-state is reached within afew milliseconds after the RBC is in diffusive contact with the gas.More importantly, it should be noted that after that time there is noadvancing front.
The global flux time dependence is shown in Fig. 10.
4. Summary and conclusion
In this work, three cases of RBC morphology have been used
to investigate the Roughton and Forster interpretation of DLCOand DLNO. The analysis deals with the minimal model of thephysico-chemical phenomena involved in the capture of gases byhaemoglobin, namely diffusion and reaction. The results, obtainedts the time after the RBC is in diffusive contact with the gas. Concentrations arerepresents the membrane-plasma interface.

iology
wp
aDcsDi
-
-
-
tacwa
scDfTtv
mihteasoru
vptammpct
spawD
M.-Y. Kang et al. / Respiratory Phys
ith different morphologies, have common properties and thenrovide insight into the conceptual basis of the transfer process.
First of all, we emphasize that the experimental quantities DLCOnd DLNO should not be confused with the “conceptual quantities”MCO,RF and DMNO,RF invented by Roughton and Forster. They areonceptual in the sense that they have never been measured asuch. Their supposed correspondence is DMCO,RF = DLCO(�CO = 0) andMNO,RF = DLNO(�NO = 0) but this condition is never realized exper-
mentally.The principal conclusions of the paper are:
1/DLCO versus �co(PO2) is only approximately linear.Consequently, the linear RF extrapolation methoddoes not give 1/DLCO(�CO = 0). Therefore, the relationDMCO,RF = DLCO(extrapolated to PO2 = 0) is erroneous.
The dependence of DLCO on the capillary volume Vc does not fitthe RF prediction, even for an idealized flat case where the RBCsurface is an isoconcentration.
The value of DLNO implies a small but finite participation of theinterior of the RBC that behaves like an internal resistance. Thus,DLNO is a good approximation of DMNO (within a few per cent)from which one could deduce DMCO. However, there is no useof DMCOif it is recognized that the RF equation is inadequate todescribe CO capture.
Not mentioned in this paper is the case of spherical vesicles con-aining Hb molecules for which exact analytical computation canlso be obtained. They exhibit the same properties that were dis-ussed here for the different morphologies. They will be comparedith experiments by Sakai et al. (2008) and Azarov et al. (2011) in
following paper.One could ask about the influence of the values of the diffu-
ivities used above on the conclusions and especially on the mainonclusion that the real DMCO is different from the extrapolatedLCO. To check this influence, the same calculations have been per-
ormed using an internal diffusivity of 1/3 of the external diffusivity.he results are summarized in the Appendix C. They show clearlyhat the fact that the extrapolated value is different from the realalue for � = 0 is independent of the diffusivity values.
These conclusions constitute a somewhat negative view of DLCOeasurements as interpreted through the RF equation. In fact,
t is possible that DLCO, as currently used in lung function tests,ave been partly misinterpreted in the past. Nevertheless, besidesheir interpretation, the accumulated clinical correlations betweenxperimental DLCO values have their own validity. In such a situ-tion where the current RF method appears to be misleading, onehould consider a different method which itself has to be checkedn the same geometries. This is the Time-Dependent approach,ecently introduced by Kang and Sapoval (2016). This new way ofnderstanding will be discussed in a forthcoming paper.
But the same results also lead to a new and different point ofiew about the clinical use of these lung function tests. The newoint of view is to consider DLCO and DLNO as two complemen-ary quantities that stand for themselves. DLCO measures a “volumebsorption” that gives an indication about the haematocrit. DLNOeasures a “surface absorption” and gives indication about theorphology of the space separating the alveolar membrane and
lasma from the RBCs. As shown in Kang and Sapoval (2016), a spe-ific interesting aspect of DLNO is that it presents a better sensitivityo membrane heterogeneity than DLCO.
Besides that, the present work sheds new light on the discus-ions about DLNO in this special issue of RESPNB and the arguments
resented in Zavorsky et al. (2017). First, suppose as generallydmitted that DLNO is close to DMNO because the reaction rate of NOith Hb is very large. Then, if this is true, one should find the realMCO through a simple scaling using the solubility and diffusiv-& Neurobiology 241 (2017) 62–71 69
ity of the respective species. The problem lies in the fact, reportedhere, namely that the scaled DLCO (� = 0) obtained here is not equalto the DMCO linearly extrapolated from large pressures. Related tothat dilemma, several studies have questioned the interpretationof DLNO itself as related to some anomaly in the capture of NO (forexample, finite against infinite �NO, anomalous diffusion in or outof the RBC membrane). But what has not been questioned so far isthe very validity of the Roughton and Forster model which leads,as shown here, to an erroneous interpretation of the extrapolatedDLCO. In the new interpretation of DLCO by Kang and Sapoval (2016)this contradiction disappears.
Conflict of interest
The authors declare no competing financial interests.
Acknowledgments
The authors wish to thank C. Hsia, J.M.B. Hughes, L. Kiger and M.Marden for interesting discussions and S. Ceste for the 3D illus-tration. This work was partially supported by Air Liquide SantéInternational.
Appendix A. Analytical solution of CO and NO capture inthe case of flat parallel structures.
The solution for the case of the flat parallel structure (shown inFig. 2) is independent of the y and z axes along the surfaces suchthat this is a 1D problem in the transverse (vertical) direction. Then,the diffusion-reaction equation in the internal region of the RBC issimply
Dd2CI
dx2− CI
�= 0
(0 < x < LRBC/2
)(A.1)
where x is the distance from the cell center. In the external zone ofthe RBC, one has
d2CE
dx2= 0
(LRBC/2 < x < LRBC/2 + LP + LM
)(A.2)
In the coordinates of Fig. 2, the boundary conditions are
CE(
LRBC/2 + Lp + LM)
= ˛Cg
CE(
LRBC/2)
= CI(
LRBC/2)
dCE(
LRBC/2)
dx=
dCI(
LRBC/2)
dx
(A.3)
The linear solution of Eq. (A.2) is in the membrane-plasma spaceis
CE (x) = AEx + BE (A.4)
and the solution of Eq. (A.1) inside the RBC is
CI (x) = AI coshx
LD+ BI sinh
x
LD
(whereLD =
√D�
)(A.5)
where the cosh and sinh are the hyperbolic cosine and sine func-tions, respectively. From the system symmetry, BI = 0. The length LDis the penetration depth characterizing qualitatively that diffusivemolecules are absorbed on this length.
From the boundary conditions in Eq. (A.3), one obtains
AI = ˛Cg1
L +L L /2 L /2(A.6)
M PLD
sinh RBCLD
+ cosh RBCLD
AE = ˛Cg1
LD coth LRBC/2LD
+ LM + LP
(A.7)
7 iology
B
C
D
�
ilbag
�
w
c
�
o
e
0 M.-Y. Kang et al. / Respiratory Phys
E = ˛CgLD coth LRBC/2
LD− LRBC/2
LD coth LRBC/2LD
+ LM + LP
(A.8)
These formulas fully determine the concentrations CE(x) andI(x).
The flux of gas molecules is given by the product of diffusivity, gas exchange surface S, and the derivative of CE(x):
E (x) = −DSdCE (x)
dx= −DSAE = −DS˛Cg
1
LD coth LRBC/2LD
+ LM + LP
(A.9)
.e., the flux is constant in this zone since there is no reaction. Theocal diffusive component of the flux inside the RBC �I(x) is giveny the following equation and illustrated in Fig. 4. Note that thebscissae of Figs. 3 and 4 in the text represent distance from theas-membrane interface having the opposite direction of x.
I (x) = −DSdCI
dx= −DS˛Cg
sinh xLD
(LM + LP) sinh LRBC/2LD
+ LD cosh LRBC/2LD
(A.10)
From Eq. (A.9), one obtains 1/DLCO
1DLCO
= Cg,CO
|�E,CO| =LD,CO coth LRBC/2
LD,CO+ LM + LP
DCOS˛CO(A.11)
For small y = (LRBC/2)/LD,CO (i.e., for large �CO), Eq. (A.11) becomes
1DLCO
≈ 1DCOS˛CO
(LM + LP + DCO�CO
LRBC/2+ LRBC/2
3
)(A.12)
here we used the series expansion of the hyperbolic cotangent:
oth (y) = 1y
+ y
3− y3
45+ ... (A.13)
The intercept of the RF extrapolation to PO2 = 0 (�CO ≈ 0) is
1
DLCO(
Ext.PO2 = 0) = 1
DCOS˛CO
(LM + LP + LRBC/2
3
)(A.14)
On the other hand, for large y, coth(y) ≈ 1, and Eq. (A.11) forCO = 0 becomes
1DLCO (�CO = 0)
≈ LM + LP
DCOS˛CO(A.15)
Relative error of the extrapolation in Eq. (A.14) to the true value
f DMCO in Eq. (A.15) isrr = LRBC/23 (LM + LP)
(A.16)
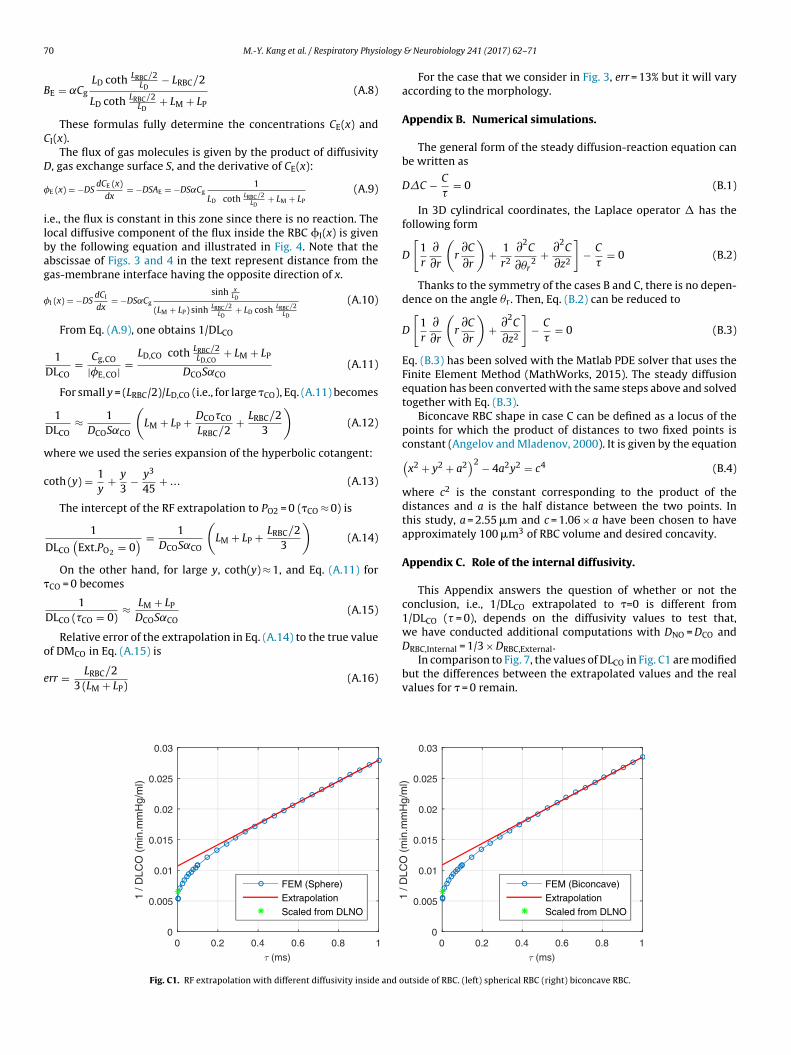
Fig. C1. RF extrapolation with different diffusivity inside and o
& Neurobiology 241 (2017) 62–71
For the case that we consider in Fig. 3, err = 13% but it will varyaccording to the morphology.
Appendix B. Numerical simulations.
The general form of the steady diffusion-reaction equation canbe written as
D�C − C
�= 0 (B.1)
In 3D cylindrical coordinates, the Laplace operator � has thefollowing form
D
[1r
∂∂r
(r∂C
∂r
)+ 1
r2
∂2C
∂�r2
+ ∂2C
∂z2
]− C
�= 0 (B.2)
Thanks to the symmetry of the cases B and C, there is no depen-dence on the angle �r. Then, Eq. (B.2) can be reduced to
D
[1r
∂∂r
(r∂C
∂r
)+ ∂2
C
∂z2
]− C
�= 0 (B.3)
Eq. (B.3) has been solved with the Matlab PDE solver that uses theFinite Element Method (MathWorks, 2015). The steady diffusionequation has been converted with the same steps above and solvedtogether with Eq. (B.3).
Biconcave RBC shape in case C can be defined as a locus of thepoints for which the product of distances to two fixed points isconstant (Angelov and Mladenov, 2000). It is given by the equation(
x2 + y2 + a2)2 − 4a2y2 = c4 (B.4)
where c2 is the constant corresponding to the product of thedistances and a is the half distance between the two points. Inthis study, a = 2.55 �m and c = 1.06 × a have been chosen to haveapproximately 100 �m3 of RBC volume and desired concavity.
Appendix C. Role of the internal diffusivity.
This Appendix answers the question of whether or not theconclusion, i.e., 1/DLCO extrapolated to �=0 is different from1/DLCO (� = 0), depends on the diffusivity values to test that,we have conducted additional computations with DNO = DCO and
DRBC,Internal = 1/3 × DRBC,External.In comparison to Fig. 7, the values of DLCO in Fig. C1 are modifiedbut the differences between the extrapolated values and the realvalues for � = 0 remain.
utside of RBC. (left) spherical RBC (right) biconcave RBC.
iology
R
A
A
B
B
B
C
C
C
C
F
D
F
F
G
G
G
M.-Y. Kang et al. / Respiratory Phys
eferences
ngelov, B., Mladenov, I.M., 2000. On the geometry of the red blood cell, geometry,integrability and quantization. In: Mladenov, I.M., Naber, G.L. (Eds.), Geometry,Integrability and Quantization. Coral Press, Sofia, pp. 27–46.
zarov, I., Liu, C., Reynolds, H., Tsekouras, Z., Lee, J.S., Gladwin, M.T., Kim-Shapiro,D.B., 2011. Mechanisms of slower nitric oxide uptake by red blood cells andother hemoglobin-containing vesicles. J. Biol. Chem. 286, 33567–33579.
orland, C.D.R., Higenbottam, T.W., 1989. A simultaneous single breathmeasurement of pulmonary diffusing capacity with nitric oxide and carbonmonoxide. Eur. Respir. J. 2, 56–63.
orland, C.D.R., Dunningham, H., Bottrill, F., Vuylsteke, A., Yilmaz, C., Dane, D.M.,Hsia, C.C., 2010. Significant blood resistance to nitric oxide transfer in the lung.J. Appl. Physiol. 108, 1052–1060.
orland, C.D.R., Bottrill, F., Jones, A., Sparkes, C., Vuylsteke, A., 2014. The significantblood resistance to lung nitric oxide transfer lies within the red cell. J. Appl.Physiol. 116, 32–41.
hakraborty, S., Balakotaiah, V., Bidani, A., 2004. Diffusing capacity reexamined:relative roles of diffusion and chemical reaction in red cell uptake of O2, CO,CO2, and NO. J. Appl. Physiol. 97, 2284–2302.
hecchia, P., Bronicki, R., Goldstein, B., 2012. Review of inhaled nitric oxide in thepediatric cardiac surgery setting. Pediatr. Cardiol. 33, 493–505.
offman, K.E., Taylor, B.J., Carlson, A.R., Wentz, R.J., Johnson, B.D., 2016. Optimizingthe calculation of DM, CO and VC via the single breath single oxygen tensionDLCO/NO method. Respir. Physiol. Neurobiol. 221, 19–29.
otes, J.E., Chinn, D.J., Miller, M.R., 2006. Lung Function: Physiology, Measurementand Application in Medicine, sixth ed. Blackwell Publishing Ltd., pp. 224–229.
oucquier, A., Filoche, M., Moreira, A.A., Andrade Jr., J.S., Arbia, G., Sapoval, B., 2013.A first principles calculation of the oxygen uptake in the human pulmonaryacinus at maximal exercise. Respir. Physiol. Neurobiol. 185, 625–638.
iffusion of gases across the alveolar membrane Forster, R.E. (Ed.), 1987.Handbook of Physiology. The Respiratory System. Gas Exchange, vol. IV. Am.Physiol. Soc., Bethesda, MD, pp. 71–88, sect. 3, chap. 5.
rostell, C., Fratacci, M.J., Wain, J., Jones, R., Zapol, W., 1991. Inhaled nitric oxide. Aselective pulmonary vasodilator reversing hypoxic pulmonaryvasoconstriction. Circulation 83, 2038–2047.
urchgott, R.F., Zawadzki, J.V., 1980. The obligatory role of endothelial cells in therelaxation of arterial smooth muscle by acetylcholine. Nature 288, 373–376.
ibson, Q.H., Kreuzer, F., Meda, E., Roughton, F.J.W., 1955. The kinetics of humanhaemoglobin in solution and in the red cell at 37◦C. J. Physiol. 129, 65–89.
riffiths, M., Evans, T., 2005. Inhaled nitric oxide therapy in adults. N. Engl. J. Med.353, 2683–2695.
uénard, H., Varène, N., Vaida, P., 1987. Determination of the lung capillary bloodvolume and membrane diffusing capacity in man by the measurements of NOand CO transfer. Respir. Physiol. 70, 113–120.
& Neurobiology 241 (2017) 62–71 71
Hughes, J.M.B., Bates, D.V., 2003. Historical review: the carbon monoxide diffusingcapacity (DLCO) and its membrane (Dm) and red cell (�•Vc) components.Respir. Physiol. Neurobiol. 138, 115–142.
Hughes, J.M.B., Pride, N.B., 1999. Lung Function Tests: Physiological Principles andClinical Applications. Bailliere Tindall.
Ignarro, L.J., Byrns, R.E., Buga, G.M., Wood, K.S., 1987. Endothelium-derived relaxingfactor from pulmonary artery and vein possesses pharmacologic and chemicalproperties identical to those of nitric oxide radical. Circ. Res. 61, 866–879.
Kang, M.-Y., Sapoval, B., 2016. Time-based understanding of DLCO and DLNO.Respir. Physiol. Neurobiol. 225, 48–59.
Kang, M.-Y., Katz, I., Sapoval, B., 2015. A new approach to the dynamics of oxygencapture by the human lung. Respir. Physiol. Neurobiol. 205, 109–119.
Krogh, M., 1915. The diffusion of gases through the lung of man. J. Physiol. 49,271–296.
MacIntyre, N., Crapo, R.O., Viegi, G., Johnson, D.C., van der Grinten, C.P.M., Brusasco,V., Burgos, F., Casaburi, R., Coates, A., Enright, P., Gustafsson, P., Hankinson, J.,Jensen, R., McKay, R., Miller, M.R., Navajas, D., Pedersen, O.F., Pellegrino, R.,Wanger, J., 2005. Standardisation of the single-breath determination of carbonmonoxide uptake in the lung. Eur. Respir. J. 26, 720–735.
Motterlini, R., Otterbein, L.E., 2010. The therapeutic potential of carbon monoxide.Nat. Rev. Drug Discov. 9, 728–743.
Palmer, R.M., Ferrige, A.G., Moncada, S., 1987. Nitric oxide release accounts for thebiological activity of endothelium-derived relaxing factor. Nature 327,524–526.
Palombo, M., Gabrielli, A., Servedio, V.D.P., Ruocco, G., Capuani, S., 2013. Structuraldisorder and anomalous diffusion in random packing of spheres. Sci. Rep. 3,2631.
Roughton, F.J.W., Forster, R.E., 1957. Relative importance of diffusion and chemicalreaction rates in determining rate of exchange of gases in the human lung,with special reference to true diffusing capacity of pulmonary membrane andvolume of blood in the lung capillaries. J. Appl. Physiol. 11, 290–302.
Ryter, S.W., Choi, A.M., 2013. Carbon monoxide: present and future indications fora medical gas. Korean J. Intern. Med. 28 (2), 123–140.
Sakai, H., Sato, A., Masuda, K., Takeoka, S., Tsuchida, E., 2008. Encapsulation ofconcentrated hemoglobin solution in phospholipid vesicles retards thereaction with NO, but not CO, by intracellular diffusion barrier. J. Biol. Chem.283, 1508–1517.
Vaughn, M.W., Huang, K.T., Kuo, L., Liao, J.C., 2000. Erythrocytes possess anintrinsic barrier to nitric oxide consumption. J. Biol. Chem. 275, 2342–2348.
Wise, D.L., Houghton, G., 1968. Diffusion coefficient of neon, krypton, xenon,carbon monoxide and nitric oxide in water at 10–60 ◦C. Chem. Eng. Sci. 23,
1211–1216.Zavorsky, G.S., Hsia, C.C., Hughes, J.M., Borland, C.D., Guenard, H., van der Lee, I.,Steenbruggen, I., Naeije, R., Cao, J., Dinh-Xuan, A.T., 2017. Standardisation andapplication of the single-breath determination of nitric oxide uptake in thelung. Eur. Respir. J. 49, 1600962.