resources, conservation and recycling - simple search956411/... · · 2016-08-30industrial...
TRANSCRIPT
Ip
RIS
a
ARRA
KCEMSSEE
1
kwmtpga2trF
tIT
h0
Resources, Conservation and Recycling 113 (2016) 65–76
Contents lists available at ScienceDirect
Resources, Conservation and Recycling
jo ur nal home p age: www.elsev ier .com/ locate / resconrec
dentifying ways of closing the metal flow loop in the global mobilehone product system: A system dynamics modeling approach
ajib Sinha ∗, Rafael Laurenti, Jagdeep Singh, Maria E. Malmström, Björn Frostellndustrial Ecology, Department of Sustainable Development, Environmental Science and Engineering (SEED), KTH Royal Institute of Technology, Stockholm,weden
r t i c l e i n f o
rticle history:eceived 25 January 2016eceived in revised form 19 May 2016ccepted 22 May 2016
eywords:losed loopco-cycleobile phones
ystem dynamicsubstance flow analysis-waste
a b s t r a c t
In the past few decades, e-waste has emerged as one of the fastest growing and increasingly complexwaste flows world-wide. Within e-waste, the life cycle of the mobile phone product system is particularlyimportant because of: (1) the increasing quantities of mobile phones in this waste flow; and (2) thesustainability challenges associated with the emerging economies of reuse, refurbishment, and export ofused mobile phones. This study examined the possibilities of closing the material flow loop in the globalmobile phone product system (GMPPS) while addressing the broad sustainability challenges linked torecovery of materials. This was done using an adapted system dynamics modeling approach to investigatethe dominant paths and drivers for closing the metal flow loop through the concept of eco-cycle. Twoindicators were chosen to define the closed loop system: loop leakage and loop efficiency. Sensitivityanalysis of selected parameters was used to identify potential drivers for closing the metal flow loop. Themodeling work indicated leverage for management strategies aimed at closing the loop in: (i) collection
nd-of-life systems for used phones, (ii) mobile phone use time, and (ii) informal recycling in developing countries.By analyzing the dominant parameters, an eco-cycle scenario that could promote a closed loop system bydecreasing pressures on virgin materials was formulated. Improved policy support and product servicesystems could synchronize growth between upstream producers and end-of-life organizations and helpachieve circular production and consumption in the GMPPS.
. Introduction
Waste electrical and electronic equipment (WEEE, also wellnown as e-waste) is one of the fastest growing waste flows world-ide (Kuehr, 2012). On a global scale, e-waste increased from 20illion tons in 1998 to 41 million tons in 2010 and was estimated
o reach 50 million tons by 2014/2015 (Kuehr, 2012). The Euro-ean Commission has estimated that the average European citizenenerates 17–20 kg e-waste per year, and that mobile phones are
potential candidate for generating e-waste (Basel-Convention,008). Indeed, mobile phone subscribers have increased exponen-
ially during the past 20 years (Basel-Convention, 2008; ITU, 2013),esulting in more e-waste at the end-of-life (EoL) (Panambunan-erse and Breiter, 2013). In industrialized countries (IC), less than∗ Corresponding author at: Division of Industrial Ecology, Department of Sus-ainable Development, Environmental Science and Engineering (SEED), KTH Royalnstitute of Technology, Teknikringen 34, 10044 Stockholm, Sweden.el.: +46 8 790 67 44.
E-mail address: [email protected] (R. Sinha).URL: http://www.kth.se (R. Sinha).
ttp://dx.doi.org/10.1016/j.resconrec.2016.05.010921-3449/© 2016 Elsevier B.V. All rights reserved.
© 2016 Elsevier B.V. All rights reserved.
20% of used phones are properly managed at EoL (Panambunan-Ferse and Breiter, 2013; Umair et al., 2013).
With rapid technological improvements and innovations, usersfrequently replace their phones, decreasing the life span (Basel-Convention, 2008; Kuehr, 2012; Tischner, 2012; Herat andAgamuthu, 2012). Because of the potentially remaining active lifein used phones and the possibility to upgrade mobile phones ata lower price, interest in using second-hand (or/and refurbished)phones has emerged in both IC and developing countries (DC).In addition, due to increasing interest in e-wastes for reuse andinformal recycling in DC, IC export e-wastes to DC (Umair et al.,2013). In DC, these wastes mostly end up in landfills after infor-mal recycling consisting of manual dismantling with bare handsand open burning (Panambunan-Ferse and Breiter, 2013; Umairet al., 2013). Due to a very low overall recovery rate in this informalrecycling (Bollinger et al., 2012; Herat and Agamuthu, 2012; Umairet al., 2013), the global mobile phone product system (GMPPS) losesa substantial amount of valuable resources that could be recovered
(Basel-Convention, 2008; Geyer and Blass, 2010; Tischner, 2012;Wang et al., 2013).In a life cycle perspective, the EoL management of mobilephones is a global, rather than a local or regional, problem and

6 vation
irseebrnhaTfdias
bbsutoac2fcspaaiS
auseasa2rlSuapqcttodecopt
ambtp
6 R. Sinha et al. / Resources, Conser
nvolves a multitude of actors such as consumers, manufacturers,etailers, collectors, refurbishers, recyclers. In addition, emergingocio-technical/economic activities among these actors (e.g., reuse,xport of e-waste, informal recycling) make the EoL complex. Forxample, export of used phones to DC increases their life span,ut valuable metals (used in phones) are lost through informalecycling in DC, whereas IC have better and more efficient tech-ologies for recycling. Apart from reuse or export, consumers eitheribernate phones by storing them unused in drawers, or throwway/dump their phones, due to lack of proper collection systems.his study investigated the factors and activities that are the driversor closing the material flow loop in the GMPPS. To investigate therivers in such a complex global system and to produce insights
nto closing the material flow loops efficiently, a broader systemspproach with dynamic analysis is warranted to understand theystem (Sterman, 2000).
System dynamics (SD) approach, which is grounded on feed-ack control theory and non-linear dynamics (Sterman, 2000), cane used to explain the behavior of complex systems to better under-tand GMPPS. Studying various interconnections in the GMPPSsing this approach could help explore the complexity of alterna-ive EoL systems and assist in decision making and in developmentf effective interventions in complex systems. Apart from the SDpproach, agent-based modeling (ABM) can be used to exploreomplexity (Sterman, 2000; Bollinger et al., 2012; Achachlouei,015). Bollinger et al. (2012) compared SD and ABM approachesor modeling metal flows in a mobile phone product system andoncluded that the SD approach is beneficial for aggregated analy-is, whereas ABM has advantages for individual action analysis. Theresent study deals with the global system and aggregated flowsnd parameters, and therefore SD modeling was selected as thenalytical approach to create a deeper understanding of the GMPPSn a life cycle perspective and to explore an eco-cycle scenario (seeection 2).
In similar research, Spengler and Schröter (2003), Georgiadisnd Besiou (2008, 2010) studied electrical and electronic productssing SD to investigate closed-loop material flows. However, theirtudies mainly focused on supply chain management and the influ-nce of consumer behavior, while effects of other factors, e.g., using
product for a longer time, on a closed-loop system received littlecrutiny. Asif et al. (2015) used SD models to analyze the potentialpplication of product multiple life cycles (Asif, 2011; Asif et al.,012) in a closed-loop supply chain based on the dynamics of mate-ial scarcity. The present study extended the investigation on causaloop diagram (CLD) studies, often used during the initial stages ofD modeling (Sterman, 2000). Nguyen et al. (2015) used CLD tonderstand smartphone usage in Singapore by exploring the lever-ge points and resistance to change. Our research group also hasreviously used CLD to analyze unintended environmental conse-uences when designing electronic products, using an example oflosing the material flow loop in the mobile phone product sys-em (Laurenti et al., 2015a,b,c). The present study also extendedhe analysis in other types of dynamic modeling studies performedn e-wastes and on mobile phones. Most of the studies conductedynamic analysis on small-scale systems (Williams et al., 2013), forxample e-waste management in a city or a country level, withoutonsidering a life cycle perspective (Andarani and Goto, 2013). Tour knowledge, a broader systems approach, i.e., with a life cycleerspective and dynamic analysis, has previously only been appliedo the mobile phone product system by Bollinger et al. (2012).
In a broader systems approach, Bollinger et al. (2012) performed dynamic substance flow analysis of global flows of metals in
obile phones in a cradle-to-cradle perspective. The study wasased on the research question “. . .[w]hat [modeling] conditions fos-er the development of a closed-loop flow network for metals in mobilehones?”. The focus was on comparing SD and ABM approaches,
and Recycling 113 (2016) 65–76
while testing and implementing the modeling outcomes in the realworld were beyond the scope of the study. However, the modelhas potential applications in a real-world situation. Adopting theSD model of Bollinger et al. (2012), the aim of the present studywas to investigate possibilities to close the metal flow loop in theGMPPS. Specific objectives of the study were to:
• Identify potential drivers for closing the metal flow loops effi-ciently by better understanding the dynamics of the GMPPS.
• Propose a future eco-cycle scenario based on the potential driversand the eco-cycle concept, and provide suggestions for imple-menting this eco-cycle scenario in the real-world situation of theGMPPS.
The intention was not to predict the future, but to under-stand, explore, and learn about the complexity and dynamics ofthe GMPPS.
2. Methods
2.1. The eco-cycle concept
The eco-cycle concept (Ravetz, 2000; Eco-Cycle, 2014) rep-resents the industrial metabolism (Fischer-Kowalski and Haberl,1998) in a socio-technical system (Geels, 2012) where substancesor resources continuously circulate within the socio-economic sys-tem with low or no leakage of the resources. The term eco-cycle isused in this study to represent nearly closed-loop material flows orvery low leakage in the mobile phone product system. The concep-tual eco-cycle model focuses on the technical nutrients, e.g., metals,that are circulated in the socio-technical system with little or nore-entry into the lithosphere (Graedel and Allenby, 2003; Preston,2012).
The necessary links between actors to close the material flowloop in the GMPPS are illustrated in Fig. 1. Physically, the productsystem entails the extraction of necessary raw materials, pro-duction and assembly of parts by manufacturers and suppliers, amaintenance and distribution network, utilization by consumers,material collection and recycling, waste treatment, and transports.In a societal context, the system includes the behavior of marketsand user practices, costs, price and demand elasticity, purposes,function and objectives, consumer preferences, awareness, eco-nomic development, and aspects of a social and a softer character.
The eco-cycle concept in mobile phone product systems thusincludes both physical resource management and social aspects. Inthis study, the eco-cycle concept illustrated in Fig. 1 only providedthe mental model to visualize the eco-cycle scenario qualitatively.The quantitative eco-cycle was formulated by experimenting withthe SD model. The default SD model was parameterized based on abusiness as usual (BAU) scenario.
2.1.1. Eco-cycle indicatorsBased on circularity indicators produced by the Ellen MacArthur
Foundation (2015) and Bollinger (2010), two indicators wereemployed for examining the GMPPS. These were loop leakage andloop efficiency, which quantify the degree to which metals are effi-ciently preserved in the system. The loop leakage indicator, basedon the linear flow index by Ellen MacArthur Foundation (2015),determines the resource fraction leaving the product system, i.e., itindicates to what extent the loop is closed and metals are preservedin the system. The loop efficiency indicator, based on the cradle-to-
cradle indicator (C2CI) developed by Bollinger (2010), determineshow efficiently the resources are utilized in the system. In this case,efficiency indicates the efficient uses of resources without hiber-nating resources. Eq. (1) illustrates quantification of loop leakage
R. Sinha et al. / Resources, Conservation and Recycling 113 (2016) 65–76 67
F . The to
(fiB
wica
bma
2
BiFGiuwtos
ddpab
ig. 1. Flows of materials through a (partially) closed mobile phone product systemr number of phones, in industrial symbioses within the product system.
lm) and loop efficiency (em) in the SD model, adapted and modi-ed from the equation for the cradle-to-cradle indicator (C2CI) ofollinger (2010).
lm(t) =∑t
t=0md +∑t
t=0mdr∑t
t=0mm
em(t) = 1 −∑t
t=0md +∑t
t=0mdr + mh(t)∑t
t=0mm
(1)
here lm(t) determines the loop leakage for metal m at time t; em(t)s the value of loop efficiency for metal m at time t;
∑tt=0md is the
umulative mass of metal m disposed of through phones disposalt time t;
∑tt=0mdr is the cumulative mass of metal m disposed of
y phone recyclers at time t;∑t
t=0mm is the cumulative mass ofetal m used in phones by manufacturers at time t and mh(t) is the
mount of metal m in hibernating phones at time t.
.2. System dynamics model
The SD model was adopted from the equation-based model ofollinger et al. (2012) to conduct metal flow analysis of the GMPPS
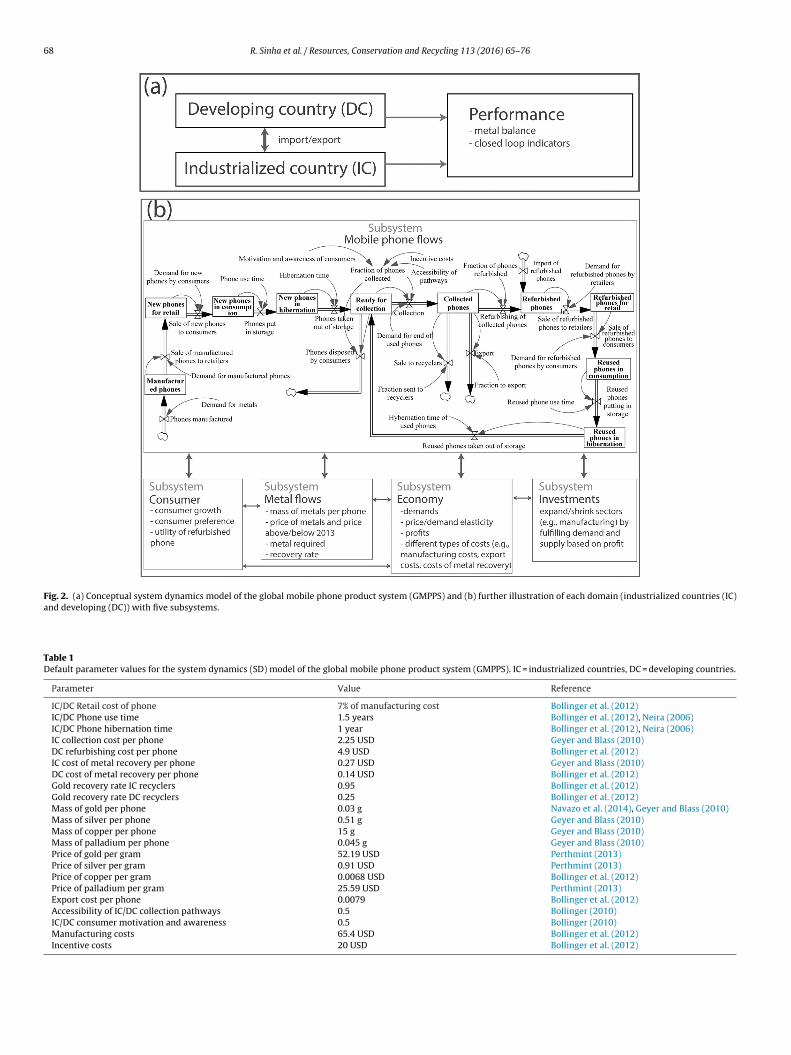
n a life cycle perspective in order to explore an eco-cycle scenario.ig. 2a describes the conceptual system dynamics model of theMPPS. The arrows in the figure between subsystems represent
nformation flows. The mobile phone flows subsystem is portrayedsing system dynamics diagramming notations (Sterman, 2000),here a rectangular box represents stocks, a pipe arrow pointing
o a stock represents inflows, a pipe arrow out of a stock representsutflows, valves on the pipes control the flows, clouds representources/sinks and each linked arrow represents a causal relation.
The overarching model of the system is divided into two mainomains with similar stocks and flows, IC and DC. These two
omains are connected through the export and import of usedhones (Fig. 2a). The export and import of used phones between ICnd DC depend on economic profits for further business, e.g., refur-ishing, retail, recycling (see Appendix). The performance domainhickness of the flow arrows illustrates the amount of materials, e.g., mass of metals
in the model (Fig. 2a) then collects all information related to stocksand flows in IC and DC to estimate the global metal balance andeco-cycle indicators (Eq. (1)).
Since the IC and DC domains have similar stocks and flows,a common detailed illustration of the stocks, flows, and subsys-tems of each domain is presented in Fig. 2b. In the diagram,the mobile phone flows subsystem is shown with detailed stocks,flows, and causally linked parameters, whereas other subsystems(consumer, metal flows, economy, and investments) are representedas conceptual information flows to the mobile phone flows sub-system. The consumer subsystem processes the information onconsumer growth and consumer choice between purchasing an oldand new phone. The metal flows subsystem provides informationabout metal requirements for phone manufacturing and recoveryof metals. The economy subsystem processes the information on alltypes of costs, price-demand elasticity, and expected profits. Theinvestments subsystems provide the information for investing orshrinking the business to specific sectors, e.g., manufacturing. Thesesubsystems are documented in the Appendix with detailed stocks,flows, state variables and equations.
The processes in Fig. 2 were parameterized with real-world datainput (see Table 1). The resulting default SD model represents aBAU scenario or base case. Based on an optimization outcome andsensitivity analysis (see Figs. 5 and 6), the eco-cycle scenario wasthen evaluated by varying the values of different input parameters.
2.3. Model modification, quantification, and implementation
Here, we implemented the system dynamic model shownin Fig. 2 in the educational version of AnyLogic 6.8.1 software(AnyLogic, 2014). We quantified the SD model based on the workof Bollinger et al. (2012) and Bollinger (2010). Detailed parameter-
ization and description of the equations in the model are providedin the Appendix.The investment sectors in the adopted model implemented inAnyLogic did not show results in agreement with the real-world
68 R. Sinha et al. / Resources, Conservation and Recycling 113 (2016) 65–76
Fig. 2. (a) Conceptual system dynamics model of the global mobile phone product system (GMPPS) and (b) further illustration of each domain (industrialized countries (IC)and developing (DC)) with five subsystems.
Table 1Default parameter values for the system dynamics (SD) model of the global mobile phone product system (GMPPS). IC = industrialized countries, DC = developing countries.
Parameter Value Reference
IC/DC Retail cost of phone 7% of manufacturing cost Bollinger et al. (2012)IC/DC Phone use time 1.5 years Bollinger et al. (2012), Neira (2006)IC/DC Phone hibernation time 1 year Bollinger et al. (2012), Neira (2006)IC collection cost per phone 2.25 USD Geyer and Blass (2010)DC refurbishing cost per phone 4.9 USD Bollinger et al. (2012)IC cost of metal recovery per phone 0.27 USD Geyer and Blass (2010)DC cost of metal recovery per phone 0.14 USD Bollinger et al. (2012)Gold recovery rate IC recyclers 0.95 Bollinger et al. (2012)Gold recovery rate DC recyclers 0.25 Bollinger et al. (2012)Mass of gold per phone 0.03 g Navazo et al. (2014), Geyer and Blass (2010)Mass of silver per phone 0.51 g Geyer and Blass (2010)Mass of copper per phone 15 g Geyer and Blass (2010)Mass of palladium per phone 0.045 g Geyer and Blass (2010)Price of gold per gram 52.19 USD Perthmint (2013)Price of silver per gram 0.91 USD Perthmint (2013)Price of copper per gram 0.0068 USD Bollinger et al. (2012)Price of palladium per gram 25.59 USD Perthmint (2013)Export cost per phone 0.0079 Bollinger et al. (2012)Accessibility of IC/DC collection pathways 0.5 Bollinger (2010)IC/DC consumer motivation and awareness 0.5 Bollinger (2010)Manufacturing costs 65.4 USD Bollinger et al. (2012)Incentive costs 20 USD Bollinger et al. (2012)

ation and Recycling 113 (2016) 65–76 69
tiiioemetdcbigA
csecnbmgtpmefih
2
aeaccr2n1fliflpoa
2
Ic
cv(li21e
Table 2Initial stock value for the system dynamics (SD) model of the global mobile phoneproduct system (GMPPS).
Stocks Values Reference
IC consumer 6,000,000 ITU (2013), UN (2013)IC new phone consumer 42,000,000 Assumed (70% of total)IC refurbished phone consumer 18,000,000 Assumed (30% of total)DC consumer 8,000,000 ITU (2013), UN (2013)DC new phone consumer 5,600,000 Assumed (70% of total)
R. Sinha et al. / Resources, Conserv
rend. Therefore, we modified the investment sectors only. Accord-ng to Bollinger (2010), investors will invest if the expected profits positive. However, it is not clear in their demonstration hownvestors would grow or fulfill the upstream demand, e.g., retailerr consumer demand for phones, and downstream demand,.g., collector, refurbisher or recycler demand for phones. In ourodeling approach, investors will invest based on the predicted
xpected profit due to the investment. If the business is profitable,he investors grow their business; otherwise, they shrink it, i.e.,egrow. We also set a controlled growth rate for investors. Theontrolled growth determines the instantaneous growth rateased on the demand and maximum handling capacity of the
nvestors. For instance, when the demand is high, the controlledrowth encourages the investors to grow at a higher rate. See theppendix for information on the controlled growth.
In our model, we assumed that upstream investors grow withonsumer demand (i.e., investment in manufacturing and retail,ee Fig. 2b) without any control. In other words, the manufactur-rs and new phone retailers will always fulfill the demand, withoutonsidering the instantaneous growth rate. However, the EoL orga-izations invest in their business with controlled growth definedy a multiplying factor which is the ratio of demand and to theaximum capacity of the organization. EoL organizations invest to
row or degrow their capacity based on the demand, current stock,he maximum handling capacity of the organization, and expectedrofit from the investment. Since the policy and regulations foranaging e-waste are stricter in IC than in DC (Kuehr, 2012; Navazo
t al., 2014), we assumed in our model that IC collection always ful-lls at least 20% of collection demand. In other words, the collectorsave to collect 20% of the demand for both profit and loss.
.4. Assumptions and limitations
Based on statistics for the most recycled metals in EoL phonesnd e-wastes (Basel-Convention, 2008; Tischner, 2012; Navazot al., 2014), we assumed that gold (Au), copper (Cu), silver (Ag),nd palladium (Pd) were the metals of highest interest in the GMPPSontext. These metals were assumed to be of pure quality and withonstant price over time. In our model, gold is the main driver forecycling, because of its high economic value (Basel-Convention,008; Tischner, 2012). According to Navazo et al. (2014), the eco-omic value of materials in EoL phones comes to 80% from Au,0% from Pd and 7% from Ag. Thus, our modeling of the EoL metalows in the mobile phone product system was based on the behav-
or of the gold flow and gold recycling rate. The recycle rate andow behavior of copper, silver and palladium in the mobile phoneroduct system might not be similar to gold. The compositionf materials in the phones and the production technology weressumed not to change over time in the model.
.5. Model inputs
Table 1 shows the default parameter values used in the model.n the following text, default parameter settings refer to the basease which also represents the BAU scenario.
In the model, the rate of phone subscriptions as a function ofonsumer growth (cf. Fig. 2) is taken from Fig. 3b. Initial stockalues for the model are presented in Table 2. According to ITU2013), mobile phone subscriptions in 1994 amounted to 60 mil-ion in IC and 8 million in DC. Global mobile phone subscriptions
n 1994 were approximately 1% of global phone subscriptions in012 (ITU, 2013). Thus, the initial point in the model was set to994. The initial stock values shown in Table 2 were used for allxperiments in this study. The study period for all experiments wasDC refurbished phone consumer 2,400,000 Assumed (30% of total)
All other stocks are set to 0.
1994–2050. Numerical methods and tolerances used in the modelare documented in the Appendix.
2.6. Experiments
2.6.1. Drivers and eco-cycle scenarioWe conducted a sensitivity analysis to identify the most sensi-
tive parameters and assess the uncertainty and robustness of themodel. The sensitivity of parameters to a certain output can indi-cate a dominant path and associated drivers (Sterman, 2000). In ourstudy, a sensitivity analysis was conducted to identify the potentialdrivers for which the loop leakage of the system was at a minimumand the loop efficiency was at a maximum. This sensitivity anal-ysis was performed by increasing (or decreasing) one parametervalue from the base case (Table 1) by up to 100% while keepingother parameters at their default values. The values of loop leak-age and loop efficiency were estimated as averages for the period1994–2050. The sensitivity analysis was conducted considering allthe input parameters shown in Table 1. However, some param-eters were omitted from the analysis based on their behavior tothe loop indicators. In many processes in the model, a number ofparameters showed closely resembling contribution to the processand the loop indicators. In those cases, we only took one param-eter as a proxy for the others. For example, consumer motivationand awareness, accessibility of collection pathways, and incentivecosts contribute positively to the fraction of phones collected, butwe only considered accessibility of collection pathways in the anal-ysis. The potential drivers were ranked based on their contributionto minimizing loop leakage and maximizing loop efficiency. Thedrivers were then analyzed with the system dynamics model tounderstand the system for the eco-cycle indicators.
Next, we devised an eco-cycle scenario focusing on maximizingloop efficiency and minimizing loop leakage using the OptQuestoptimizer (AnyLogic, 2014; OptTek Systems, 2015) and manualtuning. First, we used the OptQuest optimizer to optimize bothhigh- and low-sensitivity parameters (Figs. 5 and 6). We initially setpossible maximum and minimum values for all sensitive param-eters to optimize the system by maximizing loop efficiency andminimizing loop leakage. Then we narrowed down the maximumand minimum values for the parameters toward the optimized val-ues. Finally, we carried out manual tuning to achieve the optimizedvalues for the eco-cycle scenario, focusing on maximizing loop effi-ciency and minimizing loop leakage.
2.6.2. Model testingFirst, we tested the model with causal loop and structure
assessment tests (Sterman, 2000; Rahmandad and Sterman, 2012).The structure assessment tests included both direct structure andstructure-oriented behavior tests. The direct structure test includedrelations and assumptions and relevant variables, and examined
the static structure of the model. The structure-oriented behav-ior test examined the behavior of the model with some selectedparameters and their extreme values and also in a sensitivity anal-ysis (Figs. 5 and 6) with constant-step parameter change to check
70 R. Sinha et al. / Resources, Conservation and Recycling 113 (2016) 65–76
) mobD
tttbFhaa
dsltsrpilasm3
Fs2
Fig. 3. Change in number of (a) mobile phone subscribers and (bata source: ITU (2013).
he behavior. Extreme conditions were tested to inspect the equa-ions for extreme values and the plausible response when subjectedo extreme values of the parameters. This test examined the modelehavior no matter how extreme the policy would be to impose.or example, we checked 100% collection of phones, no phoneibernation time, no recycling costs, and so on. The model showedgreement with the results in the causal loop tests and structuressessment tests.
We then tested the model with model-independent real worldata, i.e., field data, on consumer growth and EoL scenario. Fig. 4hows the modeled number of mobile phone subscriptions (solidines) for IC, DC, and globally as a function of time from 1994o 2012. In the simulations, the initial (1994) number of sub-criptions was set to 6,000,000 and 8,000,000 for IC and DC,espectively (ITU, 2013) and the input to the model was the globalopulation (taken from UN (2013)). Markers in Fig. 4 show model-
ndependent observations of number of subscriptions from theiterature shown in Fig. 3a. The result showed that the model was
ble to replicate the observed historical behavior of mobile phoneubscriptions. The average deviation during 2000–2012 betweenodeled and observed number of global subscriptions was around% and the average deviation during 2006–2012 was less than 1%
ig. 4. Global industrialized country (IC) and developing country (DC) phone sub-criptions over time, 1994–2012. Symbols show estimates from the literature (ITU,013), while solid lines show model output from this study.
ile phone subscribers per 100 inhabitants over time, 2000–2012.
(see Appendix). We considered this level of agreement satisfactoryfor the purposes of this study.
Table 3 shows the EoL scenarios for the IC using model results(BAU case) and data for real world situations (i.e., field data). Thesefield data were collected from different publications and repre-sented the range between minimum and maximum values foundin the literature (see Table 3). The quality of these field data wassometimes not transparent as regards e.g., estimation methods.Furthermore, due to unavailability of data for some countries, thedata represent the statistical average of only a few IC.
The model results for hibernation, disposal, export, and reusefell within the range of field data but the values obtained for col-lection and recycling were higher than the field values. There wassignificant uncertainty in the field values for IC as regards recycling(2–16%) and disposal (53–90%). Since the disposal value given bythe model was close to the lower boundary of the field data range(53% in Table 3), this resulted in higher model values for collectionand recycling. Considering the quality and unavailability of the datadiscussed above, we considered model performance satisfactory forthe purposes of the study.
3. Results and discussion
3.1. Potential drivers
Potential drivers were identified by the sensitivity of the param-eters to loop leakage and loop efficiency. Loop leakage representsto the extent to which metals leave the global mobile phone prod-uct system, while loop efficiency determines how efficiently theresources are utilized in the system (Eq. (1)). Figs. 5 and 6 show theresponse in global loop leakage (Figs. 5a and 6a) and loop efficiency(Figs. 5b and 6b) to individual changes in selected parameters of themodel. The base case represents the business as usual (BAU) param-eter setting in the model, using best estimates of parameter values.With changes in the selected parameter values, the DC parametersshowed larger contribution to the loop leakage and the loop effi-ciency than the IC parameters (Figs. 5 and 6). Based on the largercontribution to minimize the loop leakage, we devised the follow-ing parameter ranking upon a 100% increase in the parameter val-ues: (i) accessibility of collection pathways (i.e., collection system)for both IC and DC; (ii) mobile phone use time (i.e. life span) for both
IC and DC; (iii) gold recovery in DC; and (iv) mobile phone hiberna-tion for both IC and DC. The analysis also suggested the same param-eter ranking for loop efficiency (Figs. 5b and 6b), which was basedon the contribution to maximize the loop efficiency by changing
R. Sinha et al. / Resources, Conservation and Recycling 113 (2016) 65–76 71
Table 3Industrialized countries (IC) end of life (EoL) scenarios for model testing.
End-of-life processa Model average(2005–2013)b
Fieldc (2005–2013) Field reference
Hibernation 63% 41–65% Cairns (2005), Meskers and Hagelüken (2009), Navazo et al. (2014)Disposald 55% 53–90% Silveira and Chang (2010), Wilhelm et al. (2011), Herat and
Agamuthu (2012), Peng and Su (2014)Collecting 45% 23–30% Navazo et al. (2014)Recyclingd 18% 2–16% Silveira and Chang (2010), Wilhelm et al. (2011), Herat and
Agamuthu (2012)Export 27% 21–34% Takeback-Coalition (2013)Reuse 6%e 0–10% Wilhelm et al. (2011)
a Schematic flow diagram of IC end-of-life scenarios.b Range of years determined based on the range of published values in the literature. Hibernation percentage estimated based on total phones in consumption. Other EoL
process percentages estimated based on used phones ready for collection.c Estimates made in different years 2005–2013 and by different methods in different studies. The range of field values represents minimum and maximum published
values for a specific process, e.g., collection.d Exported used phone disposal or recycling (dashed arrow in the schematic flow diagram) is not included in the table for estimation of disposal and recycling.
se wir
aable
iblttlorCsmmFtsc
elttasttc
sTpriFe
o
e Reuse = Reuse in IC + IC exported phone reuse in DC. Reuse includes not only reuemanufacturing.
ll selected parameters 100% from the base case. An increase in thebove ranked parameters from the base case, which was based on aest estimate of the current situation (2013), led to a decrease in the
oop leakage (Figs. 5a and 6a) and an increase in the loop efficiencyxcept for the IC and DC phone hibernation time (Figs. 5b and 6b).
We also analyzed the drivers through the SD model to gainnsights into eco-cycle indicators. This revealed that the accessi-ility of collection pathways and mobile phone use time made the
argest contributions to closing the loop efficiently (Fig. 5). Based onhe causal relationship in the model, longer life of phones reduceshe demand for new phones. As a result, manufacturers requireess metal for new phone production. In addition, longer use timef a phone delays EoL management and increases the collectionate because of the lower number of phones ready for collection.onsequently, consumer disposal rate of phones outside collectionystems decreases. In the model, collection of phones was esti-ated by: (i) accessibility of collection pathways; (ii) consumerotivation and awareness; and (iii) incentives for consumers (see
ig. 2b and equations in Appendix). Since accessibility of collec-ion pathways (Fig. 5) made a larger contribution to the closed loopystem, a higher collection rate can be achieved by incentives toonsumers or by educating them to increase awareness.
According to the SD model, more efficient collection of phonesnhances the positive feedback loop toward an efficient closedoop system through the refurbish, reuse, and recycle paths (cf.he loop in mobile phone flows subsystem in Fig. 2b). In addi-ion, a higher collection rate makes the business profitable, whichttracts more investors to invest. Therefore, an efficient collectionystem enhances the EoL organizations (e.g., collection, recycle)o grow and initiate synchronized growth with upstream parts ofhe product system. Synchronized growth is further discussed inonjunction with results of the eco-cycle scenario.
Experiments with the model on a higher degree of collectionhowed higher exports (c.f. Fig. 2b) of used phones from IC to DC.he recovery rate of informal recycling in DC was very low com-ared with the rate in IC (cf. Table 1). Consequently, the informalecycling sectors created system leakage, showing higher leveragen the sensitivity analysis (cf. gold recovery rate DC recyclers in
ig. 5). This suggests a need to improve the recycling efficiency,specially in informal sectors in DC.The last dominant driver according to the model, hibernationf phones, resulted in decreased loop leakage with an increase
thout any modification and reuse with modification by repairing, refurbishing, and
in hibernation time (cf. DC phone hibernation time in Fig. 5a).However, longer hibernation of phones also decreased loop effi-ciency (cf. IC and DC phone hibernation in Fig. 6b). Thus, the modelindicates that short duration of phone storage (without any use)increases loop efficiency.
A negligible contribution to loop leakage and loop efficiency inboth IC and DC (Figs. 5 and 6) was observed with an increase in thefollowing parameters: manufacturing cost, export cost, utility of arefurbished phone, i.e., functionality compared with a new phone,and price of metals.
Surprisingly, an increase in manufacturing costs from the basecase made a very small contribution to eco-cycle indicators (cf.,manufacturing costs in Fig. 5a and b). However, a decrease fromthe base case made a moderate contribution to eco-cycle indica-tors. Very low manufacturing costs of phones (Fig. 5) increasedloop leakage and decreased loop efficiency. According to the model,consumers buy new phones by comparing the price and utility ofa new phone and a secondhand phone. Among cheaper phones,consumers generally prefer buying new phones over secondhandphones, and this decreases the reuse of phones. Eventually, thephones are discarded, and the life span of phones becomes shorter.Thus, cheaper phones (i.e., lower manufacturing costs) resulted inlarge loop leakage and low loop efficiency (cf., manufacturing costsin Fig. 5a and b).
On the other hand, for phones with higher manufacturing costs,e.g., high end smartphones, an increase from the base case madea negligible contribution to loop leakage and loop efficiency (cf.Fig. 5). According to the model, a possible explanation is less profitfor recyclers to buy those phones to recycle. As a result, the phonesare not attracted to the collection systems at their EoL. The costlyphones thus act like a default phone in the model. Moreover, themodel does not have any direct price feedback on reuse and lifespan of a phone.
Among other drivers in the model, cost of metal recovery (Fig. 6)surprisingly made a negligible contribution to loop leakage andloop efficiency. According to the model, the formal recycling is notprofitable in the BAU scenario (base case). In addition, with a change(increase/decrease) in the cost of metal recovery, formal recycling
is not still profitable, because the recovery cost is a very small partof the total upstream costs associated with the collection of EoLphones by the formal facility. As a result, most EoL phones end upat an informal facility, and the change in the cost does not affect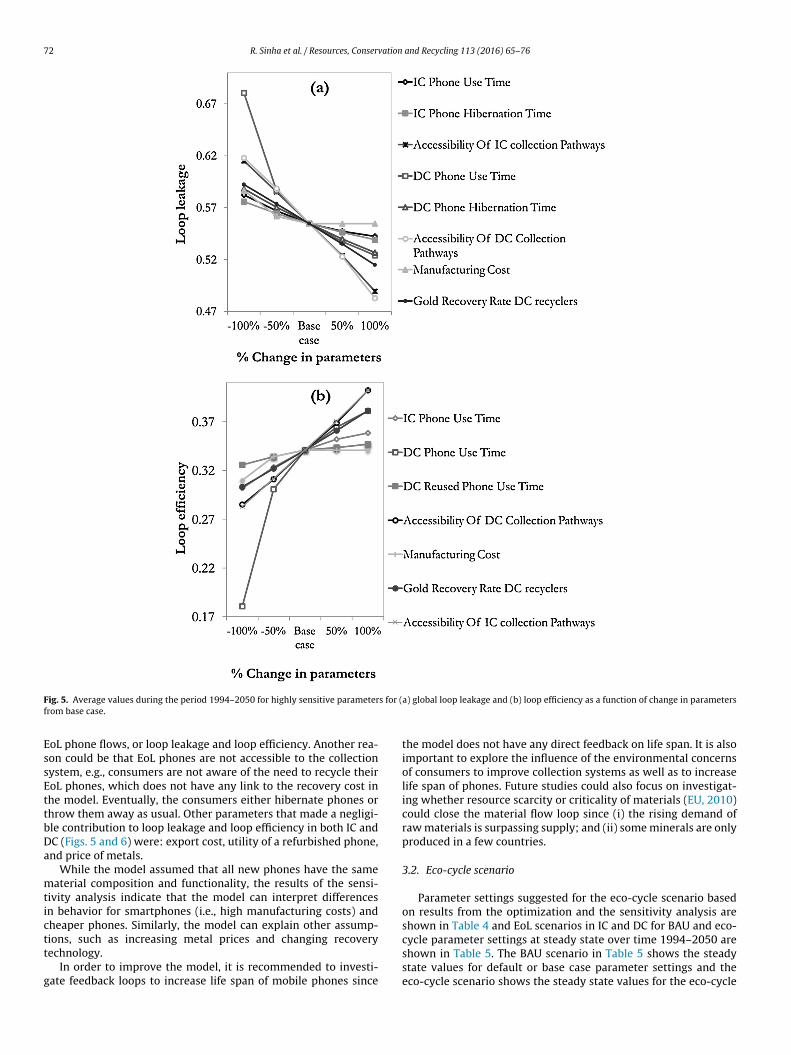
72 R. Sinha et al. / Resources, Conservation and Recycling 113 (2016) 65–76
F s for (f
EssEttbDa
mtictt
g
ig. 5. Average values during the period 1994–2050 for highly sensitive parameterrom base case.
oL phone flows, or loop leakage and loop efficiency. Another rea-on could be that EoL phones are not accessible to the collectionystem, e.g., consumers are not aware of the need to recycle theiroL phones, which does not have any link to the recovery cost inhe model. Eventually, the consumers either hibernate phones orhrow them away as usual. Other parameters that made a negligi-le contribution to loop leakage and loop efficiency in both IC andC (Figs. 5 and 6) were: export cost, utility of a refurbished phone,nd price of metals.
While the model assumed that all new phones have the sameaterial composition and functionality, the results of the sensi-
ivity analysis indicate that the model can interpret differencesn behavior for smartphones (i.e., high manufacturing costs) andheaper phones. Similarly, the model can explain other assump-
ions, such as increasing metal prices and changing recoveryechnology.In order to improve the model, it is recommended to investi-ate feedback loops to increase life span of mobile phones since
a) global loop leakage and (b) loop efficiency as a function of change in parameters
the model does not have any direct feedback on life span. It is alsoimportant to explore the influence of the environmental concernsof consumers to improve collection systems as well as to increaselife span of phones. Future studies could also focus on investigat-ing whether resource scarcity or criticality of materials (EU, 2010)could close the material flow loop since (i) the rising demand ofraw materials is surpassing supply; and (ii) some minerals are onlyproduced in a few countries.
3.2. Eco-cycle scenario
Parameter settings suggested for the eco-cycle scenario basedon results from the optimization and the sensitivity analysis areshown in Table 4 and EoL scenarios in IC and DC for BAU and eco-
cycle parameter settings at steady state over time 1994–2050 areshown in Table 5. The BAU scenario in Table 5 shows the steadystate values for default or base case parameter settings and theeco-cycle scenario shows the steady state values for the eco-cycle
R. Sinha et al. / Resources, Conservation and Recycling 113 (2016) 65–76 73
F for (a)f
pB2p
TSoa
ig. 6. Average values during the period 1994–2050 for less sensitive parameters
rom base case.
arameter settings. In the eco-cycle scenario, a step change fromAU to eco-cycle parameter settings was introduced at the year014. The BAU scenarios for both IC and DC, shown in Table 5, com-rised 55% disposal and hibernation of phones, which was mainly
able 4uggested parameter settings for the eco-cycle scenario based on results from modelptimization and sensitivity analysis. Values within brackets represent the businesss usual (BAU) or base case.
Parameter Eco-cycle
New mobile phone use time in both ICand DC
5 years (1.5 years)
New mobile phone hibernationwithout any use in both IC and DC
0.25 years (1 year)
Accessibility of collection pathways inboth IC and DC
100% (50%)
Consumer awareness in both IC and DC 75% (50%)Gold recovery rate of DC recyclers 95% (25%)
global loop leakage and (b) loop efficiency as a function of change in parameters
responsible for increasing system leakage and decreasing the effi-ciency (Eq. (1)). Disposal and hibernation of phones are both linkedto collection systems for phones, where the BAU scenario for bothcountry domains comprised around 45%. The eco-cycle scenarios
Table 5End-of-use phones at steady state in industrialized countries (IC) and developedcountries (DC).
EoL mobile phonesa Business as usual Eco-cycle
IC DC IC DC
Hibernation 66 % 66 % 5 % 5 %Disposal 55 % 55 % 0 % 0 %Collection 45 % 45 % 100 % 100 %Export 26 % 0 % 59 % 0 %Recycling 18 % 26 % 41 % 68 %Reuse 0 % 20 % 0% 32 %
a cf. the schematic flow diagram in Table 3.

74 R. Sinha et al. / Resources, Conservation and Recycling 113 (2016) 65–76
F cturee 994–2
fq5nsprep
smgm2Flopil
n(ptetwttlda
(tt(Ttr
ig. 7. Business as usual and eco-cycle scenarios of (a) gold use by phone manufafficiency of the global mobile phone product system as a function of time during 1
or both IC and DC showed 100% collection of phones and, conse-uently, the disposal and hibernation of phones was around 0% and%, respectively (Table 5). The scenario also showed that higherumbers of collected phones in eco-cycle scenarios than in BAUcenarios increases the number of recycled and refurbished/reusedhones. According to the model, exported IC used phones are eitherecycled or refurbished/reused in DC (Table 5). Thus the suggestedco-cycle scenario could improve the EoL management of mobilehones.
We also investigated the extent to which the proposed eco-cyclecenario could contribute to recovery of material at EoL and rawaterial use for production of new phones. In addition, we investi-
ated loop leakage and loop efficiency for the GMPPS. Fig. 7a showsodeled gold use and recovery from 1994 to 2050. From 1998 to
014, the model results show increasing gold use (broken line inig. 7a) and a low rate of gold recovery (thick gray line). The oscil-ation in modeled gold use, particularly seen from year 2008 annward, is ascribed to price elasticity, meaning that when prices ofhones decrease, demand of phones increase, and vice versa. Dur-
ng the historical period 1994–2014, recovery of gold (thick grayine in Fig. 7a) as given by the model was low.
For the period 2014 to 2050, we experimented with two alter-ative scenarios, BAU (broken and thick gray lines) and eco-cyclethin and thick black lines in Fig. 7a). In the eco-cycle scenario, theeriod 1994–2013 shows business as usual parameter settings andhe period 2014–2050 shows eco-cycle parameter settings. Thisxperimentation was done by making a step change in parame-er values for the eco-cycle scenario, where-after parameter valuesere kept constant over time. Thus, the model do not consider the
ime taken to go from BAU to eco-cycle conditions, by implemen-ing policies and adapting new business and user behaviors in realife. Therefore, the model output cannot be seen as a dynamic pre-iction of future, but can never the less be used to compare BAUnd eco-cycle consequences.
Model results in Fig. 7a showed a lower gold use in the eco-cyclethin line) than in the BAU (broken line). Also, the amplitude, dueo price elasticity, was lower in eco-cycle than in BAU. Moreover,he modeled gold recovery was 3-4 times larger in the eco-cycle
thick black line in Fig. 7a) than in the BAU (gray line) scenario.herefore, we conclude, that altogether, model results suggestedhat eco-cycle could lessen the pressure on gold and probably otheraw materials, as compared to BAU.rs and gold recovery at end of life of phones, (b) loop leakage and (c) closed loop050.
We also evaluated the BAU and eco-cycle scenarios in termsof loop leakage (Fig. 7b) and loop efficiency (Fig. 7c) indicatorsfor closed loop performance of the product system. In the BAUscenario, the model showed current loop leakage to be approx-imately 50% and closed loop efficiency approximately 35%. Overtime (cf. business as usual scenario in Figs. 7b and c), loop leakagecontinuously increased and loop efficiency decreased and by 2050were approximately 80% and 16%, respectively. On the other hand,the suggested eco-cycle scenario showed decreasing loop leakagedown to approximately 20% by 2050 and increasing loop efficiency,up to around 77% by 2050 (cf., eco-cycle scenario in Figs. 7b and c).
3.3. Suggestions for an eco-cycle system
3.3.1. Increasing life-span of a mobile phoneThe model results indicated that a longer life-span of mobile
phones (i.e., phone use time) decreases loop leakage and increasesloop efficiency in the GMPPS. Improvement to a small part of aphone currently makes the whole phone obsolete because of itsnon-modular design (Brezet and Van Hemel, 1997, p. 155). Thussolution such as the phoneblok concept (Phonebloks, 2013) couldincrease the life-span of a mobile phone. Furthermore, resourceconservative manufacturing (ResCoM) (Rashid et al., 2013; Asifet al., 2012) could increase the product life by allowing replacementof obsolete/damaged/expired components.
On the other hand, socio-economic enterprises (for exam-ple charities, voluntary organizations, non-profit companies, usedphone sellers) play a significant role in reuse (Ongondo et al., 2013)of a phone for extending its life. In this case, Ongondo et al. (2013)suggest a resource platform by creating industrial byproduct sym-biosis for fostering reuse, recycling, and EoL management.
3.3.2. Enhancing collection and end-of-lifeOur modeling results suggested that improved collection sys-
tems for used mobiles is a key driver for the eco-cycle scenariothat could synchronize growth between upstream and downstreamactivities. Organizations/sectors/technical systems at the EoL arecurrently not growing in synchronization with new phone produc-
tion in order to handle used phones. Hence, more investment at EoLis required to synchronize growth of upstream and downstreamsectors, in order to achieve an efficient, circular material flow loop.In the real world and in the model, an organizational growth engine
ation
dfgss
urt2rEAtwarrecaceP
ois(llafdfppthp
a2cmfdamfiiutceispme
4
c
R. Sinha et al. / Resources, Conserv
epends on profit, which triggers investment, creating a positiveeedback loop (Laurenti et al., 2015b) for the organization/businessrowth. To close the material flow loop and for the eco-cyclecenario in the GMPPS, synchronized growth of production, con-umption, and EoL management is essential.
To promote synchronized growth, it has been suggested thatpstream producers include external costs (e.g., social and envi-onmental costs of production and EoL management) in producingheir products (Leonard and Conrad, 2011; Jackson, 2011; Laurenti,013; Liao and Chuang, 2013). In addition, extended produceresponsibility (EPR) could play an important role in internalizingoL costs and possibly promoting improved collection (Herat andgamuthu, 2012; Corsini et al., 2013; Laurenti et al., 2015b). At
he same time, an EPR could motivate producers to design phonesith better recycling characteristics (Corsini et al., 2013; Herat
nd Agamuthu, 2012; Besiou et al., 2012), which could increaseecovery rate. Based on a concept of designing phones with betterecycling characteristics and securing a longer life-span, Laurentit al. (2015b) devised a product service system (PSS) that couldreate a new circular growth (e.g., reusing, refurbishing, recycling)t the EoL of mobile phones. Kuehr (2012) also argues that PSSould close the loop avoiding loop leakage and illegal shipment of-waste. Overall, therefore, internalizing external costs, EPR, andSS could synchronize growth by improving collection systems.
Based on the discussion above, PSS could synchronize growthf the EoL and the upstream production of mobile phones, whichs essential for creating a closed loop in the mobile phone productystem. In this context, Shokohyar et al. (2012), Shokohyar et al.2013) suggested some leasing strategies in PSS that could increaseoop efficiency and minimize waste generation during the productife cycle, as well as minimizing loop leakage. A reverse supply chainnd various recycling steps (Kuehr, 2012) could be other solutionsor preventing system leakage and increasing loop efficiency. Intro-uction of reverse logistics with the opening secondary marketsor refurbished/second-hand phones (i.e., the resource platformroposed by Ongondo et al. (2013)) could increase the reuse ofhones. In addition, the opening of secondary markets could reducehe preference for purchasing new phones over functional second-and phones, i.e., rationalize consumer choice between old and newhones.
Waste policies or implementation of related legislation have significant influence on e-waste management (Widmer et al.,005). However, introducing policy to reduce waste in one systemould shift the burden to the other systems. For example, imple-entation of strict e-waste guidelines could increase the cost of
ormal recycling due to legal requirements on waste treatment andisposal of hazardous material and this might increase the materi-ls flow to informal recycling facilities, where recovery of valuableaterials is less efficient because of primitive technology. There-
ore, policy makers should apply broader systems thinking beforemplementing legislation. On national level, policy incentives tomprove collection systems could amplify the reverse logistics ofsed phones, as discussed above. In addition, imposing an increasedax on material and embedded energy, and a decreased tax on labor,ould help grow the repair and refurbishment sectors, which canxtend the life span of phones (Cooper, 2012). Furthermore, pol-cy support at national or global level could allow the PSS to shapeustainable production and consumption in the GMPPS. To sum up,olicy to promote PSS or/and reverse logistics could help close theetal flow loop in the GMPSS and support to promote a circular
conomy.
. Conclusions
Because of the rapid obsolescence of mobile phones and asso-iated technologies, disposal of phones has increased, placing
and Recycling 113 (2016) 65–76 75
increasing pressure on non-renewable resources such as gold.This study investigated the possibilities to close the material flowloop for the valuable metals used in mobile phones by identify-ing potential drivers in the GMPPS. Previous modeling studies onmobile phone product systems have applied either qualitative andstatic quantitative approaches or small-scale quantitative dynamicapproaches in such work, but in this study system dynamics (SD)modeling taking a broader systems perspective was applied. Inimplementing the SD model, an equation-based model was testedwith real-world data from the scientific literature and shown tocomply with analytical objectives.
The potential drivers toward an efficient closed loop systemwere identified in the following order to take decision on: (i)improving collection systems, (ii) used phones longer mobile phoneuse time; (iii) improved informal recycling in developing countries;and (iv) shorter mobile phone hibernation time. An efficient collec-tion system would facilitate reuse, refurbishment, and recycling.The longer mobile phone use time driver reduced the pressure onthe demand side for producing new phones and the pressure onEoL management. Longer mobile phone storage time without anyuse increased hibernation, which made the loop inefficient andincreased the loop leakage. The informal recycling in developingcountries driver resulted in lower resource recovery and highersystems leakage. Other drivers, such as manufacturing cost, exportcost, and utility of a refurbished phone made very small contrib-utions to loop leakage or loop efficiency.
Based on potential drivers, an eco-cycle scenario was proposedto lower pressures on resources by decreasing resource demandsfor production and increasing resource recovery at EoL of mobilephones. By 2050, the proposed scenario decreased loop leakageto approx. 20% (BAU scenario: approx. 50% at 2014 and 80% at2050) and improved loop efficiency to around 77% (BAU scenario:approx. 35% at 2014 and 16% at 2050). Internalization of externalcosts, extended producer responsibility, a resource platform con-cept, modular design of phones, and improved recycling efficiencycould guide the current system toward the proposed eco-cyclescenario. Better policy support, development of product servicesystems, and introduction of reverse logistics are other potentiallyimportant measures in fostering a circular economy.
Acknowledgements
We thank PhD candidate L. Andrew Bollinger (Faculty of Tech-nology, Policy and Management, Delft University of Technology)for his support with implementing the model. We also express ourgratitude to Prof. Josepha Potting (KTH) and Per Jakobsson (KTH)for their constructive comments on the manuscript. Furthermore,Rajib Sinha gratefully acknowledges Industrial Ecology, KTH (RoyalInstitute of Technology, Stockholm, Sweden) for financial support.In addition, Rafael Laurenti and Jagdeep Singh acknowledge finan-cial support from the European Commission under the ErasmusMundus External Cooperation Windows ‘EU-Brazil STARTUP’ and‘India4EU’ programmes.
Appendix A. Supplementary data
Supplementary data associated with this article can be found,in the online version, at http://dx.doi.org/10.1016/j.resconrec.2016.05.010.
References
Achachlouei, M.A., 2015. Exploring the Effects of it on Environmental Assessment:From Life Cycle Assessment of Complex Systems Modeling. Ph.D. thesis,Department of Sustainable Development, Environmental science andEngineering (SEED), KTH Royal Institute of Technology, Stockholm, Sweden.

7 vation
A
A
A
A
A
B
B
B
B
B
C
C
C
E
E
E
F
G
G
G
G
G
H
I
J
K
L
L
L
L
the need for sustainability innovations. J. Strateg. Innov. Sustain. 7 (2),
6 R. Sinha et al. / Resources, Conser
ndarani, P., Goto, N., 2013. Potential e-waste generated from households inIndonesia using material flow analysis. J. Mater. Cycles Waste Manage., 1–15.
nyLogic, 2014. Multimethod simulation software, Available at: http://www.anylogic.com (accessed 21.03.14).
sif, F.M., Bianchi, C., Rashid, A., Nicolescu, C.M., 2012. Performance analysis of theclosed loop supply chain. J. Remanuf. 2 (1), 1–21.
sif, F.M., Rashid, A., Bianchi, C., Nicolescu, C.M., 2015. System dynamics modelsfor decision making in product multiple lifecycles. Resour. Conserv. Recycl.101, 20–33.
sif, F.M.A., 2011. Resource Conservative Manufacturing: A New Generation ofManufacturing. (Ph.D. thesis), KTH.
asel-Convention, 2008. Guidance Document on the Environmentally SoundManagement of Used and End-of-life Mobile Phones, Prepared by MobilePhone Working Group, (online), available at: http://archive.basel.int/industry/mppi/MPPI (accessed 07.08.13).
esiou, M., Van Wassenhove, L., Williams, I., Ongondo, F., Curran, T., O’Connor, C.,Yang, M.-Y., Dietrich, J., Marwede, M., Gallo, M., Arnaiz, S., Woolman, T.,Kopacek, B., Obersteiner, G., 2012. Enablers and barriers for producerresponsibility in the electrical and electronic equipment sector. In: ConferencePublications. Electronics Goes Green 2012+ (EGG), Berlin.
ollinger, L., 2010. Growing cradle-to-cradle metal flow systems: an application ofagent-based modeling and system dynamics to the study of global flows ofmetals in mobile phones. (Master thesis at Industrial Ecology) Delft Universityof Technology, Delft, Netherlands.
ollinger, L.A., Davis, C., Nikolic, I., Dijkema, G.P., 2012. Modeling metal flowsystems. J. Ind. Ecol. 16 (2), 176–190.
rezet, H., Van Hemel, C., 1997. Ecodesign: A Promising Approach to SustainableProduction and Consumption. United Nations Environment Programme, ISBN92-807-1631X.
airns, C.N., 2005. E-waste and the consumer: improving options to reduce, reuseand recycle. In: Proceedings of the 2005 IEEE International Symposium onElectronics and the Environment, 2005. IEEE, pp. 237–242.
ooper, T., 2012. Longer Lasting Products: Alternatives to the Throwaway Society.Gower Publishing Ltd.
orsini, F., Rizzi, F., Gusmerotti, N.M., Frey, M., 2013. Extended producerresponsibility and the evolution of sustainable specializations: evidences fromthe e-waste sector. Bus. Strategy Environ., http://dx.doi.org/10.1002/bse.1831.
co-Cycle, 2014. Eco-cycle: Building Zero Waste Communities (online), availableat: https://www.ecocycle.org/index.php (accessed 21.03.14).
llen MacArthur Foundation, 2015. Circularity indicators: an approach tomeasuring circularity. Methodology (online), available at: http://www.ellenmacarthurfoundation.org/assets/downloads/insight/Circularity-Indicators Methodology May2015.pdf (accessed 26.11.15).
U, 2010, July. Critical Raw Materials for the eu. Report of the Ad-hoc WorkingGroup on Defining Critical Raw Materials. Ad-hoc Working Group, pp. 84.
ischer-Kowalski, M., Haberl, H., 1998. Sustainable development: socio-economicmetabolism and colonization of nature. Int. Soc. Sci. J. 50 (158), 573–587.
eels, F.W., 2012. A socio-technical analysis of low-carbon transitions: introducingthe multi-level perspective into transport studies. J. Transp. Geogr. 24,471–482.
eorgiadis, P., Besiou, M., 2008. Sustainability in electrical and electronicequipment closed-loop supply chains: a system dynamics approach. J. Clean.Prod. 16 (15), 1665–1678.
eorgiadis, P., Besiou, M., 2010. Environmental and economical sustainability ofWEEE closed-loop supply chains with recycling: a system dynamics analysis.Int. J. Adv. Manuf. Technol. 47 (5–8), 475–493.
eyer, R., Blass, V.D., 2010. The economics of cell phone reuse and recycling. Int. J.Adv. Manuf. Technol. 47 (5-8), 515–525.
raedel, T.E., Allenby, B.R., 2003. Industrial Ecology, 2nd ed. Prentice Hall, UpperSaddle River, NJ.
erat, S., Agamuthu, P., 2012. E-waste: a problem or an opportunity? Review ofissues, challenges and solutions in Asian countries. Waste Manage. Res. 30(11), 1113–1129.
TU, 2013. International Telecommunication Union: Statistics (online), available at:http://www.itu.int/en/ITU-D/Statistics/Pages/stat/default.aspx (accessed31.07.13).
ackson, T., 2011. Prosperity Without Growth: Economics for a Finite Planet.Earthscan Publications, Ltd., Routledge, ISBN-13: 978-1849713238.
uehr, R., 2012. Global e-waste initiatives. In: Goodship, V., Stevels, A. (Eds.),Waste electrical and electronic equipment (WEEE) handbook. No. 30 inWoodhead Publishing Series in Electronic and Optical Materials. WoodheadPublishing Ltd., pp. 3–16 (Chapter 1).
aurenti, R., 2013. Applications of Systems Thinking Within the SustainabilityDomain: Product Design, Product Systems and Stakeholder Perspectives.(Licentiate thesis at Industrial Ecology) KTH Royal Institute of Technology,Stockholm, Sweden.
aurenti, R., Singh, J., Sinha, R., Frostell, B., 2015a. Towards addressing unintendedenvironmental consequences: a planning framework. Sustain. Dev.,doi:10.1002/sd.1601.
aurenti, R., Singh, J., Sinha, R., Potting, J., Frostell, B., 2015b. Unintendedenvironmental consequences of improvement actions: a qualitative analysis of
systems’ structure and behavior. Syst. Res. Behav. Sci.aurenti, R., Sinha, R., Singh, J., Frostell, B., 2015c. Some pervasive challenges tosustainability by design of electronic products – a conceptual discussion. J.Clean. Prod. 108, 281–288.
and Recycling 113 (2016) 65–76
Leonard, A., Conrad, A., 2011. The Story of Stuff: The Impact of Overconsumptionon the Planet. Our Communities, and Our Health-and how We Can Make itBetter. Free Press.
Liao, C.-S., Chuang, H.-K., 2013. Green product innovation: integratingenvironmental aspects into electrical and electronic equipment development.Manage. Sci. 47 (2), 250–263.
Meskers, C., Hagelüken, C., 2009. Closed loop WEEE recycling? Challenges andopportunities for a global recycling society. In: Proceedings of the 2009 EPDCongress.
Navazo, J.M.V., Méndez, G.V., Peiró, L.T., 2014. Material flow analysis and energyrequirements of mobile phone material recovery processes. Int. J. Life CycleAssess. 19, 567–579.
Neira, J., 2006. End-of-life Management of Cell Phones in the United States. (M.Sc.thesis at Environmental Science and Management for the Donald Bren Schoolof Environmental Science and Management) University of California SantaBarbara.
Nguyen, N.C., Bosch, O.J., Ong, F.Y., Seah, J.S., Succu, A., Nguyen, T.V., Banson, K.E.,2015. A systemic approach to understand smartphone usage in Singapore.Syst. Res. Behav. Sci.
Ongondo, F., Williams, I., Dietrich, J., Carroll, C., 2013. ICT reuse in socio-economicenterprises. Waste Manage., http://dx.doi.org/10.1016/j.wasman.2013.08.020.
OptTek Systems, 2015. Optquest, Available at: http://www.opttek.com/OptQuest(accessed 11.01.15).
Panambunan-Ferse, M., Breiter, A., 2013. Assessing the side-effects of ICTdevelopment: e-waste production and management: a case study about cellphone end-of-life in Manado, Indonesia. Technol. Soc., http://dx.doi.org/10.1016/j.techsoc.2013.04.002.
Peng, W.J., Su, D.Z., 2014. Development of an Online System for RecyclingConsumer Electronic Products Using the Internet, NFC and RFID Technologies.Key Eng. Mater. 572, 90–99.
Perthmint, 2013. Precious Metal Prices (online), available at: http://www.perthmint.com.au/investment invest in gold precious metal prices.aspx(accessed 25.07.13).
Phonebloks, 2013. Phonebloks: A Phone Worth Keeping (online), available at:https://phonebloks.com (accessed 08.11.13).
Preston, F., 2012. A Global Redesign? Shaping the Circular Economy. Energy,Environment and Resource Governance. Chatham House, London (online),available at: http://www.chathamhouse.org/publications/papers/view/182376(accessed 05.04.15).
Rahmandad, H., Sterman, J.D., 2012. Reporting guidelines for simulation-basedresearch in social sciences. Syst. Dyn. Rev. 28 (4), 396–411.
Rashid, A., Asif, F., Krajnik, P., Nicolescu, C.M., 2013. Resource conservativemanufacturing: an essential change in business and technology paradigm forsustainable manufacturing. J. Clean. Prod. 57, 166–177.
Ravetz, J., 2000. Integrated assessment for sustainability appraisal in cities andregions. Environ. Impact Assess. Rev. 20 (1), 31–64.
Shokohyar, S., Mansour, S., Karimi, B., 2012. A model for integrating services andproduct EOL management in sustainable product service system (S-PSS). J.Intell. Manuf., 1–14.
Shokohyar, S., Mansour, S., Karimi, B., 2013. Simulation-based optimization ofecological leasing: a step toward extended producer responsibility (EPR). Int. J.Adv. Manuf. Technol., 1–11.
Silveira, G.T., Chang, S.-Y., 2010. Cell phone recycling experiences in the unitedstates and potential recycling options in brazil. Waste Manage. 30 (11),2278–2291.
Spengler, T., Schröter, M., 2003. Strategic management of spare parts in closed-loopsupply chains – a system dynamics approach. Interfaces 33 (6), 7–17.
Sterman, J., 2000. Business Dynamics: Systems Thinking and Modeling for aComplex World. Irwin-McGraw-Hill, ISBN:978-0-07-231135-8.
Takeback-Coalition, 2013. Responsible recycling vs global dumping (online),available at: http://www.electronicstakeback.com/global-e-waste-dumping/(accessed 15.12.13).
Tischner, U., 2012. Sustainable electronic product design. In: Goodship, V., Stevels,A. (Eds.), Waste Electrical and Electronic Equipment (WEEE) Handbook. No. 30in Woodhead Publishing Series in Electronic and Optical Materials. WoodheadPublishing Ltd., pp. 404–441, Ch. 19.
Umair, S., Björklund, A., Petersen, E.E., 2013. Social life cycle inventory and impactassessment of informal recycling of electronic ICT, waste in Pakistan. In: Hilty,L., Aebischer, E., Andersson, G., Lohmann, W. (Eds.), Proceedings of the FirstInternational Conference on Information and Communication Technologies forSustainability. ETH, Zurich, pp. 52–58.
UN, 2013. World Population Prospects: The 2012 Revision. United Nations,Department of Economic and Social Affairs (online), available at: http://esa.un.org/unpd/wpp/Excel-Data/population.htm (accessed 04.08.13).
Wang, F., Huisman, J., Stevels, A., Baldé, C.P., 2013. Enhancing e-waste estimates:improving data quality by multivariate input–output analysis. Waste Manage.,http://dx.doi.org/10.1016/j.wasman.2013.07.005.
Widmer, R., Oswald-Krapf, H., Sinha-Khetriwal, D., Schnellmann, M., Böni, H., 2005.Global perspectives on e-waste. Environ. Impact Assess. Rev. 25 (5), 436–458.
Wilhelm, W., Yankov, A., Magee, P., 2011. Mobile phone consumption behavior and
20–40.Williams, E., Kahhat, R., Bengtsson, M., Hayashi, S., Hotta, Y., Totoki, Y., 2013.
Linking informal and formal electronics recycling via an interface organization.Challenges 4 (2), 136–153.