resource management. copyright © 2010 pearson education, inc. publishing as prentice hall12-2 types...
TRANSCRIPT

Resource Management
Copyright © 2010 Pearson Education, Inc. Publishing as Prentice Hall 12-2
Types of Constraints
Time
Resource
Mixed
Copyright © 2010 Pearson Education, Inc. Publishing as Prentice Hall

Resources• Definition: anything that is scarce and required for any activity
in the project. Resources are constraints for the project.• Resources can be:
– Non-storable: has to be renewed for each periode.g. work
– Storable: depleted only by usage (remains available if not used)e.g. money
• The most common resource typology, the 4Ms:– Men
– Machines
– Money (cost)
– Material
– Other
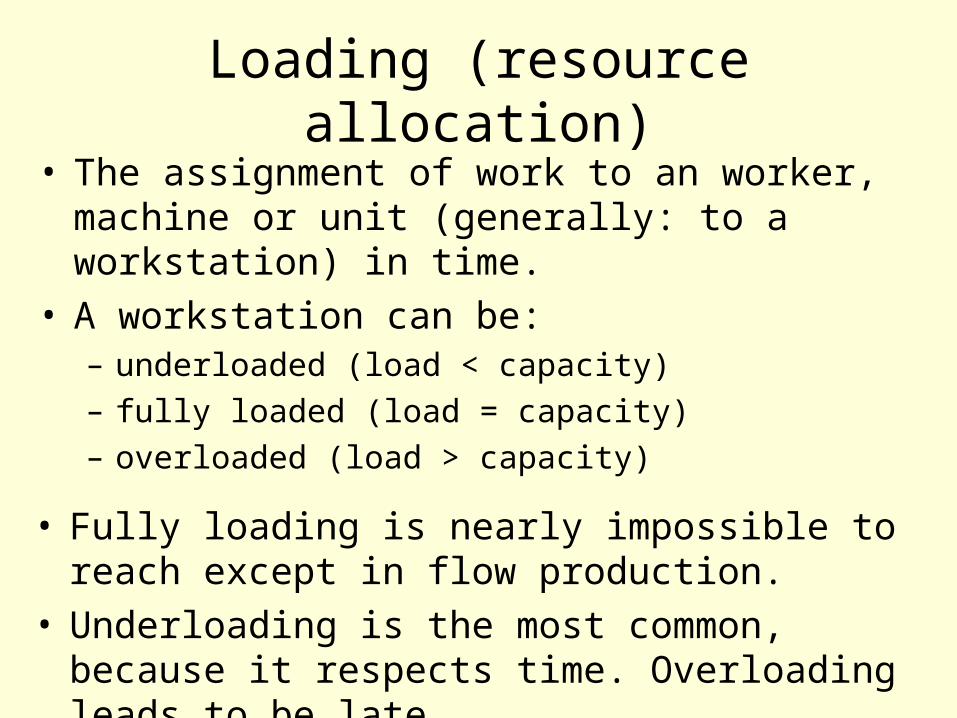
Loading (resource allocation)• The assignment of work to an worker, machine or
unit (generally: to a workstation) in time.• A workstation can be:
– underloaded (load < capacity)– fully loaded (load = capacity)– overloaded (load > capacity)
• Fully loading is nearly impossible to reach except in flow production.
• Underloading is the most common, because it respects time. Overloading leads to be late.

Copyright © 2010 Pearson Education, Inc. Publishing as Prentice Hall 12-5
Resource LoadingThe amounts of individual resources that a schedule requires during
specific time periods.
Resource loading table
Resource Name Work Details 5/5 5/12 5/19 5/26
Tom 40 hrs Work 8h 32h
Assign Bids 40 hrs Work 8h 32h
Jeff 40 hrs Work 8h 32h
Calculate Cost 40 hrs Work 8h 32h
Sue 40 hrs Work 8h 32h
Select Bid 40 hrs Work 8h 32h
Carol 8 hrs Work 8h
PR Campaign 8 hrs Work 8h

What to do with non-linear duration-resource functions?
• Use a computer• Focus on quasi-linear parts of the functions
Copyright © 2010 Pearson Education, Inc. Publishing as Prentice Hall 12-7
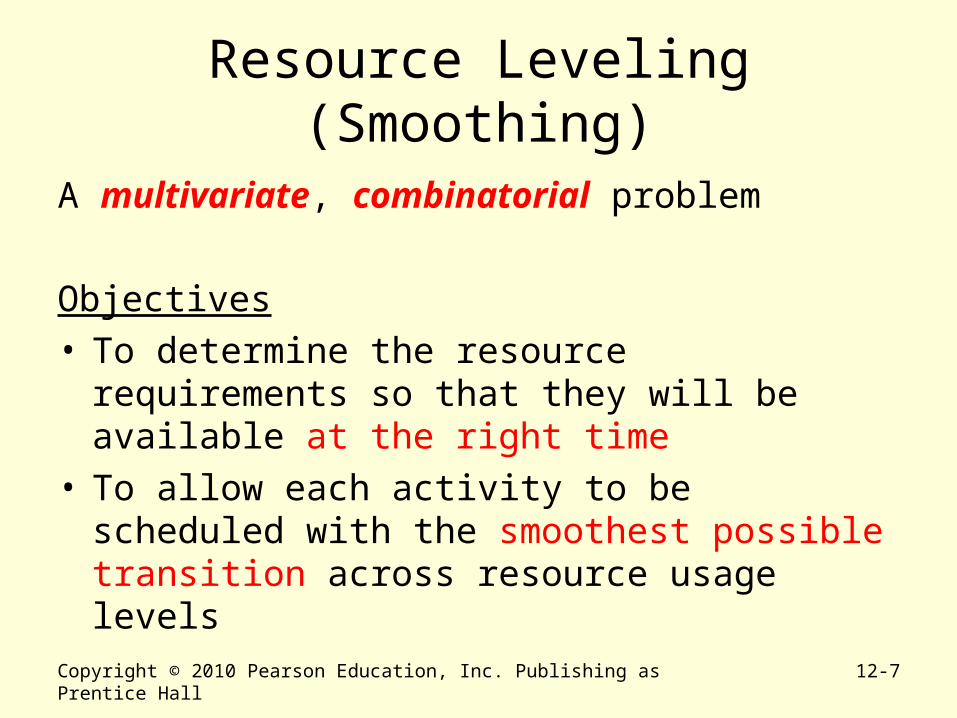
Resource Leveling (Smoothing)
A multivariate, combinatorial problem
Objectives• To determine the resource requirements so that
they will be available at the right time• To allow each activity to be scheduled with the
smoothest possible transition across resource usage levels
Copyright © 2010 Pearson Education, Inc. Publishing as Prentice Hall 12-8
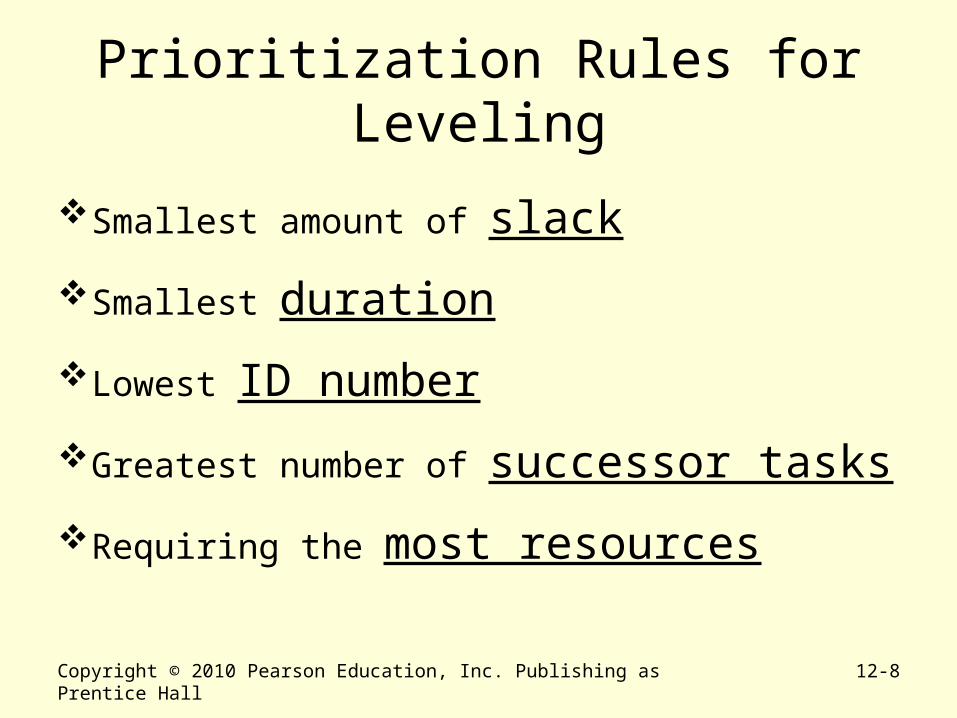
Prioritization Rules for Leveling
Smallest amount of slack
Smallest duration
Lowest ID number
Greatest number of successor tasks
Requiring the most resources
Copyright © 2010 Pearson Education, Inc. Publishing as Prentice Hall 12-9
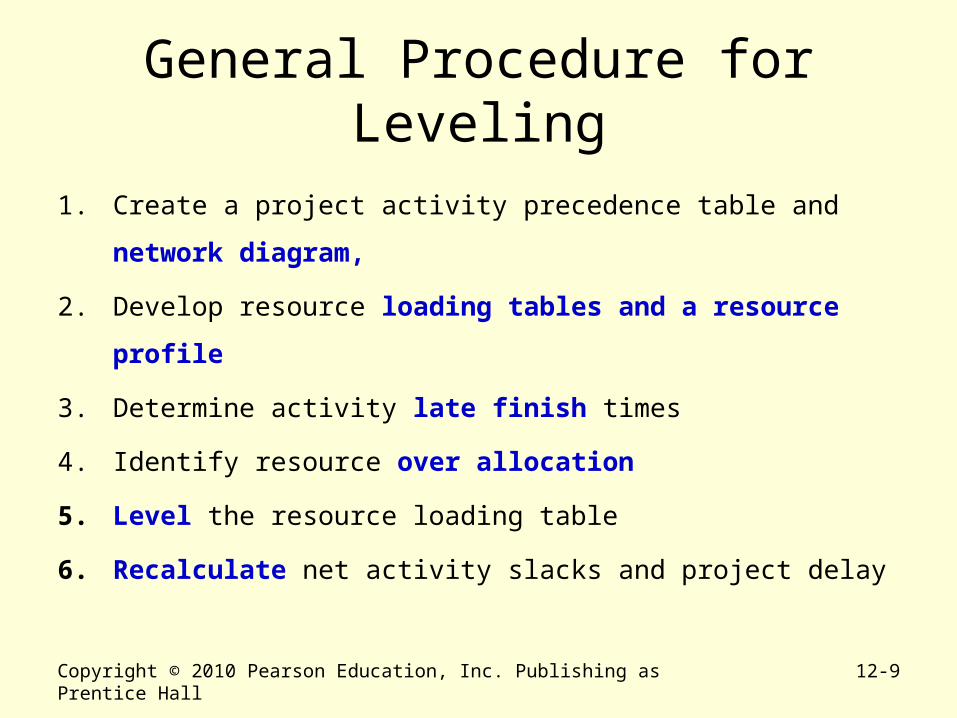
General Procedure for Leveling
1. Create a project activity precedence table and network diagram,
2. Develop resource loading tables and a resource profile
3. Determine activity late finish times
4. Identify resource over allocation
5. Level the resource loading table
6. Recalculate net activity slacks and project delay
Copyright © 2010 Pearson Education, Inc. Publishing as Prentice Hall 12-10
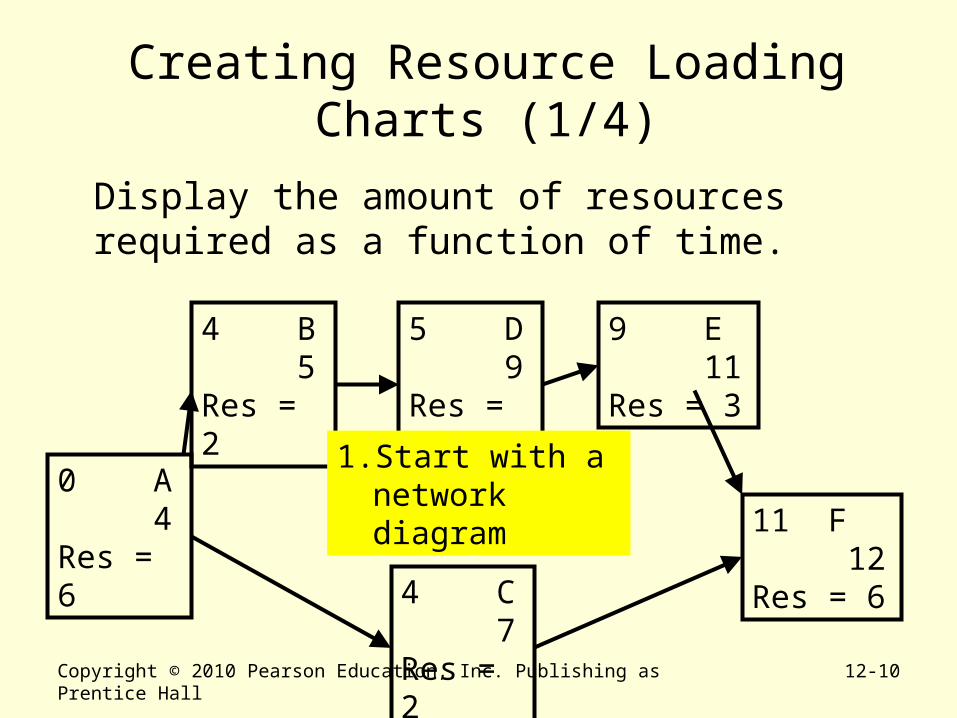
Creating Resource Loading Charts (1/4)
Display the amount of resources required as a function of time.
0 A 4 Res = 6
4 B 5 Res = 2
5 D 9 Res = 7
9 E 11 Res = 3
4 C 7 Res = 2
11 F 12 Res = 6
1. Start with a network diagram
Copyright © 2010 Pearson Education, Inc. Publishing as Prentice Hall 12-11
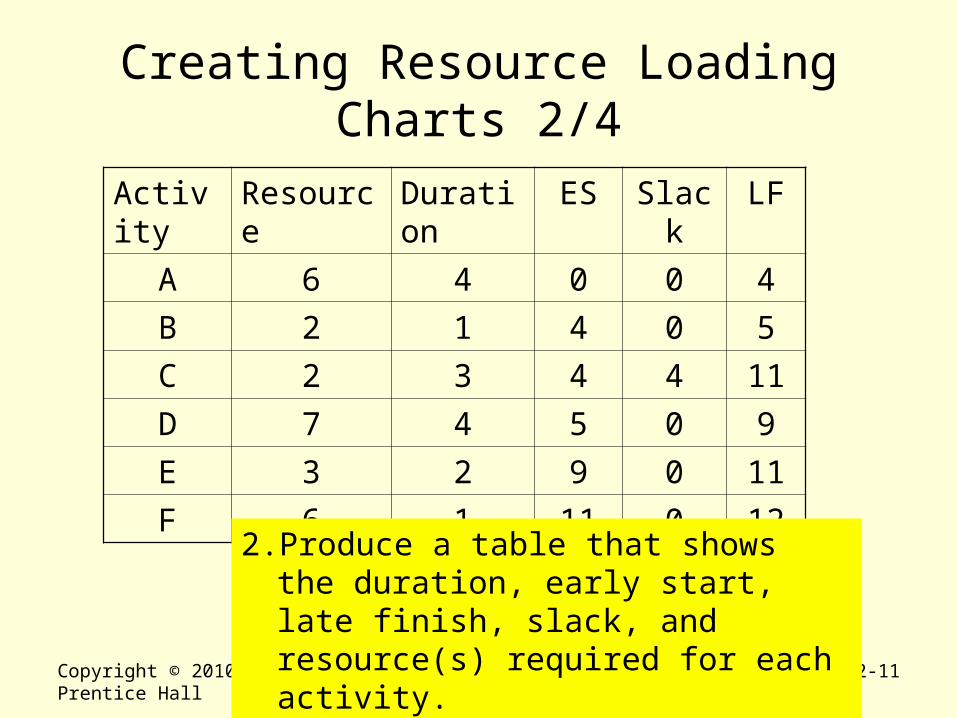
Creating Resource Loading Charts 2/4
Activity Resource Duration ES Slack LF
A 6 4 0 0 4
B 2 1 4 0 5
C 2 3 4 4 11
D 7 4 5 0 9
E 3 2 9 0 11
F 6 1 11 0 12
2. Produce a table that shows the duration, early start, late finish, slack, and resource(s) required for each activity.
Copyright © 2010 Pearson Education, Inc. Publishing as Prentice Hall 12-12
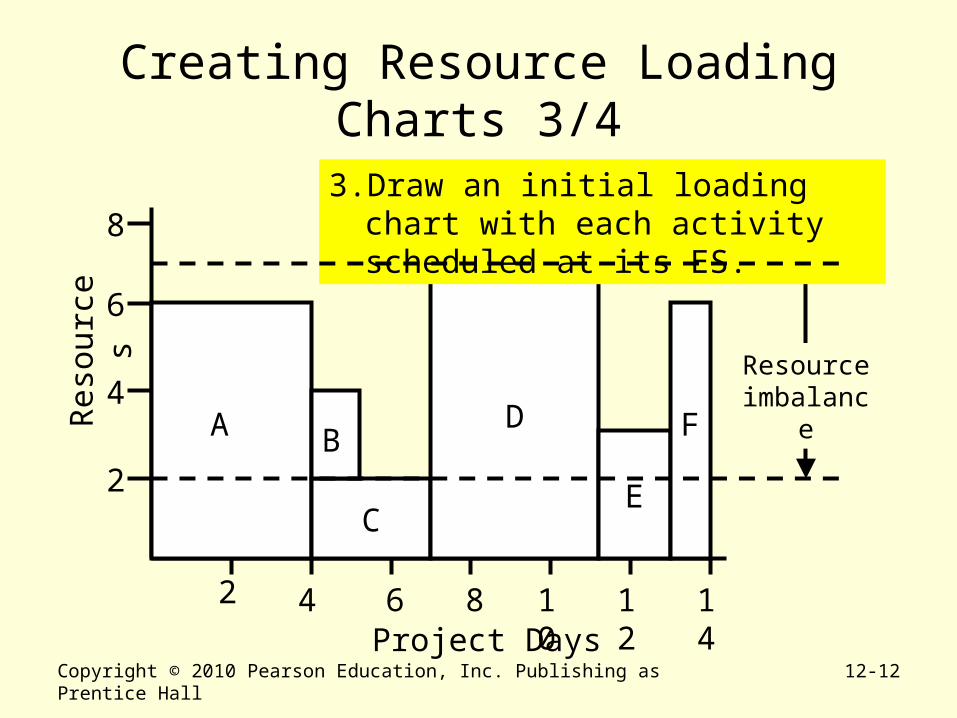
Creating Resource Loading Charts 3/4
A
2
4
6
8
2 1210864 14
C
BD
E
F
Project Days
Res
ourc
es
3. Draw an initial loading chart with each activity scheduled at its ES.
Resource imbalance

Copyright © 2010 Pearson Education, Inc. Publishing as Prentice Hall 12-13
Creating Resource Loading Charts 4/44. Rearrange activities within their slack
to create a more level profile. Splitting C creates a more level project.
A
2
4
6
8
2 1210864 14
C
BD
E
F
Project Days
Res
ourc
es
C

Copyright © 2010 Pearson Education, Inc. Publishing as Prentice Hall 12-14
Key Parameters in Multi-Project Environments
Schedule slippage
Resource utilization
In-process inventory

Copyright © 2010 Pearson Education, Inc. Publishing as Prentice Hall 12-15
Prioritizing Resource Allocations in Multi-Project Environments
• First come first served
• Greatest resource demand
• Greatest resource utilization
• Minimum late finish time
• Mathematical programming
Problem solving
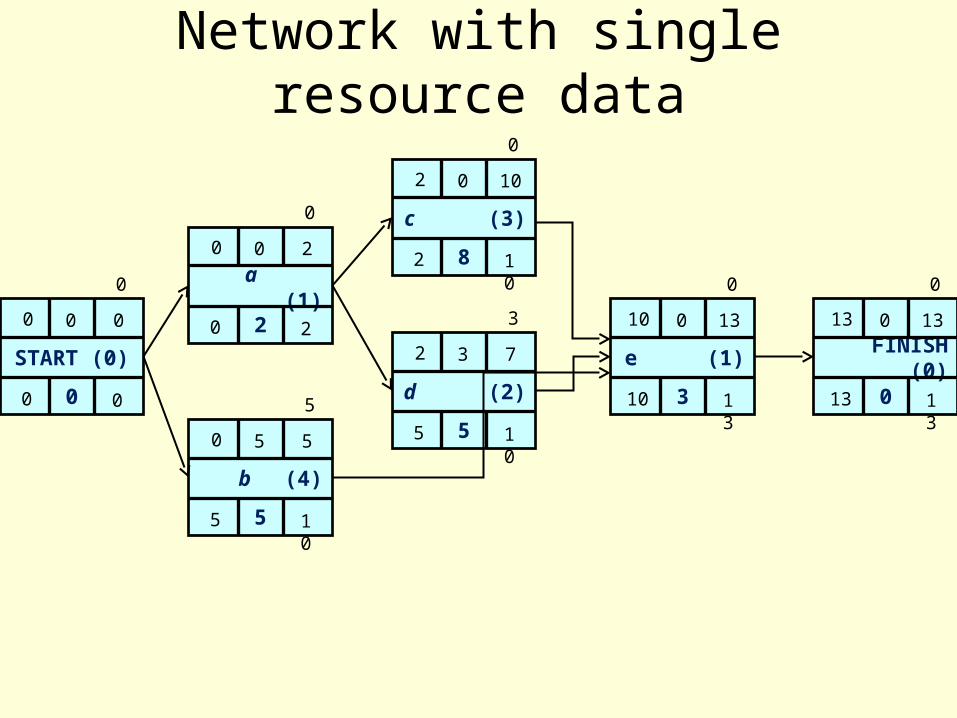
Network with single resource data
START (0)
0 00
0 00
0
e (1)
10 130
10 133
0
d (2)
2 73
5 105
3
c (3)
2 100
2 108
0
b (4)
0 55
5 105
5
a (1)
0 20
0 22
0
FINISH (0)
13 130
13 130
0
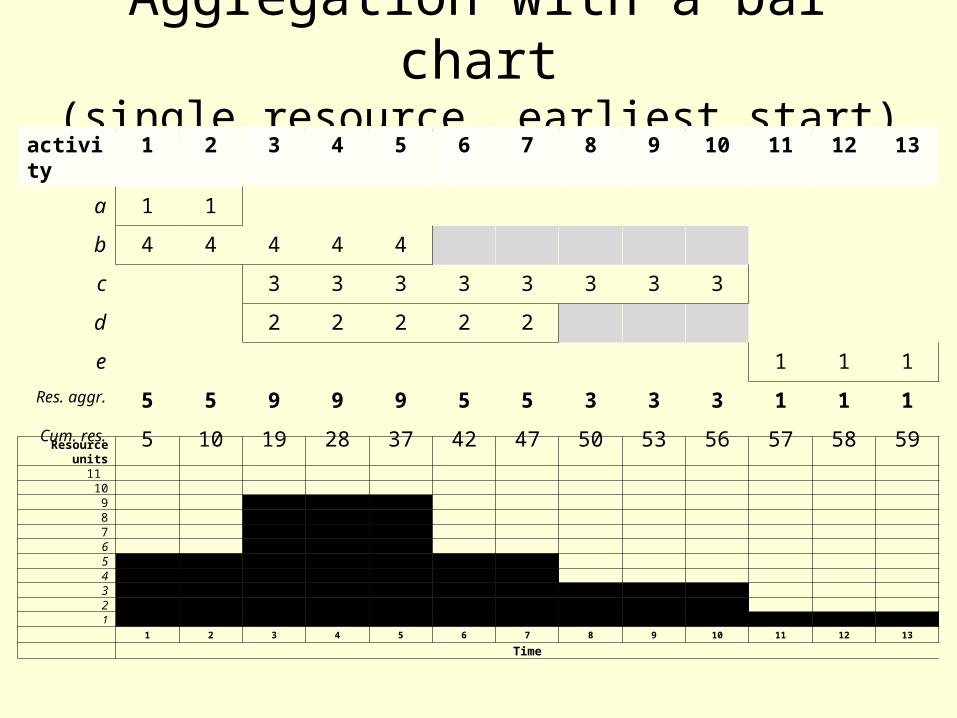
Aggregation with a bar chart(single resource, earliest start)
activity 1 2 3 4 5 6 7 8 9 10 11 12 13
a 1 1
b 4 4 4 4 4
c 3 3 3 3 3 3 3 3
d 2 2 2 2 2
e 1 1 1
Res. aggr. 5 5 9 9 9 5 5 3 3 3 1 1 1
Cum. res. 5 10 19 28 37 42 47 50 53 56 57 58 59Resource units
11 10
987654321
1 2 3 4 5 6 7 8 9 10 11 12 13
Time

Aggregation with a bar chart(single resource, latest start)
activity 1 2 3 4 5 6 7 8 9 10 11 12 13
a 1 1
b 4 4 4 4 4
c 3 3 3 3 3 3 3 3
d 2 2 2 2 2
e 1 1 1
Res. aggr. 1 1 3 3 3 9 9 9 9 9 1 1 1
Cum. res. 1 2 5 8 11 20 29 38 47 56 57 58 59Resource units
11 10
987654321
1 2 3 4 5 6 7 8 9 10 11 12 13
Time

The S Curve analysis
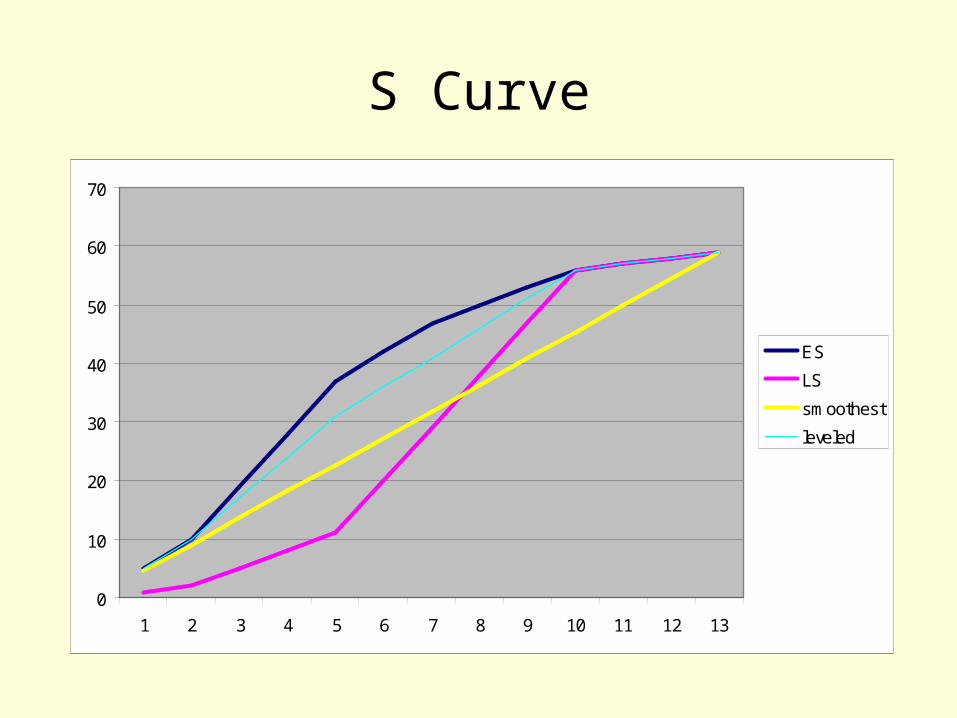
• The minimum slope level is the less ‘critical’ from the viewpoint of availability
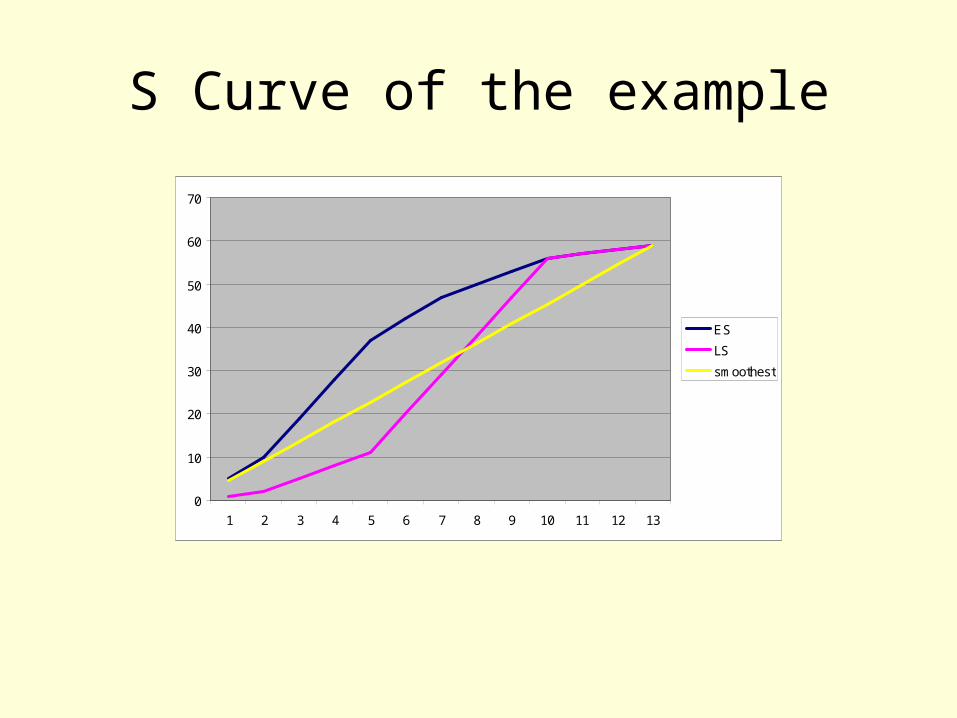
S Curve of the example
0
10
20
30
40
50
60
70
1 2 3 4 5 6 7 8 9 10 11 12 13
ES
LS
smoothest

Other possibilities
• Alternative resources• Alternative methods• Alternative sequences
(if there is no technical dependency)
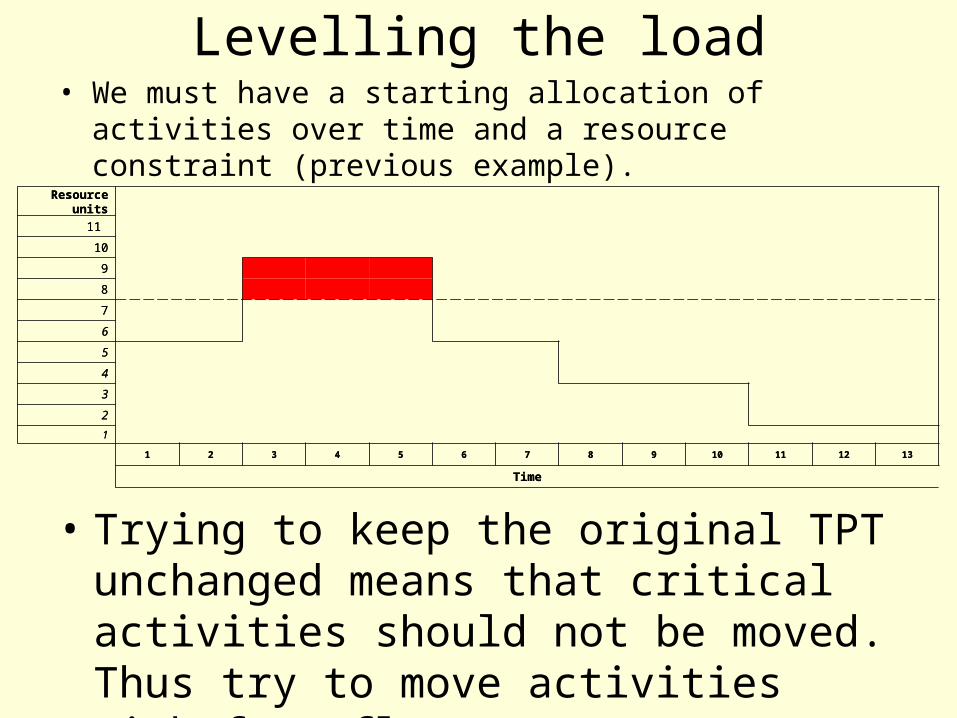
Levelling the load• We must have a starting allocation of activities over time
and a resource constraint (previous example).
Resource units
11
10
9
8
7
6
5
4
3
2
1
1 2 3 4 5 6 7 8 9 10 11 12 13
Time
• Trying to keep the original TPT unchanged means that critical activities should not be moved. Thus try to move activities with free float.
Resource units
11
10
9
8
7
6
5
4
3
2
1
1 2 3 4 5 6 7 8 9 10 11 12 13
Time
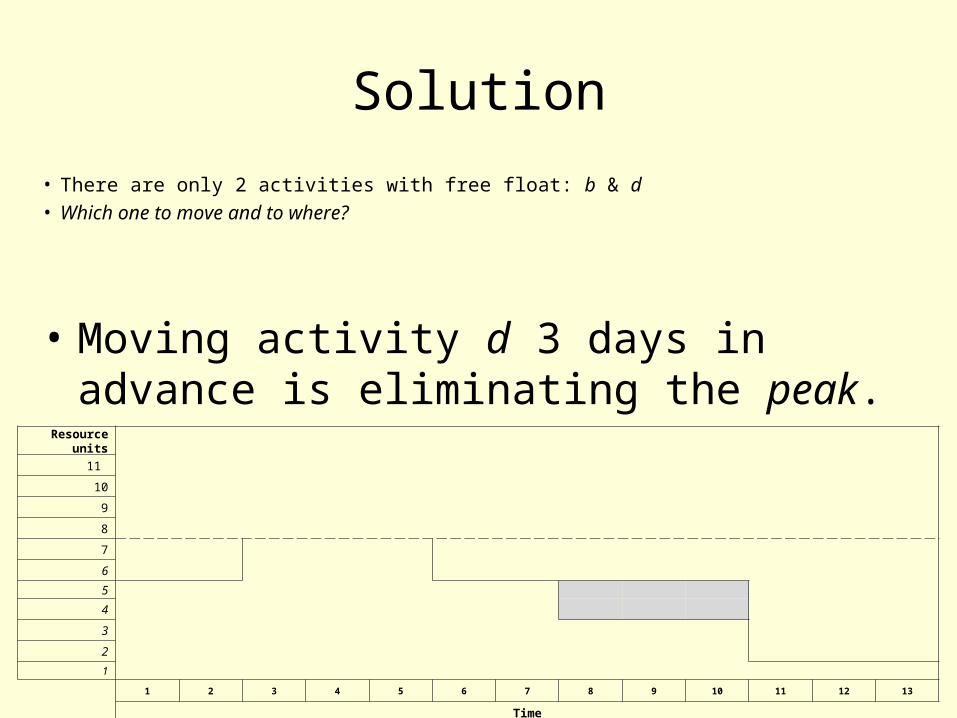
Solution
• There are only 2 activities with free float: b & d• Which one to move and to where?
• Moving activity d 3 days in advance is eliminating the peak.
Resource units
11
10
9
8
7
6
5
4
3
2
1
1 2 3 4 5 6 7 8 9 10 11 12 13
Time
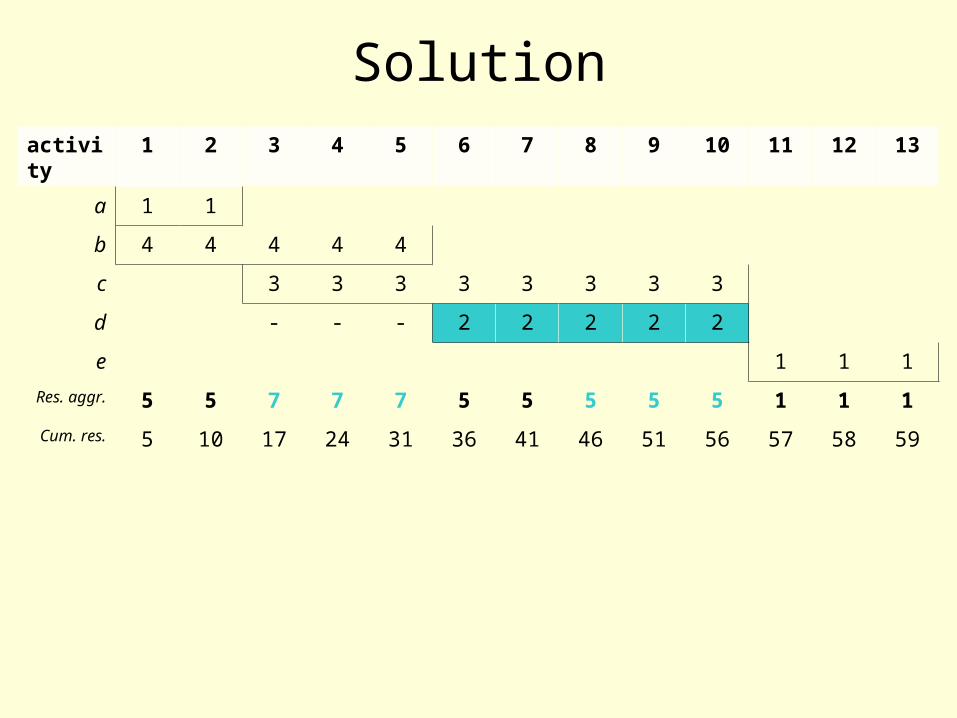
activity 1 2 3 4 5 6 7 8 9 10 11 12 13
a 1 1
b 4 4 4 4 4
c 3 3 3 3 3 3 3 3
d - - - 2 2 2 2 2
e 1 1 1
Res. aggr. 5 5 7 7 7 5 5 5 5 5 1 1 1
Cum. res. 5 10 17 24 31 36 41 46 51 56 57 58 59
Solution
0
10
20
30
40
50
60
70
1 2 3 4 5 6 7 8 9 10 11 12 13
ES
LS
smoothest
leveled
S Curve
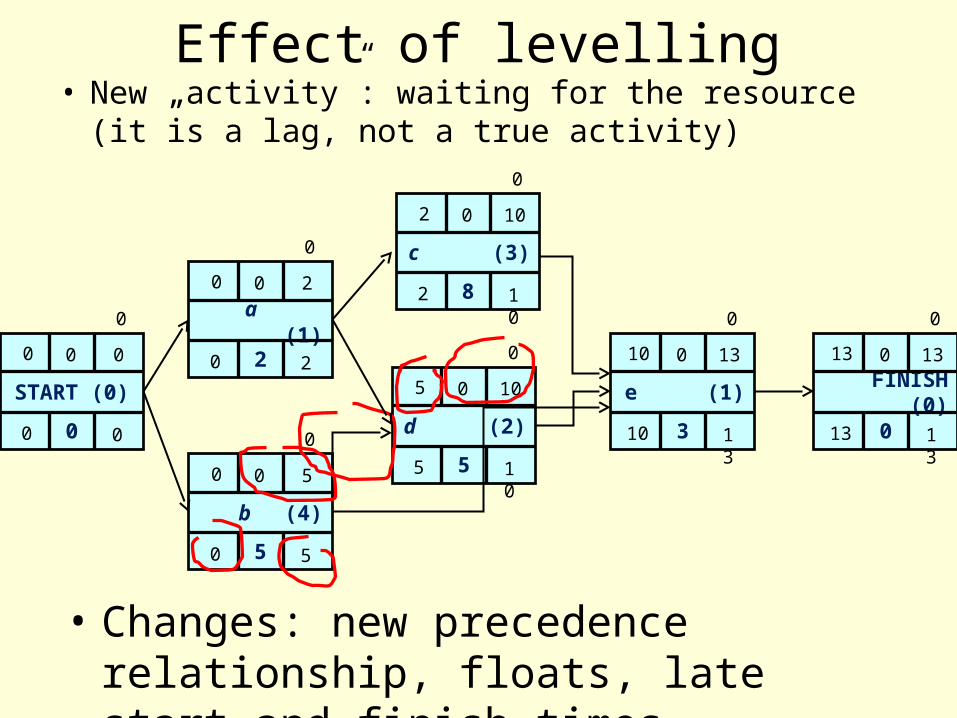
Effect of levelling• New „activity”: waiting for the resource
(it is a lag, not a true activity)
START (0)
0 00
0 00
0
e (1)
10 130
10 133
0
d (2)
5 100
5 105
0
c (3)
2 100
2 108
0
b (4)
0 50
0 55
0
a (1)
0 20
0 22
0
FINISH (0)
13 130
13 130
0
• Changes: new precedence relationship, floats, late start and finish times

Optional homework
• Hypothetical project resource analysis and planning (4*5pts):– Resource need per activity– Loading chart– Network diagram– Smoothing with resource loading charts
Copyright © 2010 Pearson Education, Inc. Publishing as Prentice Hall 12-28