resource assessment and forest management plan for … · resource assessment and forest management...
TRANSCRIPT

Resource Assessment and Forest Management Plan for the CITES-Listed
Species Cedrela Odorata (red cedar) In Guyana
Final Draft
Peter van der Hout
Consultant in Forest Resource Management
Report prepared a part of ITTO Project:
Prepared for the Guyana Forestry Commission within the framework of the ITTO-project “Enhancing
the Sustainable Management and Commercial Utilisation of the CITES-Listed Species Cedrela
Odorata (Red Cedar) In Guyana”, TMT-SPD 014/13 Rev. 1 (M)
27 October 2015

i
Executive Summary
Background to the report
This report provides an overview of the population size, distribution, stand density, size structure,
regeneration dynamics and possible strategy for the sustainable management of the timber species
Cedrela odorata L. in Guyana. In Guyana the species is known under the common name red cedar.
Cedrela odorata is deciduous, strongly light-demanding, behaves as a long-lived pioneer (Cintron,
1990; Lemmens, 2008) and is naturally distributed from northern Mexico throughout lowland
Central America and South America to northern Argentina and most Caribbean Islands (Lamb, 1968;
Pennington, 1981; Cintron, 1990). In its natural area of distribution Cedrela odorata occurs in both
primary and secondary, evergreen to semi-deciduous lowland or lower montane rain forest
(Pennington, 1981; Patiño, 1997). In Central America and Mexico it only occurs on non-flooded sites,
often on well-drained limestone (Cintron, 1990; Lamb, 1968). In Amazonian Peru Bolivia and Brazil, it
is mainly found on seasonally flooded lowland along watercourses (Gentry, no date; Pennington,
2006, cited in CITES, 2007) and in the transitional zone between evergreen forest and savannah
forest (cf Brown et al, 2003). In Guyana, the species is rare to locally occasional in Mora forest along
creeks, seasonal forest and poor types of rain forest (Fanshawe 1961).
Although C. odorata is widespread, it is seldom common - individuals of this species are few in
number and are widely dispersed. The high value of the species, the decrease in the supply of other
timber species (e.g. Swietenia macrophylla King), and the vulnerability of C. odorata to
overharvesting due to its natural history, population dynamics, and habitat preferences have
contributed to growing signs of depletion in many parts of its range (Navarro-Cerrillo, 2013).
In 1998 Cedrela odorata was assessed as globally Vulnerable in the IUCN Red List and it has been
listed in Appendix III of CITES since 2001. The species was subsequently proposed for listing in
Appendix II of CITES in 2007. Appendix II listing requires non-detriment findings (NDF) that ensure
that export will not be detrimental to the survival of the species being traded. NDFs should be based
on a comprehensive review of available information on the population status, distribution,
population trend, harvest, and other biological and ecological factors, as appropriate, and trade
information relating to the species concerned. Because such information was lacking for nearly all
range states, an Action Plan was adopted to complete knowledge on the status of conservation of,
trade in and sustainable use of Cedrela odorata.
This report aims to complete and update the available information on Cedrela odorata in Guyana,
using a variety of existing, available information sources on the distribution, population structure
and production. The main sources of information are formed by national forest inventories and
forest inventories and stock surveys carried out by forest concessionaires. Another source of
information is formed by production records.
Geographic distribution within Guyana
The FAO-supported Forest Industry Development Survey (FIDS) was undertaken as a national
inventory during 1969-73. As part the FAO-FIDS reconnaissance surveys, detailed forest type maps
were prepared using aerial photography interpretation (De Milde & De Groot, 1970a-e and g). In
2001, a vegetation map of Guyana was produced by Hans ter Steege (Ter Steege, 2001a), developed

ii
from a variety of sources including satellite imagery, a digital elevation model, soil maps, research
plots and the FAO-FIDS forest inventory plots. The CIDA-financed Interim Forestry Project (IFP) was
undertaken during 1990-95. During 2000-2002 the Guyana Forestry Commission developed its own
inventory methodology, which was subsequently recommended for State Forest Exploratory Permits
(SFEPs) and companies conducting management level inventories (MLI) for their long-term forest
management plans. From 2006 onwards, GFC has conducted such MLIs itself to obtain information
on the stocking of State Forest Permission areas targeted to guide decisions on their (re)allocation.
Red cedar was only very occasionally encountered during the abovementioned forest inventory
programmes. Only 15 trees showed up in 13 out of 4,609 MLI sample plots; 5 trees in 5 out of 1,016
FAO-FIDs plots; and 6 trees in 6 out of 7,992 IFP sample points.
Large forest concession [Timber Sales Agreements (TSAs)] holders are required to conduct a
systematic 100% pre-harvest inventory (stock survey) covering their annual operating area. Such
stock surveys over the period 2010-2014 were assessed for occurrence of red cedar. The species was
encountered in 11 out of the 23 active TSAs. In total, 393 red cedar trees were found in 224 out of
2728 blocks that were surveyed.
In Guyana, red cedar occurs widely from the North West to the South East of the country.
Occurrence was confirmed for about three quarters of Guyana’s territory according to the national
forest inventories, stock surveys and production records. Its potential geographic distribution covers
nearly the entire country with the exception of the coastal lowlands, the Rupununi and other
savannahs and the Pakaraima mountain region based on the geographic distribution of the forest
types in which it appears to occur.
Site preference and local distribution
The species does not appear to have a specific preference for a certain forest or soil type; it is
reported to occur on many soil types from pegasse, to clay, to brown sand and white sand and in
many forest types such as swamp forest, mixed forest on flat to undulating, undulating to hilly,
deeply dissected terrain and steep high hills, and in wallaba forest on white sand soils.
Forest and soil typing of the inventory plots may have been based on the general area and small-
scale ecotope differences, e.g. along small creeks and seasonal streams, may have been overlooked
when assessing the plot characteristics. The same applies to forest typing based on the FAO-FIDS
regional forest type map and the national vegetation map, which typing is rather course and ignores
small-scale ecotope differences.
Local distribution of red cedar was examined by plotting 249 red cedar trees, enumerated in 142
pre-harvest inventory blocks in the Barama Co. Ltd. concession, on 1:50,000 scale topographic map
sheets. It appeared that the local distribution of the species commonly traces creeks and that 52% of
the 249 enumerated red cedar trees were located in flood plains, 42% of the trees located within
100 m distance of a creek and 22% within 50 m distance. It was further revealed that 52% of the 249
enumerated red cedar trees were located in floodplains and that 47% of the trees were encountered
in mixed Forest, 42% in mora Forest, 9% in wallaba Forest and 2% in greenheart Forest.
The depiction of watercourses on the 1:50,000 map sheets are based on aerial photo interpretation
and forms an approximation of their true course, while small creeks are usually not depicted. Creeks,

iii
small streams and gullies are normally mapped during the stock survey exercise and 23 such detailed
stock maps were available. In these 23 blocks, 35 red cedar trees had been enumerated, out of
which trees 20% were located within 10 m distance of a creek and 51% within 10 m distance of a
gully or seasonal stream. Another 12% was located within 20 m distance of a creek.
At a local scale, the species thus appears to occur mainly in mixed and mora forest along
watercourses; particularly gullies and seasonal streams, but also larger creeks. It is estimated that
20% of the trees are within a 10 m distance of a creek and another 10% within a 20 m distance,
while 63% grow within 20 m of a gully or seasonal stream. This has crucial implications for the
management of the species because trees may not be harvested within riparian buffer zones along
creeks according to Guyana’s Code of practice (2014) and hence an estimated 20% of the red cedar
population is apparently excluded from harvesting.
Rarity of red cedar in Guyana
Red cedar appears to be rare in Guyana (< 1 tree/ha), and according to the studied stock surveys the
species is even very rare (< 1 tree per 100 ha). According to the three national forest inventories, the
estimated average density of red cedar ≥ 10 cm dbh ranges from 1.7 trees per 100 ha (FAO-FIDS) to
8.5 trees per 100 ha (MLI). The estimated density of trees ≥ 35 cm dbh is estimated to range from
0.9 trees per 100 ha (IFP) to 2.0 trees per 100 ha (MLI). Stock surveys conducted between 2010 and
2014 suggest an average of 1.7 trees per 100 ha (maximum 7 trees per 100 ha) in the blocks where
the species was encountered.
The estimated volume of red cedar ≥ 35 cm dbh ranges from 2.4 m3 per 100 ha (FAO-FIDS) to 6.0 m3
per 100 ha (MLI) according to the national forest inventories. An average volume of 8.7 m3 per 100-
ha block (maximum of 37.8 m3 per 100-ha block) was reported for the 246 blocks where red Cedar
was encountered during 2010-14.
Occurrence of red cedar was only reported in 8% of the blocks that were surveyed during 2010-
2014, but the fact that a species is not recorded in a certain concession does not necessarily mean
that the species does not occur in that concession. Neither concessionaires nor their inventory
teams appear to be familiar with the species. Not all concessionaires include the species on their
species list for 100% pre-harvest inventory, while many inventory crews do not recognize the
species. The latter was clearly indicated by a small verification exercise of seven blocks in five large
concessions. In three concessions other species had been mistakenly identified as red cedar, while in
four blocks in two other concessions, where three and twelve harvestable red cedar trees
respectively were recorded during stock surveys, the species was correctly identified but the
verification exercise also showed that two harvestable red cedar trees were overlooked during stock
surveys in each concession.
The most reliable stock survey seems to be the one carried out by Barama Co. Ltd., where 249 red
cedar trees were found in 142 out of the 1033 blocks (14%) that were surveyed over the period
2010-14; indicating a density of 0.24 tree per 100 ha. As the verification exercise showed that two
trees had been overlooked in two blocks, the estimated density was adjusted upward to 0.30 trees ≥
40 cm dbh per 100 ha. Application of a net form height factor of 12.61 yields an initial volume at first
harvest (MCDL =40 cm dbh; Year 0) of 1.49 m3 per 100 ha.
iv
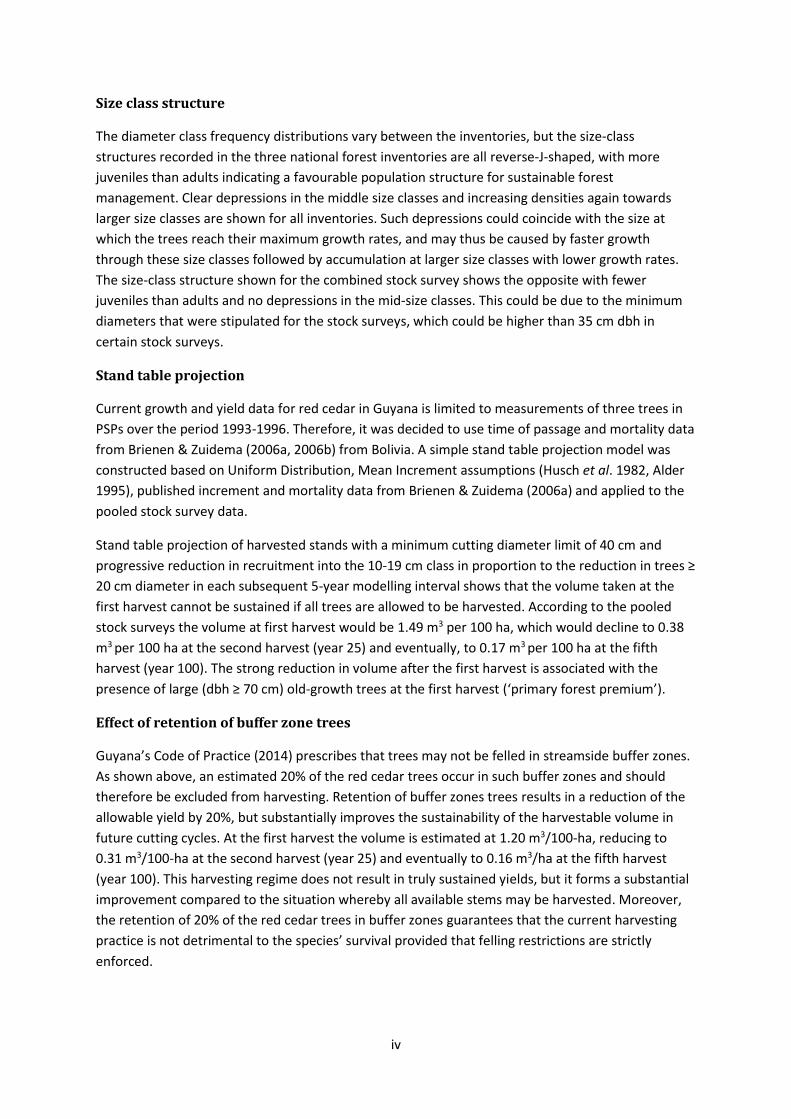
Size class structure
The diameter class frequency distributions vary between the inventories, but the size-class
structures recorded in the three national forest inventories are all reverse-J-shaped, with more
juveniles than adults indicating a favourable population structure for sustainable forest
management. Clear depressions in the middle size classes and increasing densities again towards
larger size classes are shown for all inventories. Such depressions could coincide with the size at
which the trees reach their maximum growth rates, and may thus be caused by faster growth
through these size classes followed by accumulation at larger size classes with lower growth rates.
The size-class structure shown for the combined stock survey shows the opposite with fewer
juveniles than adults and no depressions in the mid-size classes. This could be due to the minimum
diameters that were stipulated for the stock surveys, which could be higher than 35 cm dbh in
certain stock surveys.
Stand table projection
Current growth and yield data for red cedar in Guyana is limited to measurements of three trees in
PSPs over the period 1993-1996. Therefore, it was decided to use time of passage and mortality data
from Brienen & Zuidema (2006a, 2006b) from Bolivia. A simple stand table projection model was
constructed based on Uniform Distribution, Mean Increment assumptions (Husch et al. 1982, Alder
1995), published increment and mortality data from Brienen & Zuidema (2006a) and applied to the
pooled stock survey data.
Stand table projection of harvested stands with a minimum cutting diameter limit of 40 cm and
progressive reduction in recruitment into the 10-19 cm class in proportion to the reduction in trees ≥
20 cm diameter in each subsequent 5-year modelling interval shows that the volume taken at the
first harvest cannot be sustained if all trees are allowed to be harvested. According to the pooled
stock surveys the volume at first harvest would be 1.49 m3 per 100 ha, which would decline to 0.38
m3 per 100 ha at the second harvest (year 25) and eventually, to 0.17 m3 per 100 ha at the fifth
harvest (year 100). The strong reduction in volume after the first harvest is associated with the
presence of large (dbh ≥ 70 cm) old-growth trees at the first harvest (‘primary forest premium’).
Effect of retention of buffer zone trees
Guyana’s Code of Practice (2014) prescribes that trees may not be felled in streamside buffer zones.
As shown above, an estimated 20% of the red cedar trees occur in such buffer zones and should
therefore be excluded from harvesting. Retention of buffer zones trees results in a reduction of the
allowable yield by 20%, but substantially improves the sustainability of the harvestable volume in
future cutting cycles. At the first harvest the volume is estimated at 1.20 m3/100-ha, reducing to
0.31 m3/100-ha at the second harvest (year 25) and eventually to 0.16 m3/ha at the fifth harvest
(year 100). This harvesting regime does not result in truly sustained yields, but it forms a substantial
improvement compared to the situation whereby all available stems may be harvested. Moreover,
the retention of 20% of the red cedar trees in buffer zones guarantees that the current harvesting
practice is not detrimental to the species’ survival provided that felling restrictions are strictly
enforced.

v
Effect of raising the minimum cutting diameter limit
The legal minimum cutting diameter limit (MCDL) for red cedar in Guyana is 34 cm dbh. From a
silvicultural point of view, the optimum minimum cutting diameter would rather be close to 60 cm
dbh, because the mean annual increment (MAI) rate of the species is reported peak after the tree
has reached this size. If the MCDL is raised to 60 cm dbh sustained yield levels are being approached.
At the first harvest the volume will be reduced to 0.94 m3/100-ha (78% compared to a MCDL of 40
cm), but harvests will be higher at the second harvest (year 25); i.e. 0.52 m3/100-ha (169%), and
eventually 0.28 m3/ha (176%) at the fifth harvest (year 100).
Effect of recruitment rate assumptions
Red cedar is strongly light-demanding, regenerates well in forest clearings, on abandoned
agricultural plots and following disturbances such as forest fires and hurricanes and is therefore
regarded as a ‘long-lived’ pioneer. It is thus plausible that recruitment does not decrease after
removing parent trees at each harvest. Stand table projection assuming that recruitment rates
remain constant suggests that sustained yields can be achieved within two 25-year cutting cycles. In
point of fact recruitment rates will lie somewhere between a constant rate and a proportionately
decreasing rate. Sustained yield levels in a 25-year cutting cycle, as determined by the yield after the
third cutting cycle when the modelled stand structure stabilizes, would therefore lie somewhere
between 0.24 and 0.31 m3 per 100 hectare in case of a MCDL of 40 cm dbh and between 0.36 and
0.43 m3 per 100 hectare in case of a MCDL of 60 cm dbh.
Allowable red cedar yield
Based on the observation that the species occurs in all forest types along watercourses; particularly
along gullies and seasonal streams it can safely be assumed that the species occurs in all forest
concessions. The annual coupe of all large concessions (TSAs and WCLs) amounts to roughly 140,000
ha and the long-term annual sustained yield for these concessions would lie between 350 and 450
m3 per year. Raising the MCDL to the silviculturally desirable 60 cm dbh would result in a long-term
sustained yield between 500 and 600 m3 per year.
Small concessions (SFPs) are managed per log quota and not per an annual coupe. For the purpose
of assessing sustained yield levels, the annual coupe for small concessions is estimated at roughly
64,000 ha in lieu of log quota. Under the current forest management regulations with a practical
MCDL of 40 cm and prohibiting harvesting in riparian buffer zones, long-term annual sustained yield
for small concessions would lie somewhere between 150 and 200 m3 per year. Raising the MCDL to
the silviculturally desirable 60 cm dbh would result in a long-term annual sustained yield of between
250 and 300 m3 per year.
Produce stemming from Amerindian Reservations and Private Properties is not subject to maximum
cut restrictions because these lands do not form part of the State Forest Estate and are not managed
by the GFC, but sustained yield for the Amerindian reservations is estimated at 200-250 m3 per year.
The total area of available productive forest - both allocated State Forest and Amerindian
reservations - is roughly 9.0 million hectares. Applying a 25 year cutting cycle would produce a
theoretic national annual coupe of 288,000 hectares. Under the current forest management
regulations with a practical MCDL of 40 cm and prohibiting harvesting in riparian buffer zones for

vi
State Forest and assuming similar practices in Amerindian reservations, long-term annual sustained
yield would lie between 700 and 900 m3 per year. Raising the MCDL to the silviculturally desirable 60
cm dbh would result in a long-term annual sustained yield between 1,050 and 1,250 m3 per year.
Production levels in comparison with allowable yield
Over the period 2007-14, red cedar production amounted to 641 m3 per year on average and is thus
92% of the lower estimate of the sustained yield of 700 m3 per year and 71% of the higher estimate
of the sustained yield of 900 m3 per year. Red cedar is principally sourced from small concessions
where harvests are three times the lower sustained yield estimate and 2.5 times the higher
estimate. Large concessions harvest only 12-16% of their sustained yield, while production from
Amerindian Village Lands does not exceed 34-43% of the sustained yield. Sustainable management
of red cedar hence does not appear to be threatened under current forest regulations and
harvesting practice in large concessions and Amerindian reservations, but is possibly being
overharvested in small concessions. There appears to be scope for intensification of production from
large concessions.
Conclusions
Although red cedar is very rare in Guyana, current harvesting regimes (and export levels) do
not appear to be detrimental to the survival of the species, because a considerable
proportion of the population (20%) occurs along streamside buffer zones, where logging is
prohibited in Guyana, and trees are protected. Secondly, harvest levels, about 640 m3 per
year on average, are below the estimated national sustained yield level, which lies close to
800 m3 per year.
Under the current forest management regulations and harvesting practice there appear to
be no clear grounds for including Guyana’s red cedar population in CITES Appendix III.
Production of red cedar from large concessions is low and there appears to be an
opportunity to expand production from these concessions. This is likely related to poor
knowledge of the species among concessionaires and inventory teams. Large
concessionaires do not seek specialty markets for red cedar but are reported to sell the
species as mixed hardwood; i.e. below its intrinsic value. Better promotion of possibly
attractive markets for the species and training of inventory teams in identification of the
species are recommended.
Finally, red cedar is reported to attain maximum diameter increment rates through the
diameter class 40-60 cm dbh. Sustainable yield levels can therefore be increased by raising
the minimum cutting diameter limit (MCDL) to 60 cm dbh; long-term annual sustained yield
is currently estimated to lie close to 800 m3 per year with a MCDL of 40 cm, while with a
MCDL of 60 cm dbh a long-term sustained yield of around 1,150 m3 per year seems
achievable.

vii
Contents
1 Introduction .................................................................................................................................... 1
1.1 Terms of Reference ................................................................................................................. 1
1.2 Background ............................................................................................................................. 1
1.3 Red cedar ................................................................................................................................ 2
1.4 International conservation community concerns ................................................................... 3
1.5 Outline of the report ............................................................................................................... 4
2 Methodology ................................................................................................................................... 5
2.1 Information sources ................................................................................................................ 5
2.2 Geographic distribution .......................................................................................................... 6
2.3 Density and size class frequency distribution ......................................................................... 6
2.4 Sustainability of current management practices .................................................................... 6
3 Overview of CITES ........................................................................................................................... 7
3.1 The CITES convention .............................................................................................................. 7
3.2 The CITES Appendices ............................................................................................................. 7
3.3 CITES export permits ............................................................................................................... 7
3.4 Non-Detriment Finding ........................................................................................................... 8
3.5 Trade records .......................................................................................................................... 8
3.6 Timber species ........................................................................................................................ 8
3.7 Inconsistent implementation of Appendix-III timber listings ................................................. 8
3.8 Current listing of Cedrela odorata .......................................................................................... 9
4 Red Cedar: Species characteristics ................................................................................................ 10
4.1 Taxonomy .............................................................................................................................. 10
4.2 Common names .................................................................................................................... 10
4.2.1 Commercial names ....................................................................................................... 10
4.3 Geographic distribution ........................................................................................................ 11
4.4 Site preferences .................................................................................................................... 11
4.5 Botanical Description ............................................................................................................ 12
4.5.1 Field characteristics....................................................................................................... 12
4.5.2 Leaves ............................................................................................................................ 12
4.5.3 Flowers .......................................................................................................................... 13
4.5.4 Fruits and seeds ............................................................................................................ 14
4.6 Natural history and population dynamics............................................................................. 15

viii
4.7 Other botanical information ................................................................................................. 17
4.8 Wood Properties ................................................................................................................... 17
4.9 Technological characteristics ................................................................................................ 17
4.10 Processing ............................................................................................................................. 18
4.10.1 Workability .................................................................................................................... 18
4.10.2 Natural durability .......................................................................................................... 18
4.11 Uses ....................................................................................................................................... 18
4.12 Population trends.................................................................................................................. 18
4.13 Trade ..................................................................................................................................... 19
4.13.1 Trading prices ................................................................................................................ 19
4.13.2 Global trade patterns .................................................................................................... 19
4.13.3 Export from Guyana ...................................................................................................... 20
5 Geographic distribution of Red Cedar in Guyana ......................................................................... 22
5.1 Vegetation maps ................................................................................................................... 22
5.2 Forest inventories ................................................................................................................. 24
5.2.1 Geographic distribution of red cedar based on national forest inventories ................ 25
5.3 Land use allocation in Guyana .............................................................................................. 28
5.3.1 Geographic distribution of red cedar based on stock surveys in TSAs ......................... 29
5.4 Geographic distribution of red cedar based on production records .................................... 32
5.5 Proven and possible geographic distribution of red cedar ................................................... 34
5.5.1 Distribution of red cedar at local scale – the ecotope level. ........................................ 36
6 Density and size class frequency distribution ............................................................................... 40
6.1 Density in stock surveys and forest inventories ................................................................... 40
6.1.1 Interim Forestry Project inventory (IFP) ....................................................................... 40
6.1.2 Management level inventories (MLI) ............................................................................ 40
6.1.3 FAO-FIDS forest reconnaissance surveys ...................................................................... 41
6.1.4 100% pre-harvest inventories (stock surveys) .............................................................. 41
6.1.5 Estimated density of Red Cedar trees in Guyana.......................................................... 42
6.2 Size class frequency distribution in stock surveys and forest inventories ............................ 42
6.3 Volumes of red cedar in stock surveys and forest inventories ............................................. 45
6.3.1 Volumes in national forest inventories ......................................................................... 45
6.3.2 Volumes in 100% pre-harvest inventories .................................................................... 46
7 Regeneration dynamics and sustainable harvest levels ............................................................... 47
7.1 Growth and yield of red cedar in Guyana ............................................................................. 47
ix
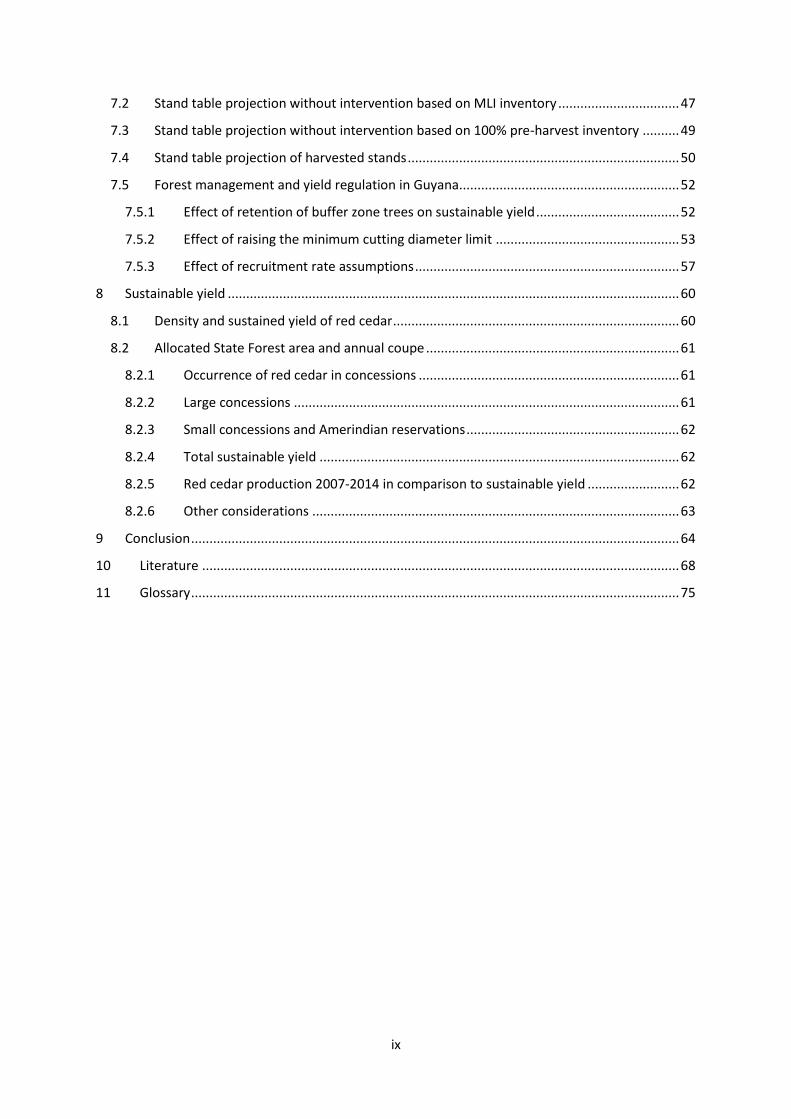
7.2 Stand table projection without intervention based on MLI inventory ................................. 47
7.3 Stand table projection without intervention based on 100% pre-harvest inventory .......... 49
7.4 Stand table projection of harvested stands .......................................................................... 50
7.5 Forest management and yield regulation in Guyana ............................................................ 52
7.5.1 Effect of retention of buffer zone trees on sustainable yield ....................................... 52
7.5.2 Effect of raising the minimum cutting diameter limit .................................................. 53
7.5.3 Effect of recruitment rate assumptions ........................................................................ 57
8 Sustainable yield ........................................................................................................................... 60
8.1 Density and sustained yield of red cedar .............................................................................. 60
8.2 Allocated State Forest area and annual coupe ..................................................................... 61
8.2.1 Occurrence of red cedar in concessions ....................................................................... 61
8.2.2 Large concessions ......................................................................................................... 61
8.2.3 Small concessions and Amerindian reservations .......................................................... 62
8.2.4 Total sustainable yield .................................................................................................. 62
8.2.5 Red cedar production 2007-2014 in comparison to sustainable yield ......................... 62
8.2.6 Other considerations .................................................................................................... 63
9 Conclusion ..................................................................................................................................... 64
10 Literature .................................................................................................................................. 68
11 Glossary ..................................................................................................................................... 75
x
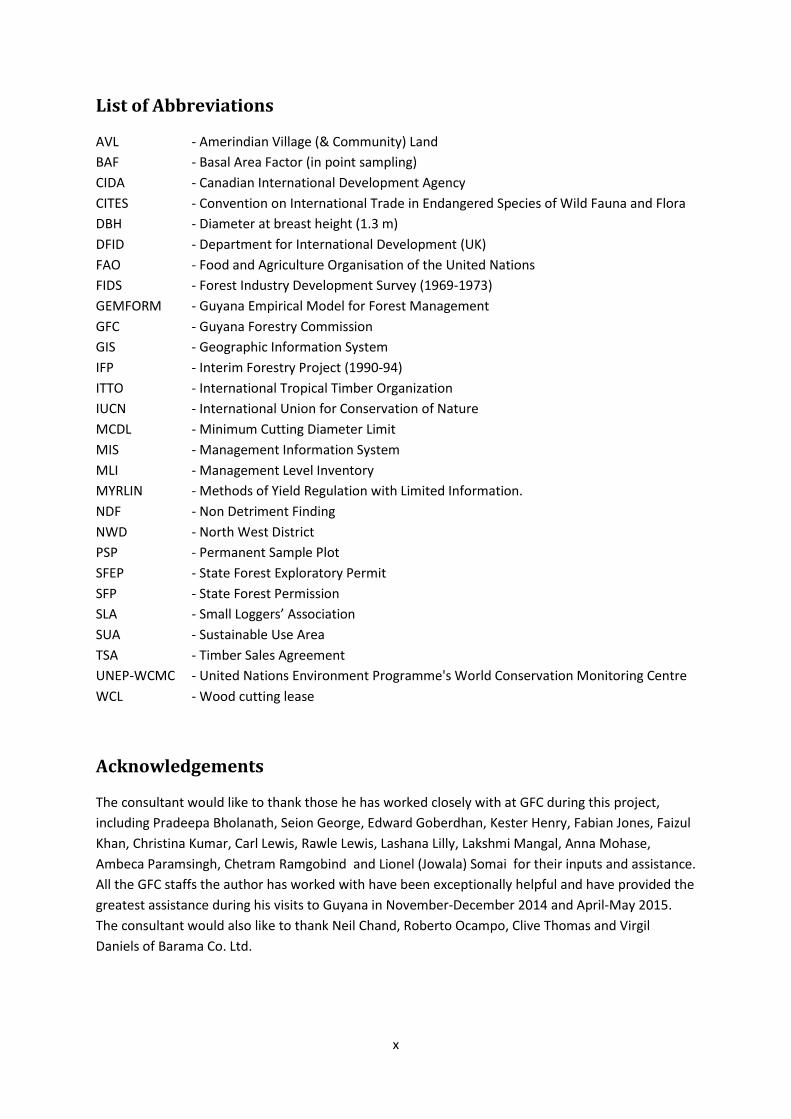
List of Abbreviations
AVL - Amerindian Village (& Community) Land
BAF - Basal Area Factor (in point sampling)
CIDA - Canadian International Development Agency
CITES - Convention on International Trade in Endangered Species of Wild Fauna and Flora
DBH - Diameter at breast height (1.3 m)
DFID - Department for International Development (UK)
FAO - Food and Agriculture Organisation of the United Nations
FIDS - Forest Industry Development Survey (1969-1973)
GEMFORM - Guyana Empirical Model for Forest Management
GFC - Guyana Forestry Commission
GIS - Geographic Information System
IFP - Interim Forestry Project (1990-94)
ITTO - International Tropical Timber Organization
IUCN - International Union for Conservation of Nature
MCDL - Minimum Cutting Diameter Limit
MIS - Management Information System
MLI - Management Level Inventory
MYRLIN - Methods of Yield Regulation with Limited Information.
NDF - Non Detriment Finding
NWD - North West District
PSP - Permanent Sample Plot
SFEP - State Forest Exploratory Permit
SFP - State Forest Permission
SLA - Small Loggers’ Association
SUA - Sustainable Use Area
TSA - Timber Sales Agreement
UNEP-WCMC - United Nations Environment Programme's World Conservation Monitoring Centre
WCL - Wood cutting lease
Acknowledgements
The consultant would like to thank those he has worked closely with at GFC during this project,
including Pradeepa Bholanath, Seion George, Edward Goberdhan, Kester Henry, Fabian Jones, Faizul
Khan, Christina Kumar, Carl Lewis, Rawle Lewis, Lashana Lilly, Lakshmi Mangal, Anna Mohase,
Ambeca Paramsingh, Chetram Ramgobind and Lionel (Jowala) Somai for their inputs and assistance.
All the GFC staffs the author has worked with have been exceptionally helpful and have provided the
greatest assistance during his visits to Guyana in November-December 2014 and April-May 2015.
The consultant would also like to thank Neil Chand, Roberto Ocampo, Clive Thomas and Virgil
Daniels of Barama Co. Ltd.

1
1 Introduction
1.1 Terms of Reference
The consultant was contracted to work with GFC to enhance the sustainable management and
commercial utilisation of the CITES-listed species Cedrela odorata (red cedar) in Guyana, a small
project within the ITTO thematic programme on trade and market transparency (TMT). The ITTO
thematic programme on trade and market transparency supports among others the ITTO-CITES
programme. The project number of this small project is TMT-SPD 014/13 Rev.1 (M).
The Terms of Reference for this work can be summarized as involving the following objectives:
1. Produce a resource assessment and forest management plan for red cedar
2. A reporting framework for CITES timber exports
3. Support capacity building on CITES and its implication for the forest sector in Guyana
The first objective concerns:
a) the design and execution of a resource assessment for red cedar in Guyana; and
b) developing a forest management plan for red cedar
The second objective concerns:
a) developing a protocol framework for international trade of red cedar;
b) developing markets for red cedar locally and internationally; and
c) compiling market information and trade statistics on red cedar.
The third objective concerns:
a) supporting the Training Consultant in developing and executing a stakeholder awareness
programme and a training programme on CITES and its implication for the forest sector in
Guyana;
b) assist the GFC in consolidating information on timber utilization; and
c) supporting interactions between local partners and international contacts at level of US, EU
and CITES.
This report is the consultant’s first delivery within the framework of a project by the Guyana Forestry
Commission to enhance the sustainable management and commercial utilisation of the CITES-listed
species Cedrela odorata (red cedar) in Guyana.
1.2 Background
The ITTO-CITES programme provides specific assistance to countries throughout the tropics to
design forest management plans, forest inventories, provide guidelines and case studies for making
“Non Detriment Findings” (NDFs) for CITES listed tree species, and to develop and disseminate tools
2
for timber identification with the overall objective to ensure that international trade in CITES-listed
timber species is consistent with their sustainable management and conservation1.
This report provides an overview of the population size, distribution, stand density, size structure,
regeneration dynamics and possible strategies for the sustainable management of the timber
species Cedrela odorata in Guyana. The species is listed in CITES Appendix III. In Guyana the species
is known under the common name red cedar. Red cedar produces a commodity timber traditionally
traded in high volumes, but only small volumes are traded internationally from Guyana.
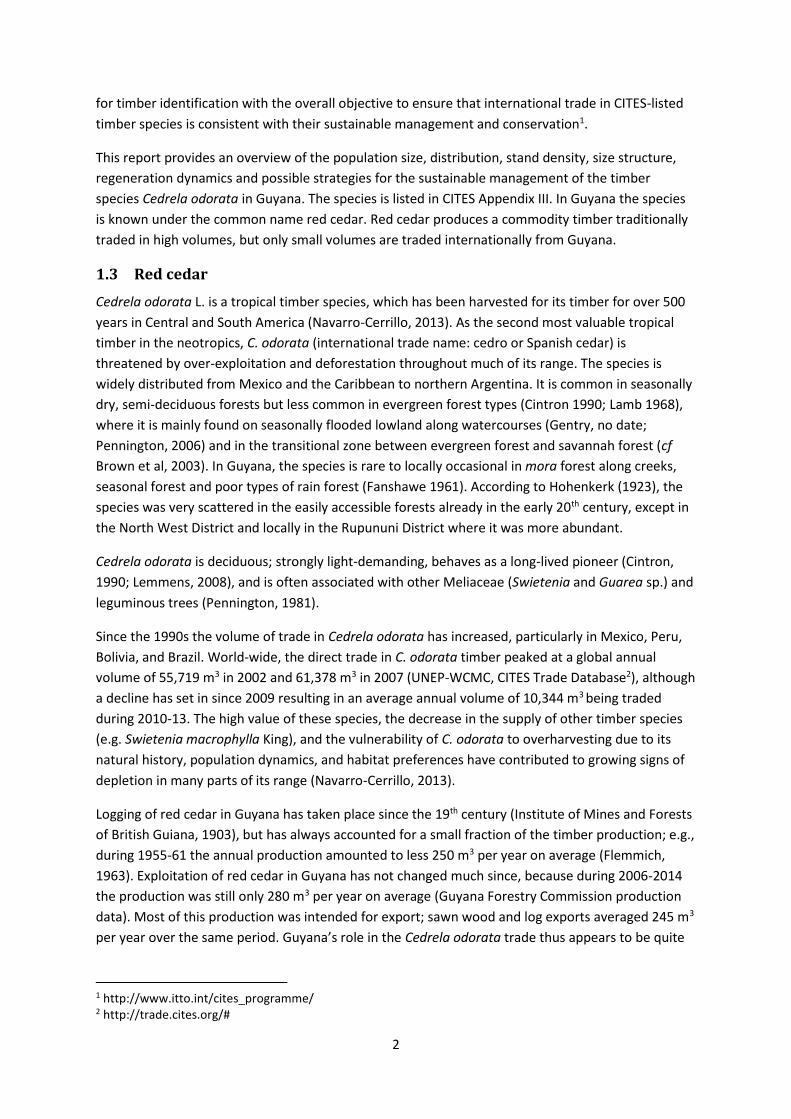
1.3 Red cedar
Cedrela odorata L. is a tropical timber species, which has been harvested for its timber for over 500
years in Central and South America (Navarro-Cerrillo, 2013). As the second most valuable tropical
timber in the neotropics, C. odorata (international trade name: cedro or Spanish cedar) is
threatened by over-exploitation and deforestation throughout much of its range. The species is
widely distributed from Mexico and the Caribbean to northern Argentina. It is common in seasonally
dry, semi-deciduous forests but less common in evergreen forest types (Cintron 1990; Lamb 1968),
where it is mainly found on seasonally flooded lowland along watercourses (Gentry, no date;
Pennington, 2006) and in the transitional zone between evergreen forest and savannah forest (cf
Brown et al, 2003). In Guyana, the species is rare to locally occasional in mora forest along creeks,
seasonal forest and poor types of rain forest (Fanshawe 1961). According to Hohenkerk (1923), the
species was very scattered in the easily accessible forests already in the early 20th century, except in
the North West District and locally in the Rupununi District where it was more abundant.
Cedrela odorata is deciduous; strongly light-demanding, behaves as a long-lived pioneer (Cintron,
1990; Lemmens, 2008), and is often associated with other Meliaceae (Swietenia and Guarea sp.) and
leguminous trees (Pennington, 1981).
Since the 1990s the volume of trade in Cedrela odorata has increased, particularly in Mexico, Peru,
Bolivia, and Brazil. World-wide, the direct trade in C. odorata timber peaked at a global annual
volume of 55,719 m3 in 2002 and 61,378 m3 in 2007 (UNEP-WCMC, CITES Trade Database2), although
a decline has set in since 2009 resulting in an average annual volume of 10,344 m3 being traded
during 2010-13. The high value of these species, the decrease in the supply of other timber species
(e.g. Swietenia macrophylla King), and the vulnerability of C. odorata to overharvesting due to its
natural history, population dynamics, and habitat preferences have contributed to growing signs of
depletion in many parts of its range (Navarro-Cerrillo, 2013).
Logging of red cedar in Guyana has taken place since the 19th century (Institute of Mines and Forests
of British Guiana, 1903), but has always accounted for a small fraction of the timber production; e.g.,
during 1955-61 the annual production amounted to less 250 m3 per year on average (Flemmich,
1963). Exploitation of red cedar in Guyana has not changed much since, because during 2006-2014
the production was still only 280 m3 per year on average (Guyana Forestry Commission production
data). Most of this production was intended for export; sawn wood and log exports averaged 245 m3
per year over the same period. Guyana’s role in the Cedrela odorata trade thus appears to be quite
1 http://www.itto.int/cites_programme/ 2 http://trade.cites.org/#

3
limited compared to a reported global average of approximately 24,000 m3/yr. over the same
period.
1.4 International conservation community concerns
In 1998 Cedrela odorata was assessed as globally Vulnerable in the IUCN Red List although this
assessment needs updating3. The species has been listed in Appendix III of CITES since 2001. CITES
(the Convention on International Trade in Endangered Species of Wild Fauna and Flora) is an
international agreement between governments that was conceived in 1973 to safeguard certain
species from over-exploitation by regulating international trade in specimens of wild animals and
plants whose survival is possibly threatened. Initially, commercial timber species were poorly
represented in the CITES Appendices; restricted to e.g. Caryocar costaricense (ajo or costus) and
Swietenia humilis (Pacific Coast mahogany) in 1975; Swietenia mahagoni (West-Indian mahogany)
and Pericopsis elata (afrormosia) in 1992; and Pterocarpus santalinus (red sandalwood), Swietenia
macrophylla (big-leaf mahogany) and Prunus africana (African cherry) in 1995. However, since the
late 1990s there has been an increased focus on timber.
In 1998, the CITES Management Authority of the Netherlands published a document titled
Contribution to an evaluation of tree species using the new CITES listing criteria. This comprehensive
study, compiled by UNEP-WCMC, reviewed the conservation and trade status of 255 tree species
that were viewed as globally threatened as a result of population decline through exploitation.
Subsequently, a number of regional workshops on tree conservation were undertaken between
2004 and 2006. On the basis of recommendations from the Mesoamerican workshop (Gillett and
Ferriss 2005), the CITES Plants Committee agreed to consider reviewing the listing of three species;
i.e., Cedrela odorata, Dalbergia retusa and Dalbergia stevensonii. The species were subsequently
proposed for listing in Appendix II of CITES by Germany at the 14th CoP meeting in 2007, based on a
report by the CITES Management Authority of the Netherlands, in collaboration with UNEP-WCMC
(CITES, 2007)4.
Appendix II requires that an export permit shall only be granted when a scientific authority of the
range State has issued a non-detriment finding (NDF) that ensures that such export will not be
detrimental to the survival of the species being traded. An NDF should be based on the
comprehensive review of available information on the population status, distribution, population
trend, harvest, and other biological and ecological factors, as appropriate, and trade information
relating to the species concerned. Because such information was lacking for nearly all range states,
an Action Plan was adopted to complete knowledge on the conservation status of, trade in and
sustainable use of Cedrela odorata, Dalbergia retusa, Dalbergia granadillo and Dalbergia stevensonii.
The 2007 proposal to list Cedrela odorata in CITES Appendix II was unanimously opposed by all 30
CITES Range States and subsequently withdrawn in 2013. However, the action plan to collect trade
and conservation status data on the species was maintained and updated; range states are now
urged to consider the inclusion, if necessary, of their populations of Cedrela odorata in Appendix III
3 IUCN (2014), ‘Cedrela odorata’, in the IUCN Red List of Threatened Species, Version 2014.3; assessor: Americas Regional Workshop (Conservation & Sustainable Management of Trees, Costa Rica, November 1996); date assessed: 1998; iucnredlist.org 4 http://cites.org/sites/default/files/eng/cop/14/prop/E14-P33.pdf

4
and ensure the implementation and enforcement of CITES with regard to those species in that
Appendix.
The implementation of the Action plan for the four species appeared to be quite onerous for range
States and CITES approached ITTO to support future work on Cedrela odorata and other threatened
timber species. A substantial number of projects related to the ecology, distribution, supply and
strategies for the sustainable management of CITES listed species have been initiated since 2008
with support by the ITTO-CITES programme for implementing CITES listings of tropical timber species.
The main species covered to date are Pericopsis elata (afrormosia or assamela), Prunus africana
(African cherry) and Diospyros spp. (ebony) of Central Africa and Madagascar; Swietenia macrophylla
(big-leaf mahogany), Cedrela odorata and other Cedrela spp. (cedro or Spanish cedar) in Latin
America; as well as Dalbergia spp. (rosewood) in both Africa and Latin America; Gonystylus spp.
(ramin) and Aquilaria spp./Gyrinops spp. (agarwood) in Southeast Asia.
During Phase I of the project activities were undertaken in the neotropics in Bolivia, Brazil, and Peru;
in Central Africa in Cameroon, the Democratic Republic of Congo, and the Republic of Congo; and in
Southeast Asia in Indonesia and Malaysia. Following up on the successful first phase of the program
(2007-2011), a second phase continued work for four more years (2012-2015) entitled ITTO-CITES
Implementation for Tree Species and Trade/Market Transparency (TMT). Phase II continued the
work of ITTO and CITES in helping target countries to ensure that trade in selected CITES-listed tree
species is legal, sustainable and traceable. Activities continued in the countries that had received
assistance during Phase I, and additional activities were initiated in those countries and also in
Ghana, Madagascar and Guyana in Phase II.
1.5 Outline of the report
The first section describes the information sources and methodology that are used to assess the
population size, distribution, stand density, size structure, and regeneration dynamics of red cedar in
Guyana.
The second section of the report provides a description of the species Cedrela odorata, including
taxonomy, botanical description, natural history and population dynamics, wood properties,
technological characteristics, uses, habitat and population trends, threats and international trade.
The third section provides an overview of CITES, including the CITES Appendices, CITES export permit
requirements, Non Detriment findings, Trade records, Inconsistent implementation of Appendix-III
timber listings and the current listing of Cedrela odorata.
The fourth section describes the current and potential geographic distribution of red cedar, based on
a variety of georeferenced inventory information, forest concession allocation maps and regional
and national vegetation maps.
The fifth section will analyse the density, size class frequency distribution and volumes
The sixth and final section will assess regeneration dynamics and sustainable harvest levels and
evaluate if current harvest levels exceed sustainable harvest levels or not and whether species-
specific management of red cedar will be required and whether Appendix III listing of Guyana’s red
cedar population is warranted or not.

5
2 Methodology
2.1 Information sources
This report aims to complete and update the available information on Cedrela odorata using a
variety of existing, available information sources on the distribution, population structure and
production. Preliminary exploration of the available information and discussions with stakeholders in
Guyana revealed that red cedar is considered to be extremely rare; being estimated at less than 1
tree per 50 ha. Because of the low density of its occurrence and uncertainty about site preferences,
it was decided to explore existing resource assessment data and verify habitat preferences based on
an analysis of existing information. It was not deemed opportune at this time to conduct any actual
forest inventories because of the rarity of the species in Guyana.
The main sources of information are formed by national forest inventories and forest inventories
and stock surveys carried out by forest concessionaires. Another source of information is formed by
production records. Guyana’s log tracking system requires that each harvested tree is measured and
tagged. These tag numbers with measurements of each tree are reported on removal permits and
associated production registers. This reporting system makes it possible to trace back the origin of
the logs; in case of large concessions, so-called Timber Sales Agreements (TSAs), to the respective
100-ha harvest block, and in case of small concessions, so-called State Forest Permissions (SFPs), to
the concession as a whole.
Two major inventories have been converted into Access databases; the FAO-supported Forest
Industry Development Survey (FIDS) and the Canadian CIDA-financed Interim Forestry Project (IFP).
The FAO-FIDS was undertaken as a national inventory, with most field work from 1969-73 and the
CIDA-IFP, more or less restricted to Central Guyana, during 1990-94.
Large forest concessions are required to conduct a systematic 100% pre-harvest inventory (stock
survey) covering their annual operating area and are obliged to provide this information to the
Guyana Forestry Commission (GFC). Small forest concessions are not required to conduct forest
inventories, but the GFC conducted systematic reconnaissance inventories in a substantial number
of these small concessions. These so-called management level inventories (MLI) use systematically
placed circular line plots with lines generally set 1 km apart and sample plots 200 m apart. Sample
plots consist of a 0.1 ha circular main plot, where trees of all species ≥ 30 cm dbh are enumerated,
and a 0.02 ha nested subplot, where trees of all species between 10 cm and 30 cm dbh are
enumerated. Similar sampling-based inventories have been conducted by a number of large
concessions for the preparation of long-term forest management plans and by the Iwokrama
International Centre for Rainforest Conservation and Development of the Iwokrama Forest.
A sample of pre-harvest inventory blocks where red cedar was recorded were verified; 5 blocks in
April 2015 and two blocks in August 2015. In total seven blocks were thus verified, two in the
Barama Co. Ltd. concession and two in the Vaitarna Holding Private Inc. concession both in the
Essequibo district and one block each in the W.A.I.C.O., Variety Woods & Greenheart Ltd. and
Haiomarakabra concessions in the Demerara and Berbice districts. During this exercise a 10% strip
sample was conducted to assess the density of sub-adult red cedar trees with a diameter less than
40 cm (dbh) and a 5% strip sample of trees between 10 and 20 cm dbh.

6
2.2 Geographic distribution
Plots of the national inventories and management level inventories have been georeferenced, while
spatial locations of the 100-ha logging blocks are known as well. This allows mapping of the
geographic distribution of red cedar in Guyana. Production records can be traced back to the origin
of the harvested trees and locations can be mapped either at the level of 100-ha logging blocks in
case of TSAs or at the level of the entire concession in case of SFPs.
A vegetation map of Guyana was produced in 2001 by Hans ter Steege (ter Steege, 2001a)
developed from a variety of sources including satellite imagery, soil maps, research plots and the
FAO-FIDS forest inventory plots. GIS shape-files of the national and regional vegetation map were
made available to the consultant. By overlaying vegetation and plot location maps it can be
determined in which vegetation type red cedar is likely to occur and the potential distribution can be
estimated by extrapolation. Once the current and potential distribution is defined, densities and
population structures can be assigned to the different vegetation types based on their precise spatial
locations within regional and national vegetation maps.
For cases where there is no specific spatial information, but where origin of produce can be traced
back to the concession level, the base layer for the forest concession allocations is used. red cedar is
also harvested in Amerindian Lands, which are managed by the Amerindian Village Councils and not
by the GFC. Produce from these so-called private properties can however be traced back just as in
case of concessions. A layer with the spatial locations of Amerindian Lands will be overlaid on the
vegetation map as well.
2.3 Density and size class frequency distribution
Size class frequency distributions can be derived from the national and MLI inventories down to a
diameter at breast height of 10 cm. Commercial stock surveys usually consider trees from the legal
minimum cutting diameter of 35 cm DBH or higher and are not really suited to assess regeneration
dynamics. A 10% strip sample was conducted in two blocks within the Barama Co. Ltd. concession
where adult red cedar trees had been recorded to assess the density of sub-adult red cedar trees
between 20 cm and 40 cm dbh and a 5% strip sample of trees between 10 and 20 cm dbh.
2.4 Sustainability of current management practices
The current allowable cut and minimum diameter cut regulations in Guyana are not species-specific
with a minimum cutting diameter limit of 35 cm DBH, an allowable cut of 20 m3/ha and a cutting
cycle of 60 years or pro-rated for shorter cutting cycles; e.g. 8.33 m3/ha when a 25-year cutting cycle
is applied instead. A growth and yield model, GEMFORM, is available for Guyana which allows
sustainable harvest projections by varying parameters such as minimum cutting diameter, cutting
cycle length, etc. (Alder, 2000, 2001, 2008)

7
3 Overview of CITES
3.1 The CITES convention
CITES (the Convention on International Trade in Endangered Species of Wild Fauna and Flora) is an
international agreement between governments and is currently signed by 180 countries. Its aim is to
ensure that international trade in specimens of wild animals and plants does not threaten their
survival. Because the trade in wild animals and plants crosses borders between countries, the effort
to regulate it requires international cooperation to safeguard certain species from over-exploitation.
CITES was conceived in the spirit of such cooperation. States that have voluntarily joined CITES and
agreed to be bound by the convention are known as Parties. Although CITES is legally binding on the
parties, it does not replace national laws. Rather, it provides a framework to be respected by each
party, which must adopt its own (domestic) legislation to ensure that CITES is implemented at the
national level.
3.2 The CITES Appendices
Roughly 5,600 species of animals and 30,000 species of plants are protected by CITES against over-
exploitation through international trade. They are listed in three CITES Appendices5 according to
how threatened they are by international trade. Appendix I lists species currently threatened with
extinction; trade in specimens of these species is permitted only in exceptional circumstances and
requires an export and import permit. Appendix II lists species not necessarily threatened with
extinction in the immediate term but in which trade must be controlled in order to avoid ‘utilization
incompatible with their survival’6. Appendix III lists species that are protected in at least one country
that has asked other CITES parties for assistance in controlling trade in those species7. Some of the
listings are limited in scope to certain products. These limitations are set out in an annotation; the
listing of e.g. Cedrela odorata in Appendix III is restricted to logs, sawn wood, and veneer sheets.
Proposals to list a species in CITES can only be made by a Party to CITES. Almost all countries are
Parties. For Appendix III, the Party must be a range state and the proposal must be sent to the CITES
Secretariat. Proposals for Appendix II can only be approved at a Conference of the Parties (which
should take place every two years) and only if two thirds of the Parties present and voting agree.
3.3 CITES export permits
All trade in the species listed in Appendix I of the Convention must be accompanied by a CITES
export permit issued by the exporting country and a CITES import permit issued by the importing
country. Species in Appendix II must be accompanied by an appropriate CITES export permit issued
by the exporting country before entry to the importing country will be allowed. For Appendix III-
listed species, an export permit is required for trade from a country that has listed its populations in
the Convention. A certificate of origin or a re-export certificate is required for exports from any
other country.
5 See Article II of the convention at http://www.cites.org/sites/default/files/eng/disc/E-Text.pdf. 6 See Article II 2(a) of the convention. 7 See Articles II.3 and V of the convention.

8
3.4 Non-Detriment Finding
Export permits for specimens of Appendix II-listed species must be based on a scientific non-
detriment finding (NDF) and, notably, a legal acquisition finding. For timber species, NDF mean that
successful implementation will require descriptive knowledge of the species resource base; where it
occurs, how much is there, and its ecological role. NDF further require understanding of
management practices necessary to promote growth and regeneration toward future harvests and a
technical capacity to implement those practices. The mandate for legal supplies means that
implementation will require regulatory and enforcement capacity adequate to the task of ensuring
compliance with forest legislation; the ability to track legal supplies to separate these from illegal
harvests; and clear protocols for handling harvests destined for domestic markets.
Export permits for specimens of Appendix III-listed species (required where the state of export listed
the species) need only legal acquisition findings, while certificates of origin require neither NDFs nor
legal acquisition findings since those documents only identify the country of export as the country
from which the specimen originated. They are not required to include sub-national ‘origin’ (such as
concession of harvest).
3.5 Trade records
Parties must record all trade in listed species and report it annually to the CITES Secretariat. This
information is made public through the online CITES trade database, managed by the UN
Environment Programme World Conservation Monitoring Centre (UNEP-WCMC). In addition, the
parties must designate at least one Management Authority responsible for licensing and at least one
Scientific Authority responsible for assessing the effects of proposed and actual trade on the status
of the species. In order to authorize the export of a specimen of a CITES-listed species, a national
Management Authority must be satisfied that the specimen has been ‘legally acquired’ and, in the
case of species listed in Appendices I and II, that the relevant national Scientific Authority has
advised that the proposed export will not be detrimental to the survival of the species.
3.6 Timber species
Initially, commercial timber species were poorly represented in the CITES Appendices; however, in
recent years there has been an increased focus on timber. The most recent CITES Conference of the
Parties (CoP16), which took place in March 2013, voted to list a number of tropical hardwood
species in Appendix II of the convention, including Malagasy ebony (Diospyros spp.) and various
Rosewood species (Dalbergia spp.) from Madagascar, Central and South America and Thailand.
Other tropical timber species already listed in CITES include Mahogany or Swietenia macrophylla,
Ramin or Gonystylus spp., Afrormosia or Pericopsis elata (all Appendix II) and red cedar or Cedrela
odorata (Appendix III).
3.7 Inconsistent implementation of Appendix-III timber listings
At its 15th meeting (CoP15, Doha, 2010), the Conference of the Parties discussed the problem of
inconsistent implementation of Appendix-III timber listings where only specified national
populations are included. It was noted that such listings can cause enforcement problems because, if
one population of a species is included in Appendix III and all others are excluded, it is difficult to
distinguish specimens that require a CITES permit or certificate from specimens that require none.

9
In cases where a whole species is included in Appendix III and national populations are also included,
the permit requirements vary depending on the country of export. There appears to be a continuing
problem of differing interpretations by Parties of the permit requirements for specimens of species,
and populations, in Appendix III. These differences have resulted in delays in shipments and in some
cases in shipments having to be returned to the country of export.
In the case of C. odorata, the whole species is included in Appendix III and one or more Parties have
also included their national populations of the species. When a Party includes a whole species in
Appendix III, this means that all populations everywhere in the world are included. If other Parties
also include their national populations, this changes the permit requirements for export from those
States of specimens originating in those national populations.
3.8 Current listing of Cedrela odorata
The current listing of Cedrela odorata implies that ‘usual’ listings for the regulation of trade for
whole species included in Appendix III should be implemented; i.e.:
a) Export, from the State that included the species in Appendix III (i.e. Brazil, Bolivia, Colombia,
Guatemala and Peru) of specimens originating in that State:
- requires the prior grant and presentation of a CITES export permit that has been
issued by the Management Authority of the State of export;
b) Export, from all other range States of the species, of specimens originating in those States
(e.g. Guyana):
- requires a CITES certificate of origin issued by the Management Authority of the
range State.
If Guyana decides, based on the outcome of this project (resource assessment and management
plan and production and (international) trade in red cedar), that the national population of red cedar
should be included on Appendix III, then exports of red cedar logs, sawn wood and veneer sheets
from Guyana would fall in category a): i.e., a CITES export permit that has been issued by the
Management Authority should be granted prior to export and be presented to the relevant
authorities.

10
4 Red Cedar: Species characteristics
4.1 Taxonomy
Class: Magnoliopsida
Order: Sapindales
Family: Meliaceae
The genus Cedrela was first described by P. Browne in 1756. In 1759 Linneaus described Cedrela
odorata (Patiño, 1997). After revision by Earle Smith (1960) the genus Cedrela currently counts nine
species, all of them occurring in the Americas (Lamb, 1968). Some authors have considered C.
odorata only to include those trees originating from the West Indies and others to be of the species
C. mexicana, but in the revision of Cedrela by Earle Smith (1960) C. mexicana was recognized as a
synonym of C. odorata.
4.2 Common names
(Rocas, 2003; Orwa et al, 2009; Patiño, 1997; Lindeman et al, 1963; Mennega et al, 1988)
English: Spanish cedar, cedar, red cedar, cedar wood, American cedar, Barbados cedar, Central
American cedar, Honduras cedar, Jamaican cedar, Mexican cedar, Nicaraguan cedar,
West Indian cedar, West Indies cedar, Brazilian mahogany, stinking mahogany, cigar-
box tree, cigar-box cedar, cigar-box cedrela, cigar-box wood, Mexican boxwood.
French: Acajou amer, acajou-bois, acajou femelle, acajou pays, acajou rouge, acajou senti,
acajou á meubles, acajou à planches, cèdre, cedrela, cèdre acajou, cèdre des barbares,
cèdre rouge.
German: Cedrela, Westindische Zeder, Westindische Scheinzeder, Zigarrenkistchenholz.
Spanish: cedro, cedro amargo, cedro blanco, cedro caoba, cedro cebolla, cedro colorado, cedro
cubano, cedro dulce, cedro del país, cedro español, cedro hembra, cedro hembra del
país, cedro macho, cedro mexicano, cedro oloroso, cedro real, cedro rojo, cedro
vermelho
Portugese: cóbano, cédre, cédre espagnol, acajú, culche.
Guyana: Red cedar (Creole), Koperi (Akawaio), Kurana (Arecuna), Akuyari (Arawak),Paranka
(Macushi), Atoreb (Wapisiana), Parank (Warrau)
Suriname: ceder, sedre
See Pennington (1981) for an extensive list of local names.
4.2.1 Commercial names
English: Central American cedar, South American cedar, Honduras cedar, Spanish cedar, West
Indian cedar, Cigar-box cedar
Spanish: Cedro hembra
French: Cedrela, cèdre d’Amérique centrale

11
4.3 Geographic distribution
Native to the tropical region of America, Cedrela odorata is naturally distributed from northern
Mexico throughout lowland Central America and South America to northern Argentina and most
Caribbean Islands within a latitudinal range of 26°N and 28°S (Pennington, 1981; Cintron, 1990;
Rocas, 2003).
Within its native range the species has been reported in: Antigua and Barbuda, Argentina, Barbados,
Belize, Bolivia, Brazil, Cayman Islands, Colombia, Costa Rica, Cuba, Dominica, Dominican Republic,
Ecuador, El Salvador, French Guiana, Grenada, Guadeloupe, Guatemala, Guyana, Haiti, Honduras,
Jamaica, Martinique, Mexico, Montserrat, Netherlands Antilles, Nicaragua, Panama, Paraguay, Peru,
Puerto Rico, Saint Kitts and Nevis, Saint Lucia, Suriname, Trinidad and Tobago, United States Virgin
Islands, Venezuela and British Virgin Islands (UNEP-WCMC CITES, no date). See CITES (2007) for
detailed references for each country.
The species has been introduced in American Samoa, the Bahamas, Bermuda, the Cook Islands, the
Fiji Islands, southern Florida, Ghana, Micronesia, New Caledonia, Nigeria, Samoa, Sierra Leone, South
Africa, Tanzania and Tonga (Betancourt, 1983; CITES, 2007; Little et al, 1967; Webb et al, 1980).
As a well-known plantation tree the species is planted in all tropical regions. Timber plantations have
been established in Australia, Côte d'Ivoire, Costa Rica, Ghana, Indonesia, Madagascar, Papua New
Guinea, Peninsular Malaysia, the Philippines, Singapore, the Solomon Islands, South Africa, Sri Lanka,
Tanzania, Thailand, Uganda and Western Samoa (Chung et al 1995). See CITES (2007) for detailed
references for each country.
4.4 Site preferences
In its natural area of distribution Cedrela odorata occurs in both primary and secondary, evergreen
to semi-deciduous lowland or lower montane rain forest (Pennington, 1981; Chung et al, 1995;
Patiño, 1997; Lemmens, 2008; Orwa et al, 2009). In general, it grows in a climate with an annual
rainfall between 1,200-2,500 mm at altitudes between 0-1,500 m above sea level (Webb et al., 1984;
Lemmens, 2008), but in Bolivia it is found up to 3,000 meters above sea level (Lamb, 1968). The
temperature ranges are a mean maximum temperature of 27-36°C during the hottest month and a
mean minimum temperature of 11-22°C in the coldest month, with a mean annual temperature of
20- 32°C (Webb et al., 1984). It prefers well-drained sites on a variety of soils, but is usually more
common on limestone-derived soil (Lemmens, 2008). It tolerates variation in pH and requires good
levels of light.
C. odorata is most successful in drier closed forest conditions but it is rare in evergreen forest types
and prefers sites with a marked dry season (Lamb, 1968). The species tolerates prolonged periods of
drought (Lamb, 1968; Salas, 1993) and does not prosper in areas with more than 3,000 mm
precipitation. In Central America and Mexico it only occurs on non-flooded sites, often on well-
drained limestone, as in the semi-deciduous forests of the Yucatan peninsula (Cintron, 1990; Lamb,
1968). However, in Amazonian Peru and Brazil it is most common on fertile soils which are
periodically flooded (Pennington, 2006, cited in CITES, 2007).
In primary forest the species is an emergent or member of the upper canopy. In general individual
trees are found in mixed forests dominated by other species. It is very common in secondary forest

12
derived from lowland evergreen rain forest and seasonal rain forest (Pennington, 2006, cited in
CITES, 2007).
In Peru, the species is found in sub-humid mountain woods, humid woods in meandering plains and
woods in dissected terraces. Individual trees are in general found scattered in mixed semi-evergreen
or semi-deciduous forests dominated by other species (INRENA, 2006).
The species occurs scattered in the high dryland forests in Suriname (Lindeman, 1954); especially
along the slopes of the hills and is reported to become scarce in ridge forests of the coastal plain
(Ostendorf, 1962).
In Guyana, the species is rare to locally occasional in mora forest along creeks, seasonal forest and
poor types of rain forest (Fanshawe 1961). According to Hohenkerk (1923), the species was very
scattered in the easily accessible forests in the early 20th century, except in the North West District
and locally in the Rupununi District where it was more abundant.
4.5 Botanical Description
4.5.1 Field characteristics
Cedrela odorata is a (semi-)deciduous, monoecious, medium-sized to large tree up to 30-40(-45) m
tall (in Guyana/Suriname) with a straight, cylindrical, branchless bole for up to 20(–25) m, 50-90
(-180) cm in diameter (in Guyana/Suriname), with low, blunt, fairly straight buttresses, 1.5-2.5(-3) x
1-2 x 0.2-0.3 m, branched at base. Bark (dark) reddish-brown especially near the base of the bole,
greyish brown higher up, longitudinally fissured or ribbed in a diamond-shaped pattern. Fissures
10-60 x 2-4 x 1-2 cm, 5-8 cm apart. Dead bark 4-10 mm thick, (dark) brown, layered, with some
lighter brown layers. Living bark 8-10 mm thick, pink or purplish-red (inner half off-white, when
exposed to air discolouring to rusty brown), layered, soft, fibrous, with typical cedar-like scent and
taste, sometimes with offensive garlic scent. Crown flat or rounded, light, branches erect to
spreading; branchlets finely to conspicuously lenticellate (Lindeman & Mennega, 1963; Polak, 1992;
Lemmens, 2008). See Figures 1-3.
Seedlings with epigeal germination and short taproot. Cotyledons are leaf-like, opposite, ovate, c. 3 x
1.5 cm, apex and base rounded. Two first leaves opposite, trifoliolate with entire leaflets; blades of
lateral leaflets narrowly elliptic, c. 0.2 x 0.5 cm; blade at middle leaflet rhombic, c. 3 x 1 cm (Polak,
1992; Lemmens, 2008).
4.5.2 Leaves
Twigs round, lenticellate, glabrous. Leaves alternate, paripinnately compound with (5–)6–14(–15)
pairs of leaflets; stipules absent; rachis slightly hairy or glabrous, petiolules puberulous when young;
petiole 2.5-7.5 cm long, round ; rachis 18-38 cm long , grooved above; petiolules to 2 cm long;
leaflets more or less opposite; blades papery or thin-leathery, (narrowly) ovate, often falcate , 5-14
cm long x 3-6 cm wide, glabrous, margin flat, apex slightly acuminate, with obtuse tip, base rounded;
primary vein plane above, slightly prominent below; secondary veins 7-12 pairs, loop-forming, with
some smaller ones in between, prominent above, moderately prominent below; tertiary venation
dense (Polak, 1992; Lemmens, 2008).

13
Figure 1 a. habit; b. flower; c. flower, longitudinal section; d. dehisced fruit; e. seed; f. trunk base; g seedling. Source: Polak (1992)
4.5.3 Flowers
As a monoecious tree, C. odorata has flowers of both sexes in the same inflorescence. The
inflorescence is a terminal, much-branched, pendulous panicle, 10-40 (50) cm long, glabrous or
puberulous; peduncle 0.5-8 cm long; pedicels 1-2 mm long. Flowers functionally unisexual, but with
well-developed vestiges of the opposite sex, male and female flowers very similar in appearance,

14
actinomorphic, pentamerous, greenish-white, subsessile, 6-9 mm long, smelling of garlic; calyx cup-
shaped, 2-3 mm long, with 5 short teeth; petals 5 free, imbricate and adnate for ⅓ of their length,
forming into a long, columnar androgynophore by a medium carina (therefore preventing their
spreading in open flowers); stamens 5, free, 2–3 mm long; ; anthers dorsifixed, opening by
longitudinal slits; ovary 5-locular, pubescent; each loculus with 10-14 ovules; style short, stigma
discoid (Polak, 1992; Lemmens, 2008; Orwa et al, 2009).
The female flowers open before the male flowers. The reproductive cycle of C. odorata is
synchronized with the growing season, and thus varies over its range of distribution (Cintron, 1990).
4.5.4 Fruits and seeds
The fruit is a pendulous, woody, oblong-ellipsoid to obovoid capsule, at first green, finally brown-
black with numerous lenticels, 3-5 cm long and 2-4 cm in diameter, glabrous, dehiscing with 5 valves,
central column with 5 broad wings (Polak, 1992; Lemmens, 2008).
Each fruit contains 13 to 34 developed seeds. The seeds are samaroid, bulky at their apex, 2 to 3 cm
long and 5 mm wide (including the wing). The bulky part is oblong, slightly comose, laterally
flattened, 7 to 8 mm long, 3.5 to 5 mm wide, and 1.2 to 1.5 mm thick. The seed-coat is light brown to
red-brown, rugose, opaque, chartaceous, and expanded at the base on a thin and brittle lateral wing
(Rocas, 2003).
Figure 2 Bark of red cedar. Source: Polak (1992)

15
Figure 3 Leaf and dry fruits of red cedar. Source: Lemmens (2008)
4.6 Natural history and population dynamics
C. odorata is insect-pollinated and has wind-dispersed seed (James et al., 1998; Cintron, 1990). The
seeds of C. odorata are generally ignored by parrots, in spite of appearing ideally suited for
predation. Macaws, however, which specialize in eating unripe seeds and fruits, are known to eat
the seeds of C. odorata (Matuzak and Dear, 2003). Trees start bearing fruit between the ages of 10
years (Lamb, 1968) to 15 years (Lamprecht, 1989). Flowers appear early in the rainy season and
fruits mature during the dry season when the leaves become deciduous.
Flowering and fruiting periods vary throughout the tree’s range. In Mexico, it blooms May through
August, and the fruits ripen during the dry season from January through March in the following year.
As the foliage begins to drop, the fruits dry and open (Rocas, 2003). In Guyana, the species is semi-
deciduous, flowers from August to November and fruits from January to March (Polak, 1992). Early
height growth of up to 2.3 m per year is possible in favourable conditions (Lamb, 1968).
C. odorata is deciduous; strongly light-demanding, behaves as a long-lived pioneer (Cintron, 1990;
Lemmens, 2008), and is often associated with other Meliaceae (Swietenia and Guarea sp.) and
leguminous trees (Pennington, 1981). It can therefore be assumed that C. odorata shares life history
traits with Swietenia macrophylla, which has been more widely studied. S. macrophylla is a long-
lived, fast-growing, deciduous tree and its seedlings require overhead light for growth but not
necessarily for survival (Mayhew & Newton 1998; Pennington 2002). The species is found in both
ever-wet and seasonally dry tropical rain forest and it seems to thrive in a very wide range of soil
conditions (Mayhew & Newton 1998). The same life history traits would thus apply to C. odorata.
In general, the Meliaceae species do not follow the regeneration patterns of the majority of
common tropical tree species, that is, those that are present at high density per hectare (Patiño and

16
Marin, 1991). Swietenia and Cedrela, are classified as ‘rare’, but population density varies
considerably. Rio San Juan, Nicaragua, has a density of one C. odorata tree per 100 ha (Paniagua, no
date, cited in CITES, 2007). A density of 2.9 stems of cedar per 100 ha was estimated in the Bladen
Reserve of Belize (Johnson and Woods, 1976, cited by Newman, 2004). In Guatemala, average
densities of 7.9 trees per 100 ha were recorded in the Peten Biosphere Reserve (Szejner, 2005, cited
in CITES, 2007). Brienen & Zuidema (2006b) report an average density of 35 harvestable trees per
100 ha in the northern part of the Bolivian Amazon (Department of Pando). According to Navarro-
Cerrillo et al (2013), C. odorata density ranges between 0.01 and 4.4 trees per ha in Bolivian forests.
From the loggers’ perspective, however, Navarro-Cerrillo et al. (2013) show that the species should
be considered as a typically ‘rare’ low-density species with average density estimated at 3.3 trees
per 100 ha for commercial-sized trees (>60 cm dbh) in Bolivia. In Quintana Roo, Mexico average is 65
trees per 100 ha when considering individuals of 15 cm and up, while for trees between 45 and 65
cm in diameter, 17.5 trees per 100 ha are found (Patiño, 1997). However in some regions, almost
pure stands are to be found, such as in successional forests on intermediate-age river terraces of
Manu National Park, Peru (Gentry, no date).
In spite of plentiful production of seedlings, natural regeneration of C. odorata was reported by
Marshall (1939) to be ‘extremely scarce’ in rainforest conditions, though better in semi-deciduous
forest. According to Marshall (1939), good regeneration follows events whereby the canopy has
been opened considerably, such as forest fires and hurricanes.
Swietenia macrophylla occurs at high densities within forest stands that have regenerated following
severe disturbance (Whitmore 1998); dense patches of mahogany have been found in forests that
have been subjected to past fires and hurricanes (Lamb 1966; Snook 1993), gully erosion and log-
jam-induced flooding (Gullison et al. 1996) as well as on abandoned agricultural fields (Stevenson
1927) and along roadsides (Snook 1993). These disturbances are thought to allow mahogany to
regenerate as single-aged cohorts every few decades or centuries (Gullison et al. 1996; Snook 1996),
which has led to the assumption that mahogany requires catastrophic disturbance in order to persist
in forest ecosystems (Brown et al., 2003). It is highly likely that population structure and dynamics of
C. odorata are comparable S. macrophylla.
However, it appears that there is a difference in the C. odorata (and Swietenia macrophylla)
population dynamics in Central America compared to South America. In Central America waves of
regeneration of these two species are apparently provoked by hurricanes and other catastrophic
events, resulting in comparatively high local densities, while in South America, the two species
mainly occur in low densities in semi-deciduous forests (Brown et al. 2003), forests with rather open
canopies along watercourses (Grogan et al., 2014; Gentry, no date) and in the transitional zone
between evergreen forest and cerrado in the Brazilian Amazon (Brown et al., 2003). For South
America, Brown et al. (2003) found no evidence that successful regeneration of mahogany depends
on periodic catastrophic disturbances, as suggested by Snook (1996). Instead, gap recruitment is
suggested to be the principal driver of mahogany population dynamics in Amazonia (Grogan et al.,
2003). Exceptions may occur after mega El Niño Southern Oscillation events which may have given
rise to higher than usual regeneration as proposed by Meggers (1994).
C. odorata trees are moderately long-lived. Lamb (1968) gives an example of a tree in Belize with 110
rings. Brienen & Zuidema (2006a) reported on harvested trees in the Bolivian Amazon and found an
average diameter of 95 cm and a maximum diameter of 172 cm. Using tree ring analysis, they

17
calculated a mean age of 140 years (range 51-308 years) for their sample of harvested trees.
Pennington (2006) suggests that C. odorata is a fast growing species, which, under optimal
conditions, can reach 1 m in diameter in 50-60 years while Clark & Clark (1992) suggested a diameter
growth potential (maximum annual diameter increment) of 3.2 cm/yr. However, Brienen & Zuidema
(2006a) report a much lower average growth rate of 0.68 cm/yr. and link this to a strong ontogenetic
pattern in growth rates, with relatively low growth rates in the smallest size class and a strong
increase (>two-fold) towards larger diameters. This implies that trees can grow 10 cm in diameter
within 8 years, but this can also take over 70 years. Using tree ring analysis, Brienen & Zuidema
(2006b) found low projected C. odorata yields for the second harvest after 20 years (as set by
Bolivian regulations); recuperation was less than 30% and it would take 72 years to recuperate 100%
of the volume obtained in the initial harvest. There are several reasons why recuperation in South
America is this low including a small number of trees present in the lower size classes, and slow
growth and high mortality rates of juveniles (Brienen & Zuidema, 2006b; Rozendaal et al, 2010), but
the main reason appears to be that many trees of harvestable size at the first harvest have passed
the minimum cutting diameter threshold already since many decades (Brienen & Zuidema, 2007).
The availability of such old-growth trees of harvestable size at the first harvest is often called the
‘Primary forest premium’ (Rozendaal et al., 2010).
4.7 Other botanical information
The genus Cedrela is included in the tribe Cedreleae of the subfamily Swietenioideae, together with
Toona. All Old World species of Cedrela have been transferred to the genus Toona. Cedrela differs
from the latter by its prominent androgynophore with petals and filaments adnate to it, the cup-like
calyx, the bigger and woodier capsule, and seedlings having entire leaflets. The formerly recognized
species C. glaziovii has recently been found to be identical to C. odorata (Chung et al, 1995). The
specific name, ‘odorata’ is Latin for sweet-smelling, fragrant.
4.8 Wood Properties
C. odorata has lustrous wood of medium density. The heartwood is pale cream in colour
immediately after sawing, turning pinkish brown upon exposure; clearly demarcated from the
narrow creamy yellow or pale brown sapwood (3-5 cm). The grain is usually straight, sometimes
interlocked, sometimes woolly indicating the presence of tension wood, texture moderately fine to
moderately coarse; the figure is attractive in flat-sawn boards. Fresh wood has a distinct, lingering,
cedar-like scent; this characteristic of the wood makes it a favourite for cigar boxes. It has a bitter,
spice-like taste. Sometimes the wood has important resin marks. Growth ring boundaries are
distinct, marked by differences in pore size and initial parenchyma (Brunner et al, 1994; Gérard et al,
1996; Miller & Détienne, 2001; Lemmens, 2008). Heartwood is rated as moderately durable and
moderately resistant to termites, but the sapwood is susceptible to staining and powder post
beetles and is not durable (Orwa et al 2009). Basic specific gravity is low to medium; variable,
ranging from 0.25-0.50 (Miller & Détienne, 2001).
4.9 Technological characteristics
The wood is light- to medium-weight, with a green density of density of 0.80 g/cm3, while air-dry
density at 12% moisture content varies according to origin from 0.35 to 0.55 g/cm3, average 0.44
g/cm3. Basic specific gravity is low to medium; variable, ranging from 0.25-0.50, on average 0.38. The

18
rates of shrinkage may be low: total tangential shrinkage 6.1 %, total radial shrinkage 3.8 % and total
volumetric shrinkage 10.0 %, T/R Ratio: 1.5. (Gérard et al, 1996).
4.10 Processing
4.10.1 Workability
The wood is easy to work with both hand and machine tools. It saws, bores, turns and sands without
problems and produces a good finish. However, growth stresses may cause severe end-splitting of
logs and warping and splitting of the central cant during saw milling (Chung et al, 1995). Due to its
low density and softness, the wood has a tendency to woolliness, if not machined with sharp cutters;
extra sanding up to finer grits may be required to obtain a smooth wood surface. Also, natural gum
pockets can remain wet and may ooze out onto the surrounding surface, which can clog and gum up
saw blades, and make finishing the wood a challenge. (Gérard et al, 1996; The Wood Database, no
date).The wood is easy to glue and nails easily with good nail-holding power. Rotary peeling and
slicing give good results without pre-treatment, producing attractively figured veneer, but with some
tendency for woolly surfaces. (Gérard et al, 1996; Lemmens, 2008).
4.10.2 Natural durability
The heartwood is rated durable to moderately durable regarding decay resistance, but only
moderately resistant to termites; resistance to insects of dry wood is rated as good; the sapwood is
non-durable and susceptible to staining and powder-post beetles; the wood is also reported to have
excellent weathering characteristics. (Chung et al, 1995; Gérard et al, 1996).
4.11 Uses
The timber of Cedrela odorata is one of the most widely-used tropical hardwoods both locally in
Central and South America and in international trade, second only to true mahogany (Swietenia
macrophylla). The characteristics which make the timber so prized are the attractive reddish-brown
colour, its stability and resistance to fungal and insect attack. It is light in weight, easy to work,
aromatic and with an attractive grain which takes a fine polish and is used for furniture, cabinet
making, panelling and joinery in general. It is now probably the most widely used timber in houses,
hotels and offices in tropical America. It is used on a massive scale locally, especially in Peru and in
the forest it is frequently used for canoes and paddles due to its light weight and resistance to decay.
(Pennington, 2006, cited in CITES, 2007).
The best known use of the timber of Cedrela is for cigar boxes (the fragrant wood is still preferred
above all others for lining cigar boxes), but it is also used for light construction, mouldings, cabinets,
clothing chests and wardrobes, panelling, boxes, exterior joinery, weatherboards, louvered doors,
boat building (hulls of light racing boats), canoes, musical instruments (sounding boards), turnery,
matchboxes, household implements, face veneer and plywood. Lower grades are suitable for crates,
fencing, and animal pens. The repellent smell of the wood makes it particularly suitable for the
manufacture of clothing chests and wardrobes. (Chung et al, 1995; UNEP-WCMC CITES, no date)
4.12 Population trends
Although C. odorata is widespread, it is seldom common - individuals of this species are few in
number and are widely dispersed - and its numbers are being reduced by exploitation without
successful regeneration (Cintron, 1990). It has been of great commercial interest for over 200 years

19
and in this time its distribution has been diminished by excessive exploitation over its entire range to
the extent that large trees of good form and size are now rarely found (Pennington, 1981).
Already before the 1960s heavy logging had resulted in a reduction in the volume of C. odorata
timber being cut as reported by Earle Smith (1960) in the West Indian Islands and Mexico and by
Standley and Steyermark (1946) in Guatemala.
A trend towards rarity has been reported in several countries and territories, including Argentina,
Barbados and Puerto Rico (CITES, 2007). It is threatened in Costa Rica (INBio, 1999), Belize (Cho,
Pers. Comm. Cited in CITES, 2007), Bolivia (Killeen, 1997 cited in CITES, 2007), Panama (Condit et al,
1996)
In Brazil, Brune and Melchior (1976) reported strong selective cutting for Cedrela odorata in the
várzea (seasonally flooded lowland by the rivers) of the Amazon. Populations of C. odorata remain in
Peru, but populations are drastically being reduced (Reynel, 1988). Reynel (1988) notes that C.
odorata was not under threat in Peru, that populations of the species remain, and that many of the
Protected Areas in the country contain individuals of the species. However, the author warns that
some populations are drastically being reduced.
4.13 Trade
According to CITES trade data for the period 2001–13, the majority of international trade in red
cedar involved sawn wood. The remainder of the trade was in carvings, logs and veneer.
4.13.1 Trading prices
red cedar is considered a commercially valuable species and an important commodity on both the
local and export market (CITES, 2007). Information on the value of the species in trade is patchy and
reported only at some stages in the supply chain. Data submitted by the Peruvian authorities
indicated prices ranging from $592/m3 to $658/m3 during the period 2000–05 (Ferriss, 2014). Prices
reported by ITTO8 for 2013-2015 for Cedrela odorata sawn wood from Peru were in the range of
$911–977/m3 in the North American and Mexican markets; while prices for the Peruvian domestic
market were $296-355/m3.
Data submitted by the Guyana Forestry Commission indicated export prices ranging from $360-
1,548/m3 for sawn wood (dressed and undressed lumber) and $90-155/m3 for logs during the period
2006-14.
4.13.2 Global trade patterns
The CITES trade database includes details of all export and import permits and certificates issued for
CITES-listed species. For this report, data were downloaded from the CITES trade database for the
years 2001–13 (2013 being the most recent year for which a complete dataset is available). Only
direct trade from the country of origin is considered (i.e., the country of export in which the timber
was harvested) to avoid double counting re-exported timber.
8 ITTO (2013-2015), ‘Report from Peru’, in Tropical Timber Market Report, Vol. 17, No. 20, 16–31 October 2013 - ITTO Tropical Timber Market Report, Vol. 19, No. 2, 16 – 31 January 2015.

20
Figure 4 Direct global trade in Cedrela odorata, according to the CITES trade database for 2001–13
According to CITES trade data between 2001 and 2013, the annual level of exports of red cedar as
reported by exporters was on average around 28,000 m3 for sawn wood and logs. Trade in red Cedar
peaked in 2002 and 2007, but declined strongly after 2009 (see Figure 4). While the data reported by
both exporters and importers for 2009 show a decrease in trade in recent years, the volume, source
and destination reported by importers differ from the information reported by exporters; i.e., the
average annual of level of imports was around 1,700 m3 only. The magnitude of the difference
between the volumes of trade reported by exporters and importers suggest under and/or
misreporting. However, the discrepancy is likely due to inconsistencies in how trade in CITES
Appendix III-listed species is reported (Ferriss, 2014). While there is no requirement to report
imports of those species and range states that do not list their population on Appendix III are only
required to issue a certificate of origin, in practice a number of countries do, including the EU
member states and the United States, but not always (Ferriss, 2014). Furthermore, some countries
report trade in Appendix III-listed populations (i.e. exports from Bolivia, Brazil, Costa Rica, Guatemala
or Peru), while others report trade in all specimens of the species. Guyana, for instance, has never
reported any exports, while exports have been substantial (see Table 1).
During the period 2001–13, Peru and Bolivia were the main exporters of red cedar according to
exporter reported quantities (annual average of c. 14,700 m3 and c. 14,150 m3 respectively), while
importer reported quantities indicate only Peru (c. 13,500 m3 annual average9) as main exporter. The
United States, Mexico and Argentina were the main importers, while Peru, Japan, Chile, Spain and
the Dominican Republic imported significant volumes according to exporter reports.
4.13.3 Export from Guyana
Data submitted by the Guyana Forestry Commission indicated that export volumes from Guyana
followed the global decline from 2009 onwards as shown in Table 1 below. The decline is clearly
demonstrated for logs, lumber and building components (mainly doors).
9 For Bolivia, importers reported an annual average volume of c. 850 m3/yr., while Brazil was the second largest exporter according to importer reports with an average annual volume of c. 1,350 m3/yr.
0
10
20
30
40
50
60
70
2001 2002 2003 2004 2005 2006 2007 2008 2009 2010 2011 2012 2013
Vo
lum
e (
x 1
00
0 m
3 )
year
Importer reported quantity Exporter reported quantity

21
Table 1 Export of red cedar lumber, logs, building components, furniture, mouldings and wooden utensils and ornaments from Guyana for the period 2006–14
2006 2007 2008 2009 2010 2011 2012 2013 2014 Total
Sawn timber1 (m3) 42 585 933 294 115 53 20 19 27 2086
Logs (m3) 2 2 55 4 3 67
Building Componentry2 (pcs) 1050 740 421 350 100 20 20 2701
Furniture (pcs) 2 40 42
Mouldings (pcs)
2194
2 208
2215
1
Wooden Utensils &
Ornaments (pcs) 14 14 1sawn timber includes both dressed and undressed lumber.
2building componentry consists mainly of doors and windows.
Barbados has been the most important market by far for red cedar exported from Guyana with a
total volume of exported sawn wood of 1,554 m3 over 2006-14, followed by the United States of
America with a volume of 256 m3 sawn wood and Trinidad and Tobago with 115 m3 over 2006-14.
Barbados was also the main market for building components (mainly doors), while China was the
main importer of red cedar logs (45 m3 over 2006-14). In terms of export value of all product
categories over 2006-14, a value was declared of 2,524,659 US$, with Barbados being the main
market in terms of value with a declared value of 1,743,502 US$.
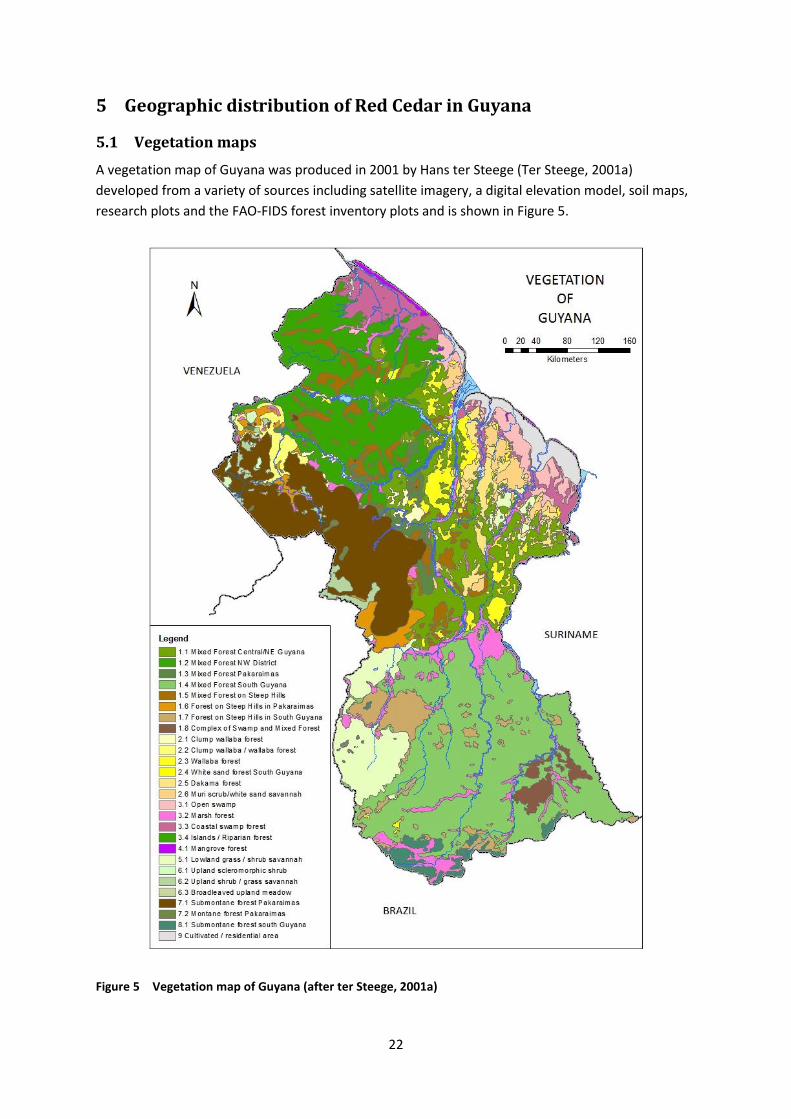
22
5 Geographic distribution of Red Cedar in Guyana
5.1 Vegetation maps
A vegetation map of Guyana was produced in 2001 by Hans ter Steege (Ter Steege, 2001a)
developed from a variety of sources including satellite imagery, a digital elevation model, soil maps,
research plots and the FAO-FIDS forest inventory plots and is shown in Figure 5.
Figure 5 Vegetation map of Guyana (after ter Steege, 2001a)

23
As part the UN-FAO Forest Industries Development Survey reconnaissance surveys of Guyana during
1968-1973, detailed forest type maps were prepared using aerial photography interpretation (De
Milde & De Groot, 1970a-e, g). These maps were digitized into one so-called regional vegetation
map in 2000 as part of the DFID Guyana Forestry Commission Support Project. An extract of the
FAO-FIDS maps is shown in Figure 6.
Figure 6 Extract from reconnaissance surveys of the more accessible forest areas, zones 1-5 and the southern part of Guyana (De Milde & De Groot, 1970a-e, and g)

24
During the same period, even more detailed forest type maps were prepared based on aerial photo
interpretation for three at the time untouched areas, two of which were presumed to be well-
stocked with greenheart (Chlorocardium rodiei); the Ebini-Itaki area (De Milde & De Groot, 1970f)
and the Great Falls area (Welch & Bell, 1971), while the third was prepared for a selected area in the
North-West district (De Milde & De Groot, 1971) to assess Virola surinamensis (Dalli) and other
swamp forest timber resources. Unfortunately these useful forest type maps have not been digitized
to date.
5.2 Forest inventories
Wright (1999) has reviewed forest inventories done in Guyana since the 1950’s. Prior to World War II
the Guyana Forest Department had undertaken numerous valuation surveys in different parts of the
accessible forest areas (Fanshawe, 1961). From 1966 to 1975, the FAO-supported Forest Industry
Development Survey (FIDS) was undertaken as a national inventory, with most field work from 1969-
73. Subsequently, the CIDA-financed Interim Forestry Project (IFP), from 1990-95, undertook a
second national inventory. During 2000-2002 the Guyana Forestry Commission developed its own
inventory capacity and methodology with support from the UK DFID. The forest inventory
methodology was recommended for State Forest Exploratory Permits (SFEPs) and companies
conducting management level inventories for their long-term forest management plans. A number
of management level inventories (MLIs) have been undertaken by Iwokrama between 2003 and
2012 and by Barama Co. Ltd. of its compartment no. 5 in 2003 and of the ‘Barama Housing SFEP
02/04’ in 2005. Such MLI was also undertaken in Nagasar Sawh’s Ya Ya Concession (TSA Dem 04/90).
These MLIs are included in the GEMFORM database of GFC.
Ter Steege (pers. comm., 2001 in Alder, 2008) converted the old IFP and FIDS data files into Access
databases, and used them as a resource for biomass studies and the Guyana vegetation map (Ter
Steege, 2001a, 2001b) and from 2006 onwards, GFC has been conducting management level
inventories (MLI) in State Forest Permits (SFPs) and Small Loggers’ Associations (SLAs) to obtain
information on the stocking of the areas targeted to guide decisions on their (re)allocation. The data
have been processed through GEMFORM (Alder, 2000, 2001, 2008).
MLIs have reportedly been conducted in 70 concessions; 42 SFPs, 24 SLAs, 2 TSAs, 1 SFEP and
Iwokrama. GEMFORM database data was available to the consultant for 52 concessions; 31 SFPs, 17
SLAs, 2 TSAs, 1 SFEP and Iwokrama. Not all of Iwokrama’s Sustainable Use Area MLI is included in the
GEMFORM database when compared with summary data obtained from Iwokrama. Iwokrama itself
made results available for red cedar only for the inventories they had conducted; i.e., Sustainable
Use Area management level inventory (2003), Annai management level inventory (2007), ITI Pre-
harvest (100%) inventory (2010) and Wildlife Preserve biodiversity inventory (2012).
The data in the GEMFORM database at hand includes 4,609 sample plots (Iwokrama: 874 plots,
TSAs: 1,420 plots, SFPs/SLAs 1,535 plots and Barama Housing SFEP: 780 plots). The sample plots are
circular line plots with lines generally set 1 km apart and sample plots were set 200 m apart. Sample
plots consisted of a 0.1 ha circular main plot, where trees of all species from 35 cm dbh are
enumerated, and a 0.02 ha nested subplot, where trees of all species between 10 cm and 35 cm dbh
are enumerated. The total area covered by these inventories measures 488,564 ha with the Barama

25
Co. Ltd. inventory of its Compartment no. 5 forming the bulk the inventoried area; i.e. 204,772 ha.
The total area of SFPs/SLAs sampled covers 140,951 ha, Iwokrama 69,085 ha and Barama Housing
SFEP 47,314 ha. The overall average sampling intensity was 0.09% (TSAs: 0.06%, SFPs/SLAs 0.11%,
SFEP 0.16% and Iwokrama 0.13%).
It must be noted that the national inventories cover different time periods (FIDS 1968-73, IFP 1990-
94, MLI 2002 onwards) and that they have rather different national coverage, as shown in Figure 7.
The locations shown are estimated from place names and descriptions for the FIDS data and in case
of the IFP project locations from the consultant’s own involvement in the IFP project, as exact
georeferences were not recorded. For MLI data, GPS waypoints were recorded for the start of most
transect lines but not for the individual plots. Therefore plots are shown as centroids of inventoried
areas.
The IFP project did not sample the southern part of the country, and used a point sampling
(Bitterlich) design with high Basal Area Count Factors, so that typically only 3-4 trees were sampled
per plot. The IFP project covered 32 locations (within 15 concessions) and counted 7,992 plots. IFP
point sampling used an average BAF of 6 m2/ha.
The 1,016 FIDS plots were distributed over 89 locations and consisted mostly of 0.2 ha clusters of 5 ×
0.04 ha subplots (De Milde & De Groot, 1970a-e,and g).
5.2.1 Geographic distribution of red cedar based on national forest inventories
Plots with red cedar present were identified and overlaid on the national vegetation (Figure 8) and
the FAO-FIDS regional forest type maps. Theoretically, it would be possible to intersect the
vegetation map and plot locations to determine site preferences for red cedar. However, given the
positional estimates for the plot locations, it is more useful to use actual forest types recorded
during the inventories. Red cedar was only very occasionally encountered in the sample plots. Only
15 trees showed up in 13 out of the 4,609 MLI sample plots; 5 trees in 5 out of 1,016 FAO-FIDs plots;
and 6 trees in 6 out of 7,992 IFP sample points. In case of the Iwokrama inventories 9 trees were
found in different plots.
The four different inventory designs used different forest typing designs. The FAO-FIDS inventory
obviously links directly to the FAO-FIDS regional forest type map, but this is less the case with the
other three inventories. The distribution of plots with red cedar over the different forest types and
soil types is shown for each of the four inventory designs in Tables 2-5.
Table 2 Forest and soil types of the plots with red cedar in the FAO-FIDS inventory
Forest type Soil type brown
sand loam sand &
loam Total
1 Mixed forest on undulating to hilly terrain 1 1 2 1b Mixed forest flat to undulating W. Guyana 1 1 1e Mixed forest flat to undulating E. Guyana 1 1 1h Mixed forest on steep high hills and mountains 1 1
Total 1 1 3 5

26
Figure 7 Estimated locations of FIDS (1969-1973), IFP (1990-1994), MLI (2006 to present) and Iwokrama (2003-2012) plots from place names and descriptions for the FIDS data and the consultant’s experience with the IFP project. For MLI data, plots are mainly shown as centroids of inventoried areas (SFPs); except for Iwokrama (only plots with red cedar) where locations are more precise.
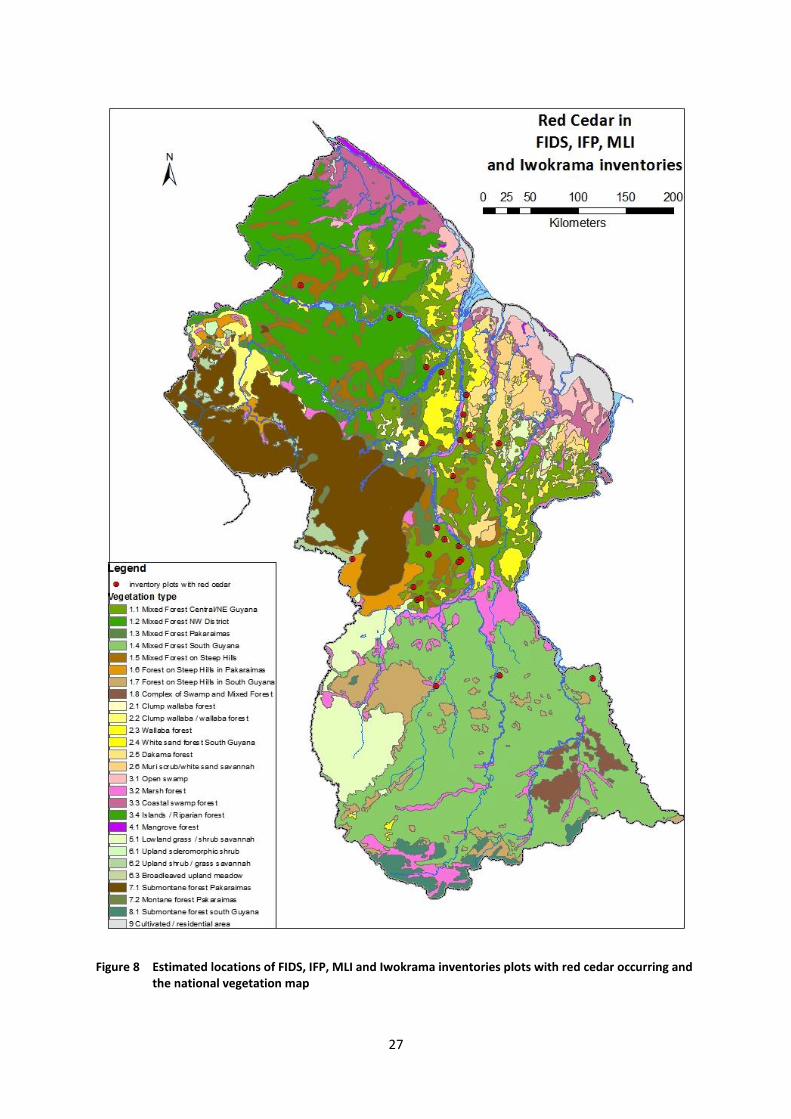
27
Figure 8 Estimated locations of FIDS, IFP, MLI and Iwokrama inventories plots with red cedar occurring and the national vegetation map

28
Table 3 Forest and soil types of the plots with red cedar in the IFP inventory
Forest type Soil type brown sand clay flooded pegasse Total
Mixed forest 2 1 1 4 Swamp forest 1 1 2
Total 1 1 2 1 6
Table 4 Forest and soil types of the plots with red cedar in the MLI inventories
Forest type Soil type brown
sand clay loam pegasse white
sand total
Dakama forest 1 1 Mixed forest 4 1 1 1 7 Mora forest 1 1 Swamp forest 2 2 4
Total 4 2 1 3 3 13
Table 5 Forest types of the plots with red cedar in the Iwokrama inventories
Forest type Total
Manicole, Kokorite, Soft Wallaba forest 4 Mixed Greenheart, Black Kakaralli, Wamara forest 3 Wallaba forest 1 Mixed Greenheart, Sand Baromalli, Soft Wallaba forest 1
Total 9
Based on the four forest inventories, red cedar does not seem to have a clear preference for a
specific forest or soil type, but appears to occur on most soil types from pegasse, to loam, to white
sand and in most forest types from swamp forest to dakama (Dimorphandra conjugata) forest.
5.3 Land use allocation in Guyana
Guyana’s land area is divided into State Forest, Amerindian Village Lands and other Private Lands,
State Land (mainly Agricultural leases), and protected area reserves, as shown in Figure 9. Roughly
7.1 million hectares of State Forest have been allocated for wood production purposes. The
unallocated State Forest area amounts to 5.2 million hectares and is located in the South and the
West of the country. 1.16 million hectares are protected areas, including Iwokrama with 371,681
hectares, Kaieteur National Park with 61,091 hectares, and Shell Beach and Kanuku Mountains
together covering 730,300 hectares.
The Guyana Forestry Commission (GFC) holds the management rights for all State Forest and issues
leases and permits to concessionaires for the commercial harvest of timber. After the lease period
the concessions are renewed or returned to the GFC depending on certain factors inclusive of
sustainable harvesting levels. There are four types of permit, which include10:
10 Forest Sector Information Report, Annual Review 2014. Guyana Forestry Commission, Georgetown, Guyana.

29
Timber sales agreement (TSA): concessions of more than 24,281 ha for a duration of 20
years minimum. As per 31st December 2014, 27 TSAs had been allocated covering an area of
4.4 million hectares (63% of the State Forest area that is allocated for production purposes).
The average size of TSAs was 123,630 hectares (ranging from 7.5 thousand to 1.6 million
hectares).
Wood cutting lease (WCL): concessions between 8,094 and 24,281 hectares and allocated
for 3 to 10 years. As per 31st December 2014, there was one licence covering an area of
about 21,267 hectares (0.3% of all allocated State Forest).
State Forest Permit (SFP): concessions allowing owners to remove a predetermined quantity
(quota) of timber from within the forest concession boundaries. SFPs are valid for a period
of 1-2 years and are for area sizes less than 8,093 ha. SFPs are generally issued to small-scale
operators and community-based associations. As per 31st December 2014, 525 permits
covering a total area of 2.1 million hectares were issued (29% of all allocated State Forest).
The average size of SFPs was 3,495 hectares.
State Forest Exploratory Permit (SFEP): a 1-3 yrs. exploratory permit issued for undertaking
exploratory operations such as inventories, environmental and social impact assessments
and the preparation of management plans. An SFEP holder is allowed to harvest a
percentage of its calculated annual allowable cut during the exploratory stage subject to GFC
approval. SFEPs are a pre-requirement for new large concessions (TSAs and WCLs). As per
31st December 2014, seven exploratory permits covering an area of 570,302 hectares were
in effect (8% of all production area allocations).
WCLs and TSAs are considered ‘large concessions’ and are required to demarcate their boundaries
on the ground, undertake 100% pre-harvest inventories, comply with the Code of Practice of Forest
Operations for TSAs and WCLs, and submit a forest management plan and annual operations plan to
the GFC before commencement of harvesting operations. The latter specifies the forest blocks to be
harvested that year and the volume to be extracted. Volume is calculated based on concession area
and felling cycle and tags are issued accordingly. Harvested blocks are inspected by GFC field staff to
ensure adherence to the annual operations plan.
‘Small concessions’ (SFPs) are normally issued for a 2-yr period, which commences in an even year
(e.g. 2012-2013). The GFC calculates the Annual Allowable Cut (quota) for SFPs based on the area of
the SFP and previous harvesting history. The quota is calculated for either a 12-mo or a 24-mo
period depending on the SFP-holder’s previous performance and date of issue of the SFP. SFP
holders are not required to conduct inventories or to prepare forest plans, but they need to comply
with the Code of Practice of Forest Operations for SFPs.
5.3.1 Geographic distribution of red cedar based on stock surveys in TSAs
TSA holders are required to conduct a systematic 100% pre-harvest inventory (stock survey) covering
their annual operating area and are obliged to provide this information to the Guyana Forestry
Commission (GFC). Stock surveys conducted over the period 2010-2014 were assessed for the
occurrence of red cedar. The species was encountered in 11 out of the 23 active TSAs. In total, 393
red cedar trees had been enumerated in 224 blocks; an average of 1.7 trees per block (maximum 7
trees per block).
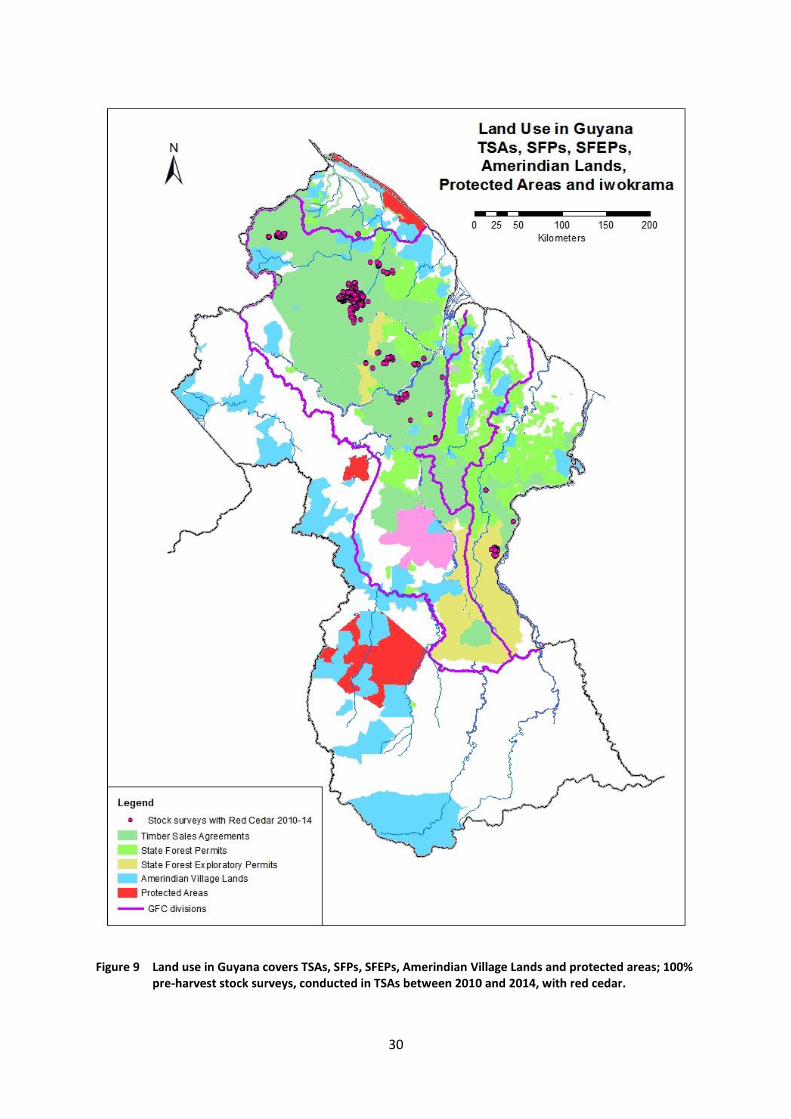
30
Figure 9 Land use in Guyana covers TSAs, SFPs, SFEPs, Amerindian Village Lands and protected areas; 100% pre-harvest stock surveys, conducted in TSAs between 2010 and 2014, with red cedar.

31
Figure 10 100% pre-harvest inventory blocks with red cedar in Timber Sales Agreements (2010-2014) overlaid on FAO-FIDS regional forest type map

32
Occurrence of red cedar in stock survey blocks is show in Figure 9. Vegetation types are usually not
recorded on a block level, because the forest type usually varies within a 100-ha block. No exact
forest type is thus known for the encountered red cedar trees. However, in the case of stock surveys
each tree within a block is georeferenced and it may be worthwhile to intersect the vegetation map
and tree locations to determine site preferences for red cedar (Figure 10).
Intersection of the FAO-FIDS regional forest type map layer with the layer with the red cedar
positions in 100% stock survey blocks was performed with ArcGIS spatial join tool. Results are shown
in Table 6. For the national vegetation map results are shown in Table 7.
Table 6 Geographic distribution of red cedar based on stock surveys in TSAs. Distribution of enumerated trees according to FAO-FIDS forest types
Forest type Number of red cedar trees
1 Mixed forest on undulating to hilly terrain 251 1b Mixed forest on flat to undulating terrain - W. Guyana 8 1c Mixed forest on deeply dissected, steeply sloping terrain 49 1e Mixed forest on flat to undulating terrain - E. Guyana 38 1h Mixed forest on steep high hills and mountains 24 1l Clump Wallaba forest 6 1m Small-crowned forest on flat to undulating terrain 4 2a Wallaba forest 13
Total 393
Table 7 Geographic distribution of red cedar based on stock surveys in TSAs. Distribution of enumerated trees according to national vegetation types
Vegetation type Number of red cedar trees
1.1 Mixed Forest Central/NE Guyana 49 1.2 Mixed Forest NW District 259 1.3 Mixed Forest Pakaraimas 15 1.5 Mixed Forest on Steep Hills 23 2.3 Wallaba forest 47
Grand Total 393
Initially, stock survey data had shown that red cedar occurred in the Variety Woods & Greenheart
Ltd. concession in the Demerara District and in the W.A.I.C.O., and Haiomarakabra concessions in
the Berbice district. Records of red cedar occurrences in these stock surveys were verified on the
ground and it appeared that Apeiba petoumo (duru), Bombax sp. (kamakuti), Calophyllum lucidum
(kurahara), Humiria balsamifera var. balsamifera (tauroniro), or Tabebuia insignis var. monophylla
(white cedar) trees had been mistaken for red cedar. Verification of red cedar trees encountered in
stock surveys in two blocks in the Barama Co. Ltd. concession and in two blocks in the Vaitarna
Holding Private Inc. concession showed that the species were identified properly. Occurrence of red
cedar in the Bai Shan Lin SFEP in the Berbice district is unsure because of the misidentifications in
the three nearby concessions.
5.4 Geographic distribution of red cedar based on production records
The Guyana Forestry Commission’s log tracking system requires that each harvested tree is
measured and tagged. These tag numbers with measurements of each tree are reported on removal

33
permits and associated production registers. The log tracking system not only applies to small and
large concessions but also to Amerindian lands, which are reported to be important producers of red
cedar.
Figure 11 Locations of red cedar production over the period 2009-2014. TSAs: blocks from where the logs originated are shown, while for SFPs and AVLs the locations of the concessions are shown

34
red cedar production figures for the period 2009-2014 by concession (including Amerindian Village
Lands) were scrutinized for red cedar. Since production figures could provide additional information
on the distribution of red cedar, in particular where it concerns Amerindian lands and small
concessions, an attempt was made to further trace back volumes and source of origin. In case of
TSAs, red cedar production can even be traced back to the block. To this end, ‘used species reports’
for red cedar were requested from the GFC MIS department.
This exercise provided detailed positional information for production from TSAs, while production
from SFPs and AVLs can be traced to the individual concession or AVL. The size of SFPs is limited to
approximately 8,094 ha and their average size is about 3,500 ha. The average size for the SFPs with
red cedar production was 4,315 ha and the maximum size 8,094 ha; the legal maximum limit for
SFPs. The average size of the Amerindian Village Lands amounts to 29,073 ha and the maximum size
to 620,791 ha for Konashen in South Guyana. The average size for the AVLs with red cedar
production was 20,720 ha and the maximum size 63,675 ha for St. Cuthbert’s mission.
Origin of red cedar production over 2009-2014 is depicted in Figure 11. For TSAs the blocks from
where the logs originated are shown, while for SFPs and AVLs the locations of the concessions are
shown.
5.5 Proven and possible geographic distribution of red cedar
Based on the FAO-FIDS, IFP, MLI and Iwokrama forest inventories, red cedar does not seem to have a
specific preference for a certain forest or soil type, but appears to occur on all soil types from
pegasse, to loam, to white sand and in many forest types from swamp forest to dakama forest. Data
from 100% pre-harvest stock surveys in large concessions (Timber Sales Agreements) and production
statistics from small concessions (State Forest Permits) and Amerindian Village Lands confirm that
the species is found in various forest types; from mora forest, to mixed forest on undulating to hilly
terrain, on deeply dissected terrain, on steep high hills, and also in wallaba forest on white sand
soils.
Forest and soil typing of the inventory plots may have been based on the general area, while small-
scale ecotope differences, e.g. along seasonal streams, may have been overlooked when assessing
the plot characteristics. Within the wallaba and dakama forests on deep, excessively drained white
sand soils, small spatially explicit ecotopes may occur along (seasonal) creeks for instance. A general
pattern of soil types in the sedimentary plains is that the white sands have an extremely sharp
boundary with other soil types (Van Kekem et al, 1996). The same, obviously, applies to forest typing
based on the FAO-FIDS regional forest type map and national vegetation map, which type is rather
course and ignores small-scale ecotope differences.
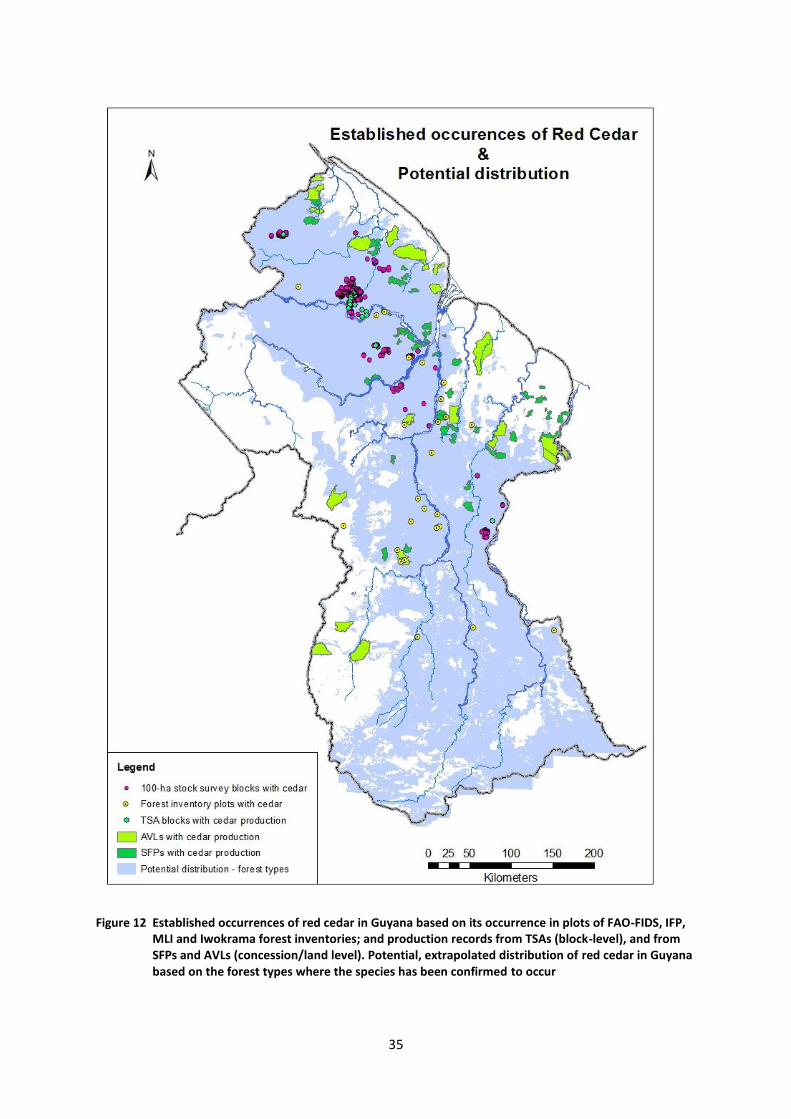
35
Figure 12 Established occurrences of red cedar in Guyana based on its occurrence in plots of FAO-FIDS, IFP, MLI and Iwokrama forest inventories; and production records from TSAs (block-level), and from SFPs and AVLs (concession/land level). Potential, extrapolated distribution of red cedar in Guyana based on the forest types where the species has been confirmed to occur
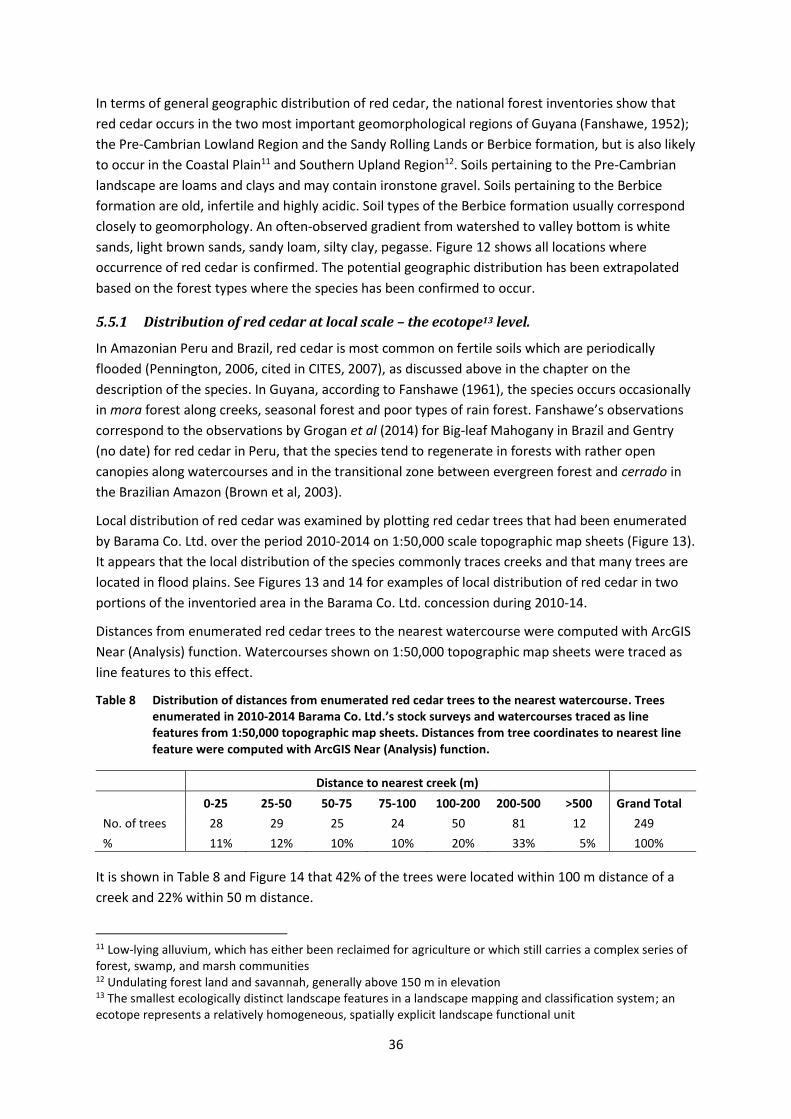
36
In terms of general geographic distribution of red cedar, the national forest inventories show that
red cedar occurs in the two most important geomorphological regions of Guyana (Fanshawe, 1952);
the Pre-Cambrian Lowland Region and the Sandy Rolling Lands or Berbice formation, but is also likely
to occur in the Coastal Plain11 and Southern Upland Region12. Soils pertaining to the Pre-Cambrian
landscape are loams and clays and may contain ironstone gravel. Soils pertaining to the Berbice
formation are old, infertile and highly acidic. Soil types of the Berbice formation usually correspond
closely to geomorphology. An often-observed gradient from watershed to valley bottom is white
sands, light brown sands, sandy loam, silty clay, pegasse. Figure 12 shows all locations where
occurrence of red cedar is confirmed. The potential geographic distribution has been extrapolated
based on the forest types where the species has been confirmed to occur.
5.5.1 Distribution of red cedar at local scale – the ecotope13 level.
In Amazonian Peru and Brazil, red cedar is most common on fertile soils which are periodically
flooded (Pennington, 2006, cited in CITES, 2007), as discussed above in the chapter on the
description of the species. In Guyana, according to Fanshawe (1961), the species occurs occasionally
in mora forest along creeks, seasonal forest and poor types of rain forest. Fanshawe’s observations
correspond to the observations by Grogan et al (2014) for Big-leaf Mahogany in Brazil and Gentry
(no date) for red cedar in Peru, that the species tend to regenerate in forests with rather open
canopies along watercourses and in the transitional zone between evergreen forest and cerrado in
the Brazilian Amazon (Brown et al, 2003).
Local distribution of red cedar was examined by plotting red cedar trees that had been enumerated
by Barama Co. Ltd. over the period 2010-2014 on 1:50,000 scale topographic map sheets (Figure 13).
It appears that the local distribution of the species commonly traces creeks and that many trees are
located in flood plains. See Figures 13 and 14 for examples of local distribution of red cedar in two
portions of the inventoried area in the Barama Co. Ltd. concession during 2010-14.
Distances from enumerated red cedar trees to the nearest watercourse were computed with ArcGIS
Near (Analysis) function. Watercourses shown on 1:50,000 topographic map sheets were traced as
line features to this effect.
Table 8 Distribution of distances from enumerated red cedar trees to the nearest watercourse. Trees enumerated in 2010-2014 Barama Co. Ltd.’s stock surveys and watercourses traced as line features from 1:50,000 topographic map sheets. Distances from tree coordinates to nearest line feature were computed with ArcGIS Near (Analysis) function.
Distance to nearest creek (m)
0-25 25-50 50-75 75-100 100-200 200-500 >500 Grand Total
No. of trees 28 29 25 24 50 81 12 249
% 11% 12% 10% 10% 20% 33% 5% 100%
It is shown in Table 8 and Figure 14 that 42% of the trees were located within 100 m distance of a
creek and 22% within 50 m distance.
11 Low-lying alluvium, which has either been reclaimed for agriculture or which still carries a complex series of forest, swamp, and marsh communities 12 Undulating forest land and savannah, generally above 150 m in elevation 13 The smallest ecologically distinct landscape features in a landscape mapping and classification system; an ecotope represents a relatively homogeneous, spatially explicit landscape functional unit

37
Figure 13 Map of a portion (c. 5000 ha) of the 100% pre-harvest inventory blocks in the Barama Co. Ltd. concession that were enumerated over 2010-14; showing red cedar locations, streams and topography. The smaller rectangle outlines the location of the larger map within the Barama Co. Ltd. concession.

38
Figure 14 Distribution of distances from enumerated red cedar trees to the nearest watercourse on 1:50,000 maps. Trees were enumerated in 2010-2014 Barama Co. Ltd.’s stock surveys and watercourses are defined as shown on 1:50,000 topographic map sheets. Distances were computed with ArcGIS Near (Analysis) function.
According to Guyana’s Code of Practice (2014), no trees may be felled in riparian or streamside
vegetated zones (buffer zones). Buffer zone widths depend on the nature and size of the
watercourse; rivers (width > 30 m) have a 30 m buffer zone on either side, creeks wider than 10 m a
buffer zone of 20 m on either side, creeks narrower than 10 m a buffer zone of 10 m on either side.
It can be assumed that most creeks in the surveyed area have widths less 10 m. Given the fact that
the distance to the creeks is based on the distance to a linear feature, the width of the creek itself
should be taken into consideration to assess whether trees fall within a buffer zone. This suggests
that at least 7% of the trees fall within a buffer zone. The depiction of watercourses on the 1:50,000
map sheets are based on aerial photo interpretation (API). Because of the forest cover API results in
an approximation of their true course. Moreover, small creeks (< 5 m width) are often not depicted
on the map sheets. Examination of the location of the trees on the topographic map sheets further
revealed that 52% of the 249 enumerated trees were located in floodplains, whereby a floodplain is
defined as being limited by the first contour line from a watercourse on the topographic map sheets.
Another source of information is formed by stock maps that are prepared using 100% pre-harvest
inventory tree and terrain data. The tree data in combination with their location allows identification
of the forest type as defined by the dominant tree species. It appears that 47% of the 249
enumerated red cedar trees occurred in Mixed Forest, 42% in mora Forest, 9% in wallaba Forest and
2% in greenheart Forest.
Creeks, small streams and gullies are normally mapped during the stock survey exercise. For 23
blocks stock maps were available on which creeks, small streams and gullies were mapped. This not
only implies that the location of the creeks can be known more precisely than in case of the
topographic map sheets, but moreover that small creeks, (seasonal) streams and gullies are mapped
that are not shown on the topographic map sheets. In the 23 blocks 35 red cedar trees were
enumerated. Out of these 35 trees 71% were located within 10 m of a watercourse and as much as
94% within 20 m of a watercourse; 20% within 10 m distance from a creek and 51% within 10 m
distance from a gully or seasonal stream (see Table 9)
11% 12%10% 10%
20%
33%
5%
0
10
20
30
40
50
60
70
80
90
No
. of
Tre
es
Distance to Watercourse m

39
Table 9 Distribution of distances from 35 enumerated red cedar trees to the nearest watercourse in 23 stock survey blocks. Distances from tree coordinates to nearest water feature (creek, gully or ephemeral stream) were taken from stock maps.
Distance to nearest water feature (m)
Type of watercourse 0-9 10-19 20-29 ≥30 Total
Creek 7 4 11
Gully 10 2 1 1 14
Seasonal stream 8 2 10
Total 25 8 1 1 35
In addition, the occurrence of red cedar was verified on the ground in two pre-harvest inventory
blocks; block 33-C (South-western corner UTM coordinates X = 221000 m and Y = 783000 m) and
block 34-C (UTM coordinates X = 221000 m and Y = 784000 m). Besides confirming that the trees
were correctly identified and the inventory concluded reasonably14 accurately, this revealed that
seven out of eight checked red cedar trees were located at close distance to seasonal streams while
only one was located on “dryland”. The verification exercise took place during a 10% strip sample of
sub-adult red cedar trees in the two blocks.
At local scale, red cedar thus appears to occur mainly in mixed or mora forest along watercourses;
particularly gullies and seasonal streams. This implies that seed dispersal may be assisted by water
flows, similar to the dispersal of Mora excelsa seeds. In terms of forest management, an estimated
20% of the red cedar population appears to be excluded from harvesting because they occur in creek
buffer zones. In addition, an estimated 50% of the population falls within gully and small stream
buffer zones, where felling is allowed but machine access is not. Such trees hence need to be
extracted by winching or manually.
14 Two overlooked red cedar trees were encountered during the verification/sampling exercise
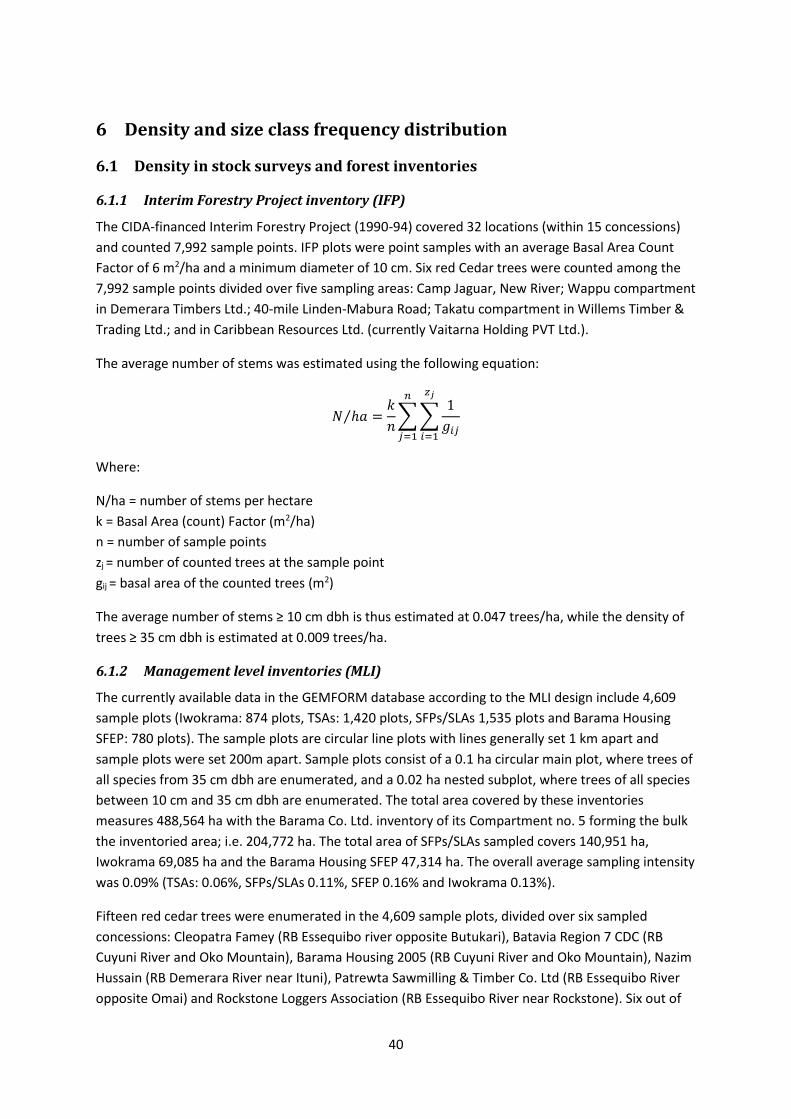
40
6 Density and size class frequency distribution
6.1 Density in stock surveys and forest inventories
6.1.1 Interim Forestry Project inventory (IFP)
The CIDA-financed Interim Forestry Project (1990-94) covered 32 locations (within 15 concessions)
and counted 7,992 sample points. IFP plots were point samples with an average Basal Area Count
Factor of 6 m2/ha and a minimum diameter of 10 cm. Six red Cedar trees were counted among the
7,992 sample points divided over five sampling areas: Camp Jaguar, New River; Wappu compartment
in Demerara Timbers Ltd.; 40-mile Linden-Mabura Road; Takatu compartment in Willems Timber &
Trading Ltd.; and in Caribbean Resources Ltd. (currently Vaitarna Holding PVT Ltd.).
The average number of stems was estimated using the following equation:
𝑁 ℎ𝑎⁄ =𝑘
𝑛∑∑
1
𝑔𝑖𝑗
𝑧𝑗
𝑖=1
𝑛
𝑗=1
Where:
N/ha = number of stems per hectare
k = Basal Area (count) Factor (m2/ha)
n = number of sample points
zj = number of counted trees at the sample point
gij = basal area of the counted trees (m2)
The average number of stems ≥ 10 cm dbh is thus estimated at 0.047 trees/ha, while the density of
trees ≥ 35 cm dbh is estimated at 0.009 trees/ha.
6.1.2 Management level inventories (MLI)
The currently available data in the GEMFORM database according to the MLI design include 4,609
sample plots (Iwokrama: 874 plots, TSAs: 1,420 plots, SFPs/SLAs 1,535 plots and Barama Housing
SFEP: 780 plots). The sample plots are circular line plots with lines generally set 1 km apart and
sample plots were set 200m apart. Sample plots consist of a 0.1 ha circular main plot, where trees of
all species from 35 cm dbh are enumerated, and a 0.02 ha nested subplot, where trees of all species
between 10 cm and 35 cm dbh are enumerated. The total area covered by these inventories
measures 488,564 ha with the Barama Co. Ltd. inventory of its Compartment no. 5 forming the bulk
the inventoried area; i.e. 204,772 ha. The total area of SFPs/SLAs sampled covers 140,951 ha,
Iwokrama 69,085 ha and the Barama Housing SFEP 47,314 ha. The overall average sampling intensity
was 0.09% (TSAs: 0.06%, SFPs/SLAs 0.11%, SFEP 0.16% and Iwokrama 0.13%).
Fifteen red cedar trees were enumerated in the 4,609 sample plots, divided over six sampled
concessions: Cleopatra Famey (RB Essequibo river opposite Butukari), Batavia Region 7 CDC (RB
Cuyuni River and Oko Mountain), Barama Housing 2005 (RB Cuyuni River and Oko Mountain), Nazim
Hussain (RB Demerara River near Ituni), Patrewta Sawmilling & Timber Co. Ltd (RB Essequibo River
opposite Omai) and Rockstone Loggers Association (RB Essequibo River near Rockstone). Six out of

41
these 15 trees were below 35 cm dbh and sampled in the subplot (0.02 ha). When considering all
sampled areas, the average number of trees per ha is estimated at 0.085/ha; 10-35 cm dbh class:
0.065/ha and ≥ 35 cm dbh: 0.020/ha. This estimate is higher than the one obtained from the stock
surveys, but appears to agree with the estimates of stakeholders. It must be realized that the
estimates are not reliable minimum estimates and the coefficient of variation is extremely high; i.e.
3920% and 2922% respectively.
6.1.3 FAO-FIDS forest reconnaissance surveys
The FAO-supported Forest Industry Development Survey (FIDS) covered 89 locations and included
1,016 plot clusters with a combined size varying between 0.1 ha and 1 ha, where trees were
enumerated from 12 inches up in 4-inch diameter classes. Five red cedar trees were enumerated
divided over five sampling areas: Korotoko trail, Buru buru, Essequibo, Kwitaro River and Monkey
Mountain. The average number of trees per ha above 12 inches (30 cm) dbh was estimated at
0.017/ha.
6.1.4 100% pre-harvest inventories (stock surveys)
Stock surveys conducted over the period 2010-2014 were assessed for the occurrence of red cedar.
The species was encountered in 11 out of the 23 active TSAs. It appeared that a total of 393
occurrences of red cedar were reported in 224 blocks (average 1.7 trees per 100-ha block and a
maximum of 7 trees per 100-ha block). During the studied period, 2728 blocks (272,800 ha) were
enumerated, suggesting that red cedar occurred in 8% of the blocks that had been inventoried
countrywide. It can hence be deducted that the density across all surveyed blocks was only 1 tree
per 694 ha or 0.14 trees per 100-ha block.
It should be noted that stock survey information is not as reliable as true forest inventory
information. First, it is not known with certainty whether red cedar is included on the species list for
all stock surveys or what the minimum diameter for enumeration for the species is. Secondly, results
from stock surveys may be biased because of poor species identification and because of rushed
execution of some stock surveys. Red cedar is not well-known among tree spotters as shown by
verification of red cedar specimens in five blocks in four concessions, which took place in April and in
August 2015. In three concessions other species such as Apeiba petoumo (duru), Bombax sp.
(kamakuti), Calophyllum lucidum (kurahara), Humiria balsamifera var. balsamifera (tauroniro), or
Tabebuia insignis var. monophylla (white cedar) trees had been mistakenly identified as red cedar.
In four blocks in two other concessions, where three and twelve harvestable red cedar trees
respectively were recorded during stock surveys, the species was correctly identified but the
verification exercise also showed that two harvestable red cedar trees were overlooked during stock
surveys in each concession.
The most reliable stock survey seems to be the one carried out by Barama Co. Ltd., where 249 red
cedar trees were found in 142 out of the 1033 blocks (14%) that were surveyed over the period
2010-14; indicating a density of 0.24 tree per 100 ha. As mentioned above, the verification exercise
showed that two trees had been overlooked; translating to 14% of the trees. The likely density was
therefore adjusted upward and is presumed to be 0.30 trees ≥ 40 cm dbh per 100 ha from this point
onwards.

42
6.1.5 Estimated density of Red Cedar trees in Guyana
The estimated average density of red cedar ≥ 10 cm dbh ranges from 1 tree per 60 hectares or 0.017
trees/ha (FAO-FIDS) to 1 tree per 12 hectares or 0.085 trees/ha (MLI) according to the national
forest inventories. The estimated density of trees ≥ 35 cm dbh ranges from 1 tree per 118 hectares
or 0.009 trees/ha (IFP) to 1 tree per 51 hectares or 0.020 trees/ha (MLI).
Stock surveys conducted between 2010 and 2014 suggest a much lower density of trees with dbh ≥
40 cm; only 1 tree per 694 ha or 0.14 tree per 100 ha. Given the observation that most stock surveys
are unreliable where it comes to red cedar, the corrected estimated based on Barama Co. Ltd’s stock
survey suggests a density of 0.30 tree ≥ 40 cm dbh per 100 ha. The species is thus definitely rare in
Guyana [< 1 tree/ha; cf Hubbell & Foster (1986)], and could even be regarded as very rare [less than
1 tree per 100 ha; cf Schulze et al (2008)] based on the stock surveys that were conducted during
2010-14.
6.2 Size class frequency distribution in stock surveys and forest inventories
The diameter class frequency distributions vary widely between the inventories (Table 10, Figure
15). The size-class structures recorded in the three national forest inventories are all reverse-J-
shaped, with progressively lower stem numbers in successive diameter classes indicating a
favourable population structure for sustainable forest management.
Table 10 Diameter class frequency distribution in numbers of trees per 100 ha for red cedar in 224 stock survey blocks (blocks with red cedar only) and three national forest inventories
Forest inventory
Diameter class in cm Totals 10-20 20-34 35-44 45-54 55-64 65-74 75-84 85+ 10-34 ≥ 35 ≥ 55
Stock surveys - - 0.11 0.43 0.42 0.38 0.17 0.25 - 1.75 1.22 FAO-FIDS15 - - 1.08 0.20 0.20 0.00 0.00 0.20 - 1.67 0.39 IFP 0.00 3.80 0.57 0.00 0.00 0.00 0.15 0.13 3.80 0.85 0.28 MLI 4.34 2.17 0.43 0.65 0.43 0.22 0.22 0.00 6.51 1.95 0.87
In 1898, the French forester de Liocourt observed that the size distribution of stems in an uneven-
aged natural forest tended to form a reverse-J curve or negative exponential distribution, in which
the ratio of stem numbers in adjacent size classes remains constant, provided the size classes are the
same width: n1 /n2 = n2 /n3 = n3 /n4 = . . . This ratio is known as de Liocourt's quotient, q (Vanclay,
1994). According to De Liocourt (1898; in Alder, 1995) numbers in successive diameter classes of a
stand table for an uneven-aged forest tend to form a geometric series, such that the ratio between
successive classes have the same constant ratio (Q). This ratio (Q) between classes is usually termed
the De Liocourt Quotient. Meyer (1933; in Alder, 1995) showed that a diameter class distribution
with constant Q-ratio values was mathematically equivalent to an exponential distribution. The
exponential distribution for tree numbers with respect to diameter can be expressed as:
𝑁𝑑 = 𝑁𝑇 ∙ (1 − exp(−𝛼 ∙ (𝑑 − 𝑑0))
15 FAO-FIDS reconnaissance survey enumerated trees in 4-inch diameter classes starting from 12 inches. Header row for this inventory reads 10-20, 20-30, 30-40, 40-50, 50-60, 60-70, 70-80, 80+, 10-30, ≥ 30, ≥ 50

43
where, Nd is the total number of trees up to diameter d, NT Is the total number of trees, d0 is the
lower limit of the smallest diameter class, and α Is an empirical constant. The higher the value of α
the steeper is the progressive decline in stem numbers from smaller to the larger diameter classes.
Figure 15 Density of red cedar trees in diameter classes (n/100 ha) in stock surveys (393 trees); and FAO-FIDS (5 trees), IFP (6 trees) and MLI (15 trees) inventories (note different Y-axis scales).
The diameter class distributions found for the national inventories (pooled plots) do not deviate
from an exponential (De Liocourt) distribution, but the distribution according to the stock surveys
(pooled blocks) does (Table 11). It must be realized that in mixed tropical stands the premise of a
constant De Liocourt Quotient generally does not hold well and many commercially valuable species
are likely to have an irregular distribution (Alder 1995).
Table 11 De Liocourt ratios for red cedar in the three national inventories an stock surveys, constant α in exponential distribution equations, Chi-square statistic and probability of deviation from expected distribution with given value α ; distributions found for the national inventories (pooled plots) do not deviate significantly from an exponential (De Liocourt) distribution, but the distribution according to the stock surveys (pooled blocks) does.
Mean ‘De Liocourt’ -
ratio
Value of α 𝛘𝟎.𝟎𝟓𝟐
-value Degrees of freedom
Probability
Stock surveys 1.53 0.026 250.37 12 <0.001 FAO-FIDS16 - 0.048 1.49 7 0.91 IFP - 0.051 9.16 5 0.24 MLI 1.40 0.059 4.71 7 0.69
A depression in the 35–45 cm class and increasing densities again towards larger size classes are
shown for the MLI inventories; depressions in the 65-84 cm classes in the FAO-FIDS surveys and 45-
16 Average De Liocourt ratio not available due to zero values in one or more diameter classes.

44
74 cm classes in the IFP point samples. Such depressions could coincide with the size at which the
trees reach their maximum growth rates, and may thus be caused by faster growth through these
size classes followed by accumulation at larger size classes with lower growth rates. However, it
must be realized that the trees in the size-class structures in Figure 15 belong to different
populations and, moreover, are based on very small numbers of trees.
The size-class structure shown for the combined stock survey shows the opposite with fewer
juveniles than adults and no depressions in the mid-size classes, but with a depression in the 35–45
cm class just like observed in the MLI inventories. This depression could be due to minimum
diameter that was stipulated for the stock survey, which could be higher than 35 cm dbh in certain
stock surveys. To further analyse the population structures, stock surveys within some concessions
were studied separately.
Four out of five size-class structures of the five geographically separated red cedar ‘populations’
show lower frequencies in the 40-49 cm class than in the 50-59 class (Figure 16). The population at
Bai Shan Lin (East-Guyana) shows deficiency in all lower diameter classes (40-69 cm). Based on the
records it can safely be assumed that these stock surveys used a minimum diameter limit of 40 cm;
only three trees below 40 cm were recorded. None of the size-class structures is reverse-J-shaped;
i.e., fewer juveniles than adults were recorded indicating an unfavourable population structure for
sustainable forest management.
Figure 16 Size-class structures of five geographically segregated red cedar ‘populations’. Barama Co Ltd (A) - covers 41 blocks situated between UTM X = 203060, Y = 763021 and X = 221290, Y = 774053 (18 x 11 km); Barama Co Ltd (B) - 62 blocks situated between UTM X = 216075, Y = 756398 and X = 236180, Y = 773470 (20 x 17 km); Barama Co Ltd (C) - 27 blocks situated between UTM X = 215680, Y = 738650 and X = 227960, Y = 757754 (12 x 19 km); Jaling Forest Industries Inc. - 21 blocks situated between UTM X = 123302, Y = 836044 and X = 142108, Y = 840800 (19 x 5 km); Bai Shan Lin - 15 blocks situated between UTM X = 376880, Y = 473257 and X = 383825, Y = 483305 (7 x 10 km)
Records on juveniles (dbh < 35 cm) are only available from national forest inventories and are
basically inconclusive; being based on 11 records only.

45
10% strip samples were conducted in April 2015 and August 2015 in four 100% pre-harvest inventory
blocks that were surveyed in 2014, two of these blocks were in the Barama Co. Ltd. concession and
two in the Vaitarna Holding PVT Ltd. concession. The blocks in the Barama Co. Ltd. concession were
not harvested yet, implying that sub-adult red cedar trees had not suffered any logging damage or
might have been overlooked due to felling gaps. The strip sample consisted of 5 equally spaced strips
in the 4 blocks, resulting in a sample of 20 strips in all. The centre line of each 20-m wide strip
coincided with a central strip line established by companies in order to save time. The first line was
randomly selected (central line of either strip 1 or strip 2) and subsequent lines were spaced 200 m
apart. Trees would be included in the sample if their centre was located within 10 m of either side of
the centre line.
Only one sub-adult tree with a diameter of 39 cm dbh was recorded in the sample resulting in an
estimated mean density of sub-adults of 5 trees per 100-ha for the Barama Co. Ltd. concession. The
sample was relatively small and the statistical error in the reported mean density is rather great; the
95% confidence interval of the mean is 5 ± 11 trees per 100-ha.
6.3 Volumes of red cedar in stock surveys and forest inventories
6.3.1 Volumes in national forest inventories
In the Management level inventories (MLI) surveys, nine harvestable red cedar trees ≥ 35 cm dbh
were enumerated in the 4,609 sample plots, divided over four of the sampled concessions. When
considering all sampled areas, the average volume per ha is estimated at 0.08 m3/ha.
During the Interim Forestry Project (1990-94) three red cedar trees ≥ 35 cm dbh were counted at the
7,992 sample points divided over three sampling areas. The average volume is estimated using the
following equation:
𝑉 ℎ𝑎⁄ =𝑘
𝑛∑∑
𝑣𝑖𝑗
𝑔𝑖𝑗
𝑧𝑗
𝑖=1
𝑛
𝑗=1
Where:
V/ha = volume per hectare
k = Basal Area (count) Factor (m2/ha)
n = number of sample points
zj = number of counted trees at the sample point
gij = basal area of each counted tree (m2)
vij = volume of each counted tree (m3)
The average volume was thus estimated at 0.028 m3/ha.
Three red cedar trees ≥ 16 inch dbh were enumerated during the FAO-supported Forest Industry
Development Survey (FIDS). The average volume per ha above 40 cm dbh was estimated at 0.024
m3/ha.

46
6.3.2 Volumes in 100% pre-harvest inventories
A total volume of 1,121 m3 was reported for the 224 blocks where red cedar was encountered
during 2010-14 with and a maximum of 37.9 m3 per 100-ha block. As mentioned before, 2728 blocks
(272,800 ha) had been enumerated during the period, implying that red cedar occurred in 8% of the
blocks that had been inventoried countrywide. It can hence be deducted that the average volume
for all blocks that were surveyed during 2010-14 amounted to 0.4 m3 per 100-ha block. This
estimate is more than 10 times less than the one found based on the MLI inventories.
As mentioned in section 6.1.4, many stock surveys did not prove to be reliable where it concerns
enumeration of red cedar trees and the most reliable stock survey seems to be the one by Barama
Co. Ltd. The 249 red cedar trees that were enumerated in that concession over the period 2010-14
had a total volume of 629.5 m3; indicating a volume of 0.61 m3 per 100 ha. Based on the assessment
that also in those stock surveys some trees were overlooked, the estimate is adjusted upwards to
0.76 m3 per 100 ha.
The estimated volume of red cedar ≥ 35 cm dbh thus ranges from 2.4 m3 per 100 ha (FAO-FIDS) to
6.0 m3 per 100 ha (MLI) according to the national forest inventories. Stock surveys conducted
between 2010 and 2014 suggest a much lower volume; i.e., 0.76 m3 per 100 ha.

47
7 Regeneration dynamics and sustainable harvest levels
7.1 Growth and yield of red cedar in Guyana
Permanent sample plots have been the single most important source of tree growth data of tropical
trees. Data from permanent plots are used to project tree growth over long time spans and calculate
timber yields with growth models (e.g., Alder, 2000, 2001, 2008). In Guyana, PSP data are available
for two locations; the Tropenbos Pibiri plots established in the Demerara Timbers Ltd concession in
Central Guyana in 1993 and plots established by the Edinburgh Centre for Tropical Forests (ECTF) in
1993 in the North-West District near Port Kaituma in Barama Co. Ltd.’s Compartment 1.
A classical method to estimate (stand) growth is diameter class or stand table projection, which is
one of the oldest techniques used to determine the future composition of uneven-aged forests, with
numerous examples in the literature and in standard textbooks (e.g. Husch et al. 1982, Vanclay 1994,
Alder 1995). The basic concept of the classical diameter class projection model is that the forest is
represented as a stand table of tree numbers classified by diameter classes; usually of equal width
(e.g. 10–19, 20–29, …, 100+ cm dbh). The method predicts the future stand table from the present
stand table by adjusting each entry in the table with the estimated diameter increment and
mortality for that class; calculated over an interval of for instance 5-10 year using periodic increment
data. The revised table is then used as the starting point to repeat the calculations. Increment,
mortality and ingrowth observations made from PSPS or from literature may be used to estimate
growth over a full felling cycle or rotation, which may be 25 years or more. It is often difficult to
compile outgrowth rates directly from PSP data and it will need to be estimated from mean
increment for a diameter class. Such approach assumes that trees in each diameter class are
uniformly distributed through the class and that each tree grows at the average rate; the so-called
Uniform Distribution, Mean Increment assumptions (Alder 1995). For each class, a ‘movement ratio’
is then determined from the class width and average increment, and this indicates the number of
trees moving to the next class (Vanclay 1994, Alder 1995).
According to Alder (2000), three red cedar specimens occurred in the PSPs mentioned earlier.
Average diameter increment of the three red cedar trees averaged 0.82 cm/yr. (SE% 42.2%).
Because the increment and mortality data for red cedar in Guyana are so limited, it is decided to
revert to data from Brienen & Zuidema (2006a, 2006b) from Bolivia to estimate the time needed to
recuperate harvested volumes. Based on tree ring analysis for red cedar, Brienen & Zuidema (2006a)
found the longest passage time in the smallest size class (0–10 cm diameter). This is most likely
caused by low growth rates because of limiting light availability in the understorey. Species such as
red cedar are thought to require releases from understorey light levels by canopy disturbances (e.g.
tree and branch falls) to enable them to reach the canopy. Brienen & Zuidema (2006a) accounted for
mortality using an annual rate of 2%. Mortality rates are highest in the smallest diameter class due
to the longer time of passage and decrease in subsequent diameter classes due to increasingly
shorter times of passage.
7.2 Stand table projection without intervention based on MLI inventory
A simple stand table projection model was constructed based on Uniform Distribution, Mean
Increment assumptions (Husch et al. 1982, Alder 1995) and published data from Brienen & Zuidema
(2006a), which are shown in Table 12. The Inventory data for the original stand table is taken from

48
the pooled MLI inventory data (4,609 plots of 0.1 ha). Initially, recruitment into the smallest
diameter class (10-20 cm dbh) was emulated in a way to achieve a constant ingrowth (see Table 13
and Figure 17).
Table 12 Median time of passage and mortality through 10-cm diameter classes for red cedar according to Brienen & Zuidema (2006a)
Diameter class (cm) 10-20 20-30 30-40 40-50 50-60 60-70 70-80 80-90 90-100 ≥100
Time of passage 16 12 9 7 7 9 12 12 12 n/a Increment cm/yr 0.63 0.83 1.11 1.43 1.43 1.11 0.82 0.82 0.82 0.63 Outgrowth %/5-yr 31.3% 41.7% 55.6% 71.4% 71.4% 55.6% 41.0% 41.0% 41.0% 0.0% Mortality % / time of passage 27.6% 21.5% 16.6% 13.2% 13.2% 16.6% 21.8% 21.8% 21.8% n/a
Table 13 Stand table projection for red cedar without intervention; initial stand structure based on the pooled MLI inventory data; stem numbers as recorded in all MLI plots (460.9 ha), expressed per 100 ha
Projection year Diameter class (cm) Total
10-19 20-29 30-39 40-49 50-59 60-69 70-79 80-89 90-99 ≥100
0 4.3 2.2 0.2 0.7 0.4 0.2 0.2 0.2 8.5
5 4.3 2.4 0.9 0.3 0.5 0.4 0.2 0.2 0.1 9.2 10 4.4 2.5 1.4 0.1 0.4 0.5 0.2 0.2 0.1 9.9 15 4.6 2.6 1.1 0.8 0.1 0.6 0.4 0.2 0.2 10.6 20 4.3 2.6 1.6 0.9 0.5 0.3 0.6 0.2 0.1 0.1 11.1
25 4.3 2.7 1.6 0.9 0.8 0.2 0.6 0.3 0.1 0.1 11.6
30 4.3 2.6 1.7 1.0 0.8 0.6 0.3 0.4 0.1 0.2 12.1 35 4.3 2.6 1.8 0.8 0.9 0.9 0.4 0.5 0.2 0.2 12.5 40 4.3 2.6 1.6 1.2 0.8 1.0 0.6 0.4 0.2 0.2 12.9 45 4.3 2.6 1.6 1.0 1.0 1.1 0.9 0.2 0.3 0.3 13.3
50 4.3 2.6 1.6 1.0 1.1 0.9 1.0 0.4 0.3 0.3 13.6
Figure 17 Initial size-class structure of red cedar (left) and projected size-class structure after 50-yr with no intervention (right). Initial size-class structure is based on pooled MLI inventory data; stem numbers expressed per 100 ha; growth and yield projection is based on time of passage and mortality figures from Brienen & Zuidema (2006a); stem numbers expressed per 100 ha.
Size class projection based on the increment and mortality data in Table 12, while maintaining a
constant level of recruitment and without intervention, results in a strong increase in adult stems
after 50 years and hence does not reflect the stand structure found for the larger trees in the pooled
MLI inventory plots or the pooled stock surveys. The encountered stand structure can be attained by
applying a lower recruitment rate or an increased mortality rate. Unfortunately, data relating to the
0-10 cm diameter class are non-existent in Guyana while data relating to the diameter classes 10-39
cm are very limited. Densities in the 10-39 cm size classes are therefore inferred based on the

49
increment and mortality rates published by Brienen & Zuidema (2006a). Recruitment into the 10-19
cm size class is set at such a constant rate (0.1 stem/100-ha/yr.) that the total number of trees ≥ 40
cm dbh remains stable. Ignoring the inventory results and constructing the stand table based on this
recruitment rate and the parameters published by Brienen & Zuidema (2006a) results in a stable
stand structure as portrayed in Figure 18.
Figure 18 Stable size-class structure of red cedar after 100-yr projection without any intervention. Initial size-class structure set at zero density for all size classes; annual recruitment set at 0.1 stems/100-ha; stem numbers expressed per 100 ha; growth and yield projection is based on time of passage from Brienen & Zuidema (2006a); stem numbers expressed per 100 ha.
7.3 Stand table projection without intervention based on 100% pre-harvest
inventory
The size-class structure of the pooled MLI inventory data is based on scarce data with a high
sampling error (see section 6.1.2). The size-class structure suggested by the MLI inventories yields a
greater number of harvestable red cedar trees (assumed to be ≥ 40 cm dbh for practical purposes) as
the stock surveys where red cedar was encountered (Table 14 and Figure 19). The stock surveys
cover a much larger area and therefore provide a better estimate of the stand structure, but do not
provide information on the size classes < 40 cm dbh. Densities in these size classes were emulated
based on De Liocourt Quotients of the stable stand structure in Figure 18. Recruitment into the 10-
19 cm size class was set at a constant rate in such a way that the total number of trees ≥ 40 cm dbh
remained stable.
Table 14 Stand table projection for red cedar without intervention; initial stand structure based on the pooled stock survey data. Stand table projection is based on time of passage and mortality figures from Brienen & Zuidema (2006a). Stem numbers are expressed per 100 ha.
Projection year Diameter class (cm) Total
10-19 20-29 30-39 40-49 50-59 60-69 70-79 80-89 90-99 ≥100
0 0.17 0.10 0.06 0.04 0.08 0.06 0.05 0.02 0.02 0.02 0.63
5 0.16 0.10 0.06 0.04 0.05 0.08 0.06 0.03 0.02 0.02 0.63 10 0.17 0.10 0.07 0.03 0.03 0.07 0.07 0.04 0.02 0.03 0.63 15 0.17 0.10 0.05 0.05 0.03 0.05 0.08 0.04 0.02 0.03 0.63 20 0.16 0.10 0.06 0.04 0.04 0.04 0.08 0.05 0.03 0.03 0.62
25 0.16 0.10 0.06 0.04 0.04 0.04 0.06 0.06 0.03 0.04 0.62
30 0.16 0.10 0.07 0.04 0.04 0.04 0.04 0.07 0.04 0.04 0.62 35 0.16 0.10 0.07 0.03 0.03 0.04 0.04 0.05 0.05 0.05 0.62 40 0.16 0.10 0.06 0.04 0.03 0.04 0.04 0.04 0.05 0.06 0.62 45 0.16 0.10 0.06 0.04 0.04 0.04 0.04 0.03 0.05 0.07 0.62
50 0.16 0.10 0.06 0.04 0.04 0.04 0.04 0.03 0.03 0.08 0.62

50
Figure 19 Initial size-class structure of red cedar (left) and projected size-class structure after 50-yr without intervention (right). Initial size-class structure is based on pooled stock survey data; stand table projection is based on time of passage and mortality figures from Brienen & Zuidema (2006a). Stem numbers are expressed per 100 ha.
7.4 Stand table projection of harvested stands
Stand table projection of harvested stands applied a minimum cutting diameter limit of 40 cm (set
6 cm above the legal minimum cutting diameter limit for practical purpose), assumed no trees are
defective, assumed no logging or natural damage inflicted to red cedar trees, and a cutting cycle of
25 years. Recruitment into the 10-19 cm class was reduced in proportion to the reduction in trees ≥
20 cm diameter in each subsequent modelling interval, but because the time of passage through the
0-10 cm size class is estimated at 20 years (Brienen & Zuidema 2006a) this reduction is applied
starting from year 20. This implies that the impact of harvesting all trees ≥ 40 cm at first harvest on
recruitment is deferred by 20 years. The impact of removing parent trees on the recruitment after
the second harvest will therefore not be as big as the effect after the third harvest after 50 years.
Progressive reduction in recruitment after year 20 and a slow transition into the 40-49 cm dbh size
class implies that the volume taken at the first harvest cannot be sustained with the given
recruitment, increment and mortality rates. The pooled stock surveys would yield an estimated
harvest of 0.30 red cedar stem ≥ 40 cm dbh per 100-ha at first harvest. The simple model suggests
that only 40% of this initial harvest (0.12 stem/100-ha) would recuperate after one logging cycle of
25 years (Table 15 and Figure 20). After a third harvest after 50 years, 35% of the initial harvest
(0.10 stem/100-ha) would still be available, but harvests would dwindle afterwards because of the
progressive decline in recruitment. Stand table projection with the given assumptions indicates that
the maximum size a tree (of 39 cm dbh) can attain within one cutting cycle of 25 years is 71 cm dbh.
Application of a net form height factor of 12.61 (Alder 2000) yields an initial volume at first harvest
(MCDL =40 cm dbh; Year 0) of 1.49 m3 per 100 ha. At the second harvest (year 25) the volume will
have declined to 0.38 m3/100-ha (26% of the initial harvest volume), at the third harvest (year 50) to
0.34 m3/100-ha, at the fourth harvest (year 75) to 0.28 m3/100-ha and at the fifth harvest (year 100)
to 0.17 m3/ha. The strong reduction in volume after the first harvest is associated with the presence
of large (dbh ≥ 70 cm) old-growth trees at the first harvest (‘primary forest premium’). Brienen &
Zuidema (2006b) also found that projected yields for a second harvest after 20 years in Bolivia were
much lower than initial harvests (recuperation of less than 30%). The further reduction after the
third harvest in year 25 is due to a reduction in recruitment into the 10-20 cm size class which is
caused by the first harvest in year 0.

51
Table 15 Stand table projection for red cedar with complete harvest of all stems ≥ 40 cm dbh in years 0, 25 and 50; initial stand structure based on the pooled stock survey data; densities shown in red italic are the trees that are harvested. Stem numbers are expressed per 100 ha.
Projection year Total
10-19 20-29 30-39 40-49 50-59 60-69 70-79 80-89 90-99 ≥100
0 0.17 0.10 0.06 0.04 0.08 0.06 0.05 0.02 0.02 0.02 0.63
5 0.16 0.10 0.06 0.03 0.36 10 0.17 0.10 0.07 0.04 0.02 0.38 15 0.17 0.10 0.05 0.05 0.03 0.40 20 0.16 0.10 0.06 0.04 0.04 0.03 0.42
25 0.16 0.08 0.06 0.04 0.04 0.04 0.01 0.42
30 0.13 0.09 0.06 0.03 0.30 35 0.11 0.09 0.05 0.03 0.02 0.30 40 0.09 0.10 0.04 0.04 0.03 0.31 45 0.08 0.07 0.06 0.03 0.03 0.02 0.31
50 0.09 0.06 0.06 0.03 0.03 0.03 0.01 0.30
Figure 20 Size-class structure of red cedar at first harvest (top-left), projected size-class structure at second harvest after 25-yr. (top-right), third harvest after 50-yr (bottom-left), fourth harvest after 75 yr. (bottom-right). Red bars indicate harvestable trees and green bars unharvested trees. Initial size-class structure is based on the average structure found in stock surveys; stem numbers expressed per 100 ha; growth and yield projection is based on time of passage and mortality figures for each 10-cm diameter class from Brienen & Zuidema (2006a).
The result is strongly influenced by the assumption that the level of recruitment is reduced in direct
proportion to the reduction in the number of trees ≥ 20 cm dbh at each 5-year modelling interval, no
logging or natural damage is inflicted to red cedar trees, and no trees are defective. The model
shows the importance of knowledge about recruitment and about differences in increment and
mortality rates among diameter classes. As previously postulated by Alder (2002) availability of data
down to a 10-cm diameter limit (e.g. by subsampling during 100% stock surveys) would provide data
that can be used for management and projection with a much higher degree of confidence and
utility.

52
7.5 Forest management and yield regulation in Guyana
Yield regulation in Guyana is based on a stipulated maximum annual allowable cut of 20 m3/ha over
a 60 year cutting cycle for all merchantable species combined (i.e. assuming a mean annual volume
increment of the entire species group of ⅓ m3/ha/yr.). The stipulated AAC is not generally achieved
due to limited availability of marketable species of minimum size and quality and the concessionaire
can opt for a lower AAC. The majority of large concessionaires apply a 25-year cutting cycle instead
of a 60-year cycle and therefore apply a prorated maximum allowable cut of (25 × 0.33 =)
8.33 m3/ha. The smallest forest management unit is a 100-ha block (the same unit as used for the
100% pre-harvest inventory). The allowable cut is determined and monitored for each individual
block based on the 100% pre-harvest inventory. The Maximum Allowable Cut is the lower volume
figure of the (prorated) AAC and the Inventoried Volume. Based on the allowable cut a number of
log tags to be issued is computed to monitor the log quota for each block.
The annual log quota for SFP holders are determined by the GFC on a case by case basis for the
entire SFP (hence not for individual 100-ha blocks), based on the 20 m3/ha over a 60-year cutting
cycle and an assumed 80% net productive forest area. SFP holders receive a fixed number of tags per
year based on the quota calculation. SFP holders are thus not required to conduct a pre-harvest
inventory or prepare any management or operational plans. They are required to tag logs and
stumps according to the log-tracking system.
7.5.1 Effect of retention of buffer zone trees on sustainable yield
According to Guyana’s Code of Practice (2014), no trees may be felled in riparian or streamside
buffer zones. The prescribed buffer zone widths depend on the type of protected area or
watercourse; i.e., 30 m on either side of rivers, 20 m on either side of creeks wider than 10 m, 10 m
on either side of creeks less than 10 m wide, and no machine access 10 m on either side of gullies
although felling is allowed along gullies. As shown in section 5.5.1, an estimated 20% of the red
cedar trees occur in creek buffer zones and would therefore be excluded from harvesting.
Stand projection was carried out whereby buffer zone trees were excluded resulting in a reduction
of the allowable yield by 20%. It is assumed that seeds from retained trees in the buffer zone are
also dispersed beyond the buffer zone borders and that recruitment originating from buffer zone
trees takes place outside the buffer zone. This improves sustainability of the harvestable volume in
future cutting cycles; at the first and second cut the harvested volume is reduced to 80% compared
to a complete harvest of all available stems (i.e. 0.24 and 0.10 stem per 100 ha), but afterwards the
size of the harvest starts to approach levels achieved with all stems harvested due to improved
regeneration levels; at the fourth and fifth cut the proportions available will be 86% and 91% (0.07
and 0.05 stems per 100-ha) compared to a harvest of all available stems (Table 16 and Figure 21). At
the first harvest the volume will be 1.20 m3/100-ha, but at the second harvest (year 25) the volume
will have declined to 0.31 m3/100-ha, at the third harvest (year 50) to 0.28 m3/100-ha, at the fourth
harvest (year 75) to 0.24 m3/100-ha and at the fifth harvest (year 100) to 0.16 m3/ha. Although this
harvesting regime still does not result in truly sustained yields, it forms a substantial improvement
compared to the situation whereby all available stems are being harvested. Moreover, retention of
20% of the red cedar trees in buffer zones protects the species from becoming in a position where
its continued existence is being threatened.

53
Table 16 Stand table projection for red cedar with harvest of stems ≥ 40 cm dbh in years 0, 25 and 50; following the GFC regulation that bans harvesting from buffer zones; initial stand structure based on the pooled stock survey data; trees within buffer zone retained and outside buffer zone harvested; densities shown in red italic are the trees that are harvested. Stem numbers are expressed per 100 ha.
Projection year Total
10-19 20-29 30-39 40-49 50-59 60-69 70-79 80-89 90-99 ≥100
0 – harvested 0.03 0.07 0.05 0.04 0.02 0.01 0.02 0.24
0 – retained 0.17 0.10 0.06 0.01 0.02 0.01 0.01 0.00 0.00 0.00 0.39
5 0.17 0.10 0.06 0.03 0.01 0.02 0.01 0.01 0.00 0.00 0.41 10 0.17 0.10 0.07 0.03 0.02 0.01 0.01 0.01 0.00 0.00 0.43 15 0.18 0.10 0.05 0.05 0.03 0.01 0.02 0.01 0.00 0.00 0.45 20 0.17 0.10 0.06 0.04 0.04 0.03 0.02 0.01 0.01 0.00 0.47
25 - harvested 0.03 0.03 0.03 0.01 0.10
25 - retained 0.17 0.09 0.06 0.01 0.01 0.01 0.01 0.01 0.01 0.00 0.37
30 0.14 0.09 0.06 0.03 0.01 0.01 0.01 0.01 0.01 0.00 0.37 35 0.12 0.10 0.06 0.03 0.02 0.01 0.01 0.01 0.01 0.00 0.37 40 0.12 0.10 0.04 0.04 0.03 0.01 0.01 0.01 0.01 0.01 0.38 45 0.11 0.08 0.06 0.03 0.03 0.03 0.01 0.01 0.01 0.01 0.38
50 - harvested 0.03 0.02 0.03 0.01 0.09
50 - retained 0.10 0.07 0.06 0.01 0.01 0.01 0.01 0.01 0.01 0.01 0.29
Figure 21 Size-class structure of red cedar following the GFC regulation that bans harvesting from buffer zones; at first harvest (top-left), projected size-class structure at second harvest after 25-yr. (top-right), third harvest after 50-yr (bottom-left), fourth harvest after 75 yr. (bottom-right). Red bars indicate harvestable trees and green bars retained trees.
7.5.2 Effect of raising the minimum cutting diameter limit
The legal minimum cutting diameter limit for red cedar in Guyana is 34 cm dbh and there are no
requirements to leave any seed trees. In Bolivia, a minimum cutting diameter 60 cm is prescribed, a
cutting cycle of at least 20 years, and a maximum harvest intensity of 80% of the trees of harvestable

54
size (leaving the remaining 20% as seed trees) for each species (Brienen & Zuidema, 2006b). Current
harvest regulations in Brazil prescribe a 50 cm minimum diameter cutting limit, a 20% commercial-
sized tree retention rate, a minimum 3 commercial-sized trees per 100 ha retained after harvest as
seed trees and a 30-year cutting cycle (Schulze et al, 2008). In Peru, minimum diameter cutting limit
is 65 cm.
The maximum harvest intensity of 80% of the trees of harvestable size (leaving the remaining 20% as
seed trees), as stipulated in Bolivia and Brazil, is guaranteed in Guyana by default because of the
harvesting ban for riparian buffer zones combined with the observation that 20% of red cedar trees
appear to grow in such buffer zones. As mentioned in the previous section a maximum harvesting
intensity of 80% ensures the continued existence of the species but does not result in a truly
sustained yield if a minimum cutting diameter limit of 34 cm dbh is applied as required by the Forest
Act and its subsidiary Forest Regulations in Guyana.
Periodic diameter increment rates of juvenile red cedar trees are reportedly low and mortality of
juveniles high. The species requires releases from low understorey light levels by canopy
disturbances to enable them to reach the canopy (Brienen & Zuidema, 2006a). Periodic diameter
increment rates (PAI) increase with increasing diameter and peak in the 40-50 cm and 50-60 cm
diameter classes. Periodic increment rates are almost 30% higher in these two classes than in the 30-
40 cm and 60-70 cm diameter class (see Table 12). From a silvicultural point of view, the optimum
minimum cutting diameter would therefore rather be close to 60 cm dbh, because the mean annual
increment (MAI) rate would peak after the tree has reached this size. The effects of a shift in the
MCDL on sustainable yield were modelled for MCDLs of 50 cm and 60 cm.
Raising the MCDL to 50 cm dbh, while excluding buffer zone trees, further improves sustainability of
the harvestable volume in future cutting cycles; at the first cut the harvested number of stems is
reduced to 86% compared to a MCDL of 40 cm while excluding buffer zone trees (i.e. 0.21 stem per
100 ha), to 88% at the second harvest (i.e. 0.08 stem per 100 ha), but increased to 103% at the
fourth cut (Figure 22). At the first harvest the volume will be 1.13 m3/100-ha (95% compared to a
MCDL of 40 cm), at the second harvest (year 25) the volume will have declined to 0.35 m3/100-ha
(116%), at the third harvest (year 50) to 0.33 m3/100-ha (118%), at the fourth harvest (year 75) to
0.31 m3/100-ha (129%) and at the fifth harvest (year 100) 0.21 m3/ha (134%). Although this
harvesting regime still does not result in strictly sustained yields, it forms a substantial improvement
compared to the situation whereby all available stems outside buffer zones are being harvested. Of
the original 0.63 tree ≥ 20 cm dbh per 100 ha 0.10 stem is preserved after 100 years, if all trees are
allowed to be harvested, compared to 0.21 stems when harvesting in buffer zones is excluded and
0.25 stems, if, in addition to buffer zone exclusion, the MCDL is raised to 50 cm.
If the MCDL is further raised to 60 cm dbh as would be advisable based on the fact that periodic
increment rates are highest in the 40-50 and 50-60 cm diameter classes, sustained yield levels are
being approached (Figure 23). At the first harvest the volume will be 0.94 m3/100-ha (78% compared
to a MCDL of 40 cm), at the second harvest (year 25) the volume will have declined to 0.52 m3/100-
ha (169%), at the third harvest (year 50) to 0.37 m3/100-ha (132%), at the fourth harvest (year 75) to
0.36 m3/100-ha (149%) and at the fifth harvest (year 100) to 0.28 m3/ha (176%). Ignoring the fifth
harvest a sustained yield level of 0.36 m3/100-ha seems achievable. Of the original 0.63 tree ≥ 20 cm

55
dbh per 100 ha 0.30 stem is preserved, if, in addition to buffer zone exclusion, the MCDL is raised to
60 cm.
Figure 22 Size-class structure of red cedar banning harvesting from buffer zones and applying a minimum cutting limit of 50 cm dbh; at first harvest (top-left), projected size-class structure at second harvest after 25-yr. (top-right), third harvest after 50-yr (bottom-left), fourth harvest after 75 yr. (bottom-right). Red bars indicate harvestable trees and green bars unharvested trees.
Figure 23 Size-class structure of red cedar banning harvesting from buffer zones and applying a minimum cutting limit of 60 cm dbh; at first harvest (top-left), projected size-class structure at second harvest after 25-yr. (top-right), third harvest after 50-yr (bottom-left), fourth harvest after 75 yr. (bottom-right). Red bars indicate harvestable trees and green bars unharvested trees.

56
Figure 24 shows that the yield at first harvest decreases by raising the MCDL but that the yield at
subsequent harvests increases. If the yields for the hypothetical harvesting regime whereby all red
cedar trees above the legal MCDL including trees in buffer zones can be harvested are ignored, it
appears that the total accumulated yield after five consecutive harvests is highest when the MCDL is
set at 60 cm.
Figure 24 Forecasted yield of red cedar at subsequent cuts with complete harvest of all available stems ≥ 40 cm dbh (red bars); and banning harvesting from buffer zones and applying a MCDL of 40 cm dbh (green bars), a MCDL of 50 cm dbh (blue bars) and a MCDL of 60 cm dbh (yellow bars); assuming recruitment into the 10-19 cm class in proportion to the reduction in trees ≥ 20 cm diameter at each 5-yr modelling interval; and initial stand structure based on the pooled stock survey data.
Figure 25 shows that standing volume at each subsequent is increased if the MCDL is increased, but
that the total standing volume diminishes after east harvest. This is due to the applied decrease in
recruitment into the 10-19 cm class in proportion to the reduction in trees ≥ 20 cm diameter at each
successive 5-year modelling interval. This implies that a stand table projection using time of passage
and mortality figures from Brienen & Zuidema (2006a) combined with the assumption that
regeneration (recruitment) diminishes after each harvest will not result in sustained yield after the
fourth harvests, neither if the MCDL is raised to 60 cm dbh.

57
Figure 25 Development of standing red cedar volume (diameter ≥ 10 cm dbh) according to stand table projection with a cutting cycle of 25 years: for complete harvest of all available stems ≥ 40 cm dbh (red line); and banning harvesting from buffer zones and applying a MCDL of 40 cm dbh (green line), a MCDL of 50 cm dbh (blue line) and a MCDL of 60 cm dbh (purple line); initial stand structure based on pooled stock survey data; time of passage and mortality figures from Brienen & Zuidema (2006a); and recruitment into the 10-19 cm class in proportion to the reduction in trees ≥ 20 cm diameter at each 5-yr modelling interval.
7.5.3 Effect of recruitment rate assumptions
Knowledge on regeneration of red cedar in Guyana is limited, but red cedar reportedly starts bearing
fruit at an early age under plantation conditions (Lamb, 1968; Lamprecht, 1989) and it was therefore
assumed that the species start reproducing at a diameter of 20 cm. In the previous sections it was
assumed that recruitment in the 10-19 cm diameter class would diminish in proportion to the
number of stems that remain after each logging cycle. However, the species is strongly light-
demanding and regarded as a ‘long-lived’ pioneer (Cintron, 1990; Lamprecht, 1989; Lemmens,
2008). It regenerates well in forest clearings, on abandoned agricultural plots and following
disturbances such as forest fires and hurricanes (Lamprecht, 1989; Marshall, 1939). According to
Lamprecht (1989) natural regeneration can be encouraged by removing the canopy around seed
trees. This may indicate that fecundity would increase after logging. Therefore, the stand projection
model was also run assuming that recruitment rates would remain constant. Under this assumption,
sustained yields would be possible and stable sustained production rates would be achieved after
two 25-year cutting cycles (Figures 26 and 27).
Ignoring the hypothetical harvesting regime whereby all red cedar trees above the legal MCDL may
be harvested also buffer zones, it appears that the total accumulated yield after five consecutive
harvests is still highest when the MCDL is set at 60 cm. The differences between the three MCDL
scenarios are however smaller when assuming constant recruitment rates in comparison with
recruitment being directly related to the number of trees retained after harvest.

58
Figure 26 Forecasted yield of red cedar at subsequent cuts with complete harvest of all available stems ≥ 40 cm dbh (red bars); and banning harvesting from buffer zones and applying a MCDL of 40 cm dbh (green bars), a MCDL of 50 cm dbh (blue bars) and a MCDL of 60 cm dbh (purple bars); assuming a constant recruitment rate; and initial stand structure based on the pooled stock survey data (224 km2).
Figure 27 Development of standing red cedar volume (diameter ≥ 10 cm dbh) according to stand table projection with a cutting cycle of 25 years for: complete harvest of all available stems ≥ 40 cm dbh (red line); and banning harvesting from buffer zones and applying a MCDL of 40 cm dbh (green line), a MCDL of 50 cm dbh (blue line) and a MCDL of 60 cm dbh (purple line); initial stand structure based on pooled stock survey data (224 km2); time of passage and mortality figures from Brienen & Zuidema (2006a); assuming a constant recruitment rate.
In point of fact recruitment rates will lie somewhere between a constant rate and a proportionately
decreasing rate. Sustained yield levels in a 25-year cutting cycle, as determined by the yield after the
third cutting cycle when the modelled stand structure stabilizes, would therefore lie somewhere

59
between 0.24 and 0.31 m3 per 100 hectare in case of a MCDL of 40 cm dbh (implemented starting
from the first harvest), between 0.31 and 0.37 m3 per 100 hectare in case of a MCDL of 50 cm dbh
and between 0.36 and 0.43 m3 per 100 hectare in case of a MCDL of 60 cm dbh.
60
8 Sustainable yield
8.1 Density and sustained yield of red cedar
This study produced variable estimates of the density of harvestable red cedar trees; varying from
0.9 trees ≥ 35 cm dbh per 100 ha according to the CIDA-IFP inventories (1990-95), 1.7 trees ≥ 30 cm
dbh per 100 ha recorded in the FAO-FIDS reconnaissance survey (1969-73) and 2.0 trees ≥ 35 cm dbh
per 100 ha according to the MLI inventories (2006-present).
The most widespread source of information was formed by 100% pre-harvest inventories in large
concessions which indicated an average of 0.14 trees ≥ 40 cm dbh per 100 ha. However, red cedar
was only reported in 8% of all 100% pre-harvest inventories that were undertaken during 2010-2014.
It should be noted that stock survey information is not as reliable as true forest inventory
information. Neither concessionaires nor their inventory teams are familiar with the species. Not all
concessionaires include the species on their species list for 100% pre-harvest inventory, while many
inventory crews do not recognize the species. The latter was clearly indicated by a small verification
exercise of seven blocks in five large concessions. In three concessions other species such as Apeiba
petoumo (duru), Bombax sp. (kamakuti), Calophyllum lucidum (kurahara), Humiria balsamifera var.
balsamifera (tauroniro), or Tabebuia insignis var. monophylla (white cedar) trees had been
mistakenly identified as red cedar. In four blocks in two other concessions, where three and twelve
harvestable red cedar trees respectively were recorded during stock surveys, the species was
correctly identified but the verification exercise also showed that four harvestable red cedar trees
had been overlooked during stock surveys. The most reliable stock survey seems to be the one
carried out by Barama Co. Ltd., where 249 red cedar trees were found in 142 out of the 1033 blocks
(14%) that were surveyed over the period 2010-14; indicating a density of 0.24 tree per 100 ha. As
mentioned above, the verification exercise showed that two trees had been overlooked; this may
suggest that the species density is about 22% higher. Given the general uncertainty regarding the
reliability of 100% pre-harvest inventories, a likely density of 0.30 tree ≥ 40 cm dbh per 100 ha is
presumed and, for that matter, 0.26 tree ≥ 50 cm dbh and 0.18 tree ≥ 60 cm dbh per 100 ha.
In terms of volume, estimates vary from 2.8 m3 per 100 ha according to the CIDA-IFP inventories
(1990-95), 2.4 m3 per 100 ha recorded in the FAO-FIDS reconnaissance survey (1969-73) and 8.2 m3
per 100 ha according to the MLI inventories (2006-present). Based on the stock surveys, a volume of
only 1.49 m3 per 100 ha is indicated. Application of a MCDL of 50 cm dbh would suggest a
harvestable volume of 1.41 m3 per 100 ha, while a MCDL of 60 cm would suggest a harvestable
volume of 1.16 m3 per 100 ha.
According to Guyana’s Code of Practice (2014), no trees may be felled in streamside buffer zones. An
estimated 20% of the red cedar trees occur in such buffer zones and would therefore be excluded
from harvesting. This would imply that of 0.24 tree ≥ 40 cm dbh per 100 ha would be actually
available for harvesting, while this would be 0.21 tree ≥ 50 cm dbh and 0.14 tree ≥ 60 cm dbh per
100 ha. The actually harvestable volume is therefore estimated at 1.20 m3 per 100 ha. Application of
a MCDL of 50 cm dbh would result in an estimated harvestable volume of 1.13 m3 per 100 ha and a
MCDL of 60 cm in an estimated harvestable volume of 0.94 m3 per 100 ha.
Stand table projection with a 25-year cutting cycle based on the stock survey results suggests long-
term sustainable yields between 0.24 and 0.31 m3 per 100 hectare in case of a MCDL of 40 cm dbh,

61
between 0.31 and 0.37 m3 per 100 hectare in case of a MCDL of 50 cm dbh and between 0.36 and
0.43 m3 per 100 hectare in case of a MCDL of 60 cm dbh.
In terms of annual sustainable yield these figures translate to 0.010-0.013 m3 per 100 hectare per
year in case of a MCDL of 40 cm dbh, 0.012-0.015 m3 per 100 hectare per year in case of a MCDL of
50 cm dbh and 0.014-0.017 m3 per 100 hectare per year in case of a MCDL of 60 cm dbh.
8.2 Allocated State Forest area and annual coupe
8.2.1 Occurrence of red cedar in concessions
In section 5.5 it was shown that red cedar does not seem to have a specific preference for a certain
forest or soil type, but appears to occur on all soil types from pegasse, to loam, to white sand and in
many forest types from mora forest, to mixed forest on undulating to hilly terrain, on deeply
dissected terrain, on steep high hills, and also in wallaba forest on white sand soils. At a local scale,
red cedar appears to occur mainly in mixed or mora forest along watercourses; particularly along
gullies and seasonal streams. For the assessment of the annual sustained red cedar yield it is
therefore assumed that red cedar occurs in all forest concessions.
8.2.2 Large concessions
Twenty-six large concessions (25 TSAs and 1 WCL) have been issued with a total area of roughly
4.4 million hectares. Assuming the net productive forest area is 80% of the concession area, the total
net productive area would amount to 3.5 million ha. Most of these large concessions are managed at
a 25-year cutting cycle. The total annual coupe for the large concessions would therefore amount to
roughly 140,000 ha. An operator’s annual quota is calculated based on the chosen cutting cycle, the
annual coupe calculated for the concession and the results of the 100% pre-harvest inventory in case
of large concessions. The quota is equated to the number of standing trees which will yield the
volume and the number of trees computed indicates the number of tags to be issued. The block and
log quota system applied to large concessionaires ensures that the concessionaire adheres to the
allowable harvest intensity and the cutting cycle, because harvesting outside of those blocks is not
permitted.
Stand table projection with a 25-year cutting cycle under the current forest management regulations
with a practical MCDL of 40 cm and prohibiting harvesting in riparian buffer zones suggests long-
term sustainable yields between 0.24 and 0.31 m3 per 100 hectare. In case a MCDL of 50 cm dbh
would be applied sustainable yield would lie between 0.31 and 0.37 m3 per 100 hectare and in case a
MCDL of 60 cm dbh would be applied sustainable yield is estimated between 0.36 and 0.43 m3 per
100 hectare. Based on the stand projection model, the estimated readily available volume of red
cedar in the State Forest allocated as large concessions would amount to 140,000 ha ÷ 100 1.2 m3
= 1,680 m3 per year, under provision that the annual coupe consists entirely of primary forest. The
long-term annual sustained yield for large concessions, however, would lie somewhere between 350
and 450 m3 per year. Application of a MCDL of 50 cm dbh would result in a readily available yield
1,582 m3 per year (providing all is primary forest), while the long-term annual sustained yield lie
between 450 and 500 m3 per year. Raising the MCDL to the silviculturally desirable 60 cm dbh would
result in a readily available yield 1,316 m3 per year (providing all is primary forest), while the long-
term annual sustained yield would be between 500 and 600 m3 per year.

62
8.2.3 Small concessions and Amerindian reservations
The total area allocated as small concessions (State Forest Permits) amounts to about 2.0 million ha.
Small concessions are managed by the GFC who issues log tags based on predetermined log quota.
The GFC computes the log quota on a case by case basis for the entire SFP, whereby the basic
maximum 20 m3 harvest intensity and a cutting cycle of 60 year are applied and allowance is made
for non-productive areas; i.e. 80% of the area is assumed to be accessible for harvesting. Small
concessions do not have an annual coupe in terms of area but a log quota.
For practical purpose the estimation of the annual sustained red cedar yield from SFPs follows the
same approach as the one that was used for large concessions. In lieu of log quota, the annual coupe
for small concessions is suggested to be roughly 64,000 ha. Under the current forest management
regulations with a practical MCDL of 40 cm and prohibiting harvesting in riparian buffer zones, long-
term annual sustained yield for small concessions would lie somewhere between 150 and 200 m3
per year. Application of a MCDL of 50 cm dbh would result in a long-term annual sustained yield
between 200 and 250 m3 per year. Raising the MCDL to the silviculturally desirable 60 cm dbh would
result in a long-term annual sustained yield of between 250 and 300 m3 per year. The majority of
SFPs have been logged previously and estimates of the readily available yield would be definitely less
than the volumes quoted for large concessions, where primary forest is still largely available.
Produce stemming from Amerindian Reservations and Private Properties is not subject to maximum
cut restrictions because these lands do not form part of the State Forest Estate and are not managed
by the GFC. About 3.5 million hectares have been formally gazetted as Amerindian Reservations and
roughly 2.6 million hectares of these lands are forested. Sustained yield for the Amerindian
reservations is estimated at 200-250 m3 per year.
8.2.4 Total sustainable yield
The total area of available productive forest - both allocated State Forest and Amerindian
reservations - is roughly 9.0 million hectares. Applying a 25 year cutting cycle this would produce a
theoretic national annual coupe of 288,000 hectares. Under the current forest management
regulations with a practical MCDL of 40 cm and prohibiting harvesting in riparian buffer zones for
State Forest and assuming similar practices in Amerindian reservations, long-term annual sustained
yield would lie between 700 and 900 m3 per year. Application of a MCDL of 50 cm dbh would result
in a long-term annual sustained yield between 900 and 1,050 m3 per year. Raising the MCDL to the
silviculturally desirable 60 cm dbh would result in a long-term annual sustained yield between 1,050
and 1,250 m3 per year.
8.2.5 Red cedar production 2007-14 in comparison to sustainable yield
Red cedar production is dealt with in detail in report no. 2 ‘Reporting Framework for CITES timber
exports’. In summary, the average total red cedar production (felled roundwood equivalent) from
State Forest fluctuated around 555 m3/yr. over the period 2007-14; ranging from around 172 m3/yr.
to 1,750 m3/yr. The majority of the red cedar production from State Forest was sourced from small
concessions with an average yearly production of 500 m3; this production was composed of 150 m3
logs and 350 m3 primary (chainsaw) lumber. Yearly production from large concession was limited to
55 m3; ranging from 21 m3 to 140 m3; this production was nearly completely composed of logs.

63
Average yearly production over the period 2009-2013 originating from Amerindian Village Lands
amounted to 86 m3; ranging from 0 m3 to 238 m3.
The total production thus amounts to 641 m3 per year on average and is thus 92% of the lower
estimate of the sustained yield of 700 m3 per year and 71% of the higher estimate of the sustained
yield of 900 m3 per year. Red cedar is principally sourced from small concessions where harvests are
three times the lower sustained yield estimate and 2.5 times the higher estimate. Large concessions
harvest only 12-16% of their sustained yield levels, while production from Amerindian Village Lands
does not exceed 34-43% of the estimated higher and lower sustained yield levels. Sustainable
management of red cedar hence does not appear to be threatened under current forest regulations
and harvesting practice in large concessions and Amerindian reservations, but is possibly being in
small concessions. There appears to be scope for intensification of production from large
concessions.
8.2.6 Other considerations
A point of concern relating to sustainable management of red cedar in Guyana is that the species
mainly occurs along watercourses. Small-scale gold mining in and along watercourses is widespread
in Guyana, particularly to the West and South-West of the Essequibo River. These destructive mining
practices may undercut established forest management measures to safeguard the species.
Given the assumption that the periodic annual increment is greatest for the 40-49 cm and 50-59 cm
size classes, higher sustained yield levels would be attained if the minimum cutting diameter limit
would be raised to 60 cm dbh. Such increase would compromise the yield at the first harvest, but
indicates a substantially higher countrywide sustained yield of about 1,150 m3 per year instead of
800 m3 per year under current regulations. In addition, stand table projection indicates that
successful regeneration is guaranteed when applying a MCDL of 60 cm dbh, while this is
questionable when applying lower MCDLs.

64
9 Conclusion In 1998 Cedrela odorata was assessed as globally Vulnerable in the IUCN Red List and it has been
listed in Appendix III of CITES since 2001. The species was subsequently proposed for listing in
Appendix II of CITES in 2007. Appendix II listing would require non-detriment findings (NDF) to
ensure that export will not be detrimental to the survival of the species being traded. NDFs should
be based on a comprehensive review of available information on the population status, distribution,
population trend, harvest, and other biological and ecological factors, as appropriate, and trade
information relating to the species concerned. Because such information was lacking for nearly all
range states, CITES adopted an Action Plan in 2007 to complete knowledge on the status of
conservation of, trade in and sustainable use of Cedrela odorata. Although the proposal to list the
species in CITES Appendix II was unanimously opposed by all 30 Range States and subsequently
withdrawn in 2013, Range states were urged to consider the inclusion of their populations of Cedrela
odorata in Appendix III and to ensure the implementation and enforcement of CITES rules with
regard to that Appendix. It is against this background that this report has been prepared.
This report aimed to review the available information on Cedrela odorata in Guyana using existing,
available information sources on the distribution, population structure and production. The main
sources of information are formed by national forest inventories and forest inventories (through
sampling) and 100% stock surveys carried out by forest concessionaires. Another source of
information is formed by production records.
Findings
In Guyana, red cedar occurs widely from the North West to the South East of the country. Its
potential geographic distribution covers about three quarters of Guyana’s territory with the
exception of the coastal lowlands, the Rupununi and other savannahs and the Pakaraima
mountain region based on the geographic distribution of the forest types in which it appears
to occur.
- The species does not appear to have a specific preference for a certain forest or soil
type; it is reported to occur on many soil types from pegasse, to clay, to brown sand
and white sand and in many forest types such as swamp forest, mixed forest on flat
to undulating, undulating to hilly, deeply dissected terrain and steep high hills, and
in wallaba forest on white sand soils.
- At a local scale, the species occurs mainly in mixed or mora forest along
watercourses; particularly gullies and seasonal streams, but also along larger creeks.
It is estimated that 20% of the trees are within a 10 m distance of a creek and
another 10% within a 20 m distance, while 63% grow within 20 m of a gully or
seasonal stream.
According to the national forest inventories, red cedar is rare in Guyana (< 1 tree/ha), but
according to stock surveys the species is very rare (< 1 tree per 100 ha). According to three
nation-wide inventories the estimated density of red cedar trees ≥ 10 cm dbh varies from 1.7
to 8.5 trees per 100 ha, while the estimated density of harvestable trees (≥ 35 cm dbh)
ranges from 0.9 trees to 2.0 trees per 100 ha. According to 100% pre-harvest inventories in

65
large concessions the average density amounts to 0.3 tree ≥ 40 cm dbh per 100 ha (in the
concessions where the species was reported).
- Red cedar was only reported in 8% of the blocks that were surveyed during 2010-
2014, but the fact that a species is not recorded in a certain concession does not
necessarily mean that the species does not occur in that concession. Neither
concessionaires nor their inventory teams appear to be familiar with the species.
Not all concessionaires include the species on their species list for 100% pre-harvest
inventory, while some inventory crews do not recognize the species.
- The estimated volume of red cedar ≥ 35 cm dbh ranges from 2.4 m3 per 100 ha
(FAO-FIDS) to 6.0 m3 per 100 ha (MLI) according to the national forest inventories.
An upwards adjusted average volume of 1.5 m3 per 100-ha block (maximum of 37.8
m3 per 100-ha block) was reported for the 2728 100-ha blocks that where were
surveyed by large concessionaires during 2010-14.
Guyana’s Code of Practice (2014) prescribes that trees may not be felled in streamside
buffer zones. As shown above, an estimated 20% of the red cedar trees occur in such buffer
zones and should therefore be excluded from harvesting. Stand table projection of
harvested stands applying a minimum cutting diameter limit of 40 cm, excluding trees in
buffer zones and assuming a progressive reduction in recruitment into the 10-19 cm class in
proportion to the reduction in trees ≥ 20 cm diameter in each subsequent 5-year modelling
interval results in a volume at the first harvest of 1.49 m3/100-ha, reducing to 0.38 m3/100-
ha at the second harvest (year 25) and eventually to 0.17 m3/ha at the fifth harvest (year
100). The strong reduction in volume after the first harvest is associated with the presence
of large (dbh ≥ 70 cm) old-growth trees at the first harvest (‘primary forest premium’).
- The legal minimum cutting diameter limit (MCDL) for red cedar in Guyana is 34 cm
dbh. From a silvicultural point of view, the optimum minimum cutting diameter
would rather be close to 60 cm dbh, because the mean annual increment rate of the
species is reported peak after the tree has reached this size. If the MCDL is raised to
60 cm dbh the volume at the first harvest will be reduced to 0.94 m3/100-ha (78%
compared to a MCDL of 40 cm), but harvests will be higher at the second harvest
(year 25) estimated at 0.52 m3/100-ha (169%), and eventually yield 0.28 m3/ha
(175%) at the fifth harvest (year 100).
- Red cedar is strongly light-demanding, regenerates well in forest clearings and
following disturbances such as forest fires and hurricanes and is regarded as a ‘long-
lived’ pioneer. It is therefore plausible that recruitment does not decrease
proportionately after removing parent trees at each harvest. Stand table projection
assuming that recruitment rates remain constant suggests that stable sustained
yields can be achieved after only two 25-year cutting cycles.
Recruitment rates will probably lie somewhere between a constant rate and a proportionate
rate. Sustained yield levels in a 25-year cutting cycle, as determined by the yield after the
third cutting cycle when the modelled stand structure stabilizes, would therefore lie
somewhere around 0.28 m3 per 100 hectare in case of a MCDL of 40 cm dbh and 0.40 m3 per
100 hectare in case of a MCDL of 60 cm dbh.

66
Based on the observation that the species occurs in all forest types along watercourses;
particularly along gullies and seasonal streams it can safely be assumed that the species
occurs in all forest concessions and overall sustained yields can be computed using the
annual coupe for the concessions:
- The annual coupe of all large concessions (TSAs and WCLs) amounts to roughly
140,000 ha and the long-term annual sustained yield for these concessions would
therefore be close to 400 m3 per year.
- Small concessions (SFPs) are managed per log quota and not per an annual coupe.
For the purpose of assessing sustained yield levels, the annual coupe for small
concessions is estimated at roughly 64,000 ha in lieu of log quota. The long-term
annual sustained yield for small concessions would lie somewhere between 150 and
200 m3 per year.
- Produce stemming from Amerindian Reservations and Private Properties is not
subject to maximum cut restrictions because these lands do not form part of the
State Forest Estate and are not managed by the GFC, but sustained yield for the
Amerindian reservations is estimated at 200-250 m3 per year.
The total area of available productive forest - both allocated State Forest and Amerindian
reservations - is roughly 9.0 million hectares. Applying a 25 year cutting cycle this would
produce a theoretic national annual coupe of 288,000 hectares. Under the current forest
management regulations with a practical MCDL of 40 cm and prohibiting harvesting in
riparian buffer zones for State Forest and assuming similar practices in Amerindian
reservations, long-term annual sustained yield would lie close to 800 m3 per year. Raising the
MCDL to the silviculturally desirable 60 cm dbh would result in a long-term annual sustained
yield of 1,150 m3 per year.
Over the period 2007-14, total red cedar production amounted to 641 m3 per year on
average and appears to be only 20% of the lower estimate of the sustained yield of 3,150 m3
per year and 12% of the higher estimate of the sustained yield of 5,200 m3 per year. Red
cedar is principally sourced from small concessions and amounts there to between 43% and
71% of the higher and lower sustained yield estimates. Large concessions harvest only 2-4%
of their sustained yield levels, while production from Amerindian Village Lands does not
exceed 6-10% of the estimated higher and lower sustained yield levels.
In conclusion
Although red cedar is very rare in Guyana, current harvesting regimes (and export levels) do
not appear to be detrimental to the survival of the species, because a considerable
proportion of the population (20%) occurs along streamside buffer zones, where logging is
prohibited in Guyana, and trees are protected. Secondly, harvest levels, about 640 m3 per
year on average, are below the estimated national sustained yield level, which lies close to
800 m3 per year.
Under the current forest management regulations and harvesting practice there appear to
be no clear grounds for including Guyana’s red cedar population in CITES Appendix III.

67
Production of red cedar from large concessions is low and there appears to be an
opportunity to expand production from these concessions. This is likely related to poor
knowledge of the species among concessionaires and inventory teams. Large
concessionaires do not seek specialty markets for red cedar but are reported to sell the
species as mixed hardwood; i.e. below its intrinsic value. Better promotion of possibly
attractive markets for the species and training of inventory teams in identification of the
species are recommended.
Finally, red cedar is reported to attain maximum diameter increment rates through the
diameter class 40-60 cm dbh. Sustainable yield levels can therefore be increased by raising
the minimum cutting diameter limit (MCDL) to 60 cm dbh; long-term annual sustained yield
is currently estimated to lie close to 800 m3 per year with a MCDL of 40 cm, while with a
MCDL of 60 cm dbh a long-term sustained yield of around 1,150 m3 per year seems
achievable.

68
10 Literature Alder, D. (1995) Growth modelling for mixed tropical forests. Oxford Forestry Institute Tropical
Forestry Paper 30. Oxford Forestry Institute, Department of Plant Sciences, University of Oxford.
231 pp.
Alder, D. (2000) Development of growth models for applications in Guyana. DFID Guyana Forestry
Commission Support Project. Consultancy Report, 41 pp.
Alder, D. (2001) GEMFORM: Forestry software for stand tables and yield projections in Guyana. DFID
Guyana Forestry Commission Support Project. Consultancy Report, 43 pp.
Alder, D. (2002) Simple diameter class and cohort modelling methods for practical forest
management. In: Proceedings Malaysia-ITTO International Workshop on Growth and Yield of
Managed Tropical Forests,, Kuala Lumpur, 24th-28th June 2002, eds. M. I. Shaharuddin, K. S.
Thai, H. Y. Yap, D. Othman & S. Korsgaard. pp 28-37. Kuala Lumpur, Forestry Department
Peninsular Malaysia.
Alder, D. (2008) GEMFORM 7 User’s Guide. Guyana Forestry Commission Consultancy Report, 31 pp.
Brienen, R.J.W. & P.A. Zuidema (2006a) Lifetime growth patterns and ages of Bolivian rain forest
trees obtained by tree ring analysis. Journal of Ecology 94: 481–493
Brienen, R.J.W. & P.A. Zuidema (2006b) The use of tree rings in tropical forest management:
Projecting timber yields of four Bolivian tree species. Forest Ecology and Management 226(1):
256-267
Brienen, R.J.W. & P. A. Zuidema (2007) Incorporating persistent tree growth differences increases
estimates of tropical timber yield. Frontiers in Ecology and the Environment, 5, 302-306
Brown, N., S. Jennings & T. Clements (2003) The ecology, silviculture and biogeography of mahogany
(Swietenia macrophylla): a critical review of the evidence. Perspectives in Plant Ecology,
Evolution and Systematics, 6, 37-49.
Brune, A. and Melchior, G.H. (1976) Ecological and genetic factors affecting exploitation and
conservation of forests in Brazil and Venezuela. In: Burley, J. and Styles, B.T. Tropical trees:
variation, breeding and conservation. Academic Press, London. pp 203-215
Brunner, M.; Kucera, L. J.; Zürcher, E. (with illustrations by A. Hirzel). (1994) Major timber trees of
Guyana - a lens key. Tropenbos Series No. 10. The Tropenbos Foundation, Wageningen, the
Netherlands. 184 pp.
Chung, R.C.K., E. Boer, R.H.M.J. Lemmens & S. Noshiro (1995) Cedrela (Meliaceae). In: R.H.M. J.
Lemmens, I. Soerianegara & W.C. Wong (eds.). Plant Resources of South-East Asia No 5(2):
Timber Trees: Minor Commercial Timbers. Backhuys Publishers, Leiden. Pp. 122-127.
Cintron, B.B. (1990) Cedrela odorata L. Cedro Hembra, Spanish Cedar, Meliaceae. Mahogany family.
In: Silvics of North America. Hardwoods. Agric. Handbook, 654. Washington, DC. USDA. Vol. 2.pp
250–257.
CITES (2007) Consideration of Proposals for Amendment of Appendices I and II (CoP14 Prop. 33),
Available at: http://www.cites.org/sites/default/files/eng/cop/14/prop/E14-P33.pdf. Accessed
29/01/2015.

69
CITES (2009) Informe de avances del Perú en la aplicación del plan de acción para Cedrela odorata;
presented by Peru at the 18th meeting of the CITES Plant Committee in Buenos Aires
(Argentina), 17-21 March de 2009 (doc: PC18 Inf. 13). Available at:
http://cites.org/sites/default/files/common/com/pc/18/X-PC18-Inf13.pdf. Accessed
20/11/2014.
Clark, D.A. and D.B. Clark (1992) Life-history diversity of canopy and emergent trees in a neotropical
rain forest. Ecological Monographs 62: 315–344.
Davis, T.A.W. & Richards, P.W. (1933, 1934). The vegetation of Moraballi Creek, British Guiana; an
ecological study of a limited area of tropical rain forest I and II. J. of Ecol,. 21: 350-384 and 22:
106-155.
De León, D. (1941) Some observations on forest entomology in Puerto Rico. Exp. Sta. Rio Piedras,
Puerto Rico., U.S.D.A, Forest Service, Caribbean Forester 2: 160 – 163.
De Graaf, N.R., Poels, R.L.H., Rompaey, R.S.A.R. (1999). Effect of silvicultural treatment on growth
and mortality of rainforest in Surinam over long periods. Forest Ecology & Management 124,
123–135.
De Groot, D. and R. de Milde (1970a) Guyana: reconnaissance survey of the more accessible forest
areas, zone 1. GUY/9. Forest Industries Development Survey. Technical Reports No 8A. FAO,
Rome, FO-UNDP/SF GUY/9. 20 pp. & 1 large map in folder
De Groot, D. and R. de Milde (1970b) Guyana: reconnaissance survey of the more accessible forest
areas, zone 2. GUY/9. Forest Industries Development Survey. Technical Reports No 8B. FAO,
Rome, FO-UNDP/SF GUY/9. 22 pp. & 1 large map in folder
De Groot, D. and R. de Milde (1970c) Guyana: reconnaissance survey of the more accessible forest
areas, zone 3. GUY/9. Forest Industries Development Survey. Technical Reports No 8C. FAO,
Rome, FO-UNDP/SF GUY/9. 19 pp. & 1 large map in folder
De Groot, D. and R. de Milde (1970d) Guyana: reconnaissance survey of the more accessible forest
areas, zone 4. GUY/9. Forest Industries Development Survey. Technical Reports No 8D. FAO,
Rome, FO-UNDP/SF GUY/9. 22 pp. & 1 large map in folder
De Groot, D. and R. de Milde (1970e) Guyana: reconnaissance survey of the more accessible forest
areas, zone 5. GUY/9. Forest Industries Development Survey. Technical Reports No 8E. FAO,
Rome, FO-UNDP/SF GUY/9. 24 pp. & 1 large map in folder
De Groot, D. and R. de Milde (1970f) Guyana: forest industries development survey: inventory of the
Ebini-Itaki area. GUY/9. Forest Industries Development Survey. Technical Report no 9. FAO,
Rome, FO-UNDP/SF GUY/9. 117 pp. 28 & 1 large map.
De Groot, D. and R. de Milde (1970g) Guyana: forest industries development survey: reconnaissance
survey of the southern part of Guyana. GUY/9. Forest Industries Development Survey. Technical
Report no 15. FAO, Rome, FO-UNDP/SF GUY/9. 73 pp. 19 graphs, 14 large maps.
De Groot, D. and R. de Milde (1971) Guyana: Forest industries development survey: inventory of a
selected area in the North-West district. GUY/9. Forest Industries Development Survey. Technical
Report no 10. FAO, Rome, FO-UNDP/SF GUY/9. 56 pp. & 2 large maps in folder
Earle Smith, C. (1960) A revision of Cedrela (Meliaceae). Fieldiana: Botany 29: 295-341.

70
Entwistle, P.F. (1967) The Current Situation on Shoot, Fruit and Collar Borers of the Meliaceae.
Proceedings of the 9th British Commonwealth Forestry Conference, Commonwealth Forestry
Institute, Oxford, U.K. 15p.
Fanshawe, D.B. (1952). The vegetation of British Guiana; a preliminary review. Institute Paper 29.
Oxford, UK, Imperial Forestry Institute, University of Oxford.
Fanshawe, D.B. (1961). Forest products of British Guiana, Part 1: Principal Timbers, Forestry Bulletin
(new series) 1, Forest Department, British Guiana.
Ferriss. 2014. An analysis of trade in five CITES-listed taxa. London, Chatham House (The Royal
Institute of International Affairs)/TRAFFIC. 61 pp.
Flemmich, C.O. (1963). Report to the Government of British Guiana on the marketing of wood and
wood products with particular reference to the export of timber. Report No. 1737. FAO, Rome,
Italy.
Free, C. M., R. Matthew Landis, J. Grogan, M. D. Schulze, M. Lentini & O. Dünisch (2014)
Management implications of long-term tree growth and mortality rates: A modeling study of big-
leaf mahogany (Swietenia macrophylla) in the Brazilian Amazon. Forest Ecology and
Management, 330, 46-54.
Gentry, A.H. No date. Lowlands of Manu National Park: Cocha Cashu Biological Station, Peru.
Available at: http://www.nmnh.si.edu/botany/projects/cpd/sa/sa11.htm. Accessed 15/02/2015.
Gérard, J., R.B. Miller & B.J.H. Ter Welle (1996) Major timber trees of Guyana; timber characteristics
and utilization. Tropenbos Series No. 15. The Tropenbos Foundation, Wageningen, the
Netherlands.
Gillett, H. and S. Ferriss (2005) Strategies for the sustainable use and management of timber tree
species subject to international trade: Mesoamerica. UNEP World Conservation Monitoring
Centre, Cambridge, UK. URL: http://cites.org/sites/default/files/common/com/pc/16/X-PC16-04-
Inf.pdf. Accessed: 30/01/2015
Grogan, J., R. M. Landis, C. M. Free, M. D. Schulze, M. Lentini & M. S. Ashton (2014) Big-leaf
mahogany Swietenia macrophylla population dynamics and implications for sustainable
management. Journal of Applied Ecology, 51, 664-674.
Gullison, R.E., Panfil, S.N., Strouse, J.J. & Hubbell, S.P. (1996) Ecology and management of mahogany
(Swietenia macrophylla King) in the Chimanes Forest, Beni, Bolivia. Botanical Journal of the
Linnean Society 122: 9–34.
Hohenkerk, B.S. (1923). A review of the timber industry of British Guiana, Journal of the Board of
Agriculture of British Guiana, vol. XVI
Horsten, F. (2002) Correlation between local tree names, regional trade names and their scientific
designations; annex 1: Description (in Dutch) of the most harvested and potential timber
species [based on Japing, Lindeman & Ostendorf (see refs.), supplemented with information
from other sources]. Suriname Ministry of Natural Resources, Paramaribo / FAO, Rome;
GCP/SUR/001/NET
71
Hubbell, S.P. and Foster, R.B. (1986). Commonness and rarity in a neotropical forest: implications for
tropical tree conservation. In: Soulé, M.E. (Ed.), Conservation Biology: Science of Scarcity and
Diversity. Sinauer Associates, Sunderland, MA, USA, pp. 205–231.
Husch, B., C. I. Miller & T. W. Beers (1982) Forest mensuration, Third edition. New York, USA: John
Wiley & Sons. 402 pp.
INBio (Instituto Nacional de Biodiversidad). (1999) UBIs: Unidades básicas de información: Cedrela
odorata. http://atta2.inbio.ac.cr/neoportal-web/species/Cedrela%20odorata. Accessed
15/02/2015.
INRENA (2006) Asunto: Inclusión del cedro en el Apéndice II de la CITES. Instituto Nacional de
Recursos Naturales, Peru. 2pp. [Response to the Netherlands’ request to the CITES Management
Authority of Peru for information regarding the proposed inclusion of Cedrela odorata in
Appendix II].
Institute of Mines and Forests of British Guiana (1903). General information with regard to the gold,
diamond and forest industries of British Guiana. Government of British Guiana.
James, T., Vege, S., Aldrich, P. and Hamrick, J.L. (1998) Mating systems of three tropical dry forest
tree species. Biotropica 30 (4): 587-594
Janzen, D.H. (1986) Tropical dry forests: the most endangered major tropical ecosystem. In: Wilson,
E.O. (Ed.) Biodiversity. National Academy Press, Washington, DC. pp. 130-137.
Japing, C. H. & H. W. Japing (1960) Houthandboek – Surinaamse Houtsoorten [Timber Handbook -
Timber species of Suriname]. 264 pp. Dienst ‘s Lands Bosbeheer, Suriname, Paramaribo.
Lamb, F.B. (1966) Mahogany in Tropical America: its Ecology and Management. University of
Michigan Press, Ann Arbor.
Lamb, A.F.A. (1968) Cedrela odorata. Fast growing timber trees of the lowland tropics No 2.
Commonwealth Forestry Institute, Oxford. 46 pp.
Lamprecht, H. (1989) Silviculture in the tropics; tropical forest ecosystems and their tree species,
possibilities and methods for their long-term utilization. GTZ, Eschborn, Germany. pp. 230-232.
Laurance, W.F. (1999) Reflections on the tropical deforestation crisis. Biological Conservation. 91:
109-117.
Lemmens, R.H.M.J. (2008) Cedrela odorata L. [Internet] Record from PROTA4U. Louppe, D., Oteng-
Amoako, A.A. & Brink, M. (Editors). PROTA (Plant Resources of Tropical Africa / Ressources
végétales de l’Afrique tropicale), Wageningen, Netherlands.
<http://www.prota4u.org/search.asp>. Accessed 11 February 2015.
Lindeman, J.C. & Mennega A.M.W (with illustrations by W.H.A. Hekking). (1963) Bomenboek voor
Suriname; herkenning van Surinaamse houtsoorten aan hout en vegetatieve kenmerken. [Major
Trees of Suriname; recognition of Surinamese timber species from wood and vegetative
characteristics.] Dienst ‘s Lands Bosbeheer Suriname – Paramaribo en Universiteit Utrecht. 312
pp + Platen (122 pp).
Little, E.L. Jr. and Wadsworth, F.H. (1964) Common trees of Puerto Rico and the Virgin Islands.
Agricultural Handbook. No. 249. US Department of Agriculture. Washington DC.

72
MacKinnon, S., Durst, T., Arnason, J.T., Angerhofer, C., Pezzuto, J., Sanchez-Vindas, P.E., Poveda, L.J.
& Gbeassor, M. (1997) Antimalarial activity of tropical Meliaceae extracts and gedunin
derivatives. Journal of Natural Products, 60 (4): 336-341.
Mahar, D. and Schneider, R. (1994) Incentives for tropical deforestation: some examples from Latin
America. In: Brown, K. and Pearce, D.W. (1994. The causes of tropical deforestation. The
economic and statistical analysis of factors giving rise to the loss of the tropical forests. UCL
Press Limited, London.pp 159-171.
Marshall, R.C. (1939) Silviculture of the trees of Trinidad and Tobago. London, Oxford University
Press.
Martorell, L.F. (1943) Forests and Forest Entomology. Caribbean Forester 4:132-34.
Matuzak, G.M.S and Dear, F. (2003) Scarlet Macaw (Ara macao) restoration and research program in
Curú National Wildlife Refuge, Costa Rica. Yearly project report.
Mayaux, P., Holmgren, P., Achard, F., Eva, H., Stibig, H-J. and Branthomme, A. (2005) Tropical forest
cover change in the 1990s and options for future monitoring. Philosophical transaction of the
Royal Society. 360: 373-384.
Mayhew JE & Newton AC (1998) The Silviculture of Mahogany. CAB International, Wallingford.
Miller, R. B.; Détienne, P. (2001) Major timber trees of Guyana: wood anatomy. Tropenbos Series No.
20. The Tropenbos Foundation, Wageningen, the Netherlands. 223 pp.
Navarro Cerrillo, R. M. N., N. Agote, F. Pizarro, C. J. Ceacero & G. Palacios (2013) Elements for a non-
detriment finding of Cedrela spp. in Bolivia—A CITES implementation case study. Journal for
Nature Conservation, 21: 241-252.
Newman, D.H. (2004) Evaluating the Opportunity Costs in Establishing a Nature Reserve. In: Groom,
M.J., Meffe, G.K and Carroll, R.C. (Eds) (2004) Principles of conservation biology. Third edition.
Sinauer Press.
Newton, A. C. Leakey R.R.B. and Mesén F. (1993) Genetic variation in mahoganies: its importance,
capture and utilization. Biodiversity and Conservation. 2 : 114–126.
Orwa, C., A. Mutua, Kindt, R., Jamnadass, R., S. Anthony (2009) Agroforestree Database: a tree
reference and selection guide version 4.0. Available at:
http://www.worldagroforestry.org/sites/treedbs/treedatabases.asp. Accessed 15/02/2015.
Ostendorf, F.W. (1962) Nuttige planten en sierplanten in Suriname [Useful and ornamentals plants
in Suriname]. Landbouwpoefstation [Agricultural Research Institute] in Suriname, Bulletin 79.
325 pp.
Patiño, V.F. (1997) Genetic resources of Swietenia and Cedrela in the Neotropics: Proposals for
Coordinated Action. Supported by Project FAO/GCP/RLA/128/NET. Available at:
http://www.fao.org/docrep/006/AD111E/AD111E02.htm#ch2.2. Accessed: 15/02/2015
Patiño, V.F. and Marin, Ch.J. (1991) Regeneración y manejo de selvas. Cuarta Reunión Anual del
INIFAP en el Estado de Veracruz. CIR Golfo Centro, INIFAP.
Pennington, T.D. (1981) A monograph of neotropical Meliaceae. Flora Neotropica Monograph 28.
The New York Botanical Garden, New York. pp. 360-385.

73
Pennington, T.D. (2002) Mahogany: carving a future. Biologist 49: 204–208
Pennington, T.D. (2006) cited in CITES (2007) Consideration of Proposals for Amendment of
Appendices I and II (CoP14 Prop. 33), Available at:
http://www.cites.org/sites/default/files/eng/cop/14/prop/E14-P33.pdf. Accessed: 29/01/2015.
Polak, A. M. (with illustrations by H.R. Rypkema). (1992) Major timber trees of Guyana: a field guide.
Tropenbos Series No. 2. The Tropenbos Foundation, Wageningen, the Netherlands. 272 pp.
Reynel, C. and Pennington, T. (1989) Reporte sobre los cedros y su situación en el Perú, una
contribución al conocimiento y la conservación de las Meliáceas peruanas. Universidad Nacional
Agaria La Molina, Centro de Datos Para la Conservación Perú, Lima. cited by Patiño, V.F. (1997).
Reynel, C.R. (1988. Estudio de la variabilidad fenotípica de Cedrela odorata en el Peru. Informe final
presentado a la FAO (no publicado). cited by Patiño, V.F. (1997).
Rocas, A.N. (2003) Cedrela odorata L., United States Department of Agriculture, Forest Service,
Washington DC, vol. 721 of Agriculture Handbook, chap. Tropical tree seed manual. Part II -
Species descriptions, pp. 386-388.
Rozendaal, D. M. A., C. C. Soliz-Gamboa & P. A. Zuidema (2010) Timber yield projections for tropical
tree species: The influence of fast juvenile growth on timber volume recovery. Forest Ecology
and Management, 259: 2292-2300.
Salas, E. J. B. (1993) Árboles de Nicaragua. Instituto Nicaragüense de Recursos Naturales y del
Ambiente (IRENA). Managua. Nicaragua. 390 p.
Schulze, M., J. Grogan, R. M. Landis & E. Vidal (2008) How rare is too rare to harvest?: Management
challenges posed by timber species occurring at low densities in the Brazilian Amazon. Forest
Ecology and Management, 256, 1443-1457.
Snook, L.K. (1993) Stand dynamics of Mahogany (Swietenia macrophylla King) and associated species
after fire and hurricane in the tropical forests of the Yucatan Peninsula, Mexico. PhD thesis, Yale
University.
Snook, L.K. (1996) Catastrophic disturbance, logging and the ecology of mahogany (Swietenia
macrophylla King): grounds for listing a major tropical timber species in CITES. Botanical Journal
of the Linnean Society 122: 35–46.
Standley, P.C. and Steyermark, J.A. (1946) Flora of Guatemala. Fieldiana: Botany. Volume 24, part V.
Chicago Natural History Museum.
Stevenson, N.S. (1927) Silvicultural treatments of mahogany forests in British Honduras. Empire
Forestry Journal 6: 219–227.
Ter Steege, H. (2001a) National Vegetation Map of Guyana. Guyana Forestry Commission.
Ter Steege, H (2001b) Biomass estimates for forests in Guyana and their use in carbon offsets.
Iwokrama Research Report 2001-01, 43 pp.
The Wood Database (no date). Spanish Cedar. Available at: http://www.wood-
database.com/lumber-identification/hardwoods/spanish-cedar/ . Retrieved at 10/02/2015
Tillmans, H. J. (1964) Notas bibliográficas sobre Hypsipyla grandella Zeller. Inst. For. Latino
Americano. Mérida. Venezuela. Bol. 14: 82–92.

74
UNEP-WCMC CITES (no date) Wiki Identification Manual database. Available at
http://www.cites.org/eng/resources/wiki_id.php. Retrieved at 10/02/2015 (authors: Prof. Pieter
Baas and Ms Bertie van Heuven from the Nationaal Herbarium Nederland, Universiteit Leiden
branch, Leiden, The Netherlands)
Van der Hout, P. (2011). Guyana. In: Werger, M.J.A. (ed.), Sustainable Management of Tropical
Rainforests - the CELOS Management System. Tropenbos International, Paramaribo, Suriname p.
167-185.
Van Kekem, A.J., Pulles, J.H.M., Khan, Z. (1996). Soils of the rainforest in Central Guyana. Tropenbos
Guyana Series (Netherlands), no. 2 / Georgetown (Guyana), Tropenbos-Guyana Programme ,
1996 , 160 p.
Vanclay, J. K. (1994) Modelling forest growth and yield: applications to mixed tropical forests. CAB
International, Wallingford, UK. 280 pp.
Watt, A.D., Newton, A.C. and Cornelius, J.P. (2001) Resistance in Mahoganies to Hypsipyla species – a
basis for integrated pest management. In: R.B. Floyd and C. Hauxwell (Eds) Hypsipyla shoot
borers in Meliaceae (ACIAR Proceedings) pp. 89-95.
Webb, D.B., Wood, P.J., Smith, J.P., Henman, G.S. (1984) A guide to species selection for tropical and
sub-tropical plantations. Second Edition. Tropical forestry papers no.15. Department of Forestry,
Commonwealth Forestry Institute, University of Oxford. 256pp.
Welch, I.A. and Bell, G.S. (1971) Great Falls Inventory. Guyana Forest Department, Georgetown.
Whitmore, T.C. (1998) An Introduction to Tropical Rain Forests. Oxford University Press, Oxford.

75
11 Glossary In this glossary explanations are given for the technical terms used in the botanical description.
actinomorphic having its petals arranged in a radially symmetric fashion.
acuminate having a gradually diminishing point
adnate linked or fused to something unlike itself
alternate inserted at different levels along the stem , not opposite (leaves or branches)
androecium the set of a flower's stamens.
androgynophore a stalk bearing both the androecium and the gynoecium of a flower above the
level of insertion of the perianth.
anther part of a stamen containing the pollen
apex tip
bark the phloem tissue formed on the outside by the cambium
blade limb of a leaf
bract small leaf subtending the flower stalk
buttress flattened outgrowth of the trunk, connected for its entire length with the
trunk, usually triangular in side view
calyx outer whorl of perianth leaves (sepals), often green
cambium layer of cells between the xylem and the phloem that is responsible for the
secondary growth of roots and stems; often difficult to see in a slash
capsule dry fruit which splits open (dehisces) to release the seeds
carina part of a flower consisting of two petals, commonly united, which encloses the
organs of fructification.
chartaceous resembling paper or parchment; papery.
comose bearing a tuft of soft hairs or down
corolla inner whorl or perianth leaves (petals), often coloured
cotyledons seed-lobes, first leaves of the embryo
cracked with fine, shallow grooves (see 'fissured')
dbh diameter at breast height (1.30 m)
dead bark the outer part of the bark in which no living tissue is present any more
deciduous falling off eventually (tree standing leafless part of the year )
dehiscent splitting up, opening (fruit)
dioecious with male and female flowers on different plants
discoid shaped like a disc
dorsifixed said of anthers that are attached to the filament somewhere along their back.
endemic occurring in a restricted area
epigeal germination cotyledons of the germinating seed expand, throw off the seed shell and
become photosynthetic above the ground
ellipsoid having the tridimensional shape of an ellipse rotated on its long axis.
falcate sickle-shaped
fibrous containing, consisting of, or resembling fibres
filament stalk of a stamen
fissure coarse, deep groove in bark
fissured with coarse, deep grooves; in fact a further developed stage of 'cracked', and
therefore not strictly separated from it; actual sizes should therefore be given

76
foliolate with a particular number of leaflets
glabrous smooth, without hairs or scales
gynoecium the pistils of a flower considered as a group
imbricate overlapping
inflorescence arrangement of the flowers on a plant
lateral to the side; of or pertaining to the side
leaflet the ultimate unit of a compound leaf
lenticel small, oval, rounded spots upon the twig, fruit, stem or branch of a plant, from
which the underlying tissues may protrude
lenticellate with lenticels
living bark the inner part of the bark; bark recently formed by the cambium which still
contains living tissue
locular having a loculus or compartment.
loculus one of the compartments of a several-celled ovary
monoecious having the male and female reproductive organs on different parts of the
same plant
oblong rectangle-shaped (2:1 - 3:1); narrowly oblong (6:1 - 3:1); transversely-oblong
(2:3 -1:2); narrowly transversely-oblong (1:3 -1:6)
obovate shaped like an egg, with the broad extremity located away from the base.
obovoid approximately obovate in shape.
obtuse blunt or rounded at the base or apex, at an angle of more than 90 degrees
opaque not reflecting light
ovary part of a carpel containing the ovules and eventually becoming the fruit
ovate egg-shaped (of a flat surface), greatest width below the middle (2:1 - 3:2);
depressed-ovate (2:3 -1:2)
ovoid egg-shaped (three-dimensional)
panicle inflorescence , in which the main axis bears several side branches with several
flowers
paripinnate compound leaf with pinnate leaflets, without a terminal one
pedicel stalk of a single flower
peduncle stalk of an inflorescence
pendulous hanging or bending downwards; drooping or weeping
pentamerous in five parts; made up of five parts.
perianth flower leaves (tepaIs; sepals and petals)
petals corolla leaves: inner whorl of often coloured perianth leaves
petiole leaf stalk
petiolule the stalk (petiole) of a leaflet of a compound leaf
phloem living vascular tissue that carries organic nutrients (known as photosynthate),
in particular, sucrose, to all parts of the plant where needed. In trees, the
phloem is the innermost layer of the bark
photosynthate compound that is a product of photosynthesis; process by which plants
generate carbohydrates and oxygen from carbon dioxide, water, and light
energy
pinna(e) yoke(s) of a compound leaf
pinnate with leaflets arranged along both sides of a common rachis

77
puberulous beset with soft, short, erect hairs
rachis main axis of inflorescence or compound leaf
rhombic rhomb-shaped (2:1 - 3:1); narrowly rhombic (6:1 - 3:1); transversely-rhombic
(2:3 - 1:2); narrowly transversely-rhombic (1:3 - 1:6)
ribbed with ridges or raised markings.
rugose having a rough, wrinkled surface
samara winged indehiscent fruit of trees
samaroid resembling a samara, or winged seed
sepals calyx leaves: outer whorl of usually green perianth leaves
sessile without stalk (flower, leaf)
slash cut blaze: the surface that becomes visible after a piece of bark has been
chopped off
stamen male reproductive organ of a flower, consisting of a filament and an anther
stigma sticky part of a flower that receives pollen during pollination
stipule leaf-like or scar-like appendage of a leaf, usually at both sides at the base of
the petiole
style mostly elongate part of a carpel at apex of ovary
subsessile not quite sessile
taproot main root of a primary-root system, growing vertically downward. From the
taproot arise smaller lateral roots (secondary roots)
tepals perianth leaves, not distinguishable as either a sepal or a petal
terminal proceeding from or belonging to the end or apex
trifoliolate (of a compound leaf) having three leaflets.
valves pieces into which a capsule naturally separates at maturity
vein thickened portion of the leaf containing the vascular bundle
venation pattern of veins or vein-like structures
vestige rudimentary or degenerate, usually non-functioning, structure that is the
remnant of an organ or part that was fully developed or functioning in a
preceding generation or an earlier stage of development
xylem living vascular tissue responsible for the distribution of water and minerals
taken up by the roots; also the primary component of wood
yoke a pair of opposite leaflets