resolution using raman spectroscopy supporting information
TRANSCRIPT

S1
Supporting Information
Probing Electric Field Distributions in the Double Layer
of a Single-Crystal Electrode with Angstrom Spatial
Resolution using Raman Spectroscopy
Bao-Ying Wen†, Jia-Sheng Lin†, Yue-Jiao Zhang†, Petar M. Radjenovic†, Xia-Guang Zhang‡,*, Zhong-Qun Tian†, Jian-Feng Li†,*
†State Key Laboratory of Physical Chemistry of Solid Surfaces, iChEM, College of Chemistry and Chemical Engineering, College of Energy, Xiamen University, Xiamen 361005, China ‡ Key Laboratory of Green Chemical Media and Reactions, Ministry of Education, Collaborative Innovation Center of Henan Province for Green Manufacturing of Fine Chemicals, School of Chemistry and Chemical Engineering, Henan Normal University, Xinxiang 453007, China
S2
Experimental and Computational Section
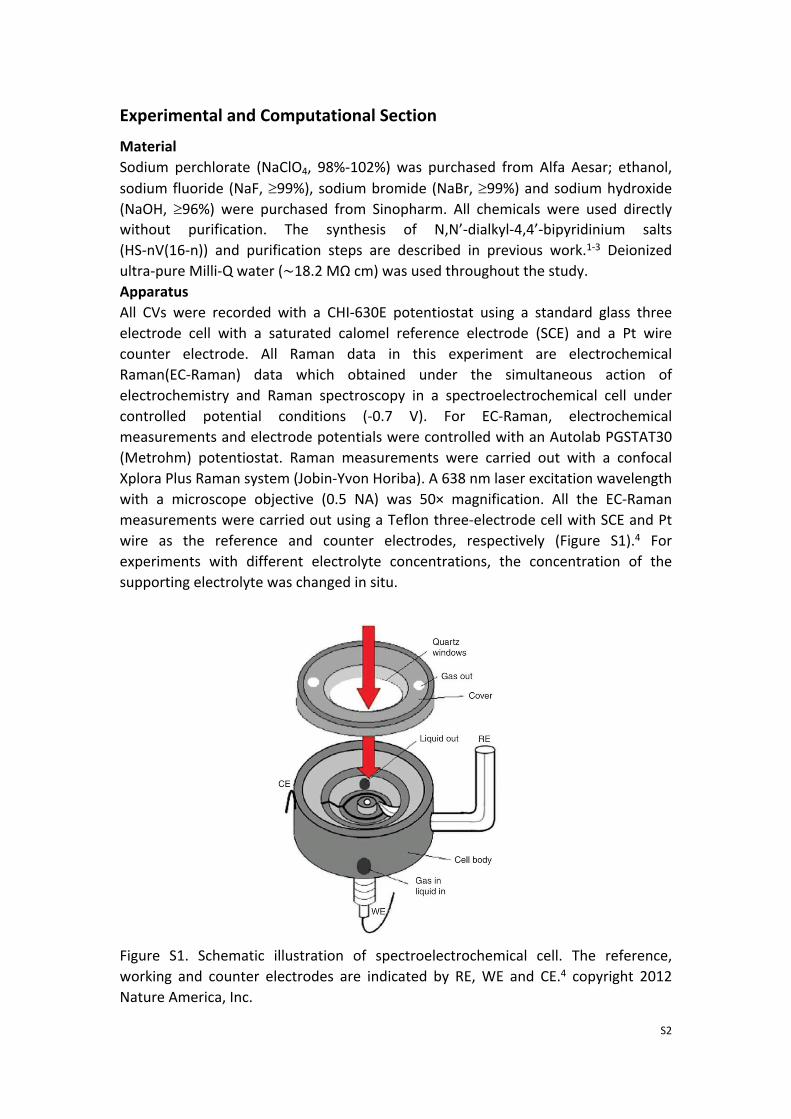
Material Sodium perchlorate (NaClO4, 98%-102%) was purchased from Alfa Aesar; ethanol, sodium fluoride (NaF, 99%), sodium bromide (NaBr, 99%) and sodium hydroxide (NaOH, 96%) were purchased from Sinopharm. All chemicals were used directly without purification. The synthesis of N,N’-dialkyl-4,4’-bipyridinium salts (HS-nV(16-n)) and purification steps are described in previous work.1-3 Deionized ultra-pure Milli-Q water (∼18.2 MΩ cm) was used throughout the study.ApparatusAll CVs were recorded with a CHI-630E potentiostat using a standard glass three electrode cell with a saturated calomel reference electrode (SCE) and a Pt wire counter electrode. All Raman data in this experiment are electrochemical Raman(EC-Raman) data which obtained under the simultaneous action of electrochemistry and Raman spectroscopy in a spectroelectrochemical cell under controlled potential conditions (-0.7 V). For EC-Raman, electrochemical measurements and electrode potentials were controlled with an Autolab PGSTAT30 (Metrohm) potentiostat. Raman measurements were carried out with a confocal Xplora Plus Raman system (Jobin-Yvon Horiba). A 638 nm laser excitation wavelength with a microscope objective (0.5 NA) was 50× magnification. All the EC-Raman measurements were carried out using a Teflon three-electrode cell with SCE and Pt wire as the reference and counter electrodes, respectively (Figure S1).4 For experiments with different electrolyte concentrations, the concentration of the supporting electrolyte was changed in situ.
Figure S1. Schematic illustration of spectroelectrochemical cell. The reference, working and counter electrodes are indicated by RE, WE and CE.4 copyright 2012 Nature America, Inc.
S3
Self-assembled viologen monolayers on Au(111) All viologen based self-assembled monolayers (SAMs) were prepared by immersing the Au(111) single crystal electrodes in 1.0 mM ethanolic solution of viologen, then thermally annealed at 60 C for 6 h, producing ordered high-coverage adlayers.3 After SAMs depostion, the modified Au-electrodes were rinsed with warm ethanol to remove physisorbed viologen species then dried.The calculation method of normalized intensityThe normalized intensity of 1529 cm-1 is performed according to the following steps. Firstly, using the overall charge of the first pair of peaks P1/P1 for viologen to calculate the surface coverage of each molecule, and then using the Raman intensity to normalize the surface coverage, finally obtaining the normalized Raman intensity of each molecule.Computational methodsDensity functional theory (DFT) calculations were performed using the Gaussian 16 program5. The geometric structures were optimized via spin-restricted calculations using the B3LYP functional. For H, C, N, O, F, S, and Cl atoms, the 6-311++G(d,p) basis was adopted, for Au atoms, the outer shell valence electrons were described by the Los Alamos National Laboratory double-ζ (LANL2DZ) basis, the inner shell electrons were described by the corresponding effective core potential. Frequency calculations showed that the optimized structures have the minimum energy states on the potential energy surfaces.
Absolute Raman intensities were calculated using the differential Raman scattering cross section6.
2 240
Raman 2
40
2
245 7
45 8 1 exp /
245 8 1 exp /
i
i i B i i
ii
i i B
h d dIc hc k T dQ dQ
h Sc hc k T
Where h, c, kB, and T are Planck constant, the speed of light, Boltzmann constant, and temperature (Kelvin), respectively. Si is the Raman scattering factor (Å4 amu-1) that was calculated using Gaussian 16 with equilibrium geometries and anisotropic polarizabilities with respect to the given normal coordinate. Here ω0 and ωi denote the frequency of the ith mode. The simulated Raman spectra were presented in terms of a Lorentzian expansion with a line width of 10 cm‒1. The differential Raman scattering cross-sectional values of different vibrational modes were calculated from the Raman scattering factor under the double-harmonic approximation, with a specific excitation wavelength of 633 nm at room temperature.
The electron density grid and local potential in real-space were obtained by performing DFT calculations using the Vienna ab initio simulation package (VASP)7. The Perdew-Burker-Ernzerhof (PBE) density functional and projector augmented potential (PAW) methods were applied, with a plane-wave basis energy cutoff of 450 eV. The Methfessel-Paxton method was used to speed up the wave functional convergence with an electronic temperature of 0.1 eV. The quasi-Newton scheme
S4
was used in geometry optimization and convergence criterion for the force was set at less than 0.02 eV Å-1. The dipole moment corrections were calculated. The applied electrostatic field was set at 0.3 eV Å-1. A three layer 3×3 Au(111) slab with the bottom 2 layers fixed was used, and a vacuum region of about 50 Å. The Г-centered k-point sampling grid of 2×2×1 was adopted for geometric optimization. The potential and charge density have performed to simulation the local potential property and charge density projections.
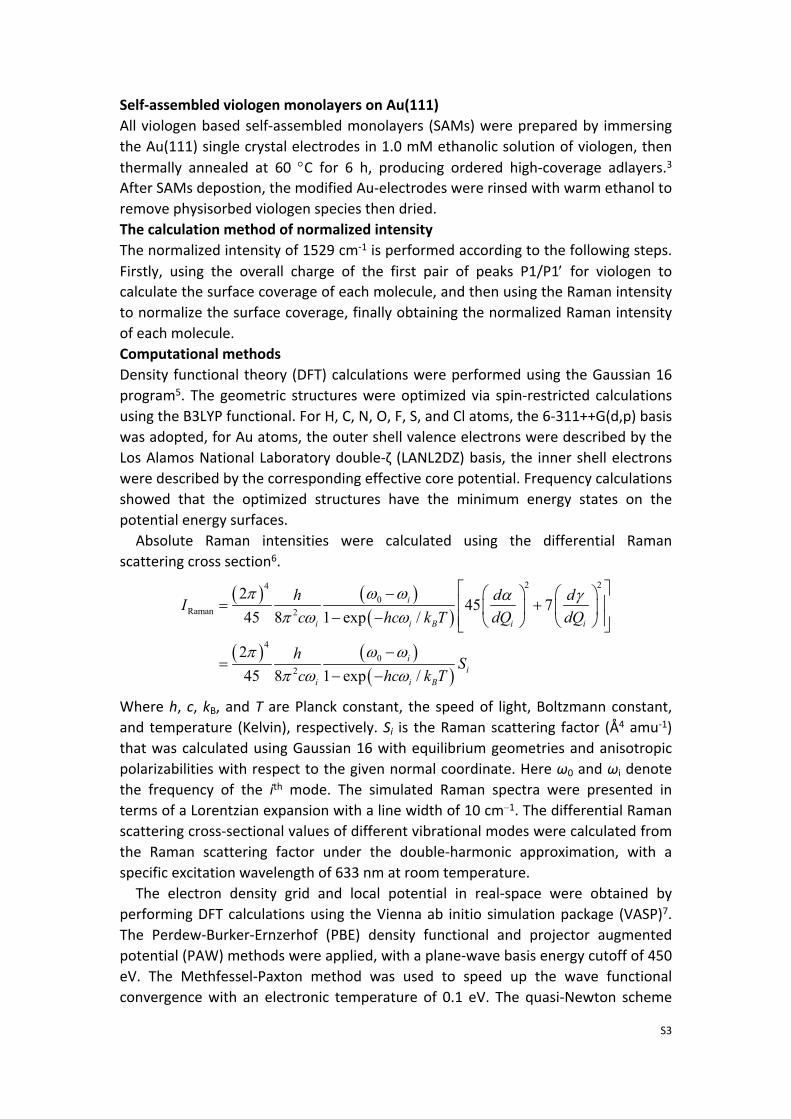
Figure S2. Experimental and calculated Raman spectra of viologen HS-6V10 at different state. The Raman spectra of V2+ was directly collected from the solid powder of viologen HS-6V10 (the excitation wavelength, power and acquisition time were 638 nm, 1.6 mW and 1 s, respectively); The Raman spectra of V+• was collected from the viologen SAMs on Au(111) surface at -0.7 V in 1 mmol/L NaClO4 solution(the excitation wavelength, power and acquisition time were 638 nm, 1.6 mW and 100 s, respectively).
S5
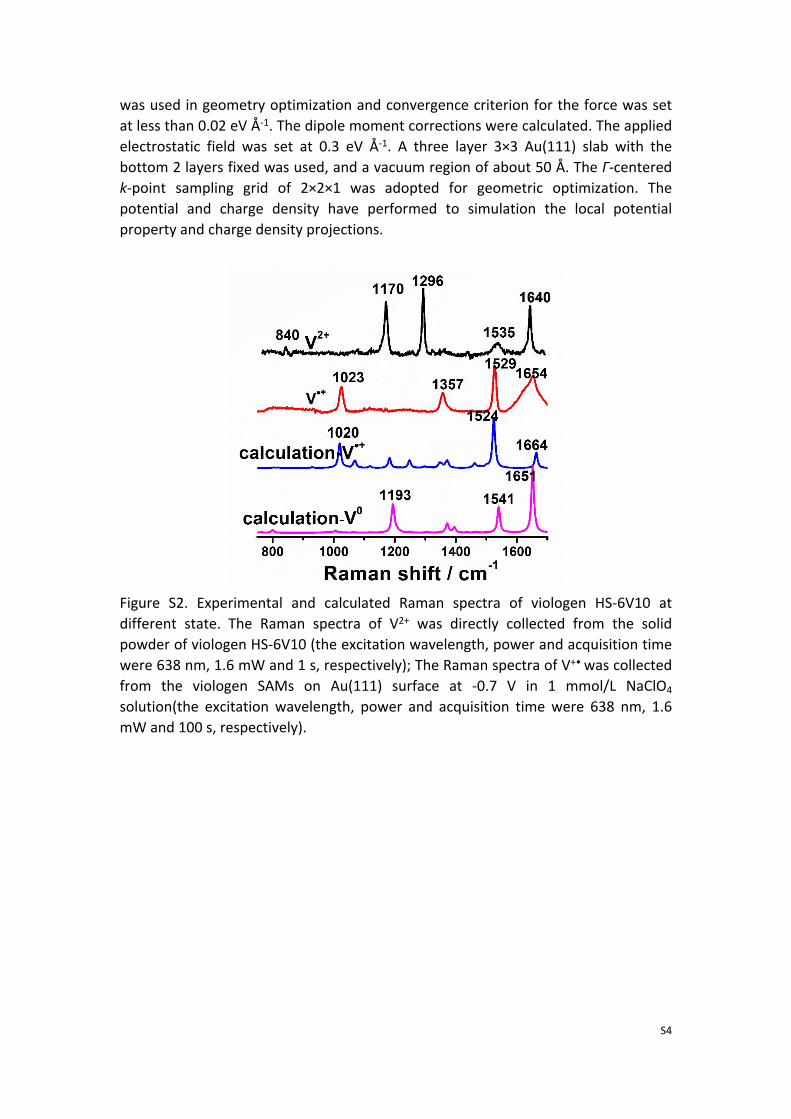
Figure S3. The dipole vectors of seven molecules in V+• state adsorption on Au surfaces (Au5 cluster). The calculations are obtained at the B3LYP/6-311+G(d,p) level. The blue arrows represent the dipole vectors.
S6
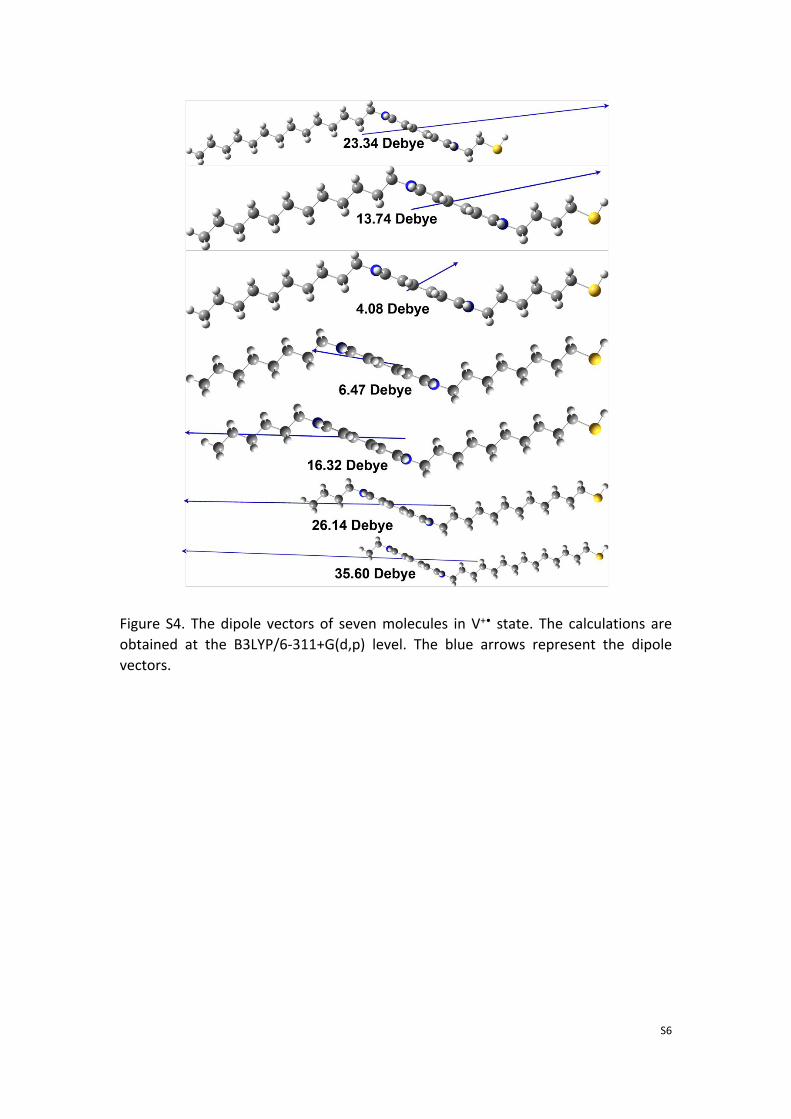
Figure S4. The dipole vectors of seven molecules in V+• state. The calculations are obtained at the B3LYP/6-311+G(d,p) level. The blue arrows represent the dipole vectors.
S7
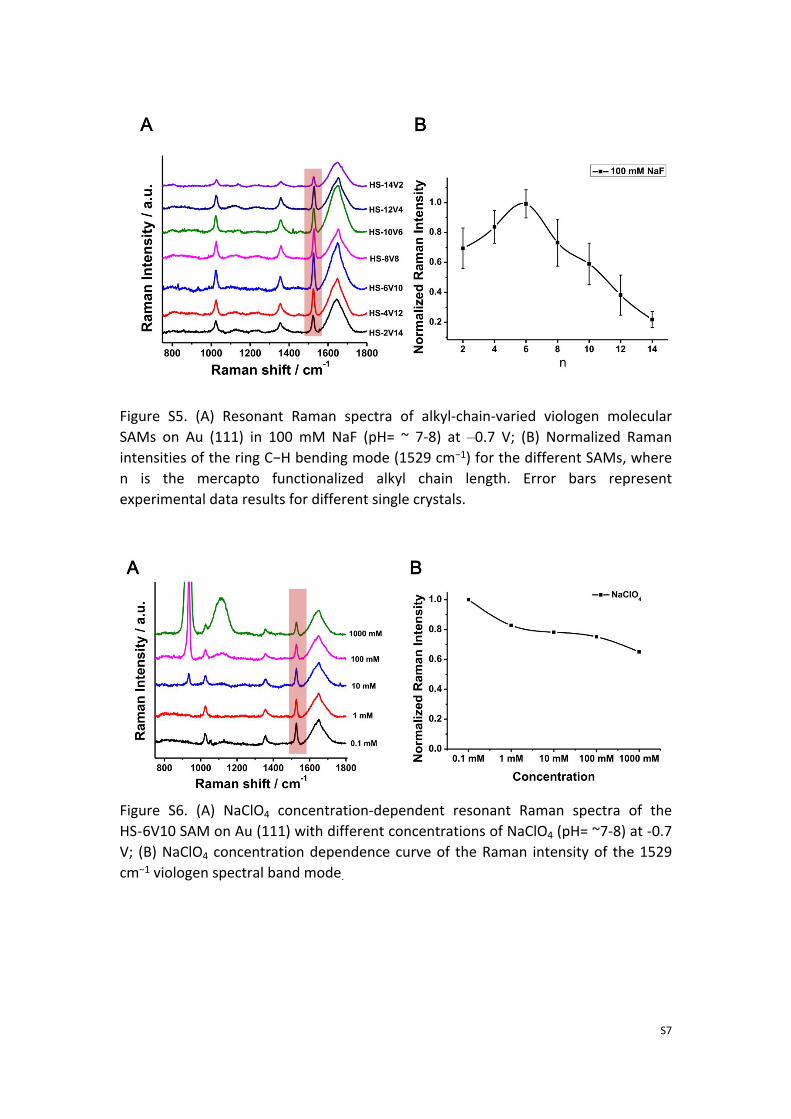
Figure S5. (A) Resonant Raman spectra of alkyl-chain-varied viologen molecular SAMs on Au (111) in 100 mM NaF (pH= ~ 7-8) at ‒0.7 V; (B) Normalized Raman intensities of the ring C−H bending mode (1529 cm−1) for the different SAMs, where n is the mercapto functionalized alkyl chain length. Error bars represent experimental data results for different single crystals.
Figure S6. (A) NaClO4 concentration-dependent resonant Raman spectra of the HS - 6V10 SAM on Au (111) with different concentrations of NaClO4 (pH= ~7-8) at -0.7 V; (B) NaClO4 concentration dependence curve of the Raman intensity of the 1529 cm−1 viologen spectral band mode.
S8
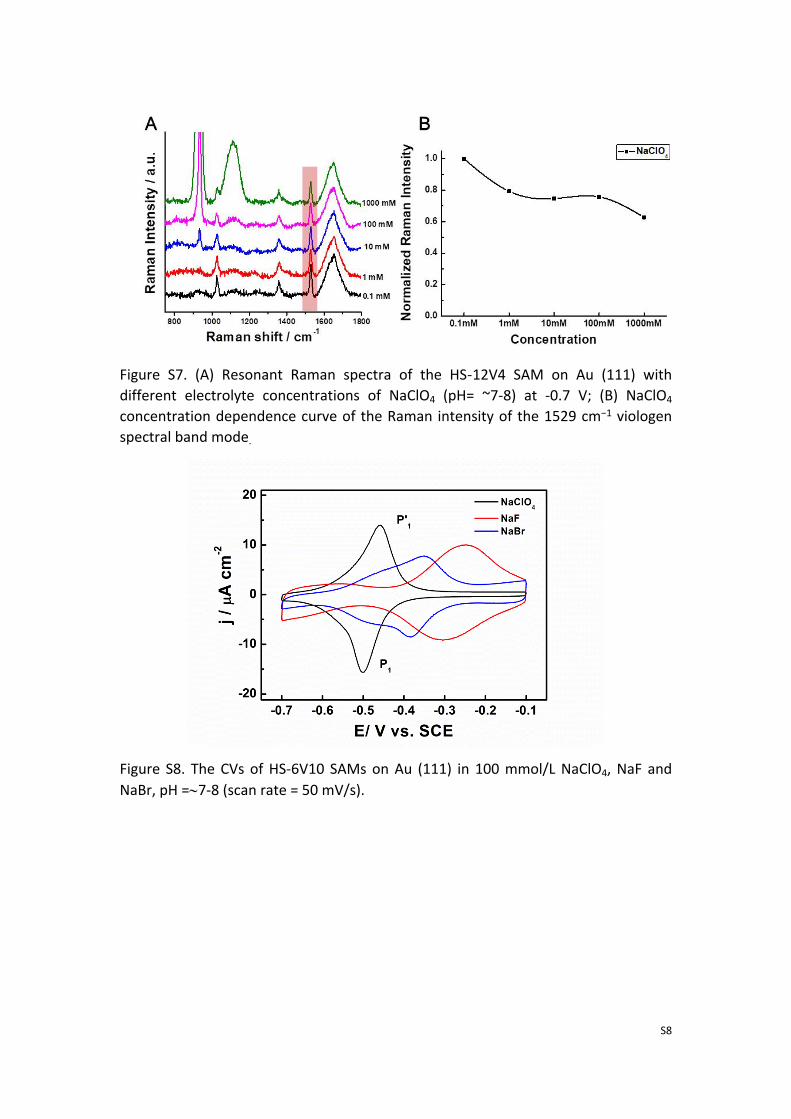
Figure S7. (A) Resonant Raman spectra of the HS - 12V4 SAM on Au (111) with different electrolyte concentrations of NaClO4 (pH= ~7-8) at -0.7 V; (B) NaClO4 concentration dependence curve of the Raman intensity of the 1529 cm−1 viologen spectral band mode.
Figure S8. The CVs of HS-6V10 SAMs on Au (111) in 100 mmol/L NaClO4, NaF and NaBr, pH =7-8 (scan rate = 50 mV/s).

S9
Figure S9. (A) Resonant Raman spectra of the HS - 6V10 SAM on Au (111) with different NaF electrolyte concentrations (pH= ~7-8) at -0.7 V; (B) NaF concentration dependence curve of the Raman intensity of the 1529 cm−1 viologen spectral band.
Figure S10. (A) Resonant Raman spectra of the HS - 6V10 SAM on Au (111) with different NaBr electrolyte concentrations (pH= ~7-8) at -0.7 V; (B) NaBr concentration dependence curve of the Raman intensity of the 1529 cm−1 viologen spectral band.
S10
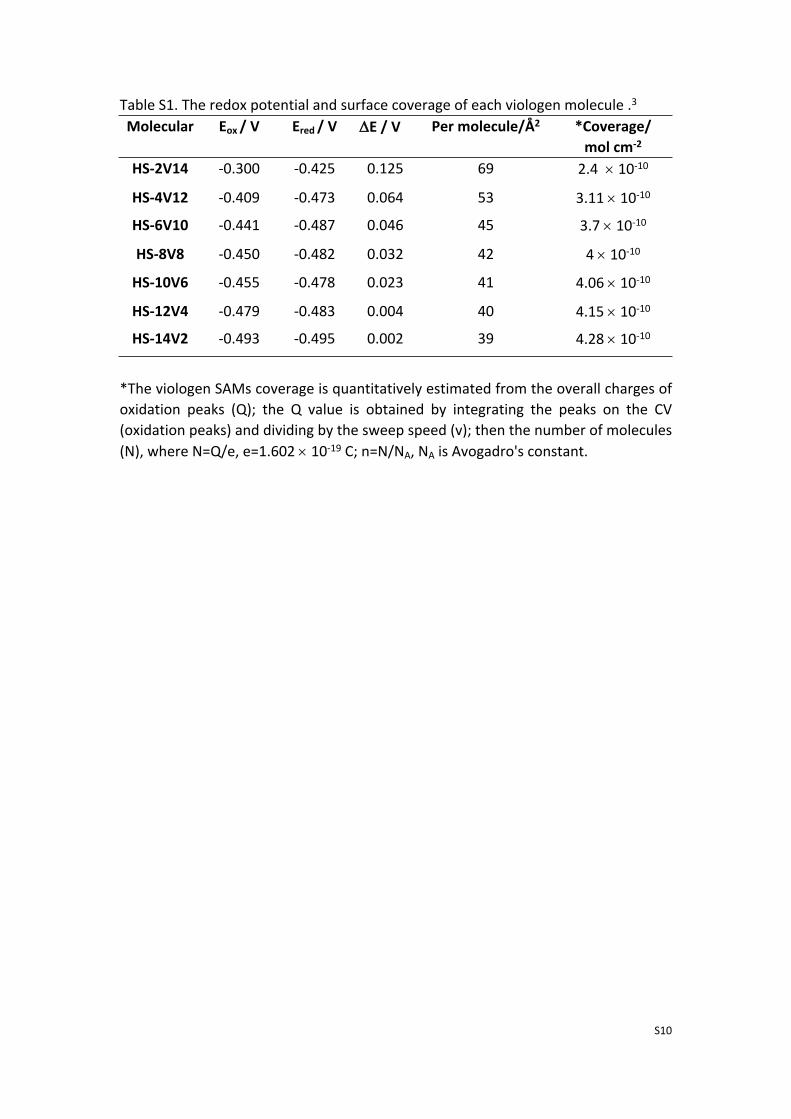
Table S1. The redox potential and surface coverage of each viologen molecule .3 Molecular Eox / V Ered / V E / V Per molecule/Å2 *Coverage/
mol cm-2
HS-2V14 -0.300 -0.425 0.125 69 2.4 10-10
HS-4V12 -0.409 -0.473 0.064 53 3.11 10-10
HS-6V10 -0.441 -0.487 0.046 45 3.7 10-10
HS-8V8 -0.450 -0.482 0.032 42 4 10-10
HS-10V6 -0.455 -0.478 0.023 41 4.06 10-10
HS-12V4 -0.479 -0.483 0.004 40 4.15 10-10
HS-14V2 -0.493 -0.495 0.002 39 4.28 10-10
*The viologen SAMs coverage is quantitatively estimated from the overall charges of oxidation peaks (Q); the Q value is obtained by integrating the peaks on the CV (oxidation peaks) and dividing by the sweep speed (v); then the number of molecules (N), where N=Q/e, e=1.602 10-19 C; n=N/NA, NA is Avogadro's constant.

S11
Table S2. Raman scattering activities (Å4 amu-1), frequencies (ω, cm‒1), reduced masses (amu), and force constants (mDyne Å-1) of the 1529
cm−1 viologen spectral band of HS-6V10 in different fields (a.u.).
Field 0.03 0.02 0.01 0.005 0.002 0.00 -0.002 -0.005 -0.01 -0.02 -0.03 -0.04
Raman 2743.8 3082.9 3293.2 3333.2 3338.4 3334.5 3325.0 3298.9 3222.2 2939.6 2526.7 1979.8
ω 1552.0 1552.8 1553.4 1553.6 1553.6 1553.6 1553.6 1553.6 1553.5 1552.9 1551.9 1550.7
Mass 2.2993 2.3283 2.3468 2.3517 2.3531 2.3534 2.3531 2.3517 2.3466 2.3269 2.2999 2.2640
Force 3.2629 3.3078 3.3367 3.3443 3.3464 3.3469 3.3465 3.3443 3.3366 3.3061 3.2636 3.2075
Table S3. Raman scattering activities (Å4 amu-1), frequencies (ω, cm‒1), reduced masses (amu), and force constants (mDyne Å-1) of the 1529
cm−1 viologen spectral band of HS-8V8 in different fields (a.u.).
Field 0.02 0.01 0.005 0.002 0.00 -0.002 -0.005 -0.01 -0.02
Raman 3025.8 3261.4 3307.2 3327.8 3328.7 3324.3 3306.5 3241.9 2989.3
ω 1553.0 1553.5 1553.6 1553.6 1553.7 1553.6 1553.6 1553.4 1552.8
Mass 2.3298 2.3484 2.3494 2.3542 2.3540 2.3538 2.3520 2.3463 2.3266
Force 3.3104 3.3392 3.3412 3.3481 3.3478 3.3474 3.3448 3.3360 3.3053
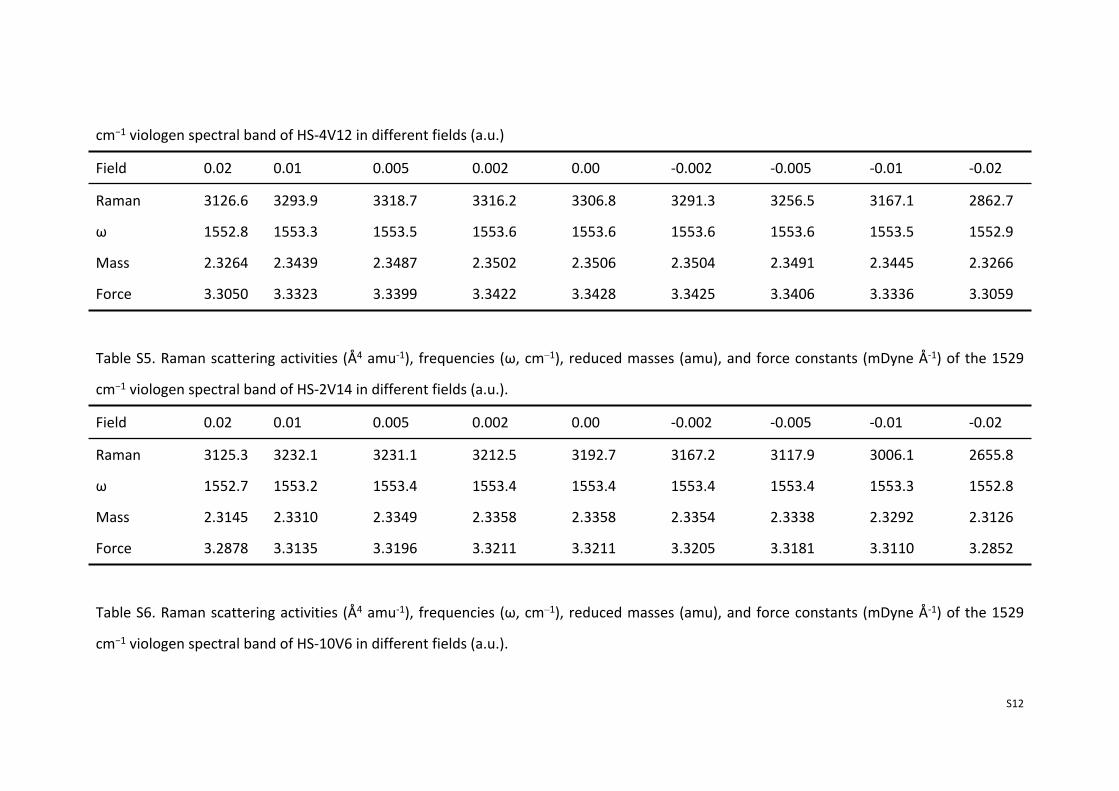
Table S4. Raman scattering activities (Å4 amu-1), frequencies (ω, cm‒1), reduced masses (amu), and force constants (mDyne Å-1) of the 1529
S12
cm−1 viologen spectral band of HS-4V12 in different fields (a.u.)
Field 0.02 0.01 0.005 0.002 0.00 -0.002 -0.005 -0.01 -0.02
Raman 3126.6 3293.9 3318.7 3316.2 3306.8 3291.3 3256.5 3167.1 2862.7
ω 1552.8 1553.3 1553.5 1553.6 1553.6 1553.6 1553.6 1553.5 1552.9
Mass 2.3264 2.3439 2.3487 2.3502 2.3506 2.3504 2.3491 2.3445 2.3266
Force 3.3050 3.3323 3.3399 3.3422 3.3428 3.3425 3.3406 3.3336 3.3059
Table S5. Raman scattering activities (Å4 amu-1), frequencies (ω, cm‒1), reduced masses (amu), and force constants (mDyne Å-1) of the 1529
cm−1 viologen spectral band of HS-2V14 in different fields (a.u.).
Field 0.02 0.01 0.005 0.002 0.00 -0.002 -0.005 -0.01 -0.02
Raman 3125.3 3232.1 3231.1 3212.5 3192.7 3167.2 3117.9 3006.1 2655.8
ω 1552.7 1553.2 1553.4 1553.4 1553.4 1553.4 1553.4 1553.3 1552.8
Mass 2.3145 2.3310 2.3349 2.3358 2.3358 2.3354 2.3338 2.3292 2.3126
Force 3.2878 3.3135 3.3196 3.3211 3.3211 3.3205 3.3181 3.3110 3.2852
Table S6. Raman scattering activities (Å4 amu-1), frequencies (ω, cm‒1), reduced masses (amu), and force constants (mDyne Å-1) of the 1529
cm−1 viologen spectral band of HS-10V6 in different fields (a.u.).

S13
Field 0.02 0.01 0.005 0.002 0.00 -0.002 -0.005 -0.01 -0.02
Raman 2859.3 3185.7 3249.2 3268.3 3273.8 3273.7 3262.6 3211.4 2988.3
ω 1553.0 1553.6 1553.7 1553.7 1553.7 1553.6 1553.6 1553.4 1552.7
Mass 2.3320 2.3497 2.3537 2.3546 2.3544 2.3537 2.3517 2.3456 2.3256
Force 3.3139 3.3414 3.3475 3.3487 3.3484 3.3473 3.3442 3.3348 3.3036
Table S7. Raman scattering activities (Å4 amu-1), frequencies (ω, cm‒1), reduced masses (amu), and force constants (mDyne Å-1) of the 1529
cm−1 viologen spectral band of HS-12V4 in different fields (a.u).
Field 0.01 0.005 0.002 0.00 -0.002 -0.005 -0.01 -0.02
Raman 3032.9 3101.0 3125.0 3133.5 3136.0 3128.8 3089.8 2903.9
ω 1553.6 1553.7 1553.7 1553.7 1553.6 1553.6 1553.4 1552.7
Mass 2.3505 2.3538 2.3542 2.3537 2.3528 2.3504 2.3441 2.3243
Force 3.3428 3.3477 3.3482 3.3474 3.3460 3.3423 3.3325 3.3014
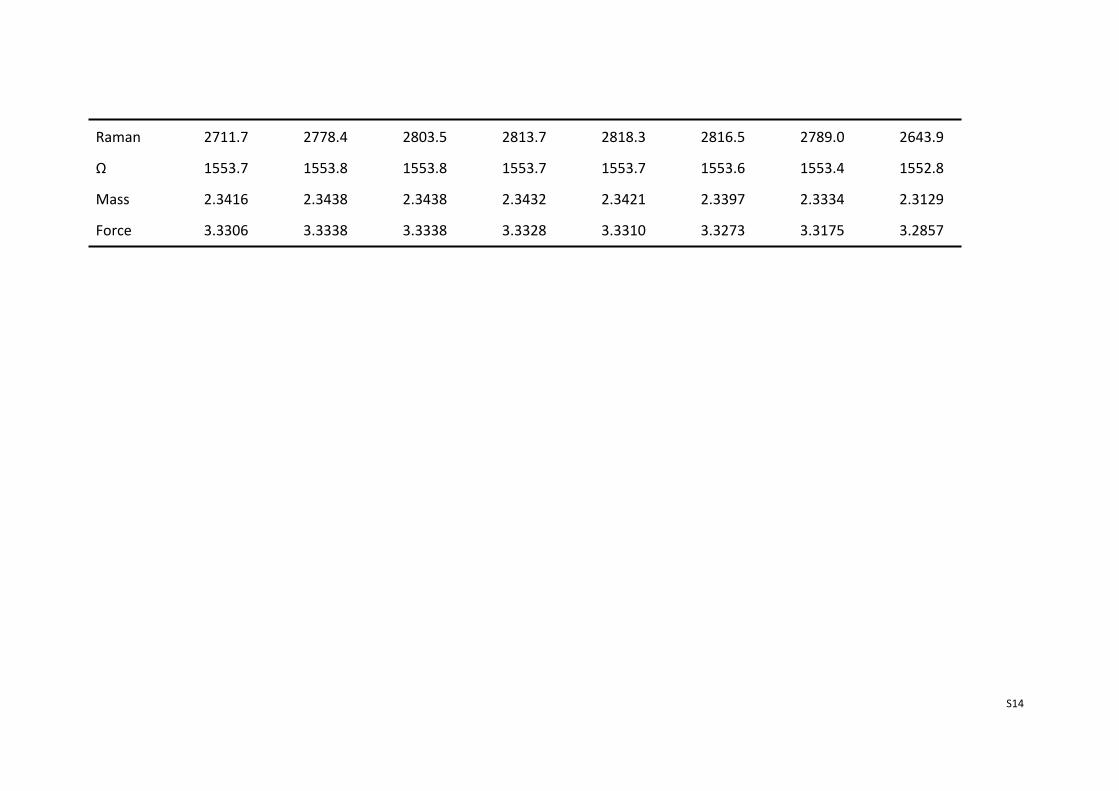
Table S8. Raman scattering activities (Å4 amu-1), frequencies (ω, cm‒1), reduced masses (amu), and force constants (mDyne Å-1) of the 1529
cm−1 viologen spectral band of HS-14V2 in different fields (a.u.).
Field 0.01 0.005 0.002 0.00 -0.002 -0.005 -0.01 -0.02
S14
Raman 2711.7 2778.4 2803.5 2813.7 2818.3 2816.5 2789.0 2643.9
Ω 1553.7 1553.8 1553.8 1553.7 1553.7 1553.6 1553.4 1552.8
Mass 2.3416 2.3438 2.3438 2.3432 2.3421 2.3397 2.3334 2.3129
Force 3.3306 3.3338 3.3338 3.3328 3.3310 3.3273 3.3175 3.2857
S15
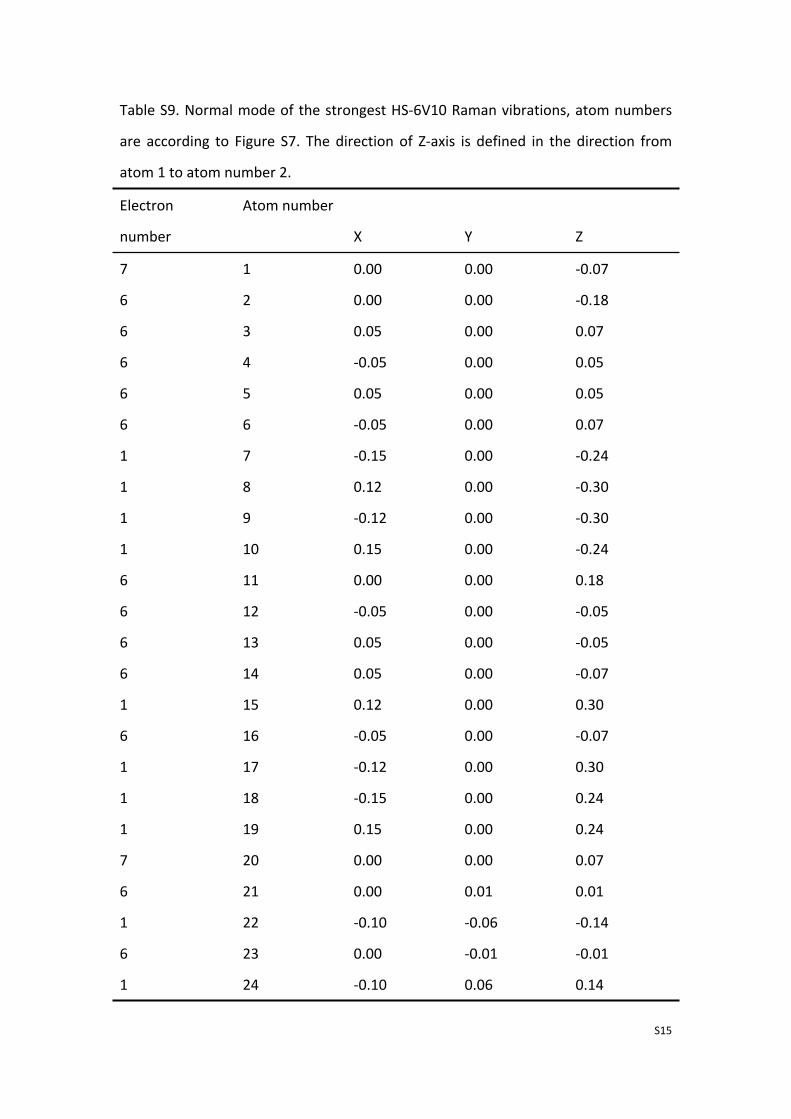
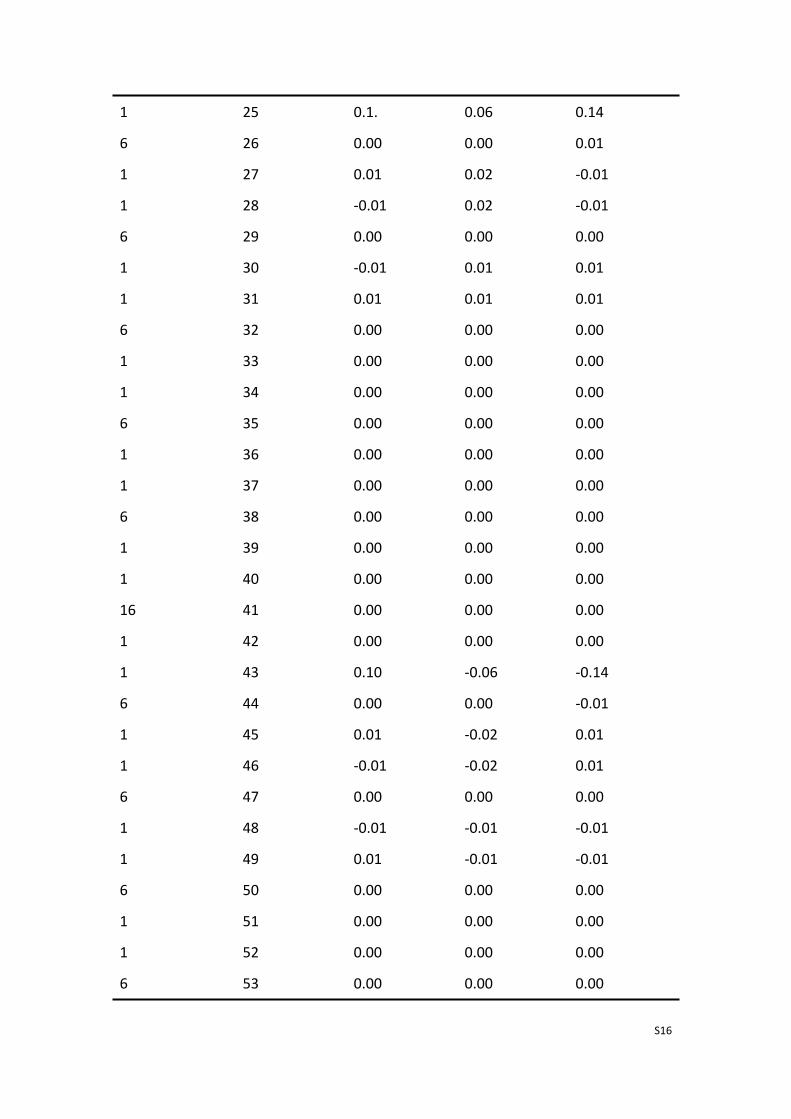
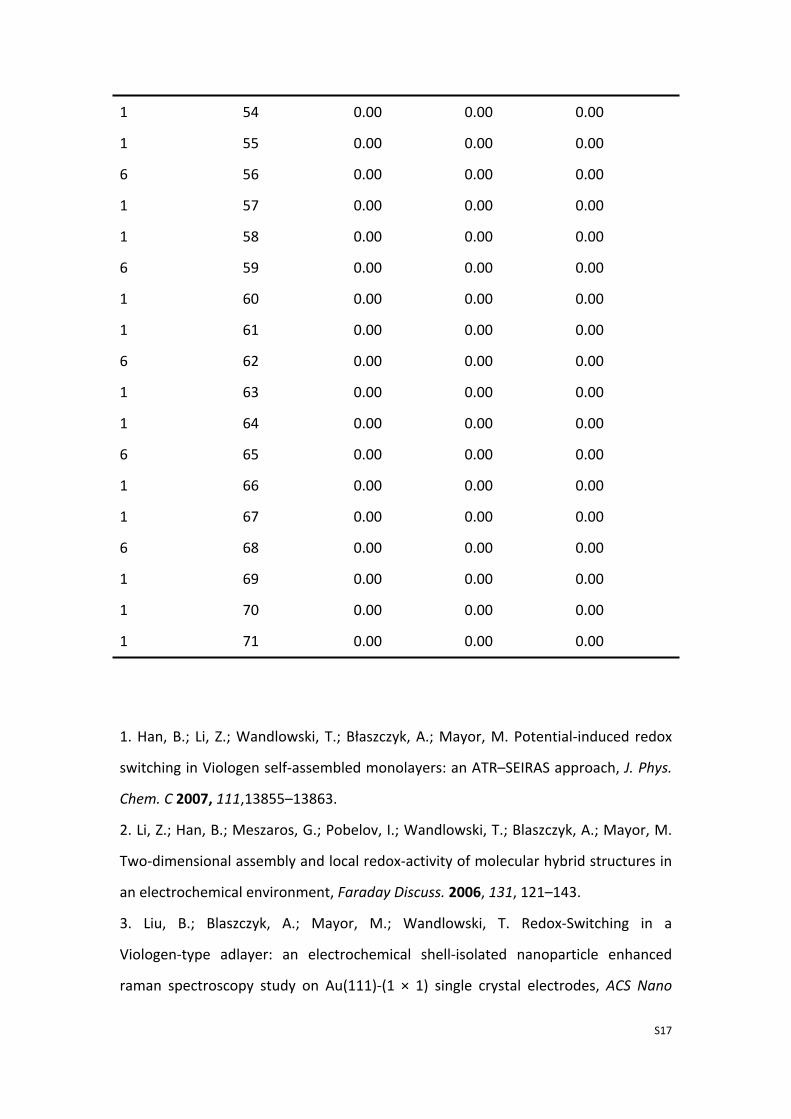
Table S9. Normal mode of the strongest HS-6V10 Raman vibrations, atom numbers
are according to Figure S7. The direction of Z-axis is defined in the direction from
atom 1 to atom number 2.
Electron
number
Atom number
X Y Z
7 1 0.00 0.00 -0.07
6 2 0.00 0.00 -0.18
6 3 0.05 0.00 0.07
6 4 -0.05 0.00 0.05
6 5 0.05 0.00 0.05
6 6 -0.05 0.00 0.07
1 7 -0.15 0.00 -0.24
1 8 0.12 0.00 -0.30
1 9 -0.12 0.00 -0.30
1 10 0.15 0.00 -0.24
6 11 0.00 0.00 0.18
6 12 -0.05 0.00 -0.05
6 13 0.05 0.00 -0.05
6 14 0.05 0.00 -0.07
1 15 0.12 0.00 0.30
6 16 -0.05 0.00 -0.07
1 17 -0.12 0.00 0.30
1 18 -0.15 0.00 0.24
1 19 0.15 0.00 0.24
7 20 0.00 0.00 0.07
6 21 0.00 0.01 0.01
1 22 -0.10 -0.06 -0.14
6 23 0.00 -0.01 -0.01
1 24 -0.10 0.06 0.14
S16
1 25 0.1. 0.06 0.14
6 26 0.00 0.00 0.01
1 27 0.01 0.02 -0.01
1 28 -0.01 0.02 -0.01
6 29 0.00 0.00 0.00
1 30 -0.01 0.01 0.01
1 31 0.01 0.01 0.01
6 32 0.00 0.00 0.00
1 33 0.00 0.00 0.00
1 34 0.00 0.00 0.00
6 35 0.00 0.00 0.00
1 36 0.00 0.00 0.00
1 37 0.00 0.00 0.00
6 38 0.00 0.00 0.00
1 39 0.00 0.00 0.00
1 40 0.00 0.00 0.00
16 41 0.00 0.00 0.00
1 42 0.00 0.00 0.00
1 43 0.10 -0.06 -0.14
6 44 0.00 0.00 -0.01
1 45 0.01 -0.02 0.01
1 46 -0.01 -0.02 0.01
6 47 0.00 0.00 0.00
1 48 -0.01 -0.01 -0.01
1 49 0.01 -0.01 -0.01
6 50 0.00 0.00 0.00
1 51 0.00 0.00 0.00
1 52 0.00 0.00 0.00
6 53 0.00 0.00 0.00
S17
1 54 0.00 0.00 0.00
1 55 0.00 0.00 0.00
6 56 0.00 0.00 0.00
1 57 0.00 0.00 0.00
1 58 0.00 0.00 0.00
6 59 0.00 0.00 0.00
1 60 0.00 0.00 0.00
1 61 0.00 0.00 0.00
6 62 0.00 0.00 0.00
1 63 0.00 0.00 0.00
1 64 0.00 0.00 0.00
6 65 0.00 0.00 0.00
1 66 0.00 0.00 0.00
1 67 0.00 0.00 0.00
6 68 0.00 0.00 0.00
1 69 0.00 0.00 0.00
1 70 0.00 0.00 0.00
1 71 0.00 0.00 0.00
1. Han, B.; Li, Z.; Wandlowski, T.; Błaszczyk, A.; Mayor, M. Potential-induced redox
switching in Viologen self-assembled monolayers: an ATR–SEIRAS approach, J. Phys.
Chem. C 2007, 111,13855–13863.
2. Li, Z.; Han, B.; Meszaros, G.; Pobelov, I.; Wandlowski, T.; Blaszczyk, A.; Mayor, M.
Two-dimensional assembly and local redox-activity of molecular hybrid structures in
an electrochemical environment, Faraday Discuss. 2006, 131, 121–143.
3. Liu, B.; Blaszczyk, A.; Mayor, M.; Wandlowski, T. Redox-Switching in a
Viologen-type adlayer: an electrochemical shell-isolated nanoparticle enhanced
raman spectroscopy study on Au(111)-(1 × 1) single crystal electrodes, ACS Nano

S18
2011, 5, 5662–5672.
4. Li, J. F.; Tian, X. D.; Li, S. B.; Anema, J. R.; Yang, Z. L.; Ding, Y.; Wu, Y. F.; Zeng, Y. M.;
Chen, Q. Z.; Ren, B.; Wang, Z. L.; Tian, Z. Q., Surface analysis using shell-isolated
nanoparticle-enhanced Raman spectroscopy. Nat. Protoc. 2012, 8, 52-65.
5. Frisch, M. J.; Trucks, G. W.; Schlegel, H. B.; Scuseria, G. E.; Robb, M. A.;
Cheeseman, J. R.; Scalmani, G.; Barone, V.; Petersson, G. A.; Nakatsuji, H.; Li, X.;
Caricato, M.; Marenich, A. V.; Bloino, J.; Janesko, B. G.; Gomperts, R.; Mennucci, B.;
Hratchian, H. P.; Ortiz, J. V.; Izmaylov, A. F.; Sonnenberg, J. L.; Williams; Ding, F.;
Lipparini, F.; Egidi, F.; Goings, J.; Peng, B.; Petrone, A.; Henderson, T.; Ranasinghe, D.;
Zakrzewski, V. G.; Gao, J.; Rega, N.; Zheng, G.; Liang, W.; Hada, M.; Ehara, M.; Toyota,
K.; Fukuda, R.; Hasegawa, J.; Ishida, M.; Nakajima, T.; Honda, Y.; Kitao, O.; Nakai, H.;
Vreven, T.; Throssell, K.; Montgomery Jr., J. A.; Peralta, J. E.; Ogliaro, F.; Bearpark, M.
J.; Heyd, J. J.; Brothers, E. N.; Kudin, K. N.; Staroverov, V. N.; Keith, T. A.; Kobayashi,
R.; Normand, J.; Raghavachari, K.; Rendell, A. P.; Burant, J. C.; Iyengar, S. S.; Tomasi,
J.; Cossi, M.; Millam, J. M.; Klene, M.; Adamo, C.; Cammi, R.; Ochterski, J. W.; Martin,
R. L.; Morokuma, K.; Farkas, O.; Foresman, J. B.; Fox, D. J. Gaussian 16 Rev. A.03,
Wallingford, CT, 2016.
6. Neugebauer, J.; Reiher, M.; Kind, C.; Hess, B. A. Quantum chemical calculation of
vibrational apectra of large molecules—raman and IR spectra for
buckminsterfullerene. J. Comput. Chem. 2002, 23, 895-910.
7. Wolfgang Haiss; Harm van Zalinge; Horst Höbenreich; Donald Bethell; David J.
Schiffrin; Simon J. Higgins; Nichols, R. J. Molecular wire formation from viologen
assemblies. Langmuir 2004, 20, 7694-7702.
8. Kresse, G.; Furthmüller, J. Efficiency of ab-initio total energy calculations for
metals and semiconductors using a plane-wave basis set. Comput. Mater. Sci. 1996,
6, 15-50.