resolution of corporate distress - documents & …€¦ · resolution of corporate evidence...
TRANSCRIPT

POLICY RESEARCH WORKING PAPER 2133
Resolution of Corporate Evidence from East Asiasuggests that a firm's
Distress ownership relationship with a
family or bank provides
Evidence from East Asia's insurance against the
likelihood of bankruptcy
Financial Crisis during bad times, possibly at
the expense of minority
Stijn Claessens shareholders. Bankruptcy is
Simeon D*ankov more likely in countries with
Leora Klapper strong creditor rights and a
good judicial system -
perhaps because creditors are
more likely to force a firm to
file for bankruptcy.
The World Bank
Financial Sector Practice DepartmentFinancial Economics UnitJune 1999
Pub
lic D
iscl
osur
e A
utho
rized
Pub
lic D
iscl
osur
e A
utho
rized
Pub
lic D
iscl
osur
e A
utho
rized
Pub
lic D
iscl
osur
e A
utho
rized

lPoI IY R SfEARI H WORKIN(I PAPER 21 33
Summary findings
hlic widespread financial crisis in East Asia ca tused large Using a sample of 4,569 publicly traded East Asianeconomic shocks, which varied by degree across the firms, they observc a total of 106 bankruptcies in 1997region. That crisis provides a uniqcle opportlnitv for and 1998.F They find tihat:investigating tihe factors that dLterminie hise use of * Tle likelihood of filing for bankruptcy is lower forbanikruLptcv processes in a nulliiber of cecoisoinies. firms with ownership links to banks and families,
C(laessens, Dijankov, and Klapper study the use of controlling for firm and country characteristics.bankriiptcr in liong Kong, Inidonesia, Japan, the * Filings are more likely in countries with betterReptiblic (i KoreLa, Mislaysia, the Philippines, Siligapore, judicial systems.Taiwani (China), and Thailand. 'IThese econiomiies differ in * Filings are more likely where there are both strongtheir institutionial frameA orks for- resolving finailcial creditor rights and a good judicial system.distress, partly hecause of thI differenJt or1igins of their lhese results alone do not allow Claessens, Djankov,judicial systens. Onle differlnce is tthe streingth of and Klapper to address whether increased use ofcreditor rights, Wx hich Claesscns, Djankov, and Klapper bankruptcv is an efficient resolution mechanism.docCLI1e1t. 'I lcN expect that differences in legal
enfor-cecmeint and Itidicial efficiency should affect ther esolutioni of finiancial distress.
This paper - a prodtuct of the Financial Economics Unit, Financial Sector Practice Department-- is part of a larger effortin the departrlment to stuidy corporate financing and governance inechanisms in emerging markets. Copies of the paper areavailable free fromn, the World Bank, 18 18 H Street NW, Washington, DC 20433. Please contact Rose Vo, room MC9-624,telephonie 202-473-3 722 fax 2 02-522-203 1, Internet address hvo ] [email protected]. Policy Research Working Papers arealso posted oii the Web at http://www.worldbanik.org/htmlidec/Publications/Workpapers/home.html. The authors may becontacted at cctsessens(a worldbank.org, sdjankov(iworldbank.org, or lklapperCq.worldbank.org. June 1999. (29 pages)
I ic I Ii; Res,arc. Ww'ki.g Paper Scries disserninates the findings of work in progress to encourage the exchange of ideas about'.i, /1 u-ic 'FISSUCS. An o'tu e thse is tge the findings out quickly, even if the presentations are less than fully polished. The
!ipps1 c,Or 1(1b noale6 ot tie authors and should be cited accordingly. The findinLgs, interpretations, and conclusions expressed in thisIt'- ! q7 -r . Iv i/use the awh,rs. Iheyv (o rot necessarily repo'sent the viet' of the World Bank, its Executive Directors, or the
Producd(l by the Policy Research Dissemination Center

Resolution of Corporate Distress:Evidence from East Asia's Financial Crisis
Stijn ClaessensSimeon DjankovLeora Klapper
Abstract
The recent financial crisis in East Asia, across countries with very different institutionalcharacteristics, allows the identification of factors that determine the use of bankruptcy asa means of resolving corporate distress. Using a sample of 4,569 publicly traded EastAsian firms, we observe a total of 106 bankruptcies in 1997 and 1998. We find that thelikelihood of filing is lower for firms with ownership links to banks and families,controlling for firm and country characteristics. In addition, filings are more likely incountries with better judicial systems. Finally, we find that the interaction betweenstrong creditor rights and a better judicial system increases the likelihood of bankruptcy.
JEL Classification Codes: G33, G34.
The authors are from the World Bank. We thank Magdi Amin, G.K. van der Mandele, and CharlesWoodruff for providing us with information on bankruptcy filings, and William Gamble, Patrick Honohan,Larry Lang, Rafael La Porta, Raghuram Rajan, Andrei Shleifer, Michelle White, and seminar participantsat the World Bank for comments. Corresponding author: EM Lklapper(a,)worldbank.org, tel. 202 473 8738.

1. Introduction
Both country and firm characteristics affect the way that financial institutions and
commercial creditors confront financial distress. Country differences include variations in
legal systems, accounting standards, and regulatory frameworks, while firms differ in
their capital and ownership structures. In this paper, we address an answered question in
the literature of the effect of firm and country characteristics on the likelihood that a firm
in financial distress uses formal bankruptcy procedures as a means of resolving corporate
distress.
The widespread financial crisis in East Asia caused large economic shocks,
varying by degree, across the region. This provides a unique opportunity to investigate
the factors determining the use of bankruptcy processes in a number of countries. The
East Asian countries that we study - Hong Kong, Indonesia, Japan, Korea, Malaysia,
Philippines, Singapore, Taiwan, and Thailand - differ in their institutional frameworks
for resolving financial distress, arising in part from the different origins of their judicial
systems. One particular difference is the strength of creditor rights, which we document
by updating the indices calculated by La Porta et al. (1997).1 The strength of a creditor to
collect payment in the case of default may influence the decision whether to settle a
default in or out of court. We expect, therefore, that differences in legal enforcement and
judicial efficiency should affect the resolution of financial distress.
Although banks play a critical role in financial intermediation in most East Asian
countries, the degree of ownership of corporations by financial institutions varies
considerably from country to country. For example, the percentage of firms with bank
2

ownership is large in Japan and the Philippines and relatively small in Taiwan. In
addition, there is regional variation in the concentration of ownership of corporations by
families, that may provide preferential supplier credit and purchasing. For example,
family ownership plays an important role in Hong Kong, Indonesia, and Thailand.
Corporate ownership is an important factor in the resolution of financial distress, since
bank- and family-related firms may have access to preferential sources of external credit.
The differences in corporate governance among countries and firms may affect the
relationship between firms and their creditors that influences the timing, severity, and
resolution of financial distress.
For a sample of 4,569 publicly traded East Asian firms, we observe a total of 106
bankruptcies during 1997 and 1998. We find that the likelihood of filing is negatively
associated with bank and family ownership, controlling for firm-specific financial
measures, such as leverage and (pseudo-) Tobin's Q. The importance of bank and family
connections suggests that informational advantages and non-market based resource
allocations encourage out-of-court renegotiations and delay the use of formal
reorganizations procedures.
We also show the importance of judicial efficiency: Filings are more likely in
countries with strong judicial systems and creditor rights. In addition, we find that the
interaction between strong creditor rights and a better judicial system increases the
likelihood of filing. This suggests that a creditor will only force a firm to file for
bankruptcy and incur the related legal costs if ex-ante loan features and ex-post judicial
efficacy indicate an adequate chance of recovery of losses.
l Within our sample of countries, the legal systems in Japan, Korea and Taiwan are of Germanic origin;Malaysia, Hong Kong, Singapore and Thailand are of Anglo-Saxon origin; Indonesia and the Philippines
3

The paper proceeds as follows: Section 2 provides a literature review on corporate
financial distress and its relationship with creditor protection under different legal
systems. Section 3 describes our data and summary statistics for the region. Section 4
presents our empirical results and a discussion of our findings. Section 5 concludes.
2. The Literature
In previous literature, we find comparisons between the bankruptcy systems in
developed countries. These studies discuss the effects of different regimes on the ex-ante
behavior of firms and on the ex-post efficiency of resolution. In particular, these papers
focus on the relative advantages of debtor- and creditor-friendly regimes. For example,
debtor-friendly regimes, such as the US bankruptcy law, allow current managers,
appointed by the firm's equity holders, to continue managing the firm during
reorganization negotiations. Creditor-friendly regimes, such as the UK bankruptcy law,
give creditors the power to replace existing managers.
White (1993) and Kaiser (1994) argue that in creditor-friendly regimes, the threat
of being fired gives managers strong ex-ante incentive to engage in less risky activities.
However, since a new manager may be unfamiliar with the company and unable to
ensure a smooth transition, the creditor suffers higher costs of resolution during distress.
They suggest that although a debtor-friendly regime may allow incompetent managers to
keep their jobs, the creditor has ex-post financial benefits. In addition, debtor-friendly
laws encourage managers to seek bankruptcy protection from their creditors, which may
allow the firm to survive and ultimately benefit claimants. Yet, it is not obvious which
are of French-origin.
4

regime is most cost-efficient and these studies do not establish how the likelihood of
bankruptcy filings varies across legal systems.
Related literature suggests that differences between countries concerning creditor
rights and judicial efficacy should affect the use of courts to resolve financial distress.
Harris and Raviv (1992) argue that bankruptcy law and enforceability are determinants of
the variation in debt contracts features. They show that judicial differences across
countries affect firm performance and corporate governance decisions, and affect the
likelihood of the bankruptcy system being used to deal with financial distress. Rajan and
Zingales (1995) find that contractability is enhanced by legal systems that protect creditor
rights and punish management and equity holders in the case of financial distress.
The economic costs of bankruptcy have been studied in more detail for
bankruptcy filings in the United States, a debtor-friendly system.2 Gilson (1989) finds
that after filing for bankruptcy, managers suffer large personal costs and that more than
half of the managers, 52%, are fired. Gilson and Vetsuypens (1994) find that managers
that survive after a bankruptcy filing receive significantly lower salaries and bonuses; on
aLverage, managers receive only 35% of their previous gross income.
It is not surprising, therefore, that managers of financially distressed firms in the
United States prefer private restructuring to public bankruptcy filings. Gilson, John, and
Lang (1990) study 169 financially distressed firms and find that only close to half of
these firms use Chapter 11 proceedings to restructure their distressed debt. They find that
firms that settle out-of-court have more intangible assets, a larger percentage of debt
owed to banks, and fewer lenders. Gilson (1997), however, finds that out-of-court
2For example, White (1989, 1993, 1994) compare the direct transaction costs of bankruptcy under differentregimes, a topic that we do not address in this paper.
5

restructuring is not necessarily beneficial to the shareholders; firms that resolve financial
distress out-of-court are more likely to remain highly-leveraged and more likely, with a
likelihood of 33%, to experience further financial distress.
Several papers have examined the effect of corporate ownership on the resolution
of financial distress. Japanese firm-level data have been used to examine the main-bank
system, which implies both an ownership and lending relationship between a bank and a
commercial firm. Hoshi et al. (1990b) find that a bank relationship improves a firm's
access to capital and promotes corporate investment in a sample of Japanese firms. In
addition, Hoshi, et al. (1990a) show that bank-affiliated firms can more easily renegotiate
their terms of credit to reduce the costs of financial distress. Consequently, bank-related
firms recover more quickly from financial distress than other firms, and without
necessarily using formal reorganization or bankruptcy procedures. This finding is
explained in Aoki (1990) and Prowse (1992), who describe the involvement of Japanese
banks in management decisions as a form of monitoring and resolution of principal-agent
and information problems between the lender and borrower.
Weinstein and Yafeh (1998), however, find that although ties to a bank improve
access to capital, they do so at a higher cost; i.e., although bank-controlled firms have
access to more capital, the benefits are offset by the rents extracted by the banks.
Johnson et al. (1998) estimate excess stock market returns for a cross-section of emerging
markets, including the East Asian countries in our sample. They find that weaknesses in
corporate governance - defined as the existence of strong links between banks and
corporations and non-transparent cross-holdings between corporations - cause larger
discounts in asset prices.
6

3. Data
We use financial and ownership structure variables at the firm level in nine
countries at the end of 1996. Our primary data source is the WorldScope database, which
contains information on 49 countries. We expanded our sample of firms using the
Financial Times Extel database, which contains information on 49 countries. In order to
test the significance of corporate ownership, we augmented these data with ownership
information from the Asian Company Handbook 1999 (1998), the Japan Company
Handbook 1999 (1998), Securities Exchange of Thailand Company Handbook, and the
Singapore Investment Guide.
The combined sample contains income statement, balance sheet, and corporate
ownership information for 5,928 firms. We excluded firms in the financial sector
because the accounting standards for income and profits for these firms are significantly
different from those in the other sectors. In addition, bankruptcy decisions for banks are
driven by other factors, such as concerns about the systemic consequences of closures.
We also excluded firms for which data required for our empirical tests was missing.
After applying these selection criteria, 4,569 firms were available for our empirical
analysis.
To identify firms that legally filed for bankruptcy protection, we collected
information from the respective stock exchanges. Since the legal definition of
bankruptcy is not consistent across the region, we used as a minimum standard that firms
filed for legal creditor protection.3 Table 1 provides descriptive statistics of our sample.
3The majority of firms in our sample filed for bankruptcy in the second half of 1998. In Indonesia, thePhilippines, and Thailand, the Bankruptcy Code was amended in August, January, and April, respectively.These bankruptcy reforms increased the number of bankruptcy filings by allowing for Chapter 11-type
7

Almost 50% of our observations are firms listed on the Japanese exchange, reflecting the
absolute size of their economy relative to the other countries. Excluding Japan, however,
we have about the same number of firms listed for each country, about 300 firms on
average, except for the Philippines (68 firms). As shown in Table 1, in absolute terms
and as a percentage of total firms, the largest number of bankruptcies occurred in
Thailand, Korea, and Malaysia; the smallest number of bankruptcies occurred in the
Philippines, Singapore and Taiwan. As reported in our summary statistics, middle-
income countries in the region (Indonesia, Korea, Malaysia, Philippines, and Thailand),
which typify less developed financial markets and business law, account for 80% of
reported bankruptcies.
We use the methodology developed by La Porta et al. (1999) and extended by
Claessens et al. (1999) to study the ultimate ownership structure of East Asian
corporations. To distinguish between cash-flow and control rights, we identify various
forms of intermediate ownership structures, such as cross-holdings, pyramiding, and
deviations from one-share-one-vote rules. For example, suppose that a family owns 11%
of the stock of Firm A, which in turn owns 21% of the stock of Firm B. In this case, we
contend that the family holds 11% of the control rights of Firm B, which is calculated as
the weakest link in the chain of voting rights. In contrast, however, we contend that the
family holds only 2% of the cash flow rights of Firm B, which is calculated as the
product of the two ownership stakes along the chain.
reorganization and establishing independent bankruptcy courts. In Indonesia, for example, there were only11 bankruptcy filings between 1978 and August 1998, and 24 filings in the last three months of 1998.Similarly, in the Philippines, there were only 35 bankruptcy filings between 1982 and 1996, and 52bankruptcy filings in 1997 and 1998. In contrast, the large increase in the number of bankruptcy filings in1998 in Hong Kong, Japan, Korea, Singapore, and Taiwan, was caused by the increase in overall financialdistress and not because of improvements to the bankruptcy system.
8

We further distinguish between firms with ultimate owners versus firms that are
widely held. Consistent with the methodology used by La Porta et al. (1999), we define
ultimate ownership as ownership of 20% or more of outstanding shares. Ultimate owners
are further divided into four categories: families, banks, commercial firms, and the state.4
Furthermore, we identify the "genealogy" of each firm, such as the ownership structure
of each firm's ultimate owner. Consequently, we identify as bank-related any firm that is
owned by a bank or belongs to a family group that also has ultimate ownership of a bank.
Our results are reported in the last two columns of Table 1. We find that the
principal shareholders in the majority of East Asian firms are other commercial firms,
not-for-profit foundations, and financial institutions. Corporate ownership structures
differ, however, greatly across East Asian countries. Almost 60% of the Japanese firms
in our sample are bank-related, while only 9% of Taiwanese firms, and 14% of Korean
and Singaporean firms have a bank relationship. Ownership by families is dominant in
Hong Kong, Indonesia, and Thailand, where 69%, 72%, and 64% of firms are family-
controlled, respectively. In comparison, only 14% of Japanese firms are controlled by a
family.
Table 2 shows the median values of financial variables and ratios for firms in our
nine countries.5 We find that prior to the crisis, firms in high-income countries were on
average about three times larger than firms in middle-income countries, as measured by
total assets and sales.6 Japanese firms are the largest in our sample, with the median firm
having annual sales and assets of half a billion dollars, US$488 and US$457 million
4 We do not distinguish among individual family members and use the family group as a unit of analysis.s "High-Income" is the weighted average of Hong Kong, Japan, Singapore and Taiwan."Middle-Income" is the weighted average of Indonesia, Korea, Malaysia, Philippines, and Thailand.6 Levels are converted to end-of-year 1996 US-dollars.
9

respectively. Thailand has the smallest firms on average, with US$84 and US$51 million
in sales and assets, respectively.
The debt-equity mix and the maturity structure of debt also vary significantly by
country. In Korea, Japan, and Thailand, debt was on average 70% of corporations'
capital structures in 1996, while in Taiwan it was only 42%]. Short-term debt was 68%
of total debt in Malaysia, but only 45% in the Philippines. These differences affect the
relationship between firms and their creditors, and influence the severity and resolution
of financial distress. Furthermore, firms in middle-income countries have lower sales-to-
debt ratios and higher leverage rates, suggesting that firms in these countries were both
smaller and riskier. For example, in 1996 the median firm in Thailand had a sales-to-debt
ratio of only 1.52 and a leverage ratio of 0.42. In comparison, the median firm in
Singapore, a high-income country, had a sales-to-debt ratio of 3.05 and a leverage ratio of
0.20.
Firms in middle-income countries, however, generally-had higher operating
margin to sales ratios and higher (pseudo-) Tobin's Q, suggesting better growth
opportunities in these countries. Indeed, higher growth rates may have led to the
relatively higher use of debt in the middle-income countries. The last column in Table 2
reports the growth in 1998 GDP. Middle-income countries were hit the hardest, with
Indonesia and Thailand experiencing a 15% and 8% decline, respectively. Taiwan was
the only country that registered high growth, 4.9 percent, in 1998.
Table 3 provides comparative information on bankruptcy law, creditor rights, and
the efficacy of the judicial system for the nine East Asian countries in our sample. The
7For Hong Kong, Indonesia, Malaysia, the Philippines, and Singapore debt was 61%, 65%, 52%, 56%, and51% of capital, respectively (Claessens et el., 1998).
10

information is compiled from detailed survey reports prepared for the Asian
Development Bank. The surveys use similar methodology and were conducted by teams
of legal experts in each country and reviewed by a regional team to ensure the
comparability of results (Asian Development Bank, 1999).
Creditor rights are strongest in countries with Anglo-Saxon and Germnanic codes
and weakest in countries with French codes. For example, creditors in the Philippines,
where the code is of French origin, are barred by the "automatic stay" on assets from
taking any collection action against the debtor's assets. In addition, a creditor's security
interest does not guarantee priority status. Furthermore, the statutory bankruptcy scheme
prohibits creditors from ousting management during reorganization. In contrast, creditors
in Malaysia, where the code is of Anglo-Saxon origin, have strong creditor rights.
We use the information presented in Table 3 to construct quantitative indices of
creditor protection and the efficacy of the judicial system. Our results are shown in Table
4, where a higher index indicates better creditor rights and judicial efficiency. We find
that Indonesia and the Philippines have the weakest creditor protection, while Hong
Kong, Singapore, and Taiwan have the strongest creditor protection. In addition, we find
that Indonesia, the Philippines, and Taiwan have the weakest judicial system, while
Korea and Singapore have the strongest judicial systems.
To construct our index of creditor rights, we use the methodology in La Porta et
al. (1997). This index is an average of four indicators of creditor strengths reported in
columns 3 to 6 of Table 3. First, the timeliness of rendering a judgement whether to
liquidate or restructure once a bankruptcy petition has been filed. For example, the
bankruptcy codes in Indonesia, the Philippines, and Thailand do not have a specified
11

timetable for rendering a judgement.8 The remaining six countries impose a timetable,
such as 60 working days in Hong Kong and Japan and 180 working days in Malaysia.
Second, whether the incumbent management remains in control of the company during
reorganization or bankruptcy. This is the case only in Indonesia and the Philippines.
Third, whether the creditor is barred by the "automatic stay" from taking collection action
against the debtor's assets during the bankruptcy proceedings. This is the case only in
Indonesia, Japan, and the Philippines. Fourth, whether secured creditors have the first
priority of claims to the debtor's assets. This is the case in Hong Kong, Japan, Korea,
Malaysia, Singapore, and Taiwan.
In addition, we use columns 7 and 8 of Table 3 to construct an index of the efficacy
of the judicial system, shown in Table 4, which report the expense, difficulty, efficiency,
and speed of liquidating or restructuring an insolvent corporate borrower. For example,
Singapore has the highest ranking, 7, which is an average of the liquidation and
restructuring processes, which are both not expensive, easy, efficient, and quick. We use
the two indices of creditor rights and judicial efficiency to test the effect of the legal
environment on the likelihood of bankruptcy as a means of resolving financial distress.
4. Empirical Results
Table 5 provides descriptive statistics for our independent variables.9 Panel A
shows summary statistics for all firms in our sample. Panel B shows summary statistics
for firms that filed for bankruptcy and Panel C shows summary statistics for firms that
did not file. Previous literature, such as Barclay and Smith (1995), found that age and
8 Indonesia, we refer to the law before the bankruptcy reform in August 1998.9 Our choice of explanatory variables is consistent with international adaptations of the Altman Z-score,which estimates a model to predict corporate bankruptcy. See Altman (1984) for a survey.
12

size significantly affect a firm's ability to obtain external financing as the probability of a
firm's failure decreases with age and increases with size. Our summary statistics for the
three samples finds, for example, that total sales for firms that did not file versus firms
that filed is $19.909 million and $1.668 million, respectively. The age of the firm,
however, matters less: Firms that survived bankruptcy are listed, on average, only one
year longer than firms that filed for bankruptcy. This is not surprising, since the financial
markets in East Asia are relatively new, and, therefore, all listed firms listed are relatively
young.
Liquidity ratios are used to measure the exposure of firms to external shocks. For
example, the ratio of sales-to-debt (SALDEBT) provides an indication of the firm's
ability to pay its liabilities with generated income. This measure should reflect the
sensitivity of the firmn's solvency to currency and interest shocks. Indeed, we find that
firms that filed for bankruptcy had lower sales-to-debt ratios so that even small decreases
in sales may have prevented them from making their debt payments. This suggests that
firms with higher levels of external debt are more sensitive to shocks and are more likely
to require judicial creditor protection.
To measure firms' efficiency prior to the crisis, we look the operating margin,
defined as sales minus cost of good sold as a ratio of sales (OISAL). We find that
median operating margins are higher for firms that did not file relative to firms that did
file. This is consistent with our expectations that firms that filed for bankruptcy were ex-
ante more inefficient and financially distressed than firms that survived.
Previous literature, such as Opler et al. (1997), found that a firm's corporate
financing decisions depend on various measures of the borrower's future growth
13

opportunities. We use a (pseudo-) Tobin's Q (TOBINQ), which is a measure of the
market's assessment of a firm's investment opportunities, to determine the market's
perception of future growth.'0 We find that firms that filed for bankruptcy had lower
(pseudo-) Tobin's Q, which may have effected their inability to access credit during
financial distress and increased their likelihood of entering bankruptcy.
We also include two dummies to account for differences in corporate ownership.
FAMILY is equal to 1 (0 otherwise) if the firm is a member of a family of firms. BANK
is equal to 1 (0 otherwise) if the firm is directly owned by a bank or belong to a family
that also owns a bank." Only 10% of the bankrupt firms are owned by banks or owned
by a group that also owns a bank, compared to 40% of the firms which do not file. Bank-
related firms thus appear significantly less likely to file for bankruptcy.
In addition to firm-specific variables, we include country-specific indicators.
These measures allow us to test the effect of variations in institutional features,
macroeconomic performance, and judicial efficacy on the likelihood of filing for
bankruptcy. We include country dummies to identify differences in institutional
characteristics. We use the growth of GNP in 1998 as an ex-post measure of economic
activity and degree of general financial distress in each country following the crisis.
Furthermore, we use our index of creditor rights to study the influence of legal protection
on the decision to file. Alternatively, we use dummies to identify the legal-origin in each
country, as in La Porta et al. (1998). Finally, we use the interaction term between
10 Tobin's Q is approximated by the book value of debt plus the market value of equity divided by totalassets.11 This is an improvement on previous literature that examined bank-related firms in Japan that only tookaccount of direct ownership.
14

creditor rights and judicial efficiency to test if the ability of the judicial system to enforce
creditor rights affects the decision to use the legal system to resolve financial distress.
Tables 6 and 7 show the results of the Logit regressions. Table 6 shows that firms
that filed for bankruptcy were more exposed to short-term liquidity constraints and had
lower expected market growth. This suggests that firms that filed for bankruptcy were
ex-ante riskier than firms that survived.'2
We also find that firm ownership structures, in particular links to banks and
ownership by families, matter. Specifically, we find that bank-affiliated firms and firms
with a family-relationship are less likely to file for bankruptcy. The implied elasticities
of the coefficients in Table 6, column 1, suggest that family-controlled firms are 30% less
likely to file for bankruptcy than non-family-related firms, correcting for their capital
structure and country of origin. In addition, bank-related firms are 10% less likely to file
for bankruptcy than firms without ownership ties to a bank. The importance of bank and
family connections suggests that filings are not based solely on market-principles, since a
priori there is no economic reason to expect that certain types of ownership are more
likely to avoid bankruptcy. The significance of corporate ownership introduces evidence
that ownership ties to a creditor increases the likelihood of renegotiations and out-of-
court settlements and decreases the likelihood of bankruptcy.
In the first regression shown in Table 6, the country dummies for Thailand and
Korea are significant. This does not explain, however, whether this is due to variation in
market features or macroeconomic conditions. Therefore, the second regression in Table
6 tests the effect of the real growth rate of GNP in 1998. This result shows that slower
12 In addition, we include dummies identifying 2 digit SIC codes, which are not significant and are notreported.
15

growth rates of GNP significantly increase the number of bankruptcies. Since Japanese
firns comprise almost 50% of the observations in our sample, we include the third
column, which excludes Japanese firms from the sample, to verify that the results are
robust to the exclusion of Japanese firms.
However, negative macroeconomic shocks do not fully explain the variation in
bankruptcies, since the Asian crisis affected the entire region. We therefore extend our
tests to include variables to capture differences in creditor rights and judicial efficacy.
Table 7 shows that we continue to find that financial strength, growth of GNP, and family
and bank relationships are negatively related to the likelihood of filings. In addition, the
first regression in Table 7 shows that legal origins matter: firms in German-origin
systems, which are have stronger rights and are more creditor-friendly, are more likely to
file for bankruptcy, while firms in countries with French-origin systems, which are more
debtor-friendly, are less likely to file for bankruptcy. This result supports the results
found in previous literature that German- (and English-) origin systems permit creditors
to force delinquent debtors into bankruptcy.
The second regression in Table 7 reports a positive relationship between our index
of the efficiency of the judicial system and the likelihood of filing for bankruptcy. The
implied elasticity of the coefficient of judicial efficiency suggests that the probability of
filing for bankruptcy increases by 11% for every one-point increase in judicial efficiency.
In other words, if the judicial system in the Philippines were to achieve the same level of
efficiency as in Singapore, bankruptcy filings would increase by 55%. Similarly, if the
judicial system in Indonesia were to achieve the level of efficiency in Hong Kong,
bankruptcy filings would increase by more than 20%. The third regression in Table 7
16

shows a positive relationship between an index of creditor rights and an index of judicial
efficacy. These results imply that effective contractability strengthened with a credible
threat of bankruptcy enforcement increases the likelihood of filings for in court
bankruptcy. We suggest that creditors are more likely to force a firm to file for
bankruptcy and incur the related legal costs if ex-ante loan features and ex-post judicial
efficacy indicate a recovery of losses.
The differences between Table 6 and Table 7 suggest that it is not only country-
specific institutional differences that explain patterns in bankruptcy filings, but also
variations in legal origin, efficiency of the judicial system, and creditor rights. Judicial
reform can increase the degree to which the bankruptcy system is used to resolve
financial distress. Whether increased use of bankruptcy is an ex-ante as well as ex-post
efficient mechanism cannot, however, be answered from these results alone.
6. Conclusion
There has been much debate among policy-makers and academics about the
benefits and dangers of bank and family ownership of commercial firms.13 Our evidence
for East Asia suggests that family- and bank-relationships provide insurance against
likelihood of bankruptcy during bad times, possibly at the expense of minority
shareholders. In addition to firm-specific financial risk, we find that the combination of
better contractability and judicial efficacy increase the likelihood of bankruptcy filing.
This suggests that creditors are more likely to force a firm to file for bankruptcy, with its
13 In his February 11th, 1999 speech in front of the House Banking Committee Federal Reserve ChairmanAlan Greenspan indicated that "the Asian crisis last year highlighted some of the risks that can arise ifrelationships between banks and commercial fimns are too close." For a discussion on the costs and benefitsof universal banking, see Saunders and Walter, Eds. (1996).
17

related legal costs, if ex-ante loan features and ex-post judicial efficiency indicate a likely
recovery of losses.
Whether the increased use of bankruptcy is an efficient resolution mechanism
cannot be answered from these results alone. Rather, we would need to investigate the
ex-ante performance of corporations and measure the dead-weight losses associated with
the resolution of financial distress through in-court bankruptcy. This direction of
research, however, is not feasible until information becomes available on the resolution
of the bankruptcies of financially distressed firms. 14
14 The East Asian crisis is too recent to systematically analyze the resolution of bankruptcy proceedings.We can, however, broadly categorize the resolution outcomes for four of the sample countries. Of allprivately-held or publicly-traded firms which filed for bankruptcy during 1997 or 1998, the cases resultedin the following decisions, where the numbers for Taiwan include small-size fimns:
Country Liquidated Reorganized Dismissed UnresolvedIndonesia 2 3 20 27Philippines 4 4 7 9Taiwan 317 24 38 33Thailand 7 9 14 48
18

References
Altman, Edward, 1984, "The Success of Business Failure Prediction Models: AnInternational Survey," Journal of Banking and Finance, 8, 2: 171-198.
Aoki, Masahiko, 1990, Toward an economic model of the Japanese firm, Journal ofEconomic Literature, 28: 1-27.
Asian Development Bank, 1999, Insolvency Law Reform, Technical Assistance Project5795-REG, mimeo.
Barclay, M. and C. Smith, 1995, The Maturity Structure of Corporate Debt, Journal ofFinance, June, 609-631.
Claessens, Stijn, Simeon Djankov, and Larry Lang, 1998, Corporate Growth, Financing,and Risks in the Decade before East Asia's Financial Crisis, World BankResearch Paper 2017, World Bank, Washington DC.
Claessens, Stijn, Simeon Djankov, and Larry Lang, 1999, Who controls East Asiancorporations?, World Bank Research Paper 2054, World Bank, Washington DC.
Corsetti, Giancarlo, Paolo Pesenti, and Nouriel Roubini, 1998, What caused the Asiancurrency and financial crisis?, New York University, mimeo.
Furman, Jason and Joseph Stiglitz, 1998, Economic crisis: Evidence and insights fromEast Asia, World Bank, mimeo.
Gilson, Stuart, 1989, Management Turnover and Financial Distress, Journal of FinancialEconomics, 25, 2: 241-262.
Gilson, Stuart, Kose John, and Larry Lang, 1990, Troubled Debt Restructurings: AnEmpirical Study of Private Reorganization of Firms in Defaults, Journal ofFinancial Economics, 27, 2: 315-353.
Gilson, Stuart, and Michael Vetsuypens, 1994, CEO Compensation in FinanciallyDistressed Firms: An Empirical Analysis, Journal of Finance, 48, 2: 425-458.
Gilson, Stuart, 1997, Transaction Cost and Capital Structure Choice: Evidence fromFinancially Distressed Firns, Journal of Finance, 52, 1: 161-196.
Hauswald, Robert, 1995, Financial Contracting, Reorganization, and Mixed Finance: ATheory of Universal Banking, Stanford University, Ph.D. Dissertation.
Hoshi, Takeo, Anil Kashyap, and David Scharfstein, 1990a, The role of banks inreducing the costs of financial distress in Japan, Journal of Financial Economics,27: 67-88.

Hoshi, Takeo, Anil Kashyap, and David Scharfstein, 1990b, Bank monitoring andinvestment: Evidence from the changing structure of Japanese corporate bankingrelationship, Asymmetric, information, corporate finance, and investment, InGlenn Hubbard, ed., University of Chicago Press, Chicago, IL.
Hoshi, Takeo, Anil Kashyap, and David Scharfstein, 1991, Corporate structure, liquidity,and investment: Evidence from Japanese industrial groups, Quarterly Journal ofEconomics, 106: 33-60.
Johnson, Simon, Peter Boone, Alasdair Breach, and Eric Friedman, 1998, Corporategovernance in the Asian financial crisis, 1997-1998, mimeo.
Kaiser, Kevin, 1994, Corporate Restructuring and Financial Distress: An InternationalView of Bankruptcy Laws and Implications for Corporations Facing FinancialDistress, INSEAD, mimeo.
Kaplan, Steven, and Bernadette Minton, 1994, Outside intervention and in Japanesecompanies: Its determinants and its implications for managers, Journal ofFinancial Economics, 36: 225-228.
Krugman, Paul, 1999, Balance Sheets, The Transfer Problem, and Financial Crises,Massachusetts Institute of Technology, mimeo.
La Porta, Rafael, Florencio Lopez-de-Silanes, Andrei Shleifer, and Robert W. Vishny,1997, "Legal Determinants of External Finance," Journal of Finance 52: 1131-1150.
La Porta, Rafael, Florencio Lopez-de-Silanes, and Andrei Shleifer, 1999, "OwnershipStructures around the World," Journal of Finance, forthcoming.
Opler, Tim, and Sheridan Titman, 1994, Financial distress and corporate performance,Journal of Finance, 26: 1015-1040.
Radelet, Steven, and Jefferey Sachs, 1998, The Onset of the East Asian Financial Crisis,Working Paper 6680, National Bureau of Economic Research, Cambridge, MA.
Rajan, Raghuram and Luigi Zingales, 1995, What Do We Know About CapitalStructure? Some Evidence from International Data, Journal of Finance, 50: 1421-1460.
Rajan, Raghuram and Luigi Zingales, 1998, Which capitalism? Lessons from the EastAsian crisis, Journal of Applied Corporate Finance.
Saunders, Anthony and Ingo Walter, eds., 1996, Financial System Design: UniversalBanking Considered, Burr Ridge, IL: Irwin Professional Publishing.
20

Weinstein, David, and Yishay Yafeh, 1998, Costs of a bank-centered financial system,Journal of Finance, 53: 635-671.
White, Michelle, 1989, The Corporate Bankruptcy Decision, Journal of EconomicPerspectives, 3: 129-151.
White, Michelle, 1993, The Costs of Corporate Bankruptcy: A U.S. - EuropeanComparison, Research Forum on International Econormics, Discussion Paper 346,University of Michigan, Ann Arbor, MI.
WNhite, Michelle, 1994, Corporate Bankruptcy as a Filtering Device: Chapter IIReorganizations and Out-of-Court Debt Restructurings, Journal of Law,Economics, and Organization, 10: 268-295.
World Bank, 1993, The East Asian Miracle, Oxford University Press, London.
21

Table 1: Summary Statistics on Bankruptcy Filings
Middle Income is the average of Indonesia, Korea, Malaysia, Philippines, and Thailand.High Income is the average of Hong Kong, Japan, Singapore, and Taiwan.
Country Number of % Total Number of % Total % Linked % OwnedObservations Observations Bankruptcies Bankruptcies to Banks by Families
Hong Kong 379 8.30% 7 7% 18% 69%
Indonesia 203 4.44% 4 4% 20% 72%
Japan 2243 49.09% 12 1% 59% 14%
Korea 278 6.08% 27 25% 14% 53%
Malaysia 615 13.46% 21 20% 23% 54%
Philippines 68 1.49% 1 1% 37% 43%
Singapore 222 4.86% 1 1% 14% 43%
Taiwan 203 4.44% 1 1% 9% 43%
Thailand 358 7.84% 32 30% 26% 64%
Middle Income 1,522 33% 85 80% 22% 58%
High Income 3,047 67% 21 20% 47% 25%
East Asia Nine 4,569 106

Table 2: Summary Statistics of Financial Variables(Medians)
SALES and ASSETS are measured in US$1,000, using the average exchange rate for 1996.SALDEBT is the ratio of total sales to total debt. LEV is the ratio of total debt to total assets.OISAL is the ratio of operating income (sales less cost of goods sold) and total sales. TOBINQis the ratio of the sum of the book value of debt and the market value of equity to totalassets. GDPG98 is the growth rate of GDP in 1998. Middle Income is the weighted average ofIndonesia, Korea, Malaysia, Philippines, and Thailand. High Income is the weighted average ofHong Kong, Japan, Singapore, and Taiwan.
Country Sales Assets SALDEBT LEV OISAL TOBINQ GDPG98
Hong Kong 237,914.16 134,814.35 2.28 0.21 19.2 1.08 -5.00%
Indonesia 100,361.47 62,088.03 2.17 0.34 34.5 1.09 -15.30%
Japan 488,076.41 457,648.12 3.48 0.27 25.5 1.05 -2.80%
Korea 504,607.88 405,760.37 1.98 0.42 23.2 0.58 -7.00%
Malaysia 63,853.17 44,563.89 2.61 0.22 20.5 1.92 -7.50%
Philippines 149,003.49 71,737.39 2.26 0.19 30.4 1.51 0.20%
Singapore 174,382.75 92,005.63 3.05 0.20 18.7 1.49 0.70%
Taiwan 292,436.36 184,581.82 2.81 0.25 25.4 1.69 4.90%
Thailand 83,980.23 50,760.47 1.52 0.42 28.4 1.05 -8.00%
Middle Income 132,007.88 97,569.53 1.52 0.63 17.30 0.97 -4.79%
HighIncome 421,070.73 372,659.94 2.16 0.32 25.7 1.34 -2.31%
23

Table 3: Main Features of the Bankruptcy Codes in East Asia
(1) (2) (3) (4) (5) (6) (7) (8)Country Code Dates Back to Timetable To Render a Management Stay in Automatic Stay Priority of Secured Process of Process of
Judgement Bankruptcy Creditors Liquidation Restructuring
Hong Kong The 1929 U.K. 60 working days after a No No Paid first Very Expensive, Expensive, Easy,bankruptcy legislation. petition is registered. Difficult, Efficient, QuickThe law was amended in Efficient, Slow1985 based on therevisions in the U.K.law. Another amendmentin 1996 allowed out-of-court settlements.
Indonesia Dutch colonial No timetable under old Yes, old code; Yes, old code; Costs of proceedings Not Expensive, Expensive,ordinances promulgated code; No, safer August No after Aug are paid first, Difficult, Difficult,in 1906. Amended in 1998. 1998 followed by claims Inefficient, Slow Inefficient, VeryAugust 1998 to establish 30 working days from on wages and secured Slowa special commercial the creditor's petition creditors.court. after August 1998.
Japan 1952 and is loosely 60 working days No Yes Paid first Expensive, Easy, Expensive,based on Chapter 11 in Efficient, Quick Difficult,the U.S. Bankruptcy Efficient, SlowLaw.
Korea 1984 and is based on the 120 working days No No Paid first Not Expensive, Expensive,1978 U.S. Bankruptcy Easy, Efficient, Difficult,Code. It also has Quick Efficient, Quickprovisions for mediationfor settling debts withoutinitiating the fullbankruptcy process.
Malaysia The 1985 British 180 working days No No Paid first Expensive, Easy, Expensive,bankruptcy law. Efficient, Slow Difficult,
Efficient, Slow

Table 3: Main Features of the Bankruptcy Codes in East Asia(continued)
(1) (2) (3) (4) (5) (6) (7) (8)
Country Code Dates Back to Timetable To Render a Management Stay in Automatic Stay Priority of Secured Process of Process ofJudgement Bankruptcy Creditors Liquidation Restructuring
Philippines 1909, with the No timetable in place. Yes Yes Taxes are paid first, Not Expensive, Expensive, Very
responsibility taken by followed by wages, Very Difficult, Difficult,the courts. Amended in cost of proceedings, Inefficient, Very Inefficient, Slow1976 to permit debtors to and secured creditors. Slowpetition the SEC forprotection.
Singapore 1965 and based on the 90 working days No No Paid first Not Expensive, Not Expensive,Australian law of 1961. Easy, Efficient, Easy, Efficient,Amended in 1987 to Quick Quickinclude a formal courtsupervised rescuescheme. Furtheramendments in 1995.
Taiwan The law drafted by the 90 working days No No Paid first Not Expensive, Expensive,Kuomintang government Difficult, Difficult,in 1935, and amended in Inefficient, Slow Inefficient, Slow
1989 and 1993. As inKorea, is also has amediation option for out-of-court settlement
Thailand Bankruptcy Act is part ofNo timetable in place. No No Cost of proceedings Not Expensive, Not Expensive,
the Commercial Code, are paid first, Easy, Efficient, Difficult,developed in 1940 and followed by taxes, Slow Efficient, Quick
revised in 1998. wage claims, andsecured creditors.
Source: World Bank, Asian Development Bank (1999).
25

Table 4: Legal Origin, Creditor Rights, andEfficacy of the Judicial System
Country Legal Origin Creditor Rights Judicial Efficacy
Hong Kong Anglo-Saxon 4 6.5
Indonesia French 0 4.5
Japan Germanic 3 6.5
Korea Germanic 3 7.5
Malaysia Anglo-Saxon 3 5.5
Philippines French 0 3.0
Singapore Anglo-Saxon 4 8.0
Taiwan Germanic 4 4.5
Thailand Anglo-Saxon 2 6.5
Sources: Legal Origin is taken from La Porta et al (1997). Creditor Rights and Efficacy of Judicial Systemare constructed by the authors based on data from Asian Development Bank (1999) and reported in Table3.
The Creditor Rights index is the summation of four dummy variables, where the highest possible score is4: TIME, equal to 1 if the timetable for rendering a judgement is less than 90 days, 0 otherwise.MANAGER, equal to I if incumbent management does not stay during a restructuring or bankruptcy, 0otherwise. STAY, equal to 1 if there is no Automatic Stay on assets, 0 otherwise. CREDITOR, equal to 1if secured creditors have the highest priority in payment 0 otherwise.
The Judicial Efficiency index is the average of 8 variables, the ranking (0-2) of expense, ease, efficiency,and speed for RESTRUCTURING and LIQUIDATION. For Example, we assign 0 points if Restructuringis Very Slow, 1 if Slow, 2 if Quick. Similar ranking is constructed for expense, easy and efficiency. Themaximum score is 8 for each Restructuring and Liquidation. We take the average of those scores.
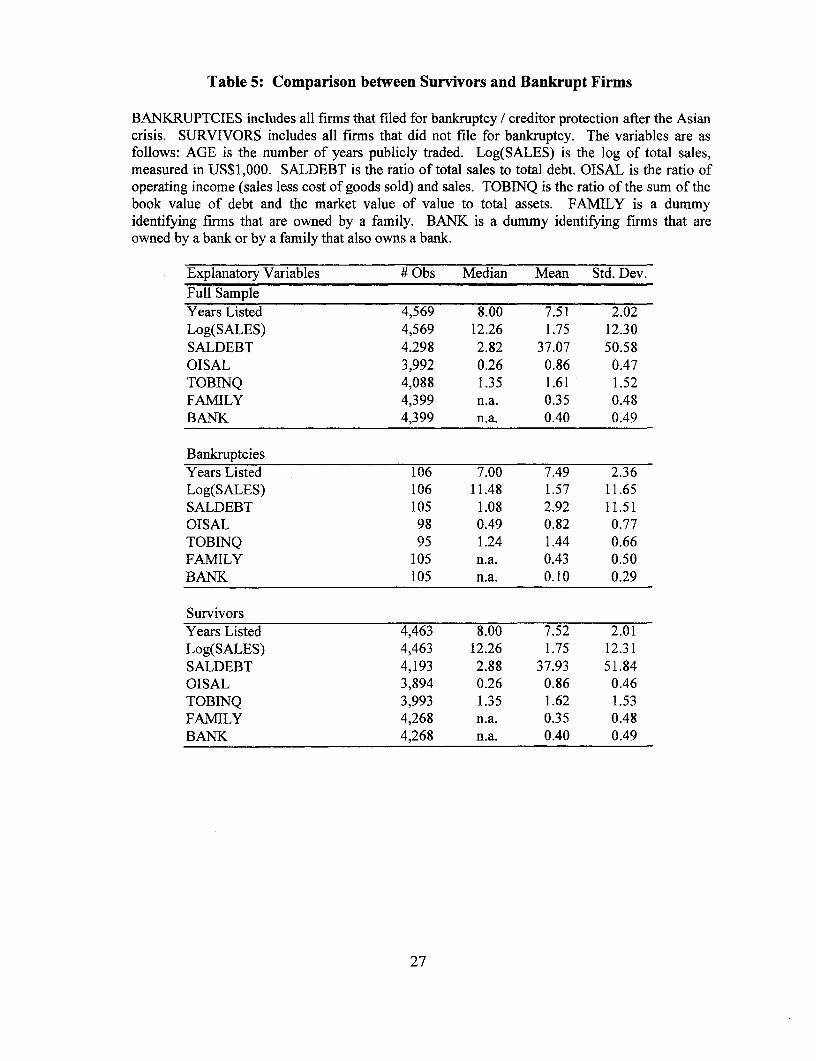
Table 5: Comparison between Survivors and Bankrupt Firms
BANKRUPTCIES includes all firms that filed for bankruptcy / creditor protection after the Asiancrisis. SURVIVORS includes all firms that did not file for bankruptcy. The variables are asfollows: AGE is the number of years publicly traded. Log(SALES) is the log of total sales,measured in US$1,000. SALDEBT is the ratio of total sales to total debt. OISAL is the ratio ofoperating income (sales less cost of goods sold) and sales. TOBINQ is the ratio of the sum of thebook value of debt and the market value of value to total assets. FAMILY is a dummyidentifying firms that are owned by a family. BANK is a dummy identifying firms that areowvned by a bank or by a family that also owns a bank.
Explanatory Variables # Obs Median Mean Std. Dev.Full SampleYears Listed 4,569 8.00 7.51 2.02Log(SALES) 4,569 12.26 1.75 12.30SALDEBT 4.298 2.82 37.07 50.58OISAL 3,992 0.26 0.86 0.47TOBINQ 4,088 1.35 1.61 1.52FAMILY 4,399 n.a. 0.35 0.48BANK 4,399 n.a. 0.40 0.49
BankruptciesYears Listed 106 7.00 7.49 2.36Log(SALES) 106 11.48 1.57 11.65SALDEBT 105 1.08 2.92 11.51OISAL 98 0.49 0.82 0.77TOBINQ 95 1.24 1.44 0.66FAMILY 105 n.a. 0.43 0.50BANK 105 n.a. 0.10 0.29
SurvivorsYears Listed 4,463 8.00 7.52 2.01Log(SALES) 4,463 12.26 1.75 12.31SALDEBT 4,193 2.88 37.93 51.84OISAL 3,894 0.26 0.86 0.46TOBINQ 3,993 1.35 1.62 1.53FAMILY 4,268 n.a. 0.35 0.48BANK 4,268 n.a. 0.40 0.49
27

Table 6: Effect of Firm and Country Characteristics on Bankruptcy(Logit Estimation)
The table is based on the following equation (with modifications for columns 1-3)Bankruptcy =Intercept +,8I LISTING+ ,32LSALES+ / 3SALDEBT + 84 OISAL+
/35 TOBINQ + /6 FAILY+ /37 BANK + /8 GNPG98 +/89 DUM-Hi +81013 [DUM-THA, DUM-KOR, DUM-IDN, DUM-MYS]
The dependent variable BANKRUPTCY identifies firms that legally filed for creditor protectionin 1997 or 1998 (1=Bankruptcy, 0=Survivors). The independent variables are as follows:LISTING is the number of years publicly traded. LSALES is log of total sales, measured inUS$1,000. SALDEBT is the ratio of total sales to total debt. OISAL is the ratio of operatingincome (sales less cost of goods sold) to sales. TOBINQ is the ratio of the sum of the book valueof debt and the market value of equity to total assets. FAMILY is a dummy identifying firms thatare owned by a family. BANK is a dummy identifying firms that are owned by a bank or by afamily that also owns a bank. DUM-Hi is a dummy indicating the developed countries (HongKong, Japan, Singapore, and Taiwan). DUM-THA is a dummy indicating Thailand. DUM-KORis a dummy indicating Korea. DUM-IDN is a dummy indicating Indonesia. DUM-MYS is adummy indicating Malaysia. GGNP98 is the real growth rate in 1998. * and ** indicatesignificance at the 5% and 1% level, respectively.
(1) (2) (3) Without JapanIndependent Variables Coefficient t-Statistics Coefficient t-Statistics Coefficient t-Statistics
Firm SpecificlNTERCEPT 0.19 0.14 -0.46 -0.44 -0.58 -0.54LISTING -0.07 -1.20 -0.06 -1.07 -0.05 -0.89LSALES -0.15 -1.78 -0.13 -1.75 -0.10 -1.16SALDEBT -0.20** -3.34 -0.26** -4.01 -0.17** -3.02OISAL -0.44 -0.97 0.54** 2.58 0.44** 2.04TOBINQ -0.61* -2.43 -0.49** -2.10 -0.44 -1.96FAMILY -1.40** -3.60 -1.68** -4.38 -1.49** -2.84BANK -0.56* -2.31 -0.58* -2.40 -0.83** -3.29
Country SpecificGNPG98 -0.13** -4.36 -0.10** -3.37DUM-Hi -0.34 -0.32DUM-Thailand 2.75* 2.24DUM-Indonesia 0.86 0.66DUM-Korea 2.18* 2.01DUM-Malaysia 1.41 1.32
Number of observations: 3,348 3,348 1,378% Concordant: 85.7% 84.6% 84.4%
28

Table 7: Effect of Legal Origin and Judicial System(Logit Estimation)
The table is based on the following equation (with modifications for columns 1-3):Bankruptcy = Intercept +/31 LISTING+,82LSALES+,B3SALDEBT+/34 OISAL +
,85 TOBINQ + 6 FAILY + 7 BANK + /38 GNP98 +/3A FRENCH +A/3o GERMAN + fill JAPAN + ,B, JUD +fll3 CREDIT-JUD
The dependent variable BANKRUPTCY identifies firms that legally filed for creditor protectionin 1997 or 1998 (l=Bankruptcy, O=Survivors). The independent variables are as follows:LISTING is the number of years publicly traded. LSALES is log total sales, measured inUS$1,000. SALDEBT is the ratio of total sales to total debt. OISAL is the ratio of operatingincome (sales less cost of goods sold) and sales. TOBINQ is the ratio of the sum of the bookvalue of debt and the market value of equity to total assets. FAMILY is a dummy identifyingfirms that are owned by a family. BANK is a dummy identifying firms that are owned by a bankor by a family that also owns a bank. GDPG98 is the real growth rate in 1998. FRENCH is adummy indicating French legal origin (Indonesia, and Philippines). GERMAN is a dummyindicating German legal origin (Japan, Korea, and Taiwan). JAPAN is a dummy for Japan. JUDis an index of the efficiency of the judicial system. CREDIT-JUD is the interaction of JUD and anindex of creditor rights. * and ** indicate significance at the 5% and 1% level, respectively.
(1) (2) (3)Independent Variables Coefficient t-Statistics Coefficient t-Statistics Coefficient t-Statistics
Firm SpecificINTERCEPT -0.94 -0.82 -3.32* 2.59 -1.89 -1.54LISTING -0.05 -0.90 -0.04 0.73 -0.02 -0.40LSALES -0.18* -2.02 -0.14 1.78 -0.10 -1.32SALDEBT -0.21** -3.47 -0.22* 3.65 -0.23** -3.70OISAL 0.35 1.67 0.27 -1.27 0.50* 2.17TOBINQ -0.37 -1.73 -0.25 1.21 -0.32 -1.48FAMILY -1.39** -3.53 -1.40** 3.57 -1.41** -3.58BANK -0.59** -2.46 -0.67** 2.81 -0.70** -2.94
Country SpecificGNPG98 -0.27** -3.71 -0.13** 2.76 -0.14** -3.01FRENCH -2.66** -3.14GERMAN 0.87* 2.22JAPAN -1.15* -2.32 -1.14** -3.27 -1.02* -2.41JUD 0.54** 2.75CREDIT-JUD 0.05* 2.02
Number of observations: 3,348 3,348 3,348% Concordant: 85.7% 84.6% 84.4%
29

Policy Research Working Paper Series
ContactTitle Author Date for paper
WPS2111 Agricultural Land Reform in Postwar Toshihiko Kawagoe May 1999 P. KokilaJapan: Experiences and Issues 33716
WPS2112 Industrial Policy after the East Asian Ashoka Mody May 1999 S. KpundehCrisis: From 'Outward Orientation" 39591To New Internal Capabilities?
WPS2113 Wage Determination and Gender Stefano Paternostro May 1999 N. NouvialeDiscrimination in a Transition David E. Sahn 34514Economy: The Case of Romania
WPS2114 Economic Reforms and Total Factor Pablo Fajnzylber May 1999 S. HoltProductivity Growth in Latin America Daniel Lederman 37859And the Caribbean (1950-95):An Empirical Note
WPS2115 Foreign Investment and Productivity Simeon Djankov May 1999 R. VoGrowth in Czech Enterorises Bernard Hoekman 33722
WPS2116 Does Child Labor Displace Martin Ravallion May 1999 P. SaderSchooling? Evidence on Behavioral Quentin Wodon 33901Responses to an Enrollment Subsidy
WPS2117 On the Size and Number of Regional Soamiely Andriamananjara May 1999 L. TabadaIntegration Arrangements: A Political 36896Economy Model
WPS2118 Developing Countries and the Next Anne 0. Krueger May 1999 L. TabadaRound of Multilateral Trade 36896Negotiations
WPS2119 Tax Deductions, Environmental Ian Parry May 1999 R. YazigiPolicy, and the "Double Dividend" Antonio Bento 37176Hypothesis
WPS2120 Can Africa Export Manufactures? Ibrahim A. Elbadawi May 1999 C. BernardoThe Role of Endowment, Exchange 31148Rates, and Transactions Costs
WPS2121 Fiscal Management in Federal William Dillinger May 1999 A. LaraDemocracies: Argentina and Brazil Steven B. Webb 88148
WPS2122 Decentralization and Fiscal William Dillinger May 1999 S. WebbManagement in Colombia Steven B. Webb 38680
WPS2123 Access to Land in Rural India Robin Mearns May 1999 G. Burnett82111

Policy Research Working Paper Series
ContactTitle Author Date for paper
WPS2124 Social Exclusion and Land Robin Mearns May 1999 G. BurnettAdministration in Orissa, India Saurabh Sinha 82111
WPS2125 Developing Country Agriculture and Bernard Hoekman May 1999 L. TabadaThe New Trade Agenda Kym Anderson 36896
WPS2126 Liberte. Egalite, Fraternite: Monica Das Gupta May 1999 M. Das GuptaExploring the Role of Governance 31983In Fertility Decline
WPS2127 Lifeboat Ethic versus Corporate Monica Das Gupta May 1999 M. Das GuptaEthic: Social and Demographic 31983Implications of Stem and JointFamilies
WPS2128 Learning Outcomes and School Gladys Lopez Acevedo May 1999 M. GellerCost-Effectiveness ir, Mexico: 85155The PARE Program
WPS2129 Agricultural Extension: Generic Gershon Feder May 1999 P. KokilaChallenges and Some Ingredients Anthony Wiliett 33716for Solutions Willem Zijp
WPS2130 Deep Integration, Nondiscrimination, Bernard Hoekman May 1999 L. Tabadaand Euro-Mediterranean Free Trade Denise Eby Konan 36896
WPS2131 Efficiency Wage and Union Effects William F. Maloney May 1999 T. GomezIn Labor Demand and Wage Eduardo Pontual Ribeiro 32127Structure in Mexico: An ApplicationOf Quantile Analysis
WPS2132 A Regime-Switching Approach to Maria Soledad Martinez June 1999 A. YaptencoStudying Speculative Attacks: Peria 38526A Focus on European MonetarySystem Crises
.~I