resolute forest products q2 2015 · pdf fileq2 2015 results richard garneau ... 2015...
TRANSCRIPT

RESOLUTE FOREST
PRODUCTS
Q2 2015 RESULTSRichard Garneau, President & CEO
Jo-Ann Longworth, Senior Vice President & CFO
July 30, 2015
RFP Q2 2015 Results 2
CAUTIONARY STATEMENTS REGARDING
FORWARD-LOOKING INFORMATION
July 30, 2015
Statements in this presentation that are not reported financial results or other historical information of Resolute Forest Products Inc. are “forward-looking statements”
within the meaning of the Private Securities Litigation Reform Act of 1995. They include, for example, statements relating to our: efforts to continue to reduce costs
and increase revenues and profitability, including our cost-reduction initiatives; business and operating outlook; future pension funding obligations; assessment of
market conditions; prospects, growth strategies and the industry in which we operate; and strategies for achieving our goals generally. Forward-looking statements
may be identified by the use of forward-looking terminology such as the words “should,” “would,” “could,” “will,” “may,” “expect,” “believe,” “anticipate,” “attempt,”
“project” and other terms with similar meaning indicating possible future events or potential impact on our business or Resolute’s shareholders.
The reader is cautioned not to place undue reliance on these forward-looking statements, which are not guarantees of future performance. These statements are
based on management’s current assumptions, beliefs and expectations, all of which involve a number of business risks and uncertainties that could cause actual
results to differ materially. The potential risks and uncertainties that could cause Resolute’s actual future financial condition, results of operations and performance to
differ materially from those expressed or implied in this presentation include, but are not limited to, developments in alternative media, which are expected to
adversely affect the demand for some of our key products, and the effectiveness of our responses to these developments; the impact of any additional closure costs
and long-lived asset impairment or accelerated depreciation charges; the impact of currency fluctuations on our competitive position, selling prices and
manufacturing costs; the impact of global economic conditions; intense competition in the forest products industry and our ability to compete effectively; negative
publicity, even if unjustified, which could have a negative impact on our brand and the marketability of our products; the highly cyclical nature of the forest products
industry, which could impact the prices of and demand for our products which could result in small or negative profit margins, lower sales volumes and curtailment or
closure of operations; the impact of contributions to our Canadian pension plans, which could be at levels significantly higher than expected; the impact of the terms
of our outstanding indebtedness, which could restrict our current and future operations, particularly our ability to respond to changes and take certain actions; our
ability to maintain adequate capital resources to provide for all of our capital requirements, which are substantial; any inability to successfully implement our
strategies to increase our earnings power; the impact of changes in laws or regulations, including environmental regulations and liabilities and the impact of future
regulation of our Canadian softwood lumber exports to the United States; any difficulties in obtaining wood fiber at favorable prices, or at all; the impact of changes
in the cost of purchased energy and other raw materials, which could lead to higher manufacturing costs and reduce our margins; the impact of changes in political
or economic conditions in Canada, the United States or other countries in which our products are manufactured or sold; physical and financial risks associated with
climate change; the impact of any labor disputes; extreme weather conditions or natural or man-made disasters, which could disrupt our supply chain and delivery of
our products; cyber security risks; the impact of acquisitions, divestitures or other strategic transactions we may pursue; and the potential risks and uncertainties set
forth under the heading “Risk Factors” in Part 1, Item 1A of Resolute’s annual report on Form 10-K for the year ended December 31, 2014.
All forward-looking statements in this presentation are expressly qualified by the cautionary statements contained or referred to above and in Resolute’s other filings
with the U.S. Securities and Exchange Commission and the Canadian securities regulatory authorities. Resolute disclaims any obligation to publicly update or revise
any forward-looking information, whether as a result of new information, future events or otherwise, except as required by law.
All figures in $US unless otherwise noted

3
Q2 2015 OVERVIEW
Adjusted EBITDA : Q2’15 vs Q1’15
Adjusted EBITDA is a non-GAAP financial measure. Refer to Appendix B for a definition and reconciliation of non-GAAP financial measures.
July 30, 2015 RFP Q2 2015 Results

4
Q2 2015 OVERVIEW
July 30, 2015 RFP Q2 2015 Results
Adjusted EBITDA : Q2’15 vs Q2’14
Adjusted EBITDA is a non-GAAP financial measure. Refer to Appendix B for a definition and reconciliation of non-GAAP financial measures.

5
MARKET PULP
1. EBITDA is a non-GAAP financial measure. Refer to Appendix B for a definition and reconciliation of non-GAAP financial measures.
2. The “all-in” delivered cost is the total cost of each ton shipped (cost of sales, depreciation and amortization, distribution costs and selling, general and administrative expenses).
Global chemical pulp demand ↑ 5% through June
– China ↑ 12%; Lat. Am ↑ 6%; NA ↑ 1%;
Softwood ↑ 2%
– NBSK ↑ 2%; SBSK ↑ 1%
– Shipments ↑ 8% to China; ↑ 2% NA;
↓ 4% W. Europe
Hardwood ↑ 8%
– Eucalyptus ↑ 11%; NBHK ↑ 3%; SBHK ↓ 4%
RFP average transaction price ↓ $8/mt q/q
RFP shipments ↑ 23k mt from Q1’15
July 30, 2015 RFP Q2 2015 Results
(US$mm) Q2 2015 Q1 2015
Sales 231 218
Operating income 26 11
EBITDA1 38 25
Shipments (000’s mt) 351 328

6
WOOD PRODUCTS
1. EBITDA is a non-GAAP financial measure. Refer to Appendix B for a definition and reconciliation of non-GAAP financial measures.
July 30, 2015 RFP Q2 2015 Results
(US$mm) Q2 2015 Q1 2015
Sales 134 139
Operating (loss)/income (4) 5
EBITDA1 5 13
Shipments (000’s mbf) 418 393
Q2’15 SAAR U.S. housing starts of 1.1mm; ↑ 16% y/y
– Q2’15 SAAR permits ↑ 19% y/y
NA exports to Asia and softer than expected demand
pulled lumber prices to multi-year lows in Q2
– RFP average price ↓ $33/mbf
RFP shipments ↑ 25mmbf in Q2’15
Atikokan now in start-up mode
Share of U.S. consumption in Q2 limited by SLA to 4.8%
for Québec and 3.3% for Ontario
7
NEWSPRINT
1. EBITDA is a non-GAAP financial measure. Refer to Appendix B for a definition and reconciliation of non-GAAP financial measures.
July 30, 2015 RFP Q2 2015 Results
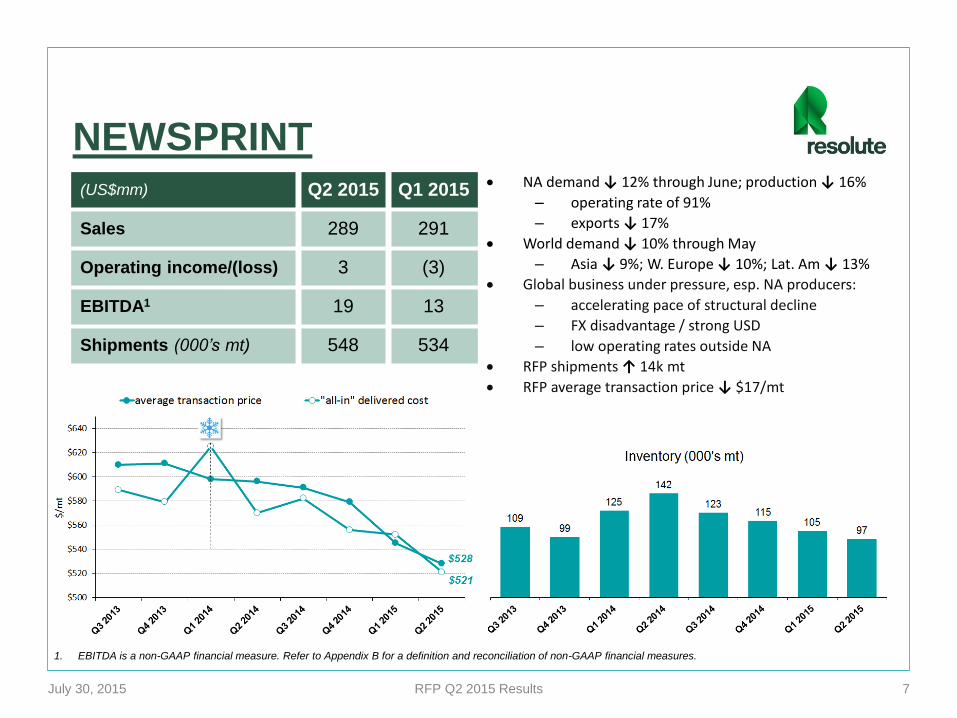
(US$mm) Q2 2015 Q1 2015
Sales 289 291
Operating income/(loss) 3 (3)
EBITDA1 19 13
Shipments (000’s mt) 548 534
NA demand ↓ 12% through June; production ↓ 16%
– operating rate of 91%
– exports ↓ 17%
World demand ↓ 10% through May
– Asia ↓ 9%; W. Europe ↓ 10%; Lat. Am ↓ 13%
Global business under pressure, esp. NA producers:
– accelerating pace of structural decline
– FX disadvantage / strong USD
– low operating rates outside NA
RFP shipments ↑ 14k mt
RFP average transaction price ↓ $17/mt
8
SPECIALTY PAPERS
1. EBITDA is a non-GAAP financial measure. Refer to Appendix B for a definition and reconciliation of non-GAAP financial measures.
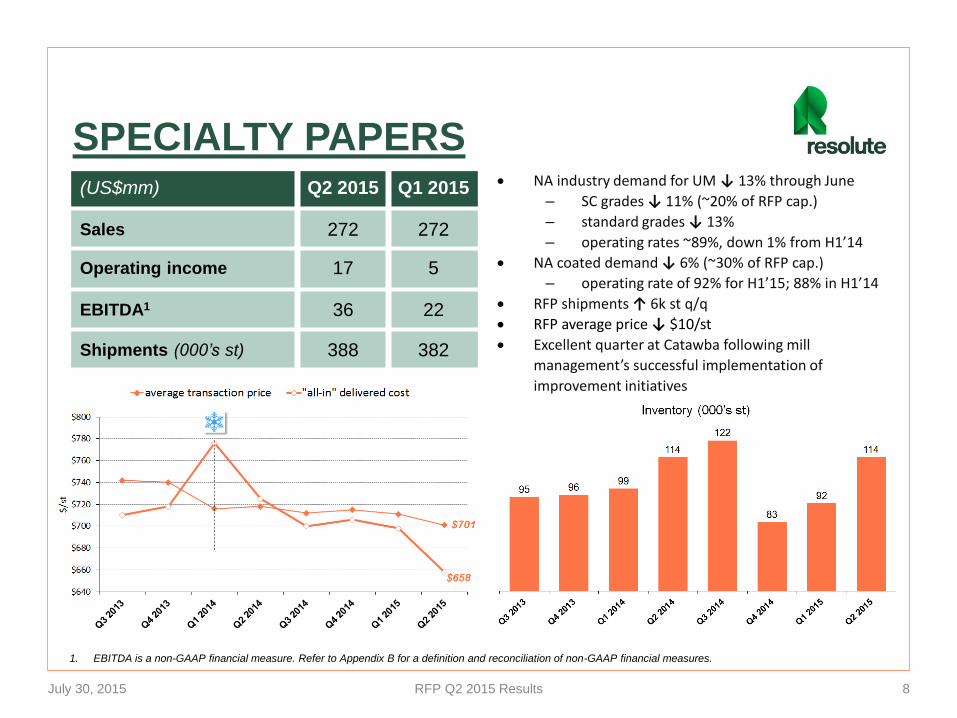
NA industry demand for UM ↓ 13% through June
– SC grades ↓ 11% (~20% of RFP cap.)
– standard grades ↓ 13%
– operating rates ~89%, down 1% from H1’14
NA coated demand ↓ 6% (~30% of RFP cap.)
– operating rate of 92% for H1’15; 88% in H1’14
RFP shipments ↑ 6k st q/q
RFP average price ↓ $10/st
Excellent quarter at Catawba following mill
management’s successful implementation of
improvement initiatives
July 30, 2015 RFP Q2 2015 Results
(US$mm) Q2 2015 Q1 2015
Sales 272 272
Operating income 17 5
EBITDA1 36 22
Shipments (000’s st) 388 382

Continued focus on costs helped deliver solid
results despite industry challenges
Announced selection of state-of the-art NTT
tissue machine as part of $270mm project to
enter tissue market by 2017
Ongoing capacity building initiatives in pulp and
lumber
RFP Q2 2015 Results
Q2’15 HIGHLIGHTS
9July 30, 2015
NTT tissue machine
First load of lumber
New sawmill stacker and sorters
NEW ATIKOKAN SAWMILL

P&L
Selected financial information
Q2 2015 vs Q1 2015 vs Q2 2014
Net income1 $7mm +$26mm -$10mm
Sales $926mm +1% -15%
EPS1 $0.07 $(0.20) $0.18
Adjusted EBITDA2
$89mm+39% -15%
1. Excluding special items. Refer to Appendix B for a definition and reconciliation of non-GAAP financial measures.
2. Adjusted EBITDA is a non-GAAP financial measure. Refer to Appendix B for a definition and reconciliation of non-GAAP financial measures.
3. Other postretirement benefit.
Special items affecting net income (pre-tax)
Q2 2015
- $12mm non-operating pension and OPEB3 costs
Selected financial information
10
Shipments
July 30, 2015 RFP Q2 2015 Results

11
« All-in » delivered cost EBITDA per unit
EBITDA improvement from cogen(in $US millions)
Q3 13 Q4 13 Q1 14 Q2 14 Q3 14 Q4 14 Q1 15 Q2 15
12 10 13 14 8 8 12 13
July 30, 2015 RFP Q2 2015 Results

12
LIQUIDITY AND CASH FLOWQ2 2015 (US$mm)
vs Q1 2015 vs Q2 2014
Cash
30321 40
Working capital
68112 14
Net debt
29421 41
Interest
1112 11
• Cash provided by operating
activities of $61mm in Q2
– up $32mm from Q1
• Q2 capex of $39mm
– in line with Q1
• Liquidity = $771mm
• Repurchased 3.2mm shares in Q2,
or 3.4% of total shares outstanding,
for $37mm
• Expect 2015 capex to be ~$290mm
– includes $90mm for the tissue
project
Available liquidity (US$mm)
2015 2014 2013
Q2 Q1 Q4 Q3 Q2 Q1 Q4 Q3 Q2 Q1
Total debt 597 597 597 598 598 598 599 604 604 532
Cash on hand 303 324 337 265 263 240 322 271 248 215
Available under ABL credit facility 468 464 521 572 567 548 561 566 467 537
July 30, 2015 RFP Q2 2015 Results

13
PENSION
(in $US millions) Q2’15 2014 2013
net pension and OPEB liabilities 1,488 1,631 1,301
U.S. GAAP discount rate at 12/312 N/A 4.0% 4.9%
(in $US millions) 2015E Q2’15 2014 2013
pension contributions3 145 34 164 155
OPEB payments 16 3 19 22
pension and OPEB expense 81 19 26 601. Other postretirement benefit
2. Pension plans
3. Includes defined benefit, defined contribution and target benefit plans
• Q2 pension contributions of $34mm
– Expect $57mm in Q3 and $27mm in Q4
– Q3 will include:
• $14mm in contributions to U.S. plans for Q3 and Q4 (timing)
• Additional solvency contributions of $15mm for machine closures under the special
funding relief measures
• ↑ in pension and OPEB1 expense of $55mm for 2015
– no impact on funding requirement
– relates to amortization of $330mm increase in 2014 liability
July 30, 2015 RFP Q2 2015 Results

APPENDIX A

PRESENTATION OF PENSION &
OPEB COMPONENTS
15July 30, 2015 RFP Q2 2015 Results
2014 Q1’15 Q2’15
(in $US millions) Previously Now Previously Now Previously Now
Market pulp 119 116 24 25 36 38
Wood products 102 102 13 13 4 5
Newsprint 92 89 10 13 17 19
Specialty papers 65 63 18 22 33 36
Corporate and other
(12) (14) (15) (9) (13) (9)
Adjusted EBITDA 366 356 50 64 77 89
Note:
1. Adjusted EBITDA excludes net financing and remeasurement components of pension and OPEB costs, which
consist of the effects of interest cost, expected return on assets and amortization of actuarial losses. These
components are sometimes referred to as “non-operating” components of pension and OPEB costs.
2. Adjusted EBITDA includes “operating” components of pension and OPEB costs, which consist of current service
costs and the amortization of prior service credits.
3. The “non-operating” components of pension and OPEB costs are now allocated to “corporate and other” in our
segment presentation of operating income.

21
APPENDIX B
1997 20132005
The boreal forest regenerates quickly …

17July 30, 2015 RFP Q2 2015 Results

18July 30, 2015 RFP Q2 2015 Results

19July 30, 2015 RFP Q2 2015 Results

20July 30, 2015 RFP Q2 2015 Results
APPENDIX C
21

22July 30, 2015 RFP Q2 2015 Results

23July 30, 2015 RFP Q2 2015 Results

24July 30, 2015 RFP Q2 2015 Results

25July 30, 2015 RFP Q2 2015 Results

26July 30, 2015 RFP Q2 2015 Results

RESOLUTE FOREST
PRODUCTS
Q2 2015 RESULTSRichard Garneau, President & CEO
Jo-Ann Longworth, Senior Vice President & CFO
July 30, 2015