resistance factor calibration for … factor...resistance factor calibration for driven piles...
TRANSCRIPT

Company
LOGO
RESISTANCE FACTOR
CALIBRATION FOR DRIVEN PILES
Ching-Nien Tsai, P.E.
PAVEMENT AND
GEOTECHNICAL SERVICES

Resistance factors are the
inverse of safety factors that
accounts for the variability of
each individual contributing
factor of resistance.

WHY ARE WE DOING IT?
FHWA has tied federal bridge funding to
the adoption of LRFD specifications. All
structures starting preliminary design by
October 1, 2007 will use the LRFD Bridge
Design Specifications.

Stability Minimum
Factor of Safety = 1.3
Experience Based Approach :
try, try again

WHAT’S WRONG WITH USING FS?
• Use conservative parameters
– Consistency
– Conflict in conservatism
– Economic issues
– Problem w/behavior prediction
• FS gives false sense of safety
• A lack of risk assessment

Pile Resistance Predictions
0
1
2
3
4
5
6
7
8
9
0.1 0.2 0.3 0.4 0.5 0.6 0.7 0.8 0.9 1 1.1 1.2 1.3 1.4 1.5 1.6 1.7 1.8 1.9 2
Ratio of Predicted to Observed Capacity
Nu
mb
er o
f P
red
icti
on
Pipe Pile
24 Values
Mean
Median
OverpredictionsUnderpredictions

Variation of Soil Properties
Parameter C.V. Parameter C.V.
Porosity 0.1 Coeff. of Compressibility 0.16
Specific Gravity 0.02 Preconsolidation Pressure 0.19
Water Content Compression Index
Silty Clay 0.2 Sandy Clay 0.26
Clay 0.13 Clay 0.3
Degree of Saturation 0.1 SPT 0.26
Unit Weight 0.03 CPT 0.37
Permeability Friction Angle
Dry of Optimum 2.4 Gravel 0.07
Wet of Optimum 0.9 Sand 0.12
Cohesion 0.4

Company
LOGO
Exam
ple
Str
uctu
ral
& F
ou
nd
ati
on
Ele
men
ts
Bia
se
s a
nd
Un
ce
rta
inti
es
(A
PI 2000
No
min
als
)
StructureElement
MedianBiasB 50Ru
CapacityUncertainty
COV %
StructureElement
MedianBiasB 50Ru
CapacityUncertainty
COV %TubularBraces
tens ioncompress ionbendinghydrostatic
1.31.41.51.4
10 - 1215 - 1810 - 1210 - 12
Plates
StiffenedPanels
1.05
1.1
7 - 8
10 - 12
Tubular JointsT, Ycompress iontens ion
X, DTcompress iontens ion
K, YTcompress iontens ion
1.22.7
1.11.7
1.31.7
20 - 2215 - 16
10 - 1220 - 22
20 - 2420 - 24
CylindersRing-StringerStiffened
RingStiffened
Box Girders
1.0
1.0
1.1
15 - 18
10 - 12
10 - 12
PilesStatic axial
clayssands
Static lateralclayssands
Dyn. axialclayssands
Dyn. lateralclayssands
1.00.8
1.01.1
2.50.9
1.01.1
30 - 4050 - 60
20 - 3040 - 50
35 - 4550 - 60
25 - 3540 - 50
Drag Anchorsclayssands
Cables
Tendons(machinedconnections)
1.51.2
1.5
1.1
40 - 5050 - 60
10 - 15
7 - 8

HEAVY LOAD
f
SLOPE STABILITY
TIPPING
RETAINING
WALL
DRAIN
SLIDING
BEARING CAPACITY

FACTOR OF SAFETY
• Does not reflect the field investigation and
lab testing efforts
• Does not account for the analytical
techniques used
• Rewards field monitoring (PDA, CAPWAP,
load test) without proper evaluation of the
variation of the test results
• Same FS different performance and risk

WHY LRFD?
• ASD
– Safety factors (subjective)
– Stress is not a good measurement of resistance
– Inadequate account of variability
• LFD
– Load factor applied to each load combination
– No risk assessment
• LRFD
– Accounts for variability
– Uniform level of safety
– Risk Assessment
FSRLLDL u /
uLLDL RLLDL f
uLLDL RLLDL f

0
0.1
0.2
0.3
0.4
0.5
0.6
0.7
0.8
0.9
-2 -1 0 1 2 3 4 5 6
x
f(x)
ASD, LFD, LRFD
FS
FS
ASD
LFD
LRFD
Resistance
Load
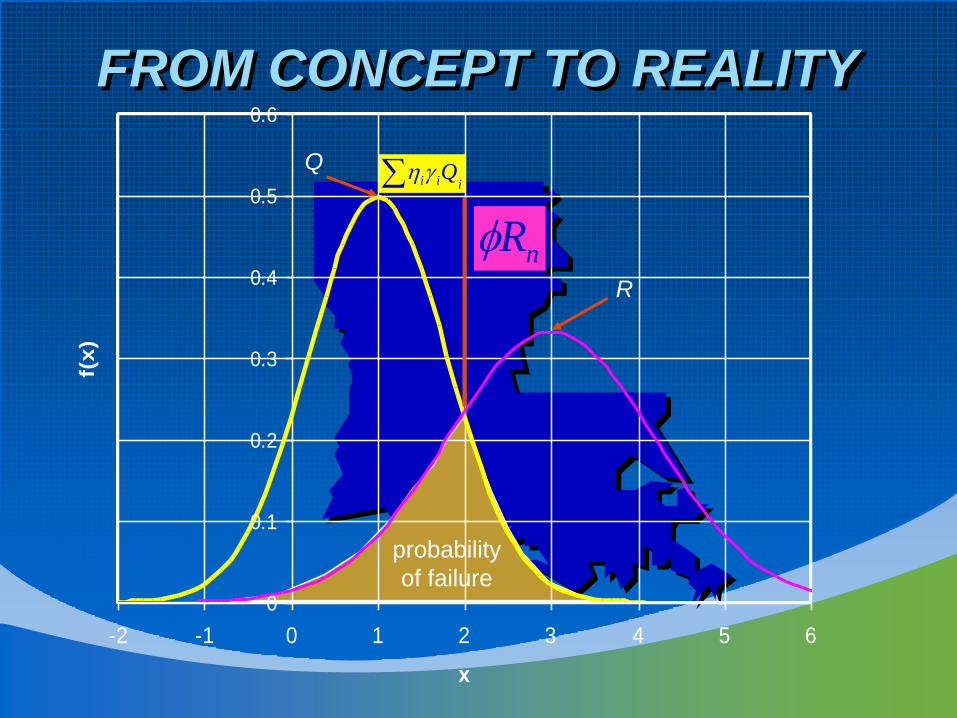
FROM CONCEPT TO REALITY
0
0.1
0.2
0.3
0.4
0.5
0.6
-2 -1 0 1 2 3 4 5 6
x
f(x
)
iii Q
probability
of failure
Q
R
nRf

Reliability Index
• Defines probability of failure
0
0.1
0.2
0.3
0.4
0.5
0.6
-2 -1 0 1 2 3 4 5 6
x
f(x
)
(FS)
1 -E(FS) )RI(
• Definition
2
2
1)(
1)(ln
Q
R
VQE
VRE

Reliability vs.
Probability of Failure
0.00001
0.0001
0.001
0.01
0.1
1
0 0.5 1 1.5 2 2.5 3 3.5 4 4.5 5
Reliabilty Index
Pro
bab
ilit
y o
f F
ailu
re
Normal
Unknown
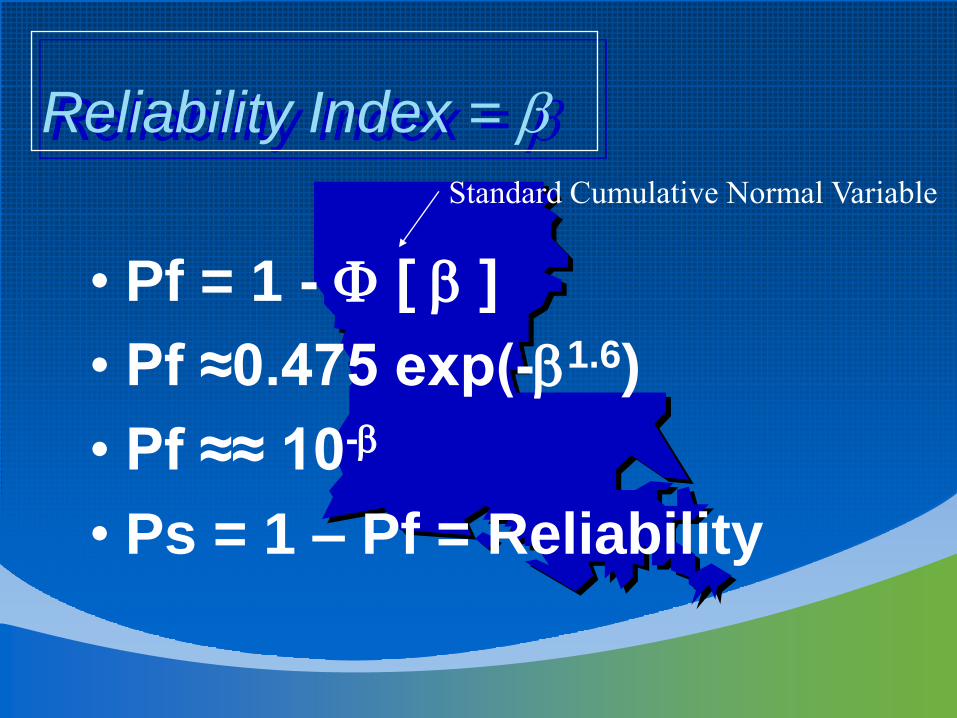
Reliability Index =
• Pf = 1 - [ ]
• Pf ≈0.475 exp(-1.6)
• Pf ≈≈ 10-
• Ps = 1 – Pf = Reliability
Standard Cumulative Normal Variable

WHAT DO WE NEED TO DETERMINE
RELIABILITY INDEX?
• A deterministic model (slope stability, a-method)
• A performance function (FS from STABL,
capacity from Driven)
• The expected value (weighted average) and
standard deviation of the parameters (C, f)
• A definition of the limit state (FS=1)
• A method to estimated the expected value and
standard deviation of the limit state

STEPS TO DETERMINE
RESISTANCE FACTORS
1. Determine acceptable probability of
failure (reliability index)
2. Estimate variability of soil parameters
3. Determine systematic errors or bias
4. Calculate resistance factor(s) f

METHODS OF RESISTANCE
FACTOR CALIBRATION
• Calibration by fitting ASD
• Calibration using reliability theories
– FOSM
– AFOSM
– FORM (NCHRP 507)
– SORM
– Monte Carlo

EVOLUTION OF RESISTANCE
FACTORS FOR DRIVEN PILES
• 1992 AUSTROAD– 0.8 to 0.9 (load test)
• 1992 Ontario– 0.4(c), 0.3(t), 0.6(sc),0.4(st)
• 1995 Australian Standard– 0.7 to 0.9 (load test)
– 0.45-0.65 (static pile analyses)
– 0.5 to 0.85 (dynamic monitoring)
• 1997 Eurocode– 0.67 to 0.91
• 1999 Goble– 0.63 to 0.77
• 1998 & 2004 AASHTO– 0.7 (a-method)
– 0.5 (-method)
– 0.8 (load test)
• 2004 NCHRP– 0.24 to 0.6 (clay)
– 0.13 to 0.58 (sand)
– 0.26 to 0.84 (mixed)
– 0.23 to 0.75 (dynamic)
• 2006 AASHTO– 0.35 (a-method)
– 0.25 (-method)
– 0.45 (Nordlund)
– 0.55 to 0.8 (load test)

PRACTICE BEFORE CALIBRATION
• Fitting ASD
• Finagled Resistance Factors
– no risk analysis
FS1LL
DLLL
DLLLDL
f
DL/LL = 3.0, then f = 1.375/FS
DL/LL = 1.0, then f= 1. 5/FS
1.25/FS < f < 1.75/FS

DOTD’S CALIBRATION EFFORT
• PI – Dr. Murad Abu-Farsakh
– Dr. Sungmin Yoon (Research Associate)
• Driven piles
– Schedule
• Summer 2007
– Methods to be Calibrated
• Tomlinson (a-method)
• Nordlund/Thurman Method
• CPT
• Drilled Shafts
– Starting after summer 2007

PROCEDURES
• Data collection
• Digitize data
• Interpret data
• Re-evaluate capacities using the methods
to be calibrated
• Statistic analysis

PROBLEMS ENCOUNTERED
• Data interpretation (judgment)
• Quality of soil boring logs
• Quality of load test data
• Difficult to differentiate among different methods
(a, , Norlund) due to mixed soil conditions
• Difficult to separate end bearing from total
capacity based on the traditional load tests
• Insufficient database for and Norlund methods
• A lack of good quality tests from north Louisiana

PRELIMINARY RESISTANCE
FACTORS FOR DRIVEN PILES
• l1.18 means 15% underprediction (avg)
– National average 1.20 (2004 NCHRP 507)
• = 2.33
– f0.65 for DD/LL of 1
– f0.61 for DD/LL of 3
• = 3.0
– f0.51for DD/LL of 1
– f0.48 for DD/LL of 3
FSavg = 2.3 (calculated)
FSavg = 2.6 (true)
FSavg = 2.9 (calculated)
FSavg = 3.3 (true)

IMPLEMENTATION CONCERNS
• Service state – no risk assessment
• Slope stability – difficult to calibrate
• Small database used for calibration
• Model representation – limit to Tomlinson’s a method
• System reliability vs. component reliability
– Retaining wall, embankment, pile group
• Difficult to quantify experience
• Requires the knowledge of database
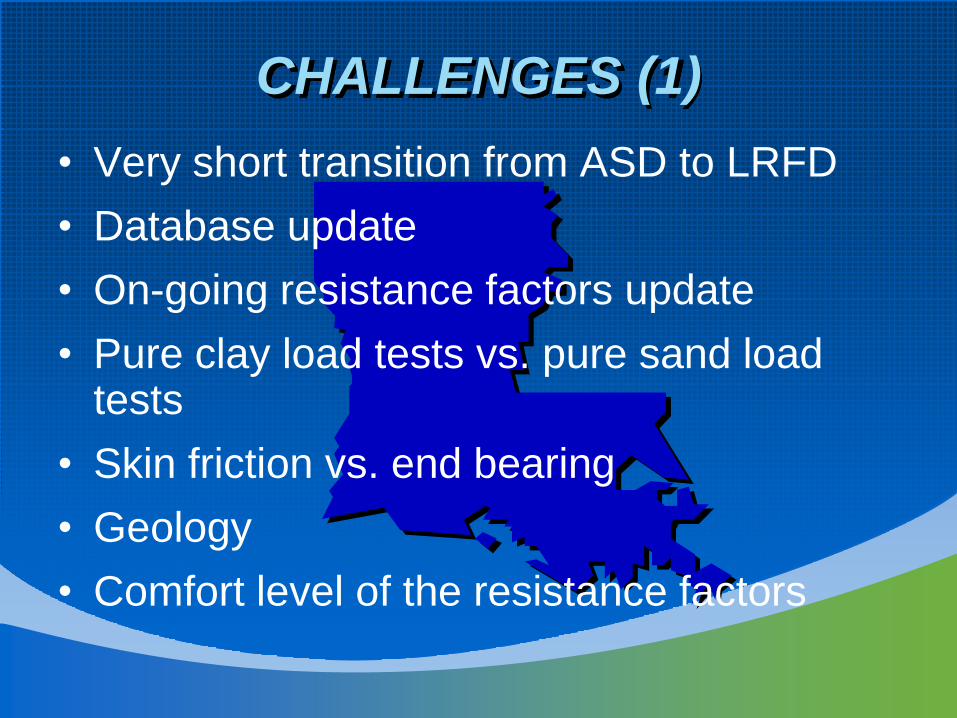
CHALLENGES (1)
• Very short transition from ASD to LRFD
• Database update
• On-going resistance factors update
• Pure clay load tests vs. pure sand load tests
• Skin friction vs. end bearing
• Geology
• Comfort level of the resistance factors

CHALLENGES (2)
• Concept of redundancy and ductility
• Educate the geotechnical community
• Experience from local geotechnical
practices is lost
• New methods require new calibration
effort

OTHER FACTORS AFFECTING
RESISTANCE FACTORS
• Site variability
– Low cov < 0.25
– Medium 0.25 < cov <0.40
– High cov > 0.4
• Redundancy
• Ductility

Company
LOGO
APPLICATION OF LRFD

LIMIT STATES
• Strength Limit (5)
– Failure
• Service Limit (4)
– Movement
• Extreme Limit (2)
– Improbable loads
• Fatigue Limit
– Cycles of loads

STREMGTH LIMIT STATES
• Strength I
– Normal vehicular with basic load combination
– No wind
• Strength II
– Permit design vehicles
– No wind
• Strength III
– Wind load combination (55 mph)
– No live load

STRENGTH LIMIT STATES
• Strength IV
– High dead to live load ratio (>7.0)
– Controls for “long span bridges”
– No live load
• Strength V
– Normal vehicular use
– Wind velocity of 55 mph
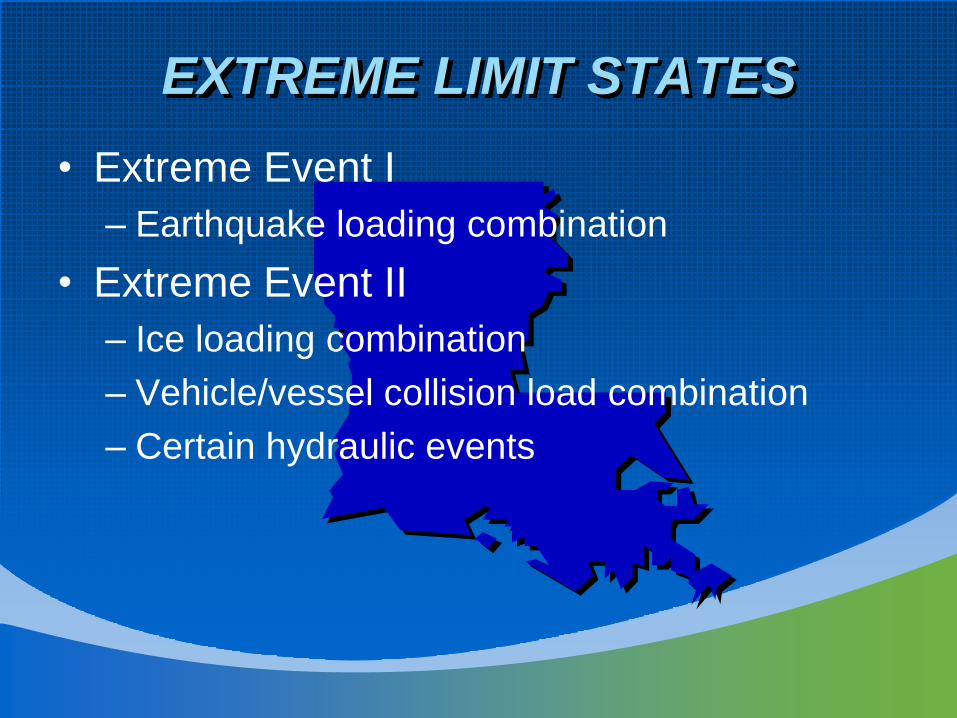
EXTREME LIMIT STATES
• Extreme Event I
– Earthquake loading combination
• Extreme Event II
– Ice loading combination
– Vehicle/vessel collision load combination
– Certain hydraulic events

SERVICE LIMIT STATES
• Service I
– Normal operation
– 55 mph wind
• Service II & III
– Structure related
• Service IV
– Tension in pre-stressed concrete substructures
– Crack control

GEOTECHNICAL DESIGN PROCESS
• ASD– Field investigation
determined based on a predetermined FS
– Allowable loads vs. depths
• Pile order lengths or plan lengths determined
– Check serviceability requirements
• LRFD– Field investigation
determined based on an appropriate f
– Choose resistance factors based on load tests and site variability
– Conduct field and lab tests
– Refine field and lab tests
– Check service states using f = 1
– Feedback during construction

LOAD TEST
• ASD
– Test to failure or 3
times design load
• LRFD
– Test to nominal
resistance or 150% of
nominal resistance

CONTINUING EFFORTS (1)
• Collect more load test data
• Group database based on geology
• Attempt to calibrate resistance factors for
pile installed in the Pleistocene or stiff soils
• Separate tip resistance from skin friction
using dynamically monitored piles

CONTINUING EFFORTS (2)
• Continuous update of resistance factors
– Will need consultants’ help in getting new load
tests
– Include more published methods, if sufficient
good quality database exists
• Update DOTD’s Bridge Design Manual
• Internal and external education on LRFD
subjects
• Publish the research results

QUESTIONS