residual business management corporation annual report 2011-12 · taking voluntary redundancy. ......
TRANSCRIPT

Annual Report and Financial Report
of the
Residual Business Management Corporation Group
For the Year Ended
30 June 2012
TABLE OF CONTENTS
Page
The Year in Review 1
Statutory Information 2
Statement of Comprehensive Income 7
Statement of Financial Position 8
Statement of Changes in Equity 9
Statement of Cash Flows 10
Notes to the Financial Statements 11
Statement Concerning The Financial Statements 46
Independent Audit Report 47
RESIDUAL BUSINESS MANAGEMENT CORPORATION GROUP
THE 2012 FINANCIAL YEAR IN REVIEW
Financial Summary
At 30 June 2012 the Residual Business Management Corporation Group (the Group) consists only of Residual Business Management Corporation (RBMC) The Group controlled Pacific Solar Pty Ltd (Pacific Solar) until its deregistration on 9 May 2012
RBMC is a NSW State-owned statutory corporation Pacific Solar was a private sector incorporated solar research and commercialisation business that had developed and licensed a number of photovoltaic patents Pacific Solar had other government and non-government shareholders until a minority shareholder buy-back was approved by all shareholders on 24 February 2012 On this date Pacific Solar became a fully owned subsidiary of RBMC Pacific Solar was then deregistered as a solvent entity on 9 May 2012
The Group consolidated result for the financial year ended 30 June 2012 was a loss of $1036611525 (2011 a profit of $70686440)
The Group consolidated worth at 30 June 2012 was a surplus of $31240602 (2011 $1306029191 surplus)
The Groups financial position has deteriorated due to actuarial forecasts regarding the present value of the Groups future defined benefit superannuation fund liabilities However due to the high level of current cash reserves accounting for the Group on a going concern basis is appropriate
Reserves
RBMC continues to maintain high levels of cash and cash equivalent reserves because its residual business activities are both risky and complex RBMC also holds large cash reserves to deal with its legacy business issues and to enable it to enforce its contractual rights in relation to the intellectual property it has acquired from its former subsidiary
It is expected that future year cash reserves will be reduced through the payment of dividends to NSW Treasury (contingent upon changes in the value of superannuation liabilities)
Operational Strategy
The re-constitution of Pacific Power on 1 July 2003 represented an ongoing chapter in the energy reform process that commenced in 1994 with the demerger of Pacific Powers generation and transmission businesses into newly formed State-Owned Corporations
RBMC will continue to deal with the residual assets and liabilities of the activities of Pacific Power in order to manage an orderly wind-up of residual matters and ensure that any obligations of a continuing nature are dealt with appropriately
RESIDUAL BUSINESS MANAGEMENT CORPORATION GROUP
STATUTORY INFORMATION 2012
BackgroundtotheRBl1CGroup
The Pacific Power (Dissolution) Act 2003 (the Act) was passed by the NSW State Parliament with effect from 1 July 2003 The purpose of the Act was to dissolve Pacific Power corporation by reshyconstituting it and changing its name to Residual Business Management Corporation (RBMC) For the purposes of private international law RBMC is the same entity as Pacific Power except that it has a new name and new functions
This 2012 Annual Report reflects RBMCs current function that being the management of residual matters from Pacific Powers businesses and investments
Responsibilities ofResidual Business l1anagement Corporation
RBMC is a statutory corporation managed by a general manager with accountability to the NSW State Treasurer The objectives of the Corporation are to
~ Manage its assets rights and liabilities effectively and responsibly
~ Operate at least as efficiently as any comparable business
~ Minimise the risk exposure of the State arising from its activities and
~ Achieve efficient and timely winding up of residual business activities
Under the Act employees of Pacific Power at the time of its re-structure became employees of RBMC retaining their existing terms and conditions of employment and other entitlements including superannuation and all leave entitlements
Former Employees
Employees were offered a choice of seeking redeployment in the public sector or the opportunity of
taking voluntary redundancy To this end RBMC worked constructively with employees and their unions providing a range of support services to employees to assist their transition including career counselling and skills development workshops
RBMC provided a redeployment program for employees seeking placements in the public sector This entailed concentrated coaching and development of all employees and a coordinated approach with the NSW Governments Redeployment amp Relocation Support Unit to identify and match RBMC employees to public sector vacancies
At 30 June 2012 and for the prior year RBMC had only one direct employee that being the General Manager RBMC was formerly managed by a specialist team of consultants that had experience in operating the residual business activities of the Group At the present time the management of RBMC has been moved back to NSW Treasury Mr Dominic Schuster of NSW Treasury was appointed the General Manager on 1 September 2012
2
RESIDUAL BUSINESS MANAGEMENT CORPORATION GROUP
STATUTORY INFORMATION 2012 (continued)
Residual Engineering Projects
On the demerger of Pacific Power Corporation RBMC became the parent entity of a wholly owned subsidiary company Pacific Power (Subsidiary No1) Pty Ltd This private company was involved in commercial engineering procurement and construction management projects pertaining to a number of power plants in Queensland Pacific (Subsidiary No1) Pty Limited was wound up and deregistered as a solvent entity on the 301
h of September 2010
Investment in Pacific Solar Pty Limited
On the demerger of Pacific Power Corporation RBMC also became the parent entity of a majority controlled subsidiary company Pacific Solar Pty Limited During the year the Board resolved to buy back all minority shareholders of the Company The buy-back process was completed on 24 February 2012 and Pacific Solar became a fully owned subsidiary of RBMC Pacific Solar was then deregistered as a solvent entity on 9 May 2012 During the year Pacific Solar declared and paid an unfranked dividend of $67039653 in favour of RBMC being the sum of all remaining cash and reserves in the Company
CODE OF CONDUCT
Pacific Powers Code of Conduct is still in place and the Code is still considered to be appropriate in its current form
CONSULTANT FEES
During the financial year ended 30 June 2012 the RBMC Group incurred consultant expenses of $3138006 (2011 $1183474) paid to three consultants (2011 two consultants)
Consultants assist in the operational running of RBMC and its subsidiary companies The use of consultants best and most efficiently manages the residual business activities of the RBMC Group
CONSUMER RESPONSE
Until 9 May 2012 subsidiary company in the RBMC Group interfaced with the community mainly through general business dealings and warranty services RBMC puts the customer first and the Corporation insists on ethical behaviour when dealing with consumers service providers and the community
CORPORATE STRUCTURE
All RBMC governance power vests with its General Manager and under the Act he is responsible to the NSW State Treasurer and as applicable the nominated Minister Mr Andrew d Apice held this position until 31 August 2012 He was appointed in 2004
The General Managers role and duties are defined in the Act Mr d Apice had international private sector Managing Director experience By resolution Mr d Apice had agreed to accept the supervision of delegates nominated by the Treasurer Crown Asset Liability Management was the entity that provided this supervision the supervision being primarily an interface between RBMC and NSW Treasury NSW Treasury represented the Treasurer Mr Dominic Schuster of NSW Treasury replaced Mr dApice on 1 September 2012 and he remains the current RBMC General Manager
3
RESIDUAL BUSINESS MANAGEMENT CORPORATION GROUP
STATUTORY INFORMATION 2012 (continued)
CORPORATE STRUCTURE (continued)
The key operating subsidiary of the Group during the year was Pacific Solar Pty Limited which was wound up and deregistered as a solvent entity on 9 May 2012 The other former subsidiary Pacific Power (Subsidiary NoI) Pty Ltd was wound up and deregistered as a solvent entity on 30 September 2010 Pacific Solar was a private sector company with an independent Board Its former nonshyexecutive chairman was appointed and part funded by RBMC The Pacific Solar former nonshyexecutive chairman reported to the General Manager and he was responsible for the supervision of the governance functions of Pacific Solar Pacific Solars governance power vested with its former Board of Directors until 24 February 2012 when the Board resigned and the RBMC General Manager then remained as the sole Director
The General Manager was supported by Mr Mark Guest as the RBMC Corporation Secretary amp Comptroller
Mr Guest was also the former Executive Officer amp Company Secretary of Pacific Solar He was appointed to this role in 2004 Under the supervised delegation of the Pacific Solar Board Mr Guest was responsible for the operational and financial activities of Pacific Solar
COST OF ANNUAL REPORT AND PUBLICATIONS
The 2011 Annual Report for the Residual Business Management Group was published in 2012 and it is available to the public on request It was not produced as a marketing document and accordingly any printing costs were negligible
CREDIT CARD USAGE
RBMC has no corporate credit cards on issue Pacific Solars corporate credit card facility was used solely by its former chairman for business purposes and all expenditure was subject to independent analysis review and authorisation This credit card facility was cancelled immediately after the resignation of the former Chairman
ENERGY MANAGEMENT PROGRAM
The RBMC Group has reduced its electricity consumption through the efficient conduct of its operations The head office is a shared arrangement located in the energy sustainable suburb of Newington near Sydney Olympic Park The business is conducted in a manner that minimises negative environmental impact Newington is a bike and pedestrian friendly environment
4
RESIDUAL BUSINESS MANAGEMENT CORPORATION GROUP
STATUTORY INFORMATION 2012 (continued)
FRAUD AND CORRUPTION PREVENTION
Throughout the financial year the RBMC Group continued its strong commitment to fraud and corruption prevention through maintaining strong corporate governance and the segregation of key duties
No reports of suspected corruption maladministration and serious and substantial waste were received during the year and as is mentioned above the results of the annual internal audit were favourable
FREEDOM OF INFORMATION
Residual Business Management Corporation processed no formal Freedom of Information applications during the period 1 July 2011 to 30 June 2012 but a number of former employees and contractors regularly seek clarification of past Pacific Power Corporation matters
The organisations compliance with the Government Information (Public Access) Act 2009 did not raise any major issues during the reporting period
FUNDS GRANTED TO NON-GOVERNMENT COMMUNITY ORGANISATIONS
There were no funds granted during the period 1 July 2011 to 30 June 2012 or during the prior year
INTERNET DETAILS
RBMCs website is located at wwwpacificpowernswgovau
MINISTER
RBMC is a special purpose corporation that reports to and is ultimately controlled by the NSW Treasurer under the relevant ministers delegation
OCCUPATIONAL HEALTH AND SAFETY PERFORMANCE
For the twelve month rolling period ending 30 June 2012 there were no lost time injuries
ENVIRONMENTAL REGULATION AND RECYCLING PERFORMANCE
The RBMC Groups corporate environmental policy goals objectives and targets and the associated management program are aligned with community expectations
RBMC has not been the subject of prosecution in respect of its performance under any regulations during the reporting period and no prosecutions are known to be pending RBMC is committed to responsible waste management and recycles the following
toner cartridges and all waste paper-based materials
5
RESIDUAL BUSINESS MANAGEMENT CORPORATION GROUP
STATUTORY INFORMATION 2012 (continued)
PERFORMANCE STATEMENTS
As at 30 June 2012 there were no CES and SES Level 5 personnel and accordingly the disclosure of performance statements is not applicable
PRIVACY AND PERSONAL INFORMATION
RBMCs processes for managing staff information meet the principles of the Privacy and Personal Information Act 1998
PROGRAM EVALUATION RESULTS
Business Plans and Performance Processes are in place and are used to measure results against overall strategic objectives
RISK MANAGEMENT AND INSURANCE
Insurable risks are covered by a program of self-retained risk and external insurance Risk management is the responsibility of all levels of management within the RBMC Group
SENIOR EXECUTIVE SERVICE STAFF NUMBERS AND SUPERANNUATION
The RBMC Group has one remaining direct employees being its General Manager The former Pacific Solar Executive Officer amp Secretary is a contract executive He employs three full-time employees that are considered indirect part-time RBMC employees At 30 June 2012 RBMC was responsible for the superannuation obligations of 46 (2011 45) former employees The gross calculated defined benefit superannuation liability with respect of these former employees at 30 June 2012 was $32SM (2011 $236M) Superannuation funds invested to cover this liability amounted to $209M at 30 June 2012 (2011 $224M)
TIME FOR PAYMENT OF ACCOUNTS
The RBMC Group seeks to pay all undisputed accounts on time During the financial year ending 30 June 2012 and prior all accounts properly received were paid in a timely manner
THE COMMUNITY RELATIONS COMMISSION AND PRINCIPLES OF MULTICULTURALISM STATEMENTS
RBMC exists as a special purpose risk management entity whose operations are subject to legislative restrictions Our primary purpose is to manage the residual assets liabilities and risks arising as part of the NSW Governments energy reform processes that have not been transferred to other State Corporations
Our Corporation understands and is strongly committed to supporting the NSW Governments legislated principles of multiculturalism
We wish to never forget those who served and died at war to protect our Nation our democracy and our fair-go culture
End of the statutory report
6
THE 2012 FINANCIAL REPORT
Start of audited financial statements - 2012
RESIDUAL BUSINESS MANAGEMENT CORPORATION GROUP STATEMENT OF COMPREHENSIVE INCOME FOR THE YEAR ENDED 30 JUNE 2012
Consolidated Parent Entity
Note 2012 2011 2012 2011
$000 $000 $000 $000
Continuing operations
Sale of goods 15 9
Rental income 7
Revenue 15 16
Cost of sales (29) ( 41)
Gross profit (14) (25)
Other revenue 3(a) 628 792 1259 11682
Other income 3(b) 813 629 823 629
Depreciation and amortisation 4(a) (9) (7)
Occupancy expenses 4(b) (23) (31)
Administrative expenses 4(c) (535) (579) (347) (366)
Other expenses 4(d) (31) (230) (760) (259)
Net (loss) I gain on sale of investments (159) 36 (159) (3)
Profit I (loss) from continuing operations before 670 585 816 11683 income tax Income tax expense 5(a)
Profit I (loss) from continuing operations after income tax 670 585 816 11683
Net profit I (loss) for the year 670 585 816 11683
Other comprehensive income Actuarial (loss) I gain on defined benefit plans 27(b) (11036) 122 (11036) 122
Other comprehensive (losses) I income for the year (11036) 122 (11036) 122
Total comprehensive (loss) income for the year (10366) 707 (10220) 11805
Profit I (loss) for the year is attributed to Non-controlling interest (146) (143)
Owners of the parent 816 728 816 11683
670 585 816 11683
Total comprehensive (loss) I income for the year is attributed to Non-controlling interest (until 9 May 2012) (146) (143)
Owners of the parent (10220) 850 (10220) 11805
(10366) 707 (10220) 11805
The statement of comprehensive income is to be read in conjunction with the notes to the financial statements
7
RESIDUAL BUSINESS MANAGEMENT CORPORATION GROUP STATEMENT OF FINANCIAL POSITION AS AT 30 JUNE 2012
Consolidated Parent Entity Note 2012 2011 2010 2012 2011 2010
Restated Restated Restated Restated $000 $000 $000 $000 $000 $000
Current assets Cash and cash equivalents 6 1041 1500 2033 1041 89 357 T Corp Hour-Glass cash facility 7 10240 12075 12624 10240 11993 1493 Trade and other receivables 8 26 49 1 26 268 Inventories 9 12 174 Other current assets 44 4
Total current assets 11307 13636 14876 11307 12350 1854 Non-current assets
Trade and other receivables 10 7 7 Financial assets at fair value Other intangibles assets Property plant and equipment
11 12 13 623 632
10
638 623
760
623
1232
623
Total non-current assets 623 639 655 623 1383 1855
Total assets 11930 14275 15531 11930 13733 3709 Current liabilities
Trade and other payables 14 43 14 10 43 34 Provisions 35
Total current liabilities 43 14 45 03 Non-current liabilities
Superannuation liability 15 11575 1201 1948 11575 1201 1948
Total non-current liabilities 11575 1201 1948 11575 1201 1948
Total liabilities 11618 1215 1993 11618 1201 1982 Net assets 312 13060 13538 312 12532 1727
Equity Parent equity interest
Issued capital Asset revaluation reserve 13b 623 623 623 623 623 623 Retained earnings 24 311 11909 12059 311 11909 1104
Total parent interest 312 12532 12682 312 12532 1727
Total non-controlling interest 25 856 856 Total eguity 312 13060 13538 312 12532 1727
See Notes 2 and 13
The statement of financial position is to be read in conjunction with the notes to the financial statements
8
34
RESIDUAL BUSINESS MANAGEMENT CORPORATION GROUP STATEMENT OF CHANGES IN EQUITY FOR THE YEAR ENDED 30 JUNE 2012
Consolidated 2012 Asset Retained Owners of the Non-controlling Total revaluation reserve earnings parent interest equity
$000 $000 $000 $000 $000
At 1 July 2011 623 11909 12532 528 13060
Profit for the period - 816 816 (146) 670
Other comprehensive income I (loss) - (11036) (11036) - (11036)
Total comprehensive income I (loss) - (10220) (10220) (146) (10366)
Transactions with owners in their capacity as owners Dividend paid - (2000) (2000) - (2000)
Share buy-back - shy - (382) (382)
At 30 June 2012 623 (311) 312 - 312
Consolidated 2011 Asset Retained Owners of the Non-controlling Total revaluation reserve earnings parent interest equity
$000 $000 $000 $000 $000
At 1 July 2010 - 12059 12059 856 12915
Net effect ofa correction of an error 623 shy 623 - shyRestated balance as at 1 July 2010 623 12059 12682 856 13538
728 (143) 585Profit for the period - 728
Other comprehensive income I (loss) - 122 122 - 122
Total comprehensive income I (loss) - 850 850 (143) 707
Transactions with owners in their capacity as owners Dividend paid - (1000) (1000) - (1000)
Share buy-back - shy - (185) (185)
At 30 June 2011 623 11909 12532 528 13060
Parent 2012 Asset Retained Owners of the Total revaluation reserve earnings parent equity
$000 $000$000 $000
At 1 July 2011 623 11909 12532 - 12532
Profit for the period - 816 816 - 816
(11036) - (11036)Other comprehensive income I (loss) - (11036)
(10220) - (10220)Total comprehensive income I (loss) - (10220)
(2000) - (2000)Dividend paid - (2000)
312 - 312At 30 June 2012 623 (311)
Owners of the TotalParent 2011 Asset revaluation Retained parent equityreserve earnings
$000 $000$000 $000
1104 - 1104At 1 July 2010 - 1104
- - 623Net effect of a correction of an error 623 shy1104 1727Restated balance as at 1 July 2010 623 1104
11683 - 11683Profit for the period - 11683
122 - 122Other comprehensive income I (loss) - 122
11805 - 11805Total comprehensive income I (loss) - 11805
(1000) - (1000)Dividend paid - (1000)
12532 - 12532At 30 June 2011 623 11909
The statement of changes in equity is to be read in conjunction with the notes to the financial statements
9
RESIDUAL BUSINESS MANAGEMENT CORPORATION GROUP STATEMENT OF CASH FLOWS FOR THE YEAR ENDED 30 JUNE 2012
Cash flows from operating activities Receipts from customers (inclusive of goods and services tax) Payments to suppliers and employees (inclusive of goods and services tax) Payments for inventory and related costs Rent received Interest received Increase (decrease) in operating liabilities
Net intra-group loans and advances
Note 2012 $000
Inflows Outflows
69
(626)
653
Consolidated 2011
$000 Inflows
(Outflows)
70
(742)
7 786
Parent Entity 2012 2011
$000 $000 Inflows Inflows
Outflows (Outflows)
24 30
(325) (368)
573 689
(57
Net cash inflow( outflow) from operating activities 16(a) 96 121 272 294
Cash flows from investing activities Proceeds from the sale of non-current assets Dividends received Investments acquired Investments redeemed Proceeds from disposal of investments Purchase of property plant amp equipment
(773) 2600
(11682) 12213
670 (805) 2550
265
10993 (11675)
1120
Net cash inflow(outlow) from investing activities 1827 531 2680 438
Cash flows from financing activities Dividends paid Share buy-back (paid to minorities)
(2000) 382
(1000) (185)
(2000) (1000)
Net cash inlow(outflow) from financing activities 2382 (1185) 2000 (1000)
Net increase( decrease) in cash amp cash equivalents held (459) (533) 952 (268)
Cash and cash equivalents at the beginning of the financial year 1500 2033 89 357
Cash and cash equivalents at the end ofthe year 16(b) 1041 1500 1041 89
The statement of cash flows is to be read in conjunction with the notes to the financial statements
10
RESIDUAL BUSINESS MANAGEMENT CORPORATION GROUP
NOTES TO THE FINANCIAL STATEMENTS for Year Ended 30 June 2012
Note 1 - Summary of significant accounting policies
The Residual Business Management Corporation Group (the Group) is a special purpose for-profit entity incorporated and domiciled in Australia The financial statements of the Group for the year ended 30 June 2012 were authorised for issue by the General Manager on the sixth day of May 2014
(a) Statement of compliance
The financial statements have been prepared to comply in all material respects with the directives of the NSW Treasurer Australian Accounting Standards and interpretations issued by Australian Accounting Standard Board
(b) Basis ofpreparation
The financial statements are general purpose financial statements which have been prepared in accordance with
bull applicable Australian Accounting Standards (which include Australian Accounting Interpretations)
bull the requirements of the Public Finance and Audit Act 1983 (as amended) and bull the requirements of the Public Finance and Audit Regulation 2010
The financial statements have been prepared on the historical cost basis except for the following assets and liabilities that are stated at their fair value derivative financial instruments financial instruments held for trading financial instruments classified as available-for-sale and investment property Any non-current assets which are held for sale are stated at the lower of carrying amount and fair value less costs to sell
The report of the subsidiary Pacific Solar has been prepared on a liquidation basis and its assets and liabilities are measured and recorded at their recoverable amount
The financial statements are presented in Australian dollars Amounts in the financial statements have been rounded off to the nearest thousand dollars unless otherwise stated
(c) Basis ofconsolidation
The consolidated financial statements comprise the financial statements of Residual Business Management Corporation (RBMC) as at and for the year ended 30 June 2012 Interests in associates are equity accounted and are not part of the consolidated Group Subsidiaries are all those entities over which the Group has the power to govern the financial and operating policies so as to obtain benefits from their activities The existence and effect of potential voting rights that are currently exercisable or convertible are considered when assessing whether a group controls another entity
Except for Pacific Solar Pty Ltd the financial statements of the group are prepared for the same reporting period as the parent company using consistent accounting policies In preparing the consolidated financial statements all intercompany balances and transactions income and expenses and profit and losses resulting from intra-group transactions have been eliminated in full
Subsidiaries and special purpose entities are fully consolidated from the date on which control is obtained by the Group and cease to be consolidated from the date on which control is transferred out of the Group
11
RESIDUAL BUSINESS MANAGEMENT CORPORATION GROUP
NOTES TO THE FINANCIAL STATEMENTS for Year Ended 30 June 2012
Note 1-Summary of significant accounting policies (continued)
(c) Basis ofconsolidation (continued)
Investments in subsidiaries held by RBMC are accounted for at cost in the separate financial statements of the parent entity less any impairment charges Dividends received from subsidiaries are recorded as a component of other revenues in the separate income statement of the parent entity and do not impact the recorded cost of the investment Upon receipt of dividend payments from subsidiaries the parent will assess whether any indicators of impairment of the carrying value of the investment in the subsidiary exist Where such indicators exist to the extent that the carrying value of the investment exceeds its recoverable amount an impairment loss is recognised as a net fair value loss on an available-for-sale financial asset in the comprehensive income section of the statement ofcomprehensive income
The acquisition of subsidiaries is accounted for using the acquisition method of accounting The acquisition method of accounting involves recognising at acquisition date separately from goodwill the identifiable assets acquired the liabilities assumed and any non-controlling interest in the acquiree The identifiable assets acquired and the liabilities assumed are measured at their acquisition date fair values The difference between the above items and the fair value of the consideration (including the fair value of any pre-existing investment in the acquiree) is goodwill or a discount on acquisition
(d) Significant accountingjudgments estimates and assumptions
The preparation of the financial statements in conformity with the Australian Accounting Standards requires management to make judgments estimates and assumptions that affect the application of policies and reported amounts of assets and liabilities income and expenses The estimates and associated assumptions are based on historical experience and various other factors that are believed to be reasonable under the circumstances the results of which form the basis of making the judgments about carrying values of assets and liabilities that are not readily apparent from other sources Actual results may differ from these estimates
(e) Revenue and expense recognition
Revenue is recognised to the extent that it is probable that the economic benefits will flow to the Group and the revenue can be reliably measured Where amounts do not meet these recognition criteria they are deferred and recognised in the period in which the recognition criteria are met Revenues are recognised at the fair value of the consideration received for the sale of goods and services net of the amount of Goods and Services Tax and rebates Revenue and expenses are recognised for the major business activities as follows
Interest revenue
Interest revenue is recognised as it accrues taking into account the effective yield on the financial asset
Unrealised gains I losses
Unrealised gains or losses on the Hour-Glass investment Facilities are recognised to reflect the current fair value of the investment Those unrealised gains will be deducted from other comprehensive income in the period in which the realised gains I losses are recognised in the statement of comprehensive income
12
RESIDUAL BUSINESS MANAGEMENT CORPORATION GROUP
NOTES TO THE FINANCIAL STATEMENTS for Year Ended 30 June 2012
Note 1-Summary of significant accounting policies (continued)
(f) Goods and services tax
Revenues expenses and assets are recognised net of the amount of goods and services tax (GST) except where the amount of GST incurred is not recoverable from the Australian Tax Office (ATO) In these circumstances the GST is recognised as part of the cost of acquisition of the asset or as part of the expense Receivables and payables are stated with the amount of GST included The net amount of GST recoverable from or payable to the ATO is included as a current asset or liability in the Statement of Financial Position Cash flows are included in the Statement of Cash Flows on a gross basis The GST components of cash flows arising from investing and financing activities which are recoverable from or payable to the A TO are classified as operating cash flows
(g) Income tax
Income tax on the statement of comprehensive income for the periods represented comprises current and deferred tax Income tax is recognised except to the extent that it relates to items recognised directly in equity in which case it is recognised in equity
Current tax is the expected tax payable on the taxable income for the year using tax rates enacted or substantially enacted at the date of the balance sheet and any adjustment to tax payable in respect of previous years
Deferred tax is provided using the balance sheet liability method providing for temporary differences between the carrying amounts of assets and liabilities for financial reporting and the amounts used for taxation purposes The amount of deferred tax provided is based on the expected manner of realisation or settlement of the carrying amount of assets and liabilities using tax rates enacted or substantially enacted at the date of the balance sheet
A deferred tax asset is recognised to the extent that it is probable that future taxable profits will be available against which the asset can be utilised Deferred tax assets are reduced to the extent that it is no longer probable that the related tax benefit will be realised
RBMC and its previously controlled subsidiary Pacific Solar Pty Limited formed an tax consolidated group for OSR purposes on 24 February 2012 when Pacific Solar Pty Limited became a wholly-owned subsidiary of RBMC as a result of the buy-back of all minority shares Upon consolidation all of Pacific Solar Pty Limiteds tax losses were acquired by RBMC at the available statutory fraction The resulting deferred tax asset is not recognised in the RBMC Group because recovery is not certain
(h) Trade and other receivables
Trade debtors and other receivables are stated at their amortised cost less any identified impairment losses Impairment charges are brought to account as described in Note l(m)
(i) Cash and cash equivalents
For purposes of the Statement of Cash Flows cash includes cash balances deposits at call with financial institutions and other highly liquid investments with short periods to maturity which are readily convertible to cash on hand and are subject to an insignificant risk of changes in value net of outstanding bank overdrafts Cash management trust holdings are disclosed as a current financial asset Movements in Group intercompany balances backed by available cash reserves are treated as cash flows Such cash movements are eliminated on consolidation
13
RESIDUAL BUSINESS MANAGEMENT CORPORATION GROUP
NOTES TO THE FINANCIAL STATEMENTS for Year Ended 30 June 2012
Note 1-Summary of significant accounting policies (continued)
(j) Acquisitions ofassets
Items of plant and equipment are initially recorded at cost being the fair value of the consideration provided plus incidental costs directly attributable to the acquisition and where relevant the initial estimate of the costs of dismantling and removing the items and restoring the site on which they are located and non-specialised assets with short useful lives are measured at depreciated historical cost as a surrogate for fair value Any individual items that have a fair value of less than $500 are expensed during the year in which the expenditure is incurred Items of property plant and equipment are depreciated and amortised as described in Note l(k) All repairs and maintenance are charged to the statement of comprehensive income during the financial period in which they are incurred
(k) Depreciation ofplant and equipment
Depreciation is charged to the statement of comprehensive income on a straight-line basis over the estimated useful life of each part of an item of property plant and equipment taking into account estimated residual values Assets are depreciated or amortised from the date of acquisition
The residual values and useful lives of the assets are reviewed and the depreciation and amortisation rates and methods adjusted if appropriate on an annual basis When these changes are made the adjustments are reflected prospectively in current and future periods only
The depreciation rates used for each class of asset (in both the current and prior year) are as follows
Asset class Rate Method
Plant and equipment 20 Straight-line
(l) Sale ofnon-current assets
Non-current assets sold during the year
In the course of its continuing activities other transactions (including the sale of non-current assets such as investments and operating assets) may be undertaken that are incidental to the main revenue generating activities of the Group The results of such transactions are presented by netting the sale proceeds on disposal less selling cost and the carrying value of the asset at the date control of the asset passes to the buyer
(m) Impairment
The Group assesses asset impairment at each reporting date by evaluating conditions specific to the Group that may lead to the impairment of assets Where an impairment trigger exists the recoverable amount of the asset is determined Value-in-use calculations performed in assessing recoverable amounts incorporate a number of key estimates
No additional impairment with respect of the Groups intangible and contract receivable assets has been recognised in the financial year ending 30 June 2012 (2011 $Nil)
14
RESIDUAL BUSINESS MANAGEMENT CORPORATION GROUP
NOTES TO THE FINANCIAL STATEMENTS for Year Ended 30 June 2012
Note 1-Summary of significant accounting policies (continued)
(m) Impairment (continued)
Calculation of recoverable amount
The recoverable amount of receivables is calculated as the present value of the estimated future cash flows discounted at the original effective interest rate (being the pre-tax rate that reflects the current market assessment of the time value of money) Receivables with a short duration are not discounted
Impairment of receivables is not recognised until objective evidence is available that an impairment event has occurred Significant receivables are individually assessed for impairment The recoverable amount of other assets is the greater of their fair value less costs to sell and value in use In assessing value in use the estimated future cash flows are discounted to their present value using a pre-tax discount rate that reflects current market assessments of the time value of money and the risks specific to the asset For an asset that does not generate largely independent cash inflows the recoverable amount is determined for the cash-generating unit to which the asset belongs
Reversals of Impairment
An impairment loss in respect of a receivable carried at recoverable amount is reversed if the subsequent increase in recoverable amount can be related objectively to an event occurring after the impairment loss was recognised
In respect of other assets an impairment loss is reversed if there has been a change in the estimates used to determine the recoverable amount An impairment loss is reversed only to the extent that the carrying amount of the asset does not exceed the carrying amount that would have been determined net of depreciation and amortisation if no impairment loss had been recognised
(n) Trade and other payables
Payables are stated at amortised cost and represent liabilities for goods and services provided to the Group prior to the end of the financial period and which are unpaid The amounts are unsecured and are usually paid within 30 days ofrecognition
(o) Intangibles
Prior to the current year the Group had assessed its acquired non -thin film intellectual property to be impaired so a full impairment provision had been recognised The Group has reviewed the recoverability of its royalty receivable right from CSG Solar AG The continued insolvency of this German company that acquired the Groups thin film intellectual property has meant the termination of the Groups rights in relation to this intellectual property The Group is awaiting the liquidation distribution but the Group is expecting no material return
(p) Inventories
Inventories held for distribution are stated at cost adjusted when applicable for any loss of service potential A loss of service potential is identified and measured based on the existence of a current replacement cost that is lower than the carrying amount Inventories (other than those held for distribution) are stated at the lower of cost and net realisable value Cost is calculated using the weighted average cost or first in first out method The cost of inventories acquired at no cost or for nominal consideration is the current replacement cost as at the date of acquisition Current replacement cost is the
15
RESIDUAL BUSINESS MANAGEMENT CORPORATION GROUP
NOTES TO THE FINANCIAL STATEMENTS for Year Ended 30 June 2012
Note 1-Summary of significant accounting policies (continued)
(p) Inventories (continued)
cost the Group would incur to acquire the asset Net realisable value is the estimated selling price in the ordinary course of business less the estimated costs of completion and the estimated costs necessary to make the sale However on the basis that it was more likely than not that the Group would dispose of the inventories of Pacific Solar on a wind-up basis rather than as part of business operations conducted by the Group the net realisable value of inventory at 30 June 2011 had been reduced by $15530814 to $1179155 the fire-sale value established by an independent valuation at 30 November 2011 During the current financial year the now wound-up subsidiary sold all remaining inventory at the best achievable price and warranty outcome
(q) Investments
Investments in unlisted companies are reviewed annually and are carried at their cost of acquisition Shares in subsidiary companies are included at their cost of acquisition and are eliminated on consolidation
The Hour-Glass Investment Facilities are recognised at fair value through profit or loss using the second leg of the fair value option The unrealised movement in the fair value of the Hour-Glass Investment Facilities is reported in the line item Other income
(r) Dividend calculation
Dividends are calculated with reference to the TPP 02-3 Financial Distribution Policy for Government Businesses In 2012 a dividend of $200000000 was paid to NSW Treasury (2011 $100000000)
(s) Dividend policy
The Corporation pays dividends out of surplus funds in a manner that is considered prudent and in a quantum that will not prejudice the interests of the Corporation or its creditors
(t) Superannuation defined benefits
The Corporation recognises the net deficiency in its defined benefit superannuation funds as is calculated by the NSW Treasury appointed actuary
Actuarial gains or losses are recognised in other comprehensive income (directly through retained earnings) in the reporting period in which they occur
(v) Property
RBMCs property accounting policy is to recognise the fair value of the property it controls The value of RBMC s property is established at the end of each financial year based on the best information then available Revaluation increments are credited directly to asset revaluation reserve except that to the extent that an increment reverses a revaluation decrement in respect of that asset previously recognised as an expense in the profit or loss the increment is recognised immediately as revenue in the profit or loss Revaluation decrements are recognised immediately as expenses in the profit or loss except that to the extent that a credit balance exists in the asset revaluation reserve in respect of the asset they are debited directly to the asset revaluation reserve
16
RESIDUAL BUSINESS MANAGEMENT CORPORATION GROUP
NOTES TO THE FINANCIAL STATEMENTS for Year Ended 30 June 2012
Note 2 -Correction ofPrior Period Errors
(a) Superannuation
The Group had previously recognised all gains and losses including actuarial gains and losses for the year in its defined benefit superannuation funds as an item of other comprehensive gains I (losses) in its statement of other comprehensive income AASB 119 Sections 93A and 93B allow only defined benefit actuarial superannuation gains and losses to be recognised in other comprehensive income
To correct this error the Statement of Comprehensive Income as at 30 June 2011 for the comparative year were restated as follows
bull Other income was increased by $625000 and bull Actuarial gain on defined benefit plans was decreased by $625000
Restatement of Financial Statements as a Result of Change in Accounting Policy
30 June 2011 Comparative year Original Change in Accounting Restated Policy Adj
Financial Report Line Item 2011 2011 2011 2011 2011 2011 I Balance Affected $000 $000 $000 $000 $000 $000
Consolidated Parent Consolidated Parent Consolidated Parent Entity Entity Entity
Statement of Com[rehensive Income Extract Other income 4 4 625 625 629 629 Profit I (loss) from continuing operations
(40) 11058 625 625 585 11683 before income tax Profit I (loss) from continuing operations
(40) 11058 625 625 585 11683 after income tax
Other comprehensive income Actuarial (loss) I gain on defined benefit plans
Total comprehensive income for the year 747 747
747 747
(625) (625)
(625) (625)
122 122
122 122
Profit I (loss) for the year is attributed to Owners of the parent 103 11058 625 625 728 11683
Note 3 - Other revenue and income Extract (b) Other income Superannuation gain on defined benefit schemes 625 625 625 625
Total other income 4 4 625 625 629 629
17
RESIDUAL BUSINESS MANAGEMENT CORPORATION GROUP
NOTES TO THE FINANCIAL STATEMENTS for Year Ended 30 June 2012
Note 2 -Correction of Prior Period Errors (continued)
(b) Correction of a Prior Period Error
In October 2012 RBMC determined it still retained some land parcels in the past former names ofRBMC The total land parcel value at 30 June 2012 was determined by Management based on independent valuation to be $2123000 However RBMC has established that $1500000 worth of its land is controlled by a Local Government entity and has not recognised it in the statement of financial position in either the current or prior years Due to the aforementioned land parcels RBMC has booked a prior period error correction to its statement of financial position It has recognised the value of the land parcels that it presently controls
As this error was made in a financial year prior to the comparative year the Statement of Financial Position opening balances as at 30 June 2010 were restated as follows
bull Property plant and equipment was increased by $623000 to recognise the land that were not previously recognised in RBMCs financial statement This increase to property plant and equipment was made up as follows
o Land by $623000 bull Asset revaluation reserve was increased by $623000 which was made up as follows
o An increase of $623000 for the land asset revaluation reserve and bull Total parent interest was increased by $623000
The same correction was made to the statement of financial position at 30 June 2011 Namely
bull Land increased by $623000 bull The asset revaluation reserve was increased by $623000 which was made up as follows
o An increase of $623000 for the land asset revaluation reserve and bull Total parent interest was increased by $623000
Note (b) continues on the following page
18
RESIDUAL BUSINESS MANAGEMENT CORPORATION GROUP
NOTES TO THE FINANCIAL STATEMENTS for Year Ended 30 June 2012
Note 2 -Correction of Prior Period Errors (continued)
(b) Correction of a Prior Period Error (continued)
Restatement of Financial Statements as a Result of Correction of an Error
30 June 2011 Comparative year Original Correction of Error Restated Adj
Financial Report Line Item 2011 2011 2011 2011 2011 2011 I Balance Affected $000 $000 $000 $000 $000 $000
Consolidated Parent Consolidated Parent Consolidated Parent Entity Entity Entity
Statement of Financial Position Extract
Non-current assets Pro2erty 2lant and egui2ment 9 623 623 632 623
Total non-current assets 16 760 623 623 639 1383
Total assets 13652 13110 623 623 14275 13733
Net assets 12437 11909 623 623 13060 12532
Equity Parent equity interest
Asset revaluation reserve 623 623 623 623 Total ~arent interest 11909 11909 623 623 12532 12532
Total equity 12437 11909 623 623 13060 12532
Statement of Changes in Equity Extract
Opening Balance Asset revaluation reserve 623 623 623 623
Note 13 Property Plant and Equipment Extract
Total depreciated value property amp equip 9 623 623 632 623
a) Reconciliation of written down value of asset classes Non-current Land at fair value Plant and equipment - at fair value Accumulated depreciation Total depreciated value of plant and equipment
34 (25)
9
623
623
623
623
623 34
(25) 632
623
623
b) Movement in the property asset revaluation reserve
Asset revaluation reserve carried forward Asset Revaluation Reserve balance 30 June
623 623
623 623
623 623
623 623
19
RESIDUAL BUSINESS MANAGEMENT CORPORATION GROUP
NOTES TO THE FINANCIAL STATEMENTS for Year Ended 30 June 2012
Note 2 - Correction of Prior Period Errors (continued)
Restatement of Financial Statements as a Result of Correction of an Error (continued)
1 July 2010 (Comparative year opening balances) Original Correction of Error Restated Adj
Financial Report Line Item I 2010 2010 2010 2010 2010 2010 Balance Affected
$000 $000 $000 $000 $000 $000 Consolidated Parent Consolidated Parent Consolidated Parent
Entity Entity Entity Statement of Financial Position Extract
Non-current assets ProQerty Qlant and eguiQment 15 623 623 638 623
Total non-current assets 32 1232 623 623 655 1855
Total assets 14908 3086 623 623 15531 3709
Net assets 12915 1104 623 623 13538 1727
Equity Parent equity interest
Asset revaluation reserve 623 623 623 623 Total Qarent interest 12059 1104 623 623 12682 1727
Total equity 12915 1104 623 623 13538 1727
Note 13 Pro~ertv2 Plant and Egui~ment Extract
Total depreciated value property amp equip 15 623 623 638 623
a) Reconciliation of written down value of asset classes Non-current Land at fair value Plant and equipment - at fair value Accumulated depreciation Total depreciated value of plant and equipment
34 (19)
15
623
623
623
623
623 34
(19) 638
623
623
b) Movement in the property asset revaluation reserve
Asset revaluation reserve carried forward Asset Revaluation Reserve balance 30 June
623 623
623 623
623 623
623 623
20
RESIDUAL BUSINESS MANAGEMENT CORPORATION GROUP
NOTES TO THE FINANCIAL STATEMENTS for Year Ended 30 June 2012
Consolidated Parent Entity 2012 2011 2012 2011
$000 $000 $000 $000 Note 3 - Other revenue and income
(a) Other revenue Interest received or receivable 628 792 589 689 Dividend from controlled entity 670 10993 Total other revenue 628 792 1259 11682
(b) Other income Revaluation gain on T Corp units 151 151 Reimbursements 10 Insurance premium refunds 4 4 Superannuation gain on defined benefit schemes 662 625 662 625 Total other income 813 629 823 629
Excludes superannuation actuarial losses of $11035456 (2010 gains of $122125) included in other comprehensive income (Refer notes 27(b) and 24)
Note 4 - Expenses
(a) Depreciation amp amortisation 9 7
(b) Occupancy expenses Operating lease rental expense 23 31
(c) Administrative expenses Auditors remuneration 88 66 65 44 Directors remuneration 123 135 82 67 Document storage 1 50 1 50 Insurance premiums 77 120 58 97 Business Manager 170 155 101 72 Travel 1 16 1 Other sundry costs 75 37 39 36 Total administrative expenses 535 579 347 366
(d) Other expenses Revaluation loss on financial assets 53 53 Impairment loss of subsidiary 760 206 Revaluation of inventory 155 Revaluation loss of non-current investment 10 Consultant fees 31 12 Total other expense 31 230 760 259
21
RESIDUAL BUSINESS MANAGEMENT CORPORATION GROUP
NOTES TO THE FINANCIAL STATEMENTS for Year Ended 30 June 2012
Consolidated Parent Entity 2012 2011 2012 2011
$000 $000 $000 $000 Note 5 - Income tax expense
(a) The prima facie tax payable on profit from ordinary activities before income tax is reconciled to the income tax expense as follows Operating profit before income tax 670 585 816 11683 Prima facie tax benefit on losses from ordinary activities before income tax at 3 0 (2011 3 0) Economic entity 201 176 Parent entity 245 3505 Add Tax effect ofnon-deductible items Sundry items 1 2 Less Tax effect of Tax losses (utilised) not brought to account 202 (178) 245 (3505) Income tax expense equivalent
Deferred tax assets not brought to account
(b) The deferred tax asset arising from the following tax losses and timing differences has not been recognised as an asset because recovery is not probable
Unused tax losses for which no deferred tax asset has been recognised 23170 29414 23170 19029 Unused capital losses for which no deferred tax asset has been recognised 1058 1058
24228 29414 24228 19029 Potential deferred tax assets at 30 not brought to account 7268 8824 7268 5709
Note 6 - Current assets - cash and cash equivalents
Cash at bank 1041 1500 1041 89 Total cash amp cash equivalents 1041 1500 1041 89
For reconciliation of cash and cash equivalents to the Statement of Cash Flows refer to Note 16 (b)
Note 7 - Current assets -T Corp Hour-Glass cash facility
T Corp Hour-Glass cash facility 10240 12075 10240 11993 Total T Corp Hour-Glass cash facility 10240 12075 10240 11993
22
RESIDUAL BUSINESS MANAGEMENT CORPORATION GROUP
NOTES TO THE FINANCIAL STATEMENTS for Year Ended 30 June 2012
Consolidated Parent Entity 2012 2011 2012 2011
$000 $000 $000 $000 Note 8 - Current assets- trade and other receivables Trade debtors I I Other debtors 10 6 10 I Interest receivable 16 42 16 I Other 265 Total trade and other receivables 26 49 26 268
Note 9 - Current assets - inventories
Finished goods - at lower of cost or realisable value 12 Total current assets - inventories 12
Note 10 - Non-current - trade and other receivables Deposits 7 Total trade and other receivables 7
Note 11- Non-current - financial assets
Shares in controlled entities (cost) - refer 11 (i) 56954 Less impairment adjustment (56194) Carrying value controlled entities 760 Shares in unlisted companies 10 Less impairment (10) Total financial assets 760
Controlled entities Residual Business Management Corporation acquired 100 (2011 59) of the shares in Pacific Solar Pty Limited on 24 February 2012 On 9 May 2012 Pacific Solar Pty Ltd was wound up and deregistered as a solvent entity
(i) The Group included the following controlled entity Country of Percentage of equity interest Investment
Entity name Incorporation held by the consolidated entity 2012 2011 2012 2011
$000 $000 Pacific Solar Pty Limited Australia Nil 59 760
Rounded to whole percent
23
RESIDUAL BUSINESS MANAGEMENT CORPORATION GROUP
NOTES TO THE FINANCIAL STATEMENTS for Year Ended 30 June 2012
Note 12 - Other non-current assets
Contract receivable Cost of goodwill re-acquired Less impairment
Consolidated 2012 2011
$000 $000
3324 8172 235
(3324) (8407)
Parent Entity 2012 2011
$000 $000
3324
(3324) Total other non-current assets
Movement in the allowance for impairment
Accumulated impairment carried forward (8407) (8407) Acc impairment written-back I (booked) 5083 (3324) Impairment balance 30 June
Note 13 - Non-current asserts - property plant and equipment
Total depreciated value property amp equip
(3324) (8407) (3324)
Consolidated Parent Entity 2012 2011 2010 2012 2011 2010
$000 $000 $000 $000 $000 $000
623 632 638 623 623 623
623 623 623 623 623 623 34 34
(25) (19) 623 632 638 623 623 623
a) Reconciliation of written down value of asset classes
Non-current Land at fair value Plant and equipment - at cost Accumulated depreciation Total depreciated value property amp equip
The prior period balance sheet has been adjusted for land parcels that were determined in 2012 to be owned and controlled by RBMC well prior to 30 June 2011 The land parcels are stated at the NSW Lands Departments commissioned valuations Refer note 2(b) for more information
24
RESIDUAL BUSINESS MANAGEMENT CORPORATION GROUP
NOTES TO THE FINANCIAL STATEMENTS for Year Ended 30 June 2012
Consolidated 2012 2011
$000 $000
Parent Entity 2012 2011
$000 $000
Note 14- Payables
Current Trade creditors Other creditors and accruals Total current payables
25 18 43
10 4
14
25 18 43
Terms and conditions relating to the above payables
(i) Trade creditors are non-interest bearing and are settled on 30 day terms (ii) Other creditors and accruals are non-interest bearing and normally settled on 30 day terms
Note 15 - Provisions
Non-current Superannuation net liability 27(b) 11575 1201 11575 1201
~~~~~~~~~~~~~~~~~
Total non-current provisions 11575 1201 11575 1201
Total provisions 11575 1201 11575 1201
Note 16 - Cash flow information
(a) Reconciliation of profit(loss) for the year after tax to net cash flows from operating activities
Profit I (loss) after income tax 670 585 816 11683 Non-cash items (Gain) I loss on investments 8 18 8 56 Depreciation of non - current assets 9 7 Superannuation (gain) on defined benefit schemes (662) (625) (662) (625) Investment activity transactions Dividends from investments (670) (10993) Changes in assets and liabilities (Decrease) I increase in trade and other debtors (3) 2 (7) (Decrease) I increase in other creditors 14 3 18 (26) (Decrease) I increase in provisions (35) Decrease I (increase) in other assets 33 (6) (16) 1 (Increase) I decrease in financial assets 10 760 206 (Increase) I decrease in inventory 12 162 Increase I (decrease) in creditors and borrowings 15 25 (8) Net cash flows from operating activities 96 121 272 294
(b) Reconciliation of cash and cash equivalents
Cash and cash equivalents 1041 1500 1041 89 Balance as per Statement of Cash Flows 1041 1500 1041 89
25
RESIDUAL BUSINESS MANAGEMENT CORPORATION GROUP
NOTES TO THE FINANCIAL STATEMENTS for Year Ended 30 June 2012
Note 16 - Cash flow information (continued)
(c) Acquisitions and disposal of entities
On 24 February 2012 RBMC became the wholly owned parent of Pacific Solar Pty Limited On the 9 May 2012 the Group effectively disposed of Pacific Solar Pty Limited due to it being wound-up and deregistered as a solvent entity on that date RBMC acquired the remaining assets of Pacific Solar they being intellectual property There were no other acquisitions of entities during the year ended 30 June 2012
(d) Financing Arrangements
Neither Residual Business Management Corporation nor any of its controlled entities have any external financing arrangements in place at year end or during the financial year
Note 17 - Commitments for expenditure
(i) Expenditure commitments
No entity in the Group had any expenditure commitments at year end or the prior year end
(ii) Lease expenditure commitments
The Group has a monthly rental agreement with Kennards Self Storage at a cost including GST of $37200 At 30 June 2012 the total rent lease commitments for warehousing facilities is $223200 (2011 $2335968)
Note 18 - Contingent liabilities
There are a number of legal actions that have been taken against RBMC and they have been defended The actions appear to have ceased without recent cost or exposure to RBMC However it is prudent to advise that future legal costs and if applicable settlement will be less than $50000 in the unlikely event that the actions are re-instigated and lost
Note 19 - Related party disclosures
Directors
The names of persons that were Directors or the equivalent of Directors or officers of Residual Business Management Corporation or its controlled entities at any time during the financial year were as follows
Residual Business Management Corporation
Dominic Schuster - General Manger - Appointed 1 September 2012 Andrew dApice - Former General Manger- Ceased 31 August 2012 Mark Guest- Secretary amp Comptroller (equivalent to a Company Secretary amp Finance officer)
Pacific Solar Pty Limited (Deregistered on 9 May 2012)
Andrew dApice- Former Executive Director (Chair)-Appointed 20 January 2012 and Ceased 9 May 2012 Mark Guest-Former Executive Officer amp Company Secretary-Ceased 9 May 2012
26
RESIDUAL BUSINESS MANAGEMENT CORPORATION GROUP
NOTES TO THE FINANCIAL STATEMENTS for Year Ended 30 June 2012
Note 19 - Related party disclosures (continued)
Pacific Solar Pty Limited (Deregistered on 9 May 2012) (continued)
Alan Cox - Former Non-Executive Director (Chair)- Resigned 20 January 2012 Edward Slack- Former Non-Executive Director- Resigned 20 January 2012 James Henderson - Former Non-Executive Director- Resigned 24 February 2012 Alfredo Palestini- Former Non-Executive Director-Resigned 24 February 2012
Ultimate parent entity
The ultimate parent entity of the RBMC Group is the New South Wales Government Residual Business Management Corporation (RBMC) is the parent entity within the RBMC Group and it owned 59 percent of Pacific Solar Pty Limited for the period from 1 July 2011 to 23 February 2012 RBMC then owned 100 percent of the former subsidiary Pacific Solar Pty Limited from 24 February 2012 until its deregistration on 9 May 2012
Transactions with related parties
All related party transactions were unsecured and based on normal terms and conditions By resolution on 6 March 2012 RBMC approved the wind-up of Pacific Solar Pty Limited and agreed to assume its known legal obligations and the expenses of the subsidiary during the wind-up process At the signing date of this report the Group believes that the deregistered Pacific Solar Pty Limited has no remaining financial obligations
There were no other cross guarantees between any entities in the RBMC Group
During the prior year the parent entity part funded the cost of Pacific Solars chairman details of which are set out below in this note
Pacific Solar Pty Limited
During the year RBMC provided funding to its former subsidiary Pacific Solar Pty Limited of Nil (2011 $29 10857) for part of the cost of its Director representative appointed to the Pacific Solar Board
During the year Pacific Solar provided funding to its parent of $9834 (2011 Nil) for part of the cost of the sole Director of the RBMC Group between February and March 2012
NewSouth Innovations Pty Limited a former minority shareholder of Pacific Solar provided Pacific Solar with information services in the 2012 year in the amount of Nil (2011 $5000) This was a normal commercial arrangement
During the year Pacific Solar completed a shareholder and ASIC approved share buy-back of all minority shareholdings RBMCs share of the buy-back payment was Nil (2011 $26548608)
This year Pacific Solar declared and paid dividends of $67039653 to RBMC (2011 Nil) being the sum of the all remaining cash and reserves of the former subsidiary company
RBMC received (paid) the following amounts from (to) or on behalf of its former subsidiary Pacific Solar
Creditor payments made $Nil (2011 $1666132) Cash returned to Pacific Solar $Nil (2011 $1037368)
At 30 June 2012 RBMC had an intercompany receivable of Nil (2011$26548608) with its former subsidiary Pacific Solar The 2011 receivable was paid by Pacific Solar to RBMC this financial year
27
RESIDUAL BUSINESS MANAGEMENT CORPORATION GROUP
NOTES TO THE FINANCIAL STATEMENTS for Year Ended 30 June 2012
Note 19 - Related party disclosures (continued)
Other Entities
During the year the RBMC Group paid remuneration to a registered Chartered Accountancy company directed and ultimately owned by Mark Guest of $18498761 (2011 $1943 53 50) This fee represents market rate remuneration for the services of Mark Guest three part-time tertiary qualified staff and the supply of the Groups registered office The parents share of this total Group remuneration was $10052472 (2011 $7205784) As part of the Pacific Solar wind-up RBMC agreed by resolution that it would assume responsibility for the contract entitlements of Mark Guests Firm The Pacific Solar contract entitlements expired on 6 September 2012 Mr Guests Firm continued to work on specific Pacific Solar related matters until mid-August 2012 and incidental matters until the date of the signing of this report
Note 20- Key management personnel compensation
Consolidated 2012 2011 $(not $(not
rounded) rounded)
Short-term benefits - RBMC 182222 139027 Short-tenn benefits - Pacific Solar Pty Limited 119843 151141 Termination benefits Total key management personnel compensation 302065 290168
Parent entity 2012 2011 $(not $(not
rounded) rounded)
Short-term benefits 182222 139027 Other long term benefits Post-employment benefits Termination benefits
182222 139027
In addition a benefit less than $150 (2011 $250) in credit card reward points was derived via the use of personal credit cards to make corporate payments on a normal executive use basis
28
RESIDUAL BUSINESS MANAGEMENT CORPORATION GROUP
NOTES TO THE FINANCIAL STATEMENTS for Year Ended 30 June 2012
Note 21 - Remuneration of Directors
Income paid or payable or otherwise made available to Directors by members of the Group and related parties in connection with the management of the Group
The number of Directors whose income from members of the Group and related parties was within the following bands
$0 - $9999 $10000 - $19999 $40000 - $49999 $50000 - $59999 $60000 - $69999 $80000 - $89999
Consolidated Parent Entity 2012 2011 2012 2011
$(not $(not $(not $(not rounded) rounded) rounded) rounded)
122636 134682 81698 66970
Number Number Number Number
3 3
2 2 1
In addition at the consolidated level benefits less than $250 (2011 $100) in credit card reward points was derived via the use of a personal credit card to make corporate payments on a normal executive use basis
No share options were or are held directly or indirectly by the Directors during the period or at balance date or during the prior year
Note 22 - Auditors remuneration
Amounts paid to or due and payable to the Auditor General ofNSW for - audit of the financial report of the entity and all other entities in the Group - other services in relation to the entity and all other entities in the Group
Consolidated Parent Entity 2012 2011 2012 2011
$000 $000 $000 $000
88 66 65 44
29
RESIDUAL BUSINESS MANAGEMENT CORPORATION GROUP
NOTES TO THE FINANCIAL STATEMENTS for Year Ended 30 June 2012
Note 23 - Financial risk management objectives and policies
The Groups principal financial instruments comprise receivables payables cash and term deposits These financial instruments arise directly from the Groups operations or are required to finance the Groups activities The Group does not enter into or trade financial instruments including derivative financial instruments for speculative purposes
(a) Risk exposures and responses
The Groups main risks arising from financial instruments are outlined below together with the Groups objectives policies and processes for measuring and managing risk Further quantitative and qualitative disclosures are included throughout these financial statements
The Groups General Manager has overall responsibility for the establishment and oversight of risk management and he reviews and agrees policies for the management of risk Risk management policies are established to identify and analyse the risks faced by the Group and to set risk limits and controls to monitor the risks Compliance with policies is reviewed by the General Manager on a continuous basis
(b) Financial instrument risk defined
The main financial instrument risks that the Group could be exposed to through its financial instruments are as follows
Interest Rate Risk
The Group is exposed to fluctuations in interest rates to the extent ofthe level of its invested cash
Credit Risk
The exposure to credit risk excluding the value of any collateral or other security held is the carrying amount of any provisions for impairment of the Groups recognised financial assets as disclosed in the Statement of Financial Position and notes to these financial statements
Liquidity Risk
The Group manages liquidity risk by monitoring forecast cash flows and ensuring that adequate cash reserves are maintained to fund creditor obligations
Foreign Currency Risk
The Group may be exposed to fluctuations in foreign currencies with respect of future royalty income
Price Risk
The Group is not currently exposed to any material commodity price risk
Sections ( e) to (i) ofthis note considers in detail those risk areas relevant to the Group
30
RESIDUAL BUSINESS MANAGEMENT CORPORATION GROUP
NOTES TO THE FINANCIAL STATEMENTS for Year Ended 30 June 2012
Note 23 - Financial risk management objectives and policies (continued)
(c) Financial instrument categories
Financial Instrument Class Table A Consolidated I Parent Note Category
(a) Financial assets
Cash and deposits 6 Cash T Corp Hour-Glass cash facility 7 Cash trust Receivables - non-current 10 Trade receivables (at amortised cost) Receivables - current 8 Other receivables (at amortised cost)
Total financial assets
(b) Financial liabilities
Payables 14 Trade and accruals measured at amortised cost
Total financial liabilities
Net financial assets
Total 2012 2011
$000 $000
1041 1500 10240 12075
- 7 26 49
11307 13631
43 14
43 H
11264 13617
(d) Financial instruments recognition policy
All Group financial assets and liabilities have been recognised at the reporting date at their net fair values The following methods and assumptions are used to determine the net fair values of financial assets and liabilities
Cash cash equivalents and short-term investments - the carrymg amount approximates fair value because of their short time maturity
Cash trusts - the carrying amount approximates fair value because the underlying trust assets are liquid investments and the financial instrument is redeemable at call
Trade receivables and trade creditors - the carrying amount approximates fair value because of their short term maturity There were no trade receivables that were past due or impaired at the year end
Contract and royalty receivables - the carrying amounts reflect impairment and discount to present value adjustments that derive an approximate fair value
Non-current investmentssecurities - for financial instruments traded in organised financial markets fair value is the current quoted market bid price for an asset or offer price for a liability adjusted for transaction costs necessary to realise the asset or settle the liability For investments where there is no quoted market price a reasonable estimate of the fair value is determined by reference to the current market value of another instrument which is substantially the same or is calculated based on the expected cash flows or the underlying net asset base of the investmentsecurity The carrying amount reflects an impairment that derives the approximate fair value
Unrecognised financial instruments- There are no unrecognised financial instruments
31
RESIDUAL BUSINESS MANAGEMENT CORPORATION GROUP
NOTES TO THE FINANCIAL STATEMENTS for Year Ended 30 June 2012
Note 23 - Financial risk management objectives and policies (continued)
(d) Financial instruments recognition policy (continued)
The entity uses the following hierarchy for disclosing the fair value of financial instruments by valuation technique
bull Level 1 - Derived from quoted prices in active markets for identical assets I liabilities bull Level 2 -Derived from inputs other than quoted prices that are observable directly or indirectly bull Level 3 - Derived from valuation techniques that include inputs for the asset I liability not based
on observable market data (unobservable inputs) 2012
Level 1 Level 2 Level 3 Total $000 $000 $000 $000
Financial assets at fair value TCorp Hour-Glass Inv Facility 10240 10240
10240 10240
The table above includes only financial assets as no financial liabilities were measured at fair value in the statement of financial position
The aggregate net fair values and carrying amounts of financial instruments are disclosed in the statement of financial position and the supporting notes to these financial statements
(e) Interest rate risk
Interest rate risk is the risk that the value of the financial instrument or its revenue or costs will fluctuate due to changes in market interest rates The Groups exposure to interest rate risk and the effective interest rates of its financial assets and liabilities at the reporting date are set out on the following pages
In respect of income-earning financial assets and interest-bearing financial liabilities the table on the following page sets out the carrying amount by maturity date of the financial instruments exposed to interest rate risk at reporting date
32
RESIDUAL BUSINESS MANAGEMENT CORPORATION GROUP
NOTES TO THE FINANCIAL STATEMENTS for Year Ended 30 June 2012
Note 23 - Financial risk management objectives and policies (continued)
(e) Interest rate risk (continued)
Table B Consolidated Fixed interest rate maturing in
Financial Instruments Floating interest rate
2012 2011 $000 $000
1 year or less
2012 2011 $000 $000
Over 1 to 5 years
2012 2011 $000 $000
More than 5 years
2012 2011 $000 $000
Non-interest bearing
2012 2011 $000 $000
Total carrying amount as per the
Statement of Financial Position
2012 2011 $000 $000
(i) Financial assets Cash at bank 41 92 1000 1408 1041 1500 Cash trust 10240 12075 10240 12075 Trade and other receivables 26 49 26 49
Total financial assets 10281 12167 1000 1408 26 49 11307 13624
Weighted average interest rate 489 475 585 578
(ii) Financial liabilities Trade creditors accruals and other creditors 43 14 43
Total financial liabilities 43 14 43
Weighted average interest rate
Net financial assets (liabilities 10281 12167 1000 1408 17 35 11264 13610
33
14
14
RESIDUAL BUSINESS MANAGEMENT CORPORATION GROUP
NOTES TO THE FINANCIAL STATEMENTS for Year Ended 30 June 2012
Note 23 - Financial risk management objectives and policies (continued)
(e) Interest rate risk (continued)
Interest rate risk scenario and sensitivity analysis
The Group invests in secure bank term deposits and with the NSW Governments Treasury Corporation (T Corp) The Group holds large cash reserves to deal with its legacy business issues and to enable it to enforce its contractual rights in relation to the intellectual property it has developed Interest rate movements have a large impact on the results of the Group The risk profile set by the General Manager results in the Group receiving only a small margin above or below the official Australian interest rate set by the Australian Reserve Bank Board The duration of each cash investment essentially drives the interest rate the Group receives
TCorp Hour-Glass facilities
Exposure to interest rate risk primarily arises through the investment in the TCorp Hour Glass Investment Facilities which are held for strategic rather than trading purposes The Group holds units in the following Hour-Glass investment trusts
Consolidated Parent
Facility Investment Sectors Investment Horizon 2012
$000 2011
$000 2012
$000 2011
$000
Cash facility Cash and money market securities At call 10240 12075 10240 11993
The unit price of the facility is equal to the total fair value of the net assets held by the facility divided by the number of units on issue for that facility Unit prices are calculated and published daily NSW TCorp is trustee for the above facility and is required to act in the best interest of the unit holders and to administer the trust in accordance with the trust deeds As trustee TCorp has appointed external managers to manage the performance and risk of the facility in accordance with a mandate agreed by the parties Significant portions of administration are also outsourced to an external custodian Investment in the Hour-Glass facilities limits the Groups exposure to risk as it allows diversification across a pool of funds with different investment horizons and a mix of investments
The impact on profit I loss 2012 is as follows
Consolidated Parent Facility Change in
Unit Price Impact on Profit I
Loss 2012 $000
Impact on Profit I Loss 2011
$000
Impact on Profit I Loss 2012
$000
Impact on Profit I Loss 2011
$000 Cash facility +-1 102 121 102 120
NSW TCorp provides sensitivity analysis information for the cash facility using historical based volatility information collected over a ten year period quoted at two standard deviations (ie 95 probability)
The TCorp Hour-Glass investment facilities are designated at fair value through the Statement of Comprehensive Income and therefore any changes in unit price impacts directly on profit (rather than equity) A reasonably possible change is based on the percentage change in unit price multiplied by the redemption value as at 30 June each year for each facility
34
RESIDUAL BUSINESS MANAGEMENT CORPORATION GROUP
NOTES TO THE FINANCIAL STATEMENTS for Year Ended 30 June 2012
Note 23 - Financial risk management objectives and policies (continued)
(e) Interest rate risk (continued)
TCorp Hour-Glass facilities (continued)
The Groups term deposit cash investment sensitivity rates are similar As follows is the Groups judgement of reasonable possible movements in profits due to foreseeable changes in interest rates
(f) Credit risk
Credit Risk is the risk of financial loss arising to the Group from the default of another party with a contract or financial position with the Group The Group has material credit risk exposure to the CSG Solar AG Group in that at reporting date the Group has gross royalty rights receivable over time from CSG Solar AG Group of a least $332438395 (2011 $8 17197928) The table below states these gross receipts at their recoverable amount discounted to present value which is Nil (2011 $Nil) these written down values being the balances reflected in these financial statements These royalty rights are not past due but they are considered fully impaired Group policy is that all customers that wish to trade on credit terms are subject to a credit worthiness review
The Groups maximum exposure to credit risk and the applicable counter party is represented by the carrying amounts of its financial assets at reporting date as is set out in the following table (There was no past due balances at 30 June 2012)
Table C Financial
Instrument
Government Institutions
Australian Banks
CSG Solar AG Group
Other Commercial
entities Total
Consolidated 2012 $000
2011 $000
2012 $000
2011 $000
2012 $000
2011 $000
2012 $000
2011 $000
2012 $000
2011 $000
(a) Financial assets Cash and deposits - - 1041 1500 - - - - 1041 1500
Cash trust 10240 12075 - - - - - - 10240 12075 Trade receivables
amp other - - - - - - 26 49 26 49 Royalty rights
Impairment - - - -3324
(3324) 8172
(8172) --
--
3324 (3324)
8172 (8 172)
Net Rovalty - - - - - - - - - -Unlisted shares
Impairment --
--
--
--
--
10 (10)
--
--
--
10 (10)
Net unlisted shares - - - - - - - - - -Total 10240 12075 1041 1500 - - 26 49 11307 13624
35
RESIDUAL BUSINESS MANAGEMENT CORPORATION GROUP
NOTES TO THE FINANCIAL STATEMENTS for Year Ended 30 June 2012
Note 23 - Financial risk management objectives and policies (continued)
(g) Liquidity risk
Liquidity risk arises from the financial liabilities of the Group and the Groups subsequent ability to meet the obligations to repay the liabilities as and when they fall due As is disclosed above the Group maintains a high level of cash reserves to cover its material credit and warranty risks The Group has ongoing administrative costs require ongoing funding The following table provides the maturity dates of the Groups financial liabilities by bands
Table D
Maturity Bands
Financial liabilities
Trade creditors
Other creditors
Total financial liabilities
2012 2012 2011 2012 2011 more 2011 2012 2011 less less more more than 2 more More More
than than than 1 than 1 less than 2 than than one one less than less than than 5 less than 5 5 2012 2011 year year 2 years 2 years years 5 years years years Total Total $000 $000 $000 $000 $000 $000 $000 $000 $000 $000
25 12 - - - - - - 25 12
18 2 - - - - - - 18 2
43 14 - - - - - - 43 14
(h) Foreign currency risk
At the present time the Group has no material exposure to foreign currency risk The Groups above mentioned royalty rights are payable in Australian dollars
(i) Derivative financial instruments
During the financial year ending 30 June 2012 neither Residual Business Management Corporation nor any of its controlled entities had any known exposure to derivatives
36
RESIDUAL BUSINESS MANAGEMENT CORPORATION GROUP
NOTES TO THE FINANCIAL STATEMENTS for Year Ended 30 June 2012
Note 24-Retained earnings Note
Consolidated
2012 2011 $000 $000
Parent Entity
2012 2011 $000 $000
Balance at beginning of the financial year Owners of the parent comprehensive income (loss) Superannuation actuarial (losses) I gains Dividend paid or declared Balance at the end of the year
3(b) 27(c)
11909 816
(11036) 2000
(311
12059 728 122
(1000) 11909
11909 816
(11036) 2000
(311
1104 11683
122 (1000) 11909
Note 25 shy Non-controlling interests
As at 30 June 2011 the parent entity held an equity interest of 59 in Pacific Solar Pty Limited On 24 February 2012 a share buyback was approved by all minority shareholders for all of their Pacific Solar Pty Limited shares Thus on this date Pacific Solar became a fully owned subsidiary of RBMC Pacific Solar was then deregistered as a solvent entity on 9 May 2012 The buyback was based on a mid-point minority interest discount of 20 for the shares held by the following shareholders
Enipower SpA University ofNSW New South Innovations Pty Limited Thi An Dinh Morgan Michael Green Briana Keagan Green and Michelle Gaye Wenham
Reconciliation of non-controlling interest in RBMCs consolidated equity Non-controlling interest
2012 2011 $000 $000
Non-controlling interest in Pacific Solar share capital 36364 Non-controlling interests share ofretained (losses) at the end of the year (35836 Non-controlling interest in RBMCs consolidated equity 528
Note 26 - New Australian Accountings Standards issued but not effective
In the current year the Group has adopted all of the new and revised Standards and Interpretations issued by the AASB that are relevant to the operations and effective for the current reporting period Details of the impact of the adoption of these new accounting standards are set out in the individual accounting policies notes in the financial statements Certain new accounting standards and interpretations have been published that are not mandatory for the 30 June 2012 reporting period The Group did not early adopt any new accounting standards that are not yet effective The Group has assessed the impact of the new standards and interpretations on issue but not effective and considers the impact to be insignificant
37
RESIDUAL BUSINESS MANAGEMENT CORPORATION GROUP
NOTES TO THE FINANCIAL STATEMENTS for Year Ended 30 June 2012
Note 27 - Superannuation information
(a) Superannuation income recognition policy
In 2012 the Group recognises the net total of the following amounts in profit or loss
Current service cost is the increase in the present value of the defined benefit obligation resulting from employee service in the current period Interest cost is the increase in the present value of the defined benefit obligation which arises because the benefits are one period closer to settlement Expected return on plan assets is based on market expectations at the beginning of the period for returns over the life of the related obligation and on any reimbursement rights Past service cost (to the extent required to be recognised) is the increase in the defined benefit obligation from changes to post-employment benefits relating to employee service in prior periods and Curtailments or settlements are amendments to the terms of the plan andor number of employees covered by the plan
The Group recognises defined benefit actuarial superannuation gains and losses in other comprehensive income
(b) Superannuation obligations
All former employees were entitled to varying levels of benefits on retirement disability or death The superannuation plans (State Superannuation Scheme (SSS) State Authorities Superannuation Scheme (SASS) and State Authorities Non-Contributory Superannuation Scheme (SANCS) provide defined benefits based on years of service and final average salary Employees contributed to the plans and the contribution of the parent entity was and remains legally enforceable All Schemes are closed to new members
Note (b) continues on the following page
38
RESIDUAL BUSINESS MANAGEMENT CORPORATION GROUP
NOTES TO THE FINANCIAL STATEMENTS for Year Ended 30 June 2012
Note 27 - Superannuation information (continued)
(b) Superannuation obligations (continued)
The following is the superannuation position of the Group as at 30 June 2012 The superannuation assets and liabilities recognised in the statement of financial position are listed at the bottom of the table
Consolidated (Being The Parent Entity)
2012 2011 2012 2011 2012 2011 2012 2011 Member numbers
SASS SANCS SSS Total
Contributors - - - - - - - -Deferred benefits - - - - 3 3 3 3 Pensioners 2 2 - - 39 38 41 40 Pensions fully commuted - - - - 2 2 2 2 Totals 2 2 - - 44 43 46 45
Accrued liability
Superannuation position for AASB119 purposes
(437)
2012 $000
(339)
2011 $000
-
2012 $000
-
2011 $000
(32024)
2012 $000
(23303)
2011 $000
(32461)
2012 $000
(23642)
2011 $000
Estimate reserve account balance 193 269 282 279 20411 21893 20886 22441 Sub-total
Future Service Liability (Note 1) Surplus in excess of recovery available from Schemes Net asset I (liability) to be recognised in statement of financial position
(244)
-
-
(244)
(70)
-
-
(70)
282
-
-
282
279
-
-
279
(11613)
-
-
(11613)
(1410)
-
-
(1410)
(11575)
-
-
(11575)
(1201)
-
-
(1201)
Note 1 The Future Service Liability (FSL) does not have to be recognised by an employer It is only used to determine if an asset ceiling limit should be imposed (AASB 119 para 58) Under AASB 119 any prepaid superannuation asset recognised cannot exceed the total of any unrecognised past service cost and the present value of any economic benefits that may be available in the form of refunds from the plan or reductions in future contributions to the plan Where the surplus in excess of recovery is zero no asset ceiling limit is imposed
As is set out above at 30 June 2012 Residual Business Management Corporation had a gross calculated defined benefit superannuation liability with respect of former employees of $32461163 (2011 23641751 ) Superannuation funds invested to cover this liability amounted to $20886294 (2011 $22440728) The aforementioned superannuation liability and surplus position has been calculated by an independent and qualified actuary The calculated deficiency of invested funds versus the anticipated superannuation liabilities at 30 June 2012 was a balance of $11574869 (2011 $1201023) The parent entity with the support ofNSW Treasury believes that it has sufficient funds to cover this deficiency
39
RESIDUAL BUSINESS MANAGEMENT CORPORATION GROUP
NOTES TO THE FINANCIAL STATEMENTS for Year Ended 30 June 2012
Note 27 - Superannuation information (continued)
(b) Superannuation obligations (continued)
Th T f h t ee reconcr ration o t e present va ue of h defimed b enefirt o blrgatrons rs as flo11ows For the year ended 30 June 2012
Consolidated (Being the Parent Entity) SASS SANCS SSS $000 $000 $000
Present value ofpartly funded defined benefit obligation at beginning of the year (339) - (23303) Current service cost - - -Interest cost (17) - (I 199) Contributions by fund participants - - -Actuarial gains (losses) (157) 3 (8995) Benefits paid 76 (3) 1473 Past service cost - - -Curtailments - - -Settlements - - -Business Combinations - - -Exchange rate changes - - -Present value of partly funded defined benefit obliations at end of the year (437) - (32024)
Total Total 2012 2011
$000 $000
(23642) (23686) - -
(1216) (I 194) - -
(9149) 141 1546 1097
- -- -- -- -- -
(32461) (23642)
The reconciliation of the fair value offund assets is as follows
For the year ended 30 June 2012 Total Total Consolidated (Being the Parent Entity) SASS SAN CS SSS 2012 2011
$000 $000 $000 $000 $000 Fair value of fund assets at beginning of the year 269 279 21893 22441 21738 Expected (loss) I return on fund assets 22 24 1832 1878 1819 Actuarial (losses) I gains (22) (24) (1841) (1887) (19) Employer contributions - - - - -Contributions by fund participants - - - - -Benefits paid (76) 3 (1473) (1546) (l097) Settlements - - - - -Business combinations - - - - -Exchange rate changes - - - - -Fair value of fund assets at end of the year 193 282 20411 20886 22441
The reconciliation of the assets and liabilities recognised in the statement of financial position is follows
Total Consolidated (Being the Parent Entity)
TotalFor the year ended 30 June 2012 2012
$000 SAN CS SASS SSS
$000 Present value ofpartly funded defined benefit obligations at end of the year
$000 $000 $000
(32461) (23642) Fair value of fund assets at end of year
(437) (32024)-22441
Subtotal 20886282 20411193
(1201) Unrecognised past service cost
(11575)(244) (11613)282 - - - --
Unrecognised gain(loss) --- --Adjustment for limitation on net assets -- -- -Net asset I (liability) recognised in the statement of financial position at end of year (l201)(11575)(244) (11613)282
40
2011
RESIDUAL BUSINESS MANAGEMENT CORPORATION GROUP
NOTES TO THE FINANCIAL STATEMENTS for Year Ended 30 June 2012
Note 27 - Superannuation information (continued)
(b) Superannuation obligations (continued)
For the year ended 30 June 2012
2012 Consolidated (Being the Parent Entity) SASS SANCS SSS Total Components recognised in profit or loss by component $000 $000 $000 $000 Current service cost - - - -Interest cost (17) - (1199) (1216) Expected return on fund assets (net of expenses) 22 24 1832 1878 Past service cost - - - -Movement in adjustment for limitation on net asset - - - -Curtailment or settlement gain(loss) - - - -Total included in Other income in the statement of 5 24 633 662 comprehensive income (refer also note 2(b))
For the year ended 30 June 2012
2012 Consolidated (Being the Parent Entity) SASS SAN CS SSS Total Components recognised in other comprehensive income $000 $000 $000 $000 Actuarial (losses) I gains recognised in year (179) (21) (10836) (11036)
2011 Total $000
-(1194)
1819 ---
625
2011 Total $000
122
Cumulative amount recognised in other comprehensive income
The cumulative amount of actuarial gains and losses since 1 July 2005 recognised in other comprehensive income is an accumulated loss of $14221000 (2011 accumulated loss of $3185000) Before 1 July 2005 RBMC treated the defined benefit superannuation funds as separate entities and so recognised no superannuation balances in other comprehensive income
(c) Superannuation obligations - actuarial loses outside the statement of comprehensive income
Amounts not recognised in the statement of comprehensive income and expenses are as follows
For the year ended 30 June 2012
Consolidated (Being the Parent Entity) SASS SAN CS SSS 2012
Total 2011 Total
$000 $000 $000 $000 $000 Actuarial (losses) - - - - -Adjustment for limit on net asset - - - - -Total loss not reco2nised in the income statement - - - - -
41
RESIDUAL BUSINESS MANAGEMENT CORPORATION GROUP
NOTES TO THE FINANCIAL STATEMENTS for Year Ended 30 June 2012
Note 27 - Superannuation information (continued)
(d) Superannuation asset classes
The percentage invested in each asset class at the balance sheet date
Consolidated (Being the Parent Entity) 30 June 2012 30 June 2011 Australian equities 280 334 Overseas equities 237 295 Australian fixed interest securities 49 57 Overseas fixed interest securities 24 31 Property 86 99 Cash 195 51 Other 129 133
All Fund assets are invested by SAS Trustee Corporation (STC) at arms length through independent fund managers
Other superannuation provision information related to AASB 119 is disclosed at Note 28
AASB 119 requires organisations to provide detailed narrative information regarding the key economic and demographic assumptions underlying the reported defined benefits superannuation account balances The assumptions and calculations are generic to all NSW Government agencies and they are set out in Note 28
Note 28 - AASB 119 Superannuation information valuation method and principal actuarial assumptions
The followings are the superannuation asset and liability assumptions and calculations generic to all NSW Government agencies
The expected rate of return on assets assumption is determined by weighting the expected long-term return for each asset class by the target allocation of assets to each class The returns used for each class are net of investment tax and investment fees
Actual return on Scheme assets are as follows
For the year ended 30 June 2012 Consolidated (Being the Parent Entity) SASS SANCS SSS Total
$000 $000 $000 $000 Actual loss I (return) on fund assets (1) - 9 8
(a) Valuation Method
The Projected Unit Credit (PUC) valuation method was used to determine the present value of the defined benefit obligations and the related current service costs This method sees each period of service as giving rise to an additional unit of benefit entitlement and measures each unit separately to build up the final obligation
42
RESIDUAL BUSINESS MANAGEMENT CORPORATION GROUP
NOTES TO THE FINANCIAL STATEMENTS for Year Ended 30 June 2012
Note 28 - AASB 119 Superannuation information valuation method and principal actuarial assumptions (continued)
(b) Economic assumptions
Consolidated (Being the Parent Entity) 30 June 2012 30 June 2011
Salary increase rate (excluding promotional increases) 25 pa 35 pa
Rate ofCPI increase 25 pa 25pa
Expected rate of return on assets backing pension liabilities 860 pa 860pa
Expected rate ofretum on assets backing other liabilities 860 pa 860pa
Discount rate 306 pa 528pa
(c) Demographic assumptions
The demographic assumptions underlying the calculated actuarial balances of the RBMC Superannuation Schemes are generic to all NSW Government agencies and further details can be obtained from the NSW Treasury website
(d) Historical information
For the year ended 3 0 June 2012 Consolidated (Being the Parent Entity) SASS SANCS SSS Total
$000 $000 $000 $000 Present value ofdefined benefit obligation (437) - (32024) (32461) Fair value of fund assets 193 282 20411 20886 Surplus(Deficit) in fund (244) 282 (11613) (11575) Experience adjustments - liabilities (157) 3 (8995) (9149) Experience adjustments - assets (22) (23) (1841) (1886)
For the year ended 30 June 2011 Consolidated (Being the Parent Entity) SASS SANCS SSS Total
$000 $000 $000 $000 Present value of defined benefit obligation (339) - (23303) (23642) Fair value of fund assets 269 279 21893 22441 Surplus(Deficit) in fund (70) 279 (1410) (1201) Experience adjustments - liabilities 12 (6) 135 141 Experience adjustments - assets - (1) (18) (19)
For the year ended 30 June 2010 Consolidated (Being the Parent Entity) SASS SAN CS SSS Total
$000 $000 $000 $000 Present value of defined benefit obligation (344) - (23342) (23686) Fair value of fund assets 258 263 21217 21738 Surplus in fund (86) 263 (2125) (1948) Experience adjustments - liabilities (8) (3) (1079) (1090) Experience adjustments - assets 2 1 133 136
43
RESIDUAL BUSINESS MANAGEMENT CORPORATION GROUP
NOTES TO THE FINANCIAL STATEMENTS for Year Ended 30 June 2012
Note 28 - AASB 119 Superannuation information valuation method and principal actuarial assumptions (continued)
(d) Historical information (continued)
For the year ended 30 June 2009 Consolidated (Being the Parent Entity) SASS SAN CS SSS Total
$000 $000 $000 $000 Present value of defined benefit obligation (336) - (21959) (22295) Fair value of fund assets 254 244 20292 20790 Surplus in fund (83) 244 (1666) (1505) Experience adjustments - liabilities (65) 15 (3875) (3925) Experience adjustments - assets (55) (48) (4259) (4362)
For the year ended 30 June 2008 Consolidated (Being the Parent Entity) SASS SAN CS SSS Total
$000 $000 $000 $000 Present value of defined benefit obligation (283) - (18313) (18596) Fair value of fund assets 313 256 24045 24614 Surplus in fund 30 256 5732 6018 Experience adjustments - liabilities 3 111 2119 2233 Experience adjustments - assets 16 (76) (5316) (5376)
(e) Expected contributions
For the year ended 30 June 2012 SASS SAN CS SSS Total $000 $000 $000 $000
Expected employer contributions to be paid in the next reporting period - - - -
(f) Funding arrangements for employer contributions
i Surplus I deficit
The following is a summary of the 30 June 2012 financial position of the Schemes calculated in accordance with AAS 25 Financial Reporting by Superannuation Plans
For the year ended 30 June 2012
Consolidated (Being the Parent Entity) SASS SANCS SSS Total 2012
Total 2011
$000 $000 $000 $000 $000 Accrued benefits (256) - (17086) (17342) (16841) Net market value of Fund assets 193 283 20410 20886 22441 Total net surplus( deficiency) (63) 283 3324 3544 5600
44
RESIDUAL BUSINESS MANAGEMENT CORPORATION GROUP
NOTES TO THE FINANCIAL STATEMENTS for Year Ended 30 June 2012
Note 28 - AASB 119 Superannuation information valuation method and principal actuarial assumptions (continued)
(f) Funding arrangements for employer contributions (continued)
ii Contribution recommendations
The recommended contribution rates are as follows For the year ended 30 June 2012
Consolidated (Being the Parent Entity)
SASS SANCS SSS
Multiple of member contributions member salary Multiple ofmember contributions 000 000 000
iii Funding method
Contribution rates are set after discussions between the employer STC and NSW Treasury
iv Economic assumptions
The economic assumptions adopted for the current actuarial review of the Fund are
Weighted-average assumptions 2012 2011
Expected rate ofretum on Fund assets backing current pension liabilities 83 pa 83pa
Expected rate of return on Fund assets backing other liabilities 73 pa 73pa
Expected salary increase rate 40 pa 40pa
Expected rate of CPI increase 25 pa 25pa
(g) Nature of asset I (liability)
If a surplus exists in the employers interest in the Fund the employer may be able to take advantage of it in the form of a reduction in the required contribution rate depending on the advice of the Funds actuary
Where a deficiency exists the employer is responsible for any difference between the employers share of Fund assets and the defined benefit obligation
Note 29 - Events occurring after reporting date
The services of Mr Andrew d Apice the former General Manager of the RBMC Group were finalised on 31 August 2012 Mr Dominic Schuster of NSW Treasury was then appointed as his replacement effective 1 September 2012
There were no other matters or circumstances that have arisen since the end of the financial year which significantly affected or may significantly affect the operations of the Group the results of those operations or the state of affairs of the Group in future years
End of audited financial statements
45
RESIDUAL BUSINESS MANAGEMENT CORPORATION
FINANCIAL STATEMENTS FOR THE YEAR ENDED 30 JUNE 2012
STATEMENT BY CHIEF EXECUTIVE OFFICER
RESIDUAL BUSINESS MANAGERMENT CORPORATION
Pursuant to Section 41C of the Public Finance and Audit Act 1983 I state that in my opinion
The accompanying financial statements and notes thereto exhibit a true and fair view of the financial
position of the Residual Business Management Corporation (RBMC) as at 30 June 2012 and the
financial performance for the year then ended
The financial statements have been prepared in accordance with the provisions of applicable
Australian Accounting Standards (which include Australian Accounting Interpretations) the
requirements of the Public Finance and Audit Act 1983 applicable clauses of the Public Finance and
Audit Regulation 2010 the requirements of the Financial Reporting Directions published in the
Financial Reporting Code for NSW General Government Sector Entities and the Treasurers
Directions
Further I am not aware of any circumstances which would render any particulars included in the
financial statements to be misleading or inaccurate
On behalf of the Corporation
Dominic Schuster
General Manager
Residual Business Management Corporation
Dated 6 May 2014 at Sydney
INDEPENDENT AUDITORS REPORT
Residual Business Management Corporation
To Members of the New South Wales Parliament
I have audited the accompanying financial statements of Residual Business Management Corporation (the Corporation) which comprise the statements of financial position as at 30 June 2012 the statements of comprehensive income the statements of changes in equity and the statements of cash flows for the year then ended notes comprising a summary of significant accounting policies and other explanatory information of the Corporation and the consolidated entity The consolidated entity comprises the Corporation and the entities it controlled at the year end or from time to time during the financial year
Opinion
In my opinion the financial statements
give a true and fair view of the financial position of the Corporation and the consolidated entity as at 30 June 2012 and of their financial performance and cash flows for the year then ended in accordance with Australian Accounting Standards
bull are in accordance with section 41B of Public Finance and Audit Act 1983 (the PFampA Act) and the Public Finance and Audit Regulation 2010
My opinion should be read in conjunction with the rest of this report
The General Managers Responsibility for the Financial Statements
The General Manager is responsible for the preparation of the financial statements that give a true and fair view in accordance with Australian Accounting Standards and the PFampA Act and for such internal control as the General Manager determines is necessary to enable the preparation of the financial statements that are free from material misstatement whether due to fraud or error
Auditors Responsibility
My responsibility is to express an opinion on the financial statements based on my audit I conducted my audit in accordance with Australian Auditing Standards Those standards require that I comply with relevant ethical requirements relating to audit engagements and plan and perform the audit to obtain reasonable assurance about whether the financial statements are free from material misstatement
An audit involves performing procedures to obtain audit evidence about the amounts and disclosures in the financial statements The procedures selected depend on the auditors judgement including the assessment of the risks of material misstatement of the financial statements whether due to fraud or error In making those risk assessments the auditor considers internal controls relevant to the entitys preparation of the financial statements that give a true and fair view in order to design audit procedures that are appropriate in the circumstances but not for the purpose of expressing an opinion on the effectiveness of the entitys internal control An audit also includes evaluating the appropriateness of accounting policies used and the reasonableness of accounting estimates made by the General Manager as well as evaluating the overall presentation of the financial statements
I believe the audit evidence I have obtained is sufficient and appropriate to provide a basis for my audit opinion
My opinion does not provide assurance
bull about the future viability of the Corporation or consolidated entity
bull that they have carried out their activities effectively efficiently and economically
bull about the effectiveness of internal control
bull about the security and controls over the electronic publication of the audited financial statements on any website where they may be presented
bull about any other information that may have been hyperlinked tofrom the financial statements
Independence
In conducting my audit I have complied with the independence requirements of the Australian Auditing Standards and other relevant ethical pronouncements The PFampA Act further promotes independence by
bull providing that only Parliament and not the executive government can remove an Auditor-General
bull mandating the Auditor-General as auditor of public sector agencies but precluding the provision of non-audit services thus ensuring the Auditor-General and the Audit Office of New South Wales are not compromised in their role by the possibility of losing clients or income
1~k Kheir Director Financial Audit Services
19May2014 SYDNEY
- Structure Bookmarks
-
- Figure
- Figure
- Financial Instrument Class Table A Consolidated I Parent Note Category (a) Financial assets Cash and deposits 6 Cash T Corp Hour-Glass cash facility 7 Cash trust Receivables -non-current 10 Trade receivables (at amortised cost) Receivables -current 8 Other receivables (at amortised cost) Total financial assets (b) Financial liabilities Payables 14 Trade and accruals measured at amortised cost Total financial liabilities Net financial assets Total 2012 2011 $000 $000 1041 1500 10240 12075 -7 26 49 1130
- For the year ended 30 June 2012 Consolidated (Being the Parent Entity) SASS SANCS SSS $000 $000 $000 Present value ofpartly funded defined benefit obligation at beginning ofthe year (339) -(23303) Current service cost ---Interest cost (17) -(I199) Contributions by fund participants ---Actuarial gains (losses) (157) 3 (8995) Benefits paid 76 (3) 1473 Past service cost ---Curtailments ---Settlements ---Business Combinations ---Exchange rate changes ---Present value of partly funded defined benefit obl
- For the year ended 30 June 2012 2012 Consolidated (Being the Parent Entity) SASS SANCS SSS Total Components recognised in profit or loss by component $000 $000 $000 $000 Current service cost ----Interest cost (17) -(1199) (1216) Expected return on fund assets (net ofexpenses) 22 24 1832 1878 Past service cost ----Movement in adjustment for limitation on net asset ----Curtailment or settlement gain(loss) ----Total included in Other income in the statement of 5 24 633 662 comprehensive income (refe
- Figure
- Figure
- 1~kKheir
-

RESIDUAL BUSINESS MANAGEMENT CORPORATION GROUP
STATUTORY INFORMATION 2012 (continued)
PERFORMANCE STATEMENTS
As at 30 June 2012 there were no CES and SES Level 5 personnel and accordingly the disclosure of performance statements is not applicable
PRIVACY AND PERSONAL INFORMATION
RBMCs processes for managing staff information meet the principles of the Privacy and Personal Information Act 1998
PROGRAM EVALUATION RESULTS
Business Plans and Performance Processes are in place and are used to measure results against overall strategic objectives
RISK MANAGEMENT AND INSURANCE
Insurable risks are covered by a program of self-retained risk and external insurance Risk management is the responsibility of all levels of management within the RBMC Group
SENIOR EXECUTIVE SERVICE STAFF NUMBERS AND SUPERANNUATION
The RBMC Group has one remaining direct employees being its General Manager The former Pacific Solar Executive Officer amp Secretary is a contract executive He employs three full-time employees that are considered indirect part-time RBMC employees At 30 June 2012 RBMC was responsible for the superannuation obligations of 46 (2011 45) former employees The gross calculated defined benefit superannuation liability with respect of these former employees at 30 June 2012 was $32SM (2011 $236M) Superannuation funds invested to cover this liability amounted to $209M at 30 June 2012 (2011 $224M)
TIME FOR PAYMENT OF ACCOUNTS
The RBMC Group seeks to pay all undisputed accounts on time During the financial year ending 30 June 2012 and prior all accounts properly received were paid in a timely manner
THE COMMUNITY RELATIONS COMMISSION AND PRINCIPLES OF MULTICULTURALISM STATEMENTS
RBMC exists as a special purpose risk management entity whose operations are subject to legislative restrictions Our primary purpose is to manage the residual assets liabilities and risks arising as part of the NSW Governments energy reform processes that have not been transferred to other State Corporations
Our Corporation understands and is strongly committed to supporting the NSW Governments legislated principles of multiculturalism
We wish to never forget those who served and died at war to protect our Nation our democracy and our fair-go culture
End of the statutory report
6
THE 2012 FINANCIAL REPORT
Start of audited financial statements - 2012
RESIDUAL BUSINESS MANAGEMENT CORPORATION GROUP STATEMENT OF COMPREHENSIVE INCOME FOR THE YEAR ENDED 30 JUNE 2012
Consolidated Parent Entity
Note 2012 2011 2012 2011
$000 $000 $000 $000
Continuing operations
Sale of goods 15 9
Rental income 7
Revenue 15 16
Cost of sales (29) ( 41)
Gross profit (14) (25)
Other revenue 3(a) 628 792 1259 11682
Other income 3(b) 813 629 823 629
Depreciation and amortisation 4(a) (9) (7)
Occupancy expenses 4(b) (23) (31)
Administrative expenses 4(c) (535) (579) (347) (366)
Other expenses 4(d) (31) (230) (760) (259)
Net (loss) I gain on sale of investments (159) 36 (159) (3)
Profit I (loss) from continuing operations before 670 585 816 11683 income tax Income tax expense 5(a)
Profit I (loss) from continuing operations after income tax 670 585 816 11683
Net profit I (loss) for the year 670 585 816 11683
Other comprehensive income Actuarial (loss) I gain on defined benefit plans 27(b) (11036) 122 (11036) 122
Other comprehensive (losses) I income for the year (11036) 122 (11036) 122
Total comprehensive (loss) income for the year (10366) 707 (10220) 11805
Profit I (loss) for the year is attributed to Non-controlling interest (146) (143)
Owners of the parent 816 728 816 11683
670 585 816 11683
Total comprehensive (loss) I income for the year is attributed to Non-controlling interest (until 9 May 2012) (146) (143)
Owners of the parent (10220) 850 (10220) 11805
(10366) 707 (10220) 11805
The statement of comprehensive income is to be read in conjunction with the notes to the financial statements
7
RESIDUAL BUSINESS MANAGEMENT CORPORATION GROUP STATEMENT OF FINANCIAL POSITION AS AT 30 JUNE 2012
Consolidated Parent Entity Note 2012 2011 2010 2012 2011 2010
Restated Restated Restated Restated $000 $000 $000 $000 $000 $000
Current assets Cash and cash equivalents 6 1041 1500 2033 1041 89 357 T Corp Hour-Glass cash facility 7 10240 12075 12624 10240 11993 1493 Trade and other receivables 8 26 49 1 26 268 Inventories 9 12 174 Other current assets 44 4
Total current assets 11307 13636 14876 11307 12350 1854 Non-current assets
Trade and other receivables 10 7 7 Financial assets at fair value Other intangibles assets Property plant and equipment
11 12 13 623 632
10
638 623
760
623
1232
623
Total non-current assets 623 639 655 623 1383 1855
Total assets 11930 14275 15531 11930 13733 3709 Current liabilities
Trade and other payables 14 43 14 10 43 34 Provisions 35
Total current liabilities 43 14 45 03 Non-current liabilities
Superannuation liability 15 11575 1201 1948 11575 1201 1948
Total non-current liabilities 11575 1201 1948 11575 1201 1948
Total liabilities 11618 1215 1993 11618 1201 1982 Net assets 312 13060 13538 312 12532 1727
Equity Parent equity interest
Issued capital Asset revaluation reserve 13b 623 623 623 623 623 623 Retained earnings 24 311 11909 12059 311 11909 1104
Total parent interest 312 12532 12682 312 12532 1727
Total non-controlling interest 25 856 856 Total eguity 312 13060 13538 312 12532 1727
See Notes 2 and 13
The statement of financial position is to be read in conjunction with the notes to the financial statements
8
34
RESIDUAL BUSINESS MANAGEMENT CORPORATION GROUP STATEMENT OF CHANGES IN EQUITY FOR THE YEAR ENDED 30 JUNE 2012
Consolidated 2012 Asset Retained Owners of the Non-controlling Total revaluation reserve earnings parent interest equity
$000 $000 $000 $000 $000
At 1 July 2011 623 11909 12532 528 13060
Profit for the period - 816 816 (146) 670
Other comprehensive income I (loss) - (11036) (11036) - (11036)
Total comprehensive income I (loss) - (10220) (10220) (146) (10366)
Transactions with owners in their capacity as owners Dividend paid - (2000) (2000) - (2000)
Share buy-back - shy - (382) (382)
At 30 June 2012 623 (311) 312 - 312
Consolidated 2011 Asset Retained Owners of the Non-controlling Total revaluation reserve earnings parent interest equity
$000 $000 $000 $000 $000
At 1 July 2010 - 12059 12059 856 12915
Net effect ofa correction of an error 623 shy 623 - shyRestated balance as at 1 July 2010 623 12059 12682 856 13538
728 (143) 585Profit for the period - 728
Other comprehensive income I (loss) - 122 122 - 122
Total comprehensive income I (loss) - 850 850 (143) 707
Transactions with owners in their capacity as owners Dividend paid - (1000) (1000) - (1000)
Share buy-back - shy - (185) (185)
At 30 June 2011 623 11909 12532 528 13060
Parent 2012 Asset Retained Owners of the Total revaluation reserve earnings parent equity
$000 $000$000 $000
At 1 July 2011 623 11909 12532 - 12532
Profit for the period - 816 816 - 816
(11036) - (11036)Other comprehensive income I (loss) - (11036)
(10220) - (10220)Total comprehensive income I (loss) - (10220)
(2000) - (2000)Dividend paid - (2000)
312 - 312At 30 June 2012 623 (311)
Owners of the TotalParent 2011 Asset revaluation Retained parent equityreserve earnings
$000 $000$000 $000
1104 - 1104At 1 July 2010 - 1104
- - 623Net effect of a correction of an error 623 shy1104 1727Restated balance as at 1 July 2010 623 1104
11683 - 11683Profit for the period - 11683
122 - 122Other comprehensive income I (loss) - 122
11805 - 11805Total comprehensive income I (loss) - 11805
(1000) - (1000)Dividend paid - (1000)
12532 - 12532At 30 June 2011 623 11909
The statement of changes in equity is to be read in conjunction with the notes to the financial statements
9
RESIDUAL BUSINESS MANAGEMENT CORPORATION GROUP STATEMENT OF CASH FLOWS FOR THE YEAR ENDED 30 JUNE 2012
Cash flows from operating activities Receipts from customers (inclusive of goods and services tax) Payments to suppliers and employees (inclusive of goods and services tax) Payments for inventory and related costs Rent received Interest received Increase (decrease) in operating liabilities
Net intra-group loans and advances
Note 2012 $000
Inflows Outflows
69
(626)
653
Consolidated 2011
$000 Inflows
(Outflows)
70
(742)
7 786
Parent Entity 2012 2011
$000 $000 Inflows Inflows
Outflows (Outflows)
24 30
(325) (368)
573 689
(57
Net cash inflow( outflow) from operating activities 16(a) 96 121 272 294
Cash flows from investing activities Proceeds from the sale of non-current assets Dividends received Investments acquired Investments redeemed Proceeds from disposal of investments Purchase of property plant amp equipment
(773) 2600
(11682) 12213
670 (805) 2550
265
10993 (11675)
1120
Net cash inflow(outlow) from investing activities 1827 531 2680 438
Cash flows from financing activities Dividends paid Share buy-back (paid to minorities)
(2000) 382
(1000) (185)
(2000) (1000)
Net cash inlow(outflow) from financing activities 2382 (1185) 2000 (1000)
Net increase( decrease) in cash amp cash equivalents held (459) (533) 952 (268)
Cash and cash equivalents at the beginning of the financial year 1500 2033 89 357
Cash and cash equivalents at the end ofthe year 16(b) 1041 1500 1041 89
The statement of cash flows is to be read in conjunction with the notes to the financial statements
10
RESIDUAL BUSINESS MANAGEMENT CORPORATION GROUP
NOTES TO THE FINANCIAL STATEMENTS for Year Ended 30 June 2012
Note 1 - Summary of significant accounting policies
The Residual Business Management Corporation Group (the Group) is a special purpose for-profit entity incorporated and domiciled in Australia The financial statements of the Group for the year ended 30 June 2012 were authorised for issue by the General Manager on the sixth day of May 2014
(a) Statement of compliance
The financial statements have been prepared to comply in all material respects with the directives of the NSW Treasurer Australian Accounting Standards and interpretations issued by Australian Accounting Standard Board
(b) Basis ofpreparation
The financial statements are general purpose financial statements which have been prepared in accordance with
bull applicable Australian Accounting Standards (which include Australian Accounting Interpretations)
bull the requirements of the Public Finance and Audit Act 1983 (as amended) and bull the requirements of the Public Finance and Audit Regulation 2010
The financial statements have been prepared on the historical cost basis except for the following assets and liabilities that are stated at their fair value derivative financial instruments financial instruments held for trading financial instruments classified as available-for-sale and investment property Any non-current assets which are held for sale are stated at the lower of carrying amount and fair value less costs to sell
The report of the subsidiary Pacific Solar has been prepared on a liquidation basis and its assets and liabilities are measured and recorded at their recoverable amount
The financial statements are presented in Australian dollars Amounts in the financial statements have been rounded off to the nearest thousand dollars unless otherwise stated
(c) Basis ofconsolidation
The consolidated financial statements comprise the financial statements of Residual Business Management Corporation (RBMC) as at and for the year ended 30 June 2012 Interests in associates are equity accounted and are not part of the consolidated Group Subsidiaries are all those entities over which the Group has the power to govern the financial and operating policies so as to obtain benefits from their activities The existence and effect of potential voting rights that are currently exercisable or convertible are considered when assessing whether a group controls another entity
Except for Pacific Solar Pty Ltd the financial statements of the group are prepared for the same reporting period as the parent company using consistent accounting policies In preparing the consolidated financial statements all intercompany balances and transactions income and expenses and profit and losses resulting from intra-group transactions have been eliminated in full
Subsidiaries and special purpose entities are fully consolidated from the date on which control is obtained by the Group and cease to be consolidated from the date on which control is transferred out of the Group
11
RESIDUAL BUSINESS MANAGEMENT CORPORATION GROUP
NOTES TO THE FINANCIAL STATEMENTS for Year Ended 30 June 2012
Note 1-Summary of significant accounting policies (continued)
(c) Basis ofconsolidation (continued)
Investments in subsidiaries held by RBMC are accounted for at cost in the separate financial statements of the parent entity less any impairment charges Dividends received from subsidiaries are recorded as a component of other revenues in the separate income statement of the parent entity and do not impact the recorded cost of the investment Upon receipt of dividend payments from subsidiaries the parent will assess whether any indicators of impairment of the carrying value of the investment in the subsidiary exist Where such indicators exist to the extent that the carrying value of the investment exceeds its recoverable amount an impairment loss is recognised as a net fair value loss on an available-for-sale financial asset in the comprehensive income section of the statement ofcomprehensive income
The acquisition of subsidiaries is accounted for using the acquisition method of accounting The acquisition method of accounting involves recognising at acquisition date separately from goodwill the identifiable assets acquired the liabilities assumed and any non-controlling interest in the acquiree The identifiable assets acquired and the liabilities assumed are measured at their acquisition date fair values The difference between the above items and the fair value of the consideration (including the fair value of any pre-existing investment in the acquiree) is goodwill or a discount on acquisition
(d) Significant accountingjudgments estimates and assumptions
The preparation of the financial statements in conformity with the Australian Accounting Standards requires management to make judgments estimates and assumptions that affect the application of policies and reported amounts of assets and liabilities income and expenses The estimates and associated assumptions are based on historical experience and various other factors that are believed to be reasonable under the circumstances the results of which form the basis of making the judgments about carrying values of assets and liabilities that are not readily apparent from other sources Actual results may differ from these estimates
(e) Revenue and expense recognition
Revenue is recognised to the extent that it is probable that the economic benefits will flow to the Group and the revenue can be reliably measured Where amounts do not meet these recognition criteria they are deferred and recognised in the period in which the recognition criteria are met Revenues are recognised at the fair value of the consideration received for the sale of goods and services net of the amount of Goods and Services Tax and rebates Revenue and expenses are recognised for the major business activities as follows
Interest revenue
Interest revenue is recognised as it accrues taking into account the effective yield on the financial asset
Unrealised gains I losses
Unrealised gains or losses on the Hour-Glass investment Facilities are recognised to reflect the current fair value of the investment Those unrealised gains will be deducted from other comprehensive income in the period in which the realised gains I losses are recognised in the statement of comprehensive income
12
RESIDUAL BUSINESS MANAGEMENT CORPORATION GROUP
NOTES TO THE FINANCIAL STATEMENTS for Year Ended 30 June 2012
Note 1-Summary of significant accounting policies (continued)
(f) Goods and services tax
Revenues expenses and assets are recognised net of the amount of goods and services tax (GST) except where the amount of GST incurred is not recoverable from the Australian Tax Office (ATO) In these circumstances the GST is recognised as part of the cost of acquisition of the asset or as part of the expense Receivables and payables are stated with the amount of GST included The net amount of GST recoverable from or payable to the ATO is included as a current asset or liability in the Statement of Financial Position Cash flows are included in the Statement of Cash Flows on a gross basis The GST components of cash flows arising from investing and financing activities which are recoverable from or payable to the A TO are classified as operating cash flows
(g) Income tax
Income tax on the statement of comprehensive income for the periods represented comprises current and deferred tax Income tax is recognised except to the extent that it relates to items recognised directly in equity in which case it is recognised in equity
Current tax is the expected tax payable on the taxable income for the year using tax rates enacted or substantially enacted at the date of the balance sheet and any adjustment to tax payable in respect of previous years
Deferred tax is provided using the balance sheet liability method providing for temporary differences between the carrying amounts of assets and liabilities for financial reporting and the amounts used for taxation purposes The amount of deferred tax provided is based on the expected manner of realisation or settlement of the carrying amount of assets and liabilities using tax rates enacted or substantially enacted at the date of the balance sheet
A deferred tax asset is recognised to the extent that it is probable that future taxable profits will be available against which the asset can be utilised Deferred tax assets are reduced to the extent that it is no longer probable that the related tax benefit will be realised
RBMC and its previously controlled subsidiary Pacific Solar Pty Limited formed an tax consolidated group for OSR purposes on 24 February 2012 when Pacific Solar Pty Limited became a wholly-owned subsidiary of RBMC as a result of the buy-back of all minority shares Upon consolidation all of Pacific Solar Pty Limiteds tax losses were acquired by RBMC at the available statutory fraction The resulting deferred tax asset is not recognised in the RBMC Group because recovery is not certain
(h) Trade and other receivables
Trade debtors and other receivables are stated at their amortised cost less any identified impairment losses Impairment charges are brought to account as described in Note l(m)
(i) Cash and cash equivalents
For purposes of the Statement of Cash Flows cash includes cash balances deposits at call with financial institutions and other highly liquid investments with short periods to maturity which are readily convertible to cash on hand and are subject to an insignificant risk of changes in value net of outstanding bank overdrafts Cash management trust holdings are disclosed as a current financial asset Movements in Group intercompany balances backed by available cash reserves are treated as cash flows Such cash movements are eliminated on consolidation
13
RESIDUAL BUSINESS MANAGEMENT CORPORATION GROUP
NOTES TO THE FINANCIAL STATEMENTS for Year Ended 30 June 2012
Note 1-Summary of significant accounting policies (continued)
(j) Acquisitions ofassets
Items of plant and equipment are initially recorded at cost being the fair value of the consideration provided plus incidental costs directly attributable to the acquisition and where relevant the initial estimate of the costs of dismantling and removing the items and restoring the site on which they are located and non-specialised assets with short useful lives are measured at depreciated historical cost as a surrogate for fair value Any individual items that have a fair value of less than $500 are expensed during the year in which the expenditure is incurred Items of property plant and equipment are depreciated and amortised as described in Note l(k) All repairs and maintenance are charged to the statement of comprehensive income during the financial period in which they are incurred
(k) Depreciation ofplant and equipment
Depreciation is charged to the statement of comprehensive income on a straight-line basis over the estimated useful life of each part of an item of property plant and equipment taking into account estimated residual values Assets are depreciated or amortised from the date of acquisition
The residual values and useful lives of the assets are reviewed and the depreciation and amortisation rates and methods adjusted if appropriate on an annual basis When these changes are made the adjustments are reflected prospectively in current and future periods only
The depreciation rates used for each class of asset (in both the current and prior year) are as follows
Asset class Rate Method
Plant and equipment 20 Straight-line
(l) Sale ofnon-current assets
Non-current assets sold during the year
In the course of its continuing activities other transactions (including the sale of non-current assets such as investments and operating assets) may be undertaken that are incidental to the main revenue generating activities of the Group The results of such transactions are presented by netting the sale proceeds on disposal less selling cost and the carrying value of the asset at the date control of the asset passes to the buyer
(m) Impairment
The Group assesses asset impairment at each reporting date by evaluating conditions specific to the Group that may lead to the impairment of assets Where an impairment trigger exists the recoverable amount of the asset is determined Value-in-use calculations performed in assessing recoverable amounts incorporate a number of key estimates
No additional impairment with respect of the Groups intangible and contract receivable assets has been recognised in the financial year ending 30 June 2012 (2011 $Nil)
14
RESIDUAL BUSINESS MANAGEMENT CORPORATION GROUP
NOTES TO THE FINANCIAL STATEMENTS for Year Ended 30 June 2012
Note 1-Summary of significant accounting policies (continued)
(m) Impairment (continued)
Calculation of recoverable amount
The recoverable amount of receivables is calculated as the present value of the estimated future cash flows discounted at the original effective interest rate (being the pre-tax rate that reflects the current market assessment of the time value of money) Receivables with a short duration are not discounted
Impairment of receivables is not recognised until objective evidence is available that an impairment event has occurred Significant receivables are individually assessed for impairment The recoverable amount of other assets is the greater of their fair value less costs to sell and value in use In assessing value in use the estimated future cash flows are discounted to their present value using a pre-tax discount rate that reflects current market assessments of the time value of money and the risks specific to the asset For an asset that does not generate largely independent cash inflows the recoverable amount is determined for the cash-generating unit to which the asset belongs
Reversals of Impairment
An impairment loss in respect of a receivable carried at recoverable amount is reversed if the subsequent increase in recoverable amount can be related objectively to an event occurring after the impairment loss was recognised
In respect of other assets an impairment loss is reversed if there has been a change in the estimates used to determine the recoverable amount An impairment loss is reversed only to the extent that the carrying amount of the asset does not exceed the carrying amount that would have been determined net of depreciation and amortisation if no impairment loss had been recognised
(n) Trade and other payables
Payables are stated at amortised cost and represent liabilities for goods and services provided to the Group prior to the end of the financial period and which are unpaid The amounts are unsecured and are usually paid within 30 days ofrecognition
(o) Intangibles
Prior to the current year the Group had assessed its acquired non -thin film intellectual property to be impaired so a full impairment provision had been recognised The Group has reviewed the recoverability of its royalty receivable right from CSG Solar AG The continued insolvency of this German company that acquired the Groups thin film intellectual property has meant the termination of the Groups rights in relation to this intellectual property The Group is awaiting the liquidation distribution but the Group is expecting no material return
(p) Inventories
Inventories held for distribution are stated at cost adjusted when applicable for any loss of service potential A loss of service potential is identified and measured based on the existence of a current replacement cost that is lower than the carrying amount Inventories (other than those held for distribution) are stated at the lower of cost and net realisable value Cost is calculated using the weighted average cost or first in first out method The cost of inventories acquired at no cost or for nominal consideration is the current replacement cost as at the date of acquisition Current replacement cost is the
15
RESIDUAL BUSINESS MANAGEMENT CORPORATION GROUP
NOTES TO THE FINANCIAL STATEMENTS for Year Ended 30 June 2012
Note 1-Summary of significant accounting policies (continued)
(p) Inventories (continued)
cost the Group would incur to acquire the asset Net realisable value is the estimated selling price in the ordinary course of business less the estimated costs of completion and the estimated costs necessary to make the sale However on the basis that it was more likely than not that the Group would dispose of the inventories of Pacific Solar on a wind-up basis rather than as part of business operations conducted by the Group the net realisable value of inventory at 30 June 2011 had been reduced by $15530814 to $1179155 the fire-sale value established by an independent valuation at 30 November 2011 During the current financial year the now wound-up subsidiary sold all remaining inventory at the best achievable price and warranty outcome
(q) Investments
Investments in unlisted companies are reviewed annually and are carried at their cost of acquisition Shares in subsidiary companies are included at their cost of acquisition and are eliminated on consolidation
The Hour-Glass Investment Facilities are recognised at fair value through profit or loss using the second leg of the fair value option The unrealised movement in the fair value of the Hour-Glass Investment Facilities is reported in the line item Other income
(r) Dividend calculation
Dividends are calculated with reference to the TPP 02-3 Financial Distribution Policy for Government Businesses In 2012 a dividend of $200000000 was paid to NSW Treasury (2011 $100000000)
(s) Dividend policy
The Corporation pays dividends out of surplus funds in a manner that is considered prudent and in a quantum that will not prejudice the interests of the Corporation or its creditors
(t) Superannuation defined benefits
The Corporation recognises the net deficiency in its defined benefit superannuation funds as is calculated by the NSW Treasury appointed actuary
Actuarial gains or losses are recognised in other comprehensive income (directly through retained earnings) in the reporting period in which they occur
(v) Property
RBMCs property accounting policy is to recognise the fair value of the property it controls The value of RBMC s property is established at the end of each financial year based on the best information then available Revaluation increments are credited directly to asset revaluation reserve except that to the extent that an increment reverses a revaluation decrement in respect of that asset previously recognised as an expense in the profit or loss the increment is recognised immediately as revenue in the profit or loss Revaluation decrements are recognised immediately as expenses in the profit or loss except that to the extent that a credit balance exists in the asset revaluation reserve in respect of the asset they are debited directly to the asset revaluation reserve
16
RESIDUAL BUSINESS MANAGEMENT CORPORATION GROUP
NOTES TO THE FINANCIAL STATEMENTS for Year Ended 30 June 2012
Note 2 -Correction ofPrior Period Errors
(a) Superannuation
The Group had previously recognised all gains and losses including actuarial gains and losses for the year in its defined benefit superannuation funds as an item of other comprehensive gains I (losses) in its statement of other comprehensive income AASB 119 Sections 93A and 93B allow only defined benefit actuarial superannuation gains and losses to be recognised in other comprehensive income
To correct this error the Statement of Comprehensive Income as at 30 June 2011 for the comparative year were restated as follows
bull Other income was increased by $625000 and bull Actuarial gain on defined benefit plans was decreased by $625000
Restatement of Financial Statements as a Result of Change in Accounting Policy
30 June 2011 Comparative year Original Change in Accounting Restated Policy Adj
Financial Report Line Item 2011 2011 2011 2011 2011 2011 I Balance Affected $000 $000 $000 $000 $000 $000
Consolidated Parent Consolidated Parent Consolidated Parent Entity Entity Entity
Statement of Com[rehensive Income Extract Other income 4 4 625 625 629 629 Profit I (loss) from continuing operations
(40) 11058 625 625 585 11683 before income tax Profit I (loss) from continuing operations
(40) 11058 625 625 585 11683 after income tax
Other comprehensive income Actuarial (loss) I gain on defined benefit plans
Total comprehensive income for the year 747 747
747 747
(625) (625)
(625) (625)
122 122
122 122
Profit I (loss) for the year is attributed to Owners of the parent 103 11058 625 625 728 11683
Note 3 - Other revenue and income Extract (b) Other income Superannuation gain on defined benefit schemes 625 625 625 625
Total other income 4 4 625 625 629 629
17
RESIDUAL BUSINESS MANAGEMENT CORPORATION GROUP
NOTES TO THE FINANCIAL STATEMENTS for Year Ended 30 June 2012
Note 2 -Correction of Prior Period Errors (continued)
(b) Correction of a Prior Period Error
In October 2012 RBMC determined it still retained some land parcels in the past former names ofRBMC The total land parcel value at 30 June 2012 was determined by Management based on independent valuation to be $2123000 However RBMC has established that $1500000 worth of its land is controlled by a Local Government entity and has not recognised it in the statement of financial position in either the current or prior years Due to the aforementioned land parcels RBMC has booked a prior period error correction to its statement of financial position It has recognised the value of the land parcels that it presently controls
As this error was made in a financial year prior to the comparative year the Statement of Financial Position opening balances as at 30 June 2010 were restated as follows
bull Property plant and equipment was increased by $623000 to recognise the land that were not previously recognised in RBMCs financial statement This increase to property plant and equipment was made up as follows
o Land by $623000 bull Asset revaluation reserve was increased by $623000 which was made up as follows
o An increase of $623000 for the land asset revaluation reserve and bull Total parent interest was increased by $623000
The same correction was made to the statement of financial position at 30 June 2011 Namely
bull Land increased by $623000 bull The asset revaluation reserve was increased by $623000 which was made up as follows
o An increase of $623000 for the land asset revaluation reserve and bull Total parent interest was increased by $623000
Note (b) continues on the following page
18
RESIDUAL BUSINESS MANAGEMENT CORPORATION GROUP
NOTES TO THE FINANCIAL STATEMENTS for Year Ended 30 June 2012
Note 2 -Correction of Prior Period Errors (continued)
(b) Correction of a Prior Period Error (continued)
Restatement of Financial Statements as a Result of Correction of an Error
30 June 2011 Comparative year Original Correction of Error Restated Adj
Financial Report Line Item 2011 2011 2011 2011 2011 2011 I Balance Affected $000 $000 $000 $000 $000 $000
Consolidated Parent Consolidated Parent Consolidated Parent Entity Entity Entity
Statement of Financial Position Extract
Non-current assets Pro2erty 2lant and egui2ment 9 623 623 632 623
Total non-current assets 16 760 623 623 639 1383
Total assets 13652 13110 623 623 14275 13733
Net assets 12437 11909 623 623 13060 12532
Equity Parent equity interest
Asset revaluation reserve 623 623 623 623 Total ~arent interest 11909 11909 623 623 12532 12532
Total equity 12437 11909 623 623 13060 12532
Statement of Changes in Equity Extract
Opening Balance Asset revaluation reserve 623 623 623 623
Note 13 Property Plant and Equipment Extract
Total depreciated value property amp equip 9 623 623 632 623
a) Reconciliation of written down value of asset classes Non-current Land at fair value Plant and equipment - at fair value Accumulated depreciation Total depreciated value of plant and equipment
34 (25)
9
623
623
623
623
623 34
(25) 632
623
623
b) Movement in the property asset revaluation reserve
Asset revaluation reserve carried forward Asset Revaluation Reserve balance 30 June
623 623
623 623
623 623
623 623
19
RESIDUAL BUSINESS MANAGEMENT CORPORATION GROUP
NOTES TO THE FINANCIAL STATEMENTS for Year Ended 30 June 2012
Note 2 - Correction of Prior Period Errors (continued)
Restatement of Financial Statements as a Result of Correction of an Error (continued)
1 July 2010 (Comparative year opening balances) Original Correction of Error Restated Adj
Financial Report Line Item I 2010 2010 2010 2010 2010 2010 Balance Affected
$000 $000 $000 $000 $000 $000 Consolidated Parent Consolidated Parent Consolidated Parent
Entity Entity Entity Statement of Financial Position Extract
Non-current assets ProQerty Qlant and eguiQment 15 623 623 638 623
Total non-current assets 32 1232 623 623 655 1855
Total assets 14908 3086 623 623 15531 3709
Net assets 12915 1104 623 623 13538 1727
Equity Parent equity interest
Asset revaluation reserve 623 623 623 623 Total Qarent interest 12059 1104 623 623 12682 1727
Total equity 12915 1104 623 623 13538 1727
Note 13 Pro~ertv2 Plant and Egui~ment Extract
Total depreciated value property amp equip 15 623 623 638 623
a) Reconciliation of written down value of asset classes Non-current Land at fair value Plant and equipment - at fair value Accumulated depreciation Total depreciated value of plant and equipment
34 (19)
15
623
623
623
623
623 34
(19) 638
623
623
b) Movement in the property asset revaluation reserve
Asset revaluation reserve carried forward Asset Revaluation Reserve balance 30 June
623 623
623 623
623 623
623 623
20
RESIDUAL BUSINESS MANAGEMENT CORPORATION GROUP
NOTES TO THE FINANCIAL STATEMENTS for Year Ended 30 June 2012
Consolidated Parent Entity 2012 2011 2012 2011
$000 $000 $000 $000 Note 3 - Other revenue and income
(a) Other revenue Interest received or receivable 628 792 589 689 Dividend from controlled entity 670 10993 Total other revenue 628 792 1259 11682
(b) Other income Revaluation gain on T Corp units 151 151 Reimbursements 10 Insurance premium refunds 4 4 Superannuation gain on defined benefit schemes 662 625 662 625 Total other income 813 629 823 629
Excludes superannuation actuarial losses of $11035456 (2010 gains of $122125) included in other comprehensive income (Refer notes 27(b) and 24)
Note 4 - Expenses
(a) Depreciation amp amortisation 9 7
(b) Occupancy expenses Operating lease rental expense 23 31
(c) Administrative expenses Auditors remuneration 88 66 65 44 Directors remuneration 123 135 82 67 Document storage 1 50 1 50 Insurance premiums 77 120 58 97 Business Manager 170 155 101 72 Travel 1 16 1 Other sundry costs 75 37 39 36 Total administrative expenses 535 579 347 366
(d) Other expenses Revaluation loss on financial assets 53 53 Impairment loss of subsidiary 760 206 Revaluation of inventory 155 Revaluation loss of non-current investment 10 Consultant fees 31 12 Total other expense 31 230 760 259
21
RESIDUAL BUSINESS MANAGEMENT CORPORATION GROUP
NOTES TO THE FINANCIAL STATEMENTS for Year Ended 30 June 2012
Consolidated Parent Entity 2012 2011 2012 2011
$000 $000 $000 $000 Note 5 - Income tax expense
(a) The prima facie tax payable on profit from ordinary activities before income tax is reconciled to the income tax expense as follows Operating profit before income tax 670 585 816 11683 Prima facie tax benefit on losses from ordinary activities before income tax at 3 0 (2011 3 0) Economic entity 201 176 Parent entity 245 3505 Add Tax effect ofnon-deductible items Sundry items 1 2 Less Tax effect of Tax losses (utilised) not brought to account 202 (178) 245 (3505) Income tax expense equivalent
Deferred tax assets not brought to account
(b) The deferred tax asset arising from the following tax losses and timing differences has not been recognised as an asset because recovery is not probable
Unused tax losses for which no deferred tax asset has been recognised 23170 29414 23170 19029 Unused capital losses for which no deferred tax asset has been recognised 1058 1058
24228 29414 24228 19029 Potential deferred tax assets at 30 not brought to account 7268 8824 7268 5709
Note 6 - Current assets - cash and cash equivalents
Cash at bank 1041 1500 1041 89 Total cash amp cash equivalents 1041 1500 1041 89
For reconciliation of cash and cash equivalents to the Statement of Cash Flows refer to Note 16 (b)
Note 7 - Current assets -T Corp Hour-Glass cash facility
T Corp Hour-Glass cash facility 10240 12075 10240 11993 Total T Corp Hour-Glass cash facility 10240 12075 10240 11993
22
RESIDUAL BUSINESS MANAGEMENT CORPORATION GROUP
NOTES TO THE FINANCIAL STATEMENTS for Year Ended 30 June 2012
Consolidated Parent Entity 2012 2011 2012 2011
$000 $000 $000 $000 Note 8 - Current assets- trade and other receivables Trade debtors I I Other debtors 10 6 10 I Interest receivable 16 42 16 I Other 265 Total trade and other receivables 26 49 26 268
Note 9 - Current assets - inventories
Finished goods - at lower of cost or realisable value 12 Total current assets - inventories 12
Note 10 - Non-current - trade and other receivables Deposits 7 Total trade and other receivables 7
Note 11- Non-current - financial assets
Shares in controlled entities (cost) - refer 11 (i) 56954 Less impairment adjustment (56194) Carrying value controlled entities 760 Shares in unlisted companies 10 Less impairment (10) Total financial assets 760
Controlled entities Residual Business Management Corporation acquired 100 (2011 59) of the shares in Pacific Solar Pty Limited on 24 February 2012 On 9 May 2012 Pacific Solar Pty Ltd was wound up and deregistered as a solvent entity
(i) The Group included the following controlled entity Country of Percentage of equity interest Investment
Entity name Incorporation held by the consolidated entity 2012 2011 2012 2011
$000 $000 Pacific Solar Pty Limited Australia Nil 59 760
Rounded to whole percent
23
RESIDUAL BUSINESS MANAGEMENT CORPORATION GROUP
NOTES TO THE FINANCIAL STATEMENTS for Year Ended 30 June 2012
Note 12 - Other non-current assets
Contract receivable Cost of goodwill re-acquired Less impairment
Consolidated 2012 2011
$000 $000
3324 8172 235
(3324) (8407)
Parent Entity 2012 2011
$000 $000
3324
(3324) Total other non-current assets
Movement in the allowance for impairment
Accumulated impairment carried forward (8407) (8407) Acc impairment written-back I (booked) 5083 (3324) Impairment balance 30 June
Note 13 - Non-current asserts - property plant and equipment
Total depreciated value property amp equip
(3324) (8407) (3324)
Consolidated Parent Entity 2012 2011 2010 2012 2011 2010
$000 $000 $000 $000 $000 $000
623 632 638 623 623 623
623 623 623 623 623 623 34 34
(25) (19) 623 632 638 623 623 623
a) Reconciliation of written down value of asset classes
Non-current Land at fair value Plant and equipment - at cost Accumulated depreciation Total depreciated value property amp equip
The prior period balance sheet has been adjusted for land parcels that were determined in 2012 to be owned and controlled by RBMC well prior to 30 June 2011 The land parcels are stated at the NSW Lands Departments commissioned valuations Refer note 2(b) for more information
24
RESIDUAL BUSINESS MANAGEMENT CORPORATION GROUP
NOTES TO THE FINANCIAL STATEMENTS for Year Ended 30 June 2012
Consolidated 2012 2011
$000 $000
Parent Entity 2012 2011
$000 $000
Note 14- Payables
Current Trade creditors Other creditors and accruals Total current payables
25 18 43
10 4
14
25 18 43
Terms and conditions relating to the above payables
(i) Trade creditors are non-interest bearing and are settled on 30 day terms (ii) Other creditors and accruals are non-interest bearing and normally settled on 30 day terms
Note 15 - Provisions
Non-current Superannuation net liability 27(b) 11575 1201 11575 1201
~~~~~~~~~~~~~~~~~
Total non-current provisions 11575 1201 11575 1201
Total provisions 11575 1201 11575 1201
Note 16 - Cash flow information
(a) Reconciliation of profit(loss) for the year after tax to net cash flows from operating activities
Profit I (loss) after income tax 670 585 816 11683 Non-cash items (Gain) I loss on investments 8 18 8 56 Depreciation of non - current assets 9 7 Superannuation (gain) on defined benefit schemes (662) (625) (662) (625) Investment activity transactions Dividends from investments (670) (10993) Changes in assets and liabilities (Decrease) I increase in trade and other debtors (3) 2 (7) (Decrease) I increase in other creditors 14 3 18 (26) (Decrease) I increase in provisions (35) Decrease I (increase) in other assets 33 (6) (16) 1 (Increase) I decrease in financial assets 10 760 206 (Increase) I decrease in inventory 12 162 Increase I (decrease) in creditors and borrowings 15 25 (8) Net cash flows from operating activities 96 121 272 294
(b) Reconciliation of cash and cash equivalents
Cash and cash equivalents 1041 1500 1041 89 Balance as per Statement of Cash Flows 1041 1500 1041 89
25
RESIDUAL BUSINESS MANAGEMENT CORPORATION GROUP
NOTES TO THE FINANCIAL STATEMENTS for Year Ended 30 June 2012
Note 16 - Cash flow information (continued)
(c) Acquisitions and disposal of entities
On 24 February 2012 RBMC became the wholly owned parent of Pacific Solar Pty Limited On the 9 May 2012 the Group effectively disposed of Pacific Solar Pty Limited due to it being wound-up and deregistered as a solvent entity on that date RBMC acquired the remaining assets of Pacific Solar they being intellectual property There were no other acquisitions of entities during the year ended 30 June 2012
(d) Financing Arrangements
Neither Residual Business Management Corporation nor any of its controlled entities have any external financing arrangements in place at year end or during the financial year
Note 17 - Commitments for expenditure
(i) Expenditure commitments
No entity in the Group had any expenditure commitments at year end or the prior year end
(ii) Lease expenditure commitments
The Group has a monthly rental agreement with Kennards Self Storage at a cost including GST of $37200 At 30 June 2012 the total rent lease commitments for warehousing facilities is $223200 (2011 $2335968)
Note 18 - Contingent liabilities
There are a number of legal actions that have been taken against RBMC and they have been defended The actions appear to have ceased without recent cost or exposure to RBMC However it is prudent to advise that future legal costs and if applicable settlement will be less than $50000 in the unlikely event that the actions are re-instigated and lost
Note 19 - Related party disclosures
Directors
The names of persons that were Directors or the equivalent of Directors or officers of Residual Business Management Corporation or its controlled entities at any time during the financial year were as follows
Residual Business Management Corporation
Dominic Schuster - General Manger - Appointed 1 September 2012 Andrew dApice - Former General Manger- Ceased 31 August 2012 Mark Guest- Secretary amp Comptroller (equivalent to a Company Secretary amp Finance officer)
Pacific Solar Pty Limited (Deregistered on 9 May 2012)
Andrew dApice- Former Executive Director (Chair)-Appointed 20 January 2012 and Ceased 9 May 2012 Mark Guest-Former Executive Officer amp Company Secretary-Ceased 9 May 2012
26
RESIDUAL BUSINESS MANAGEMENT CORPORATION GROUP
NOTES TO THE FINANCIAL STATEMENTS for Year Ended 30 June 2012
Note 19 - Related party disclosures (continued)
Pacific Solar Pty Limited (Deregistered on 9 May 2012) (continued)
Alan Cox - Former Non-Executive Director (Chair)- Resigned 20 January 2012 Edward Slack- Former Non-Executive Director- Resigned 20 January 2012 James Henderson - Former Non-Executive Director- Resigned 24 February 2012 Alfredo Palestini- Former Non-Executive Director-Resigned 24 February 2012
Ultimate parent entity
The ultimate parent entity of the RBMC Group is the New South Wales Government Residual Business Management Corporation (RBMC) is the parent entity within the RBMC Group and it owned 59 percent of Pacific Solar Pty Limited for the period from 1 July 2011 to 23 February 2012 RBMC then owned 100 percent of the former subsidiary Pacific Solar Pty Limited from 24 February 2012 until its deregistration on 9 May 2012
Transactions with related parties
All related party transactions were unsecured and based on normal terms and conditions By resolution on 6 March 2012 RBMC approved the wind-up of Pacific Solar Pty Limited and agreed to assume its known legal obligations and the expenses of the subsidiary during the wind-up process At the signing date of this report the Group believes that the deregistered Pacific Solar Pty Limited has no remaining financial obligations
There were no other cross guarantees between any entities in the RBMC Group
During the prior year the parent entity part funded the cost of Pacific Solars chairman details of which are set out below in this note
Pacific Solar Pty Limited
During the year RBMC provided funding to its former subsidiary Pacific Solar Pty Limited of Nil (2011 $29 10857) for part of the cost of its Director representative appointed to the Pacific Solar Board
During the year Pacific Solar provided funding to its parent of $9834 (2011 Nil) for part of the cost of the sole Director of the RBMC Group between February and March 2012
NewSouth Innovations Pty Limited a former minority shareholder of Pacific Solar provided Pacific Solar with information services in the 2012 year in the amount of Nil (2011 $5000) This was a normal commercial arrangement
During the year Pacific Solar completed a shareholder and ASIC approved share buy-back of all minority shareholdings RBMCs share of the buy-back payment was Nil (2011 $26548608)
This year Pacific Solar declared and paid dividends of $67039653 to RBMC (2011 Nil) being the sum of the all remaining cash and reserves of the former subsidiary company
RBMC received (paid) the following amounts from (to) or on behalf of its former subsidiary Pacific Solar
Creditor payments made $Nil (2011 $1666132) Cash returned to Pacific Solar $Nil (2011 $1037368)
At 30 June 2012 RBMC had an intercompany receivable of Nil (2011$26548608) with its former subsidiary Pacific Solar The 2011 receivable was paid by Pacific Solar to RBMC this financial year
27
RESIDUAL BUSINESS MANAGEMENT CORPORATION GROUP
NOTES TO THE FINANCIAL STATEMENTS for Year Ended 30 June 2012
Note 19 - Related party disclosures (continued)
Other Entities
During the year the RBMC Group paid remuneration to a registered Chartered Accountancy company directed and ultimately owned by Mark Guest of $18498761 (2011 $1943 53 50) This fee represents market rate remuneration for the services of Mark Guest three part-time tertiary qualified staff and the supply of the Groups registered office The parents share of this total Group remuneration was $10052472 (2011 $7205784) As part of the Pacific Solar wind-up RBMC agreed by resolution that it would assume responsibility for the contract entitlements of Mark Guests Firm The Pacific Solar contract entitlements expired on 6 September 2012 Mr Guests Firm continued to work on specific Pacific Solar related matters until mid-August 2012 and incidental matters until the date of the signing of this report
Note 20- Key management personnel compensation
Consolidated 2012 2011 $(not $(not
rounded) rounded)
Short-term benefits - RBMC 182222 139027 Short-tenn benefits - Pacific Solar Pty Limited 119843 151141 Termination benefits Total key management personnel compensation 302065 290168
Parent entity 2012 2011 $(not $(not
rounded) rounded)
Short-term benefits 182222 139027 Other long term benefits Post-employment benefits Termination benefits
182222 139027
In addition a benefit less than $150 (2011 $250) in credit card reward points was derived via the use of personal credit cards to make corporate payments on a normal executive use basis
28
RESIDUAL BUSINESS MANAGEMENT CORPORATION GROUP
NOTES TO THE FINANCIAL STATEMENTS for Year Ended 30 June 2012
Note 21 - Remuneration of Directors
Income paid or payable or otherwise made available to Directors by members of the Group and related parties in connection with the management of the Group
The number of Directors whose income from members of the Group and related parties was within the following bands
$0 - $9999 $10000 - $19999 $40000 - $49999 $50000 - $59999 $60000 - $69999 $80000 - $89999
Consolidated Parent Entity 2012 2011 2012 2011
$(not $(not $(not $(not rounded) rounded) rounded) rounded)
122636 134682 81698 66970
Number Number Number Number
3 3
2 2 1
In addition at the consolidated level benefits less than $250 (2011 $100) in credit card reward points was derived via the use of a personal credit card to make corporate payments on a normal executive use basis
No share options were or are held directly or indirectly by the Directors during the period or at balance date or during the prior year
Note 22 - Auditors remuneration
Amounts paid to or due and payable to the Auditor General ofNSW for - audit of the financial report of the entity and all other entities in the Group - other services in relation to the entity and all other entities in the Group
Consolidated Parent Entity 2012 2011 2012 2011
$000 $000 $000 $000
88 66 65 44
29
RESIDUAL BUSINESS MANAGEMENT CORPORATION GROUP
NOTES TO THE FINANCIAL STATEMENTS for Year Ended 30 June 2012
Note 23 - Financial risk management objectives and policies
The Groups principal financial instruments comprise receivables payables cash and term deposits These financial instruments arise directly from the Groups operations or are required to finance the Groups activities The Group does not enter into or trade financial instruments including derivative financial instruments for speculative purposes
(a) Risk exposures and responses
The Groups main risks arising from financial instruments are outlined below together with the Groups objectives policies and processes for measuring and managing risk Further quantitative and qualitative disclosures are included throughout these financial statements
The Groups General Manager has overall responsibility for the establishment and oversight of risk management and he reviews and agrees policies for the management of risk Risk management policies are established to identify and analyse the risks faced by the Group and to set risk limits and controls to monitor the risks Compliance with policies is reviewed by the General Manager on a continuous basis
(b) Financial instrument risk defined
The main financial instrument risks that the Group could be exposed to through its financial instruments are as follows
Interest Rate Risk
The Group is exposed to fluctuations in interest rates to the extent ofthe level of its invested cash
Credit Risk
The exposure to credit risk excluding the value of any collateral or other security held is the carrying amount of any provisions for impairment of the Groups recognised financial assets as disclosed in the Statement of Financial Position and notes to these financial statements
Liquidity Risk
The Group manages liquidity risk by monitoring forecast cash flows and ensuring that adequate cash reserves are maintained to fund creditor obligations
Foreign Currency Risk
The Group may be exposed to fluctuations in foreign currencies with respect of future royalty income
Price Risk
The Group is not currently exposed to any material commodity price risk
Sections ( e) to (i) ofthis note considers in detail those risk areas relevant to the Group
30
RESIDUAL BUSINESS MANAGEMENT CORPORATION GROUP
NOTES TO THE FINANCIAL STATEMENTS for Year Ended 30 June 2012
Note 23 - Financial risk management objectives and policies (continued)
(c) Financial instrument categories
Financial Instrument Class Table A Consolidated I Parent Note Category
(a) Financial assets
Cash and deposits 6 Cash T Corp Hour-Glass cash facility 7 Cash trust Receivables - non-current 10 Trade receivables (at amortised cost) Receivables - current 8 Other receivables (at amortised cost)
Total financial assets
(b) Financial liabilities
Payables 14 Trade and accruals measured at amortised cost
Total financial liabilities
Net financial assets
Total 2012 2011
$000 $000
1041 1500 10240 12075
- 7 26 49
11307 13631
43 14
43 H
11264 13617
(d) Financial instruments recognition policy
All Group financial assets and liabilities have been recognised at the reporting date at their net fair values The following methods and assumptions are used to determine the net fair values of financial assets and liabilities
Cash cash equivalents and short-term investments - the carrymg amount approximates fair value because of their short time maturity
Cash trusts - the carrying amount approximates fair value because the underlying trust assets are liquid investments and the financial instrument is redeemable at call
Trade receivables and trade creditors - the carrying amount approximates fair value because of their short term maturity There were no trade receivables that were past due or impaired at the year end
Contract and royalty receivables - the carrying amounts reflect impairment and discount to present value adjustments that derive an approximate fair value
Non-current investmentssecurities - for financial instruments traded in organised financial markets fair value is the current quoted market bid price for an asset or offer price for a liability adjusted for transaction costs necessary to realise the asset or settle the liability For investments where there is no quoted market price a reasonable estimate of the fair value is determined by reference to the current market value of another instrument which is substantially the same or is calculated based on the expected cash flows or the underlying net asset base of the investmentsecurity The carrying amount reflects an impairment that derives the approximate fair value
Unrecognised financial instruments- There are no unrecognised financial instruments
31
RESIDUAL BUSINESS MANAGEMENT CORPORATION GROUP
NOTES TO THE FINANCIAL STATEMENTS for Year Ended 30 June 2012
Note 23 - Financial risk management objectives and policies (continued)
(d) Financial instruments recognition policy (continued)
The entity uses the following hierarchy for disclosing the fair value of financial instruments by valuation technique
bull Level 1 - Derived from quoted prices in active markets for identical assets I liabilities bull Level 2 -Derived from inputs other than quoted prices that are observable directly or indirectly bull Level 3 - Derived from valuation techniques that include inputs for the asset I liability not based
on observable market data (unobservable inputs) 2012
Level 1 Level 2 Level 3 Total $000 $000 $000 $000
Financial assets at fair value TCorp Hour-Glass Inv Facility 10240 10240
10240 10240
The table above includes only financial assets as no financial liabilities were measured at fair value in the statement of financial position
The aggregate net fair values and carrying amounts of financial instruments are disclosed in the statement of financial position and the supporting notes to these financial statements
(e) Interest rate risk
Interest rate risk is the risk that the value of the financial instrument or its revenue or costs will fluctuate due to changes in market interest rates The Groups exposure to interest rate risk and the effective interest rates of its financial assets and liabilities at the reporting date are set out on the following pages
In respect of income-earning financial assets and interest-bearing financial liabilities the table on the following page sets out the carrying amount by maturity date of the financial instruments exposed to interest rate risk at reporting date
32
RESIDUAL BUSINESS MANAGEMENT CORPORATION GROUP
NOTES TO THE FINANCIAL STATEMENTS for Year Ended 30 June 2012
Note 23 - Financial risk management objectives and policies (continued)
(e) Interest rate risk (continued)
Table B Consolidated Fixed interest rate maturing in
Financial Instruments Floating interest rate
2012 2011 $000 $000
1 year or less
2012 2011 $000 $000
Over 1 to 5 years
2012 2011 $000 $000
More than 5 years
2012 2011 $000 $000
Non-interest bearing
2012 2011 $000 $000
Total carrying amount as per the
Statement of Financial Position
2012 2011 $000 $000
(i) Financial assets Cash at bank 41 92 1000 1408 1041 1500 Cash trust 10240 12075 10240 12075 Trade and other receivables 26 49 26 49
Total financial assets 10281 12167 1000 1408 26 49 11307 13624
Weighted average interest rate 489 475 585 578
(ii) Financial liabilities Trade creditors accruals and other creditors 43 14 43
Total financial liabilities 43 14 43
Weighted average interest rate
Net financial assets (liabilities 10281 12167 1000 1408 17 35 11264 13610
33
14
14
RESIDUAL BUSINESS MANAGEMENT CORPORATION GROUP
NOTES TO THE FINANCIAL STATEMENTS for Year Ended 30 June 2012
Note 23 - Financial risk management objectives and policies (continued)
(e) Interest rate risk (continued)
Interest rate risk scenario and sensitivity analysis
The Group invests in secure bank term deposits and with the NSW Governments Treasury Corporation (T Corp) The Group holds large cash reserves to deal with its legacy business issues and to enable it to enforce its contractual rights in relation to the intellectual property it has developed Interest rate movements have a large impact on the results of the Group The risk profile set by the General Manager results in the Group receiving only a small margin above or below the official Australian interest rate set by the Australian Reserve Bank Board The duration of each cash investment essentially drives the interest rate the Group receives
TCorp Hour-Glass facilities
Exposure to interest rate risk primarily arises through the investment in the TCorp Hour Glass Investment Facilities which are held for strategic rather than trading purposes The Group holds units in the following Hour-Glass investment trusts
Consolidated Parent
Facility Investment Sectors Investment Horizon 2012
$000 2011
$000 2012
$000 2011
$000
Cash facility Cash and money market securities At call 10240 12075 10240 11993
The unit price of the facility is equal to the total fair value of the net assets held by the facility divided by the number of units on issue for that facility Unit prices are calculated and published daily NSW TCorp is trustee for the above facility and is required to act in the best interest of the unit holders and to administer the trust in accordance with the trust deeds As trustee TCorp has appointed external managers to manage the performance and risk of the facility in accordance with a mandate agreed by the parties Significant portions of administration are also outsourced to an external custodian Investment in the Hour-Glass facilities limits the Groups exposure to risk as it allows diversification across a pool of funds with different investment horizons and a mix of investments
The impact on profit I loss 2012 is as follows
Consolidated Parent Facility Change in
Unit Price Impact on Profit I
Loss 2012 $000
Impact on Profit I Loss 2011
$000
Impact on Profit I Loss 2012
$000
Impact on Profit I Loss 2011
$000 Cash facility +-1 102 121 102 120
NSW TCorp provides sensitivity analysis information for the cash facility using historical based volatility information collected over a ten year period quoted at two standard deviations (ie 95 probability)
The TCorp Hour-Glass investment facilities are designated at fair value through the Statement of Comprehensive Income and therefore any changes in unit price impacts directly on profit (rather than equity) A reasonably possible change is based on the percentage change in unit price multiplied by the redemption value as at 30 June each year for each facility
34
RESIDUAL BUSINESS MANAGEMENT CORPORATION GROUP
NOTES TO THE FINANCIAL STATEMENTS for Year Ended 30 June 2012
Note 23 - Financial risk management objectives and policies (continued)
(e) Interest rate risk (continued)
TCorp Hour-Glass facilities (continued)
The Groups term deposit cash investment sensitivity rates are similar As follows is the Groups judgement of reasonable possible movements in profits due to foreseeable changes in interest rates
(f) Credit risk
Credit Risk is the risk of financial loss arising to the Group from the default of another party with a contract or financial position with the Group The Group has material credit risk exposure to the CSG Solar AG Group in that at reporting date the Group has gross royalty rights receivable over time from CSG Solar AG Group of a least $332438395 (2011 $8 17197928) The table below states these gross receipts at their recoverable amount discounted to present value which is Nil (2011 $Nil) these written down values being the balances reflected in these financial statements These royalty rights are not past due but they are considered fully impaired Group policy is that all customers that wish to trade on credit terms are subject to a credit worthiness review
The Groups maximum exposure to credit risk and the applicable counter party is represented by the carrying amounts of its financial assets at reporting date as is set out in the following table (There was no past due balances at 30 June 2012)
Table C Financial
Instrument
Government Institutions
Australian Banks
CSG Solar AG Group
Other Commercial
entities Total
Consolidated 2012 $000
2011 $000
2012 $000
2011 $000
2012 $000
2011 $000
2012 $000
2011 $000
2012 $000
2011 $000
(a) Financial assets Cash and deposits - - 1041 1500 - - - - 1041 1500
Cash trust 10240 12075 - - - - - - 10240 12075 Trade receivables
amp other - - - - - - 26 49 26 49 Royalty rights
Impairment - - - -3324
(3324) 8172
(8172) --
--
3324 (3324)
8172 (8 172)
Net Rovalty - - - - - - - - - -Unlisted shares
Impairment --
--
--
--
--
10 (10)
--
--
--
10 (10)
Net unlisted shares - - - - - - - - - -Total 10240 12075 1041 1500 - - 26 49 11307 13624
35
RESIDUAL BUSINESS MANAGEMENT CORPORATION GROUP
NOTES TO THE FINANCIAL STATEMENTS for Year Ended 30 June 2012
Note 23 - Financial risk management objectives and policies (continued)
(g) Liquidity risk
Liquidity risk arises from the financial liabilities of the Group and the Groups subsequent ability to meet the obligations to repay the liabilities as and when they fall due As is disclosed above the Group maintains a high level of cash reserves to cover its material credit and warranty risks The Group has ongoing administrative costs require ongoing funding The following table provides the maturity dates of the Groups financial liabilities by bands
Table D
Maturity Bands
Financial liabilities
Trade creditors
Other creditors
Total financial liabilities
2012 2012 2011 2012 2011 more 2011 2012 2011 less less more more than 2 more More More
than than than 1 than 1 less than 2 than than one one less than less than than 5 less than 5 5 2012 2011 year year 2 years 2 years years 5 years years years Total Total $000 $000 $000 $000 $000 $000 $000 $000 $000 $000
25 12 - - - - - - 25 12
18 2 - - - - - - 18 2
43 14 - - - - - - 43 14
(h) Foreign currency risk
At the present time the Group has no material exposure to foreign currency risk The Groups above mentioned royalty rights are payable in Australian dollars
(i) Derivative financial instruments
During the financial year ending 30 June 2012 neither Residual Business Management Corporation nor any of its controlled entities had any known exposure to derivatives
36
RESIDUAL BUSINESS MANAGEMENT CORPORATION GROUP
NOTES TO THE FINANCIAL STATEMENTS for Year Ended 30 June 2012
Note 24-Retained earnings Note
Consolidated
2012 2011 $000 $000
Parent Entity
2012 2011 $000 $000
Balance at beginning of the financial year Owners of the parent comprehensive income (loss) Superannuation actuarial (losses) I gains Dividend paid or declared Balance at the end of the year
3(b) 27(c)
11909 816
(11036) 2000
(311
12059 728 122
(1000) 11909
11909 816
(11036) 2000
(311
1104 11683
122 (1000) 11909
Note 25 shy Non-controlling interests
As at 30 June 2011 the parent entity held an equity interest of 59 in Pacific Solar Pty Limited On 24 February 2012 a share buyback was approved by all minority shareholders for all of their Pacific Solar Pty Limited shares Thus on this date Pacific Solar became a fully owned subsidiary of RBMC Pacific Solar was then deregistered as a solvent entity on 9 May 2012 The buyback was based on a mid-point minority interest discount of 20 for the shares held by the following shareholders
Enipower SpA University ofNSW New South Innovations Pty Limited Thi An Dinh Morgan Michael Green Briana Keagan Green and Michelle Gaye Wenham
Reconciliation of non-controlling interest in RBMCs consolidated equity Non-controlling interest
2012 2011 $000 $000
Non-controlling interest in Pacific Solar share capital 36364 Non-controlling interests share ofretained (losses) at the end of the year (35836 Non-controlling interest in RBMCs consolidated equity 528
Note 26 - New Australian Accountings Standards issued but not effective
In the current year the Group has adopted all of the new and revised Standards and Interpretations issued by the AASB that are relevant to the operations and effective for the current reporting period Details of the impact of the adoption of these new accounting standards are set out in the individual accounting policies notes in the financial statements Certain new accounting standards and interpretations have been published that are not mandatory for the 30 June 2012 reporting period The Group did not early adopt any new accounting standards that are not yet effective The Group has assessed the impact of the new standards and interpretations on issue but not effective and considers the impact to be insignificant
37
RESIDUAL BUSINESS MANAGEMENT CORPORATION GROUP
NOTES TO THE FINANCIAL STATEMENTS for Year Ended 30 June 2012
Note 27 - Superannuation information
(a) Superannuation income recognition policy
In 2012 the Group recognises the net total of the following amounts in profit or loss
Current service cost is the increase in the present value of the defined benefit obligation resulting from employee service in the current period Interest cost is the increase in the present value of the defined benefit obligation which arises because the benefits are one period closer to settlement Expected return on plan assets is based on market expectations at the beginning of the period for returns over the life of the related obligation and on any reimbursement rights Past service cost (to the extent required to be recognised) is the increase in the defined benefit obligation from changes to post-employment benefits relating to employee service in prior periods and Curtailments or settlements are amendments to the terms of the plan andor number of employees covered by the plan
The Group recognises defined benefit actuarial superannuation gains and losses in other comprehensive income
(b) Superannuation obligations
All former employees were entitled to varying levels of benefits on retirement disability or death The superannuation plans (State Superannuation Scheme (SSS) State Authorities Superannuation Scheme (SASS) and State Authorities Non-Contributory Superannuation Scheme (SANCS) provide defined benefits based on years of service and final average salary Employees contributed to the plans and the contribution of the parent entity was and remains legally enforceable All Schemes are closed to new members
Note (b) continues on the following page
38
RESIDUAL BUSINESS MANAGEMENT CORPORATION GROUP
NOTES TO THE FINANCIAL STATEMENTS for Year Ended 30 June 2012
Note 27 - Superannuation information (continued)
(b) Superannuation obligations (continued)
The following is the superannuation position of the Group as at 30 June 2012 The superannuation assets and liabilities recognised in the statement of financial position are listed at the bottom of the table
Consolidated (Being The Parent Entity)
2012 2011 2012 2011 2012 2011 2012 2011 Member numbers
SASS SANCS SSS Total
Contributors - - - - - - - -Deferred benefits - - - - 3 3 3 3 Pensioners 2 2 - - 39 38 41 40 Pensions fully commuted - - - - 2 2 2 2 Totals 2 2 - - 44 43 46 45
Accrued liability
Superannuation position for AASB119 purposes
(437)
2012 $000
(339)
2011 $000
-
2012 $000
-
2011 $000
(32024)
2012 $000
(23303)
2011 $000
(32461)
2012 $000
(23642)
2011 $000
Estimate reserve account balance 193 269 282 279 20411 21893 20886 22441 Sub-total
Future Service Liability (Note 1) Surplus in excess of recovery available from Schemes Net asset I (liability) to be recognised in statement of financial position
(244)
-
-
(244)
(70)
-
-
(70)
282
-
-
282
279
-
-
279
(11613)
-
-
(11613)
(1410)
-
-
(1410)
(11575)
-
-
(11575)
(1201)
-
-
(1201)
Note 1 The Future Service Liability (FSL) does not have to be recognised by an employer It is only used to determine if an asset ceiling limit should be imposed (AASB 119 para 58) Under AASB 119 any prepaid superannuation asset recognised cannot exceed the total of any unrecognised past service cost and the present value of any economic benefits that may be available in the form of refunds from the plan or reductions in future contributions to the plan Where the surplus in excess of recovery is zero no asset ceiling limit is imposed
As is set out above at 30 June 2012 Residual Business Management Corporation had a gross calculated defined benefit superannuation liability with respect of former employees of $32461163 (2011 23641751 ) Superannuation funds invested to cover this liability amounted to $20886294 (2011 $22440728) The aforementioned superannuation liability and surplus position has been calculated by an independent and qualified actuary The calculated deficiency of invested funds versus the anticipated superannuation liabilities at 30 June 2012 was a balance of $11574869 (2011 $1201023) The parent entity with the support ofNSW Treasury believes that it has sufficient funds to cover this deficiency
39
RESIDUAL BUSINESS MANAGEMENT CORPORATION GROUP
NOTES TO THE FINANCIAL STATEMENTS for Year Ended 30 June 2012
Note 27 - Superannuation information (continued)
(b) Superannuation obligations (continued)
Th T f h t ee reconcr ration o t e present va ue of h defimed b enefirt o blrgatrons rs as flo11ows For the year ended 30 June 2012
Consolidated (Being the Parent Entity) SASS SANCS SSS $000 $000 $000
Present value ofpartly funded defined benefit obligation at beginning of the year (339) - (23303) Current service cost - - -Interest cost (17) - (I 199) Contributions by fund participants - - -Actuarial gains (losses) (157) 3 (8995) Benefits paid 76 (3) 1473 Past service cost - - -Curtailments - - -Settlements - - -Business Combinations - - -Exchange rate changes - - -Present value of partly funded defined benefit obliations at end of the year (437) - (32024)
Total Total 2012 2011
$000 $000
(23642) (23686) - -
(1216) (I 194) - -
(9149) 141 1546 1097
- -- -- -- -- -
(32461) (23642)
The reconciliation of the fair value offund assets is as follows
For the year ended 30 June 2012 Total Total Consolidated (Being the Parent Entity) SASS SAN CS SSS 2012 2011
$000 $000 $000 $000 $000 Fair value of fund assets at beginning of the year 269 279 21893 22441 21738 Expected (loss) I return on fund assets 22 24 1832 1878 1819 Actuarial (losses) I gains (22) (24) (1841) (1887) (19) Employer contributions - - - - -Contributions by fund participants - - - - -Benefits paid (76) 3 (1473) (1546) (l097) Settlements - - - - -Business combinations - - - - -Exchange rate changes - - - - -Fair value of fund assets at end of the year 193 282 20411 20886 22441
The reconciliation of the assets and liabilities recognised in the statement of financial position is follows
Total Consolidated (Being the Parent Entity)
TotalFor the year ended 30 June 2012 2012
$000 SAN CS SASS SSS
$000 Present value ofpartly funded defined benefit obligations at end of the year
$000 $000 $000
(32461) (23642) Fair value of fund assets at end of year
(437) (32024)-22441
Subtotal 20886282 20411193
(1201) Unrecognised past service cost
(11575)(244) (11613)282 - - - --
Unrecognised gain(loss) --- --Adjustment for limitation on net assets -- -- -Net asset I (liability) recognised in the statement of financial position at end of year (l201)(11575)(244) (11613)282
40
2011
RESIDUAL BUSINESS MANAGEMENT CORPORATION GROUP
NOTES TO THE FINANCIAL STATEMENTS for Year Ended 30 June 2012
Note 27 - Superannuation information (continued)
(b) Superannuation obligations (continued)
For the year ended 30 June 2012
2012 Consolidated (Being the Parent Entity) SASS SANCS SSS Total Components recognised in profit or loss by component $000 $000 $000 $000 Current service cost - - - -Interest cost (17) - (1199) (1216) Expected return on fund assets (net of expenses) 22 24 1832 1878 Past service cost - - - -Movement in adjustment for limitation on net asset - - - -Curtailment or settlement gain(loss) - - - -Total included in Other income in the statement of 5 24 633 662 comprehensive income (refer also note 2(b))
For the year ended 30 June 2012
2012 Consolidated (Being the Parent Entity) SASS SAN CS SSS Total Components recognised in other comprehensive income $000 $000 $000 $000 Actuarial (losses) I gains recognised in year (179) (21) (10836) (11036)
2011 Total $000
-(1194)
1819 ---
625
2011 Total $000
122
Cumulative amount recognised in other comprehensive income
The cumulative amount of actuarial gains and losses since 1 July 2005 recognised in other comprehensive income is an accumulated loss of $14221000 (2011 accumulated loss of $3185000) Before 1 July 2005 RBMC treated the defined benefit superannuation funds as separate entities and so recognised no superannuation balances in other comprehensive income
(c) Superannuation obligations - actuarial loses outside the statement of comprehensive income
Amounts not recognised in the statement of comprehensive income and expenses are as follows
For the year ended 30 June 2012
Consolidated (Being the Parent Entity) SASS SAN CS SSS 2012
Total 2011 Total
$000 $000 $000 $000 $000 Actuarial (losses) - - - - -Adjustment for limit on net asset - - - - -Total loss not reco2nised in the income statement - - - - -
41
RESIDUAL BUSINESS MANAGEMENT CORPORATION GROUP
NOTES TO THE FINANCIAL STATEMENTS for Year Ended 30 June 2012
Note 27 - Superannuation information (continued)
(d) Superannuation asset classes
The percentage invested in each asset class at the balance sheet date
Consolidated (Being the Parent Entity) 30 June 2012 30 June 2011 Australian equities 280 334 Overseas equities 237 295 Australian fixed interest securities 49 57 Overseas fixed interest securities 24 31 Property 86 99 Cash 195 51 Other 129 133
All Fund assets are invested by SAS Trustee Corporation (STC) at arms length through independent fund managers
Other superannuation provision information related to AASB 119 is disclosed at Note 28
AASB 119 requires organisations to provide detailed narrative information regarding the key economic and demographic assumptions underlying the reported defined benefits superannuation account balances The assumptions and calculations are generic to all NSW Government agencies and they are set out in Note 28
Note 28 - AASB 119 Superannuation information valuation method and principal actuarial assumptions
The followings are the superannuation asset and liability assumptions and calculations generic to all NSW Government agencies
The expected rate of return on assets assumption is determined by weighting the expected long-term return for each asset class by the target allocation of assets to each class The returns used for each class are net of investment tax and investment fees
Actual return on Scheme assets are as follows
For the year ended 30 June 2012 Consolidated (Being the Parent Entity) SASS SANCS SSS Total
$000 $000 $000 $000 Actual loss I (return) on fund assets (1) - 9 8
(a) Valuation Method
The Projected Unit Credit (PUC) valuation method was used to determine the present value of the defined benefit obligations and the related current service costs This method sees each period of service as giving rise to an additional unit of benefit entitlement and measures each unit separately to build up the final obligation
42
RESIDUAL BUSINESS MANAGEMENT CORPORATION GROUP
NOTES TO THE FINANCIAL STATEMENTS for Year Ended 30 June 2012
Note 28 - AASB 119 Superannuation information valuation method and principal actuarial assumptions (continued)
(b) Economic assumptions
Consolidated (Being the Parent Entity) 30 June 2012 30 June 2011
Salary increase rate (excluding promotional increases) 25 pa 35 pa
Rate ofCPI increase 25 pa 25pa
Expected rate of return on assets backing pension liabilities 860 pa 860pa
Expected rate ofretum on assets backing other liabilities 860 pa 860pa
Discount rate 306 pa 528pa
(c) Demographic assumptions
The demographic assumptions underlying the calculated actuarial balances of the RBMC Superannuation Schemes are generic to all NSW Government agencies and further details can be obtained from the NSW Treasury website
(d) Historical information
For the year ended 3 0 June 2012 Consolidated (Being the Parent Entity) SASS SANCS SSS Total
$000 $000 $000 $000 Present value ofdefined benefit obligation (437) - (32024) (32461) Fair value of fund assets 193 282 20411 20886 Surplus(Deficit) in fund (244) 282 (11613) (11575) Experience adjustments - liabilities (157) 3 (8995) (9149) Experience adjustments - assets (22) (23) (1841) (1886)
For the year ended 30 June 2011 Consolidated (Being the Parent Entity) SASS SANCS SSS Total
$000 $000 $000 $000 Present value of defined benefit obligation (339) - (23303) (23642) Fair value of fund assets 269 279 21893 22441 Surplus(Deficit) in fund (70) 279 (1410) (1201) Experience adjustments - liabilities 12 (6) 135 141 Experience adjustments - assets - (1) (18) (19)
For the year ended 30 June 2010 Consolidated (Being the Parent Entity) SASS SAN CS SSS Total
$000 $000 $000 $000 Present value of defined benefit obligation (344) - (23342) (23686) Fair value of fund assets 258 263 21217 21738 Surplus in fund (86) 263 (2125) (1948) Experience adjustments - liabilities (8) (3) (1079) (1090) Experience adjustments - assets 2 1 133 136
43
RESIDUAL BUSINESS MANAGEMENT CORPORATION GROUP
NOTES TO THE FINANCIAL STATEMENTS for Year Ended 30 June 2012
Note 28 - AASB 119 Superannuation information valuation method and principal actuarial assumptions (continued)
(d) Historical information (continued)
For the year ended 30 June 2009 Consolidated (Being the Parent Entity) SASS SAN CS SSS Total
$000 $000 $000 $000 Present value of defined benefit obligation (336) - (21959) (22295) Fair value of fund assets 254 244 20292 20790 Surplus in fund (83) 244 (1666) (1505) Experience adjustments - liabilities (65) 15 (3875) (3925) Experience adjustments - assets (55) (48) (4259) (4362)
For the year ended 30 June 2008 Consolidated (Being the Parent Entity) SASS SAN CS SSS Total
$000 $000 $000 $000 Present value of defined benefit obligation (283) - (18313) (18596) Fair value of fund assets 313 256 24045 24614 Surplus in fund 30 256 5732 6018 Experience adjustments - liabilities 3 111 2119 2233 Experience adjustments - assets 16 (76) (5316) (5376)
(e) Expected contributions
For the year ended 30 June 2012 SASS SAN CS SSS Total $000 $000 $000 $000
Expected employer contributions to be paid in the next reporting period - - - -
(f) Funding arrangements for employer contributions
i Surplus I deficit
The following is a summary of the 30 June 2012 financial position of the Schemes calculated in accordance with AAS 25 Financial Reporting by Superannuation Plans
For the year ended 30 June 2012
Consolidated (Being the Parent Entity) SASS SANCS SSS Total 2012
Total 2011
$000 $000 $000 $000 $000 Accrued benefits (256) - (17086) (17342) (16841) Net market value of Fund assets 193 283 20410 20886 22441 Total net surplus( deficiency) (63) 283 3324 3544 5600
44
RESIDUAL BUSINESS MANAGEMENT CORPORATION GROUP
NOTES TO THE FINANCIAL STATEMENTS for Year Ended 30 June 2012
Note 28 - AASB 119 Superannuation information valuation method and principal actuarial assumptions (continued)
(f) Funding arrangements for employer contributions (continued)
ii Contribution recommendations
The recommended contribution rates are as follows For the year ended 30 June 2012
Consolidated (Being the Parent Entity)
SASS SANCS SSS
Multiple of member contributions member salary Multiple ofmember contributions 000 000 000
iii Funding method
Contribution rates are set after discussions between the employer STC and NSW Treasury
iv Economic assumptions
The economic assumptions adopted for the current actuarial review of the Fund are
Weighted-average assumptions 2012 2011
Expected rate ofretum on Fund assets backing current pension liabilities 83 pa 83pa
Expected rate of return on Fund assets backing other liabilities 73 pa 73pa
Expected salary increase rate 40 pa 40pa
Expected rate of CPI increase 25 pa 25pa
(g) Nature of asset I (liability)
If a surplus exists in the employers interest in the Fund the employer may be able to take advantage of it in the form of a reduction in the required contribution rate depending on the advice of the Funds actuary
Where a deficiency exists the employer is responsible for any difference between the employers share of Fund assets and the defined benefit obligation
Note 29 - Events occurring after reporting date
The services of Mr Andrew d Apice the former General Manager of the RBMC Group were finalised on 31 August 2012 Mr Dominic Schuster of NSW Treasury was then appointed as his replacement effective 1 September 2012
There were no other matters or circumstances that have arisen since the end of the financial year which significantly affected or may significantly affect the operations of the Group the results of those operations or the state of affairs of the Group in future years
End of audited financial statements
45
RESIDUAL BUSINESS MANAGEMENT CORPORATION
FINANCIAL STATEMENTS FOR THE YEAR ENDED 30 JUNE 2012
STATEMENT BY CHIEF EXECUTIVE OFFICER
RESIDUAL BUSINESS MANAGERMENT CORPORATION
Pursuant to Section 41C of the Public Finance and Audit Act 1983 I state that in my opinion
The accompanying financial statements and notes thereto exhibit a true and fair view of the financial
position of the Residual Business Management Corporation (RBMC) as at 30 June 2012 and the
financial performance for the year then ended
The financial statements have been prepared in accordance with the provisions of applicable
Australian Accounting Standards (which include Australian Accounting Interpretations) the
requirements of the Public Finance and Audit Act 1983 applicable clauses of the Public Finance and
Audit Regulation 2010 the requirements of the Financial Reporting Directions published in the
Financial Reporting Code for NSW General Government Sector Entities and the Treasurers
Directions
Further I am not aware of any circumstances which would render any particulars included in the
financial statements to be misleading or inaccurate
On behalf of the Corporation
Dominic Schuster
General Manager
Residual Business Management Corporation
Dated 6 May 2014 at Sydney
INDEPENDENT AUDITORS REPORT
Residual Business Management Corporation
To Members of the New South Wales Parliament
I have audited the accompanying financial statements of Residual Business Management Corporation (the Corporation) which comprise the statements of financial position as at 30 June 2012 the statements of comprehensive income the statements of changes in equity and the statements of cash flows for the year then ended notes comprising a summary of significant accounting policies and other explanatory information of the Corporation and the consolidated entity The consolidated entity comprises the Corporation and the entities it controlled at the year end or from time to time during the financial year
Opinion
In my opinion the financial statements
give a true and fair view of the financial position of the Corporation and the consolidated entity as at 30 June 2012 and of their financial performance and cash flows for the year then ended in accordance with Australian Accounting Standards
bull are in accordance with section 41B of Public Finance and Audit Act 1983 (the PFampA Act) and the Public Finance and Audit Regulation 2010
My opinion should be read in conjunction with the rest of this report
The General Managers Responsibility for the Financial Statements
The General Manager is responsible for the preparation of the financial statements that give a true and fair view in accordance with Australian Accounting Standards and the PFampA Act and for such internal control as the General Manager determines is necessary to enable the preparation of the financial statements that are free from material misstatement whether due to fraud or error
Auditors Responsibility
My responsibility is to express an opinion on the financial statements based on my audit I conducted my audit in accordance with Australian Auditing Standards Those standards require that I comply with relevant ethical requirements relating to audit engagements and plan and perform the audit to obtain reasonable assurance about whether the financial statements are free from material misstatement
An audit involves performing procedures to obtain audit evidence about the amounts and disclosures in the financial statements The procedures selected depend on the auditors judgement including the assessment of the risks of material misstatement of the financial statements whether due to fraud or error In making those risk assessments the auditor considers internal controls relevant to the entitys preparation of the financial statements that give a true and fair view in order to design audit procedures that are appropriate in the circumstances but not for the purpose of expressing an opinion on the effectiveness of the entitys internal control An audit also includes evaluating the appropriateness of accounting policies used and the reasonableness of accounting estimates made by the General Manager as well as evaluating the overall presentation of the financial statements
I believe the audit evidence I have obtained is sufficient and appropriate to provide a basis for my audit opinion
My opinion does not provide assurance
bull about the future viability of the Corporation or consolidated entity
bull that they have carried out their activities effectively efficiently and economically
bull about the effectiveness of internal control
bull about the security and controls over the electronic publication of the audited financial statements on any website where they may be presented
bull about any other information that may have been hyperlinked tofrom the financial statements
Independence
In conducting my audit I have complied with the independence requirements of the Australian Auditing Standards and other relevant ethical pronouncements The PFampA Act further promotes independence by
bull providing that only Parliament and not the executive government can remove an Auditor-General
bull mandating the Auditor-General as auditor of public sector agencies but precluding the provision of non-audit services thus ensuring the Auditor-General and the Audit Office of New South Wales are not compromised in their role by the possibility of losing clients or income
1~k Kheir Director Financial Audit Services
19May2014 SYDNEY
- Structure Bookmarks
-
- Figure
- Figure
- Financial Instrument Class Table A Consolidated I Parent Note Category (a) Financial assets Cash and deposits 6 Cash T Corp Hour-Glass cash facility 7 Cash trust Receivables -non-current 10 Trade receivables (at amortised cost) Receivables -current 8 Other receivables (at amortised cost) Total financial assets (b) Financial liabilities Payables 14 Trade and accruals measured at amortised cost Total financial liabilities Net financial assets Total 2012 2011 $000 $000 1041 1500 10240 12075 -7 26 49 1130
- For the year ended 30 June 2012 Consolidated (Being the Parent Entity) SASS SANCS SSS $000 $000 $000 Present value ofpartly funded defined benefit obligation at beginning ofthe year (339) -(23303) Current service cost ---Interest cost (17) -(I199) Contributions by fund participants ---Actuarial gains (losses) (157) 3 (8995) Benefits paid 76 (3) 1473 Past service cost ---Curtailments ---Settlements ---Business Combinations ---Exchange rate changes ---Present value of partly funded defined benefit obl
- For the year ended 30 June 2012 2012 Consolidated (Being the Parent Entity) SASS SANCS SSS Total Components recognised in profit or loss by component $000 $000 $000 $000 Current service cost ----Interest cost (17) -(1199) (1216) Expected return on fund assets (net ofexpenses) 22 24 1832 1878 Past service cost ----Movement in adjustment for limitation on net asset ----Curtailment or settlement gain(loss) ----Total included in Other income in the statement of 5 24 633 662 comprehensive income (refe
- Figure
- Figure
- 1~kKheir
-
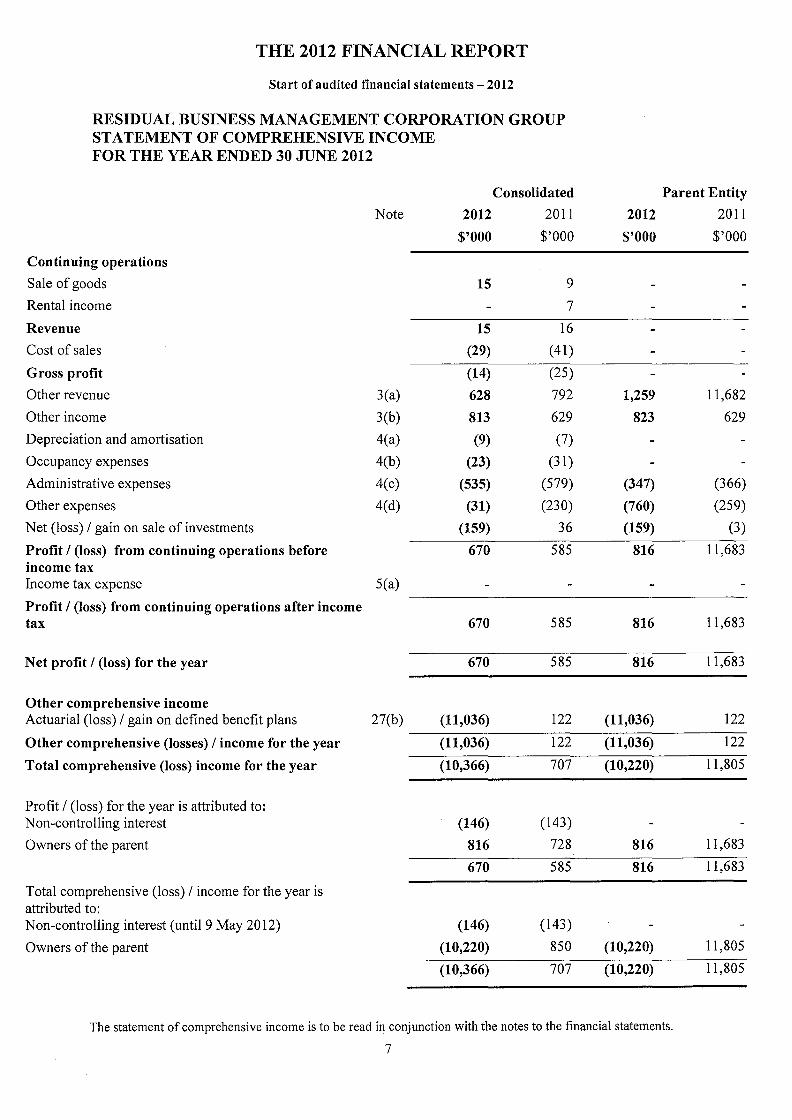

RESIDUAL BUSINESS MANAGEMENT CORPORATION GROUP
NOTES TO THE FINANCIAL STATEMENTS for Year Ended 30 June 2012
Note 1-Summary of significant accounting policies (continued)
(p) Inventories (continued)
cost the Group would incur to acquire the asset Net realisable value is the estimated selling price in the ordinary course of business less the estimated costs of completion and the estimated costs necessary to make the sale However on the basis that it was more likely than not that the Group would dispose of the inventories of Pacific Solar on a wind-up basis rather than as part of business operations conducted by the Group the net realisable value of inventory at 30 June 2011 had been reduced by $15530814 to $1179155 the fire-sale value established by an independent valuation at 30 November 2011 During the current financial year the now wound-up subsidiary sold all remaining inventory at the best achievable price and warranty outcome
(q) Investments
Investments in unlisted companies are reviewed annually and are carried at their cost of acquisition Shares in subsidiary companies are included at their cost of acquisition and are eliminated on consolidation
The Hour-Glass Investment Facilities are recognised at fair value through profit or loss using the second leg of the fair value option The unrealised movement in the fair value of the Hour-Glass Investment Facilities is reported in the line item Other income
(r) Dividend calculation
Dividends are calculated with reference to the TPP 02-3 Financial Distribution Policy for Government Businesses In 2012 a dividend of $200000000 was paid to NSW Treasury (2011 $100000000)
(s) Dividend policy
The Corporation pays dividends out of surplus funds in a manner that is considered prudent and in a quantum that will not prejudice the interests of the Corporation or its creditors
(t) Superannuation defined benefits
The Corporation recognises the net deficiency in its defined benefit superannuation funds as is calculated by the NSW Treasury appointed actuary
Actuarial gains or losses are recognised in other comprehensive income (directly through retained earnings) in the reporting period in which they occur
(v) Property
RBMCs property accounting policy is to recognise the fair value of the property it controls The value of RBMC s property is established at the end of each financial year based on the best information then available Revaluation increments are credited directly to asset revaluation reserve except that to the extent that an increment reverses a revaluation decrement in respect of that asset previously recognised as an expense in the profit or loss the increment is recognised immediately as revenue in the profit or loss Revaluation decrements are recognised immediately as expenses in the profit or loss except that to the extent that a credit balance exists in the asset revaluation reserve in respect of the asset they are debited directly to the asset revaluation reserve
16
RESIDUAL BUSINESS MANAGEMENT CORPORATION GROUP
NOTES TO THE FINANCIAL STATEMENTS for Year Ended 30 June 2012
Note 2 -Correction ofPrior Period Errors
(a) Superannuation
The Group had previously recognised all gains and losses including actuarial gains and losses for the year in its defined benefit superannuation funds as an item of other comprehensive gains I (losses) in its statement of other comprehensive income AASB 119 Sections 93A and 93B allow only defined benefit actuarial superannuation gains and losses to be recognised in other comprehensive income
To correct this error the Statement of Comprehensive Income as at 30 June 2011 for the comparative year were restated as follows
bull Other income was increased by $625000 and bull Actuarial gain on defined benefit plans was decreased by $625000
Restatement of Financial Statements as a Result of Change in Accounting Policy
30 June 2011 Comparative year Original Change in Accounting Restated Policy Adj
Financial Report Line Item 2011 2011 2011 2011 2011 2011 I Balance Affected $000 $000 $000 $000 $000 $000
Consolidated Parent Consolidated Parent Consolidated Parent Entity Entity Entity
Statement of Com[rehensive Income Extract Other income 4 4 625 625 629 629 Profit I (loss) from continuing operations
(40) 11058 625 625 585 11683 before income tax Profit I (loss) from continuing operations
(40) 11058 625 625 585 11683 after income tax
Other comprehensive income Actuarial (loss) I gain on defined benefit plans
Total comprehensive income for the year 747 747
747 747
(625) (625)
(625) (625)
122 122
122 122
Profit I (loss) for the year is attributed to Owners of the parent 103 11058 625 625 728 11683
Note 3 - Other revenue and income Extract (b) Other income Superannuation gain on defined benefit schemes 625 625 625 625
Total other income 4 4 625 625 629 629
17
RESIDUAL BUSINESS MANAGEMENT CORPORATION GROUP
NOTES TO THE FINANCIAL STATEMENTS for Year Ended 30 June 2012
Note 2 -Correction of Prior Period Errors (continued)
(b) Correction of a Prior Period Error
In October 2012 RBMC determined it still retained some land parcels in the past former names ofRBMC The total land parcel value at 30 June 2012 was determined by Management based on independent valuation to be $2123000 However RBMC has established that $1500000 worth of its land is controlled by a Local Government entity and has not recognised it in the statement of financial position in either the current or prior years Due to the aforementioned land parcels RBMC has booked a prior period error correction to its statement of financial position It has recognised the value of the land parcels that it presently controls
As this error was made in a financial year prior to the comparative year the Statement of Financial Position opening balances as at 30 June 2010 were restated as follows
bull Property plant and equipment was increased by $623000 to recognise the land that were not previously recognised in RBMCs financial statement This increase to property plant and equipment was made up as follows
o Land by $623000 bull Asset revaluation reserve was increased by $623000 which was made up as follows
o An increase of $623000 for the land asset revaluation reserve and bull Total parent interest was increased by $623000
The same correction was made to the statement of financial position at 30 June 2011 Namely
bull Land increased by $623000 bull The asset revaluation reserve was increased by $623000 which was made up as follows
o An increase of $623000 for the land asset revaluation reserve and bull Total parent interest was increased by $623000
Note (b) continues on the following page
18
RESIDUAL BUSINESS MANAGEMENT CORPORATION GROUP
NOTES TO THE FINANCIAL STATEMENTS for Year Ended 30 June 2012
Note 2 -Correction of Prior Period Errors (continued)
(b) Correction of a Prior Period Error (continued)
Restatement of Financial Statements as a Result of Correction of an Error
30 June 2011 Comparative year Original Correction of Error Restated Adj
Financial Report Line Item 2011 2011 2011 2011 2011 2011 I Balance Affected $000 $000 $000 $000 $000 $000
Consolidated Parent Consolidated Parent Consolidated Parent Entity Entity Entity
Statement of Financial Position Extract
Non-current assets Pro2erty 2lant and egui2ment 9 623 623 632 623
Total non-current assets 16 760 623 623 639 1383
Total assets 13652 13110 623 623 14275 13733
Net assets 12437 11909 623 623 13060 12532
Equity Parent equity interest
Asset revaluation reserve 623 623 623 623 Total ~arent interest 11909 11909 623 623 12532 12532
Total equity 12437 11909 623 623 13060 12532
Statement of Changes in Equity Extract
Opening Balance Asset revaluation reserve 623 623 623 623
Note 13 Property Plant and Equipment Extract
Total depreciated value property amp equip 9 623 623 632 623
a) Reconciliation of written down value of asset classes Non-current Land at fair value Plant and equipment - at fair value Accumulated depreciation Total depreciated value of plant and equipment
34 (25)
9
623
623
623
623
623 34
(25) 632
623
623
b) Movement in the property asset revaluation reserve
Asset revaluation reserve carried forward Asset Revaluation Reserve balance 30 June
623 623
623 623
623 623
623 623
19
RESIDUAL BUSINESS MANAGEMENT CORPORATION GROUP
NOTES TO THE FINANCIAL STATEMENTS for Year Ended 30 June 2012
Note 2 - Correction of Prior Period Errors (continued)
Restatement of Financial Statements as a Result of Correction of an Error (continued)
1 July 2010 (Comparative year opening balances) Original Correction of Error Restated Adj
Financial Report Line Item I 2010 2010 2010 2010 2010 2010 Balance Affected
$000 $000 $000 $000 $000 $000 Consolidated Parent Consolidated Parent Consolidated Parent
Entity Entity Entity Statement of Financial Position Extract
Non-current assets ProQerty Qlant and eguiQment 15 623 623 638 623
Total non-current assets 32 1232 623 623 655 1855
Total assets 14908 3086 623 623 15531 3709
Net assets 12915 1104 623 623 13538 1727
Equity Parent equity interest
Asset revaluation reserve 623 623 623 623 Total Qarent interest 12059 1104 623 623 12682 1727
Total equity 12915 1104 623 623 13538 1727
Note 13 Pro~ertv2 Plant and Egui~ment Extract
Total depreciated value property amp equip 15 623 623 638 623
a) Reconciliation of written down value of asset classes Non-current Land at fair value Plant and equipment - at fair value Accumulated depreciation Total depreciated value of plant and equipment
34 (19)
15
623
623
623
623
623 34
(19) 638
623
623
b) Movement in the property asset revaluation reserve
Asset revaluation reserve carried forward Asset Revaluation Reserve balance 30 June
623 623
623 623
623 623
623 623
20
RESIDUAL BUSINESS MANAGEMENT CORPORATION GROUP
NOTES TO THE FINANCIAL STATEMENTS for Year Ended 30 June 2012
Consolidated Parent Entity 2012 2011 2012 2011
$000 $000 $000 $000 Note 3 - Other revenue and income
(a) Other revenue Interest received or receivable 628 792 589 689 Dividend from controlled entity 670 10993 Total other revenue 628 792 1259 11682
(b) Other income Revaluation gain on T Corp units 151 151 Reimbursements 10 Insurance premium refunds 4 4 Superannuation gain on defined benefit schemes 662 625 662 625 Total other income 813 629 823 629
Excludes superannuation actuarial losses of $11035456 (2010 gains of $122125) included in other comprehensive income (Refer notes 27(b) and 24)
Note 4 - Expenses
(a) Depreciation amp amortisation 9 7
(b) Occupancy expenses Operating lease rental expense 23 31
(c) Administrative expenses Auditors remuneration 88 66 65 44 Directors remuneration 123 135 82 67 Document storage 1 50 1 50 Insurance premiums 77 120 58 97 Business Manager 170 155 101 72 Travel 1 16 1 Other sundry costs 75 37 39 36 Total administrative expenses 535 579 347 366
(d) Other expenses Revaluation loss on financial assets 53 53 Impairment loss of subsidiary 760 206 Revaluation of inventory 155 Revaluation loss of non-current investment 10 Consultant fees 31 12 Total other expense 31 230 760 259
21
RESIDUAL BUSINESS MANAGEMENT CORPORATION GROUP
NOTES TO THE FINANCIAL STATEMENTS for Year Ended 30 June 2012
Consolidated Parent Entity 2012 2011 2012 2011
$000 $000 $000 $000 Note 5 - Income tax expense
(a) The prima facie tax payable on profit from ordinary activities before income tax is reconciled to the income tax expense as follows Operating profit before income tax 670 585 816 11683 Prima facie tax benefit on losses from ordinary activities before income tax at 3 0 (2011 3 0) Economic entity 201 176 Parent entity 245 3505 Add Tax effect ofnon-deductible items Sundry items 1 2 Less Tax effect of Tax losses (utilised) not brought to account 202 (178) 245 (3505) Income tax expense equivalent
Deferred tax assets not brought to account
(b) The deferred tax asset arising from the following tax losses and timing differences has not been recognised as an asset because recovery is not probable
Unused tax losses for which no deferred tax asset has been recognised 23170 29414 23170 19029 Unused capital losses for which no deferred tax asset has been recognised 1058 1058
24228 29414 24228 19029 Potential deferred tax assets at 30 not brought to account 7268 8824 7268 5709
Note 6 - Current assets - cash and cash equivalents
Cash at bank 1041 1500 1041 89 Total cash amp cash equivalents 1041 1500 1041 89
For reconciliation of cash and cash equivalents to the Statement of Cash Flows refer to Note 16 (b)
Note 7 - Current assets -T Corp Hour-Glass cash facility
T Corp Hour-Glass cash facility 10240 12075 10240 11993 Total T Corp Hour-Glass cash facility 10240 12075 10240 11993
22
RESIDUAL BUSINESS MANAGEMENT CORPORATION GROUP
NOTES TO THE FINANCIAL STATEMENTS for Year Ended 30 June 2012
Consolidated Parent Entity 2012 2011 2012 2011
$000 $000 $000 $000 Note 8 - Current assets- trade and other receivables Trade debtors I I Other debtors 10 6 10 I Interest receivable 16 42 16 I Other 265 Total trade and other receivables 26 49 26 268
Note 9 - Current assets - inventories
Finished goods - at lower of cost or realisable value 12 Total current assets - inventories 12
Note 10 - Non-current - trade and other receivables Deposits 7 Total trade and other receivables 7
Note 11- Non-current - financial assets
Shares in controlled entities (cost) - refer 11 (i) 56954 Less impairment adjustment (56194) Carrying value controlled entities 760 Shares in unlisted companies 10 Less impairment (10) Total financial assets 760
Controlled entities Residual Business Management Corporation acquired 100 (2011 59) of the shares in Pacific Solar Pty Limited on 24 February 2012 On 9 May 2012 Pacific Solar Pty Ltd was wound up and deregistered as a solvent entity
(i) The Group included the following controlled entity Country of Percentage of equity interest Investment
Entity name Incorporation held by the consolidated entity 2012 2011 2012 2011
$000 $000 Pacific Solar Pty Limited Australia Nil 59 760
Rounded to whole percent
23
RESIDUAL BUSINESS MANAGEMENT CORPORATION GROUP
NOTES TO THE FINANCIAL STATEMENTS for Year Ended 30 June 2012
Note 12 - Other non-current assets
Contract receivable Cost of goodwill re-acquired Less impairment
Consolidated 2012 2011
$000 $000
3324 8172 235
(3324) (8407)
Parent Entity 2012 2011
$000 $000
3324
(3324) Total other non-current assets
Movement in the allowance for impairment
Accumulated impairment carried forward (8407) (8407) Acc impairment written-back I (booked) 5083 (3324) Impairment balance 30 June
Note 13 - Non-current asserts - property plant and equipment
Total depreciated value property amp equip
(3324) (8407) (3324)
Consolidated Parent Entity 2012 2011 2010 2012 2011 2010
$000 $000 $000 $000 $000 $000
623 632 638 623 623 623
623 623 623 623 623 623 34 34
(25) (19) 623 632 638 623 623 623
a) Reconciliation of written down value of asset classes
Non-current Land at fair value Plant and equipment - at cost Accumulated depreciation Total depreciated value property amp equip
The prior period balance sheet has been adjusted for land parcels that were determined in 2012 to be owned and controlled by RBMC well prior to 30 June 2011 The land parcels are stated at the NSW Lands Departments commissioned valuations Refer note 2(b) for more information
24
RESIDUAL BUSINESS MANAGEMENT CORPORATION GROUP
NOTES TO THE FINANCIAL STATEMENTS for Year Ended 30 June 2012
Consolidated 2012 2011
$000 $000
Parent Entity 2012 2011
$000 $000
Note 14- Payables
Current Trade creditors Other creditors and accruals Total current payables
25 18 43
10 4
14
25 18 43
Terms and conditions relating to the above payables
(i) Trade creditors are non-interest bearing and are settled on 30 day terms (ii) Other creditors and accruals are non-interest bearing and normally settled on 30 day terms
Note 15 - Provisions
Non-current Superannuation net liability 27(b) 11575 1201 11575 1201
~~~~~~~~~~~~~~~~~
Total non-current provisions 11575 1201 11575 1201
Total provisions 11575 1201 11575 1201
Note 16 - Cash flow information
(a) Reconciliation of profit(loss) for the year after tax to net cash flows from operating activities
Profit I (loss) after income tax 670 585 816 11683 Non-cash items (Gain) I loss on investments 8 18 8 56 Depreciation of non - current assets 9 7 Superannuation (gain) on defined benefit schemes (662) (625) (662) (625) Investment activity transactions Dividends from investments (670) (10993) Changes in assets and liabilities (Decrease) I increase in trade and other debtors (3) 2 (7) (Decrease) I increase in other creditors 14 3 18 (26) (Decrease) I increase in provisions (35) Decrease I (increase) in other assets 33 (6) (16) 1 (Increase) I decrease in financial assets 10 760 206 (Increase) I decrease in inventory 12 162 Increase I (decrease) in creditors and borrowings 15 25 (8) Net cash flows from operating activities 96 121 272 294
(b) Reconciliation of cash and cash equivalents
Cash and cash equivalents 1041 1500 1041 89 Balance as per Statement of Cash Flows 1041 1500 1041 89
25
RESIDUAL BUSINESS MANAGEMENT CORPORATION GROUP
NOTES TO THE FINANCIAL STATEMENTS for Year Ended 30 June 2012
Note 16 - Cash flow information (continued)
(c) Acquisitions and disposal of entities
On 24 February 2012 RBMC became the wholly owned parent of Pacific Solar Pty Limited On the 9 May 2012 the Group effectively disposed of Pacific Solar Pty Limited due to it being wound-up and deregistered as a solvent entity on that date RBMC acquired the remaining assets of Pacific Solar they being intellectual property There were no other acquisitions of entities during the year ended 30 June 2012
(d) Financing Arrangements
Neither Residual Business Management Corporation nor any of its controlled entities have any external financing arrangements in place at year end or during the financial year
Note 17 - Commitments for expenditure
(i) Expenditure commitments
No entity in the Group had any expenditure commitments at year end or the prior year end
(ii) Lease expenditure commitments
The Group has a monthly rental agreement with Kennards Self Storage at a cost including GST of $37200 At 30 June 2012 the total rent lease commitments for warehousing facilities is $223200 (2011 $2335968)
Note 18 - Contingent liabilities
There are a number of legal actions that have been taken against RBMC and they have been defended The actions appear to have ceased without recent cost or exposure to RBMC However it is prudent to advise that future legal costs and if applicable settlement will be less than $50000 in the unlikely event that the actions are re-instigated and lost
Note 19 - Related party disclosures
Directors
The names of persons that were Directors or the equivalent of Directors or officers of Residual Business Management Corporation or its controlled entities at any time during the financial year were as follows
Residual Business Management Corporation
Dominic Schuster - General Manger - Appointed 1 September 2012 Andrew dApice - Former General Manger- Ceased 31 August 2012 Mark Guest- Secretary amp Comptroller (equivalent to a Company Secretary amp Finance officer)
Pacific Solar Pty Limited (Deregistered on 9 May 2012)
Andrew dApice- Former Executive Director (Chair)-Appointed 20 January 2012 and Ceased 9 May 2012 Mark Guest-Former Executive Officer amp Company Secretary-Ceased 9 May 2012
26
RESIDUAL BUSINESS MANAGEMENT CORPORATION GROUP
NOTES TO THE FINANCIAL STATEMENTS for Year Ended 30 June 2012
Note 19 - Related party disclosures (continued)
Pacific Solar Pty Limited (Deregistered on 9 May 2012) (continued)
Alan Cox - Former Non-Executive Director (Chair)- Resigned 20 January 2012 Edward Slack- Former Non-Executive Director- Resigned 20 January 2012 James Henderson - Former Non-Executive Director- Resigned 24 February 2012 Alfredo Palestini- Former Non-Executive Director-Resigned 24 February 2012
Ultimate parent entity
The ultimate parent entity of the RBMC Group is the New South Wales Government Residual Business Management Corporation (RBMC) is the parent entity within the RBMC Group and it owned 59 percent of Pacific Solar Pty Limited for the period from 1 July 2011 to 23 February 2012 RBMC then owned 100 percent of the former subsidiary Pacific Solar Pty Limited from 24 February 2012 until its deregistration on 9 May 2012
Transactions with related parties
All related party transactions were unsecured and based on normal terms and conditions By resolution on 6 March 2012 RBMC approved the wind-up of Pacific Solar Pty Limited and agreed to assume its known legal obligations and the expenses of the subsidiary during the wind-up process At the signing date of this report the Group believes that the deregistered Pacific Solar Pty Limited has no remaining financial obligations
There were no other cross guarantees between any entities in the RBMC Group
During the prior year the parent entity part funded the cost of Pacific Solars chairman details of which are set out below in this note
Pacific Solar Pty Limited
During the year RBMC provided funding to its former subsidiary Pacific Solar Pty Limited of Nil (2011 $29 10857) for part of the cost of its Director representative appointed to the Pacific Solar Board
During the year Pacific Solar provided funding to its parent of $9834 (2011 Nil) for part of the cost of the sole Director of the RBMC Group between February and March 2012
NewSouth Innovations Pty Limited a former minority shareholder of Pacific Solar provided Pacific Solar with information services in the 2012 year in the amount of Nil (2011 $5000) This was a normal commercial arrangement
During the year Pacific Solar completed a shareholder and ASIC approved share buy-back of all minority shareholdings RBMCs share of the buy-back payment was Nil (2011 $26548608)
This year Pacific Solar declared and paid dividends of $67039653 to RBMC (2011 Nil) being the sum of the all remaining cash and reserves of the former subsidiary company
RBMC received (paid) the following amounts from (to) or on behalf of its former subsidiary Pacific Solar
Creditor payments made $Nil (2011 $1666132) Cash returned to Pacific Solar $Nil (2011 $1037368)
At 30 June 2012 RBMC had an intercompany receivable of Nil (2011$26548608) with its former subsidiary Pacific Solar The 2011 receivable was paid by Pacific Solar to RBMC this financial year
27
RESIDUAL BUSINESS MANAGEMENT CORPORATION GROUP
NOTES TO THE FINANCIAL STATEMENTS for Year Ended 30 June 2012
Note 19 - Related party disclosures (continued)
Other Entities
During the year the RBMC Group paid remuneration to a registered Chartered Accountancy company directed and ultimately owned by Mark Guest of $18498761 (2011 $1943 53 50) This fee represents market rate remuneration for the services of Mark Guest three part-time tertiary qualified staff and the supply of the Groups registered office The parents share of this total Group remuneration was $10052472 (2011 $7205784) As part of the Pacific Solar wind-up RBMC agreed by resolution that it would assume responsibility for the contract entitlements of Mark Guests Firm The Pacific Solar contract entitlements expired on 6 September 2012 Mr Guests Firm continued to work on specific Pacific Solar related matters until mid-August 2012 and incidental matters until the date of the signing of this report
Note 20- Key management personnel compensation
Consolidated 2012 2011 $(not $(not
rounded) rounded)
Short-term benefits - RBMC 182222 139027 Short-tenn benefits - Pacific Solar Pty Limited 119843 151141 Termination benefits Total key management personnel compensation 302065 290168
Parent entity 2012 2011 $(not $(not
rounded) rounded)
Short-term benefits 182222 139027 Other long term benefits Post-employment benefits Termination benefits
182222 139027
In addition a benefit less than $150 (2011 $250) in credit card reward points was derived via the use of personal credit cards to make corporate payments on a normal executive use basis
28
RESIDUAL BUSINESS MANAGEMENT CORPORATION GROUP
NOTES TO THE FINANCIAL STATEMENTS for Year Ended 30 June 2012
Note 21 - Remuneration of Directors
Income paid or payable or otherwise made available to Directors by members of the Group and related parties in connection with the management of the Group
The number of Directors whose income from members of the Group and related parties was within the following bands
$0 - $9999 $10000 - $19999 $40000 - $49999 $50000 - $59999 $60000 - $69999 $80000 - $89999
Consolidated Parent Entity 2012 2011 2012 2011
$(not $(not $(not $(not rounded) rounded) rounded) rounded)
122636 134682 81698 66970
Number Number Number Number
3 3
2 2 1
In addition at the consolidated level benefits less than $250 (2011 $100) in credit card reward points was derived via the use of a personal credit card to make corporate payments on a normal executive use basis
No share options were or are held directly or indirectly by the Directors during the period or at balance date or during the prior year
Note 22 - Auditors remuneration
Amounts paid to or due and payable to the Auditor General ofNSW for - audit of the financial report of the entity and all other entities in the Group - other services in relation to the entity and all other entities in the Group
Consolidated Parent Entity 2012 2011 2012 2011
$000 $000 $000 $000
88 66 65 44
29
RESIDUAL BUSINESS MANAGEMENT CORPORATION GROUP
NOTES TO THE FINANCIAL STATEMENTS for Year Ended 30 June 2012
Note 23 - Financial risk management objectives and policies
The Groups principal financial instruments comprise receivables payables cash and term deposits These financial instruments arise directly from the Groups operations or are required to finance the Groups activities The Group does not enter into or trade financial instruments including derivative financial instruments for speculative purposes
(a) Risk exposures and responses
The Groups main risks arising from financial instruments are outlined below together with the Groups objectives policies and processes for measuring and managing risk Further quantitative and qualitative disclosures are included throughout these financial statements
The Groups General Manager has overall responsibility for the establishment and oversight of risk management and he reviews and agrees policies for the management of risk Risk management policies are established to identify and analyse the risks faced by the Group and to set risk limits and controls to monitor the risks Compliance with policies is reviewed by the General Manager on a continuous basis
(b) Financial instrument risk defined
The main financial instrument risks that the Group could be exposed to through its financial instruments are as follows
Interest Rate Risk
The Group is exposed to fluctuations in interest rates to the extent ofthe level of its invested cash
Credit Risk
The exposure to credit risk excluding the value of any collateral or other security held is the carrying amount of any provisions for impairment of the Groups recognised financial assets as disclosed in the Statement of Financial Position and notes to these financial statements
Liquidity Risk
The Group manages liquidity risk by monitoring forecast cash flows and ensuring that adequate cash reserves are maintained to fund creditor obligations
Foreign Currency Risk
The Group may be exposed to fluctuations in foreign currencies with respect of future royalty income
Price Risk
The Group is not currently exposed to any material commodity price risk
Sections ( e) to (i) ofthis note considers in detail those risk areas relevant to the Group
30
RESIDUAL BUSINESS MANAGEMENT CORPORATION GROUP
NOTES TO THE FINANCIAL STATEMENTS for Year Ended 30 June 2012
Note 23 - Financial risk management objectives and policies (continued)
(c) Financial instrument categories
Financial Instrument Class Table A Consolidated I Parent Note Category
(a) Financial assets
Cash and deposits 6 Cash T Corp Hour-Glass cash facility 7 Cash trust Receivables - non-current 10 Trade receivables (at amortised cost) Receivables - current 8 Other receivables (at amortised cost)
Total financial assets
(b) Financial liabilities
Payables 14 Trade and accruals measured at amortised cost
Total financial liabilities
Net financial assets
Total 2012 2011
$000 $000
1041 1500 10240 12075
- 7 26 49
11307 13631
43 14
43 H
11264 13617
(d) Financial instruments recognition policy
All Group financial assets and liabilities have been recognised at the reporting date at their net fair values The following methods and assumptions are used to determine the net fair values of financial assets and liabilities
Cash cash equivalents and short-term investments - the carrymg amount approximates fair value because of their short time maturity
Cash trusts - the carrying amount approximates fair value because the underlying trust assets are liquid investments and the financial instrument is redeemable at call
Trade receivables and trade creditors - the carrying amount approximates fair value because of their short term maturity There were no trade receivables that were past due or impaired at the year end
Contract and royalty receivables - the carrying amounts reflect impairment and discount to present value adjustments that derive an approximate fair value
Non-current investmentssecurities - for financial instruments traded in organised financial markets fair value is the current quoted market bid price for an asset or offer price for a liability adjusted for transaction costs necessary to realise the asset or settle the liability For investments where there is no quoted market price a reasonable estimate of the fair value is determined by reference to the current market value of another instrument which is substantially the same or is calculated based on the expected cash flows or the underlying net asset base of the investmentsecurity The carrying amount reflects an impairment that derives the approximate fair value
Unrecognised financial instruments- There are no unrecognised financial instruments
31
RESIDUAL BUSINESS MANAGEMENT CORPORATION GROUP
NOTES TO THE FINANCIAL STATEMENTS for Year Ended 30 June 2012
Note 23 - Financial risk management objectives and policies (continued)
(d) Financial instruments recognition policy (continued)
The entity uses the following hierarchy for disclosing the fair value of financial instruments by valuation technique
bull Level 1 - Derived from quoted prices in active markets for identical assets I liabilities bull Level 2 -Derived from inputs other than quoted prices that are observable directly or indirectly bull Level 3 - Derived from valuation techniques that include inputs for the asset I liability not based
on observable market data (unobservable inputs) 2012
Level 1 Level 2 Level 3 Total $000 $000 $000 $000
Financial assets at fair value TCorp Hour-Glass Inv Facility 10240 10240
10240 10240
The table above includes only financial assets as no financial liabilities were measured at fair value in the statement of financial position
The aggregate net fair values and carrying amounts of financial instruments are disclosed in the statement of financial position and the supporting notes to these financial statements
(e) Interest rate risk
Interest rate risk is the risk that the value of the financial instrument or its revenue or costs will fluctuate due to changes in market interest rates The Groups exposure to interest rate risk and the effective interest rates of its financial assets and liabilities at the reporting date are set out on the following pages
In respect of income-earning financial assets and interest-bearing financial liabilities the table on the following page sets out the carrying amount by maturity date of the financial instruments exposed to interest rate risk at reporting date
32
RESIDUAL BUSINESS MANAGEMENT CORPORATION GROUP
NOTES TO THE FINANCIAL STATEMENTS for Year Ended 30 June 2012
Note 23 - Financial risk management objectives and policies (continued)
(e) Interest rate risk (continued)
Table B Consolidated Fixed interest rate maturing in
Financial Instruments Floating interest rate
2012 2011 $000 $000
1 year or less
2012 2011 $000 $000
Over 1 to 5 years
2012 2011 $000 $000
More than 5 years
2012 2011 $000 $000
Non-interest bearing
2012 2011 $000 $000
Total carrying amount as per the
Statement of Financial Position
2012 2011 $000 $000
(i) Financial assets Cash at bank 41 92 1000 1408 1041 1500 Cash trust 10240 12075 10240 12075 Trade and other receivables 26 49 26 49
Total financial assets 10281 12167 1000 1408 26 49 11307 13624
Weighted average interest rate 489 475 585 578
(ii) Financial liabilities Trade creditors accruals and other creditors 43 14 43
Total financial liabilities 43 14 43
Weighted average interest rate
Net financial assets (liabilities 10281 12167 1000 1408 17 35 11264 13610
33
14
14
RESIDUAL BUSINESS MANAGEMENT CORPORATION GROUP
NOTES TO THE FINANCIAL STATEMENTS for Year Ended 30 June 2012
Note 23 - Financial risk management objectives and policies (continued)
(e) Interest rate risk (continued)
Interest rate risk scenario and sensitivity analysis
The Group invests in secure bank term deposits and with the NSW Governments Treasury Corporation (T Corp) The Group holds large cash reserves to deal with its legacy business issues and to enable it to enforce its contractual rights in relation to the intellectual property it has developed Interest rate movements have a large impact on the results of the Group The risk profile set by the General Manager results in the Group receiving only a small margin above or below the official Australian interest rate set by the Australian Reserve Bank Board The duration of each cash investment essentially drives the interest rate the Group receives
TCorp Hour-Glass facilities
Exposure to interest rate risk primarily arises through the investment in the TCorp Hour Glass Investment Facilities which are held for strategic rather than trading purposes The Group holds units in the following Hour-Glass investment trusts
Consolidated Parent
Facility Investment Sectors Investment Horizon 2012
$000 2011
$000 2012
$000 2011
$000
Cash facility Cash and money market securities At call 10240 12075 10240 11993
The unit price of the facility is equal to the total fair value of the net assets held by the facility divided by the number of units on issue for that facility Unit prices are calculated and published daily NSW TCorp is trustee for the above facility and is required to act in the best interest of the unit holders and to administer the trust in accordance with the trust deeds As trustee TCorp has appointed external managers to manage the performance and risk of the facility in accordance with a mandate agreed by the parties Significant portions of administration are also outsourced to an external custodian Investment in the Hour-Glass facilities limits the Groups exposure to risk as it allows diversification across a pool of funds with different investment horizons and a mix of investments
The impact on profit I loss 2012 is as follows
Consolidated Parent Facility Change in
Unit Price Impact on Profit I
Loss 2012 $000
Impact on Profit I Loss 2011
$000
Impact on Profit I Loss 2012
$000
Impact on Profit I Loss 2011
$000 Cash facility +-1 102 121 102 120
NSW TCorp provides sensitivity analysis information for the cash facility using historical based volatility information collected over a ten year period quoted at two standard deviations (ie 95 probability)
The TCorp Hour-Glass investment facilities are designated at fair value through the Statement of Comprehensive Income and therefore any changes in unit price impacts directly on profit (rather than equity) A reasonably possible change is based on the percentage change in unit price multiplied by the redemption value as at 30 June each year for each facility
34
RESIDUAL BUSINESS MANAGEMENT CORPORATION GROUP
NOTES TO THE FINANCIAL STATEMENTS for Year Ended 30 June 2012
Note 23 - Financial risk management objectives and policies (continued)
(e) Interest rate risk (continued)
TCorp Hour-Glass facilities (continued)
The Groups term deposit cash investment sensitivity rates are similar As follows is the Groups judgement of reasonable possible movements in profits due to foreseeable changes in interest rates
(f) Credit risk
Credit Risk is the risk of financial loss arising to the Group from the default of another party with a contract or financial position with the Group The Group has material credit risk exposure to the CSG Solar AG Group in that at reporting date the Group has gross royalty rights receivable over time from CSG Solar AG Group of a least $332438395 (2011 $8 17197928) The table below states these gross receipts at their recoverable amount discounted to present value which is Nil (2011 $Nil) these written down values being the balances reflected in these financial statements These royalty rights are not past due but they are considered fully impaired Group policy is that all customers that wish to trade on credit terms are subject to a credit worthiness review
The Groups maximum exposure to credit risk and the applicable counter party is represented by the carrying amounts of its financial assets at reporting date as is set out in the following table (There was no past due balances at 30 June 2012)
Table C Financial
Instrument
Government Institutions
Australian Banks
CSG Solar AG Group
Other Commercial
entities Total
Consolidated 2012 $000
2011 $000
2012 $000
2011 $000
2012 $000
2011 $000
2012 $000
2011 $000
2012 $000
2011 $000
(a) Financial assets Cash and deposits - - 1041 1500 - - - - 1041 1500
Cash trust 10240 12075 - - - - - - 10240 12075 Trade receivables
amp other - - - - - - 26 49 26 49 Royalty rights
Impairment - - - -3324
(3324) 8172
(8172) --
--
3324 (3324)
8172 (8 172)
Net Rovalty - - - - - - - - - -Unlisted shares
Impairment --
--
--
--
--
10 (10)
--
--
--
10 (10)
Net unlisted shares - - - - - - - - - -Total 10240 12075 1041 1500 - - 26 49 11307 13624
35
RESIDUAL BUSINESS MANAGEMENT CORPORATION GROUP
NOTES TO THE FINANCIAL STATEMENTS for Year Ended 30 June 2012
Note 23 - Financial risk management objectives and policies (continued)
(g) Liquidity risk
Liquidity risk arises from the financial liabilities of the Group and the Groups subsequent ability to meet the obligations to repay the liabilities as and when they fall due As is disclosed above the Group maintains a high level of cash reserves to cover its material credit and warranty risks The Group has ongoing administrative costs require ongoing funding The following table provides the maturity dates of the Groups financial liabilities by bands
Table D
Maturity Bands
Financial liabilities
Trade creditors
Other creditors
Total financial liabilities
2012 2012 2011 2012 2011 more 2011 2012 2011 less less more more than 2 more More More
than than than 1 than 1 less than 2 than than one one less than less than than 5 less than 5 5 2012 2011 year year 2 years 2 years years 5 years years years Total Total $000 $000 $000 $000 $000 $000 $000 $000 $000 $000
25 12 - - - - - - 25 12
18 2 - - - - - - 18 2
43 14 - - - - - - 43 14
(h) Foreign currency risk
At the present time the Group has no material exposure to foreign currency risk The Groups above mentioned royalty rights are payable in Australian dollars
(i) Derivative financial instruments
During the financial year ending 30 June 2012 neither Residual Business Management Corporation nor any of its controlled entities had any known exposure to derivatives
36
RESIDUAL BUSINESS MANAGEMENT CORPORATION GROUP
NOTES TO THE FINANCIAL STATEMENTS for Year Ended 30 June 2012
Note 24-Retained earnings Note
Consolidated
2012 2011 $000 $000
Parent Entity
2012 2011 $000 $000
Balance at beginning of the financial year Owners of the parent comprehensive income (loss) Superannuation actuarial (losses) I gains Dividend paid or declared Balance at the end of the year
3(b) 27(c)
11909 816
(11036) 2000
(311
12059 728 122
(1000) 11909
11909 816
(11036) 2000
(311
1104 11683
122 (1000) 11909
Note 25 shy Non-controlling interests
As at 30 June 2011 the parent entity held an equity interest of 59 in Pacific Solar Pty Limited On 24 February 2012 a share buyback was approved by all minority shareholders for all of their Pacific Solar Pty Limited shares Thus on this date Pacific Solar became a fully owned subsidiary of RBMC Pacific Solar was then deregistered as a solvent entity on 9 May 2012 The buyback was based on a mid-point minority interest discount of 20 for the shares held by the following shareholders
Enipower SpA University ofNSW New South Innovations Pty Limited Thi An Dinh Morgan Michael Green Briana Keagan Green and Michelle Gaye Wenham
Reconciliation of non-controlling interest in RBMCs consolidated equity Non-controlling interest
2012 2011 $000 $000
Non-controlling interest in Pacific Solar share capital 36364 Non-controlling interests share ofretained (losses) at the end of the year (35836 Non-controlling interest in RBMCs consolidated equity 528
Note 26 - New Australian Accountings Standards issued but not effective
In the current year the Group has adopted all of the new and revised Standards and Interpretations issued by the AASB that are relevant to the operations and effective for the current reporting period Details of the impact of the adoption of these new accounting standards are set out in the individual accounting policies notes in the financial statements Certain new accounting standards and interpretations have been published that are not mandatory for the 30 June 2012 reporting period The Group did not early adopt any new accounting standards that are not yet effective The Group has assessed the impact of the new standards and interpretations on issue but not effective and considers the impact to be insignificant
37
RESIDUAL BUSINESS MANAGEMENT CORPORATION GROUP
NOTES TO THE FINANCIAL STATEMENTS for Year Ended 30 June 2012
Note 27 - Superannuation information
(a) Superannuation income recognition policy
In 2012 the Group recognises the net total of the following amounts in profit or loss
Current service cost is the increase in the present value of the defined benefit obligation resulting from employee service in the current period Interest cost is the increase in the present value of the defined benefit obligation which arises because the benefits are one period closer to settlement Expected return on plan assets is based on market expectations at the beginning of the period for returns over the life of the related obligation and on any reimbursement rights Past service cost (to the extent required to be recognised) is the increase in the defined benefit obligation from changes to post-employment benefits relating to employee service in prior periods and Curtailments or settlements are amendments to the terms of the plan andor number of employees covered by the plan
The Group recognises defined benefit actuarial superannuation gains and losses in other comprehensive income
(b) Superannuation obligations
All former employees were entitled to varying levels of benefits on retirement disability or death The superannuation plans (State Superannuation Scheme (SSS) State Authorities Superannuation Scheme (SASS) and State Authorities Non-Contributory Superannuation Scheme (SANCS) provide defined benefits based on years of service and final average salary Employees contributed to the plans and the contribution of the parent entity was and remains legally enforceable All Schemes are closed to new members
Note (b) continues on the following page
38
RESIDUAL BUSINESS MANAGEMENT CORPORATION GROUP
NOTES TO THE FINANCIAL STATEMENTS for Year Ended 30 June 2012
Note 27 - Superannuation information (continued)
(b) Superannuation obligations (continued)
The following is the superannuation position of the Group as at 30 June 2012 The superannuation assets and liabilities recognised in the statement of financial position are listed at the bottom of the table
Consolidated (Being The Parent Entity)
2012 2011 2012 2011 2012 2011 2012 2011 Member numbers
SASS SANCS SSS Total
Contributors - - - - - - - -Deferred benefits - - - - 3 3 3 3 Pensioners 2 2 - - 39 38 41 40 Pensions fully commuted - - - - 2 2 2 2 Totals 2 2 - - 44 43 46 45
Accrued liability
Superannuation position for AASB119 purposes
(437)
2012 $000
(339)
2011 $000
-
2012 $000
-
2011 $000
(32024)
2012 $000
(23303)
2011 $000
(32461)
2012 $000
(23642)
2011 $000
Estimate reserve account balance 193 269 282 279 20411 21893 20886 22441 Sub-total
Future Service Liability (Note 1) Surplus in excess of recovery available from Schemes Net asset I (liability) to be recognised in statement of financial position
(244)
-
-
(244)
(70)
-
-
(70)
282
-
-
282
279
-
-
279
(11613)
-
-
(11613)
(1410)
-
-
(1410)
(11575)
-
-
(11575)
(1201)
-
-
(1201)
Note 1 The Future Service Liability (FSL) does not have to be recognised by an employer It is only used to determine if an asset ceiling limit should be imposed (AASB 119 para 58) Under AASB 119 any prepaid superannuation asset recognised cannot exceed the total of any unrecognised past service cost and the present value of any economic benefits that may be available in the form of refunds from the plan or reductions in future contributions to the plan Where the surplus in excess of recovery is zero no asset ceiling limit is imposed
As is set out above at 30 June 2012 Residual Business Management Corporation had a gross calculated defined benefit superannuation liability with respect of former employees of $32461163 (2011 23641751 ) Superannuation funds invested to cover this liability amounted to $20886294 (2011 $22440728) The aforementioned superannuation liability and surplus position has been calculated by an independent and qualified actuary The calculated deficiency of invested funds versus the anticipated superannuation liabilities at 30 June 2012 was a balance of $11574869 (2011 $1201023) The parent entity with the support ofNSW Treasury believes that it has sufficient funds to cover this deficiency
39
RESIDUAL BUSINESS MANAGEMENT CORPORATION GROUP
NOTES TO THE FINANCIAL STATEMENTS for Year Ended 30 June 2012
Note 27 - Superannuation information (continued)
(b) Superannuation obligations (continued)
Th T f h t ee reconcr ration o t e present va ue of h defimed b enefirt o blrgatrons rs as flo11ows For the year ended 30 June 2012
Consolidated (Being the Parent Entity) SASS SANCS SSS $000 $000 $000
Present value ofpartly funded defined benefit obligation at beginning of the year (339) - (23303) Current service cost - - -Interest cost (17) - (I 199) Contributions by fund participants - - -Actuarial gains (losses) (157) 3 (8995) Benefits paid 76 (3) 1473 Past service cost - - -Curtailments - - -Settlements - - -Business Combinations - - -Exchange rate changes - - -Present value of partly funded defined benefit obliations at end of the year (437) - (32024)
Total Total 2012 2011
$000 $000
(23642) (23686) - -
(1216) (I 194) - -
(9149) 141 1546 1097
- -- -- -- -- -
(32461) (23642)
The reconciliation of the fair value offund assets is as follows
For the year ended 30 June 2012 Total Total Consolidated (Being the Parent Entity) SASS SAN CS SSS 2012 2011
$000 $000 $000 $000 $000 Fair value of fund assets at beginning of the year 269 279 21893 22441 21738 Expected (loss) I return on fund assets 22 24 1832 1878 1819 Actuarial (losses) I gains (22) (24) (1841) (1887) (19) Employer contributions - - - - -Contributions by fund participants - - - - -Benefits paid (76) 3 (1473) (1546) (l097) Settlements - - - - -Business combinations - - - - -Exchange rate changes - - - - -Fair value of fund assets at end of the year 193 282 20411 20886 22441
The reconciliation of the assets and liabilities recognised in the statement of financial position is follows
Total Consolidated (Being the Parent Entity)
TotalFor the year ended 30 June 2012 2012
$000 SAN CS SASS SSS
$000 Present value ofpartly funded defined benefit obligations at end of the year
$000 $000 $000
(32461) (23642) Fair value of fund assets at end of year
(437) (32024)-22441
Subtotal 20886282 20411193
(1201) Unrecognised past service cost
(11575)(244) (11613)282 - - - --
Unrecognised gain(loss) --- --Adjustment for limitation on net assets -- -- -Net asset I (liability) recognised in the statement of financial position at end of year (l201)(11575)(244) (11613)282
40
2011
RESIDUAL BUSINESS MANAGEMENT CORPORATION GROUP
NOTES TO THE FINANCIAL STATEMENTS for Year Ended 30 June 2012
Note 27 - Superannuation information (continued)
(b) Superannuation obligations (continued)
For the year ended 30 June 2012
2012 Consolidated (Being the Parent Entity) SASS SANCS SSS Total Components recognised in profit or loss by component $000 $000 $000 $000 Current service cost - - - -Interest cost (17) - (1199) (1216) Expected return on fund assets (net of expenses) 22 24 1832 1878 Past service cost - - - -Movement in adjustment for limitation on net asset - - - -Curtailment or settlement gain(loss) - - - -Total included in Other income in the statement of 5 24 633 662 comprehensive income (refer also note 2(b))
For the year ended 30 June 2012
2012 Consolidated (Being the Parent Entity) SASS SAN CS SSS Total Components recognised in other comprehensive income $000 $000 $000 $000 Actuarial (losses) I gains recognised in year (179) (21) (10836) (11036)
2011 Total $000
-(1194)
1819 ---
625
2011 Total $000
122
Cumulative amount recognised in other comprehensive income
The cumulative amount of actuarial gains and losses since 1 July 2005 recognised in other comprehensive income is an accumulated loss of $14221000 (2011 accumulated loss of $3185000) Before 1 July 2005 RBMC treated the defined benefit superannuation funds as separate entities and so recognised no superannuation balances in other comprehensive income
(c) Superannuation obligations - actuarial loses outside the statement of comprehensive income
Amounts not recognised in the statement of comprehensive income and expenses are as follows
For the year ended 30 June 2012
Consolidated (Being the Parent Entity) SASS SAN CS SSS 2012
Total 2011 Total
$000 $000 $000 $000 $000 Actuarial (losses) - - - - -Adjustment for limit on net asset - - - - -Total loss not reco2nised in the income statement - - - - -
41
RESIDUAL BUSINESS MANAGEMENT CORPORATION GROUP
NOTES TO THE FINANCIAL STATEMENTS for Year Ended 30 June 2012
Note 27 - Superannuation information (continued)
(d) Superannuation asset classes
The percentage invested in each asset class at the balance sheet date
Consolidated (Being the Parent Entity) 30 June 2012 30 June 2011 Australian equities 280 334 Overseas equities 237 295 Australian fixed interest securities 49 57 Overseas fixed interest securities 24 31 Property 86 99 Cash 195 51 Other 129 133
All Fund assets are invested by SAS Trustee Corporation (STC) at arms length through independent fund managers
Other superannuation provision information related to AASB 119 is disclosed at Note 28
AASB 119 requires organisations to provide detailed narrative information regarding the key economic and demographic assumptions underlying the reported defined benefits superannuation account balances The assumptions and calculations are generic to all NSW Government agencies and they are set out in Note 28
Note 28 - AASB 119 Superannuation information valuation method and principal actuarial assumptions
The followings are the superannuation asset and liability assumptions and calculations generic to all NSW Government agencies
The expected rate of return on assets assumption is determined by weighting the expected long-term return for each asset class by the target allocation of assets to each class The returns used for each class are net of investment tax and investment fees
Actual return on Scheme assets are as follows
For the year ended 30 June 2012 Consolidated (Being the Parent Entity) SASS SANCS SSS Total
$000 $000 $000 $000 Actual loss I (return) on fund assets (1) - 9 8
(a) Valuation Method
The Projected Unit Credit (PUC) valuation method was used to determine the present value of the defined benefit obligations and the related current service costs This method sees each period of service as giving rise to an additional unit of benefit entitlement and measures each unit separately to build up the final obligation
42
RESIDUAL BUSINESS MANAGEMENT CORPORATION GROUP
NOTES TO THE FINANCIAL STATEMENTS for Year Ended 30 June 2012
Note 28 - AASB 119 Superannuation information valuation method and principal actuarial assumptions (continued)
(b) Economic assumptions
Consolidated (Being the Parent Entity) 30 June 2012 30 June 2011
Salary increase rate (excluding promotional increases) 25 pa 35 pa
Rate ofCPI increase 25 pa 25pa
Expected rate of return on assets backing pension liabilities 860 pa 860pa
Expected rate ofretum on assets backing other liabilities 860 pa 860pa
Discount rate 306 pa 528pa
(c) Demographic assumptions
The demographic assumptions underlying the calculated actuarial balances of the RBMC Superannuation Schemes are generic to all NSW Government agencies and further details can be obtained from the NSW Treasury website
(d) Historical information
For the year ended 3 0 June 2012 Consolidated (Being the Parent Entity) SASS SANCS SSS Total
$000 $000 $000 $000 Present value ofdefined benefit obligation (437) - (32024) (32461) Fair value of fund assets 193 282 20411 20886 Surplus(Deficit) in fund (244) 282 (11613) (11575) Experience adjustments - liabilities (157) 3 (8995) (9149) Experience adjustments - assets (22) (23) (1841) (1886)
For the year ended 30 June 2011 Consolidated (Being the Parent Entity) SASS SANCS SSS Total
$000 $000 $000 $000 Present value of defined benefit obligation (339) - (23303) (23642) Fair value of fund assets 269 279 21893 22441 Surplus(Deficit) in fund (70) 279 (1410) (1201) Experience adjustments - liabilities 12 (6) 135 141 Experience adjustments - assets - (1) (18) (19)
For the year ended 30 June 2010 Consolidated (Being the Parent Entity) SASS SAN CS SSS Total
$000 $000 $000 $000 Present value of defined benefit obligation (344) - (23342) (23686) Fair value of fund assets 258 263 21217 21738 Surplus in fund (86) 263 (2125) (1948) Experience adjustments - liabilities (8) (3) (1079) (1090) Experience adjustments - assets 2 1 133 136
43
RESIDUAL BUSINESS MANAGEMENT CORPORATION GROUP
NOTES TO THE FINANCIAL STATEMENTS for Year Ended 30 June 2012
Note 28 - AASB 119 Superannuation information valuation method and principal actuarial assumptions (continued)
(d) Historical information (continued)
For the year ended 30 June 2009 Consolidated (Being the Parent Entity) SASS SAN CS SSS Total
$000 $000 $000 $000 Present value of defined benefit obligation (336) - (21959) (22295) Fair value of fund assets 254 244 20292 20790 Surplus in fund (83) 244 (1666) (1505) Experience adjustments - liabilities (65) 15 (3875) (3925) Experience adjustments - assets (55) (48) (4259) (4362)
For the year ended 30 June 2008 Consolidated (Being the Parent Entity) SASS SAN CS SSS Total
$000 $000 $000 $000 Present value of defined benefit obligation (283) - (18313) (18596) Fair value of fund assets 313 256 24045 24614 Surplus in fund 30 256 5732 6018 Experience adjustments - liabilities 3 111 2119 2233 Experience adjustments - assets 16 (76) (5316) (5376)
(e) Expected contributions
For the year ended 30 June 2012 SASS SAN CS SSS Total $000 $000 $000 $000
Expected employer contributions to be paid in the next reporting period - - - -
(f) Funding arrangements for employer contributions
i Surplus I deficit
The following is a summary of the 30 June 2012 financial position of the Schemes calculated in accordance with AAS 25 Financial Reporting by Superannuation Plans
For the year ended 30 June 2012
Consolidated (Being the Parent Entity) SASS SANCS SSS Total 2012
Total 2011
$000 $000 $000 $000 $000 Accrued benefits (256) - (17086) (17342) (16841) Net market value of Fund assets 193 283 20410 20886 22441 Total net surplus( deficiency) (63) 283 3324 3544 5600
44
RESIDUAL BUSINESS MANAGEMENT CORPORATION GROUP
NOTES TO THE FINANCIAL STATEMENTS for Year Ended 30 June 2012
Note 28 - AASB 119 Superannuation information valuation method and principal actuarial assumptions (continued)
(f) Funding arrangements for employer contributions (continued)
ii Contribution recommendations
The recommended contribution rates are as follows For the year ended 30 June 2012
Consolidated (Being the Parent Entity)
SASS SANCS SSS
Multiple of member contributions member salary Multiple ofmember contributions 000 000 000
iii Funding method
Contribution rates are set after discussions between the employer STC and NSW Treasury
iv Economic assumptions
The economic assumptions adopted for the current actuarial review of the Fund are
Weighted-average assumptions 2012 2011
Expected rate ofretum on Fund assets backing current pension liabilities 83 pa 83pa
Expected rate of return on Fund assets backing other liabilities 73 pa 73pa
Expected salary increase rate 40 pa 40pa
Expected rate of CPI increase 25 pa 25pa
(g) Nature of asset I (liability)
If a surplus exists in the employers interest in the Fund the employer may be able to take advantage of it in the form of a reduction in the required contribution rate depending on the advice of the Funds actuary
Where a deficiency exists the employer is responsible for any difference between the employers share of Fund assets and the defined benefit obligation
Note 29 - Events occurring after reporting date
The services of Mr Andrew d Apice the former General Manager of the RBMC Group were finalised on 31 August 2012 Mr Dominic Schuster of NSW Treasury was then appointed as his replacement effective 1 September 2012
There were no other matters or circumstances that have arisen since the end of the financial year which significantly affected or may significantly affect the operations of the Group the results of those operations or the state of affairs of the Group in future years
End of audited financial statements
45
RESIDUAL BUSINESS MANAGEMENT CORPORATION
FINANCIAL STATEMENTS FOR THE YEAR ENDED 30 JUNE 2012
STATEMENT BY CHIEF EXECUTIVE OFFICER
RESIDUAL BUSINESS MANAGERMENT CORPORATION
Pursuant to Section 41C of the Public Finance and Audit Act 1983 I state that in my opinion
The accompanying financial statements and notes thereto exhibit a true and fair view of the financial
position of the Residual Business Management Corporation (RBMC) as at 30 June 2012 and the
financial performance for the year then ended
The financial statements have been prepared in accordance with the provisions of applicable
Australian Accounting Standards (which include Australian Accounting Interpretations) the
requirements of the Public Finance and Audit Act 1983 applicable clauses of the Public Finance and
Audit Regulation 2010 the requirements of the Financial Reporting Directions published in the
Financial Reporting Code for NSW General Government Sector Entities and the Treasurers
Directions
Further I am not aware of any circumstances which would render any particulars included in the
financial statements to be misleading or inaccurate
On behalf of the Corporation
Dominic Schuster
General Manager
Residual Business Management Corporation
Dated 6 May 2014 at Sydney
INDEPENDENT AUDITORS REPORT
Residual Business Management Corporation
To Members of the New South Wales Parliament
I have audited the accompanying financial statements of Residual Business Management Corporation (the Corporation) which comprise the statements of financial position as at 30 June 2012 the statements of comprehensive income the statements of changes in equity and the statements of cash flows for the year then ended notes comprising a summary of significant accounting policies and other explanatory information of the Corporation and the consolidated entity The consolidated entity comprises the Corporation and the entities it controlled at the year end or from time to time during the financial year
Opinion
In my opinion the financial statements
give a true and fair view of the financial position of the Corporation and the consolidated entity as at 30 June 2012 and of their financial performance and cash flows for the year then ended in accordance with Australian Accounting Standards
bull are in accordance with section 41B of Public Finance and Audit Act 1983 (the PFampA Act) and the Public Finance and Audit Regulation 2010
My opinion should be read in conjunction with the rest of this report
The General Managers Responsibility for the Financial Statements
The General Manager is responsible for the preparation of the financial statements that give a true and fair view in accordance with Australian Accounting Standards and the PFampA Act and for such internal control as the General Manager determines is necessary to enable the preparation of the financial statements that are free from material misstatement whether due to fraud or error
Auditors Responsibility
My responsibility is to express an opinion on the financial statements based on my audit I conducted my audit in accordance with Australian Auditing Standards Those standards require that I comply with relevant ethical requirements relating to audit engagements and plan and perform the audit to obtain reasonable assurance about whether the financial statements are free from material misstatement
An audit involves performing procedures to obtain audit evidence about the amounts and disclosures in the financial statements The procedures selected depend on the auditors judgement including the assessment of the risks of material misstatement of the financial statements whether due to fraud or error In making those risk assessments the auditor considers internal controls relevant to the entitys preparation of the financial statements that give a true and fair view in order to design audit procedures that are appropriate in the circumstances but not for the purpose of expressing an opinion on the effectiveness of the entitys internal control An audit also includes evaluating the appropriateness of accounting policies used and the reasonableness of accounting estimates made by the General Manager as well as evaluating the overall presentation of the financial statements
I believe the audit evidence I have obtained is sufficient and appropriate to provide a basis for my audit opinion
My opinion does not provide assurance
bull about the future viability of the Corporation or consolidated entity
bull that they have carried out their activities effectively efficiently and economically
bull about the effectiveness of internal control
bull about the security and controls over the electronic publication of the audited financial statements on any website where they may be presented
bull about any other information that may have been hyperlinked tofrom the financial statements
Independence
In conducting my audit I have complied with the independence requirements of the Australian Auditing Standards and other relevant ethical pronouncements The PFampA Act further promotes independence by
bull providing that only Parliament and not the executive government can remove an Auditor-General
bull mandating the Auditor-General as auditor of public sector agencies but precluding the provision of non-audit services thus ensuring the Auditor-General and the Audit Office of New South Wales are not compromised in their role by the possibility of losing clients or income
1~k Kheir Director Financial Audit Services
19May2014 SYDNEY
- Structure Bookmarks
-
- Figure
- Figure
- Financial Instrument Class Table A Consolidated I Parent Note Category (a) Financial assets Cash and deposits 6 Cash T Corp Hour-Glass cash facility 7 Cash trust Receivables -non-current 10 Trade receivables (at amortised cost) Receivables -current 8 Other receivables (at amortised cost) Total financial assets (b) Financial liabilities Payables 14 Trade and accruals measured at amortised cost Total financial liabilities Net financial assets Total 2012 2011 $000 $000 1041 1500 10240 12075 -7 26 49 1130
- For the year ended 30 June 2012 Consolidated (Being the Parent Entity) SASS SANCS SSS $000 $000 $000 Present value ofpartly funded defined benefit obligation at beginning ofthe year (339) -(23303) Current service cost ---Interest cost (17) -(I199) Contributions by fund participants ---Actuarial gains (losses) (157) 3 (8995) Benefits paid 76 (3) 1473 Past service cost ---Curtailments ---Settlements ---Business Combinations ---Exchange rate changes ---Present value of partly funded defined benefit obl
- For the year ended 30 June 2012 2012 Consolidated (Being the Parent Entity) SASS SANCS SSS Total Components recognised in profit or loss by component $000 $000 $000 $000 Current service cost ----Interest cost (17) -(1199) (1216) Expected return on fund assets (net ofexpenses) 22 24 1832 1878 Past service cost ----Movement in adjustment for limitation on net asset ----Curtailment or settlement gain(loss) ----Total included in Other income in the statement of 5 24 633 662 comprehensive income (refe
- Figure
- Figure
- 1~kKheir
-

RESIDUAL BUSINESS MANAGEMENT CORPORATION GROUP
NOTES TO THE FINANCIAL STATEMENTS for Year Ended 30 June 2012
Note 2 -Correction of Prior Period Errors (continued)
(b) Correction of a Prior Period Error (continued)
Restatement of Financial Statements as a Result of Correction of an Error
30 June 2011 Comparative year Original Correction of Error Restated Adj
Financial Report Line Item 2011 2011 2011 2011 2011 2011 I Balance Affected $000 $000 $000 $000 $000 $000
Consolidated Parent Consolidated Parent Consolidated Parent Entity Entity Entity
Statement of Financial Position Extract
Non-current assets Pro2erty 2lant and egui2ment 9 623 623 632 623
Total non-current assets 16 760 623 623 639 1383
Total assets 13652 13110 623 623 14275 13733
Net assets 12437 11909 623 623 13060 12532
Equity Parent equity interest
Asset revaluation reserve 623 623 623 623 Total ~arent interest 11909 11909 623 623 12532 12532
Total equity 12437 11909 623 623 13060 12532
Statement of Changes in Equity Extract
Opening Balance Asset revaluation reserve 623 623 623 623
Note 13 Property Plant and Equipment Extract
Total depreciated value property amp equip 9 623 623 632 623
a) Reconciliation of written down value of asset classes Non-current Land at fair value Plant and equipment - at fair value Accumulated depreciation Total depreciated value of plant and equipment
34 (25)
9
623
623
623
623
623 34
(25) 632
623
623
b) Movement in the property asset revaluation reserve
Asset revaluation reserve carried forward Asset Revaluation Reserve balance 30 June
623 623
623 623
623 623
623 623
19
RESIDUAL BUSINESS MANAGEMENT CORPORATION GROUP
NOTES TO THE FINANCIAL STATEMENTS for Year Ended 30 June 2012
Note 2 - Correction of Prior Period Errors (continued)
Restatement of Financial Statements as a Result of Correction of an Error (continued)
1 July 2010 (Comparative year opening balances) Original Correction of Error Restated Adj
Financial Report Line Item I 2010 2010 2010 2010 2010 2010 Balance Affected
$000 $000 $000 $000 $000 $000 Consolidated Parent Consolidated Parent Consolidated Parent
Entity Entity Entity Statement of Financial Position Extract
Non-current assets ProQerty Qlant and eguiQment 15 623 623 638 623
Total non-current assets 32 1232 623 623 655 1855
Total assets 14908 3086 623 623 15531 3709
Net assets 12915 1104 623 623 13538 1727
Equity Parent equity interest
Asset revaluation reserve 623 623 623 623 Total Qarent interest 12059 1104 623 623 12682 1727
Total equity 12915 1104 623 623 13538 1727
Note 13 Pro~ertv2 Plant and Egui~ment Extract
Total depreciated value property amp equip 15 623 623 638 623
a) Reconciliation of written down value of asset classes Non-current Land at fair value Plant and equipment - at fair value Accumulated depreciation Total depreciated value of plant and equipment
34 (19)
15
623
623
623
623
623 34
(19) 638
623
623
b) Movement in the property asset revaluation reserve
Asset revaluation reserve carried forward Asset Revaluation Reserve balance 30 June
623 623
623 623
623 623
623 623
20
RESIDUAL BUSINESS MANAGEMENT CORPORATION GROUP
NOTES TO THE FINANCIAL STATEMENTS for Year Ended 30 June 2012
Consolidated Parent Entity 2012 2011 2012 2011
$000 $000 $000 $000 Note 3 - Other revenue and income
(a) Other revenue Interest received or receivable 628 792 589 689 Dividend from controlled entity 670 10993 Total other revenue 628 792 1259 11682
(b) Other income Revaluation gain on T Corp units 151 151 Reimbursements 10 Insurance premium refunds 4 4 Superannuation gain on defined benefit schemes 662 625 662 625 Total other income 813 629 823 629
Excludes superannuation actuarial losses of $11035456 (2010 gains of $122125) included in other comprehensive income (Refer notes 27(b) and 24)
Note 4 - Expenses
(a) Depreciation amp amortisation 9 7
(b) Occupancy expenses Operating lease rental expense 23 31
(c) Administrative expenses Auditors remuneration 88 66 65 44 Directors remuneration 123 135 82 67 Document storage 1 50 1 50 Insurance premiums 77 120 58 97 Business Manager 170 155 101 72 Travel 1 16 1 Other sundry costs 75 37 39 36 Total administrative expenses 535 579 347 366
(d) Other expenses Revaluation loss on financial assets 53 53 Impairment loss of subsidiary 760 206 Revaluation of inventory 155 Revaluation loss of non-current investment 10 Consultant fees 31 12 Total other expense 31 230 760 259
21
RESIDUAL BUSINESS MANAGEMENT CORPORATION GROUP
NOTES TO THE FINANCIAL STATEMENTS for Year Ended 30 June 2012
Consolidated Parent Entity 2012 2011 2012 2011
$000 $000 $000 $000 Note 5 - Income tax expense
(a) The prima facie tax payable on profit from ordinary activities before income tax is reconciled to the income tax expense as follows Operating profit before income tax 670 585 816 11683 Prima facie tax benefit on losses from ordinary activities before income tax at 3 0 (2011 3 0) Economic entity 201 176 Parent entity 245 3505 Add Tax effect ofnon-deductible items Sundry items 1 2 Less Tax effect of Tax losses (utilised) not brought to account 202 (178) 245 (3505) Income tax expense equivalent
Deferred tax assets not brought to account
(b) The deferred tax asset arising from the following tax losses and timing differences has not been recognised as an asset because recovery is not probable
Unused tax losses for which no deferred tax asset has been recognised 23170 29414 23170 19029 Unused capital losses for which no deferred tax asset has been recognised 1058 1058
24228 29414 24228 19029 Potential deferred tax assets at 30 not brought to account 7268 8824 7268 5709
Note 6 - Current assets - cash and cash equivalents
Cash at bank 1041 1500 1041 89 Total cash amp cash equivalents 1041 1500 1041 89
For reconciliation of cash and cash equivalents to the Statement of Cash Flows refer to Note 16 (b)
Note 7 - Current assets -T Corp Hour-Glass cash facility
T Corp Hour-Glass cash facility 10240 12075 10240 11993 Total T Corp Hour-Glass cash facility 10240 12075 10240 11993
22
RESIDUAL BUSINESS MANAGEMENT CORPORATION GROUP
NOTES TO THE FINANCIAL STATEMENTS for Year Ended 30 June 2012
Consolidated Parent Entity 2012 2011 2012 2011
$000 $000 $000 $000 Note 8 - Current assets- trade and other receivables Trade debtors I I Other debtors 10 6 10 I Interest receivable 16 42 16 I Other 265 Total trade and other receivables 26 49 26 268
Note 9 - Current assets - inventories
Finished goods - at lower of cost or realisable value 12 Total current assets - inventories 12
Note 10 - Non-current - trade and other receivables Deposits 7 Total trade and other receivables 7
Note 11- Non-current - financial assets
Shares in controlled entities (cost) - refer 11 (i) 56954 Less impairment adjustment (56194) Carrying value controlled entities 760 Shares in unlisted companies 10 Less impairment (10) Total financial assets 760
Controlled entities Residual Business Management Corporation acquired 100 (2011 59) of the shares in Pacific Solar Pty Limited on 24 February 2012 On 9 May 2012 Pacific Solar Pty Ltd was wound up and deregistered as a solvent entity
(i) The Group included the following controlled entity Country of Percentage of equity interest Investment
Entity name Incorporation held by the consolidated entity 2012 2011 2012 2011
$000 $000 Pacific Solar Pty Limited Australia Nil 59 760
Rounded to whole percent
23
RESIDUAL BUSINESS MANAGEMENT CORPORATION GROUP
NOTES TO THE FINANCIAL STATEMENTS for Year Ended 30 June 2012
Note 12 - Other non-current assets
Contract receivable Cost of goodwill re-acquired Less impairment
Consolidated 2012 2011
$000 $000
3324 8172 235
(3324) (8407)
Parent Entity 2012 2011
$000 $000
3324
(3324) Total other non-current assets
Movement in the allowance for impairment
Accumulated impairment carried forward (8407) (8407) Acc impairment written-back I (booked) 5083 (3324) Impairment balance 30 June
Note 13 - Non-current asserts - property plant and equipment
Total depreciated value property amp equip
(3324) (8407) (3324)
Consolidated Parent Entity 2012 2011 2010 2012 2011 2010
$000 $000 $000 $000 $000 $000
623 632 638 623 623 623
623 623 623 623 623 623 34 34
(25) (19) 623 632 638 623 623 623
a) Reconciliation of written down value of asset classes
Non-current Land at fair value Plant and equipment - at cost Accumulated depreciation Total depreciated value property amp equip
The prior period balance sheet has been adjusted for land parcels that were determined in 2012 to be owned and controlled by RBMC well prior to 30 June 2011 The land parcels are stated at the NSW Lands Departments commissioned valuations Refer note 2(b) for more information
24
RESIDUAL BUSINESS MANAGEMENT CORPORATION GROUP
NOTES TO THE FINANCIAL STATEMENTS for Year Ended 30 June 2012
Consolidated 2012 2011
$000 $000
Parent Entity 2012 2011
$000 $000
Note 14- Payables
Current Trade creditors Other creditors and accruals Total current payables
25 18 43
10 4
14
25 18 43
Terms and conditions relating to the above payables
(i) Trade creditors are non-interest bearing and are settled on 30 day terms (ii) Other creditors and accruals are non-interest bearing and normally settled on 30 day terms
Note 15 - Provisions
Non-current Superannuation net liability 27(b) 11575 1201 11575 1201
~~~~~~~~~~~~~~~~~
Total non-current provisions 11575 1201 11575 1201
Total provisions 11575 1201 11575 1201
Note 16 - Cash flow information
(a) Reconciliation of profit(loss) for the year after tax to net cash flows from operating activities
Profit I (loss) after income tax 670 585 816 11683 Non-cash items (Gain) I loss on investments 8 18 8 56 Depreciation of non - current assets 9 7 Superannuation (gain) on defined benefit schemes (662) (625) (662) (625) Investment activity transactions Dividends from investments (670) (10993) Changes in assets and liabilities (Decrease) I increase in trade and other debtors (3) 2 (7) (Decrease) I increase in other creditors 14 3 18 (26) (Decrease) I increase in provisions (35) Decrease I (increase) in other assets 33 (6) (16) 1 (Increase) I decrease in financial assets 10 760 206 (Increase) I decrease in inventory 12 162 Increase I (decrease) in creditors and borrowings 15 25 (8) Net cash flows from operating activities 96 121 272 294
(b) Reconciliation of cash and cash equivalents
Cash and cash equivalents 1041 1500 1041 89 Balance as per Statement of Cash Flows 1041 1500 1041 89
25
RESIDUAL BUSINESS MANAGEMENT CORPORATION GROUP
NOTES TO THE FINANCIAL STATEMENTS for Year Ended 30 June 2012
Note 16 - Cash flow information (continued)
(c) Acquisitions and disposal of entities
On 24 February 2012 RBMC became the wholly owned parent of Pacific Solar Pty Limited On the 9 May 2012 the Group effectively disposed of Pacific Solar Pty Limited due to it being wound-up and deregistered as a solvent entity on that date RBMC acquired the remaining assets of Pacific Solar they being intellectual property There were no other acquisitions of entities during the year ended 30 June 2012
(d) Financing Arrangements
Neither Residual Business Management Corporation nor any of its controlled entities have any external financing arrangements in place at year end or during the financial year
Note 17 - Commitments for expenditure
(i) Expenditure commitments
No entity in the Group had any expenditure commitments at year end or the prior year end
(ii) Lease expenditure commitments
The Group has a monthly rental agreement with Kennards Self Storage at a cost including GST of $37200 At 30 June 2012 the total rent lease commitments for warehousing facilities is $223200 (2011 $2335968)
Note 18 - Contingent liabilities
There are a number of legal actions that have been taken against RBMC and they have been defended The actions appear to have ceased without recent cost or exposure to RBMC However it is prudent to advise that future legal costs and if applicable settlement will be less than $50000 in the unlikely event that the actions are re-instigated and lost
Note 19 - Related party disclosures
Directors
The names of persons that were Directors or the equivalent of Directors or officers of Residual Business Management Corporation or its controlled entities at any time during the financial year were as follows
Residual Business Management Corporation
Dominic Schuster - General Manger - Appointed 1 September 2012 Andrew dApice - Former General Manger- Ceased 31 August 2012 Mark Guest- Secretary amp Comptroller (equivalent to a Company Secretary amp Finance officer)
Pacific Solar Pty Limited (Deregistered on 9 May 2012)
Andrew dApice- Former Executive Director (Chair)-Appointed 20 January 2012 and Ceased 9 May 2012 Mark Guest-Former Executive Officer amp Company Secretary-Ceased 9 May 2012
26
RESIDUAL BUSINESS MANAGEMENT CORPORATION GROUP
NOTES TO THE FINANCIAL STATEMENTS for Year Ended 30 June 2012
Note 19 - Related party disclosures (continued)
Pacific Solar Pty Limited (Deregistered on 9 May 2012) (continued)
Alan Cox - Former Non-Executive Director (Chair)- Resigned 20 January 2012 Edward Slack- Former Non-Executive Director- Resigned 20 January 2012 James Henderson - Former Non-Executive Director- Resigned 24 February 2012 Alfredo Palestini- Former Non-Executive Director-Resigned 24 February 2012
Ultimate parent entity
The ultimate parent entity of the RBMC Group is the New South Wales Government Residual Business Management Corporation (RBMC) is the parent entity within the RBMC Group and it owned 59 percent of Pacific Solar Pty Limited for the period from 1 July 2011 to 23 February 2012 RBMC then owned 100 percent of the former subsidiary Pacific Solar Pty Limited from 24 February 2012 until its deregistration on 9 May 2012
Transactions with related parties
All related party transactions were unsecured and based on normal terms and conditions By resolution on 6 March 2012 RBMC approved the wind-up of Pacific Solar Pty Limited and agreed to assume its known legal obligations and the expenses of the subsidiary during the wind-up process At the signing date of this report the Group believes that the deregistered Pacific Solar Pty Limited has no remaining financial obligations
There were no other cross guarantees between any entities in the RBMC Group
During the prior year the parent entity part funded the cost of Pacific Solars chairman details of which are set out below in this note
Pacific Solar Pty Limited
During the year RBMC provided funding to its former subsidiary Pacific Solar Pty Limited of Nil (2011 $29 10857) for part of the cost of its Director representative appointed to the Pacific Solar Board
During the year Pacific Solar provided funding to its parent of $9834 (2011 Nil) for part of the cost of the sole Director of the RBMC Group between February and March 2012
NewSouth Innovations Pty Limited a former minority shareholder of Pacific Solar provided Pacific Solar with information services in the 2012 year in the amount of Nil (2011 $5000) This was a normal commercial arrangement
During the year Pacific Solar completed a shareholder and ASIC approved share buy-back of all minority shareholdings RBMCs share of the buy-back payment was Nil (2011 $26548608)
This year Pacific Solar declared and paid dividends of $67039653 to RBMC (2011 Nil) being the sum of the all remaining cash and reserves of the former subsidiary company
RBMC received (paid) the following amounts from (to) or on behalf of its former subsidiary Pacific Solar
Creditor payments made $Nil (2011 $1666132) Cash returned to Pacific Solar $Nil (2011 $1037368)
At 30 June 2012 RBMC had an intercompany receivable of Nil (2011$26548608) with its former subsidiary Pacific Solar The 2011 receivable was paid by Pacific Solar to RBMC this financial year
27
RESIDUAL BUSINESS MANAGEMENT CORPORATION GROUP
NOTES TO THE FINANCIAL STATEMENTS for Year Ended 30 June 2012
Note 19 - Related party disclosures (continued)
Other Entities
During the year the RBMC Group paid remuneration to a registered Chartered Accountancy company directed and ultimately owned by Mark Guest of $18498761 (2011 $1943 53 50) This fee represents market rate remuneration for the services of Mark Guest three part-time tertiary qualified staff and the supply of the Groups registered office The parents share of this total Group remuneration was $10052472 (2011 $7205784) As part of the Pacific Solar wind-up RBMC agreed by resolution that it would assume responsibility for the contract entitlements of Mark Guests Firm The Pacific Solar contract entitlements expired on 6 September 2012 Mr Guests Firm continued to work on specific Pacific Solar related matters until mid-August 2012 and incidental matters until the date of the signing of this report
Note 20- Key management personnel compensation
Consolidated 2012 2011 $(not $(not
rounded) rounded)
Short-term benefits - RBMC 182222 139027 Short-tenn benefits - Pacific Solar Pty Limited 119843 151141 Termination benefits Total key management personnel compensation 302065 290168
Parent entity 2012 2011 $(not $(not
rounded) rounded)
Short-term benefits 182222 139027 Other long term benefits Post-employment benefits Termination benefits
182222 139027
In addition a benefit less than $150 (2011 $250) in credit card reward points was derived via the use of personal credit cards to make corporate payments on a normal executive use basis
28
RESIDUAL BUSINESS MANAGEMENT CORPORATION GROUP
NOTES TO THE FINANCIAL STATEMENTS for Year Ended 30 June 2012
Note 21 - Remuneration of Directors
Income paid or payable or otherwise made available to Directors by members of the Group and related parties in connection with the management of the Group
The number of Directors whose income from members of the Group and related parties was within the following bands
$0 - $9999 $10000 - $19999 $40000 - $49999 $50000 - $59999 $60000 - $69999 $80000 - $89999
Consolidated Parent Entity 2012 2011 2012 2011
$(not $(not $(not $(not rounded) rounded) rounded) rounded)
122636 134682 81698 66970
Number Number Number Number
3 3
2 2 1
In addition at the consolidated level benefits less than $250 (2011 $100) in credit card reward points was derived via the use of a personal credit card to make corporate payments on a normal executive use basis
No share options were or are held directly or indirectly by the Directors during the period or at balance date or during the prior year
Note 22 - Auditors remuneration
Amounts paid to or due and payable to the Auditor General ofNSW for - audit of the financial report of the entity and all other entities in the Group - other services in relation to the entity and all other entities in the Group
Consolidated Parent Entity 2012 2011 2012 2011
$000 $000 $000 $000
88 66 65 44
29
RESIDUAL BUSINESS MANAGEMENT CORPORATION GROUP
NOTES TO THE FINANCIAL STATEMENTS for Year Ended 30 June 2012
Note 23 - Financial risk management objectives and policies
The Groups principal financial instruments comprise receivables payables cash and term deposits These financial instruments arise directly from the Groups operations or are required to finance the Groups activities The Group does not enter into or trade financial instruments including derivative financial instruments for speculative purposes
(a) Risk exposures and responses
The Groups main risks arising from financial instruments are outlined below together with the Groups objectives policies and processes for measuring and managing risk Further quantitative and qualitative disclosures are included throughout these financial statements
The Groups General Manager has overall responsibility for the establishment and oversight of risk management and he reviews and agrees policies for the management of risk Risk management policies are established to identify and analyse the risks faced by the Group and to set risk limits and controls to monitor the risks Compliance with policies is reviewed by the General Manager on a continuous basis
(b) Financial instrument risk defined
The main financial instrument risks that the Group could be exposed to through its financial instruments are as follows
Interest Rate Risk
The Group is exposed to fluctuations in interest rates to the extent ofthe level of its invested cash
Credit Risk
The exposure to credit risk excluding the value of any collateral or other security held is the carrying amount of any provisions for impairment of the Groups recognised financial assets as disclosed in the Statement of Financial Position and notes to these financial statements
Liquidity Risk
The Group manages liquidity risk by monitoring forecast cash flows and ensuring that adequate cash reserves are maintained to fund creditor obligations
Foreign Currency Risk
The Group may be exposed to fluctuations in foreign currencies with respect of future royalty income
Price Risk
The Group is not currently exposed to any material commodity price risk
Sections ( e) to (i) ofthis note considers in detail those risk areas relevant to the Group
30
RESIDUAL BUSINESS MANAGEMENT CORPORATION GROUP
NOTES TO THE FINANCIAL STATEMENTS for Year Ended 30 June 2012
Note 23 - Financial risk management objectives and policies (continued)
(c) Financial instrument categories
Financial Instrument Class Table A Consolidated I Parent Note Category
(a) Financial assets
Cash and deposits 6 Cash T Corp Hour-Glass cash facility 7 Cash trust Receivables - non-current 10 Trade receivables (at amortised cost) Receivables - current 8 Other receivables (at amortised cost)
Total financial assets
(b) Financial liabilities
Payables 14 Trade and accruals measured at amortised cost
Total financial liabilities
Net financial assets
Total 2012 2011
$000 $000
1041 1500 10240 12075
- 7 26 49
11307 13631
43 14
43 H
11264 13617
(d) Financial instruments recognition policy
All Group financial assets and liabilities have been recognised at the reporting date at their net fair values The following methods and assumptions are used to determine the net fair values of financial assets and liabilities
Cash cash equivalents and short-term investments - the carrymg amount approximates fair value because of their short time maturity
Cash trusts - the carrying amount approximates fair value because the underlying trust assets are liquid investments and the financial instrument is redeemable at call
Trade receivables and trade creditors - the carrying amount approximates fair value because of their short term maturity There were no trade receivables that were past due or impaired at the year end
Contract and royalty receivables - the carrying amounts reflect impairment and discount to present value adjustments that derive an approximate fair value
Non-current investmentssecurities - for financial instruments traded in organised financial markets fair value is the current quoted market bid price for an asset or offer price for a liability adjusted for transaction costs necessary to realise the asset or settle the liability For investments where there is no quoted market price a reasonable estimate of the fair value is determined by reference to the current market value of another instrument which is substantially the same or is calculated based on the expected cash flows or the underlying net asset base of the investmentsecurity The carrying amount reflects an impairment that derives the approximate fair value
Unrecognised financial instruments- There are no unrecognised financial instruments
31
RESIDUAL BUSINESS MANAGEMENT CORPORATION GROUP
NOTES TO THE FINANCIAL STATEMENTS for Year Ended 30 June 2012
Note 23 - Financial risk management objectives and policies (continued)
(d) Financial instruments recognition policy (continued)
The entity uses the following hierarchy for disclosing the fair value of financial instruments by valuation technique
bull Level 1 - Derived from quoted prices in active markets for identical assets I liabilities bull Level 2 -Derived from inputs other than quoted prices that are observable directly or indirectly bull Level 3 - Derived from valuation techniques that include inputs for the asset I liability not based
on observable market data (unobservable inputs) 2012
Level 1 Level 2 Level 3 Total $000 $000 $000 $000
Financial assets at fair value TCorp Hour-Glass Inv Facility 10240 10240
10240 10240
The table above includes only financial assets as no financial liabilities were measured at fair value in the statement of financial position
The aggregate net fair values and carrying amounts of financial instruments are disclosed in the statement of financial position and the supporting notes to these financial statements
(e) Interest rate risk
Interest rate risk is the risk that the value of the financial instrument or its revenue or costs will fluctuate due to changes in market interest rates The Groups exposure to interest rate risk and the effective interest rates of its financial assets and liabilities at the reporting date are set out on the following pages
In respect of income-earning financial assets and interest-bearing financial liabilities the table on the following page sets out the carrying amount by maturity date of the financial instruments exposed to interest rate risk at reporting date
32
RESIDUAL BUSINESS MANAGEMENT CORPORATION GROUP
NOTES TO THE FINANCIAL STATEMENTS for Year Ended 30 June 2012
Note 23 - Financial risk management objectives and policies (continued)
(e) Interest rate risk (continued)
Table B Consolidated Fixed interest rate maturing in
Financial Instruments Floating interest rate
2012 2011 $000 $000
1 year or less
2012 2011 $000 $000
Over 1 to 5 years
2012 2011 $000 $000
More than 5 years
2012 2011 $000 $000
Non-interest bearing
2012 2011 $000 $000
Total carrying amount as per the
Statement of Financial Position
2012 2011 $000 $000
(i) Financial assets Cash at bank 41 92 1000 1408 1041 1500 Cash trust 10240 12075 10240 12075 Trade and other receivables 26 49 26 49
Total financial assets 10281 12167 1000 1408 26 49 11307 13624
Weighted average interest rate 489 475 585 578
(ii) Financial liabilities Trade creditors accruals and other creditors 43 14 43
Total financial liabilities 43 14 43
Weighted average interest rate
Net financial assets (liabilities 10281 12167 1000 1408 17 35 11264 13610
33
14
14
RESIDUAL BUSINESS MANAGEMENT CORPORATION GROUP
NOTES TO THE FINANCIAL STATEMENTS for Year Ended 30 June 2012
Note 23 - Financial risk management objectives and policies (continued)
(e) Interest rate risk (continued)
Interest rate risk scenario and sensitivity analysis
The Group invests in secure bank term deposits and with the NSW Governments Treasury Corporation (T Corp) The Group holds large cash reserves to deal with its legacy business issues and to enable it to enforce its contractual rights in relation to the intellectual property it has developed Interest rate movements have a large impact on the results of the Group The risk profile set by the General Manager results in the Group receiving only a small margin above or below the official Australian interest rate set by the Australian Reserve Bank Board The duration of each cash investment essentially drives the interest rate the Group receives
TCorp Hour-Glass facilities
Exposure to interest rate risk primarily arises through the investment in the TCorp Hour Glass Investment Facilities which are held for strategic rather than trading purposes The Group holds units in the following Hour-Glass investment trusts
Consolidated Parent
Facility Investment Sectors Investment Horizon 2012
$000 2011
$000 2012
$000 2011
$000
Cash facility Cash and money market securities At call 10240 12075 10240 11993
The unit price of the facility is equal to the total fair value of the net assets held by the facility divided by the number of units on issue for that facility Unit prices are calculated and published daily NSW TCorp is trustee for the above facility and is required to act in the best interest of the unit holders and to administer the trust in accordance with the trust deeds As trustee TCorp has appointed external managers to manage the performance and risk of the facility in accordance with a mandate agreed by the parties Significant portions of administration are also outsourced to an external custodian Investment in the Hour-Glass facilities limits the Groups exposure to risk as it allows diversification across a pool of funds with different investment horizons and a mix of investments
The impact on profit I loss 2012 is as follows
Consolidated Parent Facility Change in
Unit Price Impact on Profit I
Loss 2012 $000
Impact on Profit I Loss 2011
$000
Impact on Profit I Loss 2012
$000
Impact on Profit I Loss 2011
$000 Cash facility +-1 102 121 102 120
NSW TCorp provides sensitivity analysis information for the cash facility using historical based volatility information collected over a ten year period quoted at two standard deviations (ie 95 probability)
The TCorp Hour-Glass investment facilities are designated at fair value through the Statement of Comprehensive Income and therefore any changes in unit price impacts directly on profit (rather than equity) A reasonably possible change is based on the percentage change in unit price multiplied by the redemption value as at 30 June each year for each facility
34
RESIDUAL BUSINESS MANAGEMENT CORPORATION GROUP
NOTES TO THE FINANCIAL STATEMENTS for Year Ended 30 June 2012
Note 23 - Financial risk management objectives and policies (continued)
(e) Interest rate risk (continued)
TCorp Hour-Glass facilities (continued)
The Groups term deposit cash investment sensitivity rates are similar As follows is the Groups judgement of reasonable possible movements in profits due to foreseeable changes in interest rates
(f) Credit risk
Credit Risk is the risk of financial loss arising to the Group from the default of another party with a contract or financial position with the Group The Group has material credit risk exposure to the CSG Solar AG Group in that at reporting date the Group has gross royalty rights receivable over time from CSG Solar AG Group of a least $332438395 (2011 $8 17197928) The table below states these gross receipts at their recoverable amount discounted to present value which is Nil (2011 $Nil) these written down values being the balances reflected in these financial statements These royalty rights are not past due but they are considered fully impaired Group policy is that all customers that wish to trade on credit terms are subject to a credit worthiness review
The Groups maximum exposure to credit risk and the applicable counter party is represented by the carrying amounts of its financial assets at reporting date as is set out in the following table (There was no past due balances at 30 June 2012)
Table C Financial
Instrument
Government Institutions
Australian Banks
CSG Solar AG Group
Other Commercial
entities Total
Consolidated 2012 $000
2011 $000
2012 $000
2011 $000
2012 $000
2011 $000
2012 $000
2011 $000
2012 $000
2011 $000
(a) Financial assets Cash and deposits - - 1041 1500 - - - - 1041 1500
Cash trust 10240 12075 - - - - - - 10240 12075 Trade receivables
amp other - - - - - - 26 49 26 49 Royalty rights
Impairment - - - -3324
(3324) 8172
(8172) --
--
3324 (3324)
8172 (8 172)
Net Rovalty - - - - - - - - - -Unlisted shares
Impairment --
--
--
--
--
10 (10)
--
--
--
10 (10)
Net unlisted shares - - - - - - - - - -Total 10240 12075 1041 1500 - - 26 49 11307 13624
35
RESIDUAL BUSINESS MANAGEMENT CORPORATION GROUP
NOTES TO THE FINANCIAL STATEMENTS for Year Ended 30 June 2012
Note 23 - Financial risk management objectives and policies (continued)
(g) Liquidity risk
Liquidity risk arises from the financial liabilities of the Group and the Groups subsequent ability to meet the obligations to repay the liabilities as and when they fall due As is disclosed above the Group maintains a high level of cash reserves to cover its material credit and warranty risks The Group has ongoing administrative costs require ongoing funding The following table provides the maturity dates of the Groups financial liabilities by bands
Table D
Maturity Bands
Financial liabilities
Trade creditors
Other creditors
Total financial liabilities
2012 2012 2011 2012 2011 more 2011 2012 2011 less less more more than 2 more More More
than than than 1 than 1 less than 2 than than one one less than less than than 5 less than 5 5 2012 2011 year year 2 years 2 years years 5 years years years Total Total $000 $000 $000 $000 $000 $000 $000 $000 $000 $000
25 12 - - - - - - 25 12
18 2 - - - - - - 18 2
43 14 - - - - - - 43 14
(h) Foreign currency risk
At the present time the Group has no material exposure to foreign currency risk The Groups above mentioned royalty rights are payable in Australian dollars
(i) Derivative financial instruments
During the financial year ending 30 June 2012 neither Residual Business Management Corporation nor any of its controlled entities had any known exposure to derivatives
36
RESIDUAL BUSINESS MANAGEMENT CORPORATION GROUP
NOTES TO THE FINANCIAL STATEMENTS for Year Ended 30 June 2012
Note 24-Retained earnings Note
Consolidated
2012 2011 $000 $000
Parent Entity
2012 2011 $000 $000
Balance at beginning of the financial year Owners of the parent comprehensive income (loss) Superannuation actuarial (losses) I gains Dividend paid or declared Balance at the end of the year
3(b) 27(c)
11909 816
(11036) 2000
(311
12059 728 122
(1000) 11909
11909 816
(11036) 2000
(311
1104 11683
122 (1000) 11909
Note 25 shy Non-controlling interests
As at 30 June 2011 the parent entity held an equity interest of 59 in Pacific Solar Pty Limited On 24 February 2012 a share buyback was approved by all minority shareholders for all of their Pacific Solar Pty Limited shares Thus on this date Pacific Solar became a fully owned subsidiary of RBMC Pacific Solar was then deregistered as a solvent entity on 9 May 2012 The buyback was based on a mid-point minority interest discount of 20 for the shares held by the following shareholders
Enipower SpA University ofNSW New South Innovations Pty Limited Thi An Dinh Morgan Michael Green Briana Keagan Green and Michelle Gaye Wenham
Reconciliation of non-controlling interest in RBMCs consolidated equity Non-controlling interest
2012 2011 $000 $000
Non-controlling interest in Pacific Solar share capital 36364 Non-controlling interests share ofretained (losses) at the end of the year (35836 Non-controlling interest in RBMCs consolidated equity 528
Note 26 - New Australian Accountings Standards issued but not effective
In the current year the Group has adopted all of the new and revised Standards and Interpretations issued by the AASB that are relevant to the operations and effective for the current reporting period Details of the impact of the adoption of these new accounting standards are set out in the individual accounting policies notes in the financial statements Certain new accounting standards and interpretations have been published that are not mandatory for the 30 June 2012 reporting period The Group did not early adopt any new accounting standards that are not yet effective The Group has assessed the impact of the new standards and interpretations on issue but not effective and considers the impact to be insignificant
37
RESIDUAL BUSINESS MANAGEMENT CORPORATION GROUP
NOTES TO THE FINANCIAL STATEMENTS for Year Ended 30 June 2012
Note 27 - Superannuation information
(a) Superannuation income recognition policy
In 2012 the Group recognises the net total of the following amounts in profit or loss
Current service cost is the increase in the present value of the defined benefit obligation resulting from employee service in the current period Interest cost is the increase in the present value of the defined benefit obligation which arises because the benefits are one period closer to settlement Expected return on plan assets is based on market expectations at the beginning of the period for returns over the life of the related obligation and on any reimbursement rights Past service cost (to the extent required to be recognised) is the increase in the defined benefit obligation from changes to post-employment benefits relating to employee service in prior periods and Curtailments or settlements are amendments to the terms of the plan andor number of employees covered by the plan
The Group recognises defined benefit actuarial superannuation gains and losses in other comprehensive income
(b) Superannuation obligations
All former employees were entitled to varying levels of benefits on retirement disability or death The superannuation plans (State Superannuation Scheme (SSS) State Authorities Superannuation Scheme (SASS) and State Authorities Non-Contributory Superannuation Scheme (SANCS) provide defined benefits based on years of service and final average salary Employees contributed to the plans and the contribution of the parent entity was and remains legally enforceable All Schemes are closed to new members
Note (b) continues on the following page
38
RESIDUAL BUSINESS MANAGEMENT CORPORATION GROUP
NOTES TO THE FINANCIAL STATEMENTS for Year Ended 30 June 2012
Note 27 - Superannuation information (continued)
(b) Superannuation obligations (continued)
The following is the superannuation position of the Group as at 30 June 2012 The superannuation assets and liabilities recognised in the statement of financial position are listed at the bottom of the table
Consolidated (Being The Parent Entity)
2012 2011 2012 2011 2012 2011 2012 2011 Member numbers
SASS SANCS SSS Total
Contributors - - - - - - - -Deferred benefits - - - - 3 3 3 3 Pensioners 2 2 - - 39 38 41 40 Pensions fully commuted - - - - 2 2 2 2 Totals 2 2 - - 44 43 46 45
Accrued liability
Superannuation position for AASB119 purposes
(437)
2012 $000
(339)
2011 $000
-
2012 $000
-
2011 $000
(32024)
2012 $000
(23303)
2011 $000
(32461)
2012 $000
(23642)
2011 $000
Estimate reserve account balance 193 269 282 279 20411 21893 20886 22441 Sub-total
Future Service Liability (Note 1) Surplus in excess of recovery available from Schemes Net asset I (liability) to be recognised in statement of financial position
(244)
-
-
(244)
(70)
-
-
(70)
282
-
-
282
279
-
-
279
(11613)
-
-
(11613)
(1410)
-
-
(1410)
(11575)
-
-
(11575)
(1201)
-
-
(1201)
Note 1 The Future Service Liability (FSL) does not have to be recognised by an employer It is only used to determine if an asset ceiling limit should be imposed (AASB 119 para 58) Under AASB 119 any prepaid superannuation asset recognised cannot exceed the total of any unrecognised past service cost and the present value of any economic benefits that may be available in the form of refunds from the plan or reductions in future contributions to the plan Where the surplus in excess of recovery is zero no asset ceiling limit is imposed
As is set out above at 30 June 2012 Residual Business Management Corporation had a gross calculated defined benefit superannuation liability with respect of former employees of $32461163 (2011 23641751 ) Superannuation funds invested to cover this liability amounted to $20886294 (2011 $22440728) The aforementioned superannuation liability and surplus position has been calculated by an independent and qualified actuary The calculated deficiency of invested funds versus the anticipated superannuation liabilities at 30 June 2012 was a balance of $11574869 (2011 $1201023) The parent entity with the support ofNSW Treasury believes that it has sufficient funds to cover this deficiency
39
RESIDUAL BUSINESS MANAGEMENT CORPORATION GROUP
NOTES TO THE FINANCIAL STATEMENTS for Year Ended 30 June 2012
Note 27 - Superannuation information (continued)
(b) Superannuation obligations (continued)
Th T f h t ee reconcr ration o t e present va ue of h defimed b enefirt o blrgatrons rs as flo11ows For the year ended 30 June 2012
Consolidated (Being the Parent Entity) SASS SANCS SSS $000 $000 $000
Present value ofpartly funded defined benefit obligation at beginning of the year (339) - (23303) Current service cost - - -Interest cost (17) - (I 199) Contributions by fund participants - - -Actuarial gains (losses) (157) 3 (8995) Benefits paid 76 (3) 1473 Past service cost - - -Curtailments - - -Settlements - - -Business Combinations - - -Exchange rate changes - - -Present value of partly funded defined benefit obliations at end of the year (437) - (32024)
Total Total 2012 2011
$000 $000
(23642) (23686) - -
(1216) (I 194) - -
(9149) 141 1546 1097
- -- -- -- -- -
(32461) (23642)
The reconciliation of the fair value offund assets is as follows
For the year ended 30 June 2012 Total Total Consolidated (Being the Parent Entity) SASS SAN CS SSS 2012 2011
$000 $000 $000 $000 $000 Fair value of fund assets at beginning of the year 269 279 21893 22441 21738 Expected (loss) I return on fund assets 22 24 1832 1878 1819 Actuarial (losses) I gains (22) (24) (1841) (1887) (19) Employer contributions - - - - -Contributions by fund participants - - - - -Benefits paid (76) 3 (1473) (1546) (l097) Settlements - - - - -Business combinations - - - - -Exchange rate changes - - - - -Fair value of fund assets at end of the year 193 282 20411 20886 22441
The reconciliation of the assets and liabilities recognised in the statement of financial position is follows
Total Consolidated (Being the Parent Entity)
TotalFor the year ended 30 June 2012 2012
$000 SAN CS SASS SSS
$000 Present value ofpartly funded defined benefit obligations at end of the year
$000 $000 $000
(32461) (23642) Fair value of fund assets at end of year
(437) (32024)-22441
Subtotal 20886282 20411193
(1201) Unrecognised past service cost
(11575)(244) (11613)282 - - - --
Unrecognised gain(loss) --- --Adjustment for limitation on net assets -- -- -Net asset I (liability) recognised in the statement of financial position at end of year (l201)(11575)(244) (11613)282
40
2011
RESIDUAL BUSINESS MANAGEMENT CORPORATION GROUP
NOTES TO THE FINANCIAL STATEMENTS for Year Ended 30 June 2012
Note 27 - Superannuation information (continued)
(b) Superannuation obligations (continued)
For the year ended 30 June 2012
2012 Consolidated (Being the Parent Entity) SASS SANCS SSS Total Components recognised in profit or loss by component $000 $000 $000 $000 Current service cost - - - -Interest cost (17) - (1199) (1216) Expected return on fund assets (net of expenses) 22 24 1832 1878 Past service cost - - - -Movement in adjustment for limitation on net asset - - - -Curtailment or settlement gain(loss) - - - -Total included in Other income in the statement of 5 24 633 662 comprehensive income (refer also note 2(b))
For the year ended 30 June 2012
2012 Consolidated (Being the Parent Entity) SASS SAN CS SSS Total Components recognised in other comprehensive income $000 $000 $000 $000 Actuarial (losses) I gains recognised in year (179) (21) (10836) (11036)
2011 Total $000
-(1194)
1819 ---
625
2011 Total $000
122
Cumulative amount recognised in other comprehensive income
The cumulative amount of actuarial gains and losses since 1 July 2005 recognised in other comprehensive income is an accumulated loss of $14221000 (2011 accumulated loss of $3185000) Before 1 July 2005 RBMC treated the defined benefit superannuation funds as separate entities and so recognised no superannuation balances in other comprehensive income
(c) Superannuation obligations - actuarial loses outside the statement of comprehensive income
Amounts not recognised in the statement of comprehensive income and expenses are as follows
For the year ended 30 June 2012
Consolidated (Being the Parent Entity) SASS SAN CS SSS 2012
Total 2011 Total
$000 $000 $000 $000 $000 Actuarial (losses) - - - - -Adjustment for limit on net asset - - - - -Total loss not reco2nised in the income statement - - - - -
41
RESIDUAL BUSINESS MANAGEMENT CORPORATION GROUP
NOTES TO THE FINANCIAL STATEMENTS for Year Ended 30 June 2012
Note 27 - Superannuation information (continued)
(d) Superannuation asset classes
The percentage invested in each asset class at the balance sheet date
Consolidated (Being the Parent Entity) 30 June 2012 30 June 2011 Australian equities 280 334 Overseas equities 237 295 Australian fixed interest securities 49 57 Overseas fixed interest securities 24 31 Property 86 99 Cash 195 51 Other 129 133
All Fund assets are invested by SAS Trustee Corporation (STC) at arms length through independent fund managers
Other superannuation provision information related to AASB 119 is disclosed at Note 28
AASB 119 requires organisations to provide detailed narrative information regarding the key economic and demographic assumptions underlying the reported defined benefits superannuation account balances The assumptions and calculations are generic to all NSW Government agencies and they are set out in Note 28
Note 28 - AASB 119 Superannuation information valuation method and principal actuarial assumptions
The followings are the superannuation asset and liability assumptions and calculations generic to all NSW Government agencies
The expected rate of return on assets assumption is determined by weighting the expected long-term return for each asset class by the target allocation of assets to each class The returns used for each class are net of investment tax and investment fees
Actual return on Scheme assets are as follows
For the year ended 30 June 2012 Consolidated (Being the Parent Entity) SASS SANCS SSS Total
$000 $000 $000 $000 Actual loss I (return) on fund assets (1) - 9 8
(a) Valuation Method
The Projected Unit Credit (PUC) valuation method was used to determine the present value of the defined benefit obligations and the related current service costs This method sees each period of service as giving rise to an additional unit of benefit entitlement and measures each unit separately to build up the final obligation
42
RESIDUAL BUSINESS MANAGEMENT CORPORATION GROUP
NOTES TO THE FINANCIAL STATEMENTS for Year Ended 30 June 2012
Note 28 - AASB 119 Superannuation information valuation method and principal actuarial assumptions (continued)
(b) Economic assumptions
Consolidated (Being the Parent Entity) 30 June 2012 30 June 2011
Salary increase rate (excluding promotional increases) 25 pa 35 pa
Rate ofCPI increase 25 pa 25pa
Expected rate of return on assets backing pension liabilities 860 pa 860pa
Expected rate ofretum on assets backing other liabilities 860 pa 860pa
Discount rate 306 pa 528pa
(c) Demographic assumptions
The demographic assumptions underlying the calculated actuarial balances of the RBMC Superannuation Schemes are generic to all NSW Government agencies and further details can be obtained from the NSW Treasury website
(d) Historical information
For the year ended 3 0 June 2012 Consolidated (Being the Parent Entity) SASS SANCS SSS Total
$000 $000 $000 $000 Present value ofdefined benefit obligation (437) - (32024) (32461) Fair value of fund assets 193 282 20411 20886 Surplus(Deficit) in fund (244) 282 (11613) (11575) Experience adjustments - liabilities (157) 3 (8995) (9149) Experience adjustments - assets (22) (23) (1841) (1886)
For the year ended 30 June 2011 Consolidated (Being the Parent Entity) SASS SANCS SSS Total
$000 $000 $000 $000 Present value of defined benefit obligation (339) - (23303) (23642) Fair value of fund assets 269 279 21893 22441 Surplus(Deficit) in fund (70) 279 (1410) (1201) Experience adjustments - liabilities 12 (6) 135 141 Experience adjustments - assets - (1) (18) (19)
For the year ended 30 June 2010 Consolidated (Being the Parent Entity) SASS SAN CS SSS Total
$000 $000 $000 $000 Present value of defined benefit obligation (344) - (23342) (23686) Fair value of fund assets 258 263 21217 21738 Surplus in fund (86) 263 (2125) (1948) Experience adjustments - liabilities (8) (3) (1079) (1090) Experience adjustments - assets 2 1 133 136
43
RESIDUAL BUSINESS MANAGEMENT CORPORATION GROUP
NOTES TO THE FINANCIAL STATEMENTS for Year Ended 30 June 2012
Note 28 - AASB 119 Superannuation information valuation method and principal actuarial assumptions (continued)
(d) Historical information (continued)
For the year ended 30 June 2009 Consolidated (Being the Parent Entity) SASS SAN CS SSS Total
$000 $000 $000 $000 Present value of defined benefit obligation (336) - (21959) (22295) Fair value of fund assets 254 244 20292 20790 Surplus in fund (83) 244 (1666) (1505) Experience adjustments - liabilities (65) 15 (3875) (3925) Experience adjustments - assets (55) (48) (4259) (4362)
For the year ended 30 June 2008 Consolidated (Being the Parent Entity) SASS SAN CS SSS Total
$000 $000 $000 $000 Present value of defined benefit obligation (283) - (18313) (18596) Fair value of fund assets 313 256 24045 24614 Surplus in fund 30 256 5732 6018 Experience adjustments - liabilities 3 111 2119 2233 Experience adjustments - assets 16 (76) (5316) (5376)
(e) Expected contributions
For the year ended 30 June 2012 SASS SAN CS SSS Total $000 $000 $000 $000
Expected employer contributions to be paid in the next reporting period - - - -
(f) Funding arrangements for employer contributions
i Surplus I deficit
The following is a summary of the 30 June 2012 financial position of the Schemes calculated in accordance with AAS 25 Financial Reporting by Superannuation Plans
For the year ended 30 June 2012
Consolidated (Being the Parent Entity) SASS SANCS SSS Total 2012
Total 2011
$000 $000 $000 $000 $000 Accrued benefits (256) - (17086) (17342) (16841) Net market value of Fund assets 193 283 20410 20886 22441 Total net surplus( deficiency) (63) 283 3324 3544 5600
44
RESIDUAL BUSINESS MANAGEMENT CORPORATION GROUP
NOTES TO THE FINANCIAL STATEMENTS for Year Ended 30 June 2012
Note 28 - AASB 119 Superannuation information valuation method and principal actuarial assumptions (continued)
(f) Funding arrangements for employer contributions (continued)
ii Contribution recommendations
The recommended contribution rates are as follows For the year ended 30 June 2012
Consolidated (Being the Parent Entity)
SASS SANCS SSS
Multiple of member contributions member salary Multiple ofmember contributions 000 000 000
iii Funding method
Contribution rates are set after discussions between the employer STC and NSW Treasury
iv Economic assumptions
The economic assumptions adopted for the current actuarial review of the Fund are
Weighted-average assumptions 2012 2011
Expected rate ofretum on Fund assets backing current pension liabilities 83 pa 83pa
Expected rate of return on Fund assets backing other liabilities 73 pa 73pa
Expected salary increase rate 40 pa 40pa
Expected rate of CPI increase 25 pa 25pa
(g) Nature of asset I (liability)
If a surplus exists in the employers interest in the Fund the employer may be able to take advantage of it in the form of a reduction in the required contribution rate depending on the advice of the Funds actuary
Where a deficiency exists the employer is responsible for any difference between the employers share of Fund assets and the defined benefit obligation
Note 29 - Events occurring after reporting date
The services of Mr Andrew d Apice the former General Manager of the RBMC Group were finalised on 31 August 2012 Mr Dominic Schuster of NSW Treasury was then appointed as his replacement effective 1 September 2012
There were no other matters or circumstances that have arisen since the end of the financial year which significantly affected or may significantly affect the operations of the Group the results of those operations or the state of affairs of the Group in future years
End of audited financial statements
45
RESIDUAL BUSINESS MANAGEMENT CORPORATION
FINANCIAL STATEMENTS FOR THE YEAR ENDED 30 JUNE 2012
STATEMENT BY CHIEF EXECUTIVE OFFICER
RESIDUAL BUSINESS MANAGERMENT CORPORATION
Pursuant to Section 41C of the Public Finance and Audit Act 1983 I state that in my opinion
The accompanying financial statements and notes thereto exhibit a true and fair view of the financial
position of the Residual Business Management Corporation (RBMC) as at 30 June 2012 and the
financial performance for the year then ended
The financial statements have been prepared in accordance with the provisions of applicable
Australian Accounting Standards (which include Australian Accounting Interpretations) the
requirements of the Public Finance and Audit Act 1983 applicable clauses of the Public Finance and
Audit Regulation 2010 the requirements of the Financial Reporting Directions published in the
Financial Reporting Code for NSW General Government Sector Entities and the Treasurers
Directions
Further I am not aware of any circumstances which would render any particulars included in the
financial statements to be misleading or inaccurate
On behalf of the Corporation
Dominic Schuster
General Manager
Residual Business Management Corporation
Dated 6 May 2014 at Sydney
INDEPENDENT AUDITORS REPORT
Residual Business Management Corporation
To Members of the New South Wales Parliament
I have audited the accompanying financial statements of Residual Business Management Corporation (the Corporation) which comprise the statements of financial position as at 30 June 2012 the statements of comprehensive income the statements of changes in equity and the statements of cash flows for the year then ended notes comprising a summary of significant accounting policies and other explanatory information of the Corporation and the consolidated entity The consolidated entity comprises the Corporation and the entities it controlled at the year end or from time to time during the financial year
Opinion
In my opinion the financial statements
give a true and fair view of the financial position of the Corporation and the consolidated entity as at 30 June 2012 and of their financial performance and cash flows for the year then ended in accordance with Australian Accounting Standards
bull are in accordance with section 41B of Public Finance and Audit Act 1983 (the PFampA Act) and the Public Finance and Audit Regulation 2010
My opinion should be read in conjunction with the rest of this report
The General Managers Responsibility for the Financial Statements
The General Manager is responsible for the preparation of the financial statements that give a true and fair view in accordance with Australian Accounting Standards and the PFampA Act and for such internal control as the General Manager determines is necessary to enable the preparation of the financial statements that are free from material misstatement whether due to fraud or error
Auditors Responsibility
My responsibility is to express an opinion on the financial statements based on my audit I conducted my audit in accordance with Australian Auditing Standards Those standards require that I comply with relevant ethical requirements relating to audit engagements and plan and perform the audit to obtain reasonable assurance about whether the financial statements are free from material misstatement
An audit involves performing procedures to obtain audit evidence about the amounts and disclosures in the financial statements The procedures selected depend on the auditors judgement including the assessment of the risks of material misstatement of the financial statements whether due to fraud or error In making those risk assessments the auditor considers internal controls relevant to the entitys preparation of the financial statements that give a true and fair view in order to design audit procedures that are appropriate in the circumstances but not for the purpose of expressing an opinion on the effectiveness of the entitys internal control An audit also includes evaluating the appropriateness of accounting policies used and the reasonableness of accounting estimates made by the General Manager as well as evaluating the overall presentation of the financial statements
I believe the audit evidence I have obtained is sufficient and appropriate to provide a basis for my audit opinion
My opinion does not provide assurance
bull about the future viability of the Corporation or consolidated entity
bull that they have carried out their activities effectively efficiently and economically
bull about the effectiveness of internal control
bull about the security and controls over the electronic publication of the audited financial statements on any website where they may be presented
bull about any other information that may have been hyperlinked tofrom the financial statements
Independence
In conducting my audit I have complied with the independence requirements of the Australian Auditing Standards and other relevant ethical pronouncements The PFampA Act further promotes independence by
bull providing that only Parliament and not the executive government can remove an Auditor-General
bull mandating the Auditor-General as auditor of public sector agencies but precluding the provision of non-audit services thus ensuring the Auditor-General and the Audit Office of New South Wales are not compromised in their role by the possibility of losing clients or income
1~k Kheir Director Financial Audit Services
19May2014 SYDNEY
- Structure Bookmarks
-
- Figure
- Figure
- Financial Instrument Class Table A Consolidated I Parent Note Category (a) Financial assets Cash and deposits 6 Cash T Corp Hour-Glass cash facility 7 Cash trust Receivables -non-current 10 Trade receivables (at amortised cost) Receivables -current 8 Other receivables (at amortised cost) Total financial assets (b) Financial liabilities Payables 14 Trade and accruals measured at amortised cost Total financial liabilities Net financial assets Total 2012 2011 $000 $000 1041 1500 10240 12075 -7 26 49 1130
- For the year ended 30 June 2012 Consolidated (Being the Parent Entity) SASS SANCS SSS $000 $000 $000 Present value ofpartly funded defined benefit obligation at beginning ofthe year (339) -(23303) Current service cost ---Interest cost (17) -(I199) Contributions by fund participants ---Actuarial gains (losses) (157) 3 (8995) Benefits paid 76 (3) 1473 Past service cost ---Curtailments ---Settlements ---Business Combinations ---Exchange rate changes ---Present value of partly funded defined benefit obl
- For the year ended 30 June 2012 2012 Consolidated (Being the Parent Entity) SASS SANCS SSS Total Components recognised in profit or loss by component $000 $000 $000 $000 Current service cost ----Interest cost (17) -(1199) (1216) Expected return on fund assets (net ofexpenses) 22 24 1832 1878 Past service cost ----Movement in adjustment for limitation on net asset ----Curtailment or settlement gain(loss) ----Total included in Other income in the statement of 5 24 633 662 comprehensive income (refe
- Figure
- Figure
- 1~kKheir
-
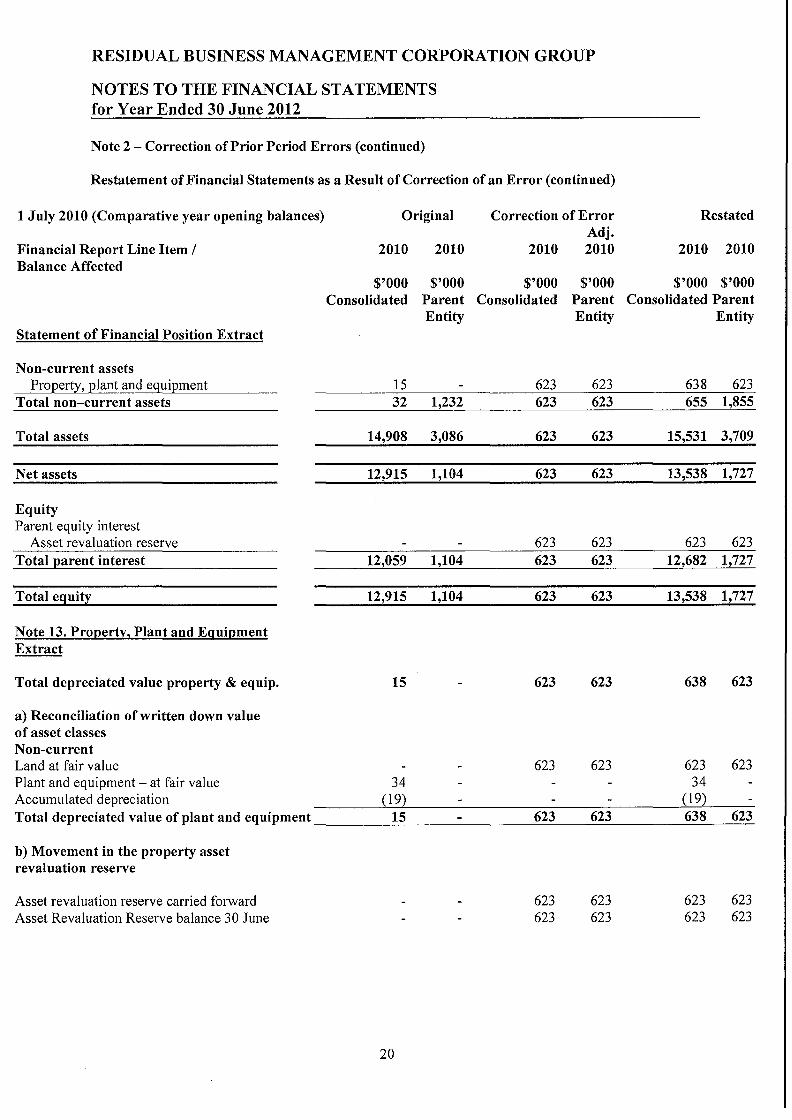
RESIDUAL BUSINESS MANAGEMENT CORPORATION GROUP
NOTES TO THE FINANCIAL STATEMENTS for Year Ended 30 June 2012
Consolidated Parent Entity 2012 2011 2012 2011
$000 $000 $000 $000 Note 3 - Other revenue and income
(a) Other revenue Interest received or receivable 628 792 589 689 Dividend from controlled entity 670 10993 Total other revenue 628 792 1259 11682
(b) Other income Revaluation gain on T Corp units 151 151 Reimbursements 10 Insurance premium refunds 4 4 Superannuation gain on defined benefit schemes 662 625 662 625 Total other income 813 629 823 629
Excludes superannuation actuarial losses of $11035456 (2010 gains of $122125) included in other comprehensive income (Refer notes 27(b) and 24)
Note 4 - Expenses
(a) Depreciation amp amortisation 9 7
(b) Occupancy expenses Operating lease rental expense 23 31
(c) Administrative expenses Auditors remuneration 88 66 65 44 Directors remuneration 123 135 82 67 Document storage 1 50 1 50 Insurance premiums 77 120 58 97 Business Manager 170 155 101 72 Travel 1 16 1 Other sundry costs 75 37 39 36 Total administrative expenses 535 579 347 366
(d) Other expenses Revaluation loss on financial assets 53 53 Impairment loss of subsidiary 760 206 Revaluation of inventory 155 Revaluation loss of non-current investment 10 Consultant fees 31 12 Total other expense 31 230 760 259
21
RESIDUAL BUSINESS MANAGEMENT CORPORATION GROUP
NOTES TO THE FINANCIAL STATEMENTS for Year Ended 30 June 2012
Consolidated Parent Entity 2012 2011 2012 2011
$000 $000 $000 $000 Note 5 - Income tax expense
(a) The prima facie tax payable on profit from ordinary activities before income tax is reconciled to the income tax expense as follows Operating profit before income tax 670 585 816 11683 Prima facie tax benefit on losses from ordinary activities before income tax at 3 0 (2011 3 0) Economic entity 201 176 Parent entity 245 3505 Add Tax effect ofnon-deductible items Sundry items 1 2 Less Tax effect of Tax losses (utilised) not brought to account 202 (178) 245 (3505) Income tax expense equivalent
Deferred tax assets not brought to account
(b) The deferred tax asset arising from the following tax losses and timing differences has not been recognised as an asset because recovery is not probable
Unused tax losses for which no deferred tax asset has been recognised 23170 29414 23170 19029 Unused capital losses for which no deferred tax asset has been recognised 1058 1058
24228 29414 24228 19029 Potential deferred tax assets at 30 not brought to account 7268 8824 7268 5709
Note 6 - Current assets - cash and cash equivalents
Cash at bank 1041 1500 1041 89 Total cash amp cash equivalents 1041 1500 1041 89
For reconciliation of cash and cash equivalents to the Statement of Cash Flows refer to Note 16 (b)
Note 7 - Current assets -T Corp Hour-Glass cash facility
T Corp Hour-Glass cash facility 10240 12075 10240 11993 Total T Corp Hour-Glass cash facility 10240 12075 10240 11993
22
RESIDUAL BUSINESS MANAGEMENT CORPORATION GROUP
NOTES TO THE FINANCIAL STATEMENTS for Year Ended 30 June 2012
Consolidated Parent Entity 2012 2011 2012 2011
$000 $000 $000 $000 Note 8 - Current assets- trade and other receivables Trade debtors I I Other debtors 10 6 10 I Interest receivable 16 42 16 I Other 265 Total trade and other receivables 26 49 26 268
Note 9 - Current assets - inventories
Finished goods - at lower of cost or realisable value 12 Total current assets - inventories 12
Note 10 - Non-current - trade and other receivables Deposits 7 Total trade and other receivables 7
Note 11- Non-current - financial assets
Shares in controlled entities (cost) - refer 11 (i) 56954 Less impairment adjustment (56194) Carrying value controlled entities 760 Shares in unlisted companies 10 Less impairment (10) Total financial assets 760
Controlled entities Residual Business Management Corporation acquired 100 (2011 59) of the shares in Pacific Solar Pty Limited on 24 February 2012 On 9 May 2012 Pacific Solar Pty Ltd was wound up and deregistered as a solvent entity
(i) The Group included the following controlled entity Country of Percentage of equity interest Investment
Entity name Incorporation held by the consolidated entity 2012 2011 2012 2011
$000 $000 Pacific Solar Pty Limited Australia Nil 59 760
Rounded to whole percent
23
RESIDUAL BUSINESS MANAGEMENT CORPORATION GROUP
NOTES TO THE FINANCIAL STATEMENTS for Year Ended 30 June 2012
Note 12 - Other non-current assets
Contract receivable Cost of goodwill re-acquired Less impairment
Consolidated 2012 2011
$000 $000
3324 8172 235
(3324) (8407)
Parent Entity 2012 2011
$000 $000
3324
(3324) Total other non-current assets
Movement in the allowance for impairment
Accumulated impairment carried forward (8407) (8407) Acc impairment written-back I (booked) 5083 (3324) Impairment balance 30 June
Note 13 - Non-current asserts - property plant and equipment
Total depreciated value property amp equip
(3324) (8407) (3324)
Consolidated Parent Entity 2012 2011 2010 2012 2011 2010
$000 $000 $000 $000 $000 $000
623 632 638 623 623 623
623 623 623 623 623 623 34 34
(25) (19) 623 632 638 623 623 623
a) Reconciliation of written down value of asset classes
Non-current Land at fair value Plant and equipment - at cost Accumulated depreciation Total depreciated value property amp equip
The prior period balance sheet has been adjusted for land parcels that were determined in 2012 to be owned and controlled by RBMC well prior to 30 June 2011 The land parcels are stated at the NSW Lands Departments commissioned valuations Refer note 2(b) for more information
24
RESIDUAL BUSINESS MANAGEMENT CORPORATION GROUP
NOTES TO THE FINANCIAL STATEMENTS for Year Ended 30 June 2012
Consolidated 2012 2011
$000 $000
Parent Entity 2012 2011
$000 $000
Note 14- Payables
Current Trade creditors Other creditors and accruals Total current payables
25 18 43
10 4
14
25 18 43
Terms and conditions relating to the above payables
(i) Trade creditors are non-interest bearing and are settled on 30 day terms (ii) Other creditors and accruals are non-interest bearing and normally settled on 30 day terms
Note 15 - Provisions
Non-current Superannuation net liability 27(b) 11575 1201 11575 1201
~~~~~~~~~~~~~~~~~
Total non-current provisions 11575 1201 11575 1201
Total provisions 11575 1201 11575 1201
Note 16 - Cash flow information
(a) Reconciliation of profit(loss) for the year after tax to net cash flows from operating activities
Profit I (loss) after income tax 670 585 816 11683 Non-cash items (Gain) I loss on investments 8 18 8 56 Depreciation of non - current assets 9 7 Superannuation (gain) on defined benefit schemes (662) (625) (662) (625) Investment activity transactions Dividends from investments (670) (10993) Changes in assets and liabilities (Decrease) I increase in trade and other debtors (3) 2 (7) (Decrease) I increase in other creditors 14 3 18 (26) (Decrease) I increase in provisions (35) Decrease I (increase) in other assets 33 (6) (16) 1 (Increase) I decrease in financial assets 10 760 206 (Increase) I decrease in inventory 12 162 Increase I (decrease) in creditors and borrowings 15 25 (8) Net cash flows from operating activities 96 121 272 294
(b) Reconciliation of cash and cash equivalents
Cash and cash equivalents 1041 1500 1041 89 Balance as per Statement of Cash Flows 1041 1500 1041 89
25
RESIDUAL BUSINESS MANAGEMENT CORPORATION GROUP
NOTES TO THE FINANCIAL STATEMENTS for Year Ended 30 June 2012
Note 16 - Cash flow information (continued)
(c) Acquisitions and disposal of entities
On 24 February 2012 RBMC became the wholly owned parent of Pacific Solar Pty Limited On the 9 May 2012 the Group effectively disposed of Pacific Solar Pty Limited due to it being wound-up and deregistered as a solvent entity on that date RBMC acquired the remaining assets of Pacific Solar they being intellectual property There were no other acquisitions of entities during the year ended 30 June 2012
(d) Financing Arrangements
Neither Residual Business Management Corporation nor any of its controlled entities have any external financing arrangements in place at year end or during the financial year
Note 17 - Commitments for expenditure
(i) Expenditure commitments
No entity in the Group had any expenditure commitments at year end or the prior year end
(ii) Lease expenditure commitments
The Group has a monthly rental agreement with Kennards Self Storage at a cost including GST of $37200 At 30 June 2012 the total rent lease commitments for warehousing facilities is $223200 (2011 $2335968)
Note 18 - Contingent liabilities
There are a number of legal actions that have been taken against RBMC and they have been defended The actions appear to have ceased without recent cost or exposure to RBMC However it is prudent to advise that future legal costs and if applicable settlement will be less than $50000 in the unlikely event that the actions are re-instigated and lost
Note 19 - Related party disclosures
Directors
The names of persons that were Directors or the equivalent of Directors or officers of Residual Business Management Corporation or its controlled entities at any time during the financial year were as follows
Residual Business Management Corporation
Dominic Schuster - General Manger - Appointed 1 September 2012 Andrew dApice - Former General Manger- Ceased 31 August 2012 Mark Guest- Secretary amp Comptroller (equivalent to a Company Secretary amp Finance officer)
Pacific Solar Pty Limited (Deregistered on 9 May 2012)
Andrew dApice- Former Executive Director (Chair)-Appointed 20 January 2012 and Ceased 9 May 2012 Mark Guest-Former Executive Officer amp Company Secretary-Ceased 9 May 2012
26
RESIDUAL BUSINESS MANAGEMENT CORPORATION GROUP
NOTES TO THE FINANCIAL STATEMENTS for Year Ended 30 June 2012
Note 19 - Related party disclosures (continued)
Pacific Solar Pty Limited (Deregistered on 9 May 2012) (continued)
Alan Cox - Former Non-Executive Director (Chair)- Resigned 20 January 2012 Edward Slack- Former Non-Executive Director- Resigned 20 January 2012 James Henderson - Former Non-Executive Director- Resigned 24 February 2012 Alfredo Palestini- Former Non-Executive Director-Resigned 24 February 2012
Ultimate parent entity
The ultimate parent entity of the RBMC Group is the New South Wales Government Residual Business Management Corporation (RBMC) is the parent entity within the RBMC Group and it owned 59 percent of Pacific Solar Pty Limited for the period from 1 July 2011 to 23 February 2012 RBMC then owned 100 percent of the former subsidiary Pacific Solar Pty Limited from 24 February 2012 until its deregistration on 9 May 2012
Transactions with related parties
All related party transactions were unsecured and based on normal terms and conditions By resolution on 6 March 2012 RBMC approved the wind-up of Pacific Solar Pty Limited and agreed to assume its known legal obligations and the expenses of the subsidiary during the wind-up process At the signing date of this report the Group believes that the deregistered Pacific Solar Pty Limited has no remaining financial obligations
There were no other cross guarantees between any entities in the RBMC Group
During the prior year the parent entity part funded the cost of Pacific Solars chairman details of which are set out below in this note
Pacific Solar Pty Limited
During the year RBMC provided funding to its former subsidiary Pacific Solar Pty Limited of Nil (2011 $29 10857) for part of the cost of its Director representative appointed to the Pacific Solar Board
During the year Pacific Solar provided funding to its parent of $9834 (2011 Nil) for part of the cost of the sole Director of the RBMC Group between February and March 2012
NewSouth Innovations Pty Limited a former minority shareholder of Pacific Solar provided Pacific Solar with information services in the 2012 year in the amount of Nil (2011 $5000) This was a normal commercial arrangement
During the year Pacific Solar completed a shareholder and ASIC approved share buy-back of all minority shareholdings RBMCs share of the buy-back payment was Nil (2011 $26548608)
This year Pacific Solar declared and paid dividends of $67039653 to RBMC (2011 Nil) being the sum of the all remaining cash and reserves of the former subsidiary company
RBMC received (paid) the following amounts from (to) or on behalf of its former subsidiary Pacific Solar
Creditor payments made $Nil (2011 $1666132) Cash returned to Pacific Solar $Nil (2011 $1037368)
At 30 June 2012 RBMC had an intercompany receivable of Nil (2011$26548608) with its former subsidiary Pacific Solar The 2011 receivable was paid by Pacific Solar to RBMC this financial year
27
RESIDUAL BUSINESS MANAGEMENT CORPORATION GROUP
NOTES TO THE FINANCIAL STATEMENTS for Year Ended 30 June 2012
Note 19 - Related party disclosures (continued)
Other Entities
During the year the RBMC Group paid remuneration to a registered Chartered Accountancy company directed and ultimately owned by Mark Guest of $18498761 (2011 $1943 53 50) This fee represents market rate remuneration for the services of Mark Guest three part-time tertiary qualified staff and the supply of the Groups registered office The parents share of this total Group remuneration was $10052472 (2011 $7205784) As part of the Pacific Solar wind-up RBMC agreed by resolution that it would assume responsibility for the contract entitlements of Mark Guests Firm The Pacific Solar contract entitlements expired on 6 September 2012 Mr Guests Firm continued to work on specific Pacific Solar related matters until mid-August 2012 and incidental matters until the date of the signing of this report
Note 20- Key management personnel compensation
Consolidated 2012 2011 $(not $(not
rounded) rounded)
Short-term benefits - RBMC 182222 139027 Short-tenn benefits - Pacific Solar Pty Limited 119843 151141 Termination benefits Total key management personnel compensation 302065 290168
Parent entity 2012 2011 $(not $(not
rounded) rounded)
Short-term benefits 182222 139027 Other long term benefits Post-employment benefits Termination benefits
182222 139027
In addition a benefit less than $150 (2011 $250) in credit card reward points was derived via the use of personal credit cards to make corporate payments on a normal executive use basis
28
RESIDUAL BUSINESS MANAGEMENT CORPORATION GROUP
NOTES TO THE FINANCIAL STATEMENTS for Year Ended 30 June 2012
Note 21 - Remuneration of Directors
Income paid or payable or otherwise made available to Directors by members of the Group and related parties in connection with the management of the Group
The number of Directors whose income from members of the Group and related parties was within the following bands
$0 - $9999 $10000 - $19999 $40000 - $49999 $50000 - $59999 $60000 - $69999 $80000 - $89999
Consolidated Parent Entity 2012 2011 2012 2011
$(not $(not $(not $(not rounded) rounded) rounded) rounded)
122636 134682 81698 66970
Number Number Number Number
3 3
2 2 1
In addition at the consolidated level benefits less than $250 (2011 $100) in credit card reward points was derived via the use of a personal credit card to make corporate payments on a normal executive use basis
No share options were or are held directly or indirectly by the Directors during the period or at balance date or during the prior year
Note 22 - Auditors remuneration
Amounts paid to or due and payable to the Auditor General ofNSW for - audit of the financial report of the entity and all other entities in the Group - other services in relation to the entity and all other entities in the Group
Consolidated Parent Entity 2012 2011 2012 2011
$000 $000 $000 $000
88 66 65 44
29
RESIDUAL BUSINESS MANAGEMENT CORPORATION GROUP
NOTES TO THE FINANCIAL STATEMENTS for Year Ended 30 June 2012
Note 23 - Financial risk management objectives and policies
The Groups principal financial instruments comprise receivables payables cash and term deposits These financial instruments arise directly from the Groups operations or are required to finance the Groups activities The Group does not enter into or trade financial instruments including derivative financial instruments for speculative purposes
(a) Risk exposures and responses
The Groups main risks arising from financial instruments are outlined below together with the Groups objectives policies and processes for measuring and managing risk Further quantitative and qualitative disclosures are included throughout these financial statements
The Groups General Manager has overall responsibility for the establishment and oversight of risk management and he reviews and agrees policies for the management of risk Risk management policies are established to identify and analyse the risks faced by the Group and to set risk limits and controls to monitor the risks Compliance with policies is reviewed by the General Manager on a continuous basis
(b) Financial instrument risk defined
The main financial instrument risks that the Group could be exposed to through its financial instruments are as follows
Interest Rate Risk
The Group is exposed to fluctuations in interest rates to the extent ofthe level of its invested cash
Credit Risk
The exposure to credit risk excluding the value of any collateral or other security held is the carrying amount of any provisions for impairment of the Groups recognised financial assets as disclosed in the Statement of Financial Position and notes to these financial statements
Liquidity Risk
The Group manages liquidity risk by monitoring forecast cash flows and ensuring that adequate cash reserves are maintained to fund creditor obligations
Foreign Currency Risk
The Group may be exposed to fluctuations in foreign currencies with respect of future royalty income
Price Risk
The Group is not currently exposed to any material commodity price risk
Sections ( e) to (i) ofthis note considers in detail those risk areas relevant to the Group
30
RESIDUAL BUSINESS MANAGEMENT CORPORATION GROUP
NOTES TO THE FINANCIAL STATEMENTS for Year Ended 30 June 2012
Note 23 - Financial risk management objectives and policies (continued)
(c) Financial instrument categories
Financial Instrument Class Table A Consolidated I Parent Note Category
(a) Financial assets
Cash and deposits 6 Cash T Corp Hour-Glass cash facility 7 Cash trust Receivables - non-current 10 Trade receivables (at amortised cost) Receivables - current 8 Other receivables (at amortised cost)
Total financial assets
(b) Financial liabilities
Payables 14 Trade and accruals measured at amortised cost
Total financial liabilities
Net financial assets
Total 2012 2011
$000 $000
1041 1500 10240 12075
- 7 26 49
11307 13631
43 14
43 H
11264 13617
(d) Financial instruments recognition policy
All Group financial assets and liabilities have been recognised at the reporting date at their net fair values The following methods and assumptions are used to determine the net fair values of financial assets and liabilities
Cash cash equivalents and short-term investments - the carrymg amount approximates fair value because of their short time maturity
Cash trusts - the carrying amount approximates fair value because the underlying trust assets are liquid investments and the financial instrument is redeemable at call
Trade receivables and trade creditors - the carrying amount approximates fair value because of their short term maturity There were no trade receivables that were past due or impaired at the year end
Contract and royalty receivables - the carrying amounts reflect impairment and discount to present value adjustments that derive an approximate fair value
Non-current investmentssecurities - for financial instruments traded in organised financial markets fair value is the current quoted market bid price for an asset or offer price for a liability adjusted for transaction costs necessary to realise the asset or settle the liability For investments where there is no quoted market price a reasonable estimate of the fair value is determined by reference to the current market value of another instrument which is substantially the same or is calculated based on the expected cash flows or the underlying net asset base of the investmentsecurity The carrying amount reflects an impairment that derives the approximate fair value
Unrecognised financial instruments- There are no unrecognised financial instruments
31
RESIDUAL BUSINESS MANAGEMENT CORPORATION GROUP
NOTES TO THE FINANCIAL STATEMENTS for Year Ended 30 June 2012
Note 23 - Financial risk management objectives and policies (continued)
(d) Financial instruments recognition policy (continued)
The entity uses the following hierarchy for disclosing the fair value of financial instruments by valuation technique
bull Level 1 - Derived from quoted prices in active markets for identical assets I liabilities bull Level 2 -Derived from inputs other than quoted prices that are observable directly or indirectly bull Level 3 - Derived from valuation techniques that include inputs for the asset I liability not based
on observable market data (unobservable inputs) 2012
Level 1 Level 2 Level 3 Total $000 $000 $000 $000
Financial assets at fair value TCorp Hour-Glass Inv Facility 10240 10240
10240 10240
The table above includes only financial assets as no financial liabilities were measured at fair value in the statement of financial position
The aggregate net fair values and carrying amounts of financial instruments are disclosed in the statement of financial position and the supporting notes to these financial statements
(e) Interest rate risk
Interest rate risk is the risk that the value of the financial instrument or its revenue or costs will fluctuate due to changes in market interest rates The Groups exposure to interest rate risk and the effective interest rates of its financial assets and liabilities at the reporting date are set out on the following pages
In respect of income-earning financial assets and interest-bearing financial liabilities the table on the following page sets out the carrying amount by maturity date of the financial instruments exposed to interest rate risk at reporting date
32
RESIDUAL BUSINESS MANAGEMENT CORPORATION GROUP
NOTES TO THE FINANCIAL STATEMENTS for Year Ended 30 June 2012
Note 23 - Financial risk management objectives and policies (continued)
(e) Interest rate risk (continued)
Table B Consolidated Fixed interest rate maturing in
Financial Instruments Floating interest rate
2012 2011 $000 $000
1 year or less
2012 2011 $000 $000
Over 1 to 5 years
2012 2011 $000 $000
More than 5 years
2012 2011 $000 $000
Non-interest bearing
2012 2011 $000 $000
Total carrying amount as per the
Statement of Financial Position
2012 2011 $000 $000
(i) Financial assets Cash at bank 41 92 1000 1408 1041 1500 Cash trust 10240 12075 10240 12075 Trade and other receivables 26 49 26 49
Total financial assets 10281 12167 1000 1408 26 49 11307 13624
Weighted average interest rate 489 475 585 578
(ii) Financial liabilities Trade creditors accruals and other creditors 43 14 43
Total financial liabilities 43 14 43
Weighted average interest rate
Net financial assets (liabilities 10281 12167 1000 1408 17 35 11264 13610
33
14
14
RESIDUAL BUSINESS MANAGEMENT CORPORATION GROUP
NOTES TO THE FINANCIAL STATEMENTS for Year Ended 30 June 2012
Note 23 - Financial risk management objectives and policies (continued)
(e) Interest rate risk (continued)
Interest rate risk scenario and sensitivity analysis
The Group invests in secure bank term deposits and with the NSW Governments Treasury Corporation (T Corp) The Group holds large cash reserves to deal with its legacy business issues and to enable it to enforce its contractual rights in relation to the intellectual property it has developed Interest rate movements have a large impact on the results of the Group The risk profile set by the General Manager results in the Group receiving only a small margin above or below the official Australian interest rate set by the Australian Reserve Bank Board The duration of each cash investment essentially drives the interest rate the Group receives
TCorp Hour-Glass facilities
Exposure to interest rate risk primarily arises through the investment in the TCorp Hour Glass Investment Facilities which are held for strategic rather than trading purposes The Group holds units in the following Hour-Glass investment trusts
Consolidated Parent
Facility Investment Sectors Investment Horizon 2012
$000 2011
$000 2012
$000 2011
$000
Cash facility Cash and money market securities At call 10240 12075 10240 11993
The unit price of the facility is equal to the total fair value of the net assets held by the facility divided by the number of units on issue for that facility Unit prices are calculated and published daily NSW TCorp is trustee for the above facility and is required to act in the best interest of the unit holders and to administer the trust in accordance with the trust deeds As trustee TCorp has appointed external managers to manage the performance and risk of the facility in accordance with a mandate agreed by the parties Significant portions of administration are also outsourced to an external custodian Investment in the Hour-Glass facilities limits the Groups exposure to risk as it allows diversification across a pool of funds with different investment horizons and a mix of investments
The impact on profit I loss 2012 is as follows
Consolidated Parent Facility Change in
Unit Price Impact on Profit I
Loss 2012 $000
Impact on Profit I Loss 2011
$000
Impact on Profit I Loss 2012
$000
Impact on Profit I Loss 2011
$000 Cash facility +-1 102 121 102 120
NSW TCorp provides sensitivity analysis information for the cash facility using historical based volatility information collected over a ten year period quoted at two standard deviations (ie 95 probability)
The TCorp Hour-Glass investment facilities are designated at fair value through the Statement of Comprehensive Income and therefore any changes in unit price impacts directly on profit (rather than equity) A reasonably possible change is based on the percentage change in unit price multiplied by the redemption value as at 30 June each year for each facility
34
RESIDUAL BUSINESS MANAGEMENT CORPORATION GROUP
NOTES TO THE FINANCIAL STATEMENTS for Year Ended 30 June 2012
Note 23 - Financial risk management objectives and policies (continued)
(e) Interest rate risk (continued)
TCorp Hour-Glass facilities (continued)
The Groups term deposit cash investment sensitivity rates are similar As follows is the Groups judgement of reasonable possible movements in profits due to foreseeable changes in interest rates
(f) Credit risk
Credit Risk is the risk of financial loss arising to the Group from the default of another party with a contract or financial position with the Group The Group has material credit risk exposure to the CSG Solar AG Group in that at reporting date the Group has gross royalty rights receivable over time from CSG Solar AG Group of a least $332438395 (2011 $8 17197928) The table below states these gross receipts at their recoverable amount discounted to present value which is Nil (2011 $Nil) these written down values being the balances reflected in these financial statements These royalty rights are not past due but they are considered fully impaired Group policy is that all customers that wish to trade on credit terms are subject to a credit worthiness review
The Groups maximum exposure to credit risk and the applicable counter party is represented by the carrying amounts of its financial assets at reporting date as is set out in the following table (There was no past due balances at 30 June 2012)
Table C Financial
Instrument
Government Institutions
Australian Banks
CSG Solar AG Group
Other Commercial
entities Total
Consolidated 2012 $000
2011 $000
2012 $000
2011 $000
2012 $000
2011 $000
2012 $000
2011 $000
2012 $000
2011 $000
(a) Financial assets Cash and deposits - - 1041 1500 - - - - 1041 1500
Cash trust 10240 12075 - - - - - - 10240 12075 Trade receivables
amp other - - - - - - 26 49 26 49 Royalty rights
Impairment - - - -3324
(3324) 8172
(8172) --
--
3324 (3324)
8172 (8 172)
Net Rovalty - - - - - - - - - -Unlisted shares
Impairment --
--
--
--
--
10 (10)
--
--
--
10 (10)
Net unlisted shares - - - - - - - - - -Total 10240 12075 1041 1500 - - 26 49 11307 13624
35
RESIDUAL BUSINESS MANAGEMENT CORPORATION GROUP
NOTES TO THE FINANCIAL STATEMENTS for Year Ended 30 June 2012
Note 23 - Financial risk management objectives and policies (continued)
(g) Liquidity risk
Liquidity risk arises from the financial liabilities of the Group and the Groups subsequent ability to meet the obligations to repay the liabilities as and when they fall due As is disclosed above the Group maintains a high level of cash reserves to cover its material credit and warranty risks The Group has ongoing administrative costs require ongoing funding The following table provides the maturity dates of the Groups financial liabilities by bands
Table D
Maturity Bands
Financial liabilities
Trade creditors
Other creditors
Total financial liabilities
2012 2012 2011 2012 2011 more 2011 2012 2011 less less more more than 2 more More More
than than than 1 than 1 less than 2 than than one one less than less than than 5 less than 5 5 2012 2011 year year 2 years 2 years years 5 years years years Total Total $000 $000 $000 $000 $000 $000 $000 $000 $000 $000
25 12 - - - - - - 25 12
18 2 - - - - - - 18 2
43 14 - - - - - - 43 14
(h) Foreign currency risk
At the present time the Group has no material exposure to foreign currency risk The Groups above mentioned royalty rights are payable in Australian dollars
(i) Derivative financial instruments
During the financial year ending 30 June 2012 neither Residual Business Management Corporation nor any of its controlled entities had any known exposure to derivatives
36
RESIDUAL BUSINESS MANAGEMENT CORPORATION GROUP
NOTES TO THE FINANCIAL STATEMENTS for Year Ended 30 June 2012
Note 24-Retained earnings Note
Consolidated
2012 2011 $000 $000
Parent Entity
2012 2011 $000 $000
Balance at beginning of the financial year Owners of the parent comprehensive income (loss) Superannuation actuarial (losses) I gains Dividend paid or declared Balance at the end of the year
3(b) 27(c)
11909 816
(11036) 2000
(311
12059 728 122
(1000) 11909
11909 816
(11036) 2000
(311
1104 11683
122 (1000) 11909
Note 25 shy Non-controlling interests
As at 30 June 2011 the parent entity held an equity interest of 59 in Pacific Solar Pty Limited On 24 February 2012 a share buyback was approved by all minority shareholders for all of their Pacific Solar Pty Limited shares Thus on this date Pacific Solar became a fully owned subsidiary of RBMC Pacific Solar was then deregistered as a solvent entity on 9 May 2012 The buyback was based on a mid-point minority interest discount of 20 for the shares held by the following shareholders
Enipower SpA University ofNSW New South Innovations Pty Limited Thi An Dinh Morgan Michael Green Briana Keagan Green and Michelle Gaye Wenham
Reconciliation of non-controlling interest in RBMCs consolidated equity Non-controlling interest
2012 2011 $000 $000
Non-controlling interest in Pacific Solar share capital 36364 Non-controlling interests share ofretained (losses) at the end of the year (35836 Non-controlling interest in RBMCs consolidated equity 528
Note 26 - New Australian Accountings Standards issued but not effective
In the current year the Group has adopted all of the new and revised Standards and Interpretations issued by the AASB that are relevant to the operations and effective for the current reporting period Details of the impact of the adoption of these new accounting standards are set out in the individual accounting policies notes in the financial statements Certain new accounting standards and interpretations have been published that are not mandatory for the 30 June 2012 reporting period The Group did not early adopt any new accounting standards that are not yet effective The Group has assessed the impact of the new standards and interpretations on issue but not effective and considers the impact to be insignificant
37
RESIDUAL BUSINESS MANAGEMENT CORPORATION GROUP
NOTES TO THE FINANCIAL STATEMENTS for Year Ended 30 June 2012
Note 27 - Superannuation information
(a) Superannuation income recognition policy
In 2012 the Group recognises the net total of the following amounts in profit or loss
Current service cost is the increase in the present value of the defined benefit obligation resulting from employee service in the current period Interest cost is the increase in the present value of the defined benefit obligation which arises because the benefits are one period closer to settlement Expected return on plan assets is based on market expectations at the beginning of the period for returns over the life of the related obligation and on any reimbursement rights Past service cost (to the extent required to be recognised) is the increase in the defined benefit obligation from changes to post-employment benefits relating to employee service in prior periods and Curtailments or settlements are amendments to the terms of the plan andor number of employees covered by the plan
The Group recognises defined benefit actuarial superannuation gains and losses in other comprehensive income
(b) Superannuation obligations
All former employees were entitled to varying levels of benefits on retirement disability or death The superannuation plans (State Superannuation Scheme (SSS) State Authorities Superannuation Scheme (SASS) and State Authorities Non-Contributory Superannuation Scheme (SANCS) provide defined benefits based on years of service and final average salary Employees contributed to the plans and the contribution of the parent entity was and remains legally enforceable All Schemes are closed to new members
Note (b) continues on the following page
38
RESIDUAL BUSINESS MANAGEMENT CORPORATION GROUP
NOTES TO THE FINANCIAL STATEMENTS for Year Ended 30 June 2012
Note 27 - Superannuation information (continued)
(b) Superannuation obligations (continued)
The following is the superannuation position of the Group as at 30 June 2012 The superannuation assets and liabilities recognised in the statement of financial position are listed at the bottom of the table
Consolidated (Being The Parent Entity)
2012 2011 2012 2011 2012 2011 2012 2011 Member numbers
SASS SANCS SSS Total
Contributors - - - - - - - -Deferred benefits - - - - 3 3 3 3 Pensioners 2 2 - - 39 38 41 40 Pensions fully commuted - - - - 2 2 2 2 Totals 2 2 - - 44 43 46 45
Accrued liability
Superannuation position for AASB119 purposes
(437)
2012 $000
(339)
2011 $000
-
2012 $000
-
2011 $000
(32024)
2012 $000
(23303)
2011 $000
(32461)
2012 $000
(23642)
2011 $000
Estimate reserve account balance 193 269 282 279 20411 21893 20886 22441 Sub-total
Future Service Liability (Note 1) Surplus in excess of recovery available from Schemes Net asset I (liability) to be recognised in statement of financial position
(244)
-
-
(244)
(70)
-
-
(70)
282
-
-
282
279
-
-
279
(11613)
-
-
(11613)
(1410)
-
-
(1410)
(11575)
-
-
(11575)
(1201)
-
-
(1201)
Note 1 The Future Service Liability (FSL) does not have to be recognised by an employer It is only used to determine if an asset ceiling limit should be imposed (AASB 119 para 58) Under AASB 119 any prepaid superannuation asset recognised cannot exceed the total of any unrecognised past service cost and the present value of any economic benefits that may be available in the form of refunds from the plan or reductions in future contributions to the plan Where the surplus in excess of recovery is zero no asset ceiling limit is imposed
As is set out above at 30 June 2012 Residual Business Management Corporation had a gross calculated defined benefit superannuation liability with respect of former employees of $32461163 (2011 23641751 ) Superannuation funds invested to cover this liability amounted to $20886294 (2011 $22440728) The aforementioned superannuation liability and surplus position has been calculated by an independent and qualified actuary The calculated deficiency of invested funds versus the anticipated superannuation liabilities at 30 June 2012 was a balance of $11574869 (2011 $1201023) The parent entity with the support ofNSW Treasury believes that it has sufficient funds to cover this deficiency
39
RESIDUAL BUSINESS MANAGEMENT CORPORATION GROUP
NOTES TO THE FINANCIAL STATEMENTS for Year Ended 30 June 2012
Note 27 - Superannuation information (continued)
(b) Superannuation obligations (continued)
Th T f h t ee reconcr ration o t e present va ue of h defimed b enefirt o blrgatrons rs as flo11ows For the year ended 30 June 2012
Consolidated (Being the Parent Entity) SASS SANCS SSS $000 $000 $000
Present value ofpartly funded defined benefit obligation at beginning of the year (339) - (23303) Current service cost - - -Interest cost (17) - (I 199) Contributions by fund participants - - -Actuarial gains (losses) (157) 3 (8995) Benefits paid 76 (3) 1473 Past service cost - - -Curtailments - - -Settlements - - -Business Combinations - - -Exchange rate changes - - -Present value of partly funded defined benefit obliations at end of the year (437) - (32024)
Total Total 2012 2011
$000 $000
(23642) (23686) - -
(1216) (I 194) - -
(9149) 141 1546 1097
- -- -- -- -- -
(32461) (23642)
The reconciliation of the fair value offund assets is as follows
For the year ended 30 June 2012 Total Total Consolidated (Being the Parent Entity) SASS SAN CS SSS 2012 2011
$000 $000 $000 $000 $000 Fair value of fund assets at beginning of the year 269 279 21893 22441 21738 Expected (loss) I return on fund assets 22 24 1832 1878 1819 Actuarial (losses) I gains (22) (24) (1841) (1887) (19) Employer contributions - - - - -Contributions by fund participants - - - - -Benefits paid (76) 3 (1473) (1546) (l097) Settlements - - - - -Business combinations - - - - -Exchange rate changes - - - - -Fair value of fund assets at end of the year 193 282 20411 20886 22441
The reconciliation of the assets and liabilities recognised in the statement of financial position is follows
Total Consolidated (Being the Parent Entity)
TotalFor the year ended 30 June 2012 2012
$000 SAN CS SASS SSS
$000 Present value ofpartly funded defined benefit obligations at end of the year
$000 $000 $000
(32461) (23642) Fair value of fund assets at end of year
(437) (32024)-22441
Subtotal 20886282 20411193
(1201) Unrecognised past service cost
(11575)(244) (11613)282 - - - --
Unrecognised gain(loss) --- --Adjustment for limitation on net assets -- -- -Net asset I (liability) recognised in the statement of financial position at end of year (l201)(11575)(244) (11613)282
40
2011
RESIDUAL BUSINESS MANAGEMENT CORPORATION GROUP
NOTES TO THE FINANCIAL STATEMENTS for Year Ended 30 June 2012
Note 27 - Superannuation information (continued)
(b) Superannuation obligations (continued)
For the year ended 30 June 2012
2012 Consolidated (Being the Parent Entity) SASS SANCS SSS Total Components recognised in profit or loss by component $000 $000 $000 $000 Current service cost - - - -Interest cost (17) - (1199) (1216) Expected return on fund assets (net of expenses) 22 24 1832 1878 Past service cost - - - -Movement in adjustment for limitation on net asset - - - -Curtailment or settlement gain(loss) - - - -Total included in Other income in the statement of 5 24 633 662 comprehensive income (refer also note 2(b))
For the year ended 30 June 2012
2012 Consolidated (Being the Parent Entity) SASS SAN CS SSS Total Components recognised in other comprehensive income $000 $000 $000 $000 Actuarial (losses) I gains recognised in year (179) (21) (10836) (11036)
2011 Total $000
-(1194)
1819 ---
625
2011 Total $000
122
Cumulative amount recognised in other comprehensive income
The cumulative amount of actuarial gains and losses since 1 July 2005 recognised in other comprehensive income is an accumulated loss of $14221000 (2011 accumulated loss of $3185000) Before 1 July 2005 RBMC treated the defined benefit superannuation funds as separate entities and so recognised no superannuation balances in other comprehensive income
(c) Superannuation obligations - actuarial loses outside the statement of comprehensive income
Amounts not recognised in the statement of comprehensive income and expenses are as follows
For the year ended 30 June 2012
Consolidated (Being the Parent Entity) SASS SAN CS SSS 2012
Total 2011 Total
$000 $000 $000 $000 $000 Actuarial (losses) - - - - -Adjustment for limit on net asset - - - - -Total loss not reco2nised in the income statement - - - - -
41
RESIDUAL BUSINESS MANAGEMENT CORPORATION GROUP
NOTES TO THE FINANCIAL STATEMENTS for Year Ended 30 June 2012
Note 27 - Superannuation information (continued)
(d) Superannuation asset classes
The percentage invested in each asset class at the balance sheet date
Consolidated (Being the Parent Entity) 30 June 2012 30 June 2011 Australian equities 280 334 Overseas equities 237 295 Australian fixed interest securities 49 57 Overseas fixed interest securities 24 31 Property 86 99 Cash 195 51 Other 129 133
All Fund assets are invested by SAS Trustee Corporation (STC) at arms length through independent fund managers
Other superannuation provision information related to AASB 119 is disclosed at Note 28
AASB 119 requires organisations to provide detailed narrative information regarding the key economic and demographic assumptions underlying the reported defined benefits superannuation account balances The assumptions and calculations are generic to all NSW Government agencies and they are set out in Note 28
Note 28 - AASB 119 Superannuation information valuation method and principal actuarial assumptions
The followings are the superannuation asset and liability assumptions and calculations generic to all NSW Government agencies
The expected rate of return on assets assumption is determined by weighting the expected long-term return for each asset class by the target allocation of assets to each class The returns used for each class are net of investment tax and investment fees
Actual return on Scheme assets are as follows
For the year ended 30 June 2012 Consolidated (Being the Parent Entity) SASS SANCS SSS Total
$000 $000 $000 $000 Actual loss I (return) on fund assets (1) - 9 8
(a) Valuation Method
The Projected Unit Credit (PUC) valuation method was used to determine the present value of the defined benefit obligations and the related current service costs This method sees each period of service as giving rise to an additional unit of benefit entitlement and measures each unit separately to build up the final obligation
42
RESIDUAL BUSINESS MANAGEMENT CORPORATION GROUP
NOTES TO THE FINANCIAL STATEMENTS for Year Ended 30 June 2012
Note 28 - AASB 119 Superannuation information valuation method and principal actuarial assumptions (continued)
(b) Economic assumptions
Consolidated (Being the Parent Entity) 30 June 2012 30 June 2011
Salary increase rate (excluding promotional increases) 25 pa 35 pa
Rate ofCPI increase 25 pa 25pa
Expected rate of return on assets backing pension liabilities 860 pa 860pa
Expected rate ofretum on assets backing other liabilities 860 pa 860pa
Discount rate 306 pa 528pa
(c) Demographic assumptions
The demographic assumptions underlying the calculated actuarial balances of the RBMC Superannuation Schemes are generic to all NSW Government agencies and further details can be obtained from the NSW Treasury website
(d) Historical information
For the year ended 3 0 June 2012 Consolidated (Being the Parent Entity) SASS SANCS SSS Total
$000 $000 $000 $000 Present value ofdefined benefit obligation (437) - (32024) (32461) Fair value of fund assets 193 282 20411 20886 Surplus(Deficit) in fund (244) 282 (11613) (11575) Experience adjustments - liabilities (157) 3 (8995) (9149) Experience adjustments - assets (22) (23) (1841) (1886)
For the year ended 30 June 2011 Consolidated (Being the Parent Entity) SASS SANCS SSS Total
$000 $000 $000 $000 Present value of defined benefit obligation (339) - (23303) (23642) Fair value of fund assets 269 279 21893 22441 Surplus(Deficit) in fund (70) 279 (1410) (1201) Experience adjustments - liabilities 12 (6) 135 141 Experience adjustments - assets - (1) (18) (19)
For the year ended 30 June 2010 Consolidated (Being the Parent Entity) SASS SAN CS SSS Total
$000 $000 $000 $000 Present value of defined benefit obligation (344) - (23342) (23686) Fair value of fund assets 258 263 21217 21738 Surplus in fund (86) 263 (2125) (1948) Experience adjustments - liabilities (8) (3) (1079) (1090) Experience adjustments - assets 2 1 133 136
43
RESIDUAL BUSINESS MANAGEMENT CORPORATION GROUP
NOTES TO THE FINANCIAL STATEMENTS for Year Ended 30 June 2012
Note 28 - AASB 119 Superannuation information valuation method and principal actuarial assumptions (continued)
(d) Historical information (continued)
For the year ended 30 June 2009 Consolidated (Being the Parent Entity) SASS SAN CS SSS Total
$000 $000 $000 $000 Present value of defined benefit obligation (336) - (21959) (22295) Fair value of fund assets 254 244 20292 20790 Surplus in fund (83) 244 (1666) (1505) Experience adjustments - liabilities (65) 15 (3875) (3925) Experience adjustments - assets (55) (48) (4259) (4362)
For the year ended 30 June 2008 Consolidated (Being the Parent Entity) SASS SAN CS SSS Total
$000 $000 $000 $000 Present value of defined benefit obligation (283) - (18313) (18596) Fair value of fund assets 313 256 24045 24614 Surplus in fund 30 256 5732 6018 Experience adjustments - liabilities 3 111 2119 2233 Experience adjustments - assets 16 (76) (5316) (5376)
(e) Expected contributions
For the year ended 30 June 2012 SASS SAN CS SSS Total $000 $000 $000 $000
Expected employer contributions to be paid in the next reporting period - - - -
(f) Funding arrangements for employer contributions
i Surplus I deficit
The following is a summary of the 30 June 2012 financial position of the Schemes calculated in accordance with AAS 25 Financial Reporting by Superannuation Plans
For the year ended 30 June 2012
Consolidated (Being the Parent Entity) SASS SANCS SSS Total 2012
Total 2011
$000 $000 $000 $000 $000 Accrued benefits (256) - (17086) (17342) (16841) Net market value of Fund assets 193 283 20410 20886 22441 Total net surplus( deficiency) (63) 283 3324 3544 5600
44
RESIDUAL BUSINESS MANAGEMENT CORPORATION GROUP
NOTES TO THE FINANCIAL STATEMENTS for Year Ended 30 June 2012
Note 28 - AASB 119 Superannuation information valuation method and principal actuarial assumptions (continued)
(f) Funding arrangements for employer contributions (continued)
ii Contribution recommendations
The recommended contribution rates are as follows For the year ended 30 June 2012
Consolidated (Being the Parent Entity)
SASS SANCS SSS
Multiple of member contributions member salary Multiple ofmember contributions 000 000 000
iii Funding method
Contribution rates are set after discussions between the employer STC and NSW Treasury
iv Economic assumptions
The economic assumptions adopted for the current actuarial review of the Fund are
Weighted-average assumptions 2012 2011
Expected rate ofretum on Fund assets backing current pension liabilities 83 pa 83pa
Expected rate of return on Fund assets backing other liabilities 73 pa 73pa
Expected salary increase rate 40 pa 40pa
Expected rate of CPI increase 25 pa 25pa
(g) Nature of asset I (liability)
If a surplus exists in the employers interest in the Fund the employer may be able to take advantage of it in the form of a reduction in the required contribution rate depending on the advice of the Funds actuary
Where a deficiency exists the employer is responsible for any difference between the employers share of Fund assets and the defined benefit obligation
Note 29 - Events occurring after reporting date
The services of Mr Andrew d Apice the former General Manager of the RBMC Group were finalised on 31 August 2012 Mr Dominic Schuster of NSW Treasury was then appointed as his replacement effective 1 September 2012
There were no other matters or circumstances that have arisen since the end of the financial year which significantly affected or may significantly affect the operations of the Group the results of those operations or the state of affairs of the Group in future years
End of audited financial statements
45
RESIDUAL BUSINESS MANAGEMENT CORPORATION
FINANCIAL STATEMENTS FOR THE YEAR ENDED 30 JUNE 2012
STATEMENT BY CHIEF EXECUTIVE OFFICER
RESIDUAL BUSINESS MANAGERMENT CORPORATION
Pursuant to Section 41C of the Public Finance and Audit Act 1983 I state that in my opinion
The accompanying financial statements and notes thereto exhibit a true and fair view of the financial
position of the Residual Business Management Corporation (RBMC) as at 30 June 2012 and the
financial performance for the year then ended
The financial statements have been prepared in accordance with the provisions of applicable
Australian Accounting Standards (which include Australian Accounting Interpretations) the
requirements of the Public Finance and Audit Act 1983 applicable clauses of the Public Finance and
Audit Regulation 2010 the requirements of the Financial Reporting Directions published in the
Financial Reporting Code for NSW General Government Sector Entities and the Treasurers
Directions
Further I am not aware of any circumstances which would render any particulars included in the
financial statements to be misleading or inaccurate
On behalf of the Corporation
Dominic Schuster
General Manager
Residual Business Management Corporation
Dated 6 May 2014 at Sydney
INDEPENDENT AUDITORS REPORT
Residual Business Management Corporation
To Members of the New South Wales Parliament
I have audited the accompanying financial statements of Residual Business Management Corporation (the Corporation) which comprise the statements of financial position as at 30 June 2012 the statements of comprehensive income the statements of changes in equity and the statements of cash flows for the year then ended notes comprising a summary of significant accounting policies and other explanatory information of the Corporation and the consolidated entity The consolidated entity comprises the Corporation and the entities it controlled at the year end or from time to time during the financial year
Opinion
In my opinion the financial statements
give a true and fair view of the financial position of the Corporation and the consolidated entity as at 30 June 2012 and of their financial performance and cash flows for the year then ended in accordance with Australian Accounting Standards
bull are in accordance with section 41B of Public Finance and Audit Act 1983 (the PFampA Act) and the Public Finance and Audit Regulation 2010
My opinion should be read in conjunction with the rest of this report
The General Managers Responsibility for the Financial Statements
The General Manager is responsible for the preparation of the financial statements that give a true and fair view in accordance with Australian Accounting Standards and the PFampA Act and for such internal control as the General Manager determines is necessary to enable the preparation of the financial statements that are free from material misstatement whether due to fraud or error
Auditors Responsibility
My responsibility is to express an opinion on the financial statements based on my audit I conducted my audit in accordance with Australian Auditing Standards Those standards require that I comply with relevant ethical requirements relating to audit engagements and plan and perform the audit to obtain reasonable assurance about whether the financial statements are free from material misstatement
An audit involves performing procedures to obtain audit evidence about the amounts and disclosures in the financial statements The procedures selected depend on the auditors judgement including the assessment of the risks of material misstatement of the financial statements whether due to fraud or error In making those risk assessments the auditor considers internal controls relevant to the entitys preparation of the financial statements that give a true and fair view in order to design audit procedures that are appropriate in the circumstances but not for the purpose of expressing an opinion on the effectiveness of the entitys internal control An audit also includes evaluating the appropriateness of accounting policies used and the reasonableness of accounting estimates made by the General Manager as well as evaluating the overall presentation of the financial statements
I believe the audit evidence I have obtained is sufficient and appropriate to provide a basis for my audit opinion
My opinion does not provide assurance
bull about the future viability of the Corporation or consolidated entity
bull that they have carried out their activities effectively efficiently and economically
bull about the effectiveness of internal control
bull about the security and controls over the electronic publication of the audited financial statements on any website where they may be presented
bull about any other information that may have been hyperlinked tofrom the financial statements
Independence
In conducting my audit I have complied with the independence requirements of the Australian Auditing Standards and other relevant ethical pronouncements The PFampA Act further promotes independence by
bull providing that only Parliament and not the executive government can remove an Auditor-General
bull mandating the Auditor-General as auditor of public sector agencies but precluding the provision of non-audit services thus ensuring the Auditor-General and the Audit Office of New South Wales are not compromised in their role by the possibility of losing clients or income
1~k Kheir Director Financial Audit Services
19May2014 SYDNEY
- Structure Bookmarks
-
- Figure
- Figure
- Financial Instrument Class Table A Consolidated I Parent Note Category (a) Financial assets Cash and deposits 6 Cash T Corp Hour-Glass cash facility 7 Cash trust Receivables -non-current 10 Trade receivables (at amortised cost) Receivables -current 8 Other receivables (at amortised cost) Total financial assets (b) Financial liabilities Payables 14 Trade and accruals measured at amortised cost Total financial liabilities Net financial assets Total 2012 2011 $000 $000 1041 1500 10240 12075 -7 26 49 1130
- For the year ended 30 June 2012 Consolidated (Being the Parent Entity) SASS SANCS SSS $000 $000 $000 Present value ofpartly funded defined benefit obligation at beginning ofthe year (339) -(23303) Current service cost ---Interest cost (17) -(I199) Contributions by fund participants ---Actuarial gains (losses) (157) 3 (8995) Benefits paid 76 (3) 1473 Past service cost ---Curtailments ---Settlements ---Business Combinations ---Exchange rate changes ---Present value of partly funded defined benefit obl
- For the year ended 30 June 2012 2012 Consolidated (Being the Parent Entity) SASS SANCS SSS Total Components recognised in profit or loss by component $000 $000 $000 $000 Current service cost ----Interest cost (17) -(1199) (1216) Expected return on fund assets (net ofexpenses) 22 24 1832 1878 Past service cost ----Movement in adjustment for limitation on net asset ----Curtailment or settlement gain(loss) ----Total included in Other income in the statement of 5 24 633 662 comprehensive income (refe
- Figure
- Figure
- 1~kKheir
-
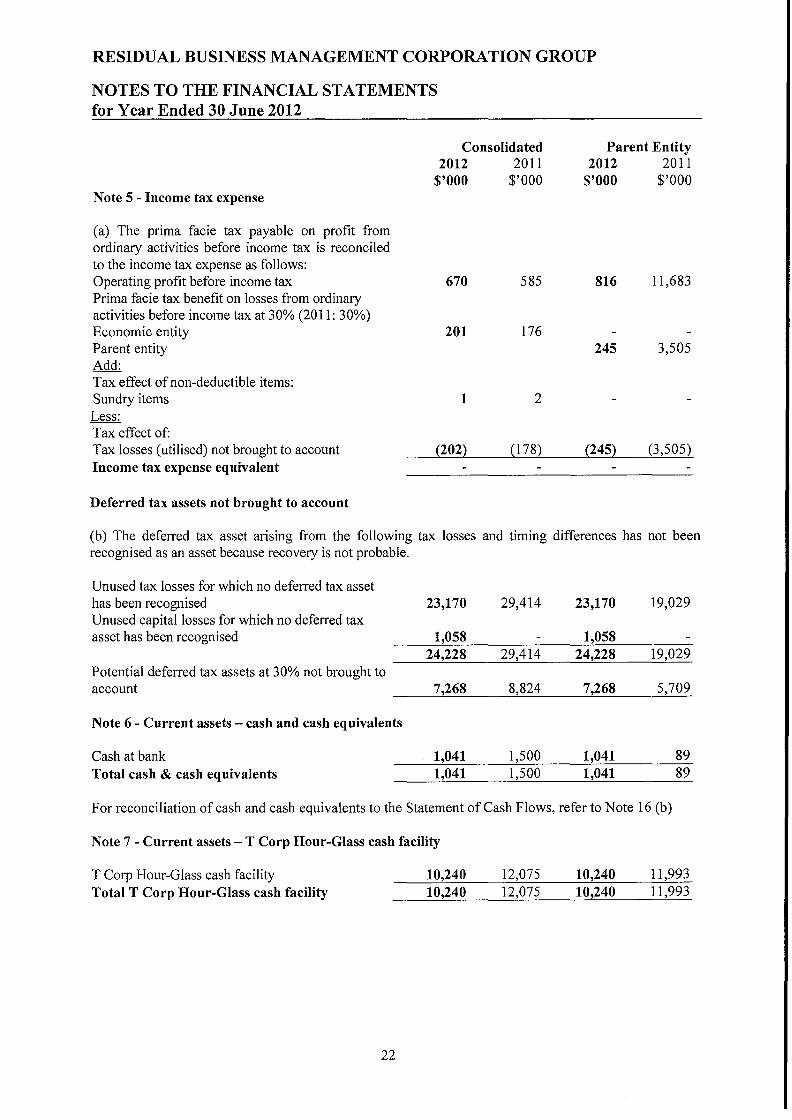
RESIDUAL BUSINESS MANAGEMENT CORPORATION GROUP
NOTES TO THE FINANCIAL STATEMENTS for Year Ended 30 June 2012
Consolidated Parent Entity 2012 2011 2012 2011
$000 $000 $000 $000 Note 8 - Current assets- trade and other receivables Trade debtors I I Other debtors 10 6 10 I Interest receivable 16 42 16 I Other 265 Total trade and other receivables 26 49 26 268
Note 9 - Current assets - inventories
Finished goods - at lower of cost or realisable value 12 Total current assets - inventories 12
Note 10 - Non-current - trade and other receivables Deposits 7 Total trade and other receivables 7
Note 11- Non-current - financial assets
Shares in controlled entities (cost) - refer 11 (i) 56954 Less impairment adjustment (56194) Carrying value controlled entities 760 Shares in unlisted companies 10 Less impairment (10) Total financial assets 760
Controlled entities Residual Business Management Corporation acquired 100 (2011 59) of the shares in Pacific Solar Pty Limited on 24 February 2012 On 9 May 2012 Pacific Solar Pty Ltd was wound up and deregistered as a solvent entity
(i) The Group included the following controlled entity Country of Percentage of equity interest Investment
Entity name Incorporation held by the consolidated entity 2012 2011 2012 2011
$000 $000 Pacific Solar Pty Limited Australia Nil 59 760
Rounded to whole percent
23
RESIDUAL BUSINESS MANAGEMENT CORPORATION GROUP
NOTES TO THE FINANCIAL STATEMENTS for Year Ended 30 June 2012
Note 12 - Other non-current assets
Contract receivable Cost of goodwill re-acquired Less impairment
Consolidated 2012 2011
$000 $000
3324 8172 235
(3324) (8407)
Parent Entity 2012 2011
$000 $000
3324
(3324) Total other non-current assets
Movement in the allowance for impairment
Accumulated impairment carried forward (8407) (8407) Acc impairment written-back I (booked) 5083 (3324) Impairment balance 30 June
Note 13 - Non-current asserts - property plant and equipment
Total depreciated value property amp equip
(3324) (8407) (3324)
Consolidated Parent Entity 2012 2011 2010 2012 2011 2010
$000 $000 $000 $000 $000 $000
623 632 638 623 623 623
623 623 623 623 623 623 34 34
(25) (19) 623 632 638 623 623 623
a) Reconciliation of written down value of asset classes
Non-current Land at fair value Plant and equipment - at cost Accumulated depreciation Total depreciated value property amp equip
The prior period balance sheet has been adjusted for land parcels that were determined in 2012 to be owned and controlled by RBMC well prior to 30 June 2011 The land parcels are stated at the NSW Lands Departments commissioned valuations Refer note 2(b) for more information
24
RESIDUAL BUSINESS MANAGEMENT CORPORATION GROUP
NOTES TO THE FINANCIAL STATEMENTS for Year Ended 30 June 2012
Consolidated 2012 2011
$000 $000
Parent Entity 2012 2011
$000 $000
Note 14- Payables
Current Trade creditors Other creditors and accruals Total current payables
25 18 43
10 4
14
25 18 43
Terms and conditions relating to the above payables
(i) Trade creditors are non-interest bearing and are settled on 30 day terms (ii) Other creditors and accruals are non-interest bearing and normally settled on 30 day terms
Note 15 - Provisions
Non-current Superannuation net liability 27(b) 11575 1201 11575 1201
~~~~~~~~~~~~~~~~~
Total non-current provisions 11575 1201 11575 1201
Total provisions 11575 1201 11575 1201
Note 16 - Cash flow information
(a) Reconciliation of profit(loss) for the year after tax to net cash flows from operating activities
Profit I (loss) after income tax 670 585 816 11683 Non-cash items (Gain) I loss on investments 8 18 8 56 Depreciation of non - current assets 9 7 Superannuation (gain) on defined benefit schemes (662) (625) (662) (625) Investment activity transactions Dividends from investments (670) (10993) Changes in assets and liabilities (Decrease) I increase in trade and other debtors (3) 2 (7) (Decrease) I increase in other creditors 14 3 18 (26) (Decrease) I increase in provisions (35) Decrease I (increase) in other assets 33 (6) (16) 1 (Increase) I decrease in financial assets 10 760 206 (Increase) I decrease in inventory 12 162 Increase I (decrease) in creditors and borrowings 15 25 (8) Net cash flows from operating activities 96 121 272 294
(b) Reconciliation of cash and cash equivalents
Cash and cash equivalents 1041 1500 1041 89 Balance as per Statement of Cash Flows 1041 1500 1041 89
25
RESIDUAL BUSINESS MANAGEMENT CORPORATION GROUP
NOTES TO THE FINANCIAL STATEMENTS for Year Ended 30 June 2012
Note 16 - Cash flow information (continued)
(c) Acquisitions and disposal of entities
On 24 February 2012 RBMC became the wholly owned parent of Pacific Solar Pty Limited On the 9 May 2012 the Group effectively disposed of Pacific Solar Pty Limited due to it being wound-up and deregistered as a solvent entity on that date RBMC acquired the remaining assets of Pacific Solar they being intellectual property There were no other acquisitions of entities during the year ended 30 June 2012
(d) Financing Arrangements
Neither Residual Business Management Corporation nor any of its controlled entities have any external financing arrangements in place at year end or during the financial year
Note 17 - Commitments for expenditure
(i) Expenditure commitments
No entity in the Group had any expenditure commitments at year end or the prior year end
(ii) Lease expenditure commitments
The Group has a monthly rental agreement with Kennards Self Storage at a cost including GST of $37200 At 30 June 2012 the total rent lease commitments for warehousing facilities is $223200 (2011 $2335968)
Note 18 - Contingent liabilities
There are a number of legal actions that have been taken against RBMC and they have been defended The actions appear to have ceased without recent cost or exposure to RBMC However it is prudent to advise that future legal costs and if applicable settlement will be less than $50000 in the unlikely event that the actions are re-instigated and lost
Note 19 - Related party disclosures
Directors
The names of persons that were Directors or the equivalent of Directors or officers of Residual Business Management Corporation or its controlled entities at any time during the financial year were as follows
Residual Business Management Corporation
Dominic Schuster - General Manger - Appointed 1 September 2012 Andrew dApice - Former General Manger- Ceased 31 August 2012 Mark Guest- Secretary amp Comptroller (equivalent to a Company Secretary amp Finance officer)
Pacific Solar Pty Limited (Deregistered on 9 May 2012)
Andrew dApice- Former Executive Director (Chair)-Appointed 20 January 2012 and Ceased 9 May 2012 Mark Guest-Former Executive Officer amp Company Secretary-Ceased 9 May 2012
26
RESIDUAL BUSINESS MANAGEMENT CORPORATION GROUP
NOTES TO THE FINANCIAL STATEMENTS for Year Ended 30 June 2012
Note 19 - Related party disclosures (continued)
Pacific Solar Pty Limited (Deregistered on 9 May 2012) (continued)
Alan Cox - Former Non-Executive Director (Chair)- Resigned 20 January 2012 Edward Slack- Former Non-Executive Director- Resigned 20 January 2012 James Henderson - Former Non-Executive Director- Resigned 24 February 2012 Alfredo Palestini- Former Non-Executive Director-Resigned 24 February 2012
Ultimate parent entity
The ultimate parent entity of the RBMC Group is the New South Wales Government Residual Business Management Corporation (RBMC) is the parent entity within the RBMC Group and it owned 59 percent of Pacific Solar Pty Limited for the period from 1 July 2011 to 23 February 2012 RBMC then owned 100 percent of the former subsidiary Pacific Solar Pty Limited from 24 February 2012 until its deregistration on 9 May 2012
Transactions with related parties
All related party transactions were unsecured and based on normal terms and conditions By resolution on 6 March 2012 RBMC approved the wind-up of Pacific Solar Pty Limited and agreed to assume its known legal obligations and the expenses of the subsidiary during the wind-up process At the signing date of this report the Group believes that the deregistered Pacific Solar Pty Limited has no remaining financial obligations
There were no other cross guarantees between any entities in the RBMC Group
During the prior year the parent entity part funded the cost of Pacific Solars chairman details of which are set out below in this note
Pacific Solar Pty Limited
During the year RBMC provided funding to its former subsidiary Pacific Solar Pty Limited of Nil (2011 $29 10857) for part of the cost of its Director representative appointed to the Pacific Solar Board
During the year Pacific Solar provided funding to its parent of $9834 (2011 Nil) for part of the cost of the sole Director of the RBMC Group between February and March 2012
NewSouth Innovations Pty Limited a former minority shareholder of Pacific Solar provided Pacific Solar with information services in the 2012 year in the amount of Nil (2011 $5000) This was a normal commercial arrangement
During the year Pacific Solar completed a shareholder and ASIC approved share buy-back of all minority shareholdings RBMCs share of the buy-back payment was Nil (2011 $26548608)
This year Pacific Solar declared and paid dividends of $67039653 to RBMC (2011 Nil) being the sum of the all remaining cash and reserves of the former subsidiary company
RBMC received (paid) the following amounts from (to) or on behalf of its former subsidiary Pacific Solar
Creditor payments made $Nil (2011 $1666132) Cash returned to Pacific Solar $Nil (2011 $1037368)
At 30 June 2012 RBMC had an intercompany receivable of Nil (2011$26548608) with its former subsidiary Pacific Solar The 2011 receivable was paid by Pacific Solar to RBMC this financial year
27
RESIDUAL BUSINESS MANAGEMENT CORPORATION GROUP
NOTES TO THE FINANCIAL STATEMENTS for Year Ended 30 June 2012
Note 19 - Related party disclosures (continued)
Other Entities
During the year the RBMC Group paid remuneration to a registered Chartered Accountancy company directed and ultimately owned by Mark Guest of $18498761 (2011 $1943 53 50) This fee represents market rate remuneration for the services of Mark Guest three part-time tertiary qualified staff and the supply of the Groups registered office The parents share of this total Group remuneration was $10052472 (2011 $7205784) As part of the Pacific Solar wind-up RBMC agreed by resolution that it would assume responsibility for the contract entitlements of Mark Guests Firm The Pacific Solar contract entitlements expired on 6 September 2012 Mr Guests Firm continued to work on specific Pacific Solar related matters until mid-August 2012 and incidental matters until the date of the signing of this report
Note 20- Key management personnel compensation
Consolidated 2012 2011 $(not $(not
rounded) rounded)
Short-term benefits - RBMC 182222 139027 Short-tenn benefits - Pacific Solar Pty Limited 119843 151141 Termination benefits Total key management personnel compensation 302065 290168
Parent entity 2012 2011 $(not $(not
rounded) rounded)
Short-term benefits 182222 139027 Other long term benefits Post-employment benefits Termination benefits
182222 139027
In addition a benefit less than $150 (2011 $250) in credit card reward points was derived via the use of personal credit cards to make corporate payments on a normal executive use basis
28
RESIDUAL BUSINESS MANAGEMENT CORPORATION GROUP
NOTES TO THE FINANCIAL STATEMENTS for Year Ended 30 June 2012
Note 21 - Remuneration of Directors
Income paid or payable or otherwise made available to Directors by members of the Group and related parties in connection with the management of the Group
The number of Directors whose income from members of the Group and related parties was within the following bands
$0 - $9999 $10000 - $19999 $40000 - $49999 $50000 - $59999 $60000 - $69999 $80000 - $89999
Consolidated Parent Entity 2012 2011 2012 2011
$(not $(not $(not $(not rounded) rounded) rounded) rounded)
122636 134682 81698 66970
Number Number Number Number
3 3
2 2 1
In addition at the consolidated level benefits less than $250 (2011 $100) in credit card reward points was derived via the use of a personal credit card to make corporate payments on a normal executive use basis
No share options were or are held directly or indirectly by the Directors during the period or at balance date or during the prior year
Note 22 - Auditors remuneration
Amounts paid to or due and payable to the Auditor General ofNSW for - audit of the financial report of the entity and all other entities in the Group - other services in relation to the entity and all other entities in the Group
Consolidated Parent Entity 2012 2011 2012 2011
$000 $000 $000 $000
88 66 65 44
29
RESIDUAL BUSINESS MANAGEMENT CORPORATION GROUP
NOTES TO THE FINANCIAL STATEMENTS for Year Ended 30 June 2012
Note 23 - Financial risk management objectives and policies
The Groups principal financial instruments comprise receivables payables cash and term deposits These financial instruments arise directly from the Groups operations or are required to finance the Groups activities The Group does not enter into or trade financial instruments including derivative financial instruments for speculative purposes
(a) Risk exposures and responses
The Groups main risks arising from financial instruments are outlined below together with the Groups objectives policies and processes for measuring and managing risk Further quantitative and qualitative disclosures are included throughout these financial statements
The Groups General Manager has overall responsibility for the establishment and oversight of risk management and he reviews and agrees policies for the management of risk Risk management policies are established to identify and analyse the risks faced by the Group and to set risk limits and controls to monitor the risks Compliance with policies is reviewed by the General Manager on a continuous basis
(b) Financial instrument risk defined
The main financial instrument risks that the Group could be exposed to through its financial instruments are as follows
Interest Rate Risk
The Group is exposed to fluctuations in interest rates to the extent ofthe level of its invested cash
Credit Risk
The exposure to credit risk excluding the value of any collateral or other security held is the carrying amount of any provisions for impairment of the Groups recognised financial assets as disclosed in the Statement of Financial Position and notes to these financial statements
Liquidity Risk
The Group manages liquidity risk by monitoring forecast cash flows and ensuring that adequate cash reserves are maintained to fund creditor obligations
Foreign Currency Risk
The Group may be exposed to fluctuations in foreign currencies with respect of future royalty income
Price Risk
The Group is not currently exposed to any material commodity price risk
Sections ( e) to (i) ofthis note considers in detail those risk areas relevant to the Group
30
RESIDUAL BUSINESS MANAGEMENT CORPORATION GROUP
NOTES TO THE FINANCIAL STATEMENTS for Year Ended 30 June 2012
Note 23 - Financial risk management objectives and policies (continued)
(c) Financial instrument categories
Financial Instrument Class Table A Consolidated I Parent Note Category
(a) Financial assets
Cash and deposits 6 Cash T Corp Hour-Glass cash facility 7 Cash trust Receivables - non-current 10 Trade receivables (at amortised cost) Receivables - current 8 Other receivables (at amortised cost)
Total financial assets
(b) Financial liabilities
Payables 14 Trade and accruals measured at amortised cost
Total financial liabilities
Net financial assets
Total 2012 2011
$000 $000
1041 1500 10240 12075
- 7 26 49
11307 13631
43 14
43 H
11264 13617
(d) Financial instruments recognition policy
All Group financial assets and liabilities have been recognised at the reporting date at their net fair values The following methods and assumptions are used to determine the net fair values of financial assets and liabilities
Cash cash equivalents and short-term investments - the carrymg amount approximates fair value because of their short time maturity
Cash trusts - the carrying amount approximates fair value because the underlying trust assets are liquid investments and the financial instrument is redeemable at call
Trade receivables and trade creditors - the carrying amount approximates fair value because of their short term maturity There were no trade receivables that were past due or impaired at the year end
Contract and royalty receivables - the carrying amounts reflect impairment and discount to present value adjustments that derive an approximate fair value
Non-current investmentssecurities - for financial instruments traded in organised financial markets fair value is the current quoted market bid price for an asset or offer price for a liability adjusted for transaction costs necessary to realise the asset or settle the liability For investments where there is no quoted market price a reasonable estimate of the fair value is determined by reference to the current market value of another instrument which is substantially the same or is calculated based on the expected cash flows or the underlying net asset base of the investmentsecurity The carrying amount reflects an impairment that derives the approximate fair value
Unrecognised financial instruments- There are no unrecognised financial instruments
31
RESIDUAL BUSINESS MANAGEMENT CORPORATION GROUP
NOTES TO THE FINANCIAL STATEMENTS for Year Ended 30 June 2012
Note 23 - Financial risk management objectives and policies (continued)
(d) Financial instruments recognition policy (continued)
The entity uses the following hierarchy for disclosing the fair value of financial instruments by valuation technique
bull Level 1 - Derived from quoted prices in active markets for identical assets I liabilities bull Level 2 -Derived from inputs other than quoted prices that are observable directly or indirectly bull Level 3 - Derived from valuation techniques that include inputs for the asset I liability not based
on observable market data (unobservable inputs) 2012
Level 1 Level 2 Level 3 Total $000 $000 $000 $000
Financial assets at fair value TCorp Hour-Glass Inv Facility 10240 10240
10240 10240
The table above includes only financial assets as no financial liabilities were measured at fair value in the statement of financial position
The aggregate net fair values and carrying amounts of financial instruments are disclosed in the statement of financial position and the supporting notes to these financial statements
(e) Interest rate risk
Interest rate risk is the risk that the value of the financial instrument or its revenue or costs will fluctuate due to changes in market interest rates The Groups exposure to interest rate risk and the effective interest rates of its financial assets and liabilities at the reporting date are set out on the following pages
In respect of income-earning financial assets and interest-bearing financial liabilities the table on the following page sets out the carrying amount by maturity date of the financial instruments exposed to interest rate risk at reporting date
32
RESIDUAL BUSINESS MANAGEMENT CORPORATION GROUP
NOTES TO THE FINANCIAL STATEMENTS for Year Ended 30 June 2012
Note 23 - Financial risk management objectives and policies (continued)
(e) Interest rate risk (continued)
Table B Consolidated Fixed interest rate maturing in
Financial Instruments Floating interest rate
2012 2011 $000 $000
1 year or less
2012 2011 $000 $000
Over 1 to 5 years
2012 2011 $000 $000
More than 5 years
2012 2011 $000 $000
Non-interest bearing
2012 2011 $000 $000
Total carrying amount as per the
Statement of Financial Position
2012 2011 $000 $000
(i) Financial assets Cash at bank 41 92 1000 1408 1041 1500 Cash trust 10240 12075 10240 12075 Trade and other receivables 26 49 26 49
Total financial assets 10281 12167 1000 1408 26 49 11307 13624
Weighted average interest rate 489 475 585 578
(ii) Financial liabilities Trade creditors accruals and other creditors 43 14 43
Total financial liabilities 43 14 43
Weighted average interest rate
Net financial assets (liabilities 10281 12167 1000 1408 17 35 11264 13610
33
14
14
RESIDUAL BUSINESS MANAGEMENT CORPORATION GROUP
NOTES TO THE FINANCIAL STATEMENTS for Year Ended 30 June 2012
Note 23 - Financial risk management objectives and policies (continued)
(e) Interest rate risk (continued)
Interest rate risk scenario and sensitivity analysis
The Group invests in secure bank term deposits and with the NSW Governments Treasury Corporation (T Corp) The Group holds large cash reserves to deal with its legacy business issues and to enable it to enforce its contractual rights in relation to the intellectual property it has developed Interest rate movements have a large impact on the results of the Group The risk profile set by the General Manager results in the Group receiving only a small margin above or below the official Australian interest rate set by the Australian Reserve Bank Board The duration of each cash investment essentially drives the interest rate the Group receives
TCorp Hour-Glass facilities
Exposure to interest rate risk primarily arises through the investment in the TCorp Hour Glass Investment Facilities which are held for strategic rather than trading purposes The Group holds units in the following Hour-Glass investment trusts
Consolidated Parent
Facility Investment Sectors Investment Horizon 2012
$000 2011
$000 2012
$000 2011
$000
Cash facility Cash and money market securities At call 10240 12075 10240 11993
The unit price of the facility is equal to the total fair value of the net assets held by the facility divided by the number of units on issue for that facility Unit prices are calculated and published daily NSW TCorp is trustee for the above facility and is required to act in the best interest of the unit holders and to administer the trust in accordance with the trust deeds As trustee TCorp has appointed external managers to manage the performance and risk of the facility in accordance with a mandate agreed by the parties Significant portions of administration are also outsourced to an external custodian Investment in the Hour-Glass facilities limits the Groups exposure to risk as it allows diversification across a pool of funds with different investment horizons and a mix of investments
The impact on profit I loss 2012 is as follows
Consolidated Parent Facility Change in
Unit Price Impact on Profit I
Loss 2012 $000
Impact on Profit I Loss 2011
$000
Impact on Profit I Loss 2012
$000
Impact on Profit I Loss 2011
$000 Cash facility +-1 102 121 102 120
NSW TCorp provides sensitivity analysis information for the cash facility using historical based volatility information collected over a ten year period quoted at two standard deviations (ie 95 probability)
The TCorp Hour-Glass investment facilities are designated at fair value through the Statement of Comprehensive Income and therefore any changes in unit price impacts directly on profit (rather than equity) A reasonably possible change is based on the percentage change in unit price multiplied by the redemption value as at 30 June each year for each facility
34
RESIDUAL BUSINESS MANAGEMENT CORPORATION GROUP
NOTES TO THE FINANCIAL STATEMENTS for Year Ended 30 June 2012
Note 23 - Financial risk management objectives and policies (continued)
(e) Interest rate risk (continued)
TCorp Hour-Glass facilities (continued)
The Groups term deposit cash investment sensitivity rates are similar As follows is the Groups judgement of reasonable possible movements in profits due to foreseeable changes in interest rates
(f) Credit risk
Credit Risk is the risk of financial loss arising to the Group from the default of another party with a contract or financial position with the Group The Group has material credit risk exposure to the CSG Solar AG Group in that at reporting date the Group has gross royalty rights receivable over time from CSG Solar AG Group of a least $332438395 (2011 $8 17197928) The table below states these gross receipts at their recoverable amount discounted to present value which is Nil (2011 $Nil) these written down values being the balances reflected in these financial statements These royalty rights are not past due but they are considered fully impaired Group policy is that all customers that wish to trade on credit terms are subject to a credit worthiness review
The Groups maximum exposure to credit risk and the applicable counter party is represented by the carrying amounts of its financial assets at reporting date as is set out in the following table (There was no past due balances at 30 June 2012)
Table C Financial
Instrument
Government Institutions
Australian Banks
CSG Solar AG Group
Other Commercial
entities Total
Consolidated 2012 $000
2011 $000
2012 $000
2011 $000
2012 $000
2011 $000
2012 $000
2011 $000
2012 $000
2011 $000
(a) Financial assets Cash and deposits - - 1041 1500 - - - - 1041 1500
Cash trust 10240 12075 - - - - - - 10240 12075 Trade receivables
amp other - - - - - - 26 49 26 49 Royalty rights
Impairment - - - -3324
(3324) 8172
(8172) --
--
3324 (3324)
8172 (8 172)
Net Rovalty - - - - - - - - - -Unlisted shares
Impairment --
--
--
--
--
10 (10)
--
--
--
10 (10)
Net unlisted shares - - - - - - - - - -Total 10240 12075 1041 1500 - - 26 49 11307 13624
35
RESIDUAL BUSINESS MANAGEMENT CORPORATION GROUP
NOTES TO THE FINANCIAL STATEMENTS for Year Ended 30 June 2012
Note 23 - Financial risk management objectives and policies (continued)
(g) Liquidity risk
Liquidity risk arises from the financial liabilities of the Group and the Groups subsequent ability to meet the obligations to repay the liabilities as and when they fall due As is disclosed above the Group maintains a high level of cash reserves to cover its material credit and warranty risks The Group has ongoing administrative costs require ongoing funding The following table provides the maturity dates of the Groups financial liabilities by bands
Table D
Maturity Bands
Financial liabilities
Trade creditors
Other creditors
Total financial liabilities
2012 2012 2011 2012 2011 more 2011 2012 2011 less less more more than 2 more More More
than than than 1 than 1 less than 2 than than one one less than less than than 5 less than 5 5 2012 2011 year year 2 years 2 years years 5 years years years Total Total $000 $000 $000 $000 $000 $000 $000 $000 $000 $000
25 12 - - - - - - 25 12
18 2 - - - - - - 18 2
43 14 - - - - - - 43 14
(h) Foreign currency risk
At the present time the Group has no material exposure to foreign currency risk The Groups above mentioned royalty rights are payable in Australian dollars
(i) Derivative financial instruments
During the financial year ending 30 June 2012 neither Residual Business Management Corporation nor any of its controlled entities had any known exposure to derivatives
36
RESIDUAL BUSINESS MANAGEMENT CORPORATION GROUP
NOTES TO THE FINANCIAL STATEMENTS for Year Ended 30 June 2012
Note 24-Retained earnings Note
Consolidated
2012 2011 $000 $000
Parent Entity
2012 2011 $000 $000
Balance at beginning of the financial year Owners of the parent comprehensive income (loss) Superannuation actuarial (losses) I gains Dividend paid or declared Balance at the end of the year
3(b) 27(c)
11909 816
(11036) 2000
(311
12059 728 122
(1000) 11909
11909 816
(11036) 2000
(311
1104 11683
122 (1000) 11909
Note 25 shy Non-controlling interests
As at 30 June 2011 the parent entity held an equity interest of 59 in Pacific Solar Pty Limited On 24 February 2012 a share buyback was approved by all minority shareholders for all of their Pacific Solar Pty Limited shares Thus on this date Pacific Solar became a fully owned subsidiary of RBMC Pacific Solar was then deregistered as a solvent entity on 9 May 2012 The buyback was based on a mid-point minority interest discount of 20 for the shares held by the following shareholders
Enipower SpA University ofNSW New South Innovations Pty Limited Thi An Dinh Morgan Michael Green Briana Keagan Green and Michelle Gaye Wenham
Reconciliation of non-controlling interest in RBMCs consolidated equity Non-controlling interest
2012 2011 $000 $000
Non-controlling interest in Pacific Solar share capital 36364 Non-controlling interests share ofretained (losses) at the end of the year (35836 Non-controlling interest in RBMCs consolidated equity 528
Note 26 - New Australian Accountings Standards issued but not effective
In the current year the Group has adopted all of the new and revised Standards and Interpretations issued by the AASB that are relevant to the operations and effective for the current reporting period Details of the impact of the adoption of these new accounting standards are set out in the individual accounting policies notes in the financial statements Certain new accounting standards and interpretations have been published that are not mandatory for the 30 June 2012 reporting period The Group did not early adopt any new accounting standards that are not yet effective The Group has assessed the impact of the new standards and interpretations on issue but not effective and considers the impact to be insignificant
37
RESIDUAL BUSINESS MANAGEMENT CORPORATION GROUP
NOTES TO THE FINANCIAL STATEMENTS for Year Ended 30 June 2012
Note 27 - Superannuation information
(a) Superannuation income recognition policy
In 2012 the Group recognises the net total of the following amounts in profit or loss
Current service cost is the increase in the present value of the defined benefit obligation resulting from employee service in the current period Interest cost is the increase in the present value of the defined benefit obligation which arises because the benefits are one period closer to settlement Expected return on plan assets is based on market expectations at the beginning of the period for returns over the life of the related obligation and on any reimbursement rights Past service cost (to the extent required to be recognised) is the increase in the defined benefit obligation from changes to post-employment benefits relating to employee service in prior periods and Curtailments or settlements are amendments to the terms of the plan andor number of employees covered by the plan
The Group recognises defined benefit actuarial superannuation gains and losses in other comprehensive income
(b) Superannuation obligations
All former employees were entitled to varying levels of benefits on retirement disability or death The superannuation plans (State Superannuation Scheme (SSS) State Authorities Superannuation Scheme (SASS) and State Authorities Non-Contributory Superannuation Scheme (SANCS) provide defined benefits based on years of service and final average salary Employees contributed to the plans and the contribution of the parent entity was and remains legally enforceable All Schemes are closed to new members
Note (b) continues on the following page
38
RESIDUAL BUSINESS MANAGEMENT CORPORATION GROUP
NOTES TO THE FINANCIAL STATEMENTS for Year Ended 30 June 2012
Note 27 - Superannuation information (continued)
(b) Superannuation obligations (continued)
The following is the superannuation position of the Group as at 30 June 2012 The superannuation assets and liabilities recognised in the statement of financial position are listed at the bottom of the table
Consolidated (Being The Parent Entity)
2012 2011 2012 2011 2012 2011 2012 2011 Member numbers
SASS SANCS SSS Total
Contributors - - - - - - - -Deferred benefits - - - - 3 3 3 3 Pensioners 2 2 - - 39 38 41 40 Pensions fully commuted - - - - 2 2 2 2 Totals 2 2 - - 44 43 46 45
Accrued liability
Superannuation position for AASB119 purposes
(437)
2012 $000
(339)
2011 $000
-
2012 $000
-
2011 $000
(32024)
2012 $000
(23303)
2011 $000
(32461)
2012 $000
(23642)
2011 $000
Estimate reserve account balance 193 269 282 279 20411 21893 20886 22441 Sub-total
Future Service Liability (Note 1) Surplus in excess of recovery available from Schemes Net asset I (liability) to be recognised in statement of financial position
(244)
-
-
(244)
(70)
-
-
(70)
282
-
-
282
279
-
-
279
(11613)
-
-
(11613)
(1410)
-
-
(1410)
(11575)
-
-
(11575)
(1201)
-
-
(1201)
Note 1 The Future Service Liability (FSL) does not have to be recognised by an employer It is only used to determine if an asset ceiling limit should be imposed (AASB 119 para 58) Under AASB 119 any prepaid superannuation asset recognised cannot exceed the total of any unrecognised past service cost and the present value of any economic benefits that may be available in the form of refunds from the plan or reductions in future contributions to the plan Where the surplus in excess of recovery is zero no asset ceiling limit is imposed
As is set out above at 30 June 2012 Residual Business Management Corporation had a gross calculated defined benefit superannuation liability with respect of former employees of $32461163 (2011 23641751 ) Superannuation funds invested to cover this liability amounted to $20886294 (2011 $22440728) The aforementioned superannuation liability and surplus position has been calculated by an independent and qualified actuary The calculated deficiency of invested funds versus the anticipated superannuation liabilities at 30 June 2012 was a balance of $11574869 (2011 $1201023) The parent entity with the support ofNSW Treasury believes that it has sufficient funds to cover this deficiency
39
RESIDUAL BUSINESS MANAGEMENT CORPORATION GROUP
NOTES TO THE FINANCIAL STATEMENTS for Year Ended 30 June 2012
Note 27 - Superannuation information (continued)
(b) Superannuation obligations (continued)
Th T f h t ee reconcr ration o t e present va ue of h defimed b enefirt o blrgatrons rs as flo11ows For the year ended 30 June 2012
Consolidated (Being the Parent Entity) SASS SANCS SSS $000 $000 $000
Present value ofpartly funded defined benefit obligation at beginning of the year (339) - (23303) Current service cost - - -Interest cost (17) - (I 199) Contributions by fund participants - - -Actuarial gains (losses) (157) 3 (8995) Benefits paid 76 (3) 1473 Past service cost - - -Curtailments - - -Settlements - - -Business Combinations - - -Exchange rate changes - - -Present value of partly funded defined benefit obliations at end of the year (437) - (32024)
Total Total 2012 2011
$000 $000
(23642) (23686) - -
(1216) (I 194) - -
(9149) 141 1546 1097
- -- -- -- -- -
(32461) (23642)
The reconciliation of the fair value offund assets is as follows
For the year ended 30 June 2012 Total Total Consolidated (Being the Parent Entity) SASS SAN CS SSS 2012 2011
$000 $000 $000 $000 $000 Fair value of fund assets at beginning of the year 269 279 21893 22441 21738 Expected (loss) I return on fund assets 22 24 1832 1878 1819 Actuarial (losses) I gains (22) (24) (1841) (1887) (19) Employer contributions - - - - -Contributions by fund participants - - - - -Benefits paid (76) 3 (1473) (1546) (l097) Settlements - - - - -Business combinations - - - - -Exchange rate changes - - - - -Fair value of fund assets at end of the year 193 282 20411 20886 22441
The reconciliation of the assets and liabilities recognised in the statement of financial position is follows
Total Consolidated (Being the Parent Entity)
TotalFor the year ended 30 June 2012 2012
$000 SAN CS SASS SSS
$000 Present value ofpartly funded defined benefit obligations at end of the year
$000 $000 $000
(32461) (23642) Fair value of fund assets at end of year
(437) (32024)-22441
Subtotal 20886282 20411193
(1201) Unrecognised past service cost
(11575)(244) (11613)282 - - - --
Unrecognised gain(loss) --- --Adjustment for limitation on net assets -- -- -Net asset I (liability) recognised in the statement of financial position at end of year (l201)(11575)(244) (11613)282
40
2011
RESIDUAL BUSINESS MANAGEMENT CORPORATION GROUP
NOTES TO THE FINANCIAL STATEMENTS for Year Ended 30 June 2012
Note 27 - Superannuation information (continued)
(b) Superannuation obligations (continued)
For the year ended 30 June 2012
2012 Consolidated (Being the Parent Entity) SASS SANCS SSS Total Components recognised in profit or loss by component $000 $000 $000 $000 Current service cost - - - -Interest cost (17) - (1199) (1216) Expected return on fund assets (net of expenses) 22 24 1832 1878 Past service cost - - - -Movement in adjustment for limitation on net asset - - - -Curtailment or settlement gain(loss) - - - -Total included in Other income in the statement of 5 24 633 662 comprehensive income (refer also note 2(b))
For the year ended 30 June 2012
2012 Consolidated (Being the Parent Entity) SASS SAN CS SSS Total Components recognised in other comprehensive income $000 $000 $000 $000 Actuarial (losses) I gains recognised in year (179) (21) (10836) (11036)
2011 Total $000
-(1194)
1819 ---
625
2011 Total $000
122
Cumulative amount recognised in other comprehensive income
The cumulative amount of actuarial gains and losses since 1 July 2005 recognised in other comprehensive income is an accumulated loss of $14221000 (2011 accumulated loss of $3185000) Before 1 July 2005 RBMC treated the defined benefit superannuation funds as separate entities and so recognised no superannuation balances in other comprehensive income
(c) Superannuation obligations - actuarial loses outside the statement of comprehensive income
Amounts not recognised in the statement of comprehensive income and expenses are as follows
For the year ended 30 June 2012
Consolidated (Being the Parent Entity) SASS SAN CS SSS 2012
Total 2011 Total
$000 $000 $000 $000 $000 Actuarial (losses) - - - - -Adjustment for limit on net asset - - - - -Total loss not reco2nised in the income statement - - - - -
41
RESIDUAL BUSINESS MANAGEMENT CORPORATION GROUP
NOTES TO THE FINANCIAL STATEMENTS for Year Ended 30 June 2012
Note 27 - Superannuation information (continued)
(d) Superannuation asset classes
The percentage invested in each asset class at the balance sheet date
Consolidated (Being the Parent Entity) 30 June 2012 30 June 2011 Australian equities 280 334 Overseas equities 237 295 Australian fixed interest securities 49 57 Overseas fixed interest securities 24 31 Property 86 99 Cash 195 51 Other 129 133
All Fund assets are invested by SAS Trustee Corporation (STC) at arms length through independent fund managers
Other superannuation provision information related to AASB 119 is disclosed at Note 28
AASB 119 requires organisations to provide detailed narrative information regarding the key economic and demographic assumptions underlying the reported defined benefits superannuation account balances The assumptions and calculations are generic to all NSW Government agencies and they are set out in Note 28
Note 28 - AASB 119 Superannuation information valuation method and principal actuarial assumptions
The followings are the superannuation asset and liability assumptions and calculations generic to all NSW Government agencies
The expected rate of return on assets assumption is determined by weighting the expected long-term return for each asset class by the target allocation of assets to each class The returns used for each class are net of investment tax and investment fees
Actual return on Scheme assets are as follows
For the year ended 30 June 2012 Consolidated (Being the Parent Entity) SASS SANCS SSS Total
$000 $000 $000 $000 Actual loss I (return) on fund assets (1) - 9 8
(a) Valuation Method
The Projected Unit Credit (PUC) valuation method was used to determine the present value of the defined benefit obligations and the related current service costs This method sees each period of service as giving rise to an additional unit of benefit entitlement and measures each unit separately to build up the final obligation
42
RESIDUAL BUSINESS MANAGEMENT CORPORATION GROUP
NOTES TO THE FINANCIAL STATEMENTS for Year Ended 30 June 2012
Note 28 - AASB 119 Superannuation information valuation method and principal actuarial assumptions (continued)
(b) Economic assumptions
Consolidated (Being the Parent Entity) 30 June 2012 30 June 2011
Salary increase rate (excluding promotional increases) 25 pa 35 pa
Rate ofCPI increase 25 pa 25pa
Expected rate of return on assets backing pension liabilities 860 pa 860pa
Expected rate ofretum on assets backing other liabilities 860 pa 860pa
Discount rate 306 pa 528pa
(c) Demographic assumptions
The demographic assumptions underlying the calculated actuarial balances of the RBMC Superannuation Schemes are generic to all NSW Government agencies and further details can be obtained from the NSW Treasury website
(d) Historical information
For the year ended 3 0 June 2012 Consolidated (Being the Parent Entity) SASS SANCS SSS Total
$000 $000 $000 $000 Present value ofdefined benefit obligation (437) - (32024) (32461) Fair value of fund assets 193 282 20411 20886 Surplus(Deficit) in fund (244) 282 (11613) (11575) Experience adjustments - liabilities (157) 3 (8995) (9149) Experience adjustments - assets (22) (23) (1841) (1886)
For the year ended 30 June 2011 Consolidated (Being the Parent Entity) SASS SANCS SSS Total
$000 $000 $000 $000 Present value of defined benefit obligation (339) - (23303) (23642) Fair value of fund assets 269 279 21893 22441 Surplus(Deficit) in fund (70) 279 (1410) (1201) Experience adjustments - liabilities 12 (6) 135 141 Experience adjustments - assets - (1) (18) (19)
For the year ended 30 June 2010 Consolidated (Being the Parent Entity) SASS SAN CS SSS Total
$000 $000 $000 $000 Present value of defined benefit obligation (344) - (23342) (23686) Fair value of fund assets 258 263 21217 21738 Surplus in fund (86) 263 (2125) (1948) Experience adjustments - liabilities (8) (3) (1079) (1090) Experience adjustments - assets 2 1 133 136
43
RESIDUAL BUSINESS MANAGEMENT CORPORATION GROUP
NOTES TO THE FINANCIAL STATEMENTS for Year Ended 30 June 2012
Note 28 - AASB 119 Superannuation information valuation method and principal actuarial assumptions (continued)
(d) Historical information (continued)
For the year ended 30 June 2009 Consolidated (Being the Parent Entity) SASS SAN CS SSS Total
$000 $000 $000 $000 Present value of defined benefit obligation (336) - (21959) (22295) Fair value of fund assets 254 244 20292 20790 Surplus in fund (83) 244 (1666) (1505) Experience adjustments - liabilities (65) 15 (3875) (3925) Experience adjustments - assets (55) (48) (4259) (4362)
For the year ended 30 June 2008 Consolidated (Being the Parent Entity) SASS SAN CS SSS Total
$000 $000 $000 $000 Present value of defined benefit obligation (283) - (18313) (18596) Fair value of fund assets 313 256 24045 24614 Surplus in fund 30 256 5732 6018 Experience adjustments - liabilities 3 111 2119 2233 Experience adjustments - assets 16 (76) (5316) (5376)
(e) Expected contributions
For the year ended 30 June 2012 SASS SAN CS SSS Total $000 $000 $000 $000
Expected employer contributions to be paid in the next reporting period - - - -
(f) Funding arrangements for employer contributions
i Surplus I deficit
The following is a summary of the 30 June 2012 financial position of the Schemes calculated in accordance with AAS 25 Financial Reporting by Superannuation Plans
For the year ended 30 June 2012
Consolidated (Being the Parent Entity) SASS SANCS SSS Total 2012
Total 2011
$000 $000 $000 $000 $000 Accrued benefits (256) - (17086) (17342) (16841) Net market value of Fund assets 193 283 20410 20886 22441 Total net surplus( deficiency) (63) 283 3324 3544 5600
44
RESIDUAL BUSINESS MANAGEMENT CORPORATION GROUP
NOTES TO THE FINANCIAL STATEMENTS for Year Ended 30 June 2012
Note 28 - AASB 119 Superannuation information valuation method and principal actuarial assumptions (continued)
(f) Funding arrangements for employer contributions (continued)
ii Contribution recommendations
The recommended contribution rates are as follows For the year ended 30 June 2012
Consolidated (Being the Parent Entity)
SASS SANCS SSS
Multiple of member contributions member salary Multiple ofmember contributions 000 000 000
iii Funding method
Contribution rates are set after discussions between the employer STC and NSW Treasury
iv Economic assumptions
The economic assumptions adopted for the current actuarial review of the Fund are
Weighted-average assumptions 2012 2011
Expected rate ofretum on Fund assets backing current pension liabilities 83 pa 83pa
Expected rate of return on Fund assets backing other liabilities 73 pa 73pa
Expected salary increase rate 40 pa 40pa
Expected rate of CPI increase 25 pa 25pa
(g) Nature of asset I (liability)
If a surplus exists in the employers interest in the Fund the employer may be able to take advantage of it in the form of a reduction in the required contribution rate depending on the advice of the Funds actuary
Where a deficiency exists the employer is responsible for any difference between the employers share of Fund assets and the defined benefit obligation
Note 29 - Events occurring after reporting date
The services of Mr Andrew d Apice the former General Manager of the RBMC Group were finalised on 31 August 2012 Mr Dominic Schuster of NSW Treasury was then appointed as his replacement effective 1 September 2012
There were no other matters or circumstances that have arisen since the end of the financial year which significantly affected or may significantly affect the operations of the Group the results of those operations or the state of affairs of the Group in future years
End of audited financial statements
45
RESIDUAL BUSINESS MANAGEMENT CORPORATION
FINANCIAL STATEMENTS FOR THE YEAR ENDED 30 JUNE 2012
STATEMENT BY CHIEF EXECUTIVE OFFICER
RESIDUAL BUSINESS MANAGERMENT CORPORATION
Pursuant to Section 41C of the Public Finance and Audit Act 1983 I state that in my opinion
The accompanying financial statements and notes thereto exhibit a true and fair view of the financial
position of the Residual Business Management Corporation (RBMC) as at 30 June 2012 and the
financial performance for the year then ended
The financial statements have been prepared in accordance with the provisions of applicable
Australian Accounting Standards (which include Australian Accounting Interpretations) the
requirements of the Public Finance and Audit Act 1983 applicable clauses of the Public Finance and
Audit Regulation 2010 the requirements of the Financial Reporting Directions published in the
Financial Reporting Code for NSW General Government Sector Entities and the Treasurers
Directions
Further I am not aware of any circumstances which would render any particulars included in the
financial statements to be misleading or inaccurate
On behalf of the Corporation
Dominic Schuster
General Manager
Residual Business Management Corporation
Dated 6 May 2014 at Sydney
INDEPENDENT AUDITORS REPORT
Residual Business Management Corporation
To Members of the New South Wales Parliament
I have audited the accompanying financial statements of Residual Business Management Corporation (the Corporation) which comprise the statements of financial position as at 30 June 2012 the statements of comprehensive income the statements of changes in equity and the statements of cash flows for the year then ended notes comprising a summary of significant accounting policies and other explanatory information of the Corporation and the consolidated entity The consolidated entity comprises the Corporation and the entities it controlled at the year end or from time to time during the financial year
Opinion
In my opinion the financial statements
give a true and fair view of the financial position of the Corporation and the consolidated entity as at 30 June 2012 and of their financial performance and cash flows for the year then ended in accordance with Australian Accounting Standards
bull are in accordance with section 41B of Public Finance and Audit Act 1983 (the PFampA Act) and the Public Finance and Audit Regulation 2010
My opinion should be read in conjunction with the rest of this report
The General Managers Responsibility for the Financial Statements
The General Manager is responsible for the preparation of the financial statements that give a true and fair view in accordance with Australian Accounting Standards and the PFampA Act and for such internal control as the General Manager determines is necessary to enable the preparation of the financial statements that are free from material misstatement whether due to fraud or error
Auditors Responsibility
My responsibility is to express an opinion on the financial statements based on my audit I conducted my audit in accordance with Australian Auditing Standards Those standards require that I comply with relevant ethical requirements relating to audit engagements and plan and perform the audit to obtain reasonable assurance about whether the financial statements are free from material misstatement
An audit involves performing procedures to obtain audit evidence about the amounts and disclosures in the financial statements The procedures selected depend on the auditors judgement including the assessment of the risks of material misstatement of the financial statements whether due to fraud or error In making those risk assessments the auditor considers internal controls relevant to the entitys preparation of the financial statements that give a true and fair view in order to design audit procedures that are appropriate in the circumstances but not for the purpose of expressing an opinion on the effectiveness of the entitys internal control An audit also includes evaluating the appropriateness of accounting policies used and the reasonableness of accounting estimates made by the General Manager as well as evaluating the overall presentation of the financial statements
I believe the audit evidence I have obtained is sufficient and appropriate to provide a basis for my audit opinion
My opinion does not provide assurance
bull about the future viability of the Corporation or consolidated entity
bull that they have carried out their activities effectively efficiently and economically
bull about the effectiveness of internal control
bull about the security and controls over the electronic publication of the audited financial statements on any website where they may be presented
bull about any other information that may have been hyperlinked tofrom the financial statements
Independence
In conducting my audit I have complied with the independence requirements of the Australian Auditing Standards and other relevant ethical pronouncements The PFampA Act further promotes independence by
bull providing that only Parliament and not the executive government can remove an Auditor-General
bull mandating the Auditor-General as auditor of public sector agencies but precluding the provision of non-audit services thus ensuring the Auditor-General and the Audit Office of New South Wales are not compromised in their role by the possibility of losing clients or income
1~k Kheir Director Financial Audit Services
19May2014 SYDNEY
- Structure Bookmarks
-
- Figure
- Figure
- Financial Instrument Class Table A Consolidated I Parent Note Category (a) Financial assets Cash and deposits 6 Cash T Corp Hour-Glass cash facility 7 Cash trust Receivables -non-current 10 Trade receivables (at amortised cost) Receivables -current 8 Other receivables (at amortised cost) Total financial assets (b) Financial liabilities Payables 14 Trade and accruals measured at amortised cost Total financial liabilities Net financial assets Total 2012 2011 $000 $000 1041 1500 10240 12075 -7 26 49 1130
- For the year ended 30 June 2012 Consolidated (Being the Parent Entity) SASS SANCS SSS $000 $000 $000 Present value ofpartly funded defined benefit obligation at beginning ofthe year (339) -(23303) Current service cost ---Interest cost (17) -(I199) Contributions by fund participants ---Actuarial gains (losses) (157) 3 (8995) Benefits paid 76 (3) 1473 Past service cost ---Curtailments ---Settlements ---Business Combinations ---Exchange rate changes ---Present value of partly funded defined benefit obl
- For the year ended 30 June 2012 2012 Consolidated (Being the Parent Entity) SASS SANCS SSS Total Components recognised in profit or loss by component $000 $000 $000 $000 Current service cost ----Interest cost (17) -(1199) (1216) Expected return on fund assets (net ofexpenses) 22 24 1832 1878 Past service cost ----Movement in adjustment for limitation on net asset ----Curtailment or settlement gain(loss) ----Total included in Other income in the statement of 5 24 633 662 comprehensive income (refe
- Figure
- Figure
- 1~kKheir
-

RESIDUAL BUSINESS MANAGEMENT CORPORATION GROUP
NOTES TO THE FINANCIAL STATEMENTS for Year Ended 30 June 2012
Note 19 - Related party disclosures (continued)
Other Entities
During the year the RBMC Group paid remuneration to a registered Chartered Accountancy company directed and ultimately owned by Mark Guest of $18498761 (2011 $1943 53 50) This fee represents market rate remuneration for the services of Mark Guest three part-time tertiary qualified staff and the supply of the Groups registered office The parents share of this total Group remuneration was $10052472 (2011 $7205784) As part of the Pacific Solar wind-up RBMC agreed by resolution that it would assume responsibility for the contract entitlements of Mark Guests Firm The Pacific Solar contract entitlements expired on 6 September 2012 Mr Guests Firm continued to work on specific Pacific Solar related matters until mid-August 2012 and incidental matters until the date of the signing of this report
Note 20- Key management personnel compensation
Consolidated 2012 2011 $(not $(not
rounded) rounded)
Short-term benefits - RBMC 182222 139027 Short-tenn benefits - Pacific Solar Pty Limited 119843 151141 Termination benefits Total key management personnel compensation 302065 290168
Parent entity 2012 2011 $(not $(not
rounded) rounded)
Short-term benefits 182222 139027 Other long term benefits Post-employment benefits Termination benefits
182222 139027
In addition a benefit less than $150 (2011 $250) in credit card reward points was derived via the use of personal credit cards to make corporate payments on a normal executive use basis
28
RESIDUAL BUSINESS MANAGEMENT CORPORATION GROUP
NOTES TO THE FINANCIAL STATEMENTS for Year Ended 30 June 2012
Note 21 - Remuneration of Directors
Income paid or payable or otherwise made available to Directors by members of the Group and related parties in connection with the management of the Group
The number of Directors whose income from members of the Group and related parties was within the following bands
$0 - $9999 $10000 - $19999 $40000 - $49999 $50000 - $59999 $60000 - $69999 $80000 - $89999
Consolidated Parent Entity 2012 2011 2012 2011
$(not $(not $(not $(not rounded) rounded) rounded) rounded)
122636 134682 81698 66970
Number Number Number Number
3 3
2 2 1
In addition at the consolidated level benefits less than $250 (2011 $100) in credit card reward points was derived via the use of a personal credit card to make corporate payments on a normal executive use basis
No share options were or are held directly or indirectly by the Directors during the period or at balance date or during the prior year
Note 22 - Auditors remuneration
Amounts paid to or due and payable to the Auditor General ofNSW for - audit of the financial report of the entity and all other entities in the Group - other services in relation to the entity and all other entities in the Group
Consolidated Parent Entity 2012 2011 2012 2011
$000 $000 $000 $000
88 66 65 44
29
RESIDUAL BUSINESS MANAGEMENT CORPORATION GROUP
NOTES TO THE FINANCIAL STATEMENTS for Year Ended 30 June 2012
Note 23 - Financial risk management objectives and policies
The Groups principal financial instruments comprise receivables payables cash and term deposits These financial instruments arise directly from the Groups operations or are required to finance the Groups activities The Group does not enter into or trade financial instruments including derivative financial instruments for speculative purposes
(a) Risk exposures and responses
The Groups main risks arising from financial instruments are outlined below together with the Groups objectives policies and processes for measuring and managing risk Further quantitative and qualitative disclosures are included throughout these financial statements
The Groups General Manager has overall responsibility for the establishment and oversight of risk management and he reviews and agrees policies for the management of risk Risk management policies are established to identify and analyse the risks faced by the Group and to set risk limits and controls to monitor the risks Compliance with policies is reviewed by the General Manager on a continuous basis
(b) Financial instrument risk defined
The main financial instrument risks that the Group could be exposed to through its financial instruments are as follows
Interest Rate Risk
The Group is exposed to fluctuations in interest rates to the extent ofthe level of its invested cash
Credit Risk
The exposure to credit risk excluding the value of any collateral or other security held is the carrying amount of any provisions for impairment of the Groups recognised financial assets as disclosed in the Statement of Financial Position and notes to these financial statements
Liquidity Risk
The Group manages liquidity risk by monitoring forecast cash flows and ensuring that adequate cash reserves are maintained to fund creditor obligations
Foreign Currency Risk
The Group may be exposed to fluctuations in foreign currencies with respect of future royalty income
Price Risk
The Group is not currently exposed to any material commodity price risk
Sections ( e) to (i) ofthis note considers in detail those risk areas relevant to the Group
30
RESIDUAL BUSINESS MANAGEMENT CORPORATION GROUP
NOTES TO THE FINANCIAL STATEMENTS for Year Ended 30 June 2012
Note 23 - Financial risk management objectives and policies (continued)
(c) Financial instrument categories
Financial Instrument Class Table A Consolidated I Parent Note Category
(a) Financial assets
Cash and deposits 6 Cash T Corp Hour-Glass cash facility 7 Cash trust Receivables - non-current 10 Trade receivables (at amortised cost) Receivables - current 8 Other receivables (at amortised cost)
Total financial assets
(b) Financial liabilities
Payables 14 Trade and accruals measured at amortised cost
Total financial liabilities
Net financial assets
Total 2012 2011
$000 $000
1041 1500 10240 12075
- 7 26 49
11307 13631
43 14
43 H
11264 13617
(d) Financial instruments recognition policy
All Group financial assets and liabilities have been recognised at the reporting date at their net fair values The following methods and assumptions are used to determine the net fair values of financial assets and liabilities
Cash cash equivalents and short-term investments - the carrymg amount approximates fair value because of their short time maturity
Cash trusts - the carrying amount approximates fair value because the underlying trust assets are liquid investments and the financial instrument is redeemable at call
Trade receivables and trade creditors - the carrying amount approximates fair value because of their short term maturity There were no trade receivables that were past due or impaired at the year end
Contract and royalty receivables - the carrying amounts reflect impairment and discount to present value adjustments that derive an approximate fair value
Non-current investmentssecurities - for financial instruments traded in organised financial markets fair value is the current quoted market bid price for an asset or offer price for a liability adjusted for transaction costs necessary to realise the asset or settle the liability For investments where there is no quoted market price a reasonable estimate of the fair value is determined by reference to the current market value of another instrument which is substantially the same or is calculated based on the expected cash flows or the underlying net asset base of the investmentsecurity The carrying amount reflects an impairment that derives the approximate fair value
Unrecognised financial instruments- There are no unrecognised financial instruments
31
RESIDUAL BUSINESS MANAGEMENT CORPORATION GROUP
NOTES TO THE FINANCIAL STATEMENTS for Year Ended 30 June 2012
Note 23 - Financial risk management objectives and policies (continued)
(d) Financial instruments recognition policy (continued)
The entity uses the following hierarchy for disclosing the fair value of financial instruments by valuation technique
bull Level 1 - Derived from quoted prices in active markets for identical assets I liabilities bull Level 2 -Derived from inputs other than quoted prices that are observable directly or indirectly bull Level 3 - Derived from valuation techniques that include inputs for the asset I liability not based
on observable market data (unobservable inputs) 2012
Level 1 Level 2 Level 3 Total $000 $000 $000 $000
Financial assets at fair value TCorp Hour-Glass Inv Facility 10240 10240
10240 10240
The table above includes only financial assets as no financial liabilities were measured at fair value in the statement of financial position
The aggregate net fair values and carrying amounts of financial instruments are disclosed in the statement of financial position and the supporting notes to these financial statements
(e) Interest rate risk
Interest rate risk is the risk that the value of the financial instrument or its revenue or costs will fluctuate due to changes in market interest rates The Groups exposure to interest rate risk and the effective interest rates of its financial assets and liabilities at the reporting date are set out on the following pages
In respect of income-earning financial assets and interest-bearing financial liabilities the table on the following page sets out the carrying amount by maturity date of the financial instruments exposed to interest rate risk at reporting date
32
RESIDUAL BUSINESS MANAGEMENT CORPORATION GROUP
NOTES TO THE FINANCIAL STATEMENTS for Year Ended 30 June 2012
Note 23 - Financial risk management objectives and policies (continued)
(e) Interest rate risk (continued)
Table B Consolidated Fixed interest rate maturing in
Financial Instruments Floating interest rate
2012 2011 $000 $000
1 year or less
2012 2011 $000 $000
Over 1 to 5 years
2012 2011 $000 $000
More than 5 years
2012 2011 $000 $000
Non-interest bearing
2012 2011 $000 $000
Total carrying amount as per the
Statement of Financial Position
2012 2011 $000 $000
(i) Financial assets Cash at bank 41 92 1000 1408 1041 1500 Cash trust 10240 12075 10240 12075 Trade and other receivables 26 49 26 49
Total financial assets 10281 12167 1000 1408 26 49 11307 13624
Weighted average interest rate 489 475 585 578
(ii) Financial liabilities Trade creditors accruals and other creditors 43 14 43
Total financial liabilities 43 14 43
Weighted average interest rate
Net financial assets (liabilities 10281 12167 1000 1408 17 35 11264 13610
33
14
14
RESIDUAL BUSINESS MANAGEMENT CORPORATION GROUP
NOTES TO THE FINANCIAL STATEMENTS for Year Ended 30 June 2012
Note 23 - Financial risk management objectives and policies (continued)
(e) Interest rate risk (continued)
Interest rate risk scenario and sensitivity analysis
The Group invests in secure bank term deposits and with the NSW Governments Treasury Corporation (T Corp) The Group holds large cash reserves to deal with its legacy business issues and to enable it to enforce its contractual rights in relation to the intellectual property it has developed Interest rate movements have a large impact on the results of the Group The risk profile set by the General Manager results in the Group receiving only a small margin above or below the official Australian interest rate set by the Australian Reserve Bank Board The duration of each cash investment essentially drives the interest rate the Group receives
TCorp Hour-Glass facilities
Exposure to interest rate risk primarily arises through the investment in the TCorp Hour Glass Investment Facilities which are held for strategic rather than trading purposes The Group holds units in the following Hour-Glass investment trusts
Consolidated Parent
Facility Investment Sectors Investment Horizon 2012
$000 2011
$000 2012
$000 2011
$000
Cash facility Cash and money market securities At call 10240 12075 10240 11993
The unit price of the facility is equal to the total fair value of the net assets held by the facility divided by the number of units on issue for that facility Unit prices are calculated and published daily NSW TCorp is trustee for the above facility and is required to act in the best interest of the unit holders and to administer the trust in accordance with the trust deeds As trustee TCorp has appointed external managers to manage the performance and risk of the facility in accordance with a mandate agreed by the parties Significant portions of administration are also outsourced to an external custodian Investment in the Hour-Glass facilities limits the Groups exposure to risk as it allows diversification across a pool of funds with different investment horizons and a mix of investments
The impact on profit I loss 2012 is as follows
Consolidated Parent Facility Change in
Unit Price Impact on Profit I
Loss 2012 $000
Impact on Profit I Loss 2011
$000
Impact on Profit I Loss 2012
$000
Impact on Profit I Loss 2011
$000 Cash facility +-1 102 121 102 120
NSW TCorp provides sensitivity analysis information for the cash facility using historical based volatility information collected over a ten year period quoted at two standard deviations (ie 95 probability)
The TCorp Hour-Glass investment facilities are designated at fair value through the Statement of Comprehensive Income and therefore any changes in unit price impacts directly on profit (rather than equity) A reasonably possible change is based on the percentage change in unit price multiplied by the redemption value as at 30 June each year for each facility
34
RESIDUAL BUSINESS MANAGEMENT CORPORATION GROUP
NOTES TO THE FINANCIAL STATEMENTS for Year Ended 30 June 2012
Note 23 - Financial risk management objectives and policies (continued)
(e) Interest rate risk (continued)
TCorp Hour-Glass facilities (continued)
The Groups term deposit cash investment sensitivity rates are similar As follows is the Groups judgement of reasonable possible movements in profits due to foreseeable changes in interest rates
(f) Credit risk
Credit Risk is the risk of financial loss arising to the Group from the default of another party with a contract or financial position with the Group The Group has material credit risk exposure to the CSG Solar AG Group in that at reporting date the Group has gross royalty rights receivable over time from CSG Solar AG Group of a least $332438395 (2011 $8 17197928) The table below states these gross receipts at their recoverable amount discounted to present value which is Nil (2011 $Nil) these written down values being the balances reflected in these financial statements These royalty rights are not past due but they are considered fully impaired Group policy is that all customers that wish to trade on credit terms are subject to a credit worthiness review
The Groups maximum exposure to credit risk and the applicable counter party is represented by the carrying amounts of its financial assets at reporting date as is set out in the following table (There was no past due balances at 30 June 2012)
Table C Financial
Instrument
Government Institutions
Australian Banks
CSG Solar AG Group
Other Commercial
entities Total
Consolidated 2012 $000
2011 $000
2012 $000
2011 $000
2012 $000
2011 $000
2012 $000
2011 $000
2012 $000
2011 $000
(a) Financial assets Cash and deposits - - 1041 1500 - - - - 1041 1500
Cash trust 10240 12075 - - - - - - 10240 12075 Trade receivables
amp other - - - - - - 26 49 26 49 Royalty rights
Impairment - - - -3324
(3324) 8172
(8172) --
--
3324 (3324)
8172 (8 172)
Net Rovalty - - - - - - - - - -Unlisted shares
Impairment --
--
--
--
--
10 (10)
--
--
--
10 (10)
Net unlisted shares - - - - - - - - - -Total 10240 12075 1041 1500 - - 26 49 11307 13624
35
RESIDUAL BUSINESS MANAGEMENT CORPORATION GROUP
NOTES TO THE FINANCIAL STATEMENTS for Year Ended 30 June 2012
Note 23 - Financial risk management objectives and policies (continued)
(g) Liquidity risk
Liquidity risk arises from the financial liabilities of the Group and the Groups subsequent ability to meet the obligations to repay the liabilities as and when they fall due As is disclosed above the Group maintains a high level of cash reserves to cover its material credit and warranty risks The Group has ongoing administrative costs require ongoing funding The following table provides the maturity dates of the Groups financial liabilities by bands
Table D
Maturity Bands
Financial liabilities
Trade creditors
Other creditors
Total financial liabilities
2012 2012 2011 2012 2011 more 2011 2012 2011 less less more more than 2 more More More
than than than 1 than 1 less than 2 than than one one less than less than than 5 less than 5 5 2012 2011 year year 2 years 2 years years 5 years years years Total Total $000 $000 $000 $000 $000 $000 $000 $000 $000 $000
25 12 - - - - - - 25 12
18 2 - - - - - - 18 2
43 14 - - - - - - 43 14
(h) Foreign currency risk
At the present time the Group has no material exposure to foreign currency risk The Groups above mentioned royalty rights are payable in Australian dollars
(i) Derivative financial instruments
During the financial year ending 30 June 2012 neither Residual Business Management Corporation nor any of its controlled entities had any known exposure to derivatives
36
RESIDUAL BUSINESS MANAGEMENT CORPORATION GROUP
NOTES TO THE FINANCIAL STATEMENTS for Year Ended 30 June 2012
Note 24-Retained earnings Note
Consolidated
2012 2011 $000 $000
Parent Entity
2012 2011 $000 $000
Balance at beginning of the financial year Owners of the parent comprehensive income (loss) Superannuation actuarial (losses) I gains Dividend paid or declared Balance at the end of the year
3(b) 27(c)
11909 816
(11036) 2000
(311
12059 728 122
(1000) 11909
11909 816
(11036) 2000
(311
1104 11683
122 (1000) 11909
Note 25 shy Non-controlling interests
As at 30 June 2011 the parent entity held an equity interest of 59 in Pacific Solar Pty Limited On 24 February 2012 a share buyback was approved by all minority shareholders for all of their Pacific Solar Pty Limited shares Thus on this date Pacific Solar became a fully owned subsidiary of RBMC Pacific Solar was then deregistered as a solvent entity on 9 May 2012 The buyback was based on a mid-point minority interest discount of 20 for the shares held by the following shareholders
Enipower SpA University ofNSW New South Innovations Pty Limited Thi An Dinh Morgan Michael Green Briana Keagan Green and Michelle Gaye Wenham
Reconciliation of non-controlling interest in RBMCs consolidated equity Non-controlling interest
2012 2011 $000 $000
Non-controlling interest in Pacific Solar share capital 36364 Non-controlling interests share ofretained (losses) at the end of the year (35836 Non-controlling interest in RBMCs consolidated equity 528
Note 26 - New Australian Accountings Standards issued but not effective
In the current year the Group has adopted all of the new and revised Standards and Interpretations issued by the AASB that are relevant to the operations and effective for the current reporting period Details of the impact of the adoption of these new accounting standards are set out in the individual accounting policies notes in the financial statements Certain new accounting standards and interpretations have been published that are not mandatory for the 30 June 2012 reporting period The Group did not early adopt any new accounting standards that are not yet effective The Group has assessed the impact of the new standards and interpretations on issue but not effective and considers the impact to be insignificant
37
RESIDUAL BUSINESS MANAGEMENT CORPORATION GROUP
NOTES TO THE FINANCIAL STATEMENTS for Year Ended 30 June 2012
Note 27 - Superannuation information
(a) Superannuation income recognition policy
In 2012 the Group recognises the net total of the following amounts in profit or loss
Current service cost is the increase in the present value of the defined benefit obligation resulting from employee service in the current period Interest cost is the increase in the present value of the defined benefit obligation which arises because the benefits are one period closer to settlement Expected return on plan assets is based on market expectations at the beginning of the period for returns over the life of the related obligation and on any reimbursement rights Past service cost (to the extent required to be recognised) is the increase in the defined benefit obligation from changes to post-employment benefits relating to employee service in prior periods and Curtailments or settlements are amendments to the terms of the plan andor number of employees covered by the plan
The Group recognises defined benefit actuarial superannuation gains and losses in other comprehensive income
(b) Superannuation obligations
All former employees were entitled to varying levels of benefits on retirement disability or death The superannuation plans (State Superannuation Scheme (SSS) State Authorities Superannuation Scheme (SASS) and State Authorities Non-Contributory Superannuation Scheme (SANCS) provide defined benefits based on years of service and final average salary Employees contributed to the plans and the contribution of the parent entity was and remains legally enforceable All Schemes are closed to new members
Note (b) continues on the following page
38
RESIDUAL BUSINESS MANAGEMENT CORPORATION GROUP
NOTES TO THE FINANCIAL STATEMENTS for Year Ended 30 June 2012
Note 27 - Superannuation information (continued)
(b) Superannuation obligations (continued)
The following is the superannuation position of the Group as at 30 June 2012 The superannuation assets and liabilities recognised in the statement of financial position are listed at the bottom of the table
Consolidated (Being The Parent Entity)
2012 2011 2012 2011 2012 2011 2012 2011 Member numbers
SASS SANCS SSS Total
Contributors - - - - - - - -Deferred benefits - - - - 3 3 3 3 Pensioners 2 2 - - 39 38 41 40 Pensions fully commuted - - - - 2 2 2 2 Totals 2 2 - - 44 43 46 45
Accrued liability
Superannuation position for AASB119 purposes
(437)
2012 $000
(339)
2011 $000
-
2012 $000
-
2011 $000
(32024)
2012 $000
(23303)
2011 $000
(32461)
2012 $000
(23642)
2011 $000
Estimate reserve account balance 193 269 282 279 20411 21893 20886 22441 Sub-total
Future Service Liability (Note 1) Surplus in excess of recovery available from Schemes Net asset I (liability) to be recognised in statement of financial position
(244)
-
-
(244)
(70)
-
-
(70)
282
-
-
282
279
-
-
279
(11613)
-
-
(11613)
(1410)
-
-
(1410)
(11575)
-
-
(11575)
(1201)
-
-
(1201)
Note 1 The Future Service Liability (FSL) does not have to be recognised by an employer It is only used to determine if an asset ceiling limit should be imposed (AASB 119 para 58) Under AASB 119 any prepaid superannuation asset recognised cannot exceed the total of any unrecognised past service cost and the present value of any economic benefits that may be available in the form of refunds from the plan or reductions in future contributions to the plan Where the surplus in excess of recovery is zero no asset ceiling limit is imposed
As is set out above at 30 June 2012 Residual Business Management Corporation had a gross calculated defined benefit superannuation liability with respect of former employees of $32461163 (2011 23641751 ) Superannuation funds invested to cover this liability amounted to $20886294 (2011 $22440728) The aforementioned superannuation liability and surplus position has been calculated by an independent and qualified actuary The calculated deficiency of invested funds versus the anticipated superannuation liabilities at 30 June 2012 was a balance of $11574869 (2011 $1201023) The parent entity with the support ofNSW Treasury believes that it has sufficient funds to cover this deficiency
39
RESIDUAL BUSINESS MANAGEMENT CORPORATION GROUP
NOTES TO THE FINANCIAL STATEMENTS for Year Ended 30 June 2012
Note 27 - Superannuation information (continued)
(b) Superannuation obligations (continued)
Th T f h t ee reconcr ration o t e present va ue of h defimed b enefirt o blrgatrons rs as flo11ows For the year ended 30 June 2012
Consolidated (Being the Parent Entity) SASS SANCS SSS $000 $000 $000
Present value ofpartly funded defined benefit obligation at beginning of the year (339) - (23303) Current service cost - - -Interest cost (17) - (I 199) Contributions by fund participants - - -Actuarial gains (losses) (157) 3 (8995) Benefits paid 76 (3) 1473 Past service cost - - -Curtailments - - -Settlements - - -Business Combinations - - -Exchange rate changes - - -Present value of partly funded defined benefit obliations at end of the year (437) - (32024)
Total Total 2012 2011
$000 $000
(23642) (23686) - -
(1216) (I 194) - -
(9149) 141 1546 1097
- -- -- -- -- -
(32461) (23642)
The reconciliation of the fair value offund assets is as follows
For the year ended 30 June 2012 Total Total Consolidated (Being the Parent Entity) SASS SAN CS SSS 2012 2011
$000 $000 $000 $000 $000 Fair value of fund assets at beginning of the year 269 279 21893 22441 21738 Expected (loss) I return on fund assets 22 24 1832 1878 1819 Actuarial (losses) I gains (22) (24) (1841) (1887) (19) Employer contributions - - - - -Contributions by fund participants - - - - -Benefits paid (76) 3 (1473) (1546) (l097) Settlements - - - - -Business combinations - - - - -Exchange rate changes - - - - -Fair value of fund assets at end of the year 193 282 20411 20886 22441
The reconciliation of the assets and liabilities recognised in the statement of financial position is follows
Total Consolidated (Being the Parent Entity)
TotalFor the year ended 30 June 2012 2012
$000 SAN CS SASS SSS
$000 Present value ofpartly funded defined benefit obligations at end of the year
$000 $000 $000
(32461) (23642) Fair value of fund assets at end of year
(437) (32024)-22441
Subtotal 20886282 20411193
(1201) Unrecognised past service cost
(11575)(244) (11613)282 - - - --
Unrecognised gain(loss) --- --Adjustment for limitation on net assets -- -- -Net asset I (liability) recognised in the statement of financial position at end of year (l201)(11575)(244) (11613)282
40
2011
RESIDUAL BUSINESS MANAGEMENT CORPORATION GROUP
NOTES TO THE FINANCIAL STATEMENTS for Year Ended 30 June 2012
Note 27 - Superannuation information (continued)
(b) Superannuation obligations (continued)
For the year ended 30 June 2012
2012 Consolidated (Being the Parent Entity) SASS SANCS SSS Total Components recognised in profit or loss by component $000 $000 $000 $000 Current service cost - - - -Interest cost (17) - (1199) (1216) Expected return on fund assets (net of expenses) 22 24 1832 1878 Past service cost - - - -Movement in adjustment for limitation on net asset - - - -Curtailment or settlement gain(loss) - - - -Total included in Other income in the statement of 5 24 633 662 comprehensive income (refer also note 2(b))
For the year ended 30 June 2012
2012 Consolidated (Being the Parent Entity) SASS SAN CS SSS Total Components recognised in other comprehensive income $000 $000 $000 $000 Actuarial (losses) I gains recognised in year (179) (21) (10836) (11036)
2011 Total $000
-(1194)
1819 ---
625
2011 Total $000
122
Cumulative amount recognised in other comprehensive income
The cumulative amount of actuarial gains and losses since 1 July 2005 recognised in other comprehensive income is an accumulated loss of $14221000 (2011 accumulated loss of $3185000) Before 1 July 2005 RBMC treated the defined benefit superannuation funds as separate entities and so recognised no superannuation balances in other comprehensive income
(c) Superannuation obligations - actuarial loses outside the statement of comprehensive income
Amounts not recognised in the statement of comprehensive income and expenses are as follows
For the year ended 30 June 2012
Consolidated (Being the Parent Entity) SASS SAN CS SSS 2012
Total 2011 Total
$000 $000 $000 $000 $000 Actuarial (losses) - - - - -Adjustment for limit on net asset - - - - -Total loss not reco2nised in the income statement - - - - -
41
RESIDUAL BUSINESS MANAGEMENT CORPORATION GROUP
NOTES TO THE FINANCIAL STATEMENTS for Year Ended 30 June 2012
Note 27 - Superannuation information (continued)
(d) Superannuation asset classes
The percentage invested in each asset class at the balance sheet date
Consolidated (Being the Parent Entity) 30 June 2012 30 June 2011 Australian equities 280 334 Overseas equities 237 295 Australian fixed interest securities 49 57 Overseas fixed interest securities 24 31 Property 86 99 Cash 195 51 Other 129 133
All Fund assets are invested by SAS Trustee Corporation (STC) at arms length through independent fund managers
Other superannuation provision information related to AASB 119 is disclosed at Note 28
AASB 119 requires organisations to provide detailed narrative information regarding the key economic and demographic assumptions underlying the reported defined benefits superannuation account balances The assumptions and calculations are generic to all NSW Government agencies and they are set out in Note 28
Note 28 - AASB 119 Superannuation information valuation method and principal actuarial assumptions
The followings are the superannuation asset and liability assumptions and calculations generic to all NSW Government agencies
The expected rate of return on assets assumption is determined by weighting the expected long-term return for each asset class by the target allocation of assets to each class The returns used for each class are net of investment tax and investment fees
Actual return on Scheme assets are as follows
For the year ended 30 June 2012 Consolidated (Being the Parent Entity) SASS SANCS SSS Total
$000 $000 $000 $000 Actual loss I (return) on fund assets (1) - 9 8
(a) Valuation Method
The Projected Unit Credit (PUC) valuation method was used to determine the present value of the defined benefit obligations and the related current service costs This method sees each period of service as giving rise to an additional unit of benefit entitlement and measures each unit separately to build up the final obligation
42
RESIDUAL BUSINESS MANAGEMENT CORPORATION GROUP
NOTES TO THE FINANCIAL STATEMENTS for Year Ended 30 June 2012
Note 28 - AASB 119 Superannuation information valuation method and principal actuarial assumptions (continued)
(b) Economic assumptions
Consolidated (Being the Parent Entity) 30 June 2012 30 June 2011
Salary increase rate (excluding promotional increases) 25 pa 35 pa
Rate ofCPI increase 25 pa 25pa
Expected rate of return on assets backing pension liabilities 860 pa 860pa
Expected rate ofretum on assets backing other liabilities 860 pa 860pa
Discount rate 306 pa 528pa
(c) Demographic assumptions
The demographic assumptions underlying the calculated actuarial balances of the RBMC Superannuation Schemes are generic to all NSW Government agencies and further details can be obtained from the NSW Treasury website
(d) Historical information
For the year ended 3 0 June 2012 Consolidated (Being the Parent Entity) SASS SANCS SSS Total
$000 $000 $000 $000 Present value ofdefined benefit obligation (437) - (32024) (32461) Fair value of fund assets 193 282 20411 20886 Surplus(Deficit) in fund (244) 282 (11613) (11575) Experience adjustments - liabilities (157) 3 (8995) (9149) Experience adjustments - assets (22) (23) (1841) (1886)
For the year ended 30 June 2011 Consolidated (Being the Parent Entity) SASS SANCS SSS Total
$000 $000 $000 $000 Present value of defined benefit obligation (339) - (23303) (23642) Fair value of fund assets 269 279 21893 22441 Surplus(Deficit) in fund (70) 279 (1410) (1201) Experience adjustments - liabilities 12 (6) 135 141 Experience adjustments - assets - (1) (18) (19)
For the year ended 30 June 2010 Consolidated (Being the Parent Entity) SASS SAN CS SSS Total
$000 $000 $000 $000 Present value of defined benefit obligation (344) - (23342) (23686) Fair value of fund assets 258 263 21217 21738 Surplus in fund (86) 263 (2125) (1948) Experience adjustments - liabilities (8) (3) (1079) (1090) Experience adjustments - assets 2 1 133 136
43
RESIDUAL BUSINESS MANAGEMENT CORPORATION GROUP
NOTES TO THE FINANCIAL STATEMENTS for Year Ended 30 June 2012
Note 28 - AASB 119 Superannuation information valuation method and principal actuarial assumptions (continued)
(d) Historical information (continued)
For the year ended 30 June 2009 Consolidated (Being the Parent Entity) SASS SAN CS SSS Total
$000 $000 $000 $000 Present value of defined benefit obligation (336) - (21959) (22295) Fair value of fund assets 254 244 20292 20790 Surplus in fund (83) 244 (1666) (1505) Experience adjustments - liabilities (65) 15 (3875) (3925) Experience adjustments - assets (55) (48) (4259) (4362)
For the year ended 30 June 2008 Consolidated (Being the Parent Entity) SASS SAN CS SSS Total
$000 $000 $000 $000 Present value of defined benefit obligation (283) - (18313) (18596) Fair value of fund assets 313 256 24045 24614 Surplus in fund 30 256 5732 6018 Experience adjustments - liabilities 3 111 2119 2233 Experience adjustments - assets 16 (76) (5316) (5376)
(e) Expected contributions
For the year ended 30 June 2012 SASS SAN CS SSS Total $000 $000 $000 $000
Expected employer contributions to be paid in the next reporting period - - - -
(f) Funding arrangements for employer contributions
i Surplus I deficit
The following is a summary of the 30 June 2012 financial position of the Schemes calculated in accordance with AAS 25 Financial Reporting by Superannuation Plans
For the year ended 30 June 2012
Consolidated (Being the Parent Entity) SASS SANCS SSS Total 2012
Total 2011
$000 $000 $000 $000 $000 Accrued benefits (256) - (17086) (17342) (16841) Net market value of Fund assets 193 283 20410 20886 22441 Total net surplus( deficiency) (63) 283 3324 3544 5600
44
RESIDUAL BUSINESS MANAGEMENT CORPORATION GROUP
NOTES TO THE FINANCIAL STATEMENTS for Year Ended 30 June 2012
Note 28 - AASB 119 Superannuation information valuation method and principal actuarial assumptions (continued)
(f) Funding arrangements for employer contributions (continued)
ii Contribution recommendations
The recommended contribution rates are as follows For the year ended 30 June 2012
Consolidated (Being the Parent Entity)
SASS SANCS SSS
Multiple of member contributions member salary Multiple ofmember contributions 000 000 000
iii Funding method
Contribution rates are set after discussions between the employer STC and NSW Treasury
iv Economic assumptions
The economic assumptions adopted for the current actuarial review of the Fund are
Weighted-average assumptions 2012 2011
Expected rate ofretum on Fund assets backing current pension liabilities 83 pa 83pa
Expected rate of return on Fund assets backing other liabilities 73 pa 73pa
Expected salary increase rate 40 pa 40pa
Expected rate of CPI increase 25 pa 25pa
(g) Nature of asset I (liability)
If a surplus exists in the employers interest in the Fund the employer may be able to take advantage of it in the form of a reduction in the required contribution rate depending on the advice of the Funds actuary
Where a deficiency exists the employer is responsible for any difference between the employers share of Fund assets and the defined benefit obligation
Note 29 - Events occurring after reporting date
The services of Mr Andrew d Apice the former General Manager of the RBMC Group were finalised on 31 August 2012 Mr Dominic Schuster of NSW Treasury was then appointed as his replacement effective 1 September 2012
There were no other matters or circumstances that have arisen since the end of the financial year which significantly affected or may significantly affect the operations of the Group the results of those operations or the state of affairs of the Group in future years
End of audited financial statements
45
RESIDUAL BUSINESS MANAGEMENT CORPORATION
FINANCIAL STATEMENTS FOR THE YEAR ENDED 30 JUNE 2012
STATEMENT BY CHIEF EXECUTIVE OFFICER
RESIDUAL BUSINESS MANAGERMENT CORPORATION
Pursuant to Section 41C of the Public Finance and Audit Act 1983 I state that in my opinion
The accompanying financial statements and notes thereto exhibit a true and fair view of the financial
position of the Residual Business Management Corporation (RBMC) as at 30 June 2012 and the
financial performance for the year then ended
The financial statements have been prepared in accordance with the provisions of applicable
Australian Accounting Standards (which include Australian Accounting Interpretations) the
requirements of the Public Finance and Audit Act 1983 applicable clauses of the Public Finance and
Audit Regulation 2010 the requirements of the Financial Reporting Directions published in the
Financial Reporting Code for NSW General Government Sector Entities and the Treasurers
Directions
Further I am not aware of any circumstances which would render any particulars included in the
financial statements to be misleading or inaccurate
On behalf of the Corporation
Dominic Schuster
General Manager
Residual Business Management Corporation
Dated 6 May 2014 at Sydney
INDEPENDENT AUDITORS REPORT
Residual Business Management Corporation
To Members of the New South Wales Parliament
I have audited the accompanying financial statements of Residual Business Management Corporation (the Corporation) which comprise the statements of financial position as at 30 June 2012 the statements of comprehensive income the statements of changes in equity and the statements of cash flows for the year then ended notes comprising a summary of significant accounting policies and other explanatory information of the Corporation and the consolidated entity The consolidated entity comprises the Corporation and the entities it controlled at the year end or from time to time during the financial year
Opinion
In my opinion the financial statements
give a true and fair view of the financial position of the Corporation and the consolidated entity as at 30 June 2012 and of their financial performance and cash flows for the year then ended in accordance with Australian Accounting Standards
bull are in accordance with section 41B of Public Finance and Audit Act 1983 (the PFampA Act) and the Public Finance and Audit Regulation 2010
My opinion should be read in conjunction with the rest of this report
The General Managers Responsibility for the Financial Statements
The General Manager is responsible for the preparation of the financial statements that give a true and fair view in accordance with Australian Accounting Standards and the PFampA Act and for such internal control as the General Manager determines is necessary to enable the preparation of the financial statements that are free from material misstatement whether due to fraud or error
Auditors Responsibility
My responsibility is to express an opinion on the financial statements based on my audit I conducted my audit in accordance with Australian Auditing Standards Those standards require that I comply with relevant ethical requirements relating to audit engagements and plan and perform the audit to obtain reasonable assurance about whether the financial statements are free from material misstatement
An audit involves performing procedures to obtain audit evidence about the amounts and disclosures in the financial statements The procedures selected depend on the auditors judgement including the assessment of the risks of material misstatement of the financial statements whether due to fraud or error In making those risk assessments the auditor considers internal controls relevant to the entitys preparation of the financial statements that give a true and fair view in order to design audit procedures that are appropriate in the circumstances but not for the purpose of expressing an opinion on the effectiveness of the entitys internal control An audit also includes evaluating the appropriateness of accounting policies used and the reasonableness of accounting estimates made by the General Manager as well as evaluating the overall presentation of the financial statements
I believe the audit evidence I have obtained is sufficient and appropriate to provide a basis for my audit opinion
My opinion does not provide assurance
bull about the future viability of the Corporation or consolidated entity
bull that they have carried out their activities effectively efficiently and economically
bull about the effectiveness of internal control
bull about the security and controls over the electronic publication of the audited financial statements on any website where they may be presented
bull about any other information that may have been hyperlinked tofrom the financial statements
Independence
In conducting my audit I have complied with the independence requirements of the Australian Auditing Standards and other relevant ethical pronouncements The PFampA Act further promotes independence by
bull providing that only Parliament and not the executive government can remove an Auditor-General
bull mandating the Auditor-General as auditor of public sector agencies but precluding the provision of non-audit services thus ensuring the Auditor-General and the Audit Office of New South Wales are not compromised in their role by the possibility of losing clients or income
1~k Kheir Director Financial Audit Services
19May2014 SYDNEY
- Structure Bookmarks
-
- Figure
- Figure
- Financial Instrument Class Table A Consolidated I Parent Note Category (a) Financial assets Cash and deposits 6 Cash T Corp Hour-Glass cash facility 7 Cash trust Receivables -non-current 10 Trade receivables (at amortised cost) Receivables -current 8 Other receivables (at amortised cost) Total financial assets (b) Financial liabilities Payables 14 Trade and accruals measured at amortised cost Total financial liabilities Net financial assets Total 2012 2011 $000 $000 1041 1500 10240 12075 -7 26 49 1130
- For the year ended 30 June 2012 Consolidated (Being the Parent Entity) SASS SANCS SSS $000 $000 $000 Present value ofpartly funded defined benefit obligation at beginning ofthe year (339) -(23303) Current service cost ---Interest cost (17) -(I199) Contributions by fund participants ---Actuarial gains (losses) (157) 3 (8995) Benefits paid 76 (3) 1473 Past service cost ---Curtailments ---Settlements ---Business Combinations ---Exchange rate changes ---Present value of partly funded defined benefit obl
- For the year ended 30 June 2012 2012 Consolidated (Being the Parent Entity) SASS SANCS SSS Total Components recognised in profit or loss by component $000 $000 $000 $000 Current service cost ----Interest cost (17) -(1199) (1216) Expected return on fund assets (net ofexpenses) 22 24 1832 1878 Past service cost ----Movement in adjustment for limitation on net asset ----Curtailment or settlement gain(loss) ----Total included in Other income in the statement of 5 24 633 662 comprehensive income (refe
- Figure
- Figure
- 1~kKheir
-

RESIDUAL BUSINESS MANAGEMENT CORPORATION GROUP
NOTES TO THE FINANCIAL STATEMENTS for Year Ended 30 June 2012
Note 23 - Financial risk management objectives and policies
The Groups principal financial instruments comprise receivables payables cash and term deposits These financial instruments arise directly from the Groups operations or are required to finance the Groups activities The Group does not enter into or trade financial instruments including derivative financial instruments for speculative purposes
(a) Risk exposures and responses
The Groups main risks arising from financial instruments are outlined below together with the Groups objectives policies and processes for measuring and managing risk Further quantitative and qualitative disclosures are included throughout these financial statements
The Groups General Manager has overall responsibility for the establishment and oversight of risk management and he reviews and agrees policies for the management of risk Risk management policies are established to identify and analyse the risks faced by the Group and to set risk limits and controls to monitor the risks Compliance with policies is reviewed by the General Manager on a continuous basis
(b) Financial instrument risk defined
The main financial instrument risks that the Group could be exposed to through its financial instruments are as follows
Interest Rate Risk
The Group is exposed to fluctuations in interest rates to the extent ofthe level of its invested cash
Credit Risk
The exposure to credit risk excluding the value of any collateral or other security held is the carrying amount of any provisions for impairment of the Groups recognised financial assets as disclosed in the Statement of Financial Position and notes to these financial statements
Liquidity Risk
The Group manages liquidity risk by monitoring forecast cash flows and ensuring that adequate cash reserves are maintained to fund creditor obligations
Foreign Currency Risk
The Group may be exposed to fluctuations in foreign currencies with respect of future royalty income
Price Risk
The Group is not currently exposed to any material commodity price risk
Sections ( e) to (i) ofthis note considers in detail those risk areas relevant to the Group
30
RESIDUAL BUSINESS MANAGEMENT CORPORATION GROUP
NOTES TO THE FINANCIAL STATEMENTS for Year Ended 30 June 2012
Note 23 - Financial risk management objectives and policies (continued)
(c) Financial instrument categories
Financial Instrument Class Table A Consolidated I Parent Note Category
(a) Financial assets
Cash and deposits 6 Cash T Corp Hour-Glass cash facility 7 Cash trust Receivables - non-current 10 Trade receivables (at amortised cost) Receivables - current 8 Other receivables (at amortised cost)
Total financial assets
(b) Financial liabilities
Payables 14 Trade and accruals measured at amortised cost
Total financial liabilities
Net financial assets
Total 2012 2011
$000 $000
1041 1500 10240 12075
- 7 26 49
11307 13631
43 14
43 H
11264 13617
(d) Financial instruments recognition policy
All Group financial assets and liabilities have been recognised at the reporting date at their net fair values The following methods and assumptions are used to determine the net fair values of financial assets and liabilities
Cash cash equivalents and short-term investments - the carrymg amount approximates fair value because of their short time maturity
Cash trusts - the carrying amount approximates fair value because the underlying trust assets are liquid investments and the financial instrument is redeemable at call
Trade receivables and trade creditors - the carrying amount approximates fair value because of their short term maturity There were no trade receivables that were past due or impaired at the year end
Contract and royalty receivables - the carrying amounts reflect impairment and discount to present value adjustments that derive an approximate fair value
Non-current investmentssecurities - for financial instruments traded in organised financial markets fair value is the current quoted market bid price for an asset or offer price for a liability adjusted for transaction costs necessary to realise the asset or settle the liability For investments where there is no quoted market price a reasonable estimate of the fair value is determined by reference to the current market value of another instrument which is substantially the same or is calculated based on the expected cash flows or the underlying net asset base of the investmentsecurity The carrying amount reflects an impairment that derives the approximate fair value
Unrecognised financial instruments- There are no unrecognised financial instruments
31
RESIDUAL BUSINESS MANAGEMENT CORPORATION GROUP
NOTES TO THE FINANCIAL STATEMENTS for Year Ended 30 June 2012
Note 23 - Financial risk management objectives and policies (continued)
(d) Financial instruments recognition policy (continued)
The entity uses the following hierarchy for disclosing the fair value of financial instruments by valuation technique
bull Level 1 - Derived from quoted prices in active markets for identical assets I liabilities bull Level 2 -Derived from inputs other than quoted prices that are observable directly or indirectly bull Level 3 - Derived from valuation techniques that include inputs for the asset I liability not based
on observable market data (unobservable inputs) 2012
Level 1 Level 2 Level 3 Total $000 $000 $000 $000
Financial assets at fair value TCorp Hour-Glass Inv Facility 10240 10240
10240 10240
The table above includes only financial assets as no financial liabilities were measured at fair value in the statement of financial position
The aggregate net fair values and carrying amounts of financial instruments are disclosed in the statement of financial position and the supporting notes to these financial statements
(e) Interest rate risk
Interest rate risk is the risk that the value of the financial instrument or its revenue or costs will fluctuate due to changes in market interest rates The Groups exposure to interest rate risk and the effective interest rates of its financial assets and liabilities at the reporting date are set out on the following pages
In respect of income-earning financial assets and interest-bearing financial liabilities the table on the following page sets out the carrying amount by maturity date of the financial instruments exposed to interest rate risk at reporting date
32
RESIDUAL BUSINESS MANAGEMENT CORPORATION GROUP
NOTES TO THE FINANCIAL STATEMENTS for Year Ended 30 June 2012
Note 23 - Financial risk management objectives and policies (continued)
(e) Interest rate risk (continued)
Table B Consolidated Fixed interest rate maturing in
Financial Instruments Floating interest rate
2012 2011 $000 $000
1 year or less
2012 2011 $000 $000
Over 1 to 5 years
2012 2011 $000 $000
More than 5 years
2012 2011 $000 $000
Non-interest bearing
2012 2011 $000 $000
Total carrying amount as per the
Statement of Financial Position
2012 2011 $000 $000
(i) Financial assets Cash at bank 41 92 1000 1408 1041 1500 Cash trust 10240 12075 10240 12075 Trade and other receivables 26 49 26 49
Total financial assets 10281 12167 1000 1408 26 49 11307 13624
Weighted average interest rate 489 475 585 578
(ii) Financial liabilities Trade creditors accruals and other creditors 43 14 43
Total financial liabilities 43 14 43
Weighted average interest rate
Net financial assets (liabilities 10281 12167 1000 1408 17 35 11264 13610
33
14
14
RESIDUAL BUSINESS MANAGEMENT CORPORATION GROUP
NOTES TO THE FINANCIAL STATEMENTS for Year Ended 30 June 2012
Note 23 - Financial risk management objectives and policies (continued)
(e) Interest rate risk (continued)
Interest rate risk scenario and sensitivity analysis
The Group invests in secure bank term deposits and with the NSW Governments Treasury Corporation (T Corp) The Group holds large cash reserves to deal with its legacy business issues and to enable it to enforce its contractual rights in relation to the intellectual property it has developed Interest rate movements have a large impact on the results of the Group The risk profile set by the General Manager results in the Group receiving only a small margin above or below the official Australian interest rate set by the Australian Reserve Bank Board The duration of each cash investment essentially drives the interest rate the Group receives
TCorp Hour-Glass facilities
Exposure to interest rate risk primarily arises through the investment in the TCorp Hour Glass Investment Facilities which are held for strategic rather than trading purposes The Group holds units in the following Hour-Glass investment trusts
Consolidated Parent
Facility Investment Sectors Investment Horizon 2012
$000 2011
$000 2012
$000 2011
$000
Cash facility Cash and money market securities At call 10240 12075 10240 11993
The unit price of the facility is equal to the total fair value of the net assets held by the facility divided by the number of units on issue for that facility Unit prices are calculated and published daily NSW TCorp is trustee for the above facility and is required to act in the best interest of the unit holders and to administer the trust in accordance with the trust deeds As trustee TCorp has appointed external managers to manage the performance and risk of the facility in accordance with a mandate agreed by the parties Significant portions of administration are also outsourced to an external custodian Investment in the Hour-Glass facilities limits the Groups exposure to risk as it allows diversification across a pool of funds with different investment horizons and a mix of investments
The impact on profit I loss 2012 is as follows
Consolidated Parent Facility Change in
Unit Price Impact on Profit I
Loss 2012 $000
Impact on Profit I Loss 2011
$000
Impact on Profit I Loss 2012
$000
Impact on Profit I Loss 2011
$000 Cash facility +-1 102 121 102 120
NSW TCorp provides sensitivity analysis information for the cash facility using historical based volatility information collected over a ten year period quoted at two standard deviations (ie 95 probability)
The TCorp Hour-Glass investment facilities are designated at fair value through the Statement of Comprehensive Income and therefore any changes in unit price impacts directly on profit (rather than equity) A reasonably possible change is based on the percentage change in unit price multiplied by the redemption value as at 30 June each year for each facility
34
RESIDUAL BUSINESS MANAGEMENT CORPORATION GROUP
NOTES TO THE FINANCIAL STATEMENTS for Year Ended 30 June 2012
Note 23 - Financial risk management objectives and policies (continued)
(e) Interest rate risk (continued)
TCorp Hour-Glass facilities (continued)
The Groups term deposit cash investment sensitivity rates are similar As follows is the Groups judgement of reasonable possible movements in profits due to foreseeable changes in interest rates
(f) Credit risk
Credit Risk is the risk of financial loss arising to the Group from the default of another party with a contract or financial position with the Group The Group has material credit risk exposure to the CSG Solar AG Group in that at reporting date the Group has gross royalty rights receivable over time from CSG Solar AG Group of a least $332438395 (2011 $8 17197928) The table below states these gross receipts at their recoverable amount discounted to present value which is Nil (2011 $Nil) these written down values being the balances reflected in these financial statements These royalty rights are not past due but they are considered fully impaired Group policy is that all customers that wish to trade on credit terms are subject to a credit worthiness review
The Groups maximum exposure to credit risk and the applicable counter party is represented by the carrying amounts of its financial assets at reporting date as is set out in the following table (There was no past due balances at 30 June 2012)
Table C Financial
Instrument
Government Institutions
Australian Banks
CSG Solar AG Group
Other Commercial
entities Total
Consolidated 2012 $000
2011 $000
2012 $000
2011 $000
2012 $000
2011 $000
2012 $000
2011 $000
2012 $000
2011 $000
(a) Financial assets Cash and deposits - - 1041 1500 - - - - 1041 1500
Cash trust 10240 12075 - - - - - - 10240 12075 Trade receivables
amp other - - - - - - 26 49 26 49 Royalty rights
Impairment - - - -3324
(3324) 8172
(8172) --
--
3324 (3324)
8172 (8 172)
Net Rovalty - - - - - - - - - -Unlisted shares
Impairment --
--
--
--
--
10 (10)
--
--
--
10 (10)
Net unlisted shares - - - - - - - - - -Total 10240 12075 1041 1500 - - 26 49 11307 13624
35
RESIDUAL BUSINESS MANAGEMENT CORPORATION GROUP
NOTES TO THE FINANCIAL STATEMENTS for Year Ended 30 June 2012
Note 23 - Financial risk management objectives and policies (continued)
(g) Liquidity risk
Liquidity risk arises from the financial liabilities of the Group and the Groups subsequent ability to meet the obligations to repay the liabilities as and when they fall due As is disclosed above the Group maintains a high level of cash reserves to cover its material credit and warranty risks The Group has ongoing administrative costs require ongoing funding The following table provides the maturity dates of the Groups financial liabilities by bands
Table D
Maturity Bands
Financial liabilities
Trade creditors
Other creditors
Total financial liabilities
2012 2012 2011 2012 2011 more 2011 2012 2011 less less more more than 2 more More More
than than than 1 than 1 less than 2 than than one one less than less than than 5 less than 5 5 2012 2011 year year 2 years 2 years years 5 years years years Total Total $000 $000 $000 $000 $000 $000 $000 $000 $000 $000
25 12 - - - - - - 25 12
18 2 - - - - - - 18 2
43 14 - - - - - - 43 14
(h) Foreign currency risk
At the present time the Group has no material exposure to foreign currency risk The Groups above mentioned royalty rights are payable in Australian dollars
(i) Derivative financial instruments
During the financial year ending 30 June 2012 neither Residual Business Management Corporation nor any of its controlled entities had any known exposure to derivatives
36
RESIDUAL BUSINESS MANAGEMENT CORPORATION GROUP
NOTES TO THE FINANCIAL STATEMENTS for Year Ended 30 June 2012
Note 24-Retained earnings Note
Consolidated
2012 2011 $000 $000
Parent Entity
2012 2011 $000 $000
Balance at beginning of the financial year Owners of the parent comprehensive income (loss) Superannuation actuarial (losses) I gains Dividend paid or declared Balance at the end of the year
3(b) 27(c)
11909 816
(11036) 2000
(311
12059 728 122
(1000) 11909
11909 816
(11036) 2000
(311
1104 11683
122 (1000) 11909
Note 25 shy Non-controlling interests
As at 30 June 2011 the parent entity held an equity interest of 59 in Pacific Solar Pty Limited On 24 February 2012 a share buyback was approved by all minority shareholders for all of their Pacific Solar Pty Limited shares Thus on this date Pacific Solar became a fully owned subsidiary of RBMC Pacific Solar was then deregistered as a solvent entity on 9 May 2012 The buyback was based on a mid-point minority interest discount of 20 for the shares held by the following shareholders
Enipower SpA University ofNSW New South Innovations Pty Limited Thi An Dinh Morgan Michael Green Briana Keagan Green and Michelle Gaye Wenham
Reconciliation of non-controlling interest in RBMCs consolidated equity Non-controlling interest
2012 2011 $000 $000
Non-controlling interest in Pacific Solar share capital 36364 Non-controlling interests share ofretained (losses) at the end of the year (35836 Non-controlling interest in RBMCs consolidated equity 528
Note 26 - New Australian Accountings Standards issued but not effective
In the current year the Group has adopted all of the new and revised Standards and Interpretations issued by the AASB that are relevant to the operations and effective for the current reporting period Details of the impact of the adoption of these new accounting standards are set out in the individual accounting policies notes in the financial statements Certain new accounting standards and interpretations have been published that are not mandatory for the 30 June 2012 reporting period The Group did not early adopt any new accounting standards that are not yet effective The Group has assessed the impact of the new standards and interpretations on issue but not effective and considers the impact to be insignificant
37
RESIDUAL BUSINESS MANAGEMENT CORPORATION GROUP
NOTES TO THE FINANCIAL STATEMENTS for Year Ended 30 June 2012
Note 27 - Superannuation information
(a) Superannuation income recognition policy
In 2012 the Group recognises the net total of the following amounts in profit or loss
Current service cost is the increase in the present value of the defined benefit obligation resulting from employee service in the current period Interest cost is the increase in the present value of the defined benefit obligation which arises because the benefits are one period closer to settlement Expected return on plan assets is based on market expectations at the beginning of the period for returns over the life of the related obligation and on any reimbursement rights Past service cost (to the extent required to be recognised) is the increase in the defined benefit obligation from changes to post-employment benefits relating to employee service in prior periods and Curtailments or settlements are amendments to the terms of the plan andor number of employees covered by the plan
The Group recognises defined benefit actuarial superannuation gains and losses in other comprehensive income
(b) Superannuation obligations
All former employees were entitled to varying levels of benefits on retirement disability or death The superannuation plans (State Superannuation Scheme (SSS) State Authorities Superannuation Scheme (SASS) and State Authorities Non-Contributory Superannuation Scheme (SANCS) provide defined benefits based on years of service and final average salary Employees contributed to the plans and the contribution of the parent entity was and remains legally enforceable All Schemes are closed to new members
Note (b) continues on the following page
38
RESIDUAL BUSINESS MANAGEMENT CORPORATION GROUP
NOTES TO THE FINANCIAL STATEMENTS for Year Ended 30 June 2012
Note 27 - Superannuation information (continued)
(b) Superannuation obligations (continued)
The following is the superannuation position of the Group as at 30 June 2012 The superannuation assets and liabilities recognised in the statement of financial position are listed at the bottom of the table
Consolidated (Being The Parent Entity)
2012 2011 2012 2011 2012 2011 2012 2011 Member numbers
SASS SANCS SSS Total
Contributors - - - - - - - -Deferred benefits - - - - 3 3 3 3 Pensioners 2 2 - - 39 38 41 40 Pensions fully commuted - - - - 2 2 2 2 Totals 2 2 - - 44 43 46 45
Accrued liability
Superannuation position for AASB119 purposes
(437)
2012 $000
(339)
2011 $000
-
2012 $000
-
2011 $000
(32024)
2012 $000
(23303)
2011 $000
(32461)
2012 $000
(23642)
2011 $000
Estimate reserve account balance 193 269 282 279 20411 21893 20886 22441 Sub-total
Future Service Liability (Note 1) Surplus in excess of recovery available from Schemes Net asset I (liability) to be recognised in statement of financial position
(244)
-
-
(244)
(70)
-
-
(70)
282
-
-
282
279
-
-
279
(11613)
-
-
(11613)
(1410)
-
-
(1410)
(11575)
-
-
(11575)
(1201)
-
-
(1201)
Note 1 The Future Service Liability (FSL) does not have to be recognised by an employer It is only used to determine if an asset ceiling limit should be imposed (AASB 119 para 58) Under AASB 119 any prepaid superannuation asset recognised cannot exceed the total of any unrecognised past service cost and the present value of any economic benefits that may be available in the form of refunds from the plan or reductions in future contributions to the plan Where the surplus in excess of recovery is zero no asset ceiling limit is imposed
As is set out above at 30 June 2012 Residual Business Management Corporation had a gross calculated defined benefit superannuation liability with respect of former employees of $32461163 (2011 23641751 ) Superannuation funds invested to cover this liability amounted to $20886294 (2011 $22440728) The aforementioned superannuation liability and surplus position has been calculated by an independent and qualified actuary The calculated deficiency of invested funds versus the anticipated superannuation liabilities at 30 June 2012 was a balance of $11574869 (2011 $1201023) The parent entity with the support ofNSW Treasury believes that it has sufficient funds to cover this deficiency
39
RESIDUAL BUSINESS MANAGEMENT CORPORATION GROUP
NOTES TO THE FINANCIAL STATEMENTS for Year Ended 30 June 2012
Note 27 - Superannuation information (continued)
(b) Superannuation obligations (continued)
Th T f h t ee reconcr ration o t e present va ue of h defimed b enefirt o blrgatrons rs as flo11ows For the year ended 30 June 2012
Consolidated (Being the Parent Entity) SASS SANCS SSS $000 $000 $000
Present value ofpartly funded defined benefit obligation at beginning of the year (339) - (23303) Current service cost - - -Interest cost (17) - (I 199) Contributions by fund participants - - -Actuarial gains (losses) (157) 3 (8995) Benefits paid 76 (3) 1473 Past service cost - - -Curtailments - - -Settlements - - -Business Combinations - - -Exchange rate changes - - -Present value of partly funded defined benefit obliations at end of the year (437) - (32024)
Total Total 2012 2011
$000 $000
(23642) (23686) - -
(1216) (I 194) - -
(9149) 141 1546 1097
- -- -- -- -- -
(32461) (23642)
The reconciliation of the fair value offund assets is as follows
For the year ended 30 June 2012 Total Total Consolidated (Being the Parent Entity) SASS SAN CS SSS 2012 2011
$000 $000 $000 $000 $000 Fair value of fund assets at beginning of the year 269 279 21893 22441 21738 Expected (loss) I return on fund assets 22 24 1832 1878 1819 Actuarial (losses) I gains (22) (24) (1841) (1887) (19) Employer contributions - - - - -Contributions by fund participants - - - - -Benefits paid (76) 3 (1473) (1546) (l097) Settlements - - - - -Business combinations - - - - -Exchange rate changes - - - - -Fair value of fund assets at end of the year 193 282 20411 20886 22441
The reconciliation of the assets and liabilities recognised in the statement of financial position is follows
Total Consolidated (Being the Parent Entity)
TotalFor the year ended 30 June 2012 2012
$000 SAN CS SASS SSS
$000 Present value ofpartly funded defined benefit obligations at end of the year
$000 $000 $000
(32461) (23642) Fair value of fund assets at end of year
(437) (32024)-22441
Subtotal 20886282 20411193
(1201) Unrecognised past service cost
(11575)(244) (11613)282 - - - --
Unrecognised gain(loss) --- --Adjustment for limitation on net assets -- -- -Net asset I (liability) recognised in the statement of financial position at end of year (l201)(11575)(244) (11613)282
40
2011
RESIDUAL BUSINESS MANAGEMENT CORPORATION GROUP
NOTES TO THE FINANCIAL STATEMENTS for Year Ended 30 June 2012
Note 27 - Superannuation information (continued)
(b) Superannuation obligations (continued)
For the year ended 30 June 2012
2012 Consolidated (Being the Parent Entity) SASS SANCS SSS Total Components recognised in profit or loss by component $000 $000 $000 $000 Current service cost - - - -Interest cost (17) - (1199) (1216) Expected return on fund assets (net of expenses) 22 24 1832 1878 Past service cost - - - -Movement in adjustment for limitation on net asset - - - -Curtailment or settlement gain(loss) - - - -Total included in Other income in the statement of 5 24 633 662 comprehensive income (refer also note 2(b))
For the year ended 30 June 2012
2012 Consolidated (Being the Parent Entity) SASS SAN CS SSS Total Components recognised in other comprehensive income $000 $000 $000 $000 Actuarial (losses) I gains recognised in year (179) (21) (10836) (11036)
2011 Total $000
-(1194)
1819 ---
625
2011 Total $000
122
Cumulative amount recognised in other comprehensive income
The cumulative amount of actuarial gains and losses since 1 July 2005 recognised in other comprehensive income is an accumulated loss of $14221000 (2011 accumulated loss of $3185000) Before 1 July 2005 RBMC treated the defined benefit superannuation funds as separate entities and so recognised no superannuation balances in other comprehensive income
(c) Superannuation obligations - actuarial loses outside the statement of comprehensive income
Amounts not recognised in the statement of comprehensive income and expenses are as follows
For the year ended 30 June 2012
Consolidated (Being the Parent Entity) SASS SAN CS SSS 2012
Total 2011 Total
$000 $000 $000 $000 $000 Actuarial (losses) - - - - -Adjustment for limit on net asset - - - - -Total loss not reco2nised in the income statement - - - - -
41
RESIDUAL BUSINESS MANAGEMENT CORPORATION GROUP
NOTES TO THE FINANCIAL STATEMENTS for Year Ended 30 June 2012
Note 27 - Superannuation information (continued)
(d) Superannuation asset classes
The percentage invested in each asset class at the balance sheet date
Consolidated (Being the Parent Entity) 30 June 2012 30 June 2011 Australian equities 280 334 Overseas equities 237 295 Australian fixed interest securities 49 57 Overseas fixed interest securities 24 31 Property 86 99 Cash 195 51 Other 129 133
All Fund assets are invested by SAS Trustee Corporation (STC) at arms length through independent fund managers
Other superannuation provision information related to AASB 119 is disclosed at Note 28
AASB 119 requires organisations to provide detailed narrative information regarding the key economic and demographic assumptions underlying the reported defined benefits superannuation account balances The assumptions and calculations are generic to all NSW Government agencies and they are set out in Note 28
Note 28 - AASB 119 Superannuation information valuation method and principal actuarial assumptions
The followings are the superannuation asset and liability assumptions and calculations generic to all NSW Government agencies
The expected rate of return on assets assumption is determined by weighting the expected long-term return for each asset class by the target allocation of assets to each class The returns used for each class are net of investment tax and investment fees
Actual return on Scheme assets are as follows
For the year ended 30 June 2012 Consolidated (Being the Parent Entity) SASS SANCS SSS Total
$000 $000 $000 $000 Actual loss I (return) on fund assets (1) - 9 8
(a) Valuation Method
The Projected Unit Credit (PUC) valuation method was used to determine the present value of the defined benefit obligations and the related current service costs This method sees each period of service as giving rise to an additional unit of benefit entitlement and measures each unit separately to build up the final obligation
42
RESIDUAL BUSINESS MANAGEMENT CORPORATION GROUP
NOTES TO THE FINANCIAL STATEMENTS for Year Ended 30 June 2012
Note 28 - AASB 119 Superannuation information valuation method and principal actuarial assumptions (continued)
(b) Economic assumptions
Consolidated (Being the Parent Entity) 30 June 2012 30 June 2011
Salary increase rate (excluding promotional increases) 25 pa 35 pa
Rate ofCPI increase 25 pa 25pa
Expected rate of return on assets backing pension liabilities 860 pa 860pa
Expected rate ofretum on assets backing other liabilities 860 pa 860pa
Discount rate 306 pa 528pa
(c) Demographic assumptions
The demographic assumptions underlying the calculated actuarial balances of the RBMC Superannuation Schemes are generic to all NSW Government agencies and further details can be obtained from the NSW Treasury website
(d) Historical information
For the year ended 3 0 June 2012 Consolidated (Being the Parent Entity) SASS SANCS SSS Total
$000 $000 $000 $000 Present value ofdefined benefit obligation (437) - (32024) (32461) Fair value of fund assets 193 282 20411 20886 Surplus(Deficit) in fund (244) 282 (11613) (11575) Experience adjustments - liabilities (157) 3 (8995) (9149) Experience adjustments - assets (22) (23) (1841) (1886)
For the year ended 30 June 2011 Consolidated (Being the Parent Entity) SASS SANCS SSS Total
$000 $000 $000 $000 Present value of defined benefit obligation (339) - (23303) (23642) Fair value of fund assets 269 279 21893 22441 Surplus(Deficit) in fund (70) 279 (1410) (1201) Experience adjustments - liabilities 12 (6) 135 141 Experience adjustments - assets - (1) (18) (19)
For the year ended 30 June 2010 Consolidated (Being the Parent Entity) SASS SAN CS SSS Total
$000 $000 $000 $000 Present value of defined benefit obligation (344) - (23342) (23686) Fair value of fund assets 258 263 21217 21738 Surplus in fund (86) 263 (2125) (1948) Experience adjustments - liabilities (8) (3) (1079) (1090) Experience adjustments - assets 2 1 133 136
43
RESIDUAL BUSINESS MANAGEMENT CORPORATION GROUP
NOTES TO THE FINANCIAL STATEMENTS for Year Ended 30 June 2012
Note 28 - AASB 119 Superannuation information valuation method and principal actuarial assumptions (continued)
(d) Historical information (continued)
For the year ended 30 June 2009 Consolidated (Being the Parent Entity) SASS SAN CS SSS Total
$000 $000 $000 $000 Present value of defined benefit obligation (336) - (21959) (22295) Fair value of fund assets 254 244 20292 20790 Surplus in fund (83) 244 (1666) (1505) Experience adjustments - liabilities (65) 15 (3875) (3925) Experience adjustments - assets (55) (48) (4259) (4362)
For the year ended 30 June 2008 Consolidated (Being the Parent Entity) SASS SAN CS SSS Total
$000 $000 $000 $000 Present value of defined benefit obligation (283) - (18313) (18596) Fair value of fund assets 313 256 24045 24614 Surplus in fund 30 256 5732 6018 Experience adjustments - liabilities 3 111 2119 2233 Experience adjustments - assets 16 (76) (5316) (5376)
(e) Expected contributions
For the year ended 30 June 2012 SASS SAN CS SSS Total $000 $000 $000 $000
Expected employer contributions to be paid in the next reporting period - - - -
(f) Funding arrangements for employer contributions
i Surplus I deficit
The following is a summary of the 30 June 2012 financial position of the Schemes calculated in accordance with AAS 25 Financial Reporting by Superannuation Plans
For the year ended 30 June 2012
Consolidated (Being the Parent Entity) SASS SANCS SSS Total 2012
Total 2011
$000 $000 $000 $000 $000 Accrued benefits (256) - (17086) (17342) (16841) Net market value of Fund assets 193 283 20410 20886 22441 Total net surplus( deficiency) (63) 283 3324 3544 5600
44
RESIDUAL BUSINESS MANAGEMENT CORPORATION GROUP
NOTES TO THE FINANCIAL STATEMENTS for Year Ended 30 June 2012
Note 28 - AASB 119 Superannuation information valuation method and principal actuarial assumptions (continued)
(f) Funding arrangements for employer contributions (continued)
ii Contribution recommendations
The recommended contribution rates are as follows For the year ended 30 June 2012
Consolidated (Being the Parent Entity)
SASS SANCS SSS
Multiple of member contributions member salary Multiple ofmember contributions 000 000 000
iii Funding method
Contribution rates are set after discussions between the employer STC and NSW Treasury
iv Economic assumptions
The economic assumptions adopted for the current actuarial review of the Fund are
Weighted-average assumptions 2012 2011
Expected rate ofretum on Fund assets backing current pension liabilities 83 pa 83pa
Expected rate of return on Fund assets backing other liabilities 73 pa 73pa
Expected salary increase rate 40 pa 40pa
Expected rate of CPI increase 25 pa 25pa
(g) Nature of asset I (liability)
If a surplus exists in the employers interest in the Fund the employer may be able to take advantage of it in the form of a reduction in the required contribution rate depending on the advice of the Funds actuary
Where a deficiency exists the employer is responsible for any difference between the employers share of Fund assets and the defined benefit obligation
Note 29 - Events occurring after reporting date
The services of Mr Andrew d Apice the former General Manager of the RBMC Group were finalised on 31 August 2012 Mr Dominic Schuster of NSW Treasury was then appointed as his replacement effective 1 September 2012
There were no other matters or circumstances that have arisen since the end of the financial year which significantly affected or may significantly affect the operations of the Group the results of those operations or the state of affairs of the Group in future years
End of audited financial statements
45
RESIDUAL BUSINESS MANAGEMENT CORPORATION
FINANCIAL STATEMENTS FOR THE YEAR ENDED 30 JUNE 2012
STATEMENT BY CHIEF EXECUTIVE OFFICER
RESIDUAL BUSINESS MANAGERMENT CORPORATION
Pursuant to Section 41C of the Public Finance and Audit Act 1983 I state that in my opinion
The accompanying financial statements and notes thereto exhibit a true and fair view of the financial
position of the Residual Business Management Corporation (RBMC) as at 30 June 2012 and the
financial performance for the year then ended
The financial statements have been prepared in accordance with the provisions of applicable
Australian Accounting Standards (which include Australian Accounting Interpretations) the
requirements of the Public Finance and Audit Act 1983 applicable clauses of the Public Finance and
Audit Regulation 2010 the requirements of the Financial Reporting Directions published in the
Financial Reporting Code for NSW General Government Sector Entities and the Treasurers
Directions
Further I am not aware of any circumstances which would render any particulars included in the
financial statements to be misleading or inaccurate
On behalf of the Corporation
Dominic Schuster
General Manager
Residual Business Management Corporation
Dated 6 May 2014 at Sydney
INDEPENDENT AUDITORS REPORT
Residual Business Management Corporation
To Members of the New South Wales Parliament
I have audited the accompanying financial statements of Residual Business Management Corporation (the Corporation) which comprise the statements of financial position as at 30 June 2012 the statements of comprehensive income the statements of changes in equity and the statements of cash flows for the year then ended notes comprising a summary of significant accounting policies and other explanatory information of the Corporation and the consolidated entity The consolidated entity comprises the Corporation and the entities it controlled at the year end or from time to time during the financial year
Opinion
In my opinion the financial statements
give a true and fair view of the financial position of the Corporation and the consolidated entity as at 30 June 2012 and of their financial performance and cash flows for the year then ended in accordance with Australian Accounting Standards
bull are in accordance with section 41B of Public Finance and Audit Act 1983 (the PFampA Act) and the Public Finance and Audit Regulation 2010
My opinion should be read in conjunction with the rest of this report
The General Managers Responsibility for the Financial Statements
The General Manager is responsible for the preparation of the financial statements that give a true and fair view in accordance with Australian Accounting Standards and the PFampA Act and for such internal control as the General Manager determines is necessary to enable the preparation of the financial statements that are free from material misstatement whether due to fraud or error
Auditors Responsibility
My responsibility is to express an opinion on the financial statements based on my audit I conducted my audit in accordance with Australian Auditing Standards Those standards require that I comply with relevant ethical requirements relating to audit engagements and plan and perform the audit to obtain reasonable assurance about whether the financial statements are free from material misstatement
An audit involves performing procedures to obtain audit evidence about the amounts and disclosures in the financial statements The procedures selected depend on the auditors judgement including the assessment of the risks of material misstatement of the financial statements whether due to fraud or error In making those risk assessments the auditor considers internal controls relevant to the entitys preparation of the financial statements that give a true and fair view in order to design audit procedures that are appropriate in the circumstances but not for the purpose of expressing an opinion on the effectiveness of the entitys internal control An audit also includes evaluating the appropriateness of accounting policies used and the reasonableness of accounting estimates made by the General Manager as well as evaluating the overall presentation of the financial statements
I believe the audit evidence I have obtained is sufficient and appropriate to provide a basis for my audit opinion
My opinion does not provide assurance
bull about the future viability of the Corporation or consolidated entity
bull that they have carried out their activities effectively efficiently and economically
bull about the effectiveness of internal control
bull about the security and controls over the electronic publication of the audited financial statements on any website where they may be presented
bull about any other information that may have been hyperlinked tofrom the financial statements
Independence
In conducting my audit I have complied with the independence requirements of the Australian Auditing Standards and other relevant ethical pronouncements The PFampA Act further promotes independence by
bull providing that only Parliament and not the executive government can remove an Auditor-General
bull mandating the Auditor-General as auditor of public sector agencies but precluding the provision of non-audit services thus ensuring the Auditor-General and the Audit Office of New South Wales are not compromised in their role by the possibility of losing clients or income
1~k Kheir Director Financial Audit Services
19May2014 SYDNEY
- Structure Bookmarks
-
- Figure
- Figure
- Financial Instrument Class Table A Consolidated I Parent Note Category (a) Financial assets Cash and deposits 6 Cash T Corp Hour-Glass cash facility 7 Cash trust Receivables -non-current 10 Trade receivables (at amortised cost) Receivables -current 8 Other receivables (at amortised cost) Total financial assets (b) Financial liabilities Payables 14 Trade and accruals measured at amortised cost Total financial liabilities Net financial assets Total 2012 2011 $000 $000 1041 1500 10240 12075 -7 26 49 1130
- For the year ended 30 June 2012 Consolidated (Being the Parent Entity) SASS SANCS SSS $000 $000 $000 Present value ofpartly funded defined benefit obligation at beginning ofthe year (339) -(23303) Current service cost ---Interest cost (17) -(I199) Contributions by fund participants ---Actuarial gains (losses) (157) 3 (8995) Benefits paid 76 (3) 1473 Past service cost ---Curtailments ---Settlements ---Business Combinations ---Exchange rate changes ---Present value of partly funded defined benefit obl
- For the year ended 30 June 2012 2012 Consolidated (Being the Parent Entity) SASS SANCS SSS Total Components recognised in profit or loss by component $000 $000 $000 $000 Current service cost ----Interest cost (17) -(1199) (1216) Expected return on fund assets (net ofexpenses) 22 24 1832 1878 Past service cost ----Movement in adjustment for limitation on net asset ----Curtailment or settlement gain(loss) ----Total included in Other income in the statement of 5 24 633 662 comprehensive income (refe
- Figure
- Figure
- 1~kKheir
-
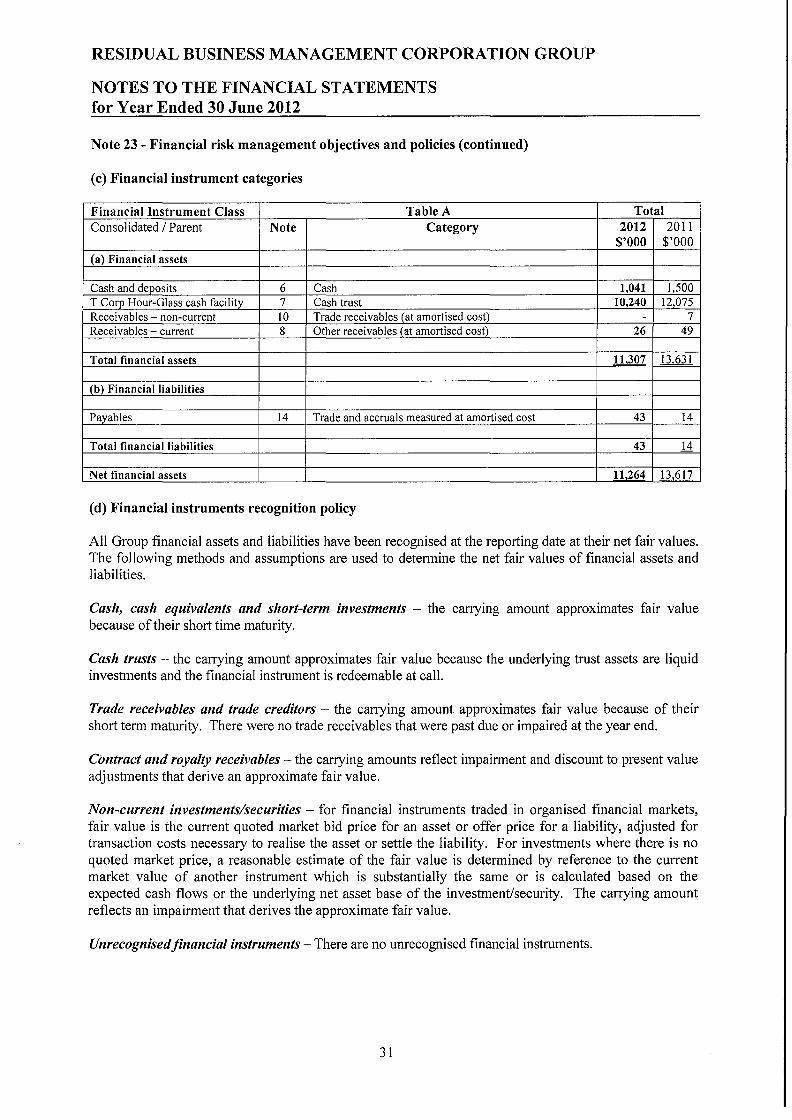
RESIDUAL BUSINESS MANAGEMENT CORPORATION GROUP
NOTES TO THE FINANCIAL STATEMENTS for Year Ended 30 June 2012
Note 23 - Financial risk management objectives and policies (continued)
(e) Interest rate risk (continued)
TCorp Hour-Glass facilities (continued)
The Groups term deposit cash investment sensitivity rates are similar As follows is the Groups judgement of reasonable possible movements in profits due to foreseeable changes in interest rates
(f) Credit risk
Credit Risk is the risk of financial loss arising to the Group from the default of another party with a contract or financial position with the Group The Group has material credit risk exposure to the CSG Solar AG Group in that at reporting date the Group has gross royalty rights receivable over time from CSG Solar AG Group of a least $332438395 (2011 $8 17197928) The table below states these gross receipts at their recoverable amount discounted to present value which is Nil (2011 $Nil) these written down values being the balances reflected in these financial statements These royalty rights are not past due but they are considered fully impaired Group policy is that all customers that wish to trade on credit terms are subject to a credit worthiness review
The Groups maximum exposure to credit risk and the applicable counter party is represented by the carrying amounts of its financial assets at reporting date as is set out in the following table (There was no past due balances at 30 June 2012)
Table C Financial
Instrument
Government Institutions
Australian Banks
CSG Solar AG Group
Other Commercial
entities Total
Consolidated 2012 $000
2011 $000
2012 $000
2011 $000
2012 $000
2011 $000
2012 $000
2011 $000
2012 $000
2011 $000
(a) Financial assets Cash and deposits - - 1041 1500 - - - - 1041 1500
Cash trust 10240 12075 - - - - - - 10240 12075 Trade receivables
amp other - - - - - - 26 49 26 49 Royalty rights
Impairment - - - -3324
(3324) 8172
(8172) --
--
3324 (3324)
8172 (8 172)
Net Rovalty - - - - - - - - - -Unlisted shares
Impairment --
--
--
--
--
10 (10)
--
--
--
10 (10)
Net unlisted shares - - - - - - - - - -Total 10240 12075 1041 1500 - - 26 49 11307 13624
35
RESIDUAL BUSINESS MANAGEMENT CORPORATION GROUP
NOTES TO THE FINANCIAL STATEMENTS for Year Ended 30 June 2012
Note 23 - Financial risk management objectives and policies (continued)
(g) Liquidity risk
Liquidity risk arises from the financial liabilities of the Group and the Groups subsequent ability to meet the obligations to repay the liabilities as and when they fall due As is disclosed above the Group maintains a high level of cash reserves to cover its material credit and warranty risks The Group has ongoing administrative costs require ongoing funding The following table provides the maturity dates of the Groups financial liabilities by bands
Table D
Maturity Bands
Financial liabilities
Trade creditors
Other creditors
Total financial liabilities
2012 2012 2011 2012 2011 more 2011 2012 2011 less less more more than 2 more More More
than than than 1 than 1 less than 2 than than one one less than less than than 5 less than 5 5 2012 2011 year year 2 years 2 years years 5 years years years Total Total $000 $000 $000 $000 $000 $000 $000 $000 $000 $000
25 12 - - - - - - 25 12
18 2 - - - - - - 18 2
43 14 - - - - - - 43 14
(h) Foreign currency risk
At the present time the Group has no material exposure to foreign currency risk The Groups above mentioned royalty rights are payable in Australian dollars
(i) Derivative financial instruments
During the financial year ending 30 June 2012 neither Residual Business Management Corporation nor any of its controlled entities had any known exposure to derivatives
36
RESIDUAL BUSINESS MANAGEMENT CORPORATION GROUP
NOTES TO THE FINANCIAL STATEMENTS for Year Ended 30 June 2012
Note 24-Retained earnings Note
Consolidated
2012 2011 $000 $000
Parent Entity
2012 2011 $000 $000
Balance at beginning of the financial year Owners of the parent comprehensive income (loss) Superannuation actuarial (losses) I gains Dividend paid or declared Balance at the end of the year
3(b) 27(c)
11909 816
(11036) 2000
(311
12059 728 122
(1000) 11909
11909 816
(11036) 2000
(311
1104 11683
122 (1000) 11909
Note 25 shy Non-controlling interests
As at 30 June 2011 the parent entity held an equity interest of 59 in Pacific Solar Pty Limited On 24 February 2012 a share buyback was approved by all minority shareholders for all of their Pacific Solar Pty Limited shares Thus on this date Pacific Solar became a fully owned subsidiary of RBMC Pacific Solar was then deregistered as a solvent entity on 9 May 2012 The buyback was based on a mid-point minority interest discount of 20 for the shares held by the following shareholders
Enipower SpA University ofNSW New South Innovations Pty Limited Thi An Dinh Morgan Michael Green Briana Keagan Green and Michelle Gaye Wenham
Reconciliation of non-controlling interest in RBMCs consolidated equity Non-controlling interest
2012 2011 $000 $000
Non-controlling interest in Pacific Solar share capital 36364 Non-controlling interests share ofretained (losses) at the end of the year (35836 Non-controlling interest in RBMCs consolidated equity 528
Note 26 - New Australian Accountings Standards issued but not effective
In the current year the Group has adopted all of the new and revised Standards and Interpretations issued by the AASB that are relevant to the operations and effective for the current reporting period Details of the impact of the adoption of these new accounting standards are set out in the individual accounting policies notes in the financial statements Certain new accounting standards and interpretations have been published that are not mandatory for the 30 June 2012 reporting period The Group did not early adopt any new accounting standards that are not yet effective The Group has assessed the impact of the new standards and interpretations on issue but not effective and considers the impact to be insignificant
37
RESIDUAL BUSINESS MANAGEMENT CORPORATION GROUP
NOTES TO THE FINANCIAL STATEMENTS for Year Ended 30 June 2012
Note 27 - Superannuation information
(a) Superannuation income recognition policy
In 2012 the Group recognises the net total of the following amounts in profit or loss
Current service cost is the increase in the present value of the defined benefit obligation resulting from employee service in the current period Interest cost is the increase in the present value of the defined benefit obligation which arises because the benefits are one period closer to settlement Expected return on plan assets is based on market expectations at the beginning of the period for returns over the life of the related obligation and on any reimbursement rights Past service cost (to the extent required to be recognised) is the increase in the defined benefit obligation from changes to post-employment benefits relating to employee service in prior periods and Curtailments or settlements are amendments to the terms of the plan andor number of employees covered by the plan
The Group recognises defined benefit actuarial superannuation gains and losses in other comprehensive income
(b) Superannuation obligations
All former employees were entitled to varying levels of benefits on retirement disability or death The superannuation plans (State Superannuation Scheme (SSS) State Authorities Superannuation Scheme (SASS) and State Authorities Non-Contributory Superannuation Scheme (SANCS) provide defined benefits based on years of service and final average salary Employees contributed to the plans and the contribution of the parent entity was and remains legally enforceable All Schemes are closed to new members
Note (b) continues on the following page
38
RESIDUAL BUSINESS MANAGEMENT CORPORATION GROUP
NOTES TO THE FINANCIAL STATEMENTS for Year Ended 30 June 2012
Note 27 - Superannuation information (continued)
(b) Superannuation obligations (continued)
The following is the superannuation position of the Group as at 30 June 2012 The superannuation assets and liabilities recognised in the statement of financial position are listed at the bottom of the table
Consolidated (Being The Parent Entity)
2012 2011 2012 2011 2012 2011 2012 2011 Member numbers
SASS SANCS SSS Total
Contributors - - - - - - - -Deferred benefits - - - - 3 3 3 3 Pensioners 2 2 - - 39 38 41 40 Pensions fully commuted - - - - 2 2 2 2 Totals 2 2 - - 44 43 46 45
Accrued liability
Superannuation position for AASB119 purposes
(437)
2012 $000
(339)
2011 $000
-
2012 $000
-
2011 $000
(32024)
2012 $000
(23303)
2011 $000
(32461)
2012 $000
(23642)
2011 $000
Estimate reserve account balance 193 269 282 279 20411 21893 20886 22441 Sub-total
Future Service Liability (Note 1) Surplus in excess of recovery available from Schemes Net asset I (liability) to be recognised in statement of financial position
(244)
-
-
(244)
(70)
-
-
(70)
282
-
-
282
279
-
-
279
(11613)
-
-
(11613)
(1410)
-
-
(1410)
(11575)
-
-
(11575)
(1201)
-
-
(1201)
Note 1 The Future Service Liability (FSL) does not have to be recognised by an employer It is only used to determine if an asset ceiling limit should be imposed (AASB 119 para 58) Under AASB 119 any prepaid superannuation asset recognised cannot exceed the total of any unrecognised past service cost and the present value of any economic benefits that may be available in the form of refunds from the plan or reductions in future contributions to the plan Where the surplus in excess of recovery is zero no asset ceiling limit is imposed
As is set out above at 30 June 2012 Residual Business Management Corporation had a gross calculated defined benefit superannuation liability with respect of former employees of $32461163 (2011 23641751 ) Superannuation funds invested to cover this liability amounted to $20886294 (2011 $22440728) The aforementioned superannuation liability and surplus position has been calculated by an independent and qualified actuary The calculated deficiency of invested funds versus the anticipated superannuation liabilities at 30 June 2012 was a balance of $11574869 (2011 $1201023) The parent entity with the support ofNSW Treasury believes that it has sufficient funds to cover this deficiency
39
RESIDUAL BUSINESS MANAGEMENT CORPORATION GROUP
NOTES TO THE FINANCIAL STATEMENTS for Year Ended 30 June 2012
Note 27 - Superannuation information (continued)
(b) Superannuation obligations (continued)
Th T f h t ee reconcr ration o t e present va ue of h defimed b enefirt o blrgatrons rs as flo11ows For the year ended 30 June 2012
Consolidated (Being the Parent Entity) SASS SANCS SSS $000 $000 $000
Present value ofpartly funded defined benefit obligation at beginning of the year (339) - (23303) Current service cost - - -Interest cost (17) - (I 199) Contributions by fund participants - - -Actuarial gains (losses) (157) 3 (8995) Benefits paid 76 (3) 1473 Past service cost - - -Curtailments - - -Settlements - - -Business Combinations - - -Exchange rate changes - - -Present value of partly funded defined benefit obliations at end of the year (437) - (32024)
Total Total 2012 2011
$000 $000
(23642) (23686) - -
(1216) (I 194) - -
(9149) 141 1546 1097
- -- -- -- -- -
(32461) (23642)
The reconciliation of the fair value offund assets is as follows
For the year ended 30 June 2012 Total Total Consolidated (Being the Parent Entity) SASS SAN CS SSS 2012 2011
$000 $000 $000 $000 $000 Fair value of fund assets at beginning of the year 269 279 21893 22441 21738 Expected (loss) I return on fund assets 22 24 1832 1878 1819 Actuarial (losses) I gains (22) (24) (1841) (1887) (19) Employer contributions - - - - -Contributions by fund participants - - - - -Benefits paid (76) 3 (1473) (1546) (l097) Settlements - - - - -Business combinations - - - - -Exchange rate changes - - - - -Fair value of fund assets at end of the year 193 282 20411 20886 22441
The reconciliation of the assets and liabilities recognised in the statement of financial position is follows
Total Consolidated (Being the Parent Entity)
TotalFor the year ended 30 June 2012 2012
$000 SAN CS SASS SSS
$000 Present value ofpartly funded defined benefit obligations at end of the year
$000 $000 $000
(32461) (23642) Fair value of fund assets at end of year
(437) (32024)-22441
Subtotal 20886282 20411193
(1201) Unrecognised past service cost
(11575)(244) (11613)282 - - - --
Unrecognised gain(loss) --- --Adjustment for limitation on net assets -- -- -Net asset I (liability) recognised in the statement of financial position at end of year (l201)(11575)(244) (11613)282
40
2011
RESIDUAL BUSINESS MANAGEMENT CORPORATION GROUP
NOTES TO THE FINANCIAL STATEMENTS for Year Ended 30 June 2012
Note 27 - Superannuation information (continued)
(b) Superannuation obligations (continued)
For the year ended 30 June 2012
2012 Consolidated (Being the Parent Entity) SASS SANCS SSS Total Components recognised in profit or loss by component $000 $000 $000 $000 Current service cost - - - -Interest cost (17) - (1199) (1216) Expected return on fund assets (net of expenses) 22 24 1832 1878 Past service cost - - - -Movement in adjustment for limitation on net asset - - - -Curtailment or settlement gain(loss) - - - -Total included in Other income in the statement of 5 24 633 662 comprehensive income (refer also note 2(b))
For the year ended 30 June 2012
2012 Consolidated (Being the Parent Entity) SASS SAN CS SSS Total Components recognised in other comprehensive income $000 $000 $000 $000 Actuarial (losses) I gains recognised in year (179) (21) (10836) (11036)
2011 Total $000
-(1194)
1819 ---
625
2011 Total $000
122
Cumulative amount recognised in other comprehensive income
The cumulative amount of actuarial gains and losses since 1 July 2005 recognised in other comprehensive income is an accumulated loss of $14221000 (2011 accumulated loss of $3185000) Before 1 July 2005 RBMC treated the defined benefit superannuation funds as separate entities and so recognised no superannuation balances in other comprehensive income
(c) Superannuation obligations - actuarial loses outside the statement of comprehensive income
Amounts not recognised in the statement of comprehensive income and expenses are as follows
For the year ended 30 June 2012
Consolidated (Being the Parent Entity) SASS SAN CS SSS 2012
Total 2011 Total
$000 $000 $000 $000 $000 Actuarial (losses) - - - - -Adjustment for limit on net asset - - - - -Total loss not reco2nised in the income statement - - - - -
41
RESIDUAL BUSINESS MANAGEMENT CORPORATION GROUP
NOTES TO THE FINANCIAL STATEMENTS for Year Ended 30 June 2012
Note 27 - Superannuation information (continued)
(d) Superannuation asset classes
The percentage invested in each asset class at the balance sheet date
Consolidated (Being the Parent Entity) 30 June 2012 30 June 2011 Australian equities 280 334 Overseas equities 237 295 Australian fixed interest securities 49 57 Overseas fixed interest securities 24 31 Property 86 99 Cash 195 51 Other 129 133
All Fund assets are invested by SAS Trustee Corporation (STC) at arms length through independent fund managers
Other superannuation provision information related to AASB 119 is disclosed at Note 28
AASB 119 requires organisations to provide detailed narrative information regarding the key economic and demographic assumptions underlying the reported defined benefits superannuation account balances The assumptions and calculations are generic to all NSW Government agencies and they are set out in Note 28
Note 28 - AASB 119 Superannuation information valuation method and principal actuarial assumptions
The followings are the superannuation asset and liability assumptions and calculations generic to all NSW Government agencies
The expected rate of return on assets assumption is determined by weighting the expected long-term return for each asset class by the target allocation of assets to each class The returns used for each class are net of investment tax and investment fees
Actual return on Scheme assets are as follows
For the year ended 30 June 2012 Consolidated (Being the Parent Entity) SASS SANCS SSS Total
$000 $000 $000 $000 Actual loss I (return) on fund assets (1) - 9 8
(a) Valuation Method
The Projected Unit Credit (PUC) valuation method was used to determine the present value of the defined benefit obligations and the related current service costs This method sees each period of service as giving rise to an additional unit of benefit entitlement and measures each unit separately to build up the final obligation
42
RESIDUAL BUSINESS MANAGEMENT CORPORATION GROUP
NOTES TO THE FINANCIAL STATEMENTS for Year Ended 30 June 2012
Note 28 - AASB 119 Superannuation information valuation method and principal actuarial assumptions (continued)
(b) Economic assumptions
Consolidated (Being the Parent Entity) 30 June 2012 30 June 2011
Salary increase rate (excluding promotional increases) 25 pa 35 pa
Rate ofCPI increase 25 pa 25pa
Expected rate of return on assets backing pension liabilities 860 pa 860pa
Expected rate ofretum on assets backing other liabilities 860 pa 860pa
Discount rate 306 pa 528pa
(c) Demographic assumptions
The demographic assumptions underlying the calculated actuarial balances of the RBMC Superannuation Schemes are generic to all NSW Government agencies and further details can be obtained from the NSW Treasury website
(d) Historical information
For the year ended 3 0 June 2012 Consolidated (Being the Parent Entity) SASS SANCS SSS Total
$000 $000 $000 $000 Present value ofdefined benefit obligation (437) - (32024) (32461) Fair value of fund assets 193 282 20411 20886 Surplus(Deficit) in fund (244) 282 (11613) (11575) Experience adjustments - liabilities (157) 3 (8995) (9149) Experience adjustments - assets (22) (23) (1841) (1886)
For the year ended 30 June 2011 Consolidated (Being the Parent Entity) SASS SANCS SSS Total
$000 $000 $000 $000 Present value of defined benefit obligation (339) - (23303) (23642) Fair value of fund assets 269 279 21893 22441 Surplus(Deficit) in fund (70) 279 (1410) (1201) Experience adjustments - liabilities 12 (6) 135 141 Experience adjustments - assets - (1) (18) (19)
For the year ended 30 June 2010 Consolidated (Being the Parent Entity) SASS SAN CS SSS Total
$000 $000 $000 $000 Present value of defined benefit obligation (344) - (23342) (23686) Fair value of fund assets 258 263 21217 21738 Surplus in fund (86) 263 (2125) (1948) Experience adjustments - liabilities (8) (3) (1079) (1090) Experience adjustments - assets 2 1 133 136
43
RESIDUAL BUSINESS MANAGEMENT CORPORATION GROUP
NOTES TO THE FINANCIAL STATEMENTS for Year Ended 30 June 2012
Note 28 - AASB 119 Superannuation information valuation method and principal actuarial assumptions (continued)
(d) Historical information (continued)
For the year ended 30 June 2009 Consolidated (Being the Parent Entity) SASS SAN CS SSS Total
$000 $000 $000 $000 Present value of defined benefit obligation (336) - (21959) (22295) Fair value of fund assets 254 244 20292 20790 Surplus in fund (83) 244 (1666) (1505) Experience adjustments - liabilities (65) 15 (3875) (3925) Experience adjustments - assets (55) (48) (4259) (4362)
For the year ended 30 June 2008 Consolidated (Being the Parent Entity) SASS SAN CS SSS Total
$000 $000 $000 $000 Present value of defined benefit obligation (283) - (18313) (18596) Fair value of fund assets 313 256 24045 24614 Surplus in fund 30 256 5732 6018 Experience adjustments - liabilities 3 111 2119 2233 Experience adjustments - assets 16 (76) (5316) (5376)
(e) Expected contributions
For the year ended 30 June 2012 SASS SAN CS SSS Total $000 $000 $000 $000
Expected employer contributions to be paid in the next reporting period - - - -
(f) Funding arrangements for employer contributions
i Surplus I deficit
The following is a summary of the 30 June 2012 financial position of the Schemes calculated in accordance with AAS 25 Financial Reporting by Superannuation Plans
For the year ended 30 June 2012
Consolidated (Being the Parent Entity) SASS SANCS SSS Total 2012
Total 2011
$000 $000 $000 $000 $000 Accrued benefits (256) - (17086) (17342) (16841) Net market value of Fund assets 193 283 20410 20886 22441 Total net surplus( deficiency) (63) 283 3324 3544 5600
44
RESIDUAL BUSINESS MANAGEMENT CORPORATION GROUP
NOTES TO THE FINANCIAL STATEMENTS for Year Ended 30 June 2012
Note 28 - AASB 119 Superannuation information valuation method and principal actuarial assumptions (continued)
(f) Funding arrangements for employer contributions (continued)
ii Contribution recommendations
The recommended contribution rates are as follows For the year ended 30 June 2012
Consolidated (Being the Parent Entity)
SASS SANCS SSS
Multiple of member contributions member salary Multiple ofmember contributions 000 000 000
iii Funding method
Contribution rates are set after discussions between the employer STC and NSW Treasury
iv Economic assumptions
The economic assumptions adopted for the current actuarial review of the Fund are
Weighted-average assumptions 2012 2011
Expected rate ofretum on Fund assets backing current pension liabilities 83 pa 83pa
Expected rate of return on Fund assets backing other liabilities 73 pa 73pa
Expected salary increase rate 40 pa 40pa
Expected rate of CPI increase 25 pa 25pa
(g) Nature of asset I (liability)
If a surplus exists in the employers interest in the Fund the employer may be able to take advantage of it in the form of a reduction in the required contribution rate depending on the advice of the Funds actuary
Where a deficiency exists the employer is responsible for any difference between the employers share of Fund assets and the defined benefit obligation
Note 29 - Events occurring after reporting date
The services of Mr Andrew d Apice the former General Manager of the RBMC Group were finalised on 31 August 2012 Mr Dominic Schuster of NSW Treasury was then appointed as his replacement effective 1 September 2012
There were no other matters or circumstances that have arisen since the end of the financial year which significantly affected or may significantly affect the operations of the Group the results of those operations or the state of affairs of the Group in future years
End of audited financial statements
45
RESIDUAL BUSINESS MANAGEMENT CORPORATION
FINANCIAL STATEMENTS FOR THE YEAR ENDED 30 JUNE 2012
STATEMENT BY CHIEF EXECUTIVE OFFICER
RESIDUAL BUSINESS MANAGERMENT CORPORATION
Pursuant to Section 41C of the Public Finance and Audit Act 1983 I state that in my opinion
The accompanying financial statements and notes thereto exhibit a true and fair view of the financial
position of the Residual Business Management Corporation (RBMC) as at 30 June 2012 and the
financial performance for the year then ended
The financial statements have been prepared in accordance with the provisions of applicable
Australian Accounting Standards (which include Australian Accounting Interpretations) the
requirements of the Public Finance and Audit Act 1983 applicable clauses of the Public Finance and
Audit Regulation 2010 the requirements of the Financial Reporting Directions published in the
Financial Reporting Code for NSW General Government Sector Entities and the Treasurers
Directions
Further I am not aware of any circumstances which would render any particulars included in the
financial statements to be misleading or inaccurate
On behalf of the Corporation
Dominic Schuster
General Manager
Residual Business Management Corporation
Dated 6 May 2014 at Sydney
INDEPENDENT AUDITORS REPORT
Residual Business Management Corporation
To Members of the New South Wales Parliament
I have audited the accompanying financial statements of Residual Business Management Corporation (the Corporation) which comprise the statements of financial position as at 30 June 2012 the statements of comprehensive income the statements of changes in equity and the statements of cash flows for the year then ended notes comprising a summary of significant accounting policies and other explanatory information of the Corporation and the consolidated entity The consolidated entity comprises the Corporation and the entities it controlled at the year end or from time to time during the financial year
Opinion
In my opinion the financial statements
give a true and fair view of the financial position of the Corporation and the consolidated entity as at 30 June 2012 and of their financial performance and cash flows for the year then ended in accordance with Australian Accounting Standards
bull are in accordance with section 41B of Public Finance and Audit Act 1983 (the PFampA Act) and the Public Finance and Audit Regulation 2010
My opinion should be read in conjunction with the rest of this report
The General Managers Responsibility for the Financial Statements
The General Manager is responsible for the preparation of the financial statements that give a true and fair view in accordance with Australian Accounting Standards and the PFampA Act and for such internal control as the General Manager determines is necessary to enable the preparation of the financial statements that are free from material misstatement whether due to fraud or error
Auditors Responsibility
My responsibility is to express an opinion on the financial statements based on my audit I conducted my audit in accordance with Australian Auditing Standards Those standards require that I comply with relevant ethical requirements relating to audit engagements and plan and perform the audit to obtain reasonable assurance about whether the financial statements are free from material misstatement
An audit involves performing procedures to obtain audit evidence about the amounts and disclosures in the financial statements The procedures selected depend on the auditors judgement including the assessment of the risks of material misstatement of the financial statements whether due to fraud or error In making those risk assessments the auditor considers internal controls relevant to the entitys preparation of the financial statements that give a true and fair view in order to design audit procedures that are appropriate in the circumstances but not for the purpose of expressing an opinion on the effectiveness of the entitys internal control An audit also includes evaluating the appropriateness of accounting policies used and the reasonableness of accounting estimates made by the General Manager as well as evaluating the overall presentation of the financial statements
I believe the audit evidence I have obtained is sufficient and appropriate to provide a basis for my audit opinion
My opinion does not provide assurance
bull about the future viability of the Corporation or consolidated entity
bull that they have carried out their activities effectively efficiently and economically
bull about the effectiveness of internal control
bull about the security and controls over the electronic publication of the audited financial statements on any website where they may be presented
bull about any other information that may have been hyperlinked tofrom the financial statements
Independence
In conducting my audit I have complied with the independence requirements of the Australian Auditing Standards and other relevant ethical pronouncements The PFampA Act further promotes independence by
bull providing that only Parliament and not the executive government can remove an Auditor-General
bull mandating the Auditor-General as auditor of public sector agencies but precluding the provision of non-audit services thus ensuring the Auditor-General and the Audit Office of New South Wales are not compromised in their role by the possibility of losing clients or income
1~k Kheir Director Financial Audit Services
19May2014 SYDNEY
- Structure Bookmarks
-
- Figure
- Figure
- Financial Instrument Class Table A Consolidated I Parent Note Category (a) Financial assets Cash and deposits 6 Cash T Corp Hour-Glass cash facility 7 Cash trust Receivables -non-current 10 Trade receivables (at amortised cost) Receivables -current 8 Other receivables (at amortised cost) Total financial assets (b) Financial liabilities Payables 14 Trade and accruals measured at amortised cost Total financial liabilities Net financial assets Total 2012 2011 $000 $000 1041 1500 10240 12075 -7 26 49 1130
- For the year ended 30 June 2012 Consolidated (Being the Parent Entity) SASS SANCS SSS $000 $000 $000 Present value ofpartly funded defined benefit obligation at beginning ofthe year (339) -(23303) Current service cost ---Interest cost (17) -(I199) Contributions by fund participants ---Actuarial gains (losses) (157) 3 (8995) Benefits paid 76 (3) 1473 Past service cost ---Curtailments ---Settlements ---Business Combinations ---Exchange rate changes ---Present value of partly funded defined benefit obl
- For the year ended 30 June 2012 2012 Consolidated (Being the Parent Entity) SASS SANCS SSS Total Components recognised in profit or loss by component $000 $000 $000 $000 Current service cost ----Interest cost (17) -(1199) (1216) Expected return on fund assets (net ofexpenses) 22 24 1832 1878 Past service cost ----Movement in adjustment for limitation on net asset ----Curtailment or settlement gain(loss) ----Total included in Other income in the statement of 5 24 633 662 comprehensive income (refe
- Figure
- Figure
- 1~kKheir
-

RESIDUAL BUSINESS MANAGEMENT CORPORATION GROUP
NOTES TO THE FINANCIAL STATEMENTS for Year Ended 30 June 2012
Note 23 - Financial risk management objectives and policies (continued)
(g) Liquidity risk
Liquidity risk arises from the financial liabilities of the Group and the Groups subsequent ability to meet the obligations to repay the liabilities as and when they fall due As is disclosed above the Group maintains a high level of cash reserves to cover its material credit and warranty risks The Group has ongoing administrative costs require ongoing funding The following table provides the maturity dates of the Groups financial liabilities by bands
Table D
Maturity Bands
Financial liabilities
Trade creditors
Other creditors
Total financial liabilities
2012 2012 2011 2012 2011 more 2011 2012 2011 less less more more than 2 more More More
than than than 1 than 1 less than 2 than than one one less than less than than 5 less than 5 5 2012 2011 year year 2 years 2 years years 5 years years years Total Total $000 $000 $000 $000 $000 $000 $000 $000 $000 $000
25 12 - - - - - - 25 12
18 2 - - - - - - 18 2
43 14 - - - - - - 43 14
(h) Foreign currency risk
At the present time the Group has no material exposure to foreign currency risk The Groups above mentioned royalty rights are payable in Australian dollars
(i) Derivative financial instruments
During the financial year ending 30 June 2012 neither Residual Business Management Corporation nor any of its controlled entities had any known exposure to derivatives
36
RESIDUAL BUSINESS MANAGEMENT CORPORATION GROUP
NOTES TO THE FINANCIAL STATEMENTS for Year Ended 30 June 2012
Note 24-Retained earnings Note
Consolidated
2012 2011 $000 $000
Parent Entity
2012 2011 $000 $000
Balance at beginning of the financial year Owners of the parent comprehensive income (loss) Superannuation actuarial (losses) I gains Dividend paid or declared Balance at the end of the year
3(b) 27(c)
11909 816
(11036) 2000
(311
12059 728 122
(1000) 11909
11909 816
(11036) 2000
(311
1104 11683
122 (1000) 11909
Note 25 shy Non-controlling interests
As at 30 June 2011 the parent entity held an equity interest of 59 in Pacific Solar Pty Limited On 24 February 2012 a share buyback was approved by all minority shareholders for all of their Pacific Solar Pty Limited shares Thus on this date Pacific Solar became a fully owned subsidiary of RBMC Pacific Solar was then deregistered as a solvent entity on 9 May 2012 The buyback was based on a mid-point minority interest discount of 20 for the shares held by the following shareholders
Enipower SpA University ofNSW New South Innovations Pty Limited Thi An Dinh Morgan Michael Green Briana Keagan Green and Michelle Gaye Wenham
Reconciliation of non-controlling interest in RBMCs consolidated equity Non-controlling interest
2012 2011 $000 $000
Non-controlling interest in Pacific Solar share capital 36364 Non-controlling interests share ofretained (losses) at the end of the year (35836 Non-controlling interest in RBMCs consolidated equity 528
Note 26 - New Australian Accountings Standards issued but not effective
In the current year the Group has adopted all of the new and revised Standards and Interpretations issued by the AASB that are relevant to the operations and effective for the current reporting period Details of the impact of the adoption of these new accounting standards are set out in the individual accounting policies notes in the financial statements Certain new accounting standards and interpretations have been published that are not mandatory for the 30 June 2012 reporting period The Group did not early adopt any new accounting standards that are not yet effective The Group has assessed the impact of the new standards and interpretations on issue but not effective and considers the impact to be insignificant
37
RESIDUAL BUSINESS MANAGEMENT CORPORATION GROUP
NOTES TO THE FINANCIAL STATEMENTS for Year Ended 30 June 2012
Note 27 - Superannuation information
(a) Superannuation income recognition policy
In 2012 the Group recognises the net total of the following amounts in profit or loss
Current service cost is the increase in the present value of the defined benefit obligation resulting from employee service in the current period Interest cost is the increase in the present value of the defined benefit obligation which arises because the benefits are one period closer to settlement Expected return on plan assets is based on market expectations at the beginning of the period for returns over the life of the related obligation and on any reimbursement rights Past service cost (to the extent required to be recognised) is the increase in the defined benefit obligation from changes to post-employment benefits relating to employee service in prior periods and Curtailments or settlements are amendments to the terms of the plan andor number of employees covered by the plan
The Group recognises defined benefit actuarial superannuation gains and losses in other comprehensive income
(b) Superannuation obligations
All former employees were entitled to varying levels of benefits on retirement disability or death The superannuation plans (State Superannuation Scheme (SSS) State Authorities Superannuation Scheme (SASS) and State Authorities Non-Contributory Superannuation Scheme (SANCS) provide defined benefits based on years of service and final average salary Employees contributed to the plans and the contribution of the parent entity was and remains legally enforceable All Schemes are closed to new members
Note (b) continues on the following page
38
RESIDUAL BUSINESS MANAGEMENT CORPORATION GROUP
NOTES TO THE FINANCIAL STATEMENTS for Year Ended 30 June 2012
Note 27 - Superannuation information (continued)
(b) Superannuation obligations (continued)
The following is the superannuation position of the Group as at 30 June 2012 The superannuation assets and liabilities recognised in the statement of financial position are listed at the bottom of the table
Consolidated (Being The Parent Entity)
2012 2011 2012 2011 2012 2011 2012 2011 Member numbers
SASS SANCS SSS Total
Contributors - - - - - - - -Deferred benefits - - - - 3 3 3 3 Pensioners 2 2 - - 39 38 41 40 Pensions fully commuted - - - - 2 2 2 2 Totals 2 2 - - 44 43 46 45
Accrued liability
Superannuation position for AASB119 purposes
(437)
2012 $000
(339)
2011 $000
-
2012 $000
-
2011 $000
(32024)
2012 $000
(23303)
2011 $000
(32461)
2012 $000
(23642)
2011 $000
Estimate reserve account balance 193 269 282 279 20411 21893 20886 22441 Sub-total
Future Service Liability (Note 1) Surplus in excess of recovery available from Schemes Net asset I (liability) to be recognised in statement of financial position
(244)
-
-
(244)
(70)
-
-
(70)
282
-
-
282
279
-
-
279
(11613)
-
-
(11613)
(1410)
-
-
(1410)
(11575)
-
-
(11575)
(1201)
-
-
(1201)
Note 1 The Future Service Liability (FSL) does not have to be recognised by an employer It is only used to determine if an asset ceiling limit should be imposed (AASB 119 para 58) Under AASB 119 any prepaid superannuation asset recognised cannot exceed the total of any unrecognised past service cost and the present value of any economic benefits that may be available in the form of refunds from the plan or reductions in future contributions to the plan Where the surplus in excess of recovery is zero no asset ceiling limit is imposed
As is set out above at 30 June 2012 Residual Business Management Corporation had a gross calculated defined benefit superannuation liability with respect of former employees of $32461163 (2011 23641751 ) Superannuation funds invested to cover this liability amounted to $20886294 (2011 $22440728) The aforementioned superannuation liability and surplus position has been calculated by an independent and qualified actuary The calculated deficiency of invested funds versus the anticipated superannuation liabilities at 30 June 2012 was a balance of $11574869 (2011 $1201023) The parent entity with the support ofNSW Treasury believes that it has sufficient funds to cover this deficiency
39
RESIDUAL BUSINESS MANAGEMENT CORPORATION GROUP
NOTES TO THE FINANCIAL STATEMENTS for Year Ended 30 June 2012
Note 27 - Superannuation information (continued)
(b) Superannuation obligations (continued)
Th T f h t ee reconcr ration o t e present va ue of h defimed b enefirt o blrgatrons rs as flo11ows For the year ended 30 June 2012
Consolidated (Being the Parent Entity) SASS SANCS SSS $000 $000 $000
Present value ofpartly funded defined benefit obligation at beginning of the year (339) - (23303) Current service cost - - -Interest cost (17) - (I 199) Contributions by fund participants - - -Actuarial gains (losses) (157) 3 (8995) Benefits paid 76 (3) 1473 Past service cost - - -Curtailments - - -Settlements - - -Business Combinations - - -Exchange rate changes - - -Present value of partly funded defined benefit obliations at end of the year (437) - (32024)
Total Total 2012 2011
$000 $000
(23642) (23686) - -
(1216) (I 194) - -
(9149) 141 1546 1097
- -- -- -- -- -
(32461) (23642)
The reconciliation of the fair value offund assets is as follows
For the year ended 30 June 2012 Total Total Consolidated (Being the Parent Entity) SASS SAN CS SSS 2012 2011
$000 $000 $000 $000 $000 Fair value of fund assets at beginning of the year 269 279 21893 22441 21738 Expected (loss) I return on fund assets 22 24 1832 1878 1819 Actuarial (losses) I gains (22) (24) (1841) (1887) (19) Employer contributions - - - - -Contributions by fund participants - - - - -Benefits paid (76) 3 (1473) (1546) (l097) Settlements - - - - -Business combinations - - - - -Exchange rate changes - - - - -Fair value of fund assets at end of the year 193 282 20411 20886 22441
The reconciliation of the assets and liabilities recognised in the statement of financial position is follows
Total Consolidated (Being the Parent Entity)
TotalFor the year ended 30 June 2012 2012
$000 SAN CS SASS SSS
$000 Present value ofpartly funded defined benefit obligations at end of the year
$000 $000 $000
(32461) (23642) Fair value of fund assets at end of year
(437) (32024)-22441
Subtotal 20886282 20411193
(1201) Unrecognised past service cost
(11575)(244) (11613)282 - - - --
Unrecognised gain(loss) --- --Adjustment for limitation on net assets -- -- -Net asset I (liability) recognised in the statement of financial position at end of year (l201)(11575)(244) (11613)282
40
2011
RESIDUAL BUSINESS MANAGEMENT CORPORATION GROUP
NOTES TO THE FINANCIAL STATEMENTS for Year Ended 30 June 2012
Note 27 - Superannuation information (continued)
(b) Superannuation obligations (continued)
For the year ended 30 June 2012
2012 Consolidated (Being the Parent Entity) SASS SANCS SSS Total Components recognised in profit or loss by component $000 $000 $000 $000 Current service cost - - - -Interest cost (17) - (1199) (1216) Expected return on fund assets (net of expenses) 22 24 1832 1878 Past service cost - - - -Movement in adjustment for limitation on net asset - - - -Curtailment or settlement gain(loss) - - - -Total included in Other income in the statement of 5 24 633 662 comprehensive income (refer also note 2(b))
For the year ended 30 June 2012
2012 Consolidated (Being the Parent Entity) SASS SAN CS SSS Total Components recognised in other comprehensive income $000 $000 $000 $000 Actuarial (losses) I gains recognised in year (179) (21) (10836) (11036)
2011 Total $000
-(1194)
1819 ---
625
2011 Total $000
122
Cumulative amount recognised in other comprehensive income
The cumulative amount of actuarial gains and losses since 1 July 2005 recognised in other comprehensive income is an accumulated loss of $14221000 (2011 accumulated loss of $3185000) Before 1 July 2005 RBMC treated the defined benefit superannuation funds as separate entities and so recognised no superannuation balances in other comprehensive income
(c) Superannuation obligations - actuarial loses outside the statement of comprehensive income
Amounts not recognised in the statement of comprehensive income and expenses are as follows
For the year ended 30 June 2012
Consolidated (Being the Parent Entity) SASS SAN CS SSS 2012
Total 2011 Total
$000 $000 $000 $000 $000 Actuarial (losses) - - - - -Adjustment for limit on net asset - - - - -Total loss not reco2nised in the income statement - - - - -
41
RESIDUAL BUSINESS MANAGEMENT CORPORATION GROUP
NOTES TO THE FINANCIAL STATEMENTS for Year Ended 30 June 2012
Note 27 - Superannuation information (continued)
(d) Superannuation asset classes
The percentage invested in each asset class at the balance sheet date
Consolidated (Being the Parent Entity) 30 June 2012 30 June 2011 Australian equities 280 334 Overseas equities 237 295 Australian fixed interest securities 49 57 Overseas fixed interest securities 24 31 Property 86 99 Cash 195 51 Other 129 133
All Fund assets are invested by SAS Trustee Corporation (STC) at arms length through independent fund managers
Other superannuation provision information related to AASB 119 is disclosed at Note 28
AASB 119 requires organisations to provide detailed narrative information regarding the key economic and demographic assumptions underlying the reported defined benefits superannuation account balances The assumptions and calculations are generic to all NSW Government agencies and they are set out in Note 28
Note 28 - AASB 119 Superannuation information valuation method and principal actuarial assumptions
The followings are the superannuation asset and liability assumptions and calculations generic to all NSW Government agencies
The expected rate of return on assets assumption is determined by weighting the expected long-term return for each asset class by the target allocation of assets to each class The returns used for each class are net of investment tax and investment fees
Actual return on Scheme assets are as follows
For the year ended 30 June 2012 Consolidated (Being the Parent Entity) SASS SANCS SSS Total
$000 $000 $000 $000 Actual loss I (return) on fund assets (1) - 9 8
(a) Valuation Method
The Projected Unit Credit (PUC) valuation method was used to determine the present value of the defined benefit obligations and the related current service costs This method sees each period of service as giving rise to an additional unit of benefit entitlement and measures each unit separately to build up the final obligation
42
RESIDUAL BUSINESS MANAGEMENT CORPORATION GROUP
NOTES TO THE FINANCIAL STATEMENTS for Year Ended 30 June 2012
Note 28 - AASB 119 Superannuation information valuation method and principal actuarial assumptions (continued)
(b) Economic assumptions
Consolidated (Being the Parent Entity) 30 June 2012 30 June 2011
Salary increase rate (excluding promotional increases) 25 pa 35 pa
Rate ofCPI increase 25 pa 25pa
Expected rate of return on assets backing pension liabilities 860 pa 860pa
Expected rate ofretum on assets backing other liabilities 860 pa 860pa
Discount rate 306 pa 528pa
(c) Demographic assumptions
The demographic assumptions underlying the calculated actuarial balances of the RBMC Superannuation Schemes are generic to all NSW Government agencies and further details can be obtained from the NSW Treasury website
(d) Historical information
For the year ended 3 0 June 2012 Consolidated (Being the Parent Entity) SASS SANCS SSS Total
$000 $000 $000 $000 Present value ofdefined benefit obligation (437) - (32024) (32461) Fair value of fund assets 193 282 20411 20886 Surplus(Deficit) in fund (244) 282 (11613) (11575) Experience adjustments - liabilities (157) 3 (8995) (9149) Experience adjustments - assets (22) (23) (1841) (1886)
For the year ended 30 June 2011 Consolidated (Being the Parent Entity) SASS SANCS SSS Total
$000 $000 $000 $000 Present value of defined benefit obligation (339) - (23303) (23642) Fair value of fund assets 269 279 21893 22441 Surplus(Deficit) in fund (70) 279 (1410) (1201) Experience adjustments - liabilities 12 (6) 135 141 Experience adjustments - assets - (1) (18) (19)
For the year ended 30 June 2010 Consolidated (Being the Parent Entity) SASS SAN CS SSS Total
$000 $000 $000 $000 Present value of defined benefit obligation (344) - (23342) (23686) Fair value of fund assets 258 263 21217 21738 Surplus in fund (86) 263 (2125) (1948) Experience adjustments - liabilities (8) (3) (1079) (1090) Experience adjustments - assets 2 1 133 136
43
RESIDUAL BUSINESS MANAGEMENT CORPORATION GROUP
NOTES TO THE FINANCIAL STATEMENTS for Year Ended 30 June 2012
Note 28 - AASB 119 Superannuation information valuation method and principal actuarial assumptions (continued)
(d) Historical information (continued)
For the year ended 30 June 2009 Consolidated (Being the Parent Entity) SASS SAN CS SSS Total
$000 $000 $000 $000 Present value of defined benefit obligation (336) - (21959) (22295) Fair value of fund assets 254 244 20292 20790 Surplus in fund (83) 244 (1666) (1505) Experience adjustments - liabilities (65) 15 (3875) (3925) Experience adjustments - assets (55) (48) (4259) (4362)
For the year ended 30 June 2008 Consolidated (Being the Parent Entity) SASS SAN CS SSS Total
$000 $000 $000 $000 Present value of defined benefit obligation (283) - (18313) (18596) Fair value of fund assets 313 256 24045 24614 Surplus in fund 30 256 5732 6018 Experience adjustments - liabilities 3 111 2119 2233 Experience adjustments - assets 16 (76) (5316) (5376)
(e) Expected contributions
For the year ended 30 June 2012 SASS SAN CS SSS Total $000 $000 $000 $000
Expected employer contributions to be paid in the next reporting period - - - -
(f) Funding arrangements for employer contributions
i Surplus I deficit
The following is a summary of the 30 June 2012 financial position of the Schemes calculated in accordance with AAS 25 Financial Reporting by Superannuation Plans
For the year ended 30 June 2012
Consolidated (Being the Parent Entity) SASS SANCS SSS Total 2012
Total 2011
$000 $000 $000 $000 $000 Accrued benefits (256) - (17086) (17342) (16841) Net market value of Fund assets 193 283 20410 20886 22441 Total net surplus( deficiency) (63) 283 3324 3544 5600
44
RESIDUAL BUSINESS MANAGEMENT CORPORATION GROUP
NOTES TO THE FINANCIAL STATEMENTS for Year Ended 30 June 2012
Note 28 - AASB 119 Superannuation information valuation method and principal actuarial assumptions (continued)
(f) Funding arrangements for employer contributions (continued)
ii Contribution recommendations
The recommended contribution rates are as follows For the year ended 30 June 2012
Consolidated (Being the Parent Entity)
SASS SANCS SSS
Multiple of member contributions member salary Multiple ofmember contributions 000 000 000
iii Funding method
Contribution rates are set after discussions between the employer STC and NSW Treasury
iv Economic assumptions
The economic assumptions adopted for the current actuarial review of the Fund are
Weighted-average assumptions 2012 2011
Expected rate ofretum on Fund assets backing current pension liabilities 83 pa 83pa
Expected rate of return on Fund assets backing other liabilities 73 pa 73pa
Expected salary increase rate 40 pa 40pa
Expected rate of CPI increase 25 pa 25pa
(g) Nature of asset I (liability)
If a surplus exists in the employers interest in the Fund the employer may be able to take advantage of it in the form of a reduction in the required contribution rate depending on the advice of the Funds actuary
Where a deficiency exists the employer is responsible for any difference between the employers share of Fund assets and the defined benefit obligation
Note 29 - Events occurring after reporting date
The services of Mr Andrew d Apice the former General Manager of the RBMC Group were finalised on 31 August 2012 Mr Dominic Schuster of NSW Treasury was then appointed as his replacement effective 1 September 2012
There were no other matters or circumstances that have arisen since the end of the financial year which significantly affected or may significantly affect the operations of the Group the results of those operations or the state of affairs of the Group in future years
End of audited financial statements
45
RESIDUAL BUSINESS MANAGEMENT CORPORATION
FINANCIAL STATEMENTS FOR THE YEAR ENDED 30 JUNE 2012
STATEMENT BY CHIEF EXECUTIVE OFFICER
RESIDUAL BUSINESS MANAGERMENT CORPORATION
Pursuant to Section 41C of the Public Finance and Audit Act 1983 I state that in my opinion
The accompanying financial statements and notes thereto exhibit a true and fair view of the financial
position of the Residual Business Management Corporation (RBMC) as at 30 June 2012 and the
financial performance for the year then ended
The financial statements have been prepared in accordance with the provisions of applicable
Australian Accounting Standards (which include Australian Accounting Interpretations) the
requirements of the Public Finance and Audit Act 1983 applicable clauses of the Public Finance and
Audit Regulation 2010 the requirements of the Financial Reporting Directions published in the
Financial Reporting Code for NSW General Government Sector Entities and the Treasurers
Directions
Further I am not aware of any circumstances which would render any particulars included in the
financial statements to be misleading or inaccurate
On behalf of the Corporation
Dominic Schuster
General Manager
Residual Business Management Corporation
Dated 6 May 2014 at Sydney
INDEPENDENT AUDITORS REPORT
Residual Business Management Corporation
To Members of the New South Wales Parliament
I have audited the accompanying financial statements of Residual Business Management Corporation (the Corporation) which comprise the statements of financial position as at 30 June 2012 the statements of comprehensive income the statements of changes in equity and the statements of cash flows for the year then ended notes comprising a summary of significant accounting policies and other explanatory information of the Corporation and the consolidated entity The consolidated entity comprises the Corporation and the entities it controlled at the year end or from time to time during the financial year
Opinion
In my opinion the financial statements
give a true and fair view of the financial position of the Corporation and the consolidated entity as at 30 June 2012 and of their financial performance and cash flows for the year then ended in accordance with Australian Accounting Standards
bull are in accordance with section 41B of Public Finance and Audit Act 1983 (the PFampA Act) and the Public Finance and Audit Regulation 2010
My opinion should be read in conjunction with the rest of this report
The General Managers Responsibility for the Financial Statements
The General Manager is responsible for the preparation of the financial statements that give a true and fair view in accordance with Australian Accounting Standards and the PFampA Act and for such internal control as the General Manager determines is necessary to enable the preparation of the financial statements that are free from material misstatement whether due to fraud or error
Auditors Responsibility
My responsibility is to express an opinion on the financial statements based on my audit I conducted my audit in accordance with Australian Auditing Standards Those standards require that I comply with relevant ethical requirements relating to audit engagements and plan and perform the audit to obtain reasonable assurance about whether the financial statements are free from material misstatement
An audit involves performing procedures to obtain audit evidence about the amounts and disclosures in the financial statements The procedures selected depend on the auditors judgement including the assessment of the risks of material misstatement of the financial statements whether due to fraud or error In making those risk assessments the auditor considers internal controls relevant to the entitys preparation of the financial statements that give a true and fair view in order to design audit procedures that are appropriate in the circumstances but not for the purpose of expressing an opinion on the effectiveness of the entitys internal control An audit also includes evaluating the appropriateness of accounting policies used and the reasonableness of accounting estimates made by the General Manager as well as evaluating the overall presentation of the financial statements
I believe the audit evidence I have obtained is sufficient and appropriate to provide a basis for my audit opinion
My opinion does not provide assurance
bull about the future viability of the Corporation or consolidated entity
bull that they have carried out their activities effectively efficiently and economically
bull about the effectiveness of internal control
bull about the security and controls over the electronic publication of the audited financial statements on any website where they may be presented
bull about any other information that may have been hyperlinked tofrom the financial statements
Independence
In conducting my audit I have complied with the independence requirements of the Australian Auditing Standards and other relevant ethical pronouncements The PFampA Act further promotes independence by
bull providing that only Parliament and not the executive government can remove an Auditor-General
bull mandating the Auditor-General as auditor of public sector agencies but precluding the provision of non-audit services thus ensuring the Auditor-General and the Audit Office of New South Wales are not compromised in their role by the possibility of losing clients or income
1~k Kheir Director Financial Audit Services
19May2014 SYDNEY
- Structure Bookmarks
-
- Figure
- Figure
- Financial Instrument Class Table A Consolidated I Parent Note Category (a) Financial assets Cash and deposits 6 Cash T Corp Hour-Glass cash facility 7 Cash trust Receivables -non-current 10 Trade receivables (at amortised cost) Receivables -current 8 Other receivables (at amortised cost) Total financial assets (b) Financial liabilities Payables 14 Trade and accruals measured at amortised cost Total financial liabilities Net financial assets Total 2012 2011 $000 $000 1041 1500 10240 12075 -7 26 49 1130
- For the year ended 30 June 2012 Consolidated (Being the Parent Entity) SASS SANCS SSS $000 $000 $000 Present value ofpartly funded defined benefit obligation at beginning ofthe year (339) -(23303) Current service cost ---Interest cost (17) -(I199) Contributions by fund participants ---Actuarial gains (losses) (157) 3 (8995) Benefits paid 76 (3) 1473 Past service cost ---Curtailments ---Settlements ---Business Combinations ---Exchange rate changes ---Present value of partly funded defined benefit obl
- For the year ended 30 June 2012 2012 Consolidated (Being the Parent Entity) SASS SANCS SSS Total Components recognised in profit or loss by component $000 $000 $000 $000 Current service cost ----Interest cost (17) -(1199) (1216) Expected return on fund assets (net ofexpenses) 22 24 1832 1878 Past service cost ----Movement in adjustment for limitation on net asset ----Curtailment or settlement gain(loss) ----Total included in Other income in the statement of 5 24 633 662 comprehensive income (refe
- Figure
- Figure
- 1~kKheir
-
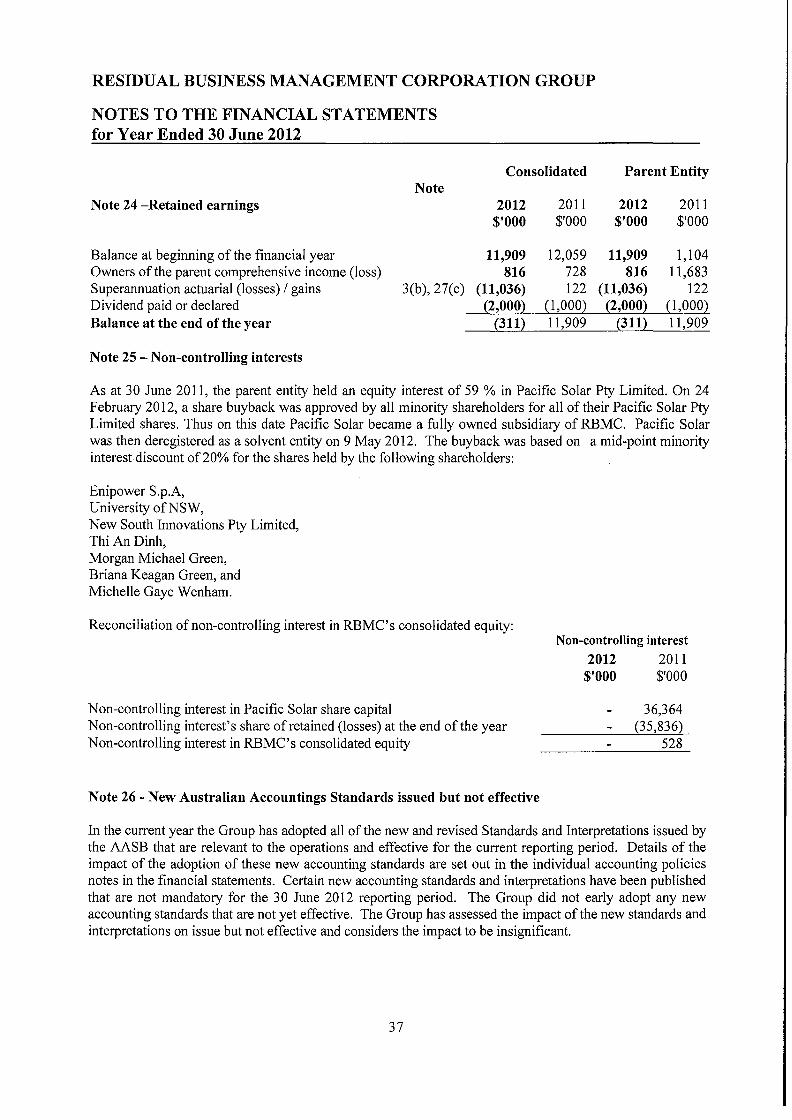
RESIDUAL BUSINESS MANAGEMENT CORPORATION GROUP
NOTES TO THE FINANCIAL STATEMENTS for Year Ended 30 June 2012
Note 27 - Superannuation information
(a) Superannuation income recognition policy
In 2012 the Group recognises the net total of the following amounts in profit or loss
Current service cost is the increase in the present value of the defined benefit obligation resulting from employee service in the current period Interest cost is the increase in the present value of the defined benefit obligation which arises because the benefits are one period closer to settlement Expected return on plan assets is based on market expectations at the beginning of the period for returns over the life of the related obligation and on any reimbursement rights Past service cost (to the extent required to be recognised) is the increase in the defined benefit obligation from changes to post-employment benefits relating to employee service in prior periods and Curtailments or settlements are amendments to the terms of the plan andor number of employees covered by the plan
The Group recognises defined benefit actuarial superannuation gains and losses in other comprehensive income
(b) Superannuation obligations
All former employees were entitled to varying levels of benefits on retirement disability or death The superannuation plans (State Superannuation Scheme (SSS) State Authorities Superannuation Scheme (SASS) and State Authorities Non-Contributory Superannuation Scheme (SANCS) provide defined benefits based on years of service and final average salary Employees contributed to the plans and the contribution of the parent entity was and remains legally enforceable All Schemes are closed to new members
Note (b) continues on the following page
38
RESIDUAL BUSINESS MANAGEMENT CORPORATION GROUP
NOTES TO THE FINANCIAL STATEMENTS for Year Ended 30 June 2012
Note 27 - Superannuation information (continued)
(b) Superannuation obligations (continued)
The following is the superannuation position of the Group as at 30 June 2012 The superannuation assets and liabilities recognised in the statement of financial position are listed at the bottom of the table
Consolidated (Being The Parent Entity)
2012 2011 2012 2011 2012 2011 2012 2011 Member numbers
SASS SANCS SSS Total
Contributors - - - - - - - -Deferred benefits - - - - 3 3 3 3 Pensioners 2 2 - - 39 38 41 40 Pensions fully commuted - - - - 2 2 2 2 Totals 2 2 - - 44 43 46 45
Accrued liability
Superannuation position for AASB119 purposes
(437)
2012 $000
(339)
2011 $000
-
2012 $000
-
2011 $000
(32024)
2012 $000
(23303)
2011 $000
(32461)
2012 $000
(23642)
2011 $000
Estimate reserve account balance 193 269 282 279 20411 21893 20886 22441 Sub-total
Future Service Liability (Note 1) Surplus in excess of recovery available from Schemes Net asset I (liability) to be recognised in statement of financial position
(244)
-
-
(244)
(70)
-
-
(70)
282
-
-
282
279
-
-
279
(11613)
-
-
(11613)
(1410)
-
-
(1410)
(11575)
-
-
(11575)
(1201)
-
-
(1201)
Note 1 The Future Service Liability (FSL) does not have to be recognised by an employer It is only used to determine if an asset ceiling limit should be imposed (AASB 119 para 58) Under AASB 119 any prepaid superannuation asset recognised cannot exceed the total of any unrecognised past service cost and the present value of any economic benefits that may be available in the form of refunds from the plan or reductions in future contributions to the plan Where the surplus in excess of recovery is zero no asset ceiling limit is imposed
As is set out above at 30 June 2012 Residual Business Management Corporation had a gross calculated defined benefit superannuation liability with respect of former employees of $32461163 (2011 23641751 ) Superannuation funds invested to cover this liability amounted to $20886294 (2011 $22440728) The aforementioned superannuation liability and surplus position has been calculated by an independent and qualified actuary The calculated deficiency of invested funds versus the anticipated superannuation liabilities at 30 June 2012 was a balance of $11574869 (2011 $1201023) The parent entity with the support ofNSW Treasury believes that it has sufficient funds to cover this deficiency
39
RESIDUAL BUSINESS MANAGEMENT CORPORATION GROUP
NOTES TO THE FINANCIAL STATEMENTS for Year Ended 30 June 2012
Note 27 - Superannuation information (continued)
(b) Superannuation obligations (continued)
Th T f h t ee reconcr ration o t e present va ue of h defimed b enefirt o blrgatrons rs as flo11ows For the year ended 30 June 2012
Consolidated (Being the Parent Entity) SASS SANCS SSS $000 $000 $000
Present value ofpartly funded defined benefit obligation at beginning of the year (339) - (23303) Current service cost - - -Interest cost (17) - (I 199) Contributions by fund participants - - -Actuarial gains (losses) (157) 3 (8995) Benefits paid 76 (3) 1473 Past service cost - - -Curtailments - - -Settlements - - -Business Combinations - - -Exchange rate changes - - -Present value of partly funded defined benefit obliations at end of the year (437) - (32024)
Total Total 2012 2011
$000 $000
(23642) (23686) - -
(1216) (I 194) - -
(9149) 141 1546 1097
- -- -- -- -- -
(32461) (23642)
The reconciliation of the fair value offund assets is as follows
For the year ended 30 June 2012 Total Total Consolidated (Being the Parent Entity) SASS SAN CS SSS 2012 2011
$000 $000 $000 $000 $000 Fair value of fund assets at beginning of the year 269 279 21893 22441 21738 Expected (loss) I return on fund assets 22 24 1832 1878 1819 Actuarial (losses) I gains (22) (24) (1841) (1887) (19) Employer contributions - - - - -Contributions by fund participants - - - - -Benefits paid (76) 3 (1473) (1546) (l097) Settlements - - - - -Business combinations - - - - -Exchange rate changes - - - - -Fair value of fund assets at end of the year 193 282 20411 20886 22441
The reconciliation of the assets and liabilities recognised in the statement of financial position is follows
Total Consolidated (Being the Parent Entity)
TotalFor the year ended 30 June 2012 2012
$000 SAN CS SASS SSS
$000 Present value ofpartly funded defined benefit obligations at end of the year
$000 $000 $000
(32461) (23642) Fair value of fund assets at end of year
(437) (32024)-22441
Subtotal 20886282 20411193
(1201) Unrecognised past service cost
(11575)(244) (11613)282 - - - --
Unrecognised gain(loss) --- --Adjustment for limitation on net assets -- -- -Net asset I (liability) recognised in the statement of financial position at end of year (l201)(11575)(244) (11613)282
40
2011
RESIDUAL BUSINESS MANAGEMENT CORPORATION GROUP
NOTES TO THE FINANCIAL STATEMENTS for Year Ended 30 June 2012
Note 27 - Superannuation information (continued)
(b) Superannuation obligations (continued)
For the year ended 30 June 2012
2012 Consolidated (Being the Parent Entity) SASS SANCS SSS Total Components recognised in profit or loss by component $000 $000 $000 $000 Current service cost - - - -Interest cost (17) - (1199) (1216) Expected return on fund assets (net of expenses) 22 24 1832 1878 Past service cost - - - -Movement in adjustment for limitation on net asset - - - -Curtailment or settlement gain(loss) - - - -Total included in Other income in the statement of 5 24 633 662 comprehensive income (refer also note 2(b))
For the year ended 30 June 2012
2012 Consolidated (Being the Parent Entity) SASS SAN CS SSS Total Components recognised in other comprehensive income $000 $000 $000 $000 Actuarial (losses) I gains recognised in year (179) (21) (10836) (11036)
2011 Total $000
-(1194)
1819 ---
625
2011 Total $000
122
Cumulative amount recognised in other comprehensive income
The cumulative amount of actuarial gains and losses since 1 July 2005 recognised in other comprehensive income is an accumulated loss of $14221000 (2011 accumulated loss of $3185000) Before 1 July 2005 RBMC treated the defined benefit superannuation funds as separate entities and so recognised no superannuation balances in other comprehensive income
(c) Superannuation obligations - actuarial loses outside the statement of comprehensive income
Amounts not recognised in the statement of comprehensive income and expenses are as follows
For the year ended 30 June 2012
Consolidated (Being the Parent Entity) SASS SAN CS SSS 2012
Total 2011 Total
$000 $000 $000 $000 $000 Actuarial (losses) - - - - -Adjustment for limit on net asset - - - - -Total loss not reco2nised in the income statement - - - - -
41
RESIDUAL BUSINESS MANAGEMENT CORPORATION GROUP
NOTES TO THE FINANCIAL STATEMENTS for Year Ended 30 June 2012
Note 27 - Superannuation information (continued)
(d) Superannuation asset classes
The percentage invested in each asset class at the balance sheet date
Consolidated (Being the Parent Entity) 30 June 2012 30 June 2011 Australian equities 280 334 Overseas equities 237 295 Australian fixed interest securities 49 57 Overseas fixed interest securities 24 31 Property 86 99 Cash 195 51 Other 129 133
All Fund assets are invested by SAS Trustee Corporation (STC) at arms length through independent fund managers
Other superannuation provision information related to AASB 119 is disclosed at Note 28
AASB 119 requires organisations to provide detailed narrative information regarding the key economic and demographic assumptions underlying the reported defined benefits superannuation account balances The assumptions and calculations are generic to all NSW Government agencies and they are set out in Note 28
Note 28 - AASB 119 Superannuation information valuation method and principal actuarial assumptions
The followings are the superannuation asset and liability assumptions and calculations generic to all NSW Government agencies
The expected rate of return on assets assumption is determined by weighting the expected long-term return for each asset class by the target allocation of assets to each class The returns used for each class are net of investment tax and investment fees
Actual return on Scheme assets are as follows
For the year ended 30 June 2012 Consolidated (Being the Parent Entity) SASS SANCS SSS Total
$000 $000 $000 $000 Actual loss I (return) on fund assets (1) - 9 8
(a) Valuation Method
The Projected Unit Credit (PUC) valuation method was used to determine the present value of the defined benefit obligations and the related current service costs This method sees each period of service as giving rise to an additional unit of benefit entitlement and measures each unit separately to build up the final obligation
42
RESIDUAL BUSINESS MANAGEMENT CORPORATION GROUP
NOTES TO THE FINANCIAL STATEMENTS for Year Ended 30 June 2012
Note 28 - AASB 119 Superannuation information valuation method and principal actuarial assumptions (continued)
(b) Economic assumptions
Consolidated (Being the Parent Entity) 30 June 2012 30 June 2011
Salary increase rate (excluding promotional increases) 25 pa 35 pa
Rate ofCPI increase 25 pa 25pa
Expected rate of return on assets backing pension liabilities 860 pa 860pa
Expected rate ofretum on assets backing other liabilities 860 pa 860pa
Discount rate 306 pa 528pa
(c) Demographic assumptions
The demographic assumptions underlying the calculated actuarial balances of the RBMC Superannuation Schemes are generic to all NSW Government agencies and further details can be obtained from the NSW Treasury website
(d) Historical information
For the year ended 3 0 June 2012 Consolidated (Being the Parent Entity) SASS SANCS SSS Total
$000 $000 $000 $000 Present value ofdefined benefit obligation (437) - (32024) (32461) Fair value of fund assets 193 282 20411 20886 Surplus(Deficit) in fund (244) 282 (11613) (11575) Experience adjustments - liabilities (157) 3 (8995) (9149) Experience adjustments - assets (22) (23) (1841) (1886)
For the year ended 30 June 2011 Consolidated (Being the Parent Entity) SASS SANCS SSS Total
$000 $000 $000 $000 Present value of defined benefit obligation (339) - (23303) (23642) Fair value of fund assets 269 279 21893 22441 Surplus(Deficit) in fund (70) 279 (1410) (1201) Experience adjustments - liabilities 12 (6) 135 141 Experience adjustments - assets - (1) (18) (19)
For the year ended 30 June 2010 Consolidated (Being the Parent Entity) SASS SAN CS SSS Total
$000 $000 $000 $000 Present value of defined benefit obligation (344) - (23342) (23686) Fair value of fund assets 258 263 21217 21738 Surplus in fund (86) 263 (2125) (1948) Experience adjustments - liabilities (8) (3) (1079) (1090) Experience adjustments - assets 2 1 133 136
43
RESIDUAL BUSINESS MANAGEMENT CORPORATION GROUP
NOTES TO THE FINANCIAL STATEMENTS for Year Ended 30 June 2012
Note 28 - AASB 119 Superannuation information valuation method and principal actuarial assumptions (continued)
(d) Historical information (continued)
For the year ended 30 June 2009 Consolidated (Being the Parent Entity) SASS SAN CS SSS Total
$000 $000 $000 $000 Present value of defined benefit obligation (336) - (21959) (22295) Fair value of fund assets 254 244 20292 20790 Surplus in fund (83) 244 (1666) (1505) Experience adjustments - liabilities (65) 15 (3875) (3925) Experience adjustments - assets (55) (48) (4259) (4362)
For the year ended 30 June 2008 Consolidated (Being the Parent Entity) SASS SAN CS SSS Total
$000 $000 $000 $000 Present value of defined benefit obligation (283) - (18313) (18596) Fair value of fund assets 313 256 24045 24614 Surplus in fund 30 256 5732 6018 Experience adjustments - liabilities 3 111 2119 2233 Experience adjustments - assets 16 (76) (5316) (5376)
(e) Expected contributions
For the year ended 30 June 2012 SASS SAN CS SSS Total $000 $000 $000 $000
Expected employer contributions to be paid in the next reporting period - - - -
(f) Funding arrangements for employer contributions
i Surplus I deficit
The following is a summary of the 30 June 2012 financial position of the Schemes calculated in accordance with AAS 25 Financial Reporting by Superannuation Plans
For the year ended 30 June 2012
Consolidated (Being the Parent Entity) SASS SANCS SSS Total 2012
Total 2011
$000 $000 $000 $000 $000 Accrued benefits (256) - (17086) (17342) (16841) Net market value of Fund assets 193 283 20410 20886 22441 Total net surplus( deficiency) (63) 283 3324 3544 5600
44
RESIDUAL BUSINESS MANAGEMENT CORPORATION GROUP
NOTES TO THE FINANCIAL STATEMENTS for Year Ended 30 June 2012
Note 28 - AASB 119 Superannuation information valuation method and principal actuarial assumptions (continued)
(f) Funding arrangements for employer contributions (continued)
ii Contribution recommendations
The recommended contribution rates are as follows For the year ended 30 June 2012
Consolidated (Being the Parent Entity)
SASS SANCS SSS
Multiple of member contributions member salary Multiple ofmember contributions 000 000 000
iii Funding method
Contribution rates are set after discussions between the employer STC and NSW Treasury
iv Economic assumptions
The economic assumptions adopted for the current actuarial review of the Fund are
Weighted-average assumptions 2012 2011
Expected rate ofretum on Fund assets backing current pension liabilities 83 pa 83pa
Expected rate of return on Fund assets backing other liabilities 73 pa 73pa
Expected salary increase rate 40 pa 40pa
Expected rate of CPI increase 25 pa 25pa
(g) Nature of asset I (liability)
If a surplus exists in the employers interest in the Fund the employer may be able to take advantage of it in the form of a reduction in the required contribution rate depending on the advice of the Funds actuary
Where a deficiency exists the employer is responsible for any difference between the employers share of Fund assets and the defined benefit obligation
Note 29 - Events occurring after reporting date
The services of Mr Andrew d Apice the former General Manager of the RBMC Group were finalised on 31 August 2012 Mr Dominic Schuster of NSW Treasury was then appointed as his replacement effective 1 September 2012
There were no other matters or circumstances that have arisen since the end of the financial year which significantly affected or may significantly affect the operations of the Group the results of those operations or the state of affairs of the Group in future years
End of audited financial statements
45
RESIDUAL BUSINESS MANAGEMENT CORPORATION
FINANCIAL STATEMENTS FOR THE YEAR ENDED 30 JUNE 2012
STATEMENT BY CHIEF EXECUTIVE OFFICER
RESIDUAL BUSINESS MANAGERMENT CORPORATION
Pursuant to Section 41C of the Public Finance and Audit Act 1983 I state that in my opinion
The accompanying financial statements and notes thereto exhibit a true and fair view of the financial
position of the Residual Business Management Corporation (RBMC) as at 30 June 2012 and the
financial performance for the year then ended
The financial statements have been prepared in accordance with the provisions of applicable
Australian Accounting Standards (which include Australian Accounting Interpretations) the
requirements of the Public Finance and Audit Act 1983 applicable clauses of the Public Finance and
Audit Regulation 2010 the requirements of the Financial Reporting Directions published in the
Financial Reporting Code for NSW General Government Sector Entities and the Treasurers
Directions
Further I am not aware of any circumstances which would render any particulars included in the
financial statements to be misleading or inaccurate
On behalf of the Corporation
Dominic Schuster
General Manager
Residual Business Management Corporation
Dated 6 May 2014 at Sydney
INDEPENDENT AUDITORS REPORT
Residual Business Management Corporation
To Members of the New South Wales Parliament
I have audited the accompanying financial statements of Residual Business Management Corporation (the Corporation) which comprise the statements of financial position as at 30 June 2012 the statements of comprehensive income the statements of changes in equity and the statements of cash flows for the year then ended notes comprising a summary of significant accounting policies and other explanatory information of the Corporation and the consolidated entity The consolidated entity comprises the Corporation and the entities it controlled at the year end or from time to time during the financial year
Opinion
In my opinion the financial statements
give a true and fair view of the financial position of the Corporation and the consolidated entity as at 30 June 2012 and of their financial performance and cash flows for the year then ended in accordance with Australian Accounting Standards
bull are in accordance with section 41B of Public Finance and Audit Act 1983 (the PFampA Act) and the Public Finance and Audit Regulation 2010
My opinion should be read in conjunction with the rest of this report
The General Managers Responsibility for the Financial Statements
The General Manager is responsible for the preparation of the financial statements that give a true and fair view in accordance with Australian Accounting Standards and the PFampA Act and for such internal control as the General Manager determines is necessary to enable the preparation of the financial statements that are free from material misstatement whether due to fraud or error
Auditors Responsibility
My responsibility is to express an opinion on the financial statements based on my audit I conducted my audit in accordance with Australian Auditing Standards Those standards require that I comply with relevant ethical requirements relating to audit engagements and plan and perform the audit to obtain reasonable assurance about whether the financial statements are free from material misstatement
An audit involves performing procedures to obtain audit evidence about the amounts and disclosures in the financial statements The procedures selected depend on the auditors judgement including the assessment of the risks of material misstatement of the financial statements whether due to fraud or error In making those risk assessments the auditor considers internal controls relevant to the entitys preparation of the financial statements that give a true and fair view in order to design audit procedures that are appropriate in the circumstances but not for the purpose of expressing an opinion on the effectiveness of the entitys internal control An audit also includes evaluating the appropriateness of accounting policies used and the reasonableness of accounting estimates made by the General Manager as well as evaluating the overall presentation of the financial statements
I believe the audit evidence I have obtained is sufficient and appropriate to provide a basis for my audit opinion
My opinion does not provide assurance
bull about the future viability of the Corporation or consolidated entity
bull that they have carried out their activities effectively efficiently and economically
bull about the effectiveness of internal control
bull about the security and controls over the electronic publication of the audited financial statements on any website where they may be presented
bull about any other information that may have been hyperlinked tofrom the financial statements
Independence
In conducting my audit I have complied with the independence requirements of the Australian Auditing Standards and other relevant ethical pronouncements The PFampA Act further promotes independence by
bull providing that only Parliament and not the executive government can remove an Auditor-General
bull mandating the Auditor-General as auditor of public sector agencies but precluding the provision of non-audit services thus ensuring the Auditor-General and the Audit Office of New South Wales are not compromised in their role by the possibility of losing clients or income
1~k Kheir Director Financial Audit Services
19May2014 SYDNEY
- Structure Bookmarks
-
- Figure
- Figure
- Financial Instrument Class Table A Consolidated I Parent Note Category (a) Financial assets Cash and deposits 6 Cash T Corp Hour-Glass cash facility 7 Cash trust Receivables -non-current 10 Trade receivables (at amortised cost) Receivables -current 8 Other receivables (at amortised cost) Total financial assets (b) Financial liabilities Payables 14 Trade and accruals measured at amortised cost Total financial liabilities Net financial assets Total 2012 2011 $000 $000 1041 1500 10240 12075 -7 26 49 1130
- For the year ended 30 June 2012 Consolidated (Being the Parent Entity) SASS SANCS SSS $000 $000 $000 Present value ofpartly funded defined benefit obligation at beginning ofthe year (339) -(23303) Current service cost ---Interest cost (17) -(I199) Contributions by fund participants ---Actuarial gains (losses) (157) 3 (8995) Benefits paid 76 (3) 1473 Past service cost ---Curtailments ---Settlements ---Business Combinations ---Exchange rate changes ---Present value of partly funded defined benefit obl
- For the year ended 30 June 2012 2012 Consolidated (Being the Parent Entity) SASS SANCS SSS Total Components recognised in profit or loss by component $000 $000 $000 $000 Current service cost ----Interest cost (17) -(1199) (1216) Expected return on fund assets (net ofexpenses) 22 24 1832 1878 Past service cost ----Movement in adjustment for limitation on net asset ----Curtailment or settlement gain(loss) ----Total included in Other income in the statement of 5 24 633 662 comprehensive income (refe
- Figure
- Figure
- 1~kKheir
-
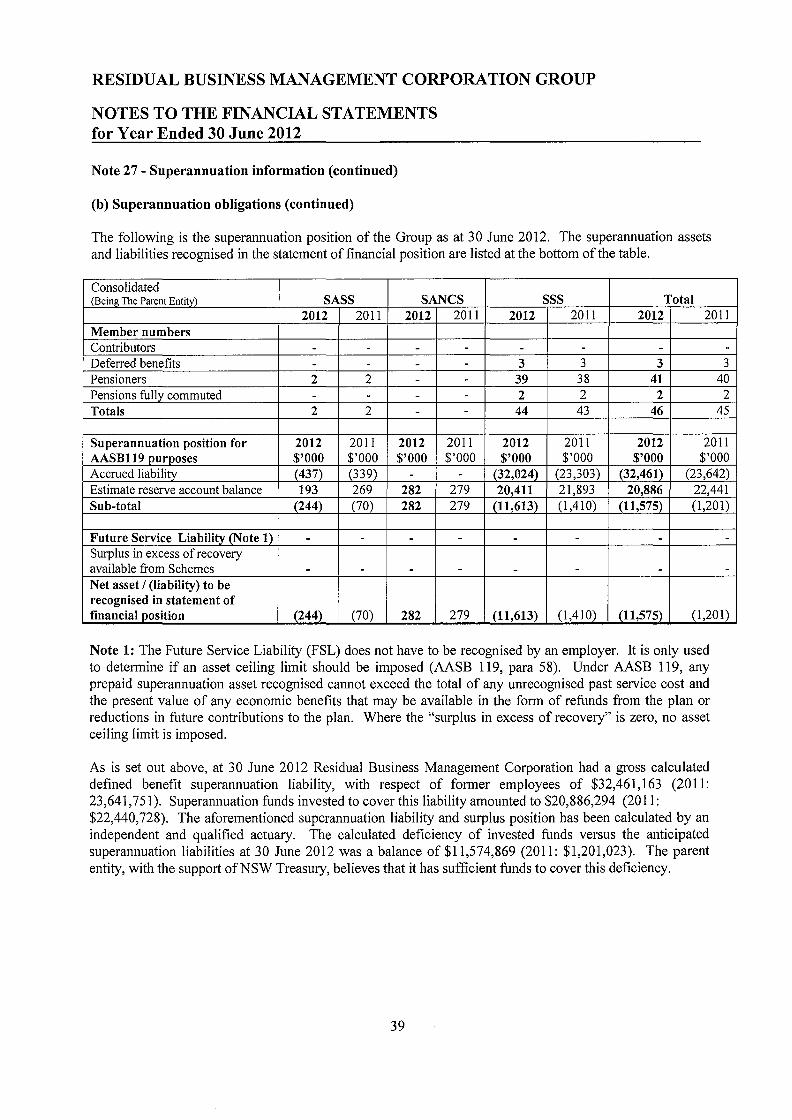
RESIDUAL BUSINESS MANAGEMENT CORPORATION GROUP
NOTES TO THE FINANCIAL STATEMENTS for Year Ended 30 June 2012
Note 27 - Superannuation information (continued)
(b) Superannuation obligations (continued)
For the year ended 30 June 2012
2012 Consolidated (Being the Parent Entity) SASS SANCS SSS Total Components recognised in profit or loss by component $000 $000 $000 $000 Current service cost - - - -Interest cost (17) - (1199) (1216) Expected return on fund assets (net of expenses) 22 24 1832 1878 Past service cost - - - -Movement in adjustment for limitation on net asset - - - -Curtailment or settlement gain(loss) - - - -Total included in Other income in the statement of 5 24 633 662 comprehensive income (refer also note 2(b))
For the year ended 30 June 2012
2012 Consolidated (Being the Parent Entity) SASS SAN CS SSS Total Components recognised in other comprehensive income $000 $000 $000 $000 Actuarial (losses) I gains recognised in year (179) (21) (10836) (11036)
2011 Total $000
-(1194)
1819 ---
625
2011 Total $000
122
Cumulative amount recognised in other comprehensive income
The cumulative amount of actuarial gains and losses since 1 July 2005 recognised in other comprehensive income is an accumulated loss of $14221000 (2011 accumulated loss of $3185000) Before 1 July 2005 RBMC treated the defined benefit superannuation funds as separate entities and so recognised no superannuation balances in other comprehensive income
(c) Superannuation obligations - actuarial loses outside the statement of comprehensive income
Amounts not recognised in the statement of comprehensive income and expenses are as follows
For the year ended 30 June 2012
Consolidated (Being the Parent Entity) SASS SAN CS SSS 2012
Total 2011 Total
$000 $000 $000 $000 $000 Actuarial (losses) - - - - -Adjustment for limit on net asset - - - - -Total loss not reco2nised in the income statement - - - - -
41
RESIDUAL BUSINESS MANAGEMENT CORPORATION GROUP
NOTES TO THE FINANCIAL STATEMENTS for Year Ended 30 June 2012
Note 27 - Superannuation information (continued)
(d) Superannuation asset classes
The percentage invested in each asset class at the balance sheet date
Consolidated (Being the Parent Entity) 30 June 2012 30 June 2011 Australian equities 280 334 Overseas equities 237 295 Australian fixed interest securities 49 57 Overseas fixed interest securities 24 31 Property 86 99 Cash 195 51 Other 129 133
All Fund assets are invested by SAS Trustee Corporation (STC) at arms length through independent fund managers
Other superannuation provision information related to AASB 119 is disclosed at Note 28
AASB 119 requires organisations to provide detailed narrative information regarding the key economic and demographic assumptions underlying the reported defined benefits superannuation account balances The assumptions and calculations are generic to all NSW Government agencies and they are set out in Note 28
Note 28 - AASB 119 Superannuation information valuation method and principal actuarial assumptions
The followings are the superannuation asset and liability assumptions and calculations generic to all NSW Government agencies
The expected rate of return on assets assumption is determined by weighting the expected long-term return for each asset class by the target allocation of assets to each class The returns used for each class are net of investment tax and investment fees
Actual return on Scheme assets are as follows
For the year ended 30 June 2012 Consolidated (Being the Parent Entity) SASS SANCS SSS Total
$000 $000 $000 $000 Actual loss I (return) on fund assets (1) - 9 8
(a) Valuation Method
The Projected Unit Credit (PUC) valuation method was used to determine the present value of the defined benefit obligations and the related current service costs This method sees each period of service as giving rise to an additional unit of benefit entitlement and measures each unit separately to build up the final obligation
42
RESIDUAL BUSINESS MANAGEMENT CORPORATION GROUP
NOTES TO THE FINANCIAL STATEMENTS for Year Ended 30 June 2012
Note 28 - AASB 119 Superannuation information valuation method and principal actuarial assumptions (continued)
(b) Economic assumptions
Consolidated (Being the Parent Entity) 30 June 2012 30 June 2011
Salary increase rate (excluding promotional increases) 25 pa 35 pa
Rate ofCPI increase 25 pa 25pa
Expected rate of return on assets backing pension liabilities 860 pa 860pa
Expected rate ofretum on assets backing other liabilities 860 pa 860pa
Discount rate 306 pa 528pa
(c) Demographic assumptions
The demographic assumptions underlying the calculated actuarial balances of the RBMC Superannuation Schemes are generic to all NSW Government agencies and further details can be obtained from the NSW Treasury website
(d) Historical information
For the year ended 3 0 June 2012 Consolidated (Being the Parent Entity) SASS SANCS SSS Total
$000 $000 $000 $000 Present value ofdefined benefit obligation (437) - (32024) (32461) Fair value of fund assets 193 282 20411 20886 Surplus(Deficit) in fund (244) 282 (11613) (11575) Experience adjustments - liabilities (157) 3 (8995) (9149) Experience adjustments - assets (22) (23) (1841) (1886)
For the year ended 30 June 2011 Consolidated (Being the Parent Entity) SASS SANCS SSS Total
$000 $000 $000 $000 Present value of defined benefit obligation (339) - (23303) (23642) Fair value of fund assets 269 279 21893 22441 Surplus(Deficit) in fund (70) 279 (1410) (1201) Experience adjustments - liabilities 12 (6) 135 141 Experience adjustments - assets - (1) (18) (19)
For the year ended 30 June 2010 Consolidated (Being the Parent Entity) SASS SAN CS SSS Total
$000 $000 $000 $000 Present value of defined benefit obligation (344) - (23342) (23686) Fair value of fund assets 258 263 21217 21738 Surplus in fund (86) 263 (2125) (1948) Experience adjustments - liabilities (8) (3) (1079) (1090) Experience adjustments - assets 2 1 133 136
43
RESIDUAL BUSINESS MANAGEMENT CORPORATION GROUP
NOTES TO THE FINANCIAL STATEMENTS for Year Ended 30 June 2012
Note 28 - AASB 119 Superannuation information valuation method and principal actuarial assumptions (continued)
(d) Historical information (continued)
For the year ended 30 June 2009 Consolidated (Being the Parent Entity) SASS SAN CS SSS Total
$000 $000 $000 $000 Present value of defined benefit obligation (336) - (21959) (22295) Fair value of fund assets 254 244 20292 20790 Surplus in fund (83) 244 (1666) (1505) Experience adjustments - liabilities (65) 15 (3875) (3925) Experience adjustments - assets (55) (48) (4259) (4362)
For the year ended 30 June 2008 Consolidated (Being the Parent Entity) SASS SAN CS SSS Total
$000 $000 $000 $000 Present value of defined benefit obligation (283) - (18313) (18596) Fair value of fund assets 313 256 24045 24614 Surplus in fund 30 256 5732 6018 Experience adjustments - liabilities 3 111 2119 2233 Experience adjustments - assets 16 (76) (5316) (5376)
(e) Expected contributions
For the year ended 30 June 2012 SASS SAN CS SSS Total $000 $000 $000 $000
Expected employer contributions to be paid in the next reporting period - - - -
(f) Funding arrangements for employer contributions
i Surplus I deficit
The following is a summary of the 30 June 2012 financial position of the Schemes calculated in accordance with AAS 25 Financial Reporting by Superannuation Plans
For the year ended 30 June 2012
Consolidated (Being the Parent Entity) SASS SANCS SSS Total 2012
Total 2011
$000 $000 $000 $000 $000 Accrued benefits (256) - (17086) (17342) (16841) Net market value of Fund assets 193 283 20410 20886 22441 Total net surplus( deficiency) (63) 283 3324 3544 5600
44
RESIDUAL BUSINESS MANAGEMENT CORPORATION GROUP
NOTES TO THE FINANCIAL STATEMENTS for Year Ended 30 June 2012
Note 28 - AASB 119 Superannuation information valuation method and principal actuarial assumptions (continued)
(f) Funding arrangements for employer contributions (continued)
ii Contribution recommendations
The recommended contribution rates are as follows For the year ended 30 June 2012
Consolidated (Being the Parent Entity)
SASS SANCS SSS
Multiple of member contributions member salary Multiple ofmember contributions 000 000 000
iii Funding method
Contribution rates are set after discussions between the employer STC and NSW Treasury
iv Economic assumptions
The economic assumptions adopted for the current actuarial review of the Fund are
Weighted-average assumptions 2012 2011
Expected rate ofretum on Fund assets backing current pension liabilities 83 pa 83pa
Expected rate of return on Fund assets backing other liabilities 73 pa 73pa
Expected salary increase rate 40 pa 40pa
Expected rate of CPI increase 25 pa 25pa
(g) Nature of asset I (liability)
If a surplus exists in the employers interest in the Fund the employer may be able to take advantage of it in the form of a reduction in the required contribution rate depending on the advice of the Funds actuary
Where a deficiency exists the employer is responsible for any difference between the employers share of Fund assets and the defined benefit obligation
Note 29 - Events occurring after reporting date
The services of Mr Andrew d Apice the former General Manager of the RBMC Group were finalised on 31 August 2012 Mr Dominic Schuster of NSW Treasury was then appointed as his replacement effective 1 September 2012
There were no other matters or circumstances that have arisen since the end of the financial year which significantly affected or may significantly affect the operations of the Group the results of those operations or the state of affairs of the Group in future years
End of audited financial statements
45
RESIDUAL BUSINESS MANAGEMENT CORPORATION
FINANCIAL STATEMENTS FOR THE YEAR ENDED 30 JUNE 2012
STATEMENT BY CHIEF EXECUTIVE OFFICER
RESIDUAL BUSINESS MANAGERMENT CORPORATION
Pursuant to Section 41C of the Public Finance and Audit Act 1983 I state that in my opinion
The accompanying financial statements and notes thereto exhibit a true and fair view of the financial
position of the Residual Business Management Corporation (RBMC) as at 30 June 2012 and the
financial performance for the year then ended
The financial statements have been prepared in accordance with the provisions of applicable
Australian Accounting Standards (which include Australian Accounting Interpretations) the
requirements of the Public Finance and Audit Act 1983 applicable clauses of the Public Finance and
Audit Regulation 2010 the requirements of the Financial Reporting Directions published in the
Financial Reporting Code for NSW General Government Sector Entities and the Treasurers
Directions
Further I am not aware of any circumstances which would render any particulars included in the
financial statements to be misleading or inaccurate
On behalf of the Corporation
Dominic Schuster
General Manager
Residual Business Management Corporation
Dated 6 May 2014 at Sydney
INDEPENDENT AUDITORS REPORT
Residual Business Management Corporation
To Members of the New South Wales Parliament
I have audited the accompanying financial statements of Residual Business Management Corporation (the Corporation) which comprise the statements of financial position as at 30 June 2012 the statements of comprehensive income the statements of changes in equity and the statements of cash flows for the year then ended notes comprising a summary of significant accounting policies and other explanatory information of the Corporation and the consolidated entity The consolidated entity comprises the Corporation and the entities it controlled at the year end or from time to time during the financial year
Opinion
In my opinion the financial statements
give a true and fair view of the financial position of the Corporation and the consolidated entity as at 30 June 2012 and of their financial performance and cash flows for the year then ended in accordance with Australian Accounting Standards
bull are in accordance with section 41B of Public Finance and Audit Act 1983 (the PFampA Act) and the Public Finance and Audit Regulation 2010
My opinion should be read in conjunction with the rest of this report
The General Managers Responsibility for the Financial Statements
The General Manager is responsible for the preparation of the financial statements that give a true and fair view in accordance with Australian Accounting Standards and the PFampA Act and for such internal control as the General Manager determines is necessary to enable the preparation of the financial statements that are free from material misstatement whether due to fraud or error
Auditors Responsibility
My responsibility is to express an opinion on the financial statements based on my audit I conducted my audit in accordance with Australian Auditing Standards Those standards require that I comply with relevant ethical requirements relating to audit engagements and plan and perform the audit to obtain reasonable assurance about whether the financial statements are free from material misstatement
An audit involves performing procedures to obtain audit evidence about the amounts and disclosures in the financial statements The procedures selected depend on the auditors judgement including the assessment of the risks of material misstatement of the financial statements whether due to fraud or error In making those risk assessments the auditor considers internal controls relevant to the entitys preparation of the financial statements that give a true and fair view in order to design audit procedures that are appropriate in the circumstances but not for the purpose of expressing an opinion on the effectiveness of the entitys internal control An audit also includes evaluating the appropriateness of accounting policies used and the reasonableness of accounting estimates made by the General Manager as well as evaluating the overall presentation of the financial statements
I believe the audit evidence I have obtained is sufficient and appropriate to provide a basis for my audit opinion
My opinion does not provide assurance
bull about the future viability of the Corporation or consolidated entity
bull that they have carried out their activities effectively efficiently and economically
bull about the effectiveness of internal control
bull about the security and controls over the electronic publication of the audited financial statements on any website where they may be presented
bull about any other information that may have been hyperlinked tofrom the financial statements
Independence
In conducting my audit I have complied with the independence requirements of the Australian Auditing Standards and other relevant ethical pronouncements The PFampA Act further promotes independence by
bull providing that only Parliament and not the executive government can remove an Auditor-General
bull mandating the Auditor-General as auditor of public sector agencies but precluding the provision of non-audit services thus ensuring the Auditor-General and the Audit Office of New South Wales are not compromised in their role by the possibility of losing clients or income
1~k Kheir Director Financial Audit Services
19May2014 SYDNEY
- Structure Bookmarks
-
- Figure
- Figure
- Financial Instrument Class Table A Consolidated I Parent Note Category (a) Financial assets Cash and deposits 6 Cash T Corp Hour-Glass cash facility 7 Cash trust Receivables -non-current 10 Trade receivables (at amortised cost) Receivables -current 8 Other receivables (at amortised cost) Total financial assets (b) Financial liabilities Payables 14 Trade and accruals measured at amortised cost Total financial liabilities Net financial assets Total 2012 2011 $000 $000 1041 1500 10240 12075 -7 26 49 1130
- For the year ended 30 June 2012 Consolidated (Being the Parent Entity) SASS SANCS SSS $000 $000 $000 Present value ofpartly funded defined benefit obligation at beginning ofthe year (339) -(23303) Current service cost ---Interest cost (17) -(I199) Contributions by fund participants ---Actuarial gains (losses) (157) 3 (8995) Benefits paid 76 (3) 1473 Past service cost ---Curtailments ---Settlements ---Business Combinations ---Exchange rate changes ---Present value of partly funded defined benefit obl
- For the year ended 30 June 2012 2012 Consolidated (Being the Parent Entity) SASS SANCS SSS Total Components recognised in profit or loss by component $000 $000 $000 $000 Current service cost ----Interest cost (17) -(1199) (1216) Expected return on fund assets (net ofexpenses) 22 24 1832 1878 Past service cost ----Movement in adjustment for limitation on net asset ----Curtailment or settlement gain(loss) ----Total included in Other income in the statement of 5 24 633 662 comprehensive income (refe
- Figure
- Figure
- 1~kKheir
-
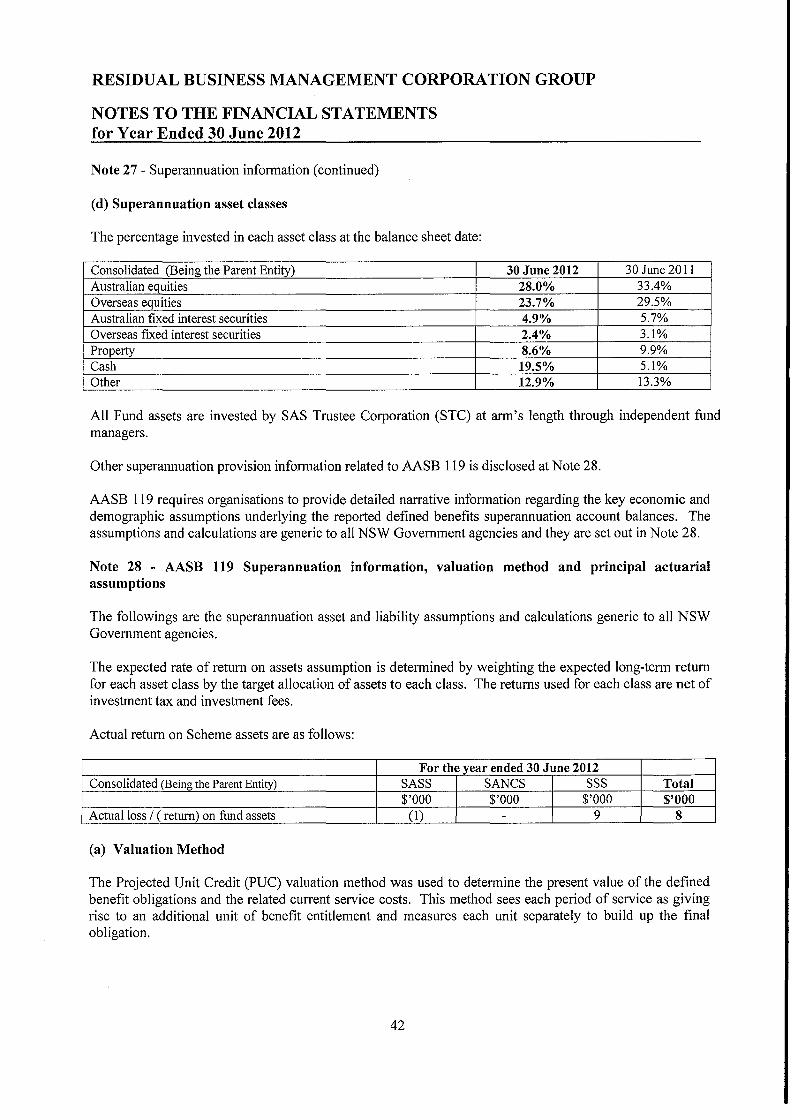
RESIDUAL BUSINESS MANAGEMENT CORPORATION GROUP
NOTES TO THE FINANCIAL STATEMENTS for Year Ended 30 June 2012
Note 27 - Superannuation information (continued)
(d) Superannuation asset classes
The percentage invested in each asset class at the balance sheet date
Consolidated (Being the Parent Entity) 30 June 2012 30 June 2011 Australian equities 280 334 Overseas equities 237 295 Australian fixed interest securities 49 57 Overseas fixed interest securities 24 31 Property 86 99 Cash 195 51 Other 129 133
All Fund assets are invested by SAS Trustee Corporation (STC) at arms length through independent fund managers
Other superannuation provision information related to AASB 119 is disclosed at Note 28
AASB 119 requires organisations to provide detailed narrative information regarding the key economic and demographic assumptions underlying the reported defined benefits superannuation account balances The assumptions and calculations are generic to all NSW Government agencies and they are set out in Note 28
Note 28 - AASB 119 Superannuation information valuation method and principal actuarial assumptions
The followings are the superannuation asset and liability assumptions and calculations generic to all NSW Government agencies
The expected rate of return on assets assumption is determined by weighting the expected long-term return for each asset class by the target allocation of assets to each class The returns used for each class are net of investment tax and investment fees
Actual return on Scheme assets are as follows
For the year ended 30 June 2012 Consolidated (Being the Parent Entity) SASS SANCS SSS Total
$000 $000 $000 $000 Actual loss I (return) on fund assets (1) - 9 8
(a) Valuation Method
The Projected Unit Credit (PUC) valuation method was used to determine the present value of the defined benefit obligations and the related current service costs This method sees each period of service as giving rise to an additional unit of benefit entitlement and measures each unit separately to build up the final obligation
42
RESIDUAL BUSINESS MANAGEMENT CORPORATION GROUP
NOTES TO THE FINANCIAL STATEMENTS for Year Ended 30 June 2012
Note 28 - AASB 119 Superannuation information valuation method and principal actuarial assumptions (continued)
(b) Economic assumptions
Consolidated (Being the Parent Entity) 30 June 2012 30 June 2011
Salary increase rate (excluding promotional increases) 25 pa 35 pa
Rate ofCPI increase 25 pa 25pa
Expected rate of return on assets backing pension liabilities 860 pa 860pa
Expected rate ofretum on assets backing other liabilities 860 pa 860pa
Discount rate 306 pa 528pa
(c) Demographic assumptions
The demographic assumptions underlying the calculated actuarial balances of the RBMC Superannuation Schemes are generic to all NSW Government agencies and further details can be obtained from the NSW Treasury website
(d) Historical information
For the year ended 3 0 June 2012 Consolidated (Being the Parent Entity) SASS SANCS SSS Total
$000 $000 $000 $000 Present value ofdefined benefit obligation (437) - (32024) (32461) Fair value of fund assets 193 282 20411 20886 Surplus(Deficit) in fund (244) 282 (11613) (11575) Experience adjustments - liabilities (157) 3 (8995) (9149) Experience adjustments - assets (22) (23) (1841) (1886)
For the year ended 30 June 2011 Consolidated (Being the Parent Entity) SASS SANCS SSS Total
$000 $000 $000 $000 Present value of defined benefit obligation (339) - (23303) (23642) Fair value of fund assets 269 279 21893 22441 Surplus(Deficit) in fund (70) 279 (1410) (1201) Experience adjustments - liabilities 12 (6) 135 141 Experience adjustments - assets - (1) (18) (19)
For the year ended 30 June 2010 Consolidated (Being the Parent Entity) SASS SAN CS SSS Total
$000 $000 $000 $000 Present value of defined benefit obligation (344) - (23342) (23686) Fair value of fund assets 258 263 21217 21738 Surplus in fund (86) 263 (2125) (1948) Experience adjustments - liabilities (8) (3) (1079) (1090) Experience adjustments - assets 2 1 133 136
43
RESIDUAL BUSINESS MANAGEMENT CORPORATION GROUP
NOTES TO THE FINANCIAL STATEMENTS for Year Ended 30 June 2012
Note 28 - AASB 119 Superannuation information valuation method and principal actuarial assumptions (continued)
(d) Historical information (continued)
For the year ended 30 June 2009 Consolidated (Being the Parent Entity) SASS SAN CS SSS Total
$000 $000 $000 $000 Present value of defined benefit obligation (336) - (21959) (22295) Fair value of fund assets 254 244 20292 20790 Surplus in fund (83) 244 (1666) (1505) Experience adjustments - liabilities (65) 15 (3875) (3925) Experience adjustments - assets (55) (48) (4259) (4362)
For the year ended 30 June 2008 Consolidated (Being the Parent Entity) SASS SAN CS SSS Total
$000 $000 $000 $000 Present value of defined benefit obligation (283) - (18313) (18596) Fair value of fund assets 313 256 24045 24614 Surplus in fund 30 256 5732 6018 Experience adjustments - liabilities 3 111 2119 2233 Experience adjustments - assets 16 (76) (5316) (5376)
(e) Expected contributions
For the year ended 30 June 2012 SASS SAN CS SSS Total $000 $000 $000 $000
Expected employer contributions to be paid in the next reporting period - - - -
(f) Funding arrangements for employer contributions
i Surplus I deficit
The following is a summary of the 30 June 2012 financial position of the Schemes calculated in accordance with AAS 25 Financial Reporting by Superannuation Plans
For the year ended 30 June 2012
Consolidated (Being the Parent Entity) SASS SANCS SSS Total 2012
Total 2011
$000 $000 $000 $000 $000 Accrued benefits (256) - (17086) (17342) (16841) Net market value of Fund assets 193 283 20410 20886 22441 Total net surplus( deficiency) (63) 283 3324 3544 5600
44
RESIDUAL BUSINESS MANAGEMENT CORPORATION GROUP
NOTES TO THE FINANCIAL STATEMENTS for Year Ended 30 June 2012
Note 28 - AASB 119 Superannuation information valuation method and principal actuarial assumptions (continued)
(f) Funding arrangements for employer contributions (continued)
ii Contribution recommendations
The recommended contribution rates are as follows For the year ended 30 June 2012
Consolidated (Being the Parent Entity)
SASS SANCS SSS
Multiple of member contributions member salary Multiple ofmember contributions 000 000 000
iii Funding method
Contribution rates are set after discussions between the employer STC and NSW Treasury
iv Economic assumptions
The economic assumptions adopted for the current actuarial review of the Fund are
Weighted-average assumptions 2012 2011
Expected rate ofretum on Fund assets backing current pension liabilities 83 pa 83pa
Expected rate of return on Fund assets backing other liabilities 73 pa 73pa
Expected salary increase rate 40 pa 40pa
Expected rate of CPI increase 25 pa 25pa
(g) Nature of asset I (liability)
If a surplus exists in the employers interest in the Fund the employer may be able to take advantage of it in the form of a reduction in the required contribution rate depending on the advice of the Funds actuary
Where a deficiency exists the employer is responsible for any difference between the employers share of Fund assets and the defined benefit obligation
Note 29 - Events occurring after reporting date
The services of Mr Andrew d Apice the former General Manager of the RBMC Group were finalised on 31 August 2012 Mr Dominic Schuster of NSW Treasury was then appointed as his replacement effective 1 September 2012
There were no other matters or circumstances that have arisen since the end of the financial year which significantly affected or may significantly affect the operations of the Group the results of those operations or the state of affairs of the Group in future years
End of audited financial statements
45
RESIDUAL BUSINESS MANAGEMENT CORPORATION
FINANCIAL STATEMENTS FOR THE YEAR ENDED 30 JUNE 2012
STATEMENT BY CHIEF EXECUTIVE OFFICER
RESIDUAL BUSINESS MANAGERMENT CORPORATION
Pursuant to Section 41C of the Public Finance and Audit Act 1983 I state that in my opinion
The accompanying financial statements and notes thereto exhibit a true and fair view of the financial
position of the Residual Business Management Corporation (RBMC) as at 30 June 2012 and the
financial performance for the year then ended
The financial statements have been prepared in accordance with the provisions of applicable
Australian Accounting Standards (which include Australian Accounting Interpretations) the
requirements of the Public Finance and Audit Act 1983 applicable clauses of the Public Finance and
Audit Regulation 2010 the requirements of the Financial Reporting Directions published in the
Financial Reporting Code for NSW General Government Sector Entities and the Treasurers
Directions
Further I am not aware of any circumstances which would render any particulars included in the
financial statements to be misleading or inaccurate
On behalf of the Corporation
Dominic Schuster
General Manager
Residual Business Management Corporation
Dated 6 May 2014 at Sydney
INDEPENDENT AUDITORS REPORT
Residual Business Management Corporation
To Members of the New South Wales Parliament
I have audited the accompanying financial statements of Residual Business Management Corporation (the Corporation) which comprise the statements of financial position as at 30 June 2012 the statements of comprehensive income the statements of changes in equity and the statements of cash flows for the year then ended notes comprising a summary of significant accounting policies and other explanatory information of the Corporation and the consolidated entity The consolidated entity comprises the Corporation and the entities it controlled at the year end or from time to time during the financial year
Opinion
In my opinion the financial statements
give a true and fair view of the financial position of the Corporation and the consolidated entity as at 30 June 2012 and of their financial performance and cash flows for the year then ended in accordance with Australian Accounting Standards
bull are in accordance with section 41B of Public Finance and Audit Act 1983 (the PFampA Act) and the Public Finance and Audit Regulation 2010
My opinion should be read in conjunction with the rest of this report
The General Managers Responsibility for the Financial Statements
The General Manager is responsible for the preparation of the financial statements that give a true and fair view in accordance with Australian Accounting Standards and the PFampA Act and for such internal control as the General Manager determines is necessary to enable the preparation of the financial statements that are free from material misstatement whether due to fraud or error
Auditors Responsibility
My responsibility is to express an opinion on the financial statements based on my audit I conducted my audit in accordance with Australian Auditing Standards Those standards require that I comply with relevant ethical requirements relating to audit engagements and plan and perform the audit to obtain reasonable assurance about whether the financial statements are free from material misstatement
An audit involves performing procedures to obtain audit evidence about the amounts and disclosures in the financial statements The procedures selected depend on the auditors judgement including the assessment of the risks of material misstatement of the financial statements whether due to fraud or error In making those risk assessments the auditor considers internal controls relevant to the entitys preparation of the financial statements that give a true and fair view in order to design audit procedures that are appropriate in the circumstances but not for the purpose of expressing an opinion on the effectiveness of the entitys internal control An audit also includes evaluating the appropriateness of accounting policies used and the reasonableness of accounting estimates made by the General Manager as well as evaluating the overall presentation of the financial statements
I believe the audit evidence I have obtained is sufficient and appropriate to provide a basis for my audit opinion
My opinion does not provide assurance
bull about the future viability of the Corporation or consolidated entity
bull that they have carried out their activities effectively efficiently and economically
bull about the effectiveness of internal control
bull about the security and controls over the electronic publication of the audited financial statements on any website where they may be presented
bull about any other information that may have been hyperlinked tofrom the financial statements
Independence
In conducting my audit I have complied with the independence requirements of the Australian Auditing Standards and other relevant ethical pronouncements The PFampA Act further promotes independence by
bull providing that only Parliament and not the executive government can remove an Auditor-General
bull mandating the Auditor-General as auditor of public sector agencies but precluding the provision of non-audit services thus ensuring the Auditor-General and the Audit Office of New South Wales are not compromised in their role by the possibility of losing clients or income
1~k Kheir Director Financial Audit Services
19May2014 SYDNEY
- Structure Bookmarks
-
- Figure
- Figure
- Financial Instrument Class Table A Consolidated I Parent Note Category (a) Financial assets Cash and deposits 6 Cash T Corp Hour-Glass cash facility 7 Cash trust Receivables -non-current 10 Trade receivables (at amortised cost) Receivables -current 8 Other receivables (at amortised cost) Total financial assets (b) Financial liabilities Payables 14 Trade and accruals measured at amortised cost Total financial liabilities Net financial assets Total 2012 2011 $000 $000 1041 1500 10240 12075 -7 26 49 1130
- For the year ended 30 June 2012 Consolidated (Being the Parent Entity) SASS SANCS SSS $000 $000 $000 Present value ofpartly funded defined benefit obligation at beginning ofthe year (339) -(23303) Current service cost ---Interest cost (17) -(I199) Contributions by fund participants ---Actuarial gains (losses) (157) 3 (8995) Benefits paid 76 (3) 1473 Past service cost ---Curtailments ---Settlements ---Business Combinations ---Exchange rate changes ---Present value of partly funded defined benefit obl
- For the year ended 30 June 2012 2012 Consolidated (Being the Parent Entity) SASS SANCS SSS Total Components recognised in profit or loss by component $000 $000 $000 $000 Current service cost ----Interest cost (17) -(1199) (1216) Expected return on fund assets (net ofexpenses) 22 24 1832 1878 Past service cost ----Movement in adjustment for limitation on net asset ----Curtailment or settlement gain(loss) ----Total included in Other income in the statement of 5 24 633 662 comprehensive income (refe
- Figure
- Figure
- 1~kKheir
-

RESIDUAL BUSINESS MANAGEMENT CORPORATION GROUP
NOTES TO THE FINANCIAL STATEMENTS for Year Ended 30 June 2012
Note 28 - AASB 119 Superannuation information valuation method and principal actuarial assumptions (continued)
(f) Funding arrangements for employer contributions (continued)
ii Contribution recommendations
The recommended contribution rates are as follows For the year ended 30 June 2012
Consolidated (Being the Parent Entity)
SASS SANCS SSS
Multiple of member contributions member salary Multiple ofmember contributions 000 000 000
iii Funding method
Contribution rates are set after discussions between the employer STC and NSW Treasury
iv Economic assumptions
The economic assumptions adopted for the current actuarial review of the Fund are
Weighted-average assumptions 2012 2011
Expected rate ofretum on Fund assets backing current pension liabilities 83 pa 83pa
Expected rate of return on Fund assets backing other liabilities 73 pa 73pa
Expected salary increase rate 40 pa 40pa
Expected rate of CPI increase 25 pa 25pa
(g) Nature of asset I (liability)
If a surplus exists in the employers interest in the Fund the employer may be able to take advantage of it in the form of a reduction in the required contribution rate depending on the advice of the Funds actuary
Where a deficiency exists the employer is responsible for any difference between the employers share of Fund assets and the defined benefit obligation
Note 29 - Events occurring after reporting date
The services of Mr Andrew d Apice the former General Manager of the RBMC Group were finalised on 31 August 2012 Mr Dominic Schuster of NSW Treasury was then appointed as his replacement effective 1 September 2012
There were no other matters or circumstances that have arisen since the end of the financial year which significantly affected or may significantly affect the operations of the Group the results of those operations or the state of affairs of the Group in future years
End of audited financial statements
45
RESIDUAL BUSINESS MANAGEMENT CORPORATION
FINANCIAL STATEMENTS FOR THE YEAR ENDED 30 JUNE 2012
STATEMENT BY CHIEF EXECUTIVE OFFICER
RESIDUAL BUSINESS MANAGERMENT CORPORATION
Pursuant to Section 41C of the Public Finance and Audit Act 1983 I state that in my opinion
The accompanying financial statements and notes thereto exhibit a true and fair view of the financial
position of the Residual Business Management Corporation (RBMC) as at 30 June 2012 and the
financial performance for the year then ended
The financial statements have been prepared in accordance with the provisions of applicable
Australian Accounting Standards (which include Australian Accounting Interpretations) the
requirements of the Public Finance and Audit Act 1983 applicable clauses of the Public Finance and
Audit Regulation 2010 the requirements of the Financial Reporting Directions published in the
Financial Reporting Code for NSW General Government Sector Entities and the Treasurers
Directions
Further I am not aware of any circumstances which would render any particulars included in the
financial statements to be misleading or inaccurate
On behalf of the Corporation
Dominic Schuster
General Manager
Residual Business Management Corporation
Dated 6 May 2014 at Sydney
INDEPENDENT AUDITORS REPORT
Residual Business Management Corporation
To Members of the New South Wales Parliament
I have audited the accompanying financial statements of Residual Business Management Corporation (the Corporation) which comprise the statements of financial position as at 30 June 2012 the statements of comprehensive income the statements of changes in equity and the statements of cash flows for the year then ended notes comprising a summary of significant accounting policies and other explanatory information of the Corporation and the consolidated entity The consolidated entity comprises the Corporation and the entities it controlled at the year end or from time to time during the financial year
Opinion
In my opinion the financial statements
give a true and fair view of the financial position of the Corporation and the consolidated entity as at 30 June 2012 and of their financial performance and cash flows for the year then ended in accordance with Australian Accounting Standards
bull are in accordance with section 41B of Public Finance and Audit Act 1983 (the PFampA Act) and the Public Finance and Audit Regulation 2010
My opinion should be read in conjunction with the rest of this report
The General Managers Responsibility for the Financial Statements
The General Manager is responsible for the preparation of the financial statements that give a true and fair view in accordance with Australian Accounting Standards and the PFampA Act and for such internal control as the General Manager determines is necessary to enable the preparation of the financial statements that are free from material misstatement whether due to fraud or error
Auditors Responsibility
My responsibility is to express an opinion on the financial statements based on my audit I conducted my audit in accordance with Australian Auditing Standards Those standards require that I comply with relevant ethical requirements relating to audit engagements and plan and perform the audit to obtain reasonable assurance about whether the financial statements are free from material misstatement
An audit involves performing procedures to obtain audit evidence about the amounts and disclosures in the financial statements The procedures selected depend on the auditors judgement including the assessment of the risks of material misstatement of the financial statements whether due to fraud or error In making those risk assessments the auditor considers internal controls relevant to the entitys preparation of the financial statements that give a true and fair view in order to design audit procedures that are appropriate in the circumstances but not for the purpose of expressing an opinion on the effectiveness of the entitys internal control An audit also includes evaluating the appropriateness of accounting policies used and the reasonableness of accounting estimates made by the General Manager as well as evaluating the overall presentation of the financial statements
I believe the audit evidence I have obtained is sufficient and appropriate to provide a basis for my audit opinion
My opinion does not provide assurance
bull about the future viability of the Corporation or consolidated entity
bull that they have carried out their activities effectively efficiently and economically
bull about the effectiveness of internal control
bull about the security and controls over the electronic publication of the audited financial statements on any website where they may be presented
bull about any other information that may have been hyperlinked tofrom the financial statements
Independence
In conducting my audit I have complied with the independence requirements of the Australian Auditing Standards and other relevant ethical pronouncements The PFampA Act further promotes independence by
bull providing that only Parliament and not the executive government can remove an Auditor-General
bull mandating the Auditor-General as auditor of public sector agencies but precluding the provision of non-audit services thus ensuring the Auditor-General and the Audit Office of New South Wales are not compromised in their role by the possibility of losing clients or income
1~k Kheir Director Financial Audit Services
19May2014 SYDNEY
- Structure Bookmarks
-
- Figure
- Figure
- Financial Instrument Class Table A Consolidated I Parent Note Category (a) Financial assets Cash and deposits 6 Cash T Corp Hour-Glass cash facility 7 Cash trust Receivables -non-current 10 Trade receivables (at amortised cost) Receivables -current 8 Other receivables (at amortised cost) Total financial assets (b) Financial liabilities Payables 14 Trade and accruals measured at amortised cost Total financial liabilities Net financial assets Total 2012 2011 $000 $000 1041 1500 10240 12075 -7 26 49 1130
- For the year ended 30 June 2012 Consolidated (Being the Parent Entity) SASS SANCS SSS $000 $000 $000 Present value ofpartly funded defined benefit obligation at beginning ofthe year (339) -(23303) Current service cost ---Interest cost (17) -(I199) Contributions by fund participants ---Actuarial gains (losses) (157) 3 (8995) Benefits paid 76 (3) 1473 Past service cost ---Curtailments ---Settlements ---Business Combinations ---Exchange rate changes ---Present value of partly funded defined benefit obl
- For the year ended 30 June 2012 2012 Consolidated (Being the Parent Entity) SASS SANCS SSS Total Components recognised in profit or loss by component $000 $000 $000 $000 Current service cost ----Interest cost (17) -(1199) (1216) Expected return on fund assets (net ofexpenses) 22 24 1832 1878 Past service cost ----Movement in adjustment for limitation on net asset ----Curtailment or settlement gain(loss) ----Total included in Other income in the statement of 5 24 633 662 comprehensive income (refe
- Figure
- Figure
- 1~kKheir
-