residential property price - welcome to the unece - latest news
TRANSCRIPT
BUREAU OF TRADE AND ECONOMIC INDICES, THE MINISTRY OF COMMERCE,
THAILAND
Residential Property Price: An alternative approach for house rent in
Consumer Price Index of Thailand
Benyasut Prayoth
Dispadung Chanikarn
22/4/2012
[This paper is an extensive study from “An amendment study of House Price Index from
commercial banks’ mortgage loans”, the Bank of Thailand. The authors are grateful for
useful information and valued comments]
1 | P a g e
Content
Page
Introduction 2
Data Source and Coverage 3
Methodology 4
Hedonic regression method for House price index: 4
Single house with land and Town house with land
Consumer Price Index compilation: combined with 10
House Price Index movement
Result 13
Limitations of study and Recommendation 16
Reference 18
Appendix 19
2 | P a g e
I. Introduction
House rent index compilation varies among countries as opposed to consumer price
index compilation where the approach has been standardized to the same alignment around
the world. Many methods are proposed, yet it has not been concluded which is the best one.
Due to the fact that each country applies an approach considered the best at that time, house
rent index has still been critical and ambiguous part in Consumer Price Index for many years.
Since house rent accounts for 15.19 percent (at base year, 2007) in Consumer Price
Index of Thailand – the largest for non-food and beverage in CPI basket, its movement
significantly affects the index. Currently, house rent index in Thailand is compiled from
actual rent survey across country. Even though it shows actual rent that each household
spends, it is doubtful in terms of representation. Due to the fact that 80 percent of private
households occupy their own residences while only 10 percent rent shelter according to the
National Statistical Office1, actual rent survey might not represent true housing service of
majority. In addition, sample selection in rent survey is based on price collectors’ judgment
rather than statistical rationale, it is likely to contribute sample bias and inevitably affect the
quality of house rent index as well as consumer price index. Moreover, house rent index in
Thailand indicates low rate of change over time - close to zero - regardless of economic
cycle. This is unlikely since house rent tends to fluctuate with economy, particularly real
estate sector. These factors encourage Thailand for a further study in order to improve indices
in terms of house rent and consumer price.
Bureau of Trade and Economic Indices, the Ministry of Commerce is writing this
paper in collaboration with the Bank of Thailand to initiate an alternative approach for house
rent index in consumer price index of Thailand. This study consists of two main sections:
1 the 2000 population and housing census whole kingdom, the National of Statistical Office, Office of the
Prime Minister, 2000
3 | P a g e
hedonic regression of house price index2– considered as owners’ equivalent rent index in this
study – and implication of its movement to house rent index and consumer price index of
Thailand.
With highly-integrated database of new mortgage loans from 17 commercial banks in
Bangkok metropolis and suburb areas using hedonic regression model, the Bank of Thailand
has constructed house price index which consists of single house with land, town house with
land, condominium and land on monthly basis from March 2008. Assuming that owner’s
equivalent rent index has the same movement as house price index, Bureau of Trade and
Economic Indices turns to account of those indices and experimentally applies them to house
rent index and consumer price index respectively. A comparison of index series between
current and alternative approach in the light of economic cycle consistency will allow us to
evaluate their effectiveness for the sake of methodology recommendation in the future.
II. Data source and coverage
As for house price index, monthly data of new mortgage loans from 17 registered
commercial banks in Bangkok metropolis and 5 suburbs: Nothaburi, Pathumthani, Samut
Prakarn, Samut Sakorn, and Nakornpathom since January 2008 is used for index compilation.
The data is categorized into 3 groups: borrower features, loan features, and housing features.
The appraisal property price with land within housing features category will be extracted to
impute housing price and compile the index due to its reliability and completeness. Note that
83 percent of new personal loans in this database are mainly for new residential property.
This implies that the house price index would rather reflect the price of newly established
residential property than used residential property.
2
House price index: Commercial banks mortgages’ loans in Thailand, 2011, Bank of Thailand

4 | P a g e
Regarding consumer price index compilation, Bureau of Trade and Economic Indices,
the Ministry of Commerce will excerpt only single house with land and town house with land
price index and consolidate them into consumer price index within the same area and time
coverage. Although Bank of Thailand provides separate price index for single house with
land, town house with land, condominium, and land; both condominium and land are less
likely to be included in house rent survey. Furthermore, single house and town house account
for 78.8 percent of total dwellings according to the National Statistical Office3.
III. Methodology
(1) Hedonic regression method for House price index: Single house with land and
Town house with land
Since repeat sales method requires intensive and well-developed used property
database and Thailand has yet developed into this stage, hedonic regression method seems to
be the best option to construct house price index in Thailand4. Basically, hedonic regression
method relates property prices to their price determining characteristics. Furthermore, to
compare the prices in different period, those characteristics are standardized in order to
remove the difference in terms of quality and location of properties. This implies that
property prices will be qualitatively adjusted and reflects movement in prices only. Ideally,
this approach obliges extensive database particularly dominant price determining
characteristics to capture estimated property prices; however, some variables are difficult to
quantify. Each country has selected those variables from their availability, completeness and
significance in the model. There are no standardized selection criteria. In the case of
Thailand, the Bank of Thailand includes 4 variables: age, number of storey, type of
3
the 2010 population and housing census whole kingdom, the National of Statistical Office, Office of the Prime
Minister, 2010 4
House price index: Commercial banks mortgages’ loans in Thailand, 2011, Bank of Thailand
5 | P a g e
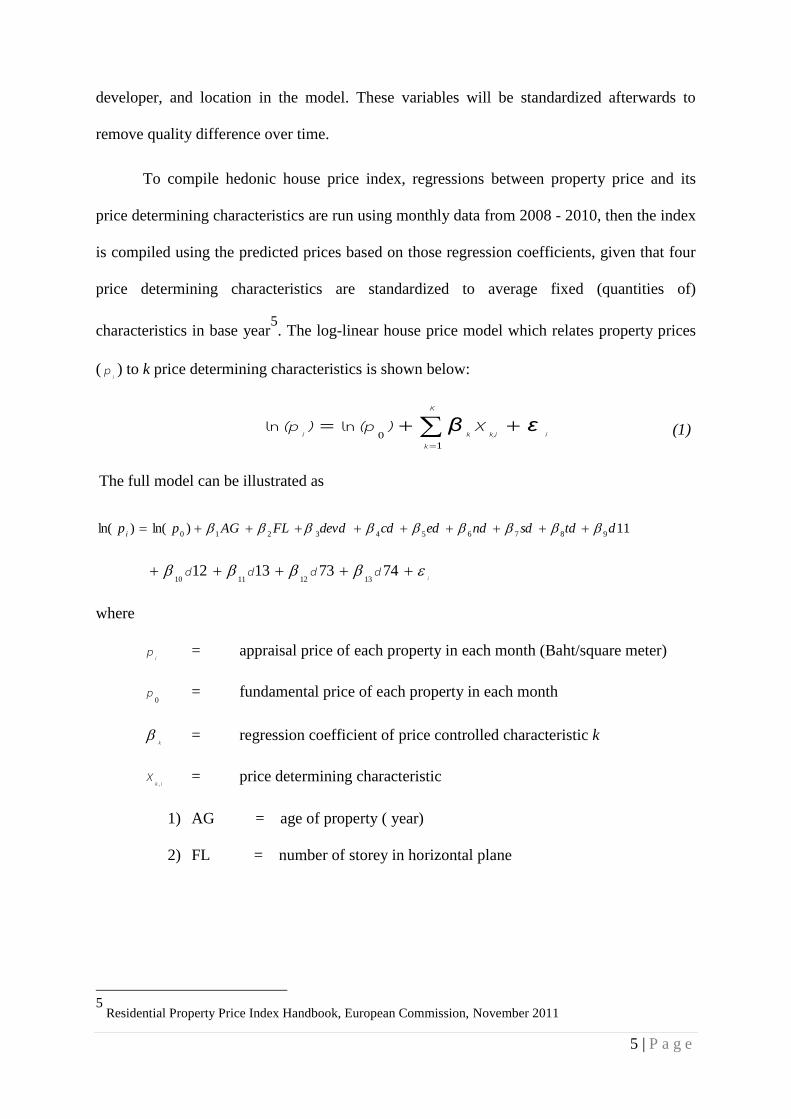
developer, and location in the model. These variables will be standardized afterwards to
remove quality difference over time.
To compile hedonic house price index, regressions between property price and its
price determining characteristics are run using monthly data from 2008 - 2010, then the index
is compiled using the predicted prices based on those regression coefficients, given that four
price determining characteristics are standardized to average fixed (quantities of)
characteristics in base year5. The log-linear house price model which relates property prices
(ip ) to k price determining characteristics is shown below:
K
kik,iki
εXβ)(p)(p1
0lnln (1)
The full model can be illustrated as
11)ln()ln(9876543210dtdsdndedcddevdFLAGpp
i
idddd 74731312
13121110
where
ip = appraisal price of each property in each month (Baht/square meter)
0p = fundamental price of each property in each month
k
= regression coefficient of price controlled characteristic k
ik
X, = price determining characteristic
1) AG = age of property ( year)
2) FL = number of storey in horizontal plane
5
Residential Property Price Index Handbook, European Commission, November 2011
6 | P a g e
3) devd = dummy variable for type of developer
a. developers enlisted in Stock Exchange of Thailand = 1
b. developers not enlisted in Stock Exchange of Thailand and
contractors = 0
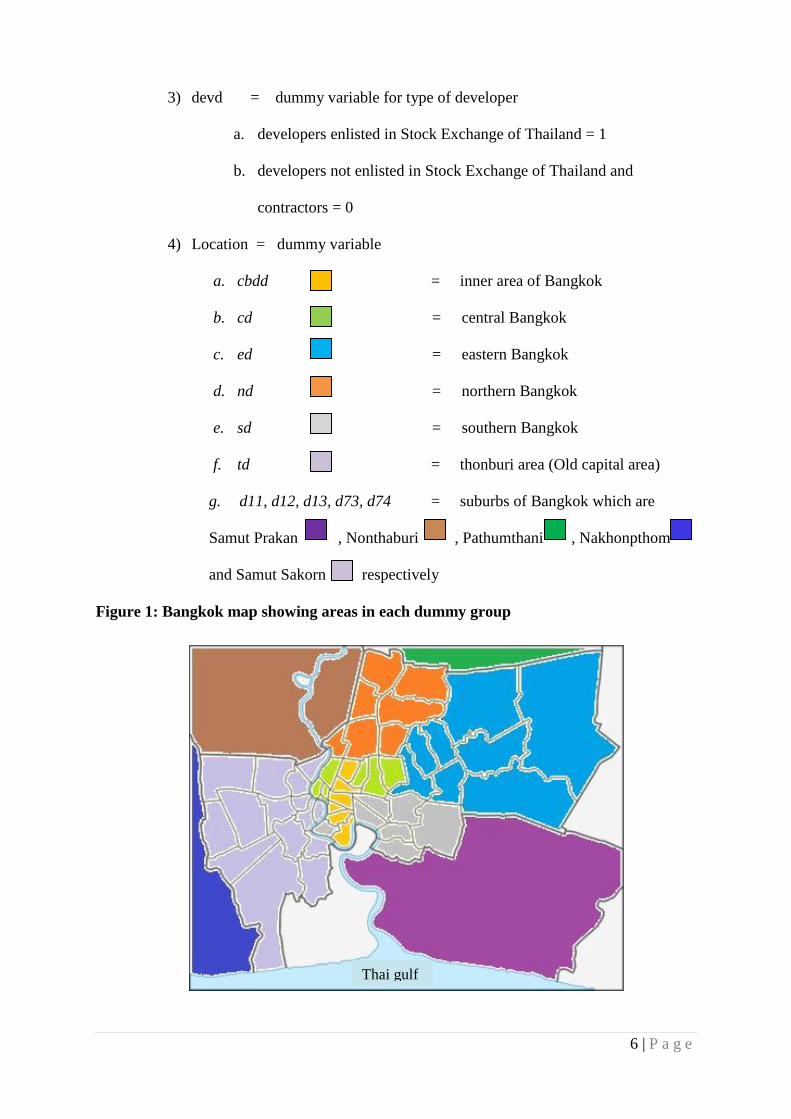
4) Location = dummy variable
a. cbdd = inner area of Bangkok
b. cd = central Bangkok
c. ed = eastern Bangkok
d. nd = northern Bangkok
e. sd = southern Bangkok
f. td = thonburi area (Old capital area)
g. d11, d12, d13, d73, d74 = suburbs of Bangkok which are
Samut Prakan , Nonthaburi , Pathumthani , Nakhonpthom
and Samut Sakorn respectively
Figure 1: Bangkok map showing areas in each dummy group
Thai gulf
7 | P a g e
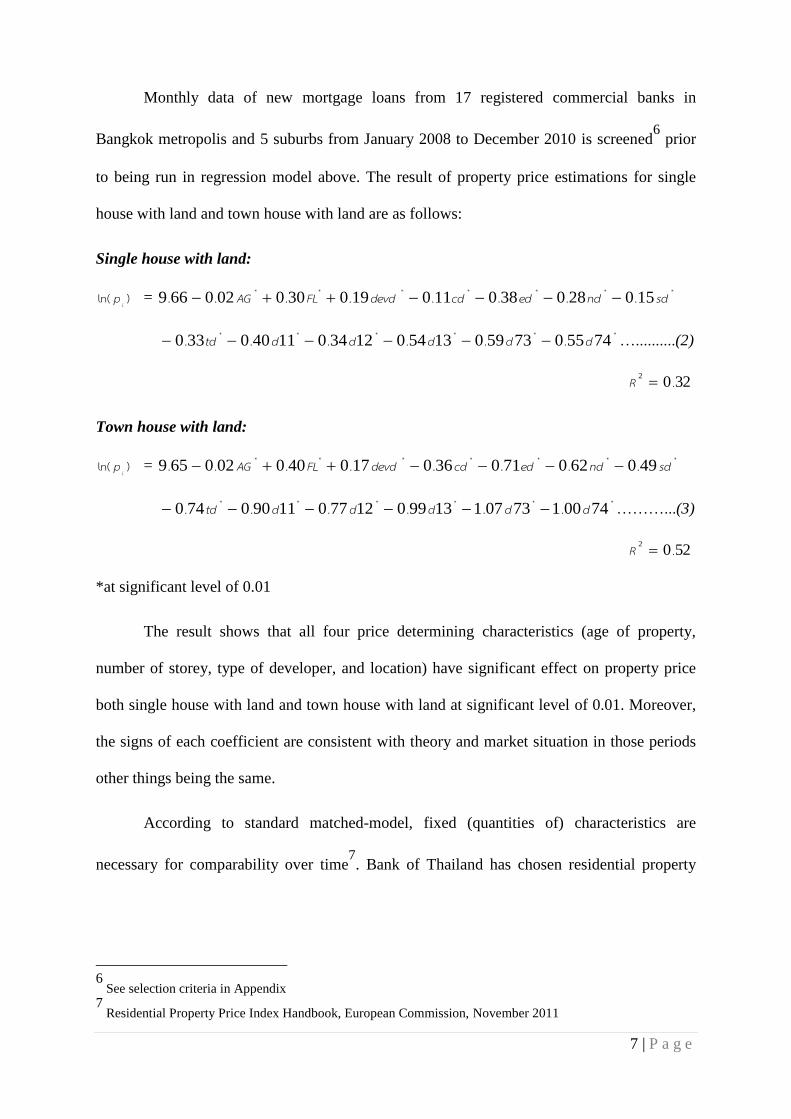
Monthly data of new mortgage loans from 17 registered commercial banks in
Bangkok metropolis and 5 suburbs from January 2008 to December 2010 is screened6 prior
to being run in regression model above. The result of property price estimations for single
house with land and town house with land are as follows:
Single house with land:
)ln(ip =
******* ........ sdndedcddevdFLAG 150280380110190300020669
****** ...... 7455073590135401234011400330 dddddtd …..........(2)
3202 .R
Town house with land:
)ln(ip =
******* ........ sdndedcddevdFLAG 490620710360170400020659
****** ...... 7400173071139901277011900740 dddddtd ………...(3)
5202 .R
*at significant level of 0.01
The result shows that all four price determining characteristics (age of property,
number of storey, type of developer, and location) have significant effect on property price
both single house with land and town house with land at significant level of 0.01. Moreover,
the signs of each coefficient are consistent with theory and market situation in those periods
other things being the same.
According to standard matched-model, fixed (quantities of) characteristics are
necessary for comparability over time7. Bank of Thailand has chosen residential property
6
See selection criteria in Appendix 7
Residential Property Price Index Handbook, European Commission, November 2011
8 | P a g e
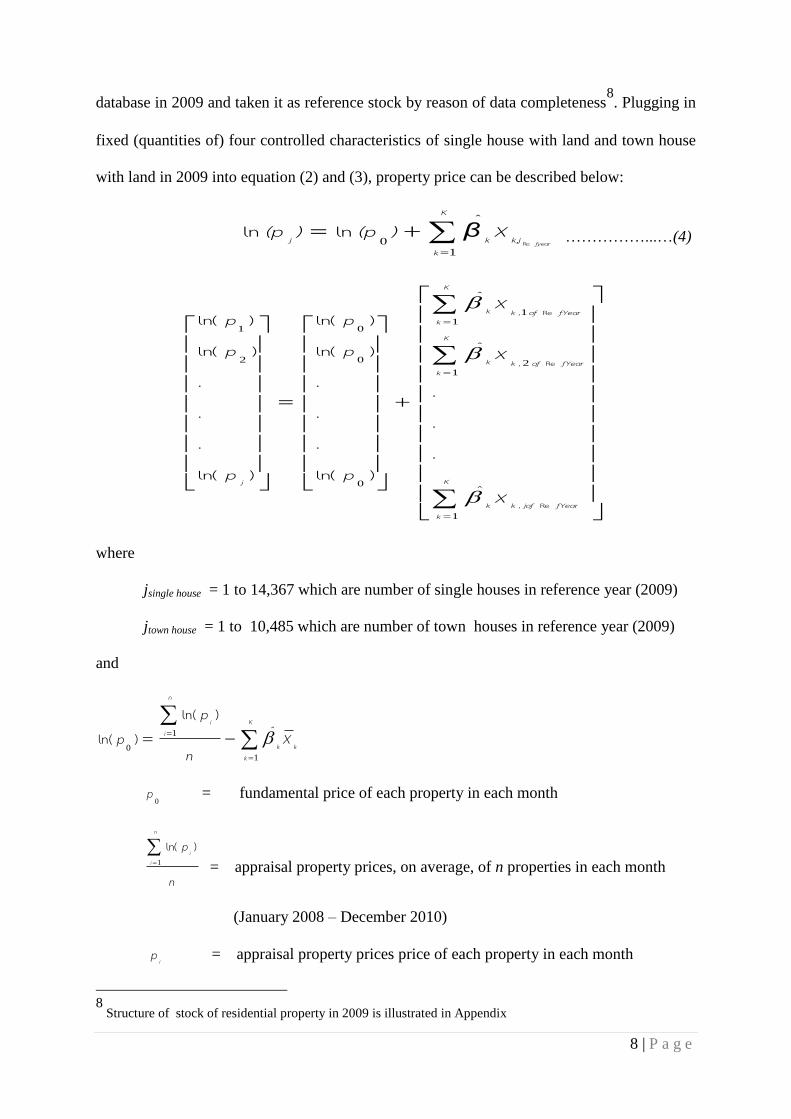
database in 2009 and taken it as reference stock by reason of data completeness8. Plugging in
fixed (quantities of) four controlled characteristics of single house with land and town house
with land in 2009 into equation (2) and (3), property price can be described below:
K
kk,jkj fyearXβ)(p)(p
10 Re
ˆlnln ……………...…(4)
K
kfYearjofkk
K
kfYearofkk
K
kfYearofkk
j
X
X
X
p
p
p
p
p
p
1
12
11
0
0
0
2
1
Re,
Re,
Re,
ˆ
.
.
.
ˆ
ˆ
)ln(
.
.
.
)ln(
)ln(
)ln(
.
.
.
)ln(
)ln(
where
jsingle house = 1 to 14,367 which are number of single houses in reference year (2009)
jtown house = 1 to 10,485 which are number of town houses in reference year (2009)
and
K
kkk
n
ii
Xn
p
p1
1
0̂
)ln(
)ln(
0p = fundamental price of each property in each month
n
pn
ii
1
)ln(
= appraisal property prices, on average, of n properties in each month
(January 2008 – December 2010)
ip = appraisal property prices price of each property in each month
8
Structure of stock of residential property in 2009 is illustrated in Appendix
9 | P a g e
(January 2008 – December 2010)
kX = average of controlled characteristic k of n properties in each month
(January 2008 – December 2010)
Imputed prices from equation (4) above are equivalent to prices of property in
respective year whose have matched characteristics as underlying property in reference year
(2009).
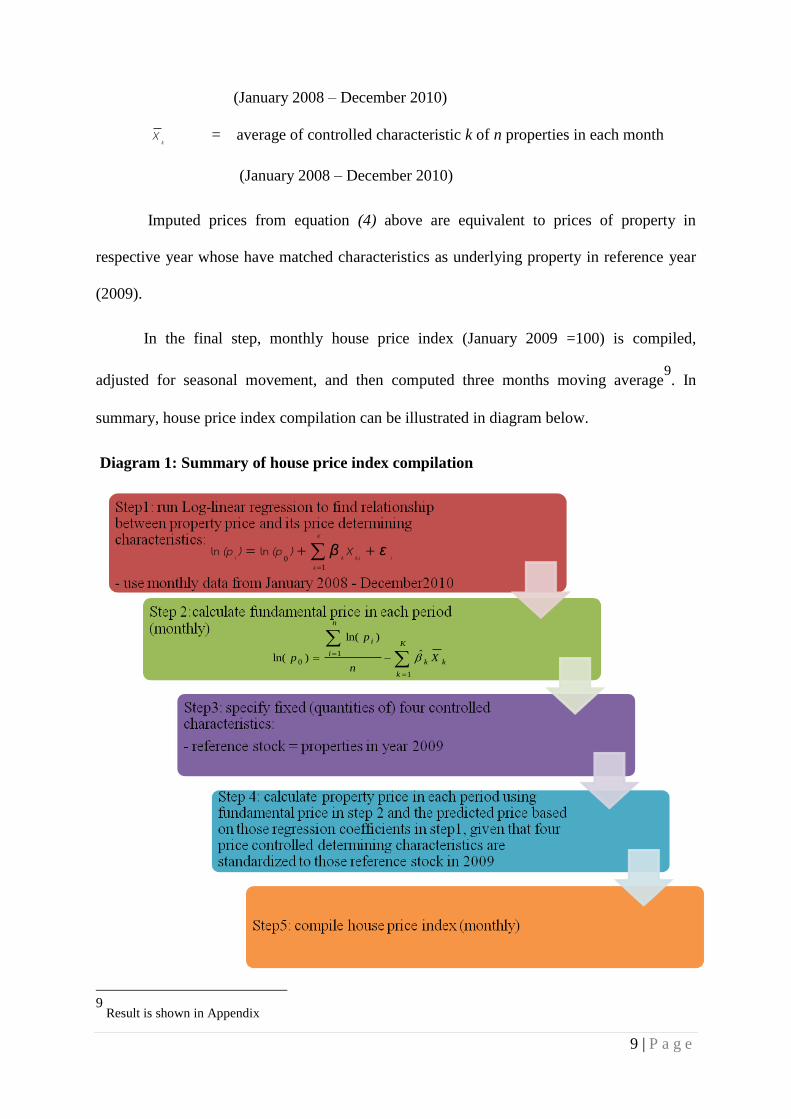
In the final step, monthly house price index (January 2009 =100) is compiled,
adjusted for seasonal movement, and then computed three months moving average9. In
summary, house price index compilation can be illustrated in diagram below.
Diagram 1: Summary of house price index compilation
9
Result is shown in Appendix
K
kik,iki
εXβ)(p)(p1
0lnln
K
k
kk
n
i
i
Xn
p
p
1
10
ˆ
)ln(
)ln(

10 | P a g e
(2) Consumer Price Index compilation: combined with House Price Index movement
Bureau of Trade and Economic Indices, the Ministry of Commerce Thailand has
compiled consumer price index to quantify a cost of living of people in municipal areas
which are grouped into 5 regions: Bangkok metropolis and suburbs, Northern region, Central
region, North Eastern region, and Southern region. Bangkok metropolis and suburbs consists
of Bangkok, Nonthabuti, Pathumthanui, and Samut Prakarn – less coverage than the data
used for house price index explained above.
Consumer Price Index is calculated from an arithmetic mean of changes in commodity
prices in a reference basket. Those commodities are classified into 7 groups10
according to
Classification of Individual Consumption According to Purpose, COICOP, by the United
Nations):
1. Food and Beverages
2. Apparel and Footwear
3. Housing and Furnishing
a. Shelter which includes house rent
b. Electricity, fuel and water supply
c. Textile – house furnishing
d. Miscellaneous appliances
e. Household furnishing and equipments
f. Cleaning supplies
g. House services
4. Medical and Personal care
5. Transportation and Communication
10
Subgroup details are illustrated in Appendix
11 | P a g e
6. Recreation and Education
7. Tobacco and Alcoholic beverages
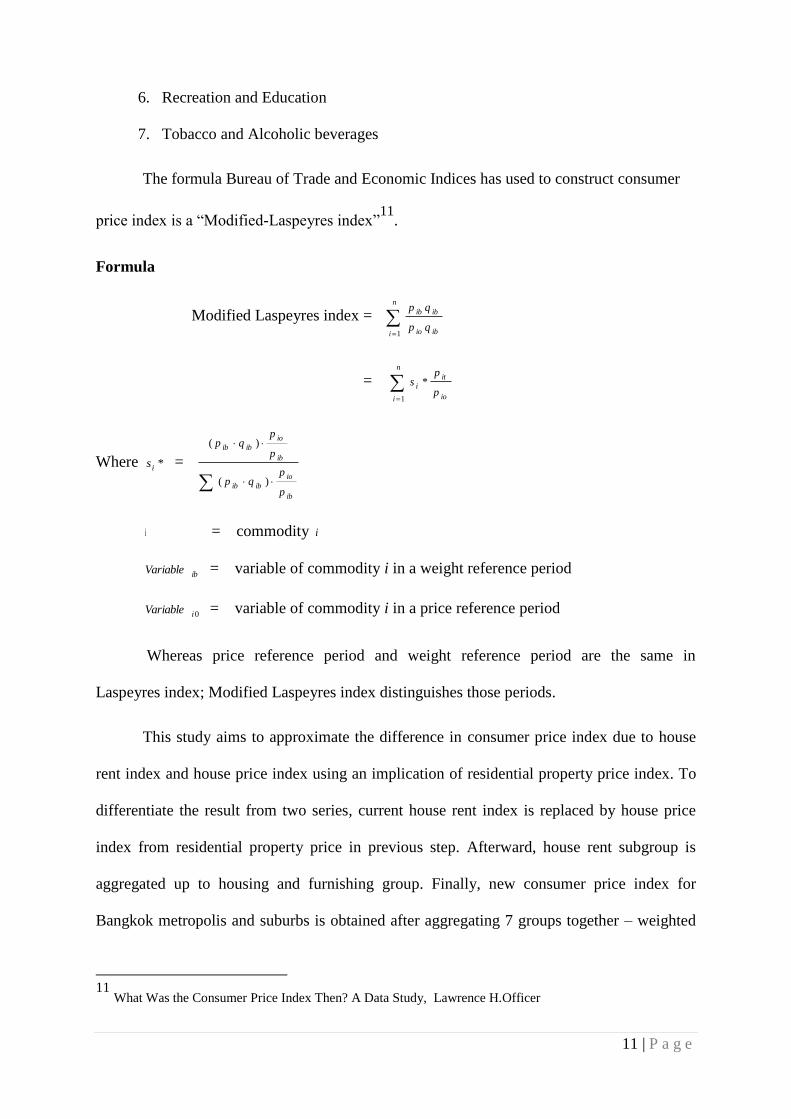
The formula Bureau of Trade and Economic Indices has used to construct consumer
price index is a “Modified-Laspeyres index”11
.
Formula
Modified Laspeyres index =
n
i ibio
ibib
qp
qp
1
=
n
i io
it
ip
ps
1
*
Where *is =
ib
io
ibib
ib
io
ibib
p
pqp
p
pqp
)(
)(
i = commodity i
ibVariable = variable of commodity i in a weight reference period
0iVariable = variable of commodity i in a price reference period
Whereas price reference period and weight reference period are the same in
Laspeyres index; Modified Laspeyres index distinguishes those periods.
This study aims to approximate the difference in consumer price index due to house
rent index and house price index using an implication of residential property price index. To
differentiate the result from two series, current house rent index is replaced by house price
index from residential property price in previous step. Afterward, house rent subgroup is
aggregated up to housing and furnishing group. Finally, new consumer price index for
Bangkok metropolis and suburbs is obtained after aggregating 7 groups together – weighted
11
What Was the Consumer Price Index Then? A Data Study, Lawrence H.Officer

12 | P a g e
with group weight. However, it is assumed that expenditure structure and weight for new
series of consumer price index remain unchanged from old series. In the end, all consumer
price index series are rebased to January 2009 in the same alignment as house price index
study from the Bank of Thailand. Two steps of methodology can be summarized in diagram
below
Diagram 2: Summary of methodology
13 | P a g e
IV. Results
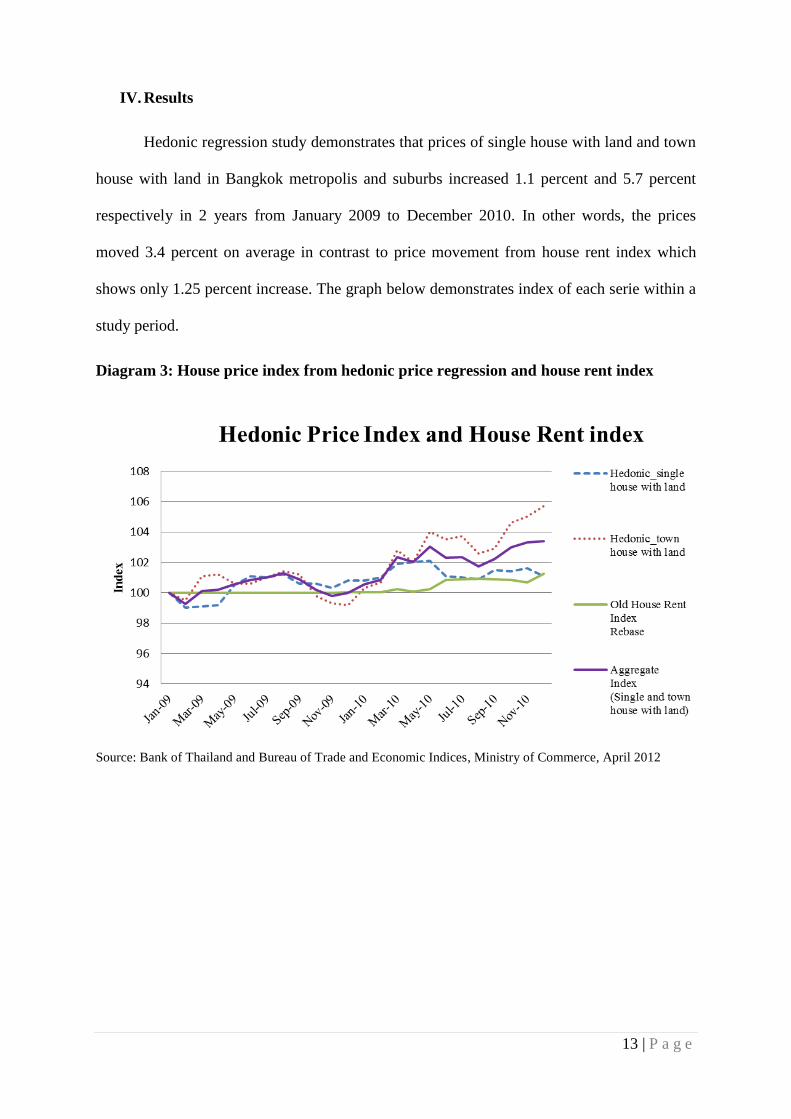
Hedonic regression study demonstrates that prices of single house with land and town
house with land in Bangkok metropolis and suburbs increased 1.1 percent and 5.7 percent
respectively in 2 years from January 2009 to December 2010. In other words, the prices
moved 3.4 percent on average in contrast to price movement from house rent index which
shows only 1.25 percent increase. The graph below demonstrates index of each serie within a
study period.
Diagram 3: House price index from hedonic price regression and house rent index
Source: Bank of Thailand and Bureau of Trade and Economic Indices, Ministry of Commerce, April 2012
14 | P a g e
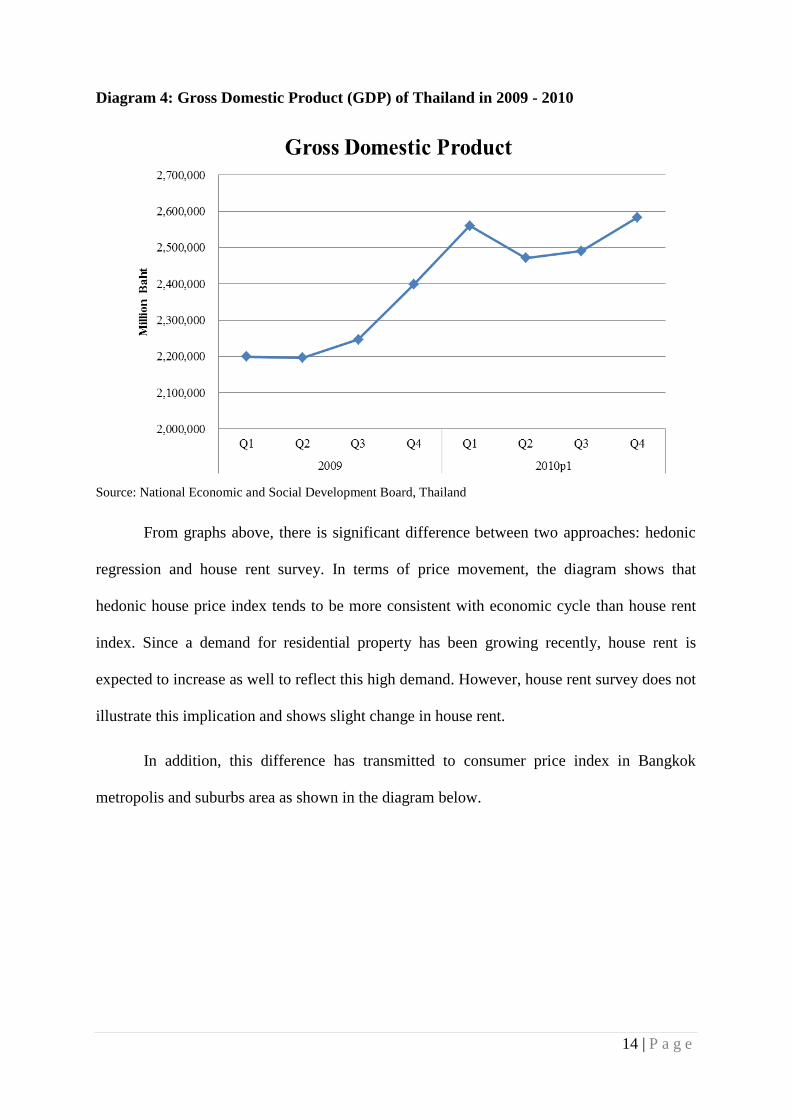
Diagram 4: Gross Domestic Product (GDP) of Thailand in 2009 - 2010
Source: National Economic and Social Development Board, Thailand
From graphs above, there is significant difference between two approaches: hedonic
regression and house rent survey. In terms of price movement, the diagram shows that
hedonic house price index tends to be more consistent with economic cycle than house rent
index. Since a demand for residential property has been growing recently, house rent is
expected to increase as well to reflect this high demand. However, house rent survey does not
illustrate this implication and shows slight change in house rent.
In addition, this difference has transmitted to consumer price index in Bangkok
metropolis and suburbs area as shown in the diagram below.

15 | P a g e
Diagram 5: Effect on Consumer Price Index (Bangkok and its suburbs)
Source: Bank of Thailand and Bureau of Trade and Economic Indices, April 2012
The Consumer Price Index in Bangkok metropolis and suburbs shifts upward when it
is applied by hedonic house price index in house rent subgroup shown in all RPPI serie. In
other words, the consumer price index with hedonic house price index increases by 0.51
percent on average as opposed to current method - house rent survey.
Based on data from Bangkok metropolis and suburbs, this study implies that a
problem of sample selection bias is expected to be less as hedonic house price index has
specific sample selection criteria. After all, this contributes to better representation on
consumer price index. Above and beyond, hedonic house price index is able to provide more
favorable index regarding economic cycle consistency particularly with real estate sector. In
conclusion, hedonic house price index - taken into account as owners’ equivalent rent in this
case - computed from new mortgage loans data from commercial banks can be an alternative
proxy which improves the Consumer Price Index in Thailand concerning better
representation and economic cycle consistency.

16 | P a g e
V. Limitations of study and Recommendation
1. Difference in coverage area between hedonic house price regression and house rent
survey might overestimate a divergence of house rent in this study. It would influence
consumer price index after all. House rent survey as well as consumer price index has
covered 4 provinces which are Bangkok metropolis, Nonthaburi, Pathumthani, and Samut
Prakarn while hedonic house price index has used more extensive data – 6 provinces from
Bangkok metropolis, Nonthaburi, Pathumthani, Samut Prakarn, Samut Sakorn, and
Nakornpathom. However, we expect that an overestimation is scant since a behavior of 2
additional provinces in hedonic house price index study are likely to be similar to the rest of
the suburb areas.
2. This study has excluded hedonic price index of condominium price for the sake of
comparability with old consumer price index series due to the fact that few condominiums are
included in house rent survey. In fact, nowadays people tend to live in condominiums, this
urges index compilers to reconsider types of dwelling coverage in order to reflect people’s
current lifestyle.
3. As index from hedonic regression and consumer price have different base periods,
index variation might prevail when we have rebased consumer price index to the same period
as hedonic house price index.
4. This study simplifies that price movement of single house with land and town house
with land represents the movement of other properties as well. This might overstate price
movement of all properties in general since the market of single house and town house has
currently been more widespread and competitive. In order to capture overall residential price
movement precisely, hedonic regression for other properties are essential.

17 | P a g e
5. In spite that four price determining characteristics are controlled in hedonic
regression: age of property, number of storey, types of developer, and location; standardized
quantity of these variables might vary over time. A revision of regression is necessary to
capture their changes as well as other changes in the market such as market structure,
monetary environment, and consumer behavior.
6. Additionally, other price determining characteristics have not been controlled in
hedonic regression study due to inaccessibility to those data. Likewise, some of them are
sophisticated to quantify. Further assistance from many organizations is necessary in order to
fill in the gap and strengthen the quality of hedonic house price index.
*******************************
18 | P a g e
Reference
Ruja Adisornkarnjana and Phongpiyapaiboon Notisarn, “An amended study of House Price
Index from commercial banks’ mortgage loans”, Bank of Thailand, May 2011
The 2010 population and housing census whole kingdom, National of Statistical Office,
Office of the Prime Minister, 2010
“Residential Property Price Index Handbook”, European Commission, November 2011
Prayoth Benyasut, “Consumer Price Index Handbook”, Bureau of Trade and Economic
Indices
Lawrence H.Officer , “What Was the Consumer Price Index Then? A Data Study”,
University of Illinois at Chicago

19 | P a g e
Appendix
Table 1: Data screening criteria
Type of property Single house Town house
Appraisal price
(price per house)
500,000– 900,000 300,000 - 40,000,000
Age of property (year) Less than 30 Less than 30
Number of storey 1-3 1-3
Usage area (square meter) 90 – 1,300 60 – 400
Size of land (square
two-meters)
50 – 1,000 16 - 45
Source: A study of Residential Property Price Index of Thailand, May 2011
Table 2: Regression samples in Bangkok Metropolis and suburbs in 2008 – 2010 after
data screening process
Type of property Total data Incomplete data
(refer to table 1)
Samples
Single house 69,168 30,176 38,992
Town house 61,961 28,460 33,501
Source: A study of Residential Property Price Index of Thailand, May 2011

20 | P a g e
Diagram 1: Structure of reference stock in 2009
Single house Town House

21 | P a g e
Diagram 1 (cont.): Structure of reference stock in 2009
Single house Town House
Table 3: House Price Index: Hedonic Regression Result
Period Hedonic_single
house with land
Hedonic_town house
with land
Aggregate
Index
(Single and town house
with land)
Jan-09 100.00 100.00 100.00
Feb-09 99.00 99.50 99.25
Mar-09 99.10 101.10 100.10
Apr-09 99.20 101.20 100.20
May-09 100.50 100.60 100.55
Jun-09 101.10 100.60 100.85
Jul-09 101.00 101.00 101.00
Aug-09 101.20 101.40 101.30
Sep-09 100.60 101.20 100.90
Oct-09 100.60 99.80 100.20
Nov-09 100.30 99.30 99.80
Dec-09 100.80 99.20 100.00
Jan-10 100.80 100.30 100.55
Feb-10 101.00 100.70 100.85
Mar-10 101.90 102.80 102.35
Apr-10 102.00 102.00 102.00
May-10 102.10 104.00 103.05
Jun-10 101.10 103.50 102.30
Jul-10 101.00 103.70 102.35

22 | P a g e
Table 3 (cont.): Residential Property Price Index: Hedonic Regression Result
Source: Bank of Thailand
Table 4: Groups and Subgroups in Consumer Price Index of Thailand
CODE GROUP SUBGROUP WEIGHT IN
BASE YEAR
0 ALL COMMODITIES 100
1000 FOOD AND BEVERAGES 33.01
1110 RICE, FLOUR AND CEREAL PRODUCTS 2.88
1120 MEATS, POULTRY AND FISH 5.73
1121 MEATS 2.29
1122 DUCK, CHICKEN AND FROG 1.08
1123 FISH AND AQUATIC ANIMALS 2.37
1130 EGGS AND DAIRY PRODUCTS 2.1
1140 VEGETABLES AND FRUITS 3.9
1150 SEASONINGS AND CONDIMENTS 1.95
1160 NON-ALCOHOLIC BEVERAGES 2
1200 PREPARED FOOD 14.45
1210 PREPARED FOOD AT HOME 7.93
1220 FOOD AWAY FROM HOME 6.52
2000 APPAREL AND FOOTWARE 2.96
3000 HOUSING AND FURNISHING 23.48
3100 SHELTER 15.91
3110 HOUSE RENT 15.19
3200 ELECTRICITY, FUEL AND WATER SUPPLY 5.1
3300 TEXTILE - HOUSE FURNISHING 0.18
3400 MISCELLANEIUS APPLIANCES
3500 HOUSEHOLD FURNISHING AND EQUIPMENTS
Period Hedonic_single
house with land
Hedonic_town house
with land
Aggregate
Index
(Single and town house
with land)
Aug-10 100.90 102.60 101.75
Sep-10 101.50 102.90 102.20
Oct-10 101.40 104.60 103.00
Nov-10 101.60 105.00 103.30
Dec-10 101.10 105.70 103.40

23 | P a g e
Table 4 (cont.): Groups and Subgroups in Consumer Price Index of Thailand
CODE GROUP SUBGROUP WEIGHT IN
BASE YEAR
3600 CLEANIMG SUPPLIES 1.43
3700 HOUSE SERVICES
4000 MEDICAL AND PERSONAL CARE 6.87
4100 MEDICAL CARE 2.17
4200 PERSONAL CARE EXPENDITURES 3.8
5000 TRANSPORTATION AND
COMMUNICATION 26.8
5100 PUBLIC TRANSPORTATION SERVICES 5.22
5200 VEHICLES AND VEHICLE OPERATION 13.56
5400 COMMUNICATION AND EQUIPMENTS 4.48
6000 RECREATION AND EDUCATION 5.21
7000 TOBACCO AND ALCOHOLIC
BEVERAGES 1.66
Table 5: Results of Consumer Price Index compilation: combined with House Price
Index movement
Period All Rebase All RPPI
Jan-09 100.00 100.00
Feb-09 101.16 101.22
Mar-09 101.59 101.78
Apr-09 102.39 102.59
May-09 101.98 102.33
Jun-09 102.40 102.84
Jul-09 102.30 102.77
Aug-09 102.55 103.10
Sep-09 102.76 103.22
Oct-09 102.83 103.18
Nov-09 103.05 103.35
Dec-09 102.89 103.21
Jan-10 103.52 104.03
Feb-10 104.07 104.62
Mar-10 104.24 105.01
Apr-10 104.69 105.53
May-10 104.87 105.85

24 | P a g e
Table 5 (cont.): Results of Consumer Price Index compilation: combined with House
Price Index movement
Source: Bureau of Trade and Economic Indices, Ministry of Commerce
Period All Rebase All RPPI
Jun-10 105.19 105.92
July-10 105.40 106.12
Aug-10 105.59 106.21
Sept-10 105.52 106.20
Oct-10 105.47 106.30
Nov-10 105.61 106.53
Dec-10 105.94 106.77