residential markets
DESCRIPTION
Residential markets in France, Germany and the Netherlands and Researchwork in the real estate marketTRANSCRIPT
Residential markets in France,
Germany and the Netherlands
and Researchwork in the
real estate market
Bucarest 24th.october 2013
Han Joosten,
Director Market Research
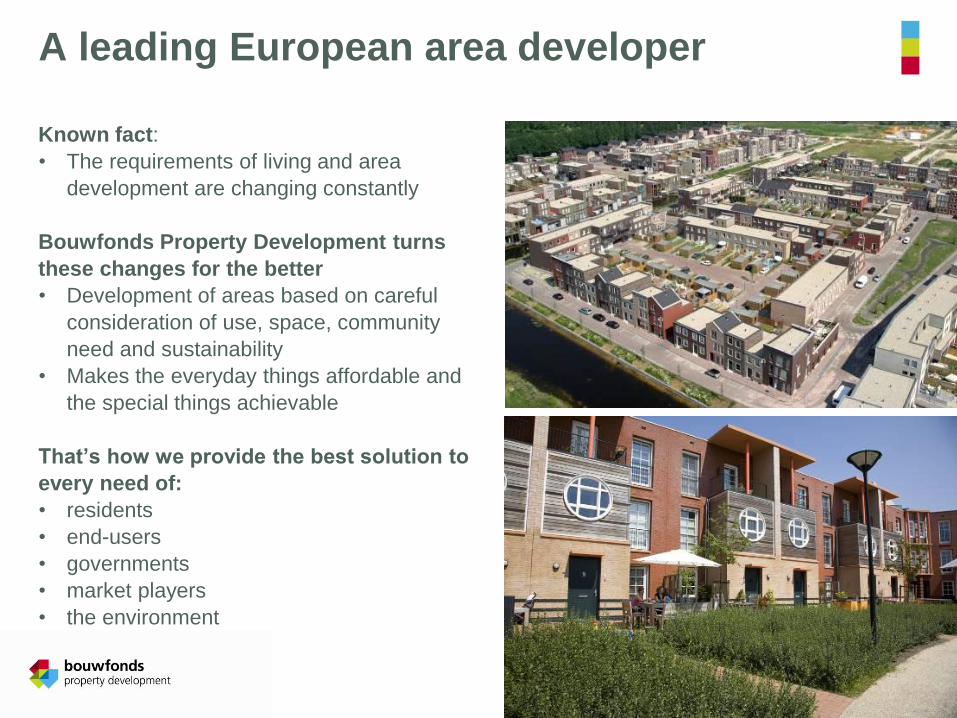
A leading European area developer
Known fact:
• The requirements of living and area
development are changing constantly
Bouwfonds Property Development turns
these changes for the better
• Development of areas based on careful
consideration of use, space, community
need and sustainability
• Makes the everyday things affordable and
the special things achievable
That’s how we provide the best solution to
every need of:
• residents
• end-users
• governments
• market players
• the environment
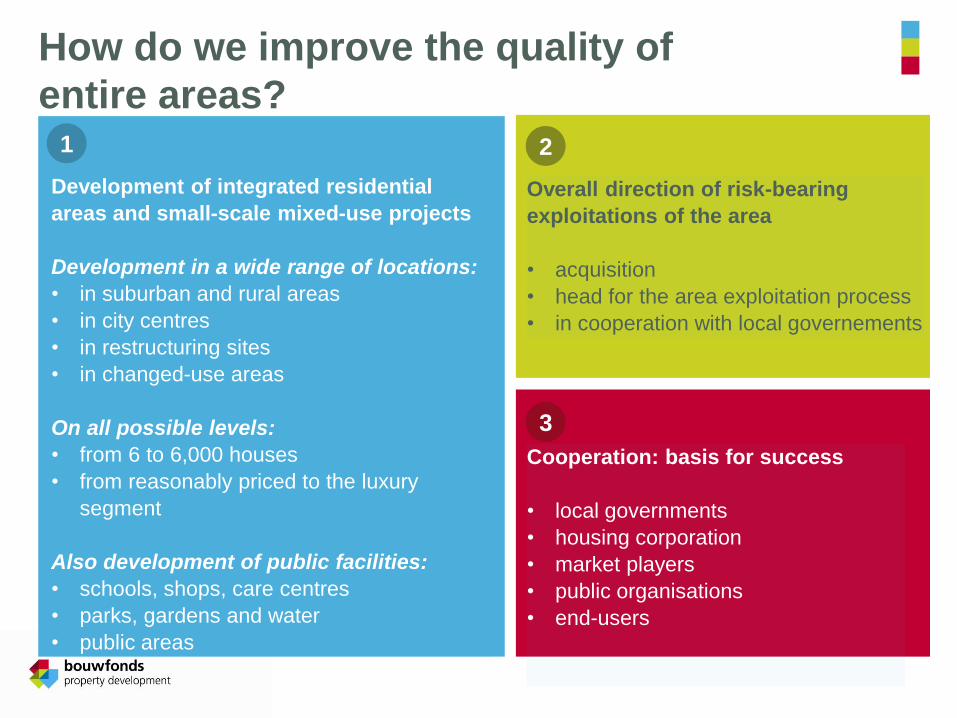
How do we improve the quality of
entire areas? 1 2
3
Development of integrated residential
areas and small-scale mixed-use projects
Development in a wide range of locations:
• in suburban and rural areas
• in city centres
• in restructuring sites
• in changed-use areas
On all possible levels:
• from 6 to 6,000 houses
• from reasonably priced to the luxury
segment
Also development of public facilities:
• schools, shops, care centres
• parks, gardens and water
• public areas
Overall direction of risk-bearing
exploitations of the area
• acquisition
• head for the area exploitation process
• in cooperation with local governements
Cooperation: basis for success
• local governments
• housing corporation
• market players
• public organisations
• end-users
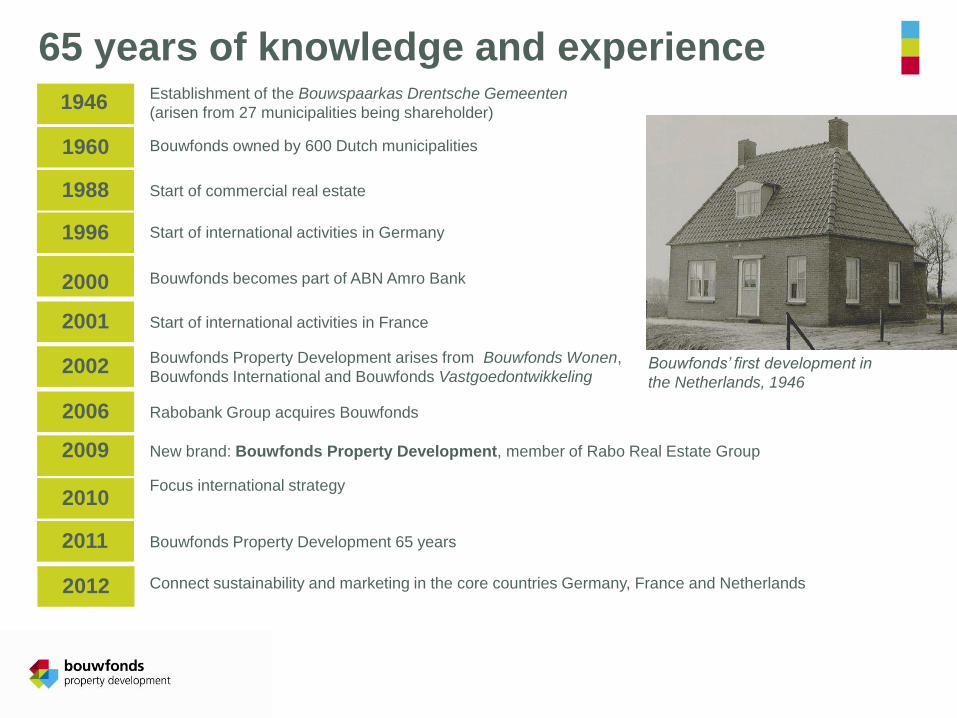
65 years of knowledge and experience Establishment of the Bouwspaarkas Drentsche Gemeenten
(arisen from 27 municipalities being shareholder) 1946
1960
1988
1996
2000
2001
2002
2006
2009
Bouwfonds owned by 600 Dutch municipalities
Start of commercial real estate
Start of international activities in Germany
Bouwfonds becomes part of ABN Amro Bank
Start of international activities in France
Bouwfonds Property Development arises from Bouwfonds Wonen,
Bouwfonds International and Bouwfonds Vastgoedontwikkeling
Rabobank Group acquires Bouwfonds
New brand: Bouwfonds Property Development, member of Rabo Real Estate Group
Bouwfonds’ first development in
the Netherlands, 1946
2010 Focus international strategy
2011 Bouwfonds Property Development 65 years
2012 Connect sustainability and marketing in the core countries Germany, France and Netherlands
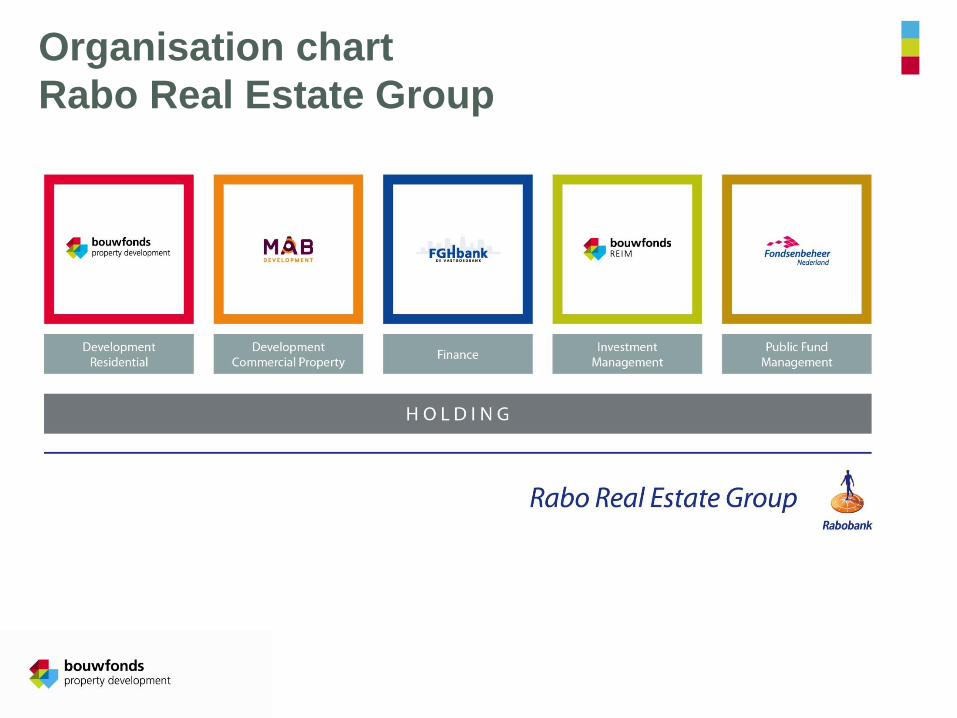
Organisation chart
Rabo Real Estate Group
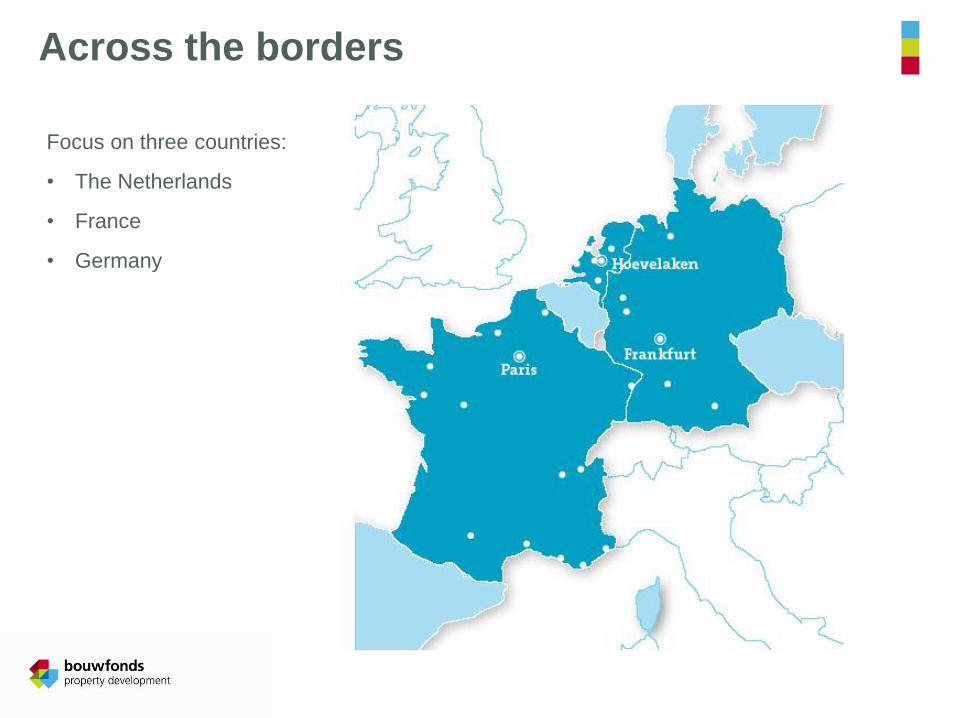
Across the borders
Focus on three countries:
• The Netherlands
• France
• Germany
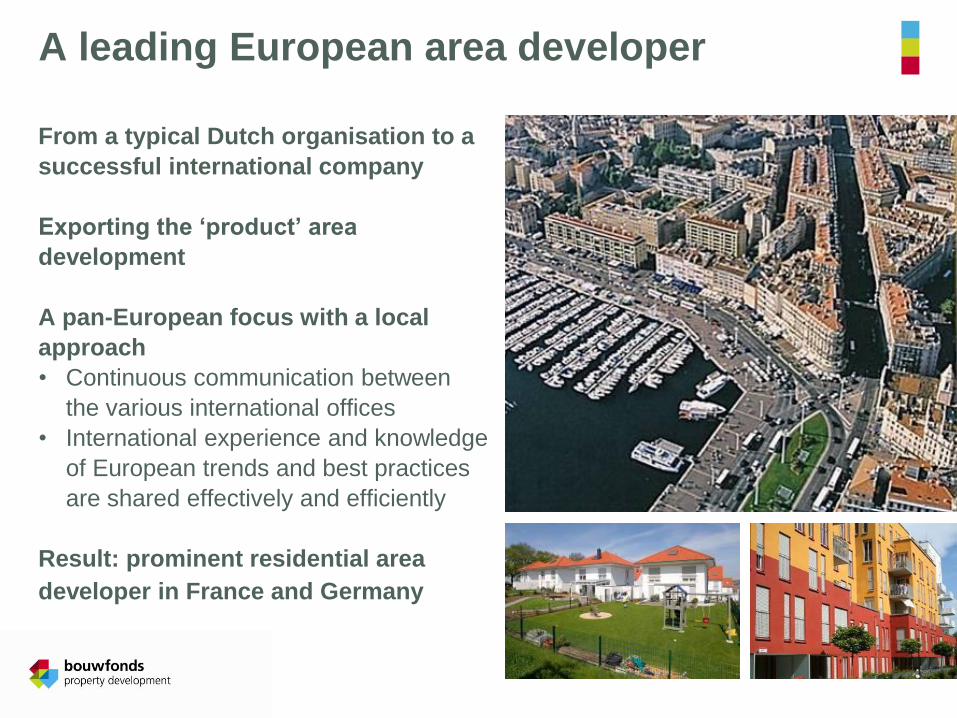
A leading European area developer
From a typical Dutch organisation to a
successful international company
Exporting the ‘product’ area
development
A pan-European focus with a local
approach
• Continuous communication between
the various international offices
• International experience and knowledge
of European trends and best practices
are shared effectively and efficiently
Result: prominent residential area
developer in France and Germany
Above 65 years of in-depth expertise
Usage and expansion of real estate expertise
• International experience and knowledge are being
translated to local circumstances
• Knowledge of local markets by track record and by
continuous market research
Also a keen eye for developments in society
• Thanks to 55 years of ownership by 600 Dutch
municipalities
Development in a wide range of projects
• Partnerships with governments, market players and
end-users
• Small and large-scale projects
• Innovative, sustainable and realistic projects
• Projects that improve the quality of entire areas
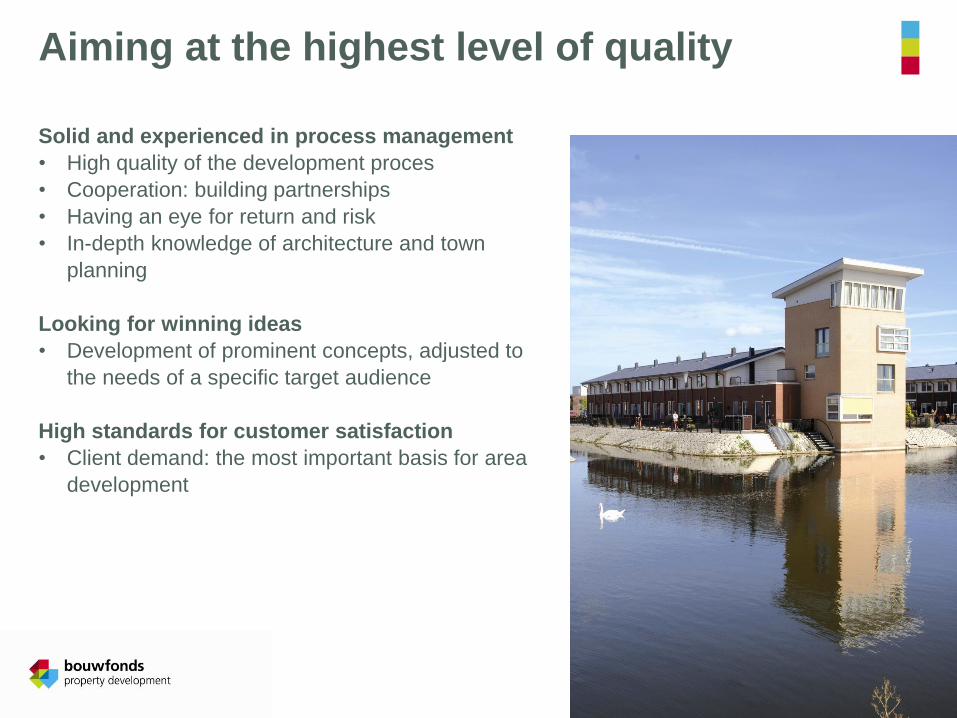
Aiming at the highest level of quality
Solid and experienced in process management
• High quality of the development proces
• Cooperation: building partnerships
• Having an eye for return and risk
• In-depth knowledge of architecture and town
planning
Looking for winning ideas
• Development of prominent concepts, adjusted to
the needs of a specific target audience
High standards for customer satisfaction
• Client demand: the most important basis for area
development
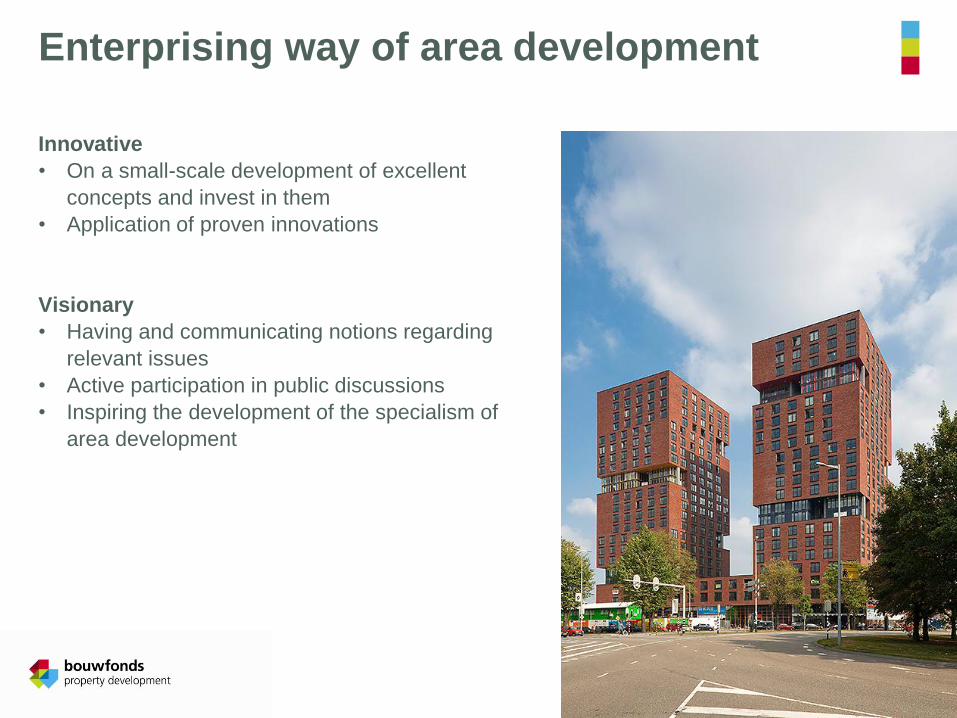
Enterprising way of area development
Innovative
• On a small-scale development of excellent
concepts and invest in them
• Application of proven innovations
Visionary
• Having and communicating notions regarding
relevant issues
• Active participation in public discussions
• Inspiring the development of the specialism of
area development
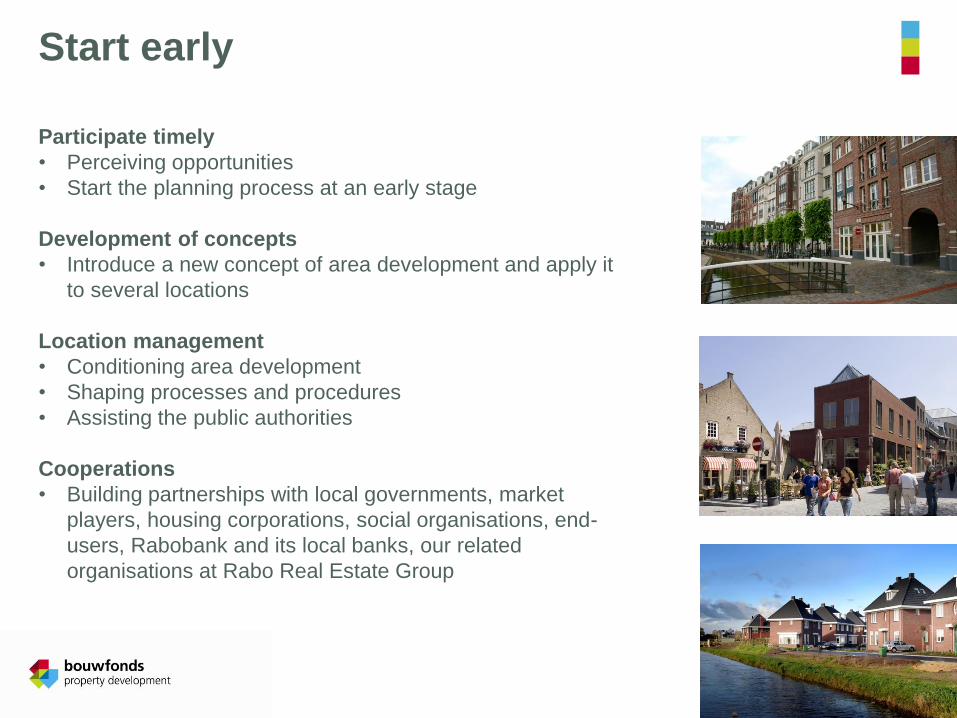
Start early
Participate timely
• Perceiving opportunities
• Start the planning process at an early stage
Development of concepts
• Introduce a new concept of area development and apply it
to several locations
Location management
• Conditioning area development
• Shaping processes and procedures
• Assisting the public authorities
Cooperations
• Building partnerships with local governments, market
players, housing corporations, social organisations, end-
users, Rabobank and its local banks, our related
organisations at Rabo Real Estate Group
Facts & figures
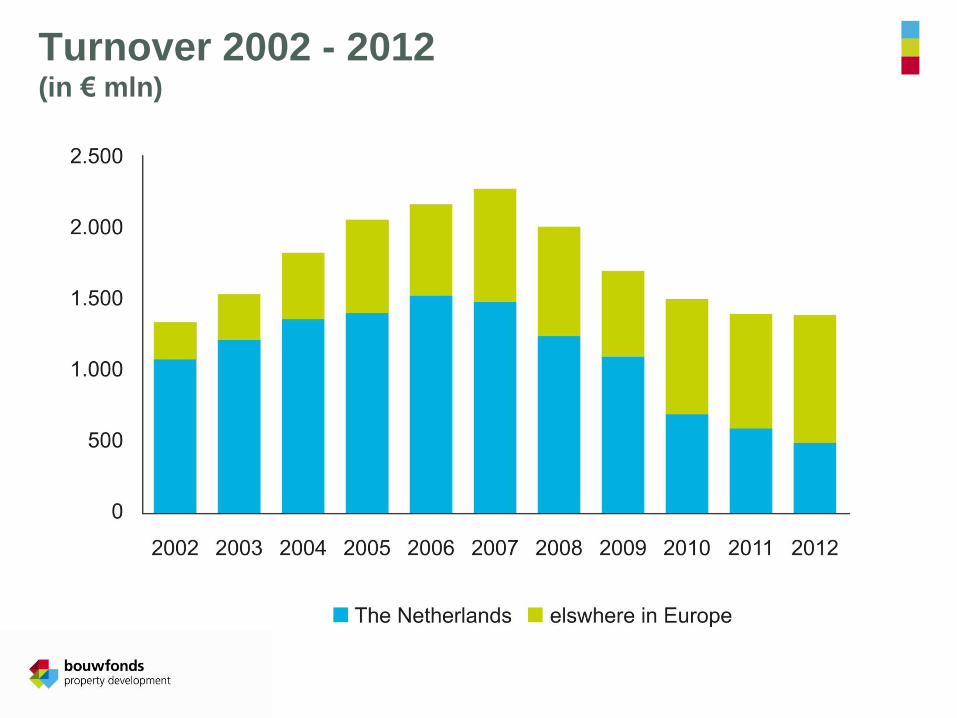
Turnover 2002 - 2012 (in € mln)
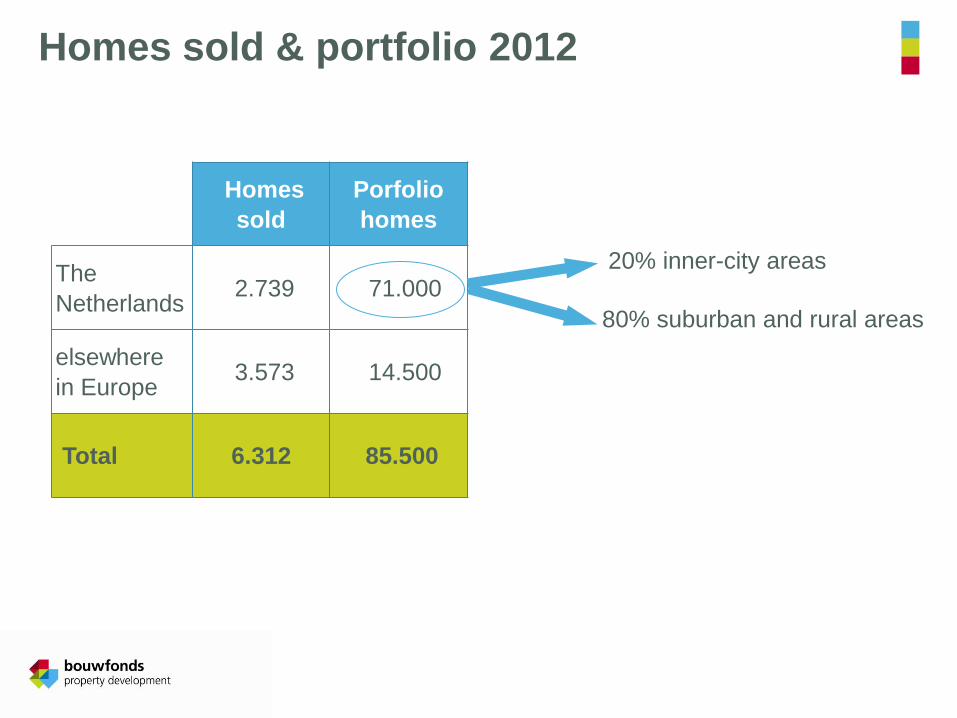
Homes sold & portfolio 2012
Homes
sold
Porfolio
homes
The
Netherlands 2.739 71.000
elsewhere
in Europe 3.573 14.500
Total 6.312 85.500
20% inner-city areas
80% suburban and rural areas
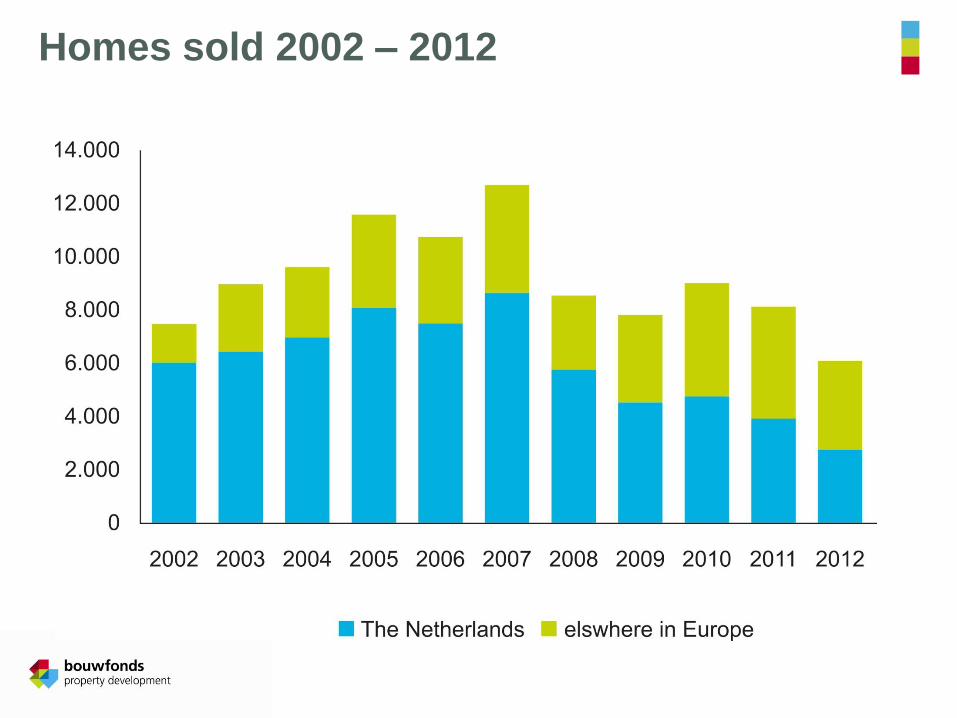
Homes sold 2002 – 2012
Show cases
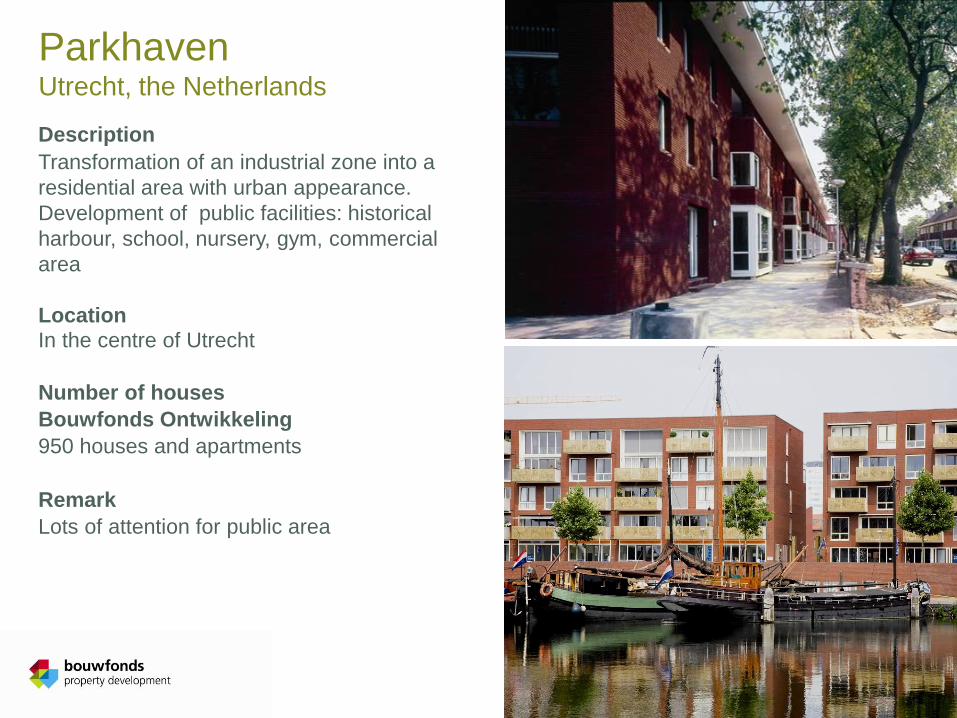
Parkhaven Utrecht, the Netherlands
Description
Transformation of an industrial zone into a
residential area with urban appearance.
Development of public facilities: historical
harbour, school, nursery, gym, commercial
area
Location In the centre of Utrecht
Number of houses
Bouwfonds Ontwikkeling
950 houses and apartments
Remark
Lots of attention for public area
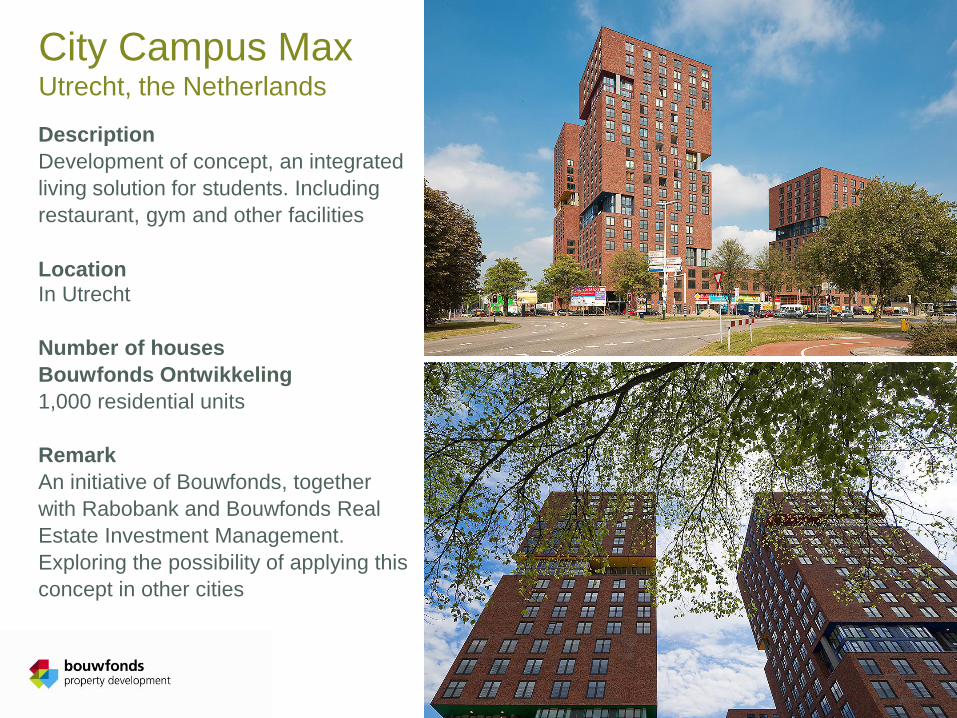
City Campus Max Utrecht, the Netherlands
Description
Development of concept, an integrated
living solution for students. Including
restaurant, gym and other facilities
Location
In Utrecht
Number of houses
Bouwfonds Ontwikkeling
1,000 residential units
Remark
An initiative of Bouwfonds, together
with Rabobank and Bouwfonds Real
Estate Investment Management.
Exploring the possibility of applying this
concept in other cities
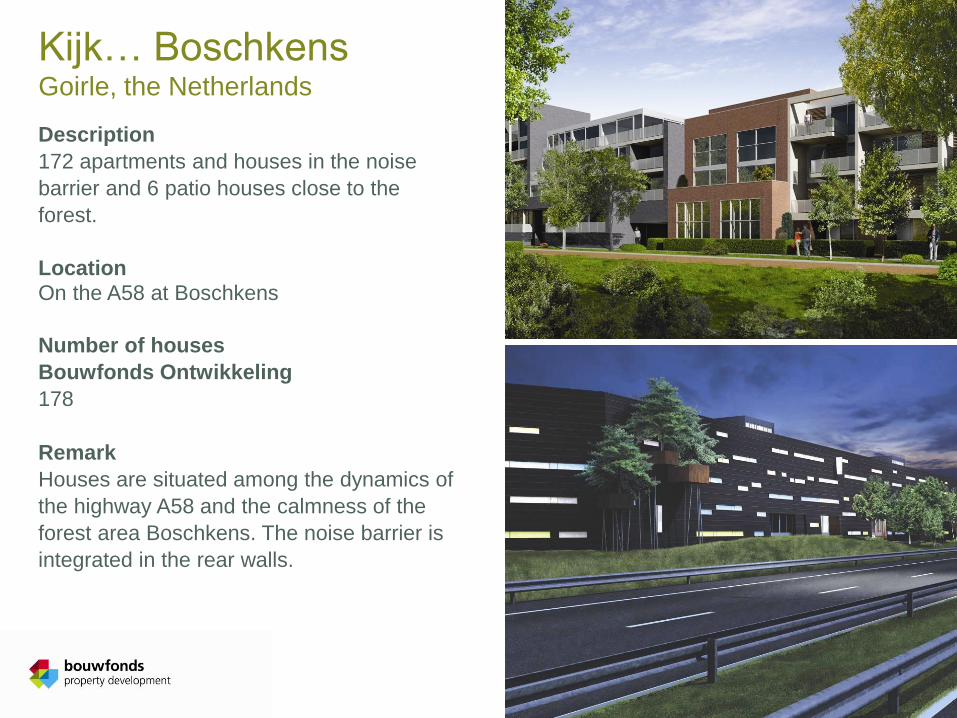
Kijk… Boschkens Goirle, the Netherlands
Description
172 apartments and houses in the noise
barrier and 6 patio houses close to the
forest.
Location
On the A58 at Boschkens
Number of houses
Bouwfonds Ontwikkeling
178
Remark
Houses are situated among the dynamics of
the highway A58 and the calmness of the
forest area Boschkens. The noise barrier is
integrated in the rear walls.
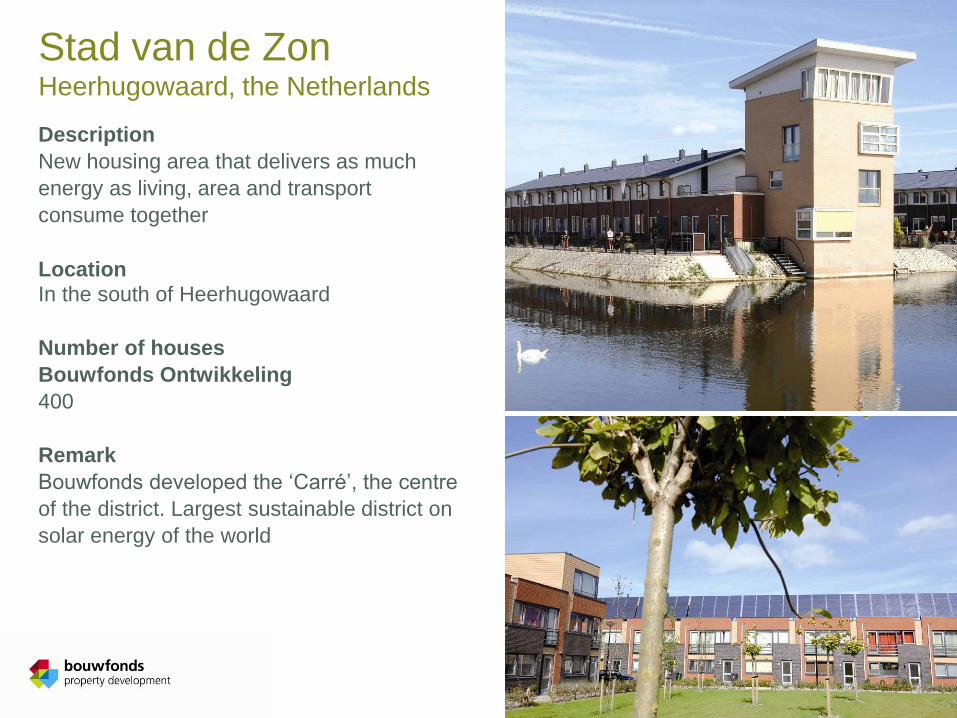
Stad van de Zon Heerhugowaard, the Netherlands
Description
New housing area that delivers as much
energy as living, area and transport
consume together
Location
In the south of Heerhugowaard
Number of houses
Bouwfonds Ontwikkeling
400
Remark
Bouwfonds developed the ‘Carré’, the centre
of the district. Largest sustainable district on
solar energy of the world
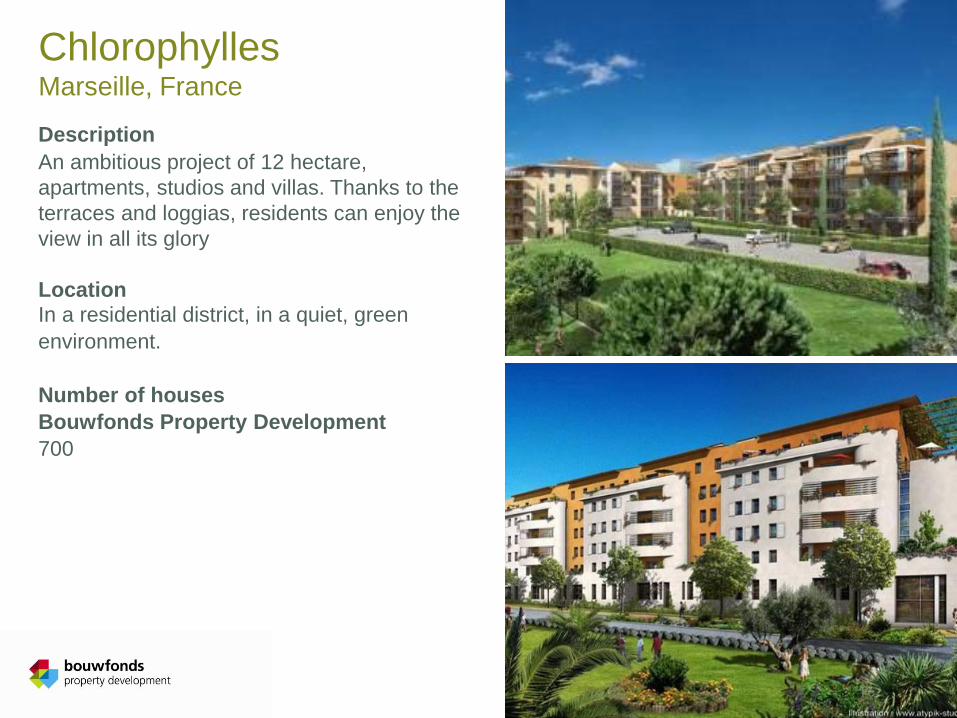
Chlorophylles Marseille, France
Description
An ambitious project of 12 hectare,
apartments, studios and villas. Thanks to the
terraces and loggias, residents can enjoy the
view in all its glory
Location
In a residential district, in a quiet, green
environment.
Number of houses
Bouwfonds Property Development
700
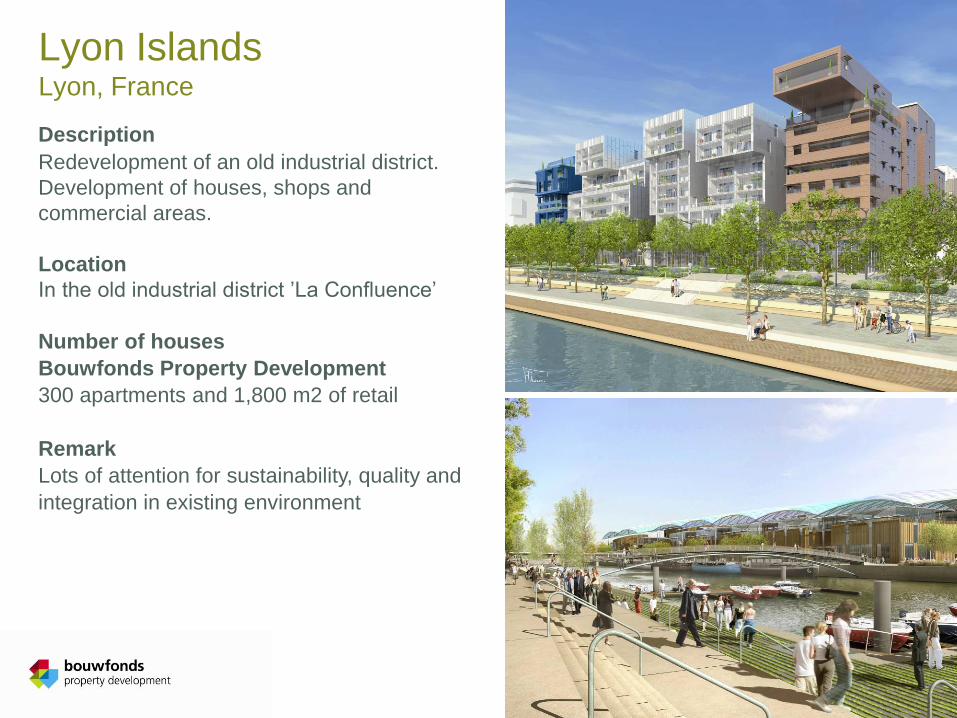
Lyon Islands Lyon, France
Description
Redevelopment of an old industrial district.
Development of houses, shops and
commercial areas.
Location
In the old industrial district ’La Confluence’
Number of houses
Bouwfonds Property Development
300 apartments and 1,800 m2 of retail
Remark
Lots of attention for sustainability, quality and
integration in existing environment
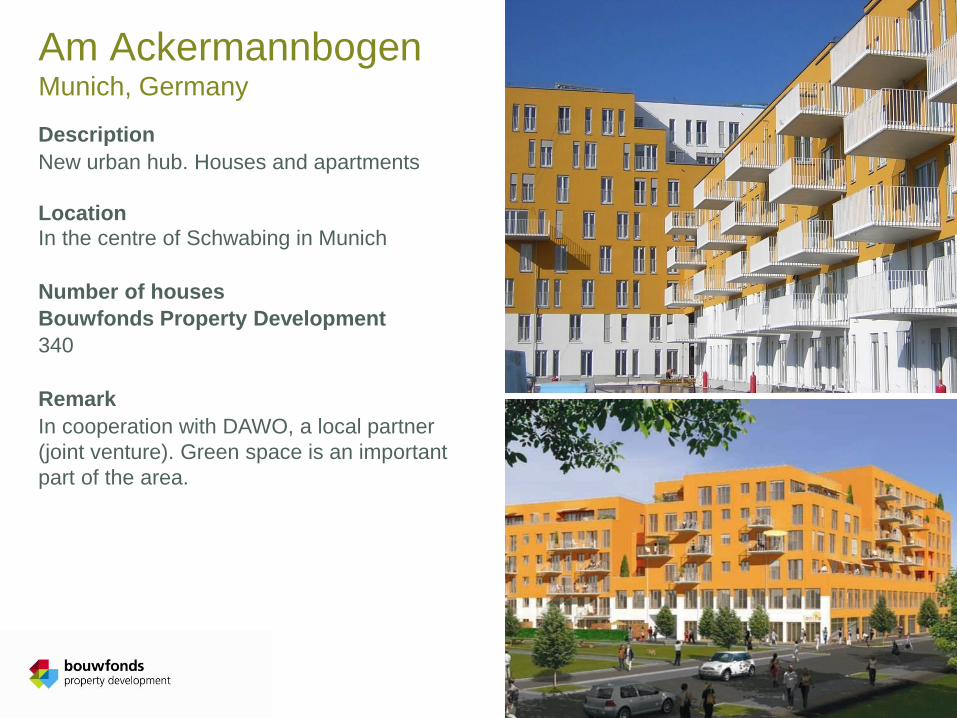
Am Ackermannbogen Munich, Germany
Description
New urban hub. Houses and apartments
Location
In the centre of Schwabing in Munich
Number of houses
Bouwfonds Property Development
340
Remark
In cooperation with DAWO, a local partner
(joint venture). Green space is an important
part of the area.
24
Crisis?
25
Or a booming market?
Dutch population and household figures
Naam presentatie, Datum 26
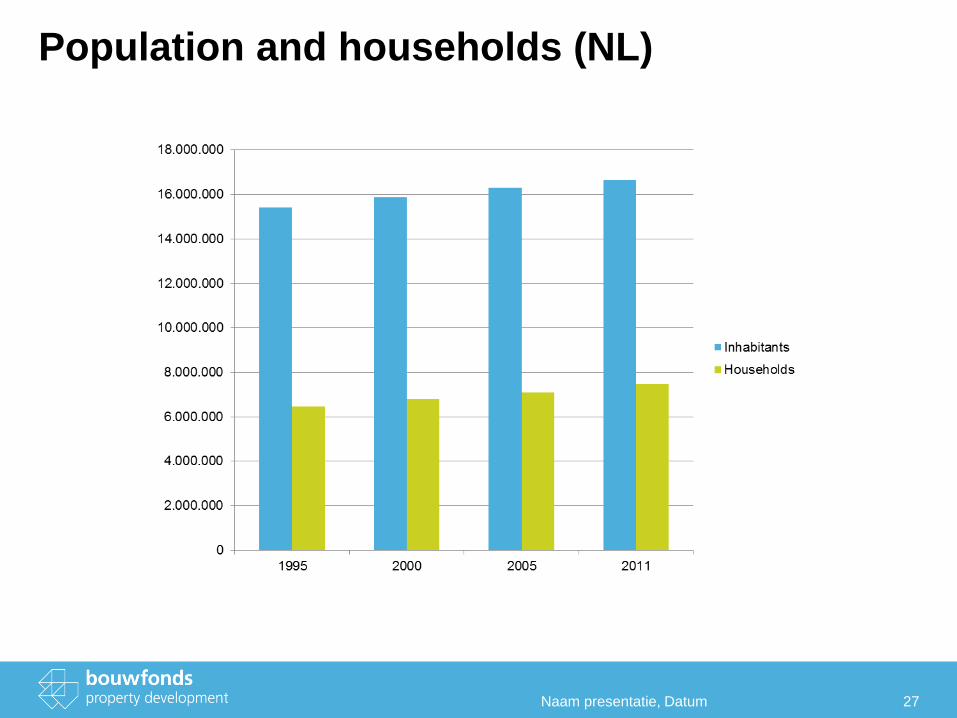
Population and households (NL)
Naam presentatie, Datum 27
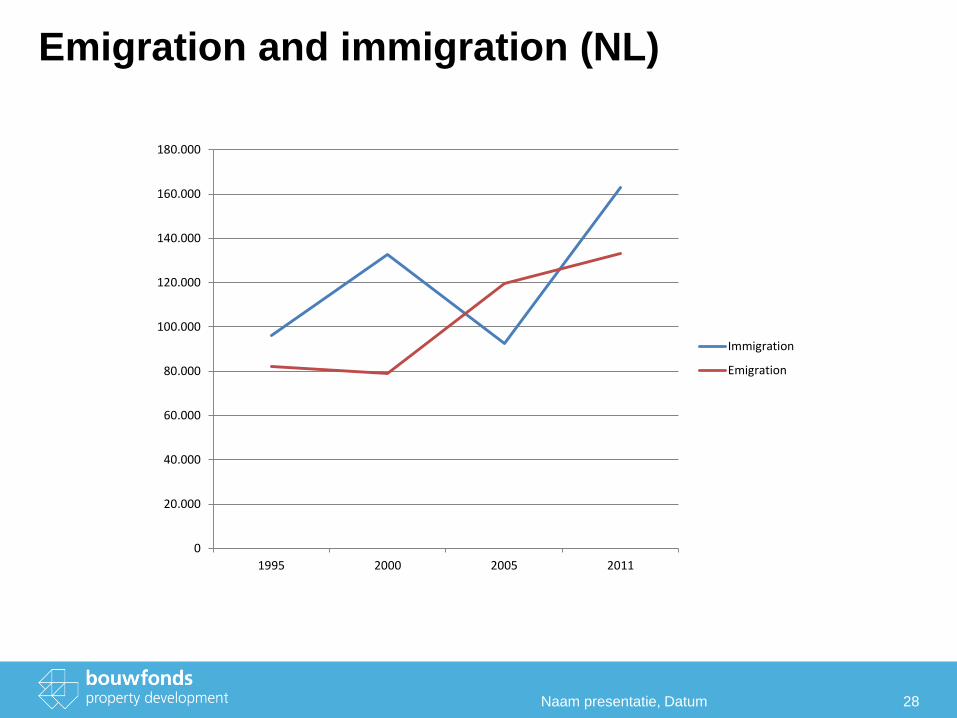
Emigration and immigration (NL)
Naam presentatie, Datum 28
0
20.000
40.000
60.000
80.000
100.000
120.000
140.000
160.000
180.000
1995 2000 2005 2011
Immigration
Emigration
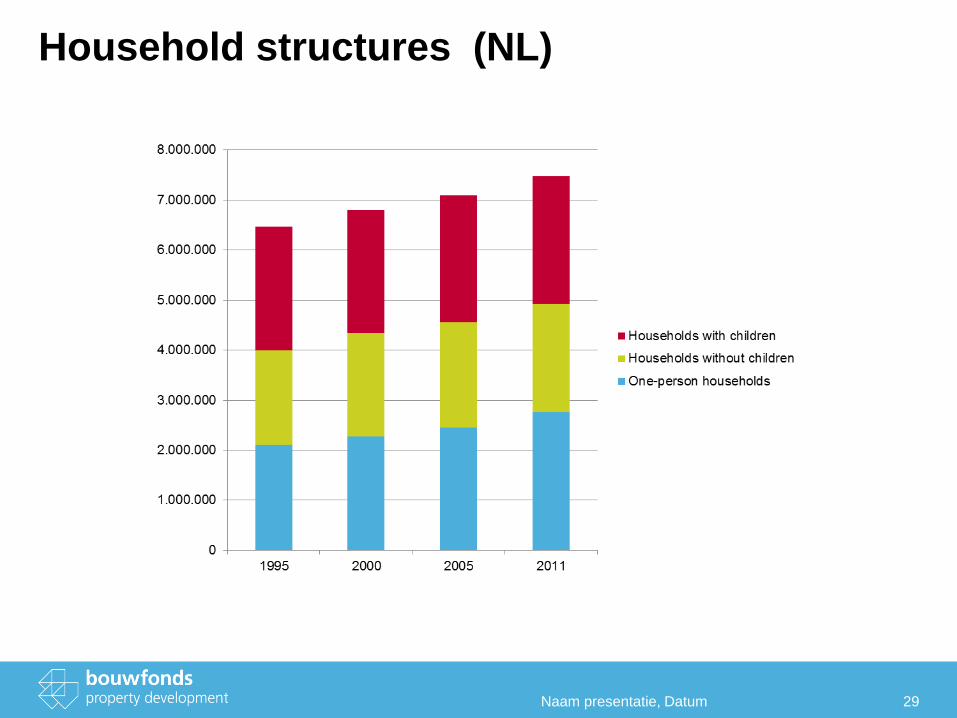
Household structures (NL)
Naam presentatie, Datum 29
30
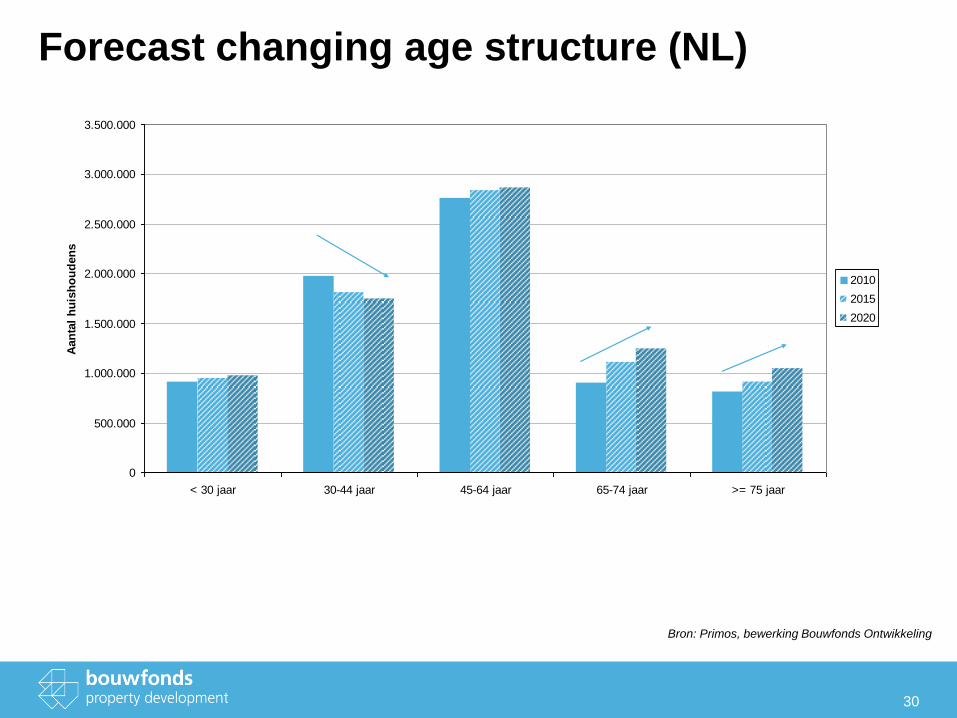
Forecast changing age structure (NL)
0
500.000
1.000.000
1.500.000
2.000.000
2.500.000
3.000.000
3.500.000
< 30 jaar 30-44 jaar 45-64 jaar 65-74 jaar >= 75 jaar
Aan
tal
hu
ish
ou
den
s
2010
2015
2020
Bron: Primos, bewerking Bouwfonds Ontwikkeling
31
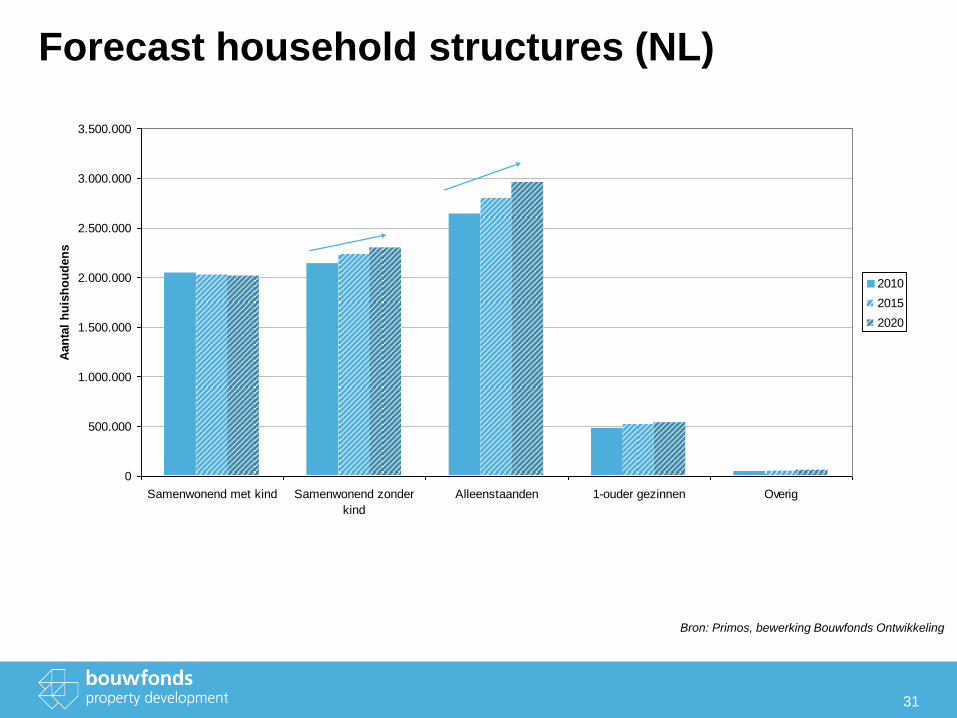
Forecast household structures (NL)
0
500.000
1.000.000
1.500.000
2.000.000
2.500.000
3.000.000
3.500.000
Samenwonend met kind Samenwonend zonder
kind
Alleenstaanden 1-ouder gezinnen Overig
Aan
tal
hu
ish
ou
den
s
2010
2015
2020
Bron: Primos, bewerking Bouwfonds Ontwikkeling
To sum up
• The Dutch population is still growing
• The immigration is still on a low level and almost completely compensated by
emigration
• The amount of households is still growing
• 35% are single households, going to 40% in the coming 10 years
• The aging of the society has just started
Naam presentatie, Datum 32
The Dutch economy
Naam presentatie, Datum 33
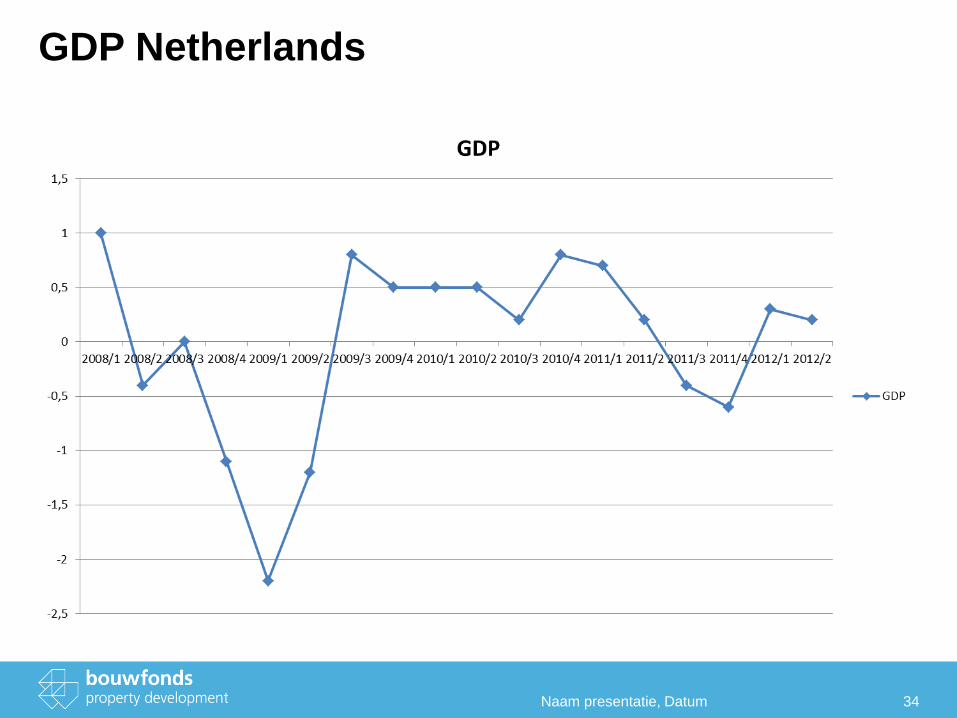
GDP Netherlands
Naam presentatie, Datum 34
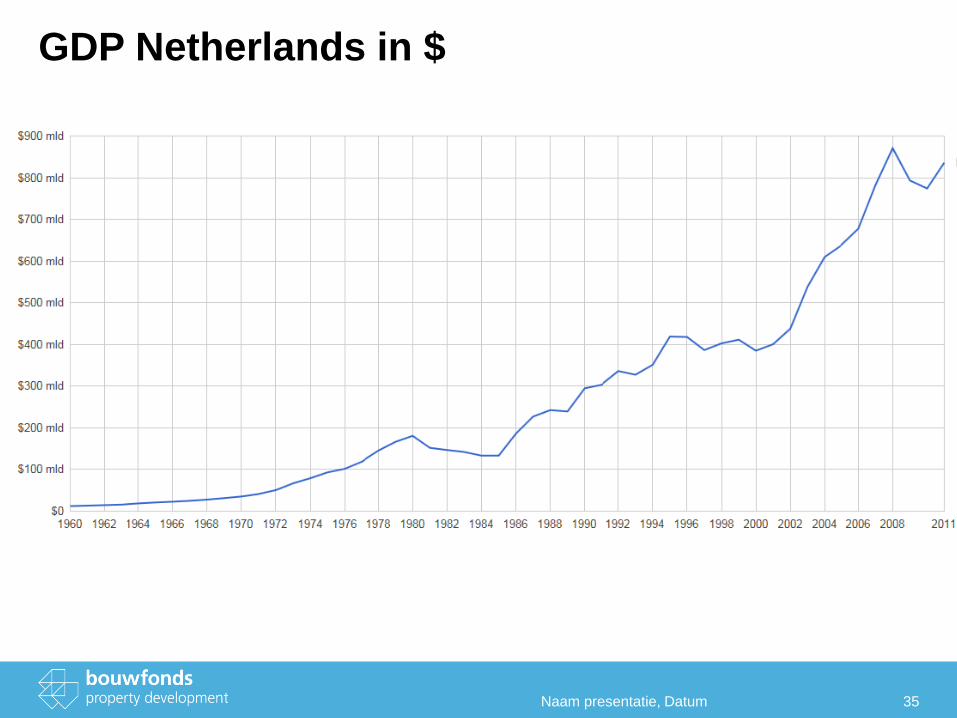
GDP Netherlands in $
Naam presentatie, Datum 35
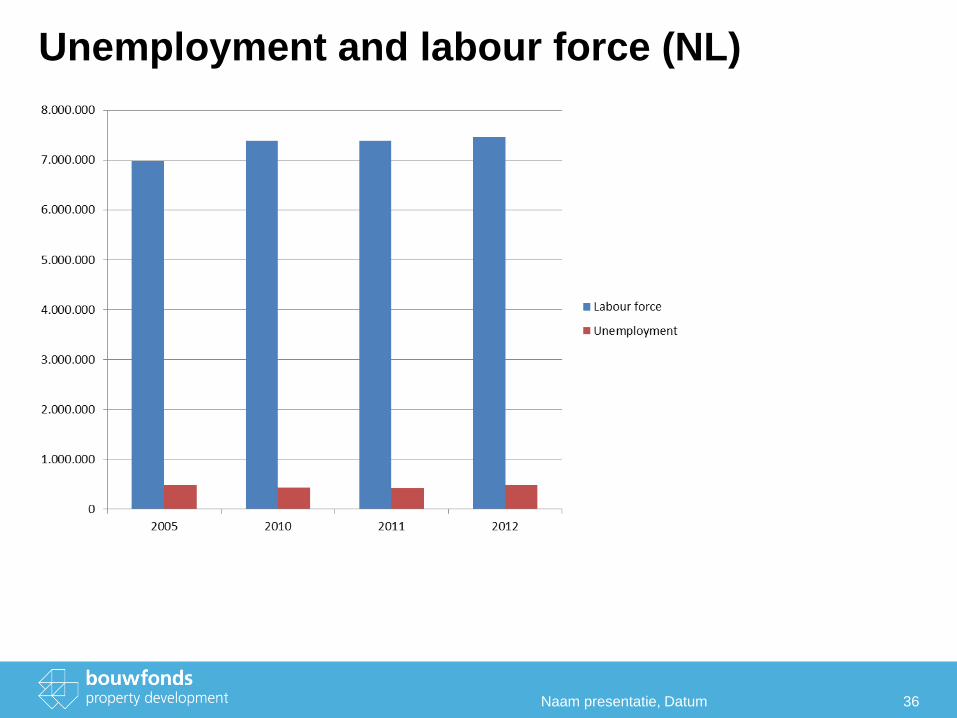
Unemployment and labour force (NL)
Naam presentatie, Datum 36
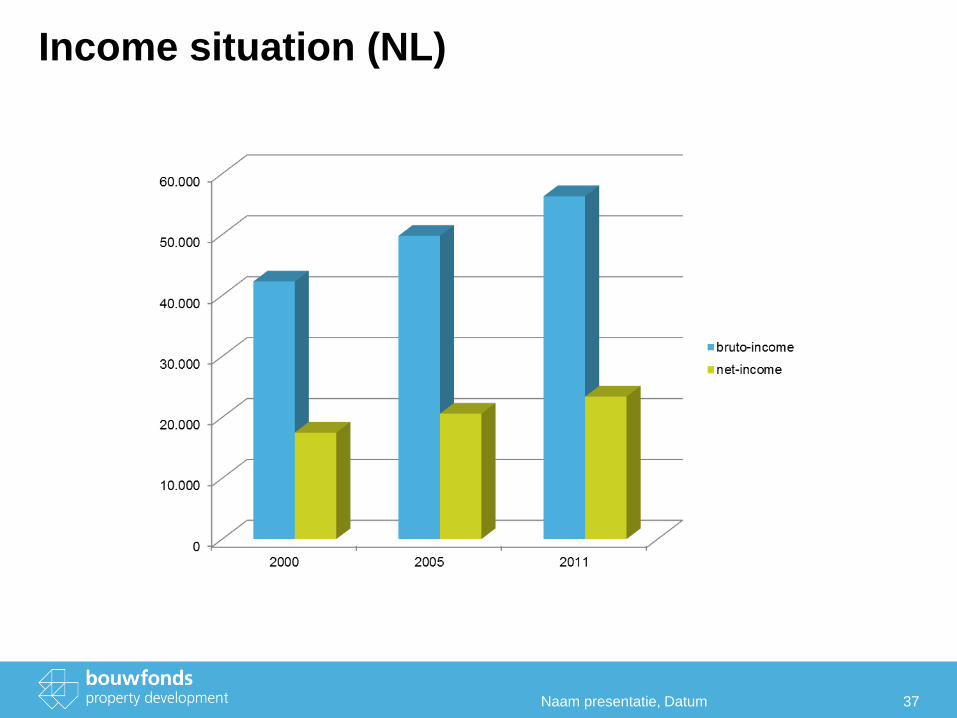
Income situation (NL)
Naam presentatie, Datum 37
To sum up
• The economic situation in the Netherlands is better than the general feeling of
the population
• The unemployment rates are still one of the lowest in Europe
• There is a growing gap between the earned incomes and the spendable
incomes.
Naam presentatie, Datum 38
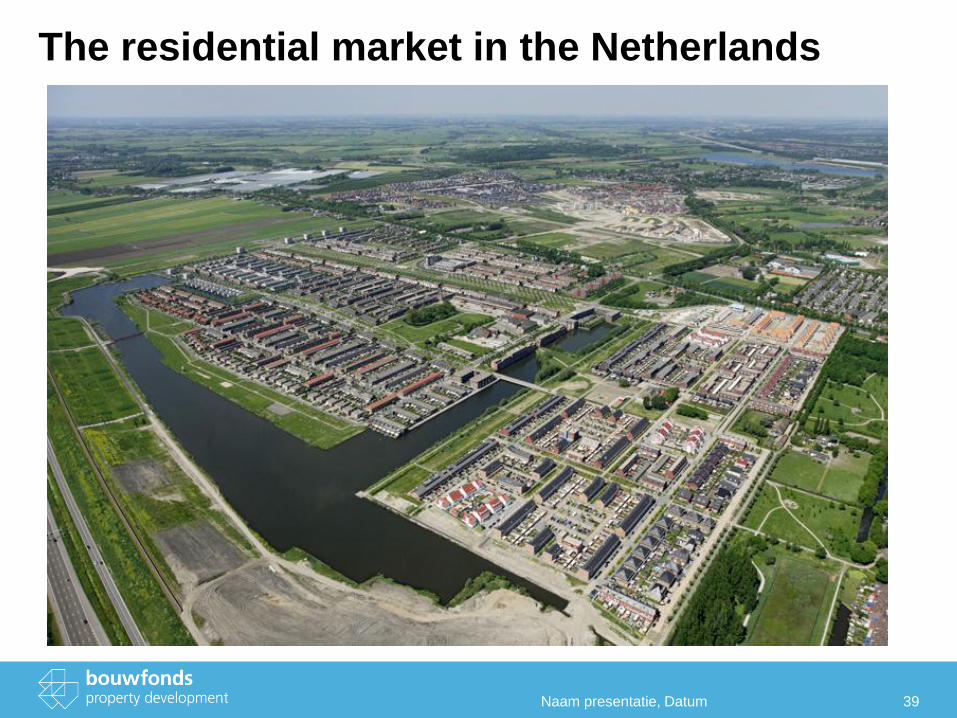
The residential market in the Netherlands
Naam presentatie, Datum 39
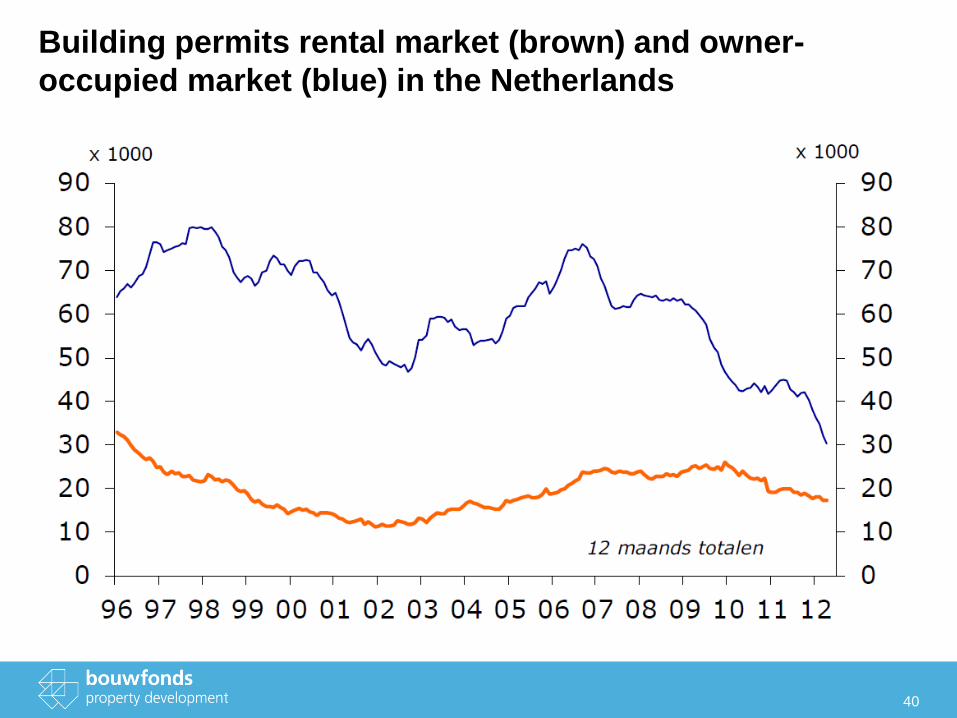
40
Building permits rental market (brown) and owner-
occupied market (blue) in the Netherlands
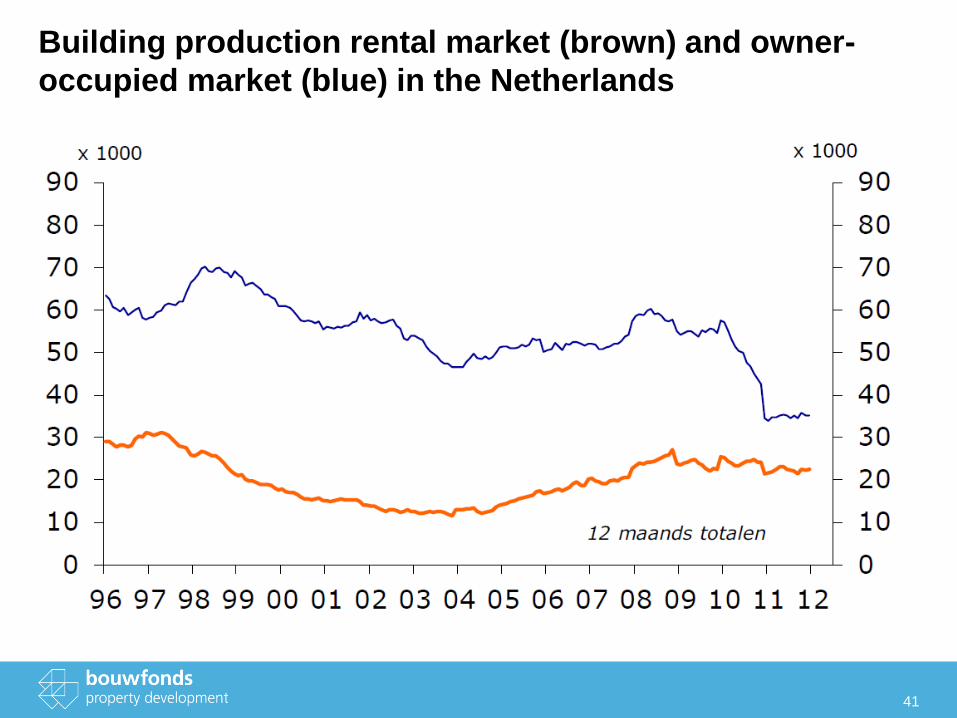
41
Building production rental market (brown) and owner-
occupied market (blue) in the Netherlands
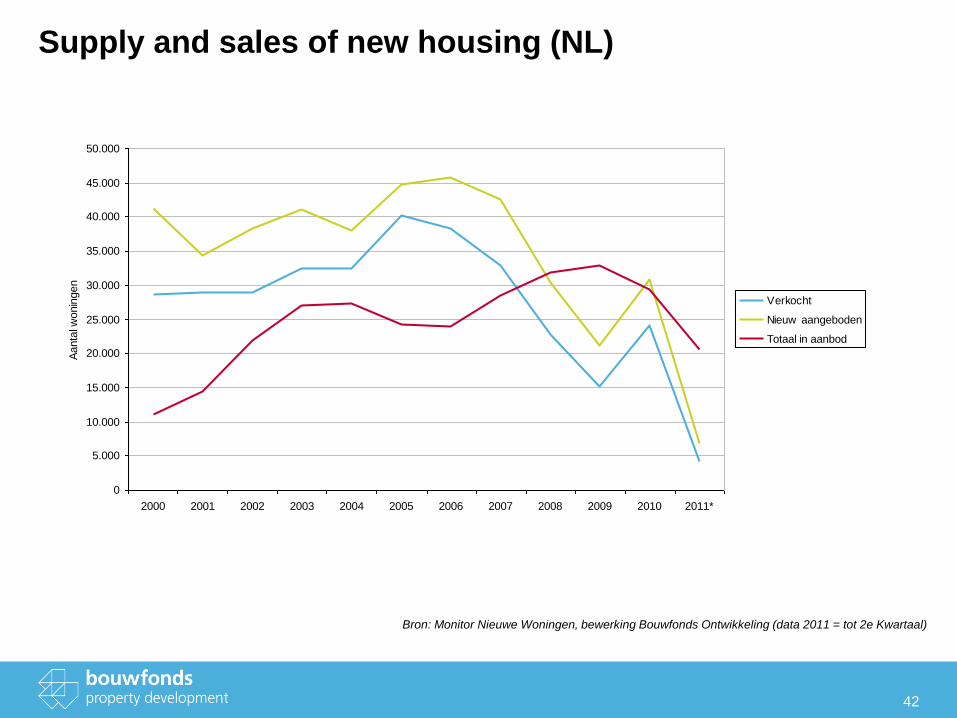
42
Supply and sales of new housing (NL)
0
5.000
10.000
15.000
20.000
25.000
30.000
35.000
40.000
45.000
50.000
2000 2001 2002 2003 2004 2005 2006 2007 2008 2009 2010 2011*
Aanta
l wonin
gen
Verkocht
Nieuw aangeboden
Totaal in aanbod
Bron: Monitor Nieuwe Woningen, bewerking Bouwfonds Ontwikkeling (data 2011 = tot 2e Kwartaal)
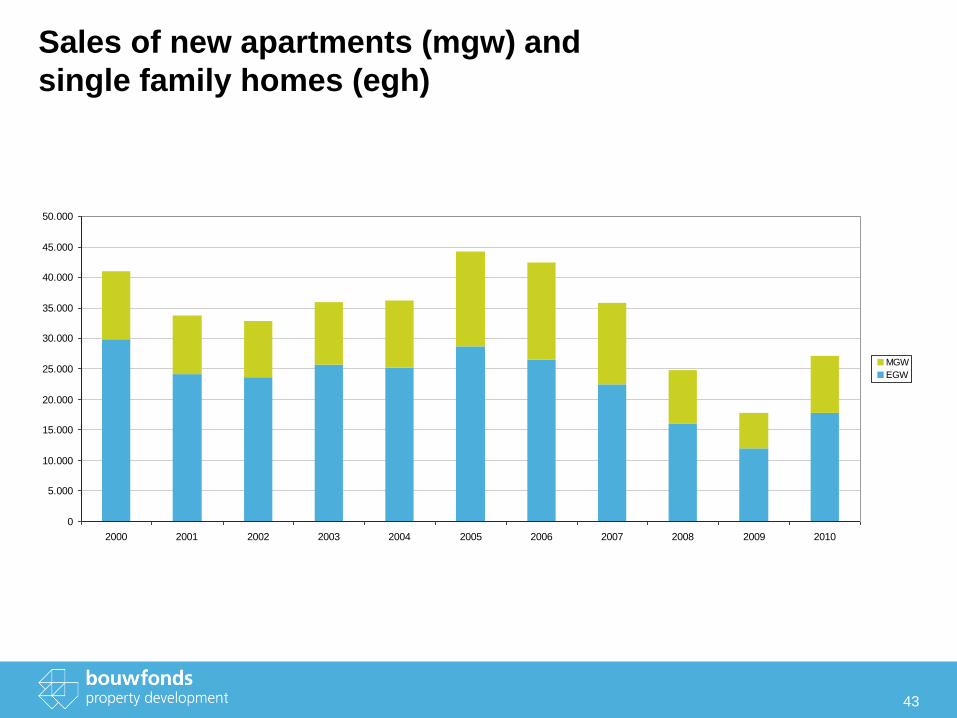
43
Sales of new apartments (mgw) and
single family homes (egh)
0
5.000
10.000
15.000
20.000
25.000
30.000
35.000
40.000
45.000
50.000
2000 2001 2002 2003 2004 2005 2006 2007 2008 2009 2010
MGW
EGW
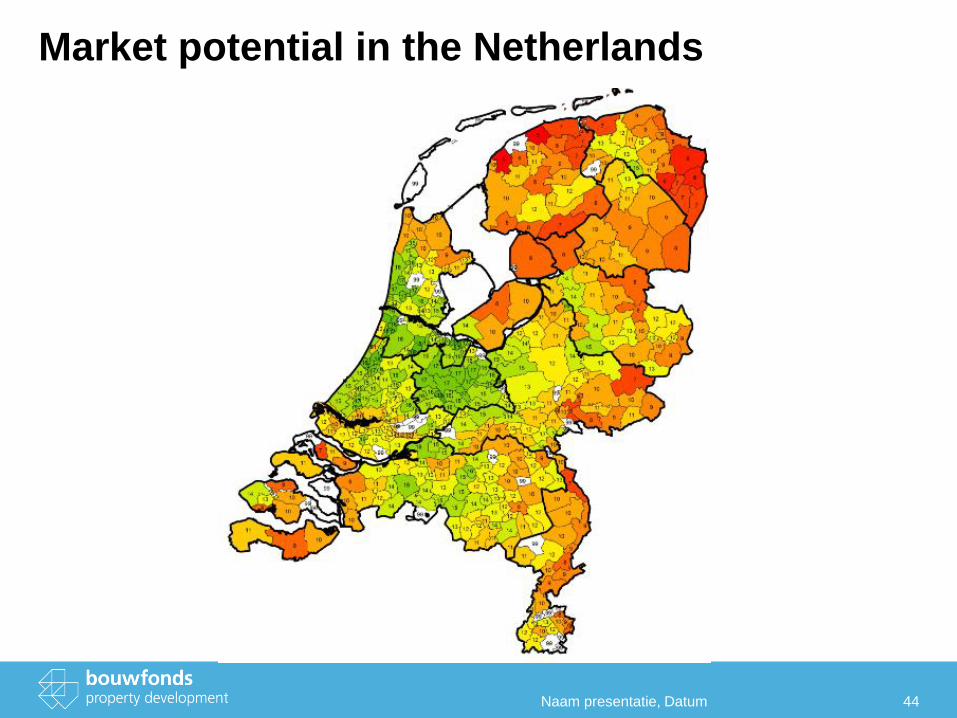
Market potential in the Netherlands
Naam presentatie, Datum 44
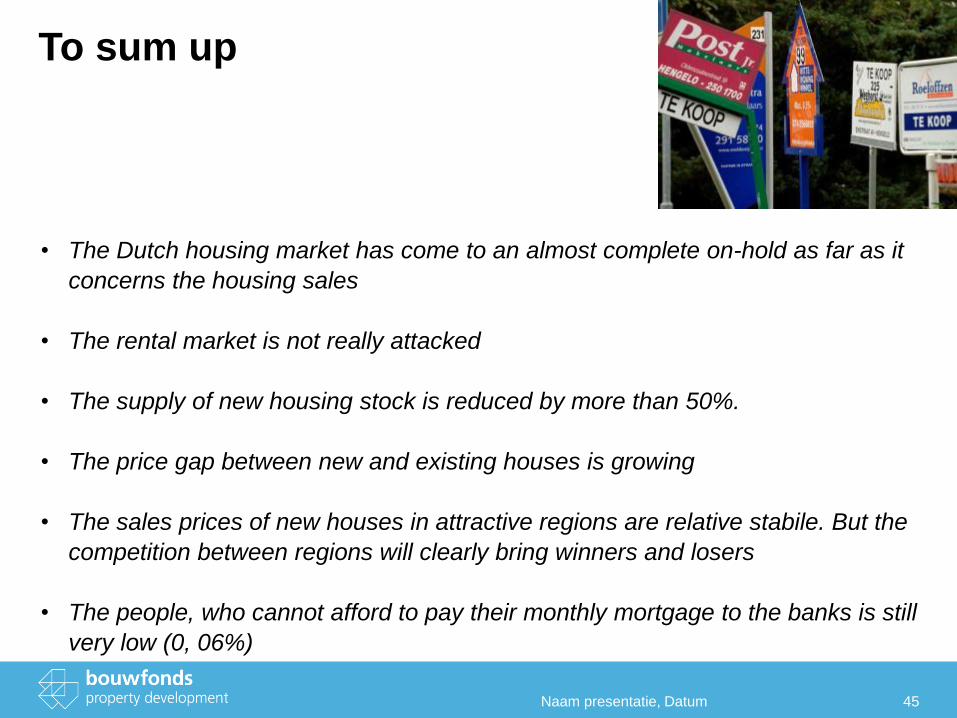
To sum up
• The Dutch housing market has come to an almost complete on-hold as far as it
concerns the housing sales
• The rental market is not really attacked
• The supply of new housing stock is reduced by more than 50%.
• The price gap between new and existing houses is growing
• The sales prices of new houses in attractive regions are relative stabile. But the
competition between regions will clearly bring winners and losers
• The people, who cannot afford to pay their monthly mortgage to the banks is still
very low (0, 06%)
Naam presentatie, Datum 45
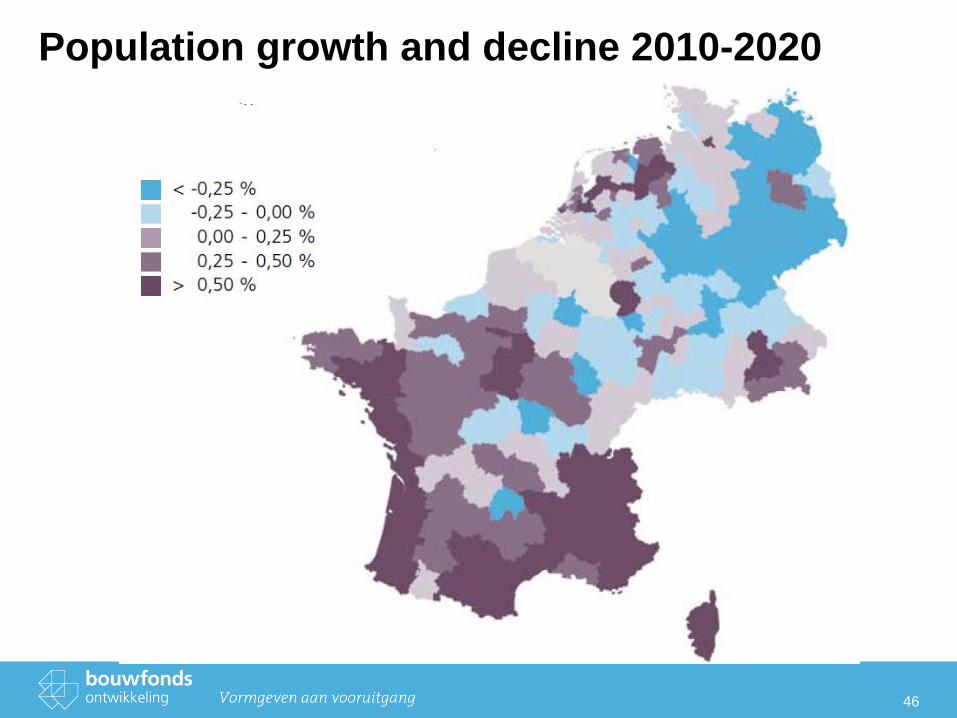
Population growth and decline 2010-2020
46

Employment growth and decline 2010-2020
47
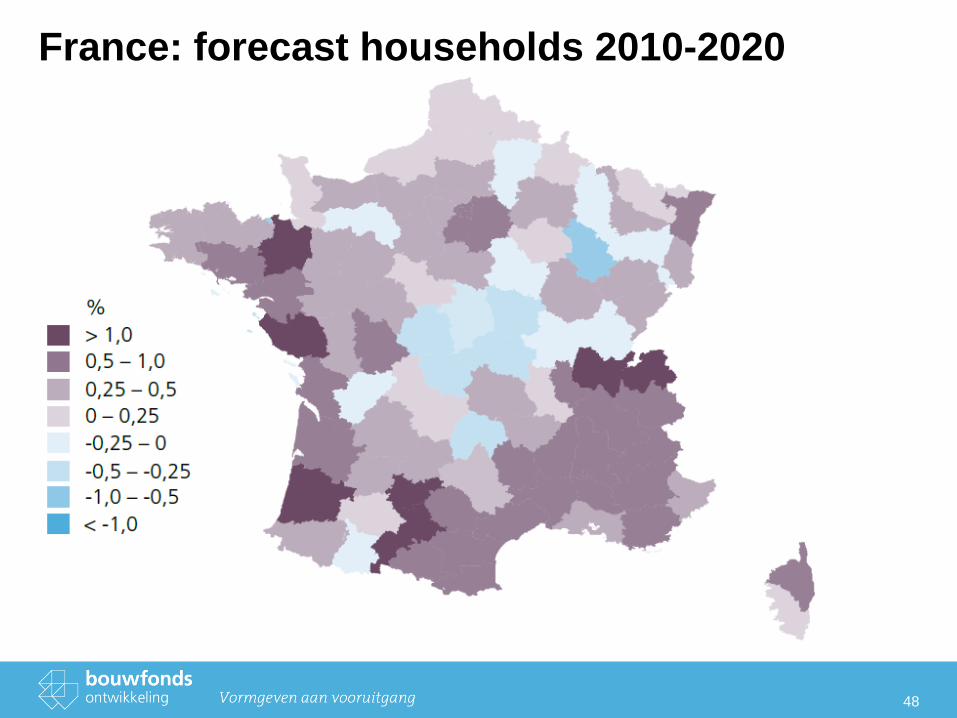
France: forecast households 2010-2020
48
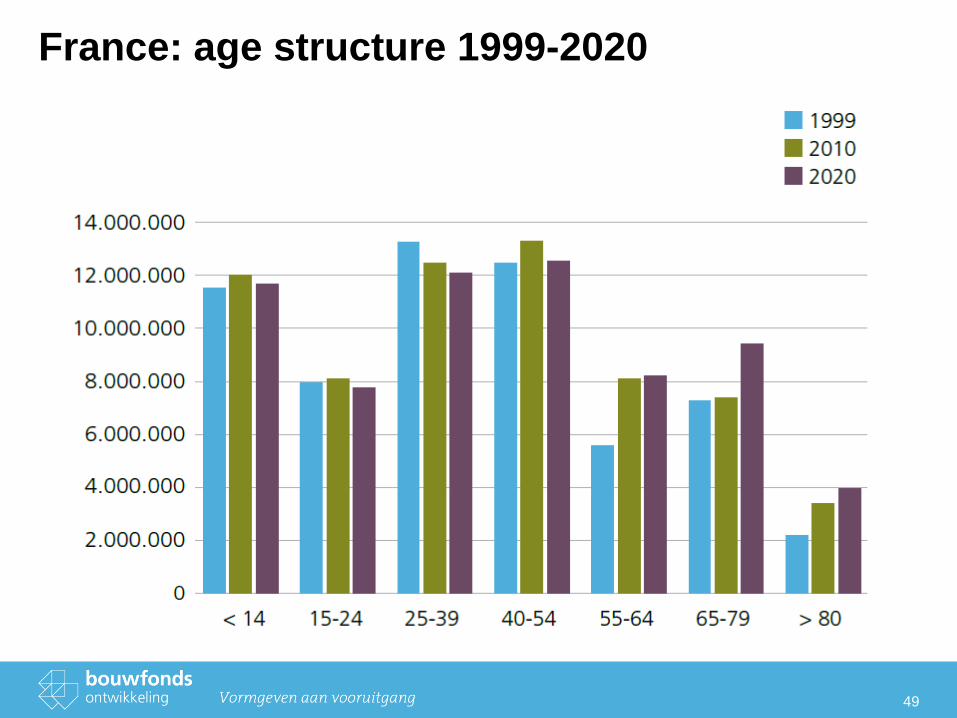
France: age structure 1999-2020
49
50
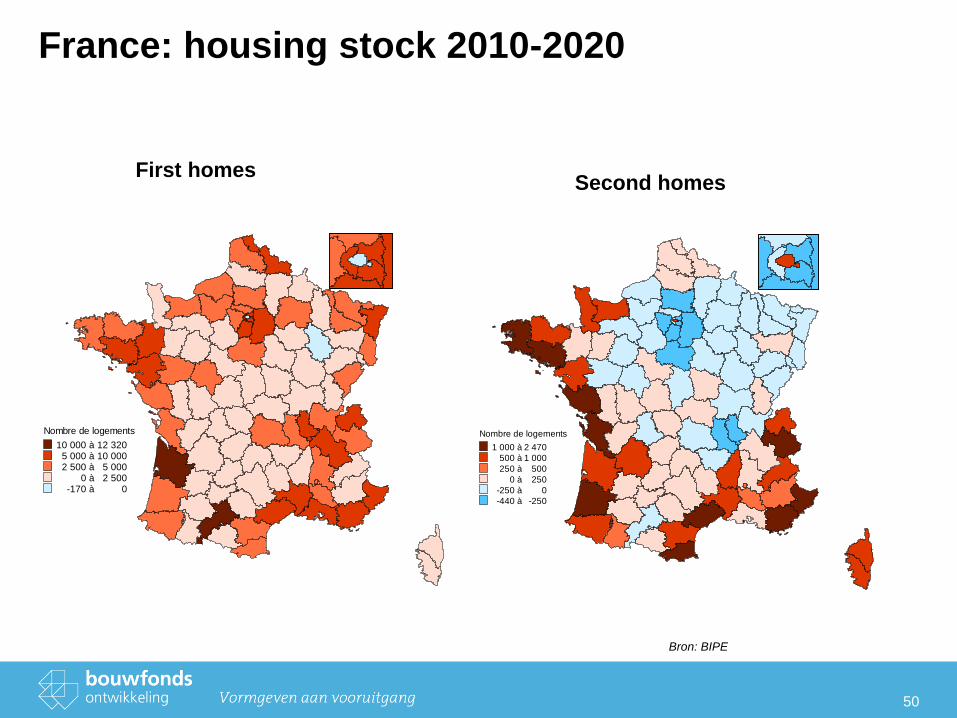
France: housing stock 2010-2020
Nombre de logements
10 000 à 12 3205 000 à 10 0002 500 à 5 000
0 à 2 500-170 à 0
Nombre de logements
1 000 à 2 470
500 à 1 000
250 à 500
0 à 250
-250 à 0
-440 à -250
First homes Second homes
Bron: BIPE
51
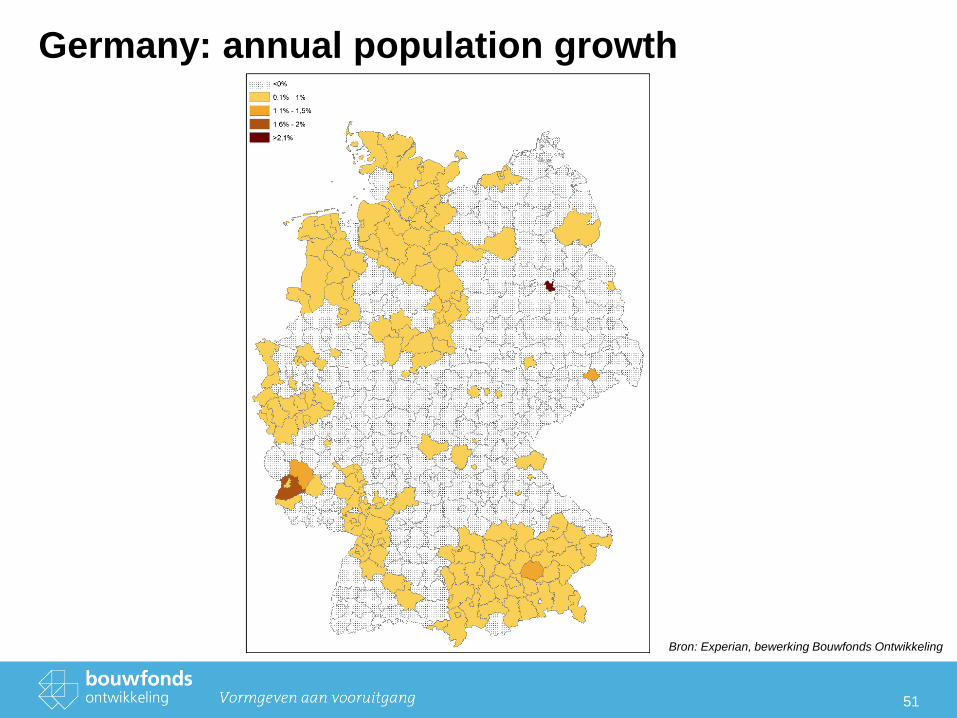
Germany: annual population growth
Bron: Experian, bewerking Bouwfonds Ontwikkeling
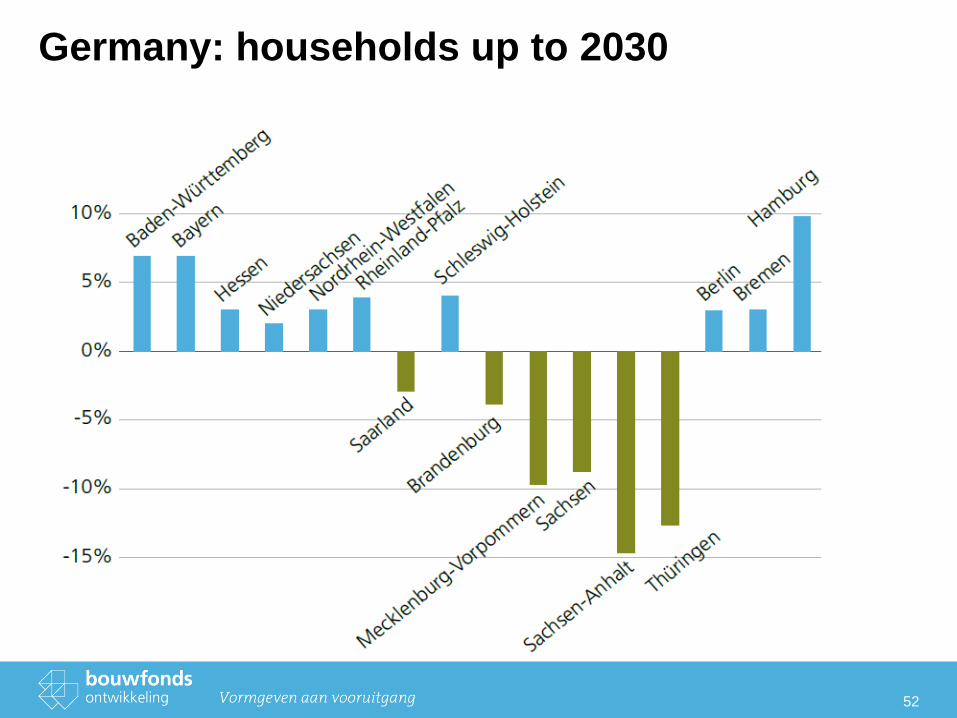
Germany: households up to 2030
52
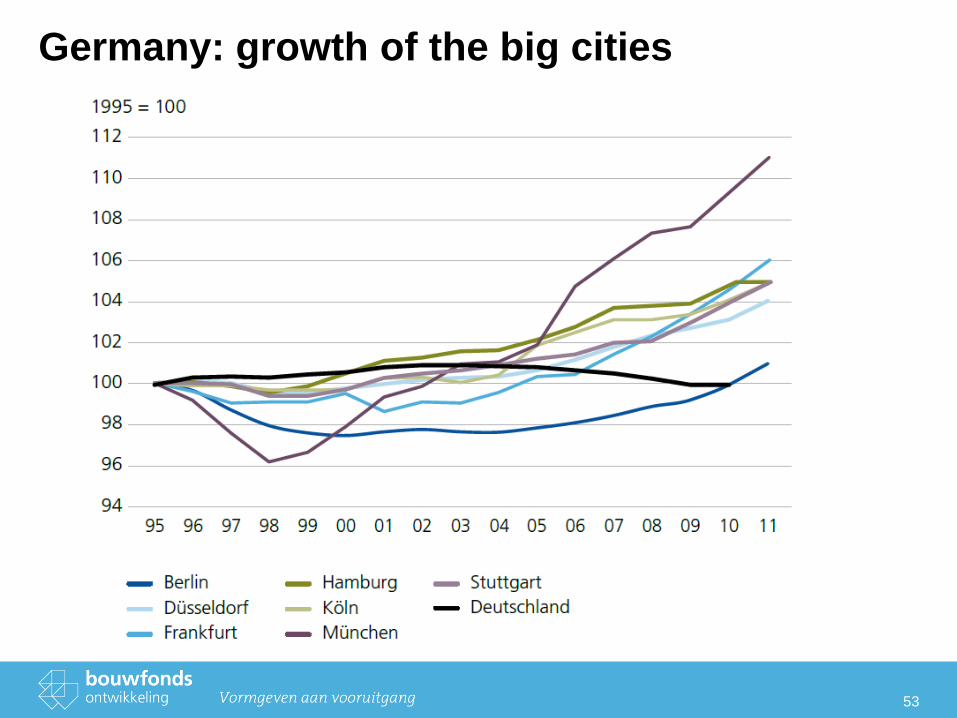
Germany: growth of the big cities
53

Germany: an ageing society
54
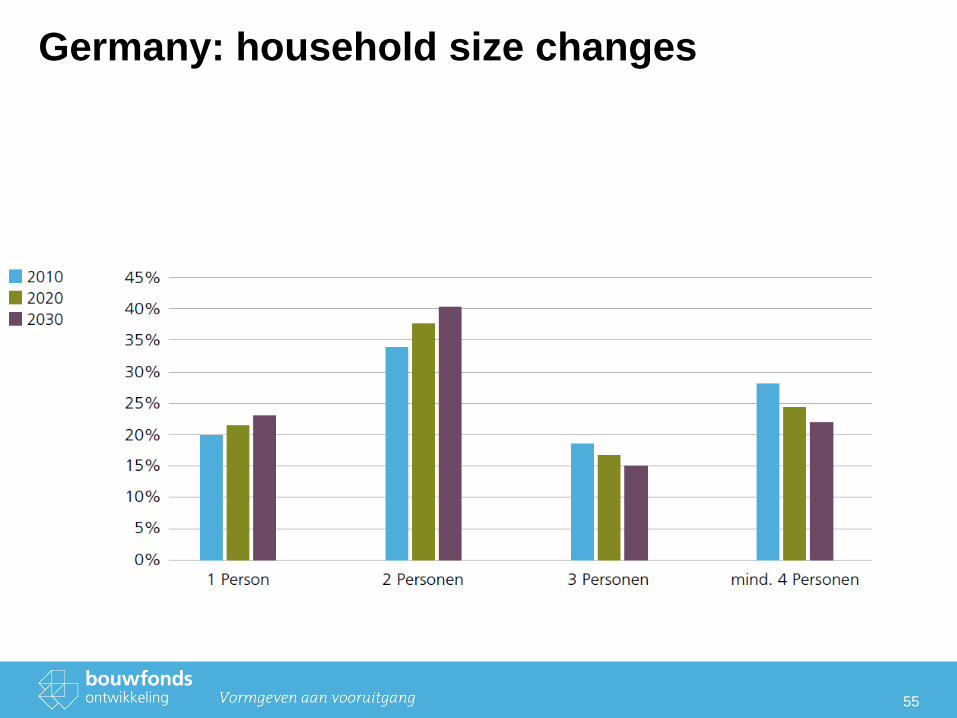
Germany: household size changes
55
56
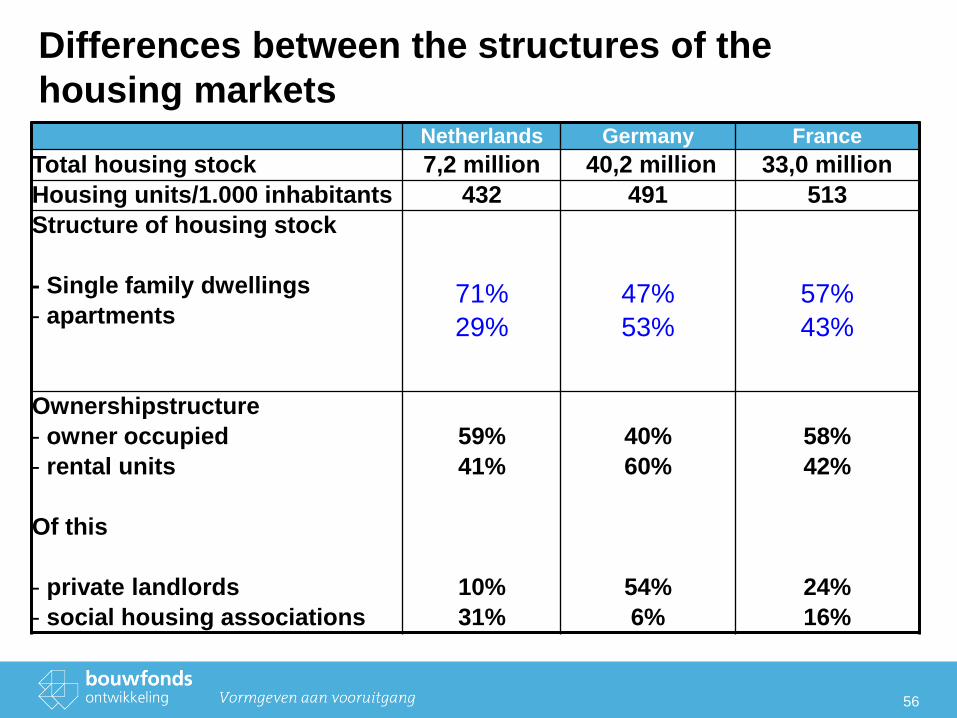
Differences between the structures of the
housing markets Netherlands Germany France
Total housing stock 7,2 million 40,2 million 33,0 million
Housing units/1.000 inhabitants 432 491 513
Structure of housing stock
- Single family dwellings
- apartments
71%
29%
47%
53%
57%
43%
Ownershipstructure
- owner occupied
- rental units
Of this
- private landlords
- social housing associations
59%
41%
10%
31%
40%
60%
54%
6%
58%
42%
24%
16%
57
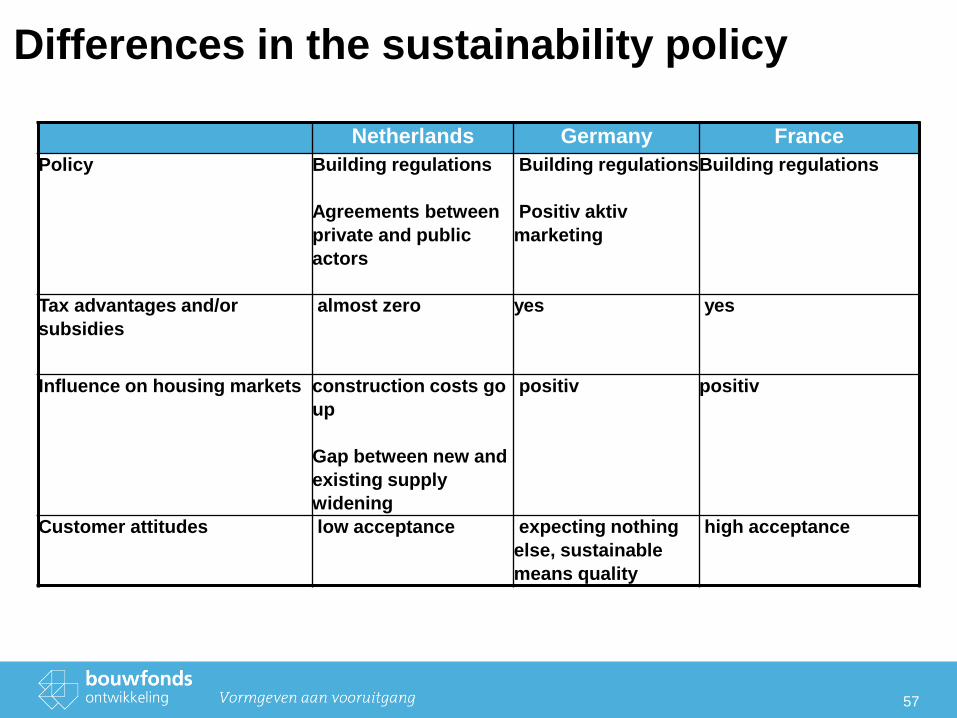
Differences in the sustainability policy
Netherlands Germany France
Policy Building regulations
Agreements between
private and public
actors
Building regulations
Positiv aktiv
marketing
Building regulations
Tax advantages and/or
subsidies
almost zero yes yes
Influence on housing markets construction costs go
up
Gap between new and
existing supply
widening
positiv positiv
Customer attitudes low acceptance expecting nothing
else, sustainable
means quality
high acceptance
58
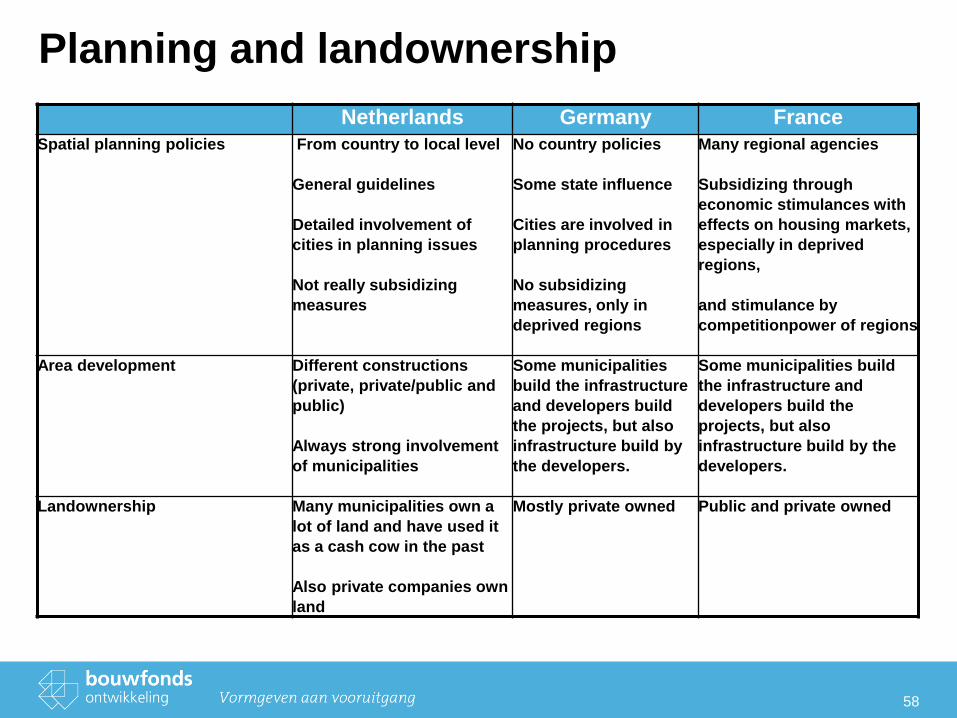
Planning and landownership
Netherlands Germany France
Spatial planning policies From country to local level
General guidelines
Detailed involvement of
cities in planning issues
Not really subsidizing
measures
No country policies
Some state influence
Cities are involved in
planning procedures
No subsidizing
measures, only in
deprived regions
Many regional agencies
Subsidizing through
economic stimulances with
effects on housing markets,
especially in deprived
regions,
and stimulance by
competitionpower of regions
Area development Different constructions
(private, private/public and
public)
Always strong involvement
of municipalities
Some municipalities
build the infrastructure
and developers build
the projects, but also
infrastructure build by
the developers.
Some municipalities build
the infrastructure and
developers build the
projects, but also
infrastructure build by the
developers.
Landownership Many municipalities own a
lot of land and have used it
as a cash cow in the past
Also private companies own
land
Mostly private owned Public and private owned
59
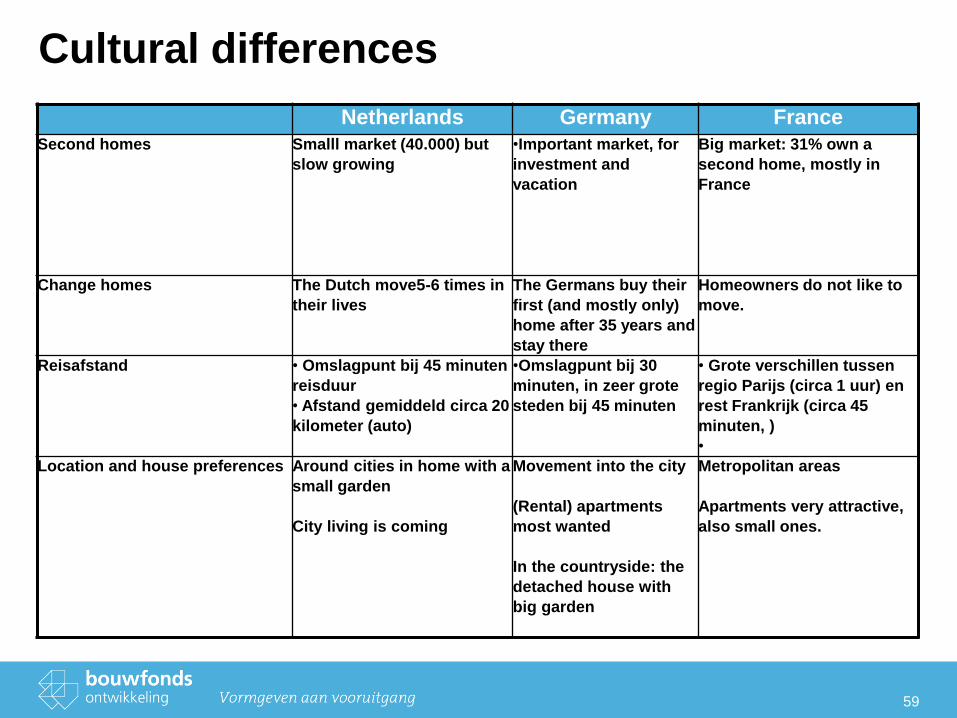
Cultural differences
Netherlands Germany France
Second homes Smalll market (40.000) but
slow growing
•Important market, for
investment and
vacation
Big market: 31% own a
second home, mostly in
France
Change homes The Dutch move5-6 times in
their lives
The Germans buy their
first (and mostly only)
home after 35 years and
stay there
Homeowners do not like to
move.
Reisafstand • Omslagpunt bij 45 minuten
reisduur
• Afstand gemiddeld circa 20
kilometer (auto)
•Omslagpunt bij 30
minuten, in zeer grote
steden bij 45 minuten
• Grote verschillen tussen
regio Parijs (circa 1 uur) en
rest Frankrijk (circa 45
minuten, )
•
Location and house preferences Around cities in home with a
small garden
City living is coming
Movement into the city
(Rental) apartments
most wanted
In the countryside: the
detached house with
big garden
Metropolitan areas
Apartments very attractive,
also small ones.

60
The big consumer survey
• Survey by phone in France and Germany, by phone+internet in the Netherlands
• 1.000 complete surveys for each country
• Representative on country level
• Feedback: France 48%, Germany 49%, Netherlands 20%
• Questionaire: 22 questions, average 11 minutes
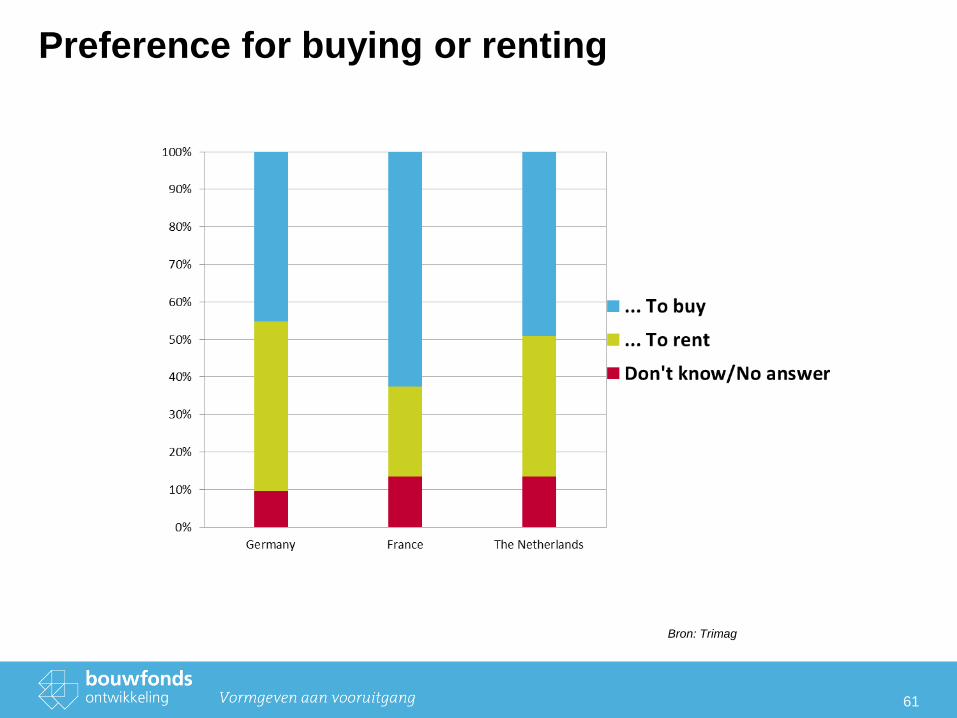
61
Preference for buying or renting
Bron: Trimag
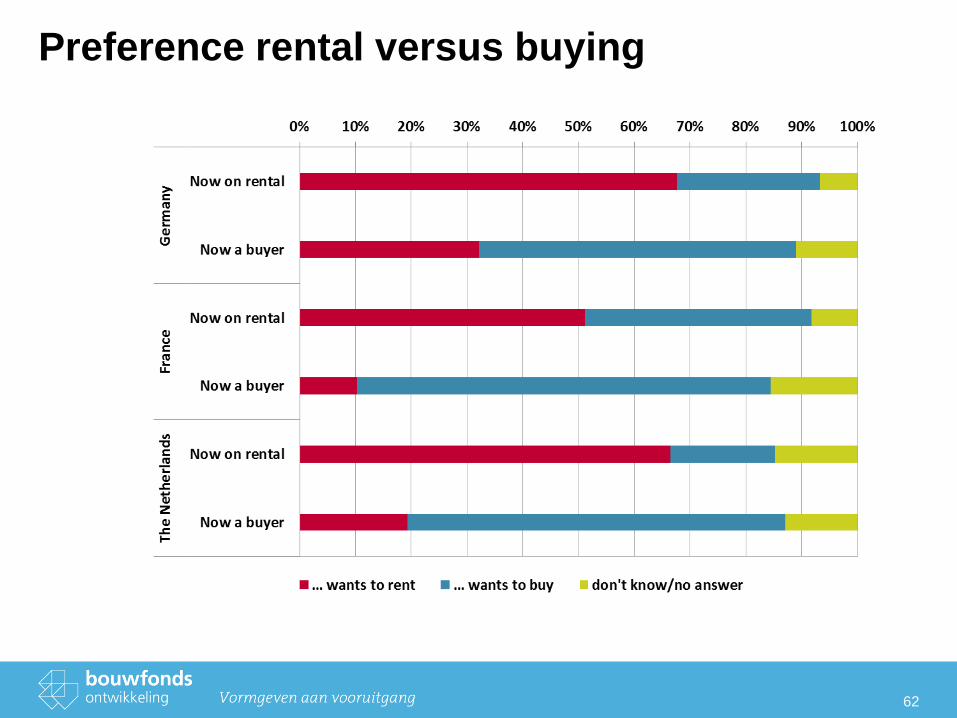
Preference rental versus buying
62
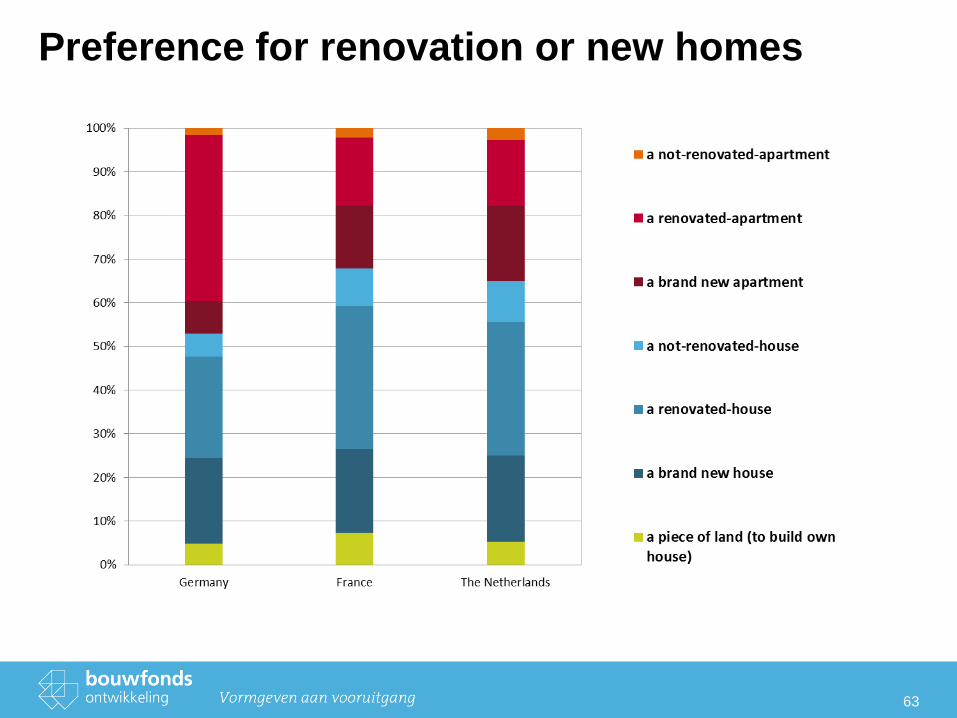
Preference for renovation or new homes
63
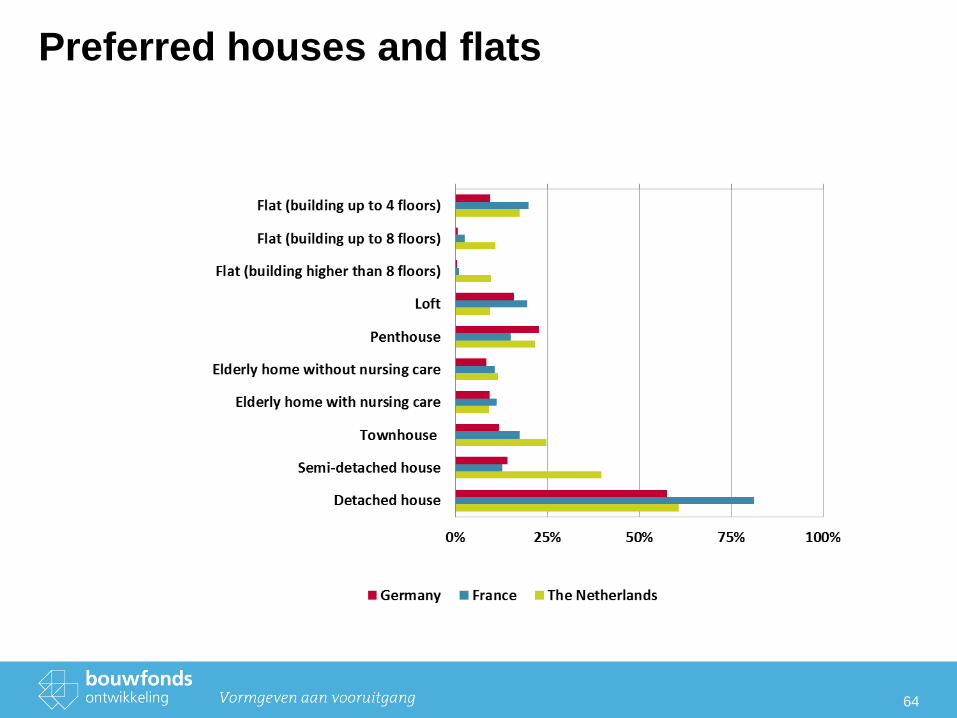
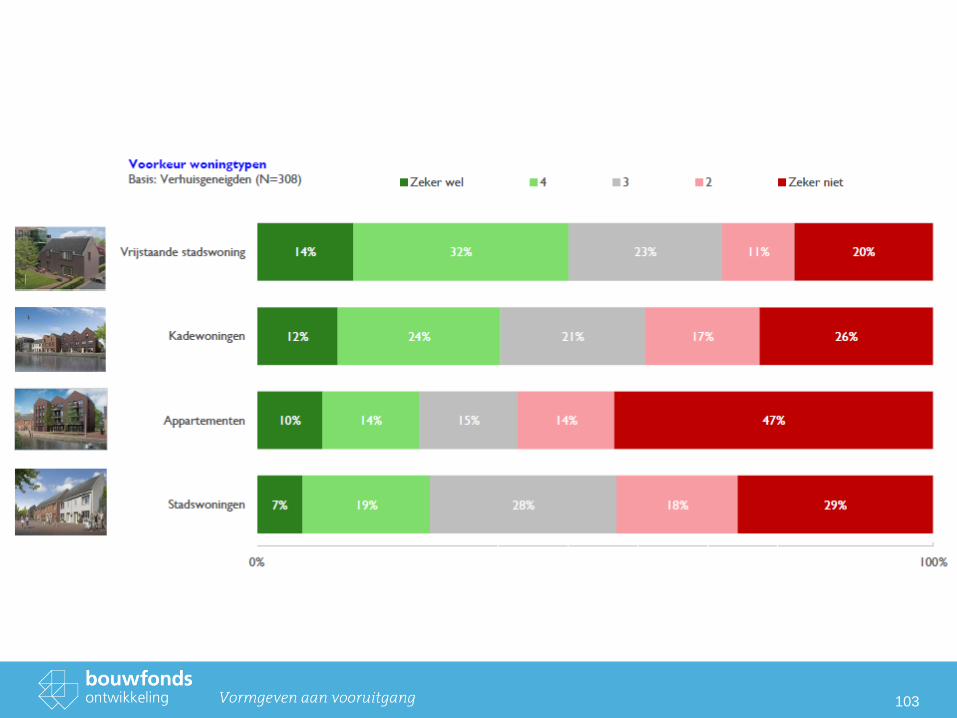
Preferred houses and flats
64
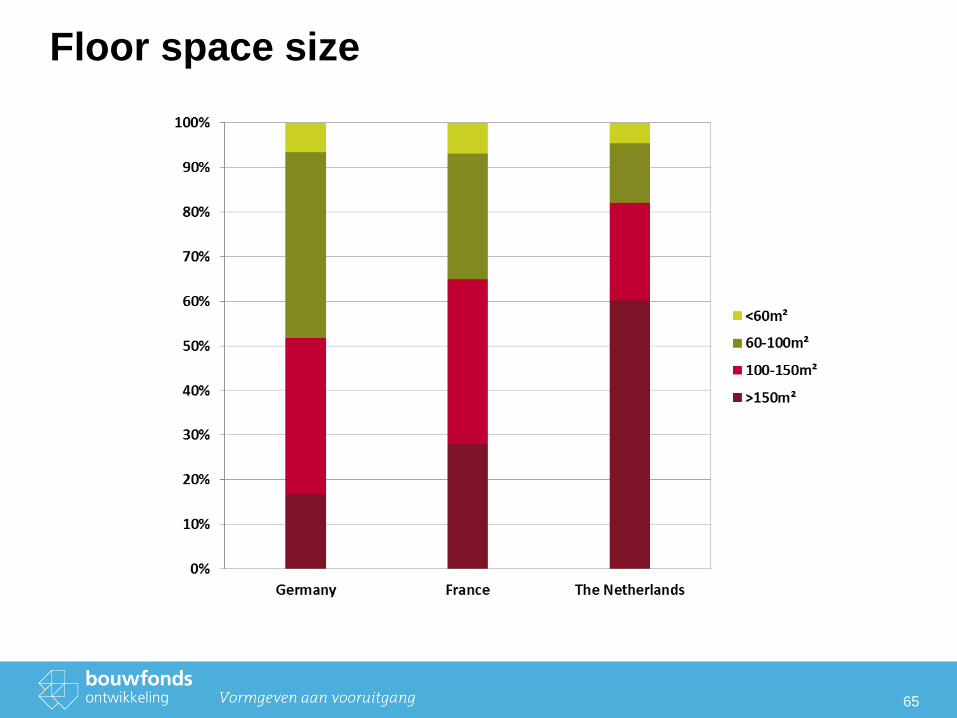
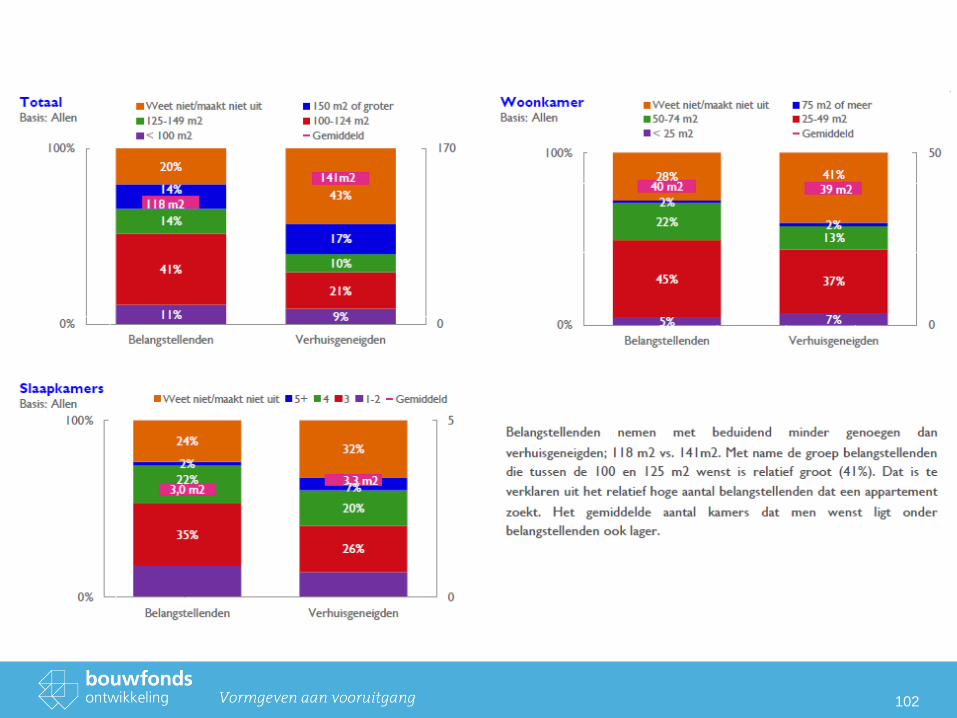
Floor space size
65
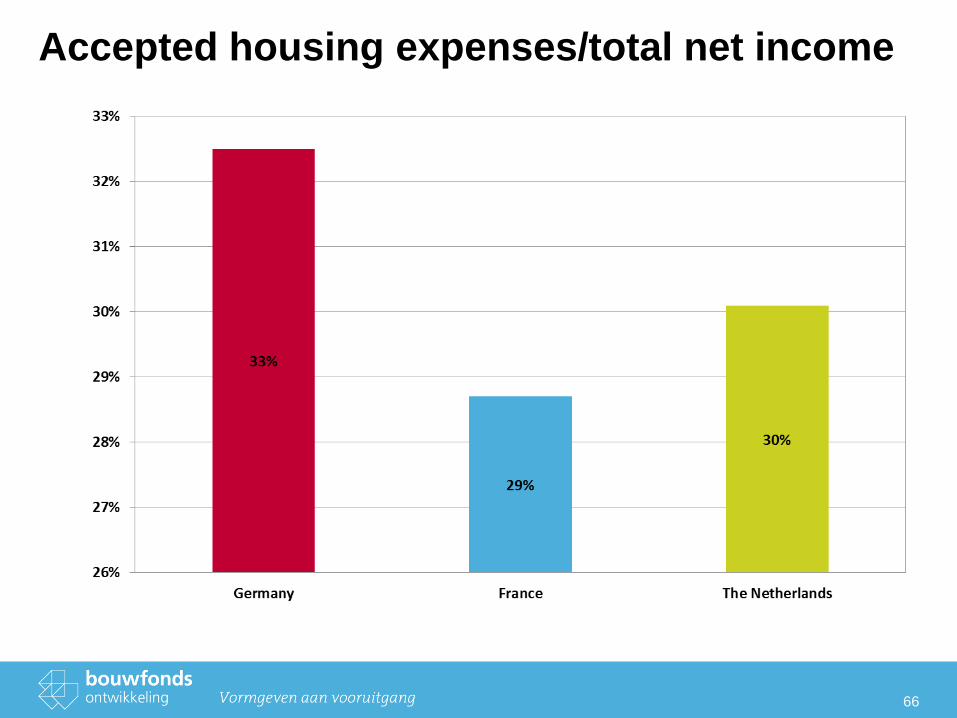
Accepted housing expenses/total net income
66
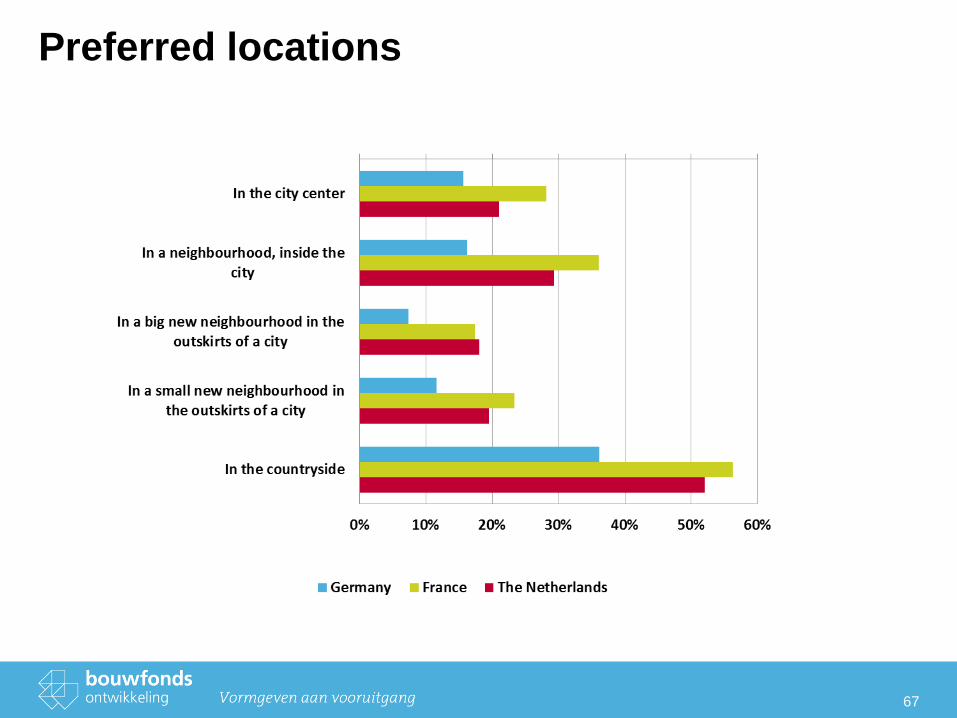
Preferred locations
67
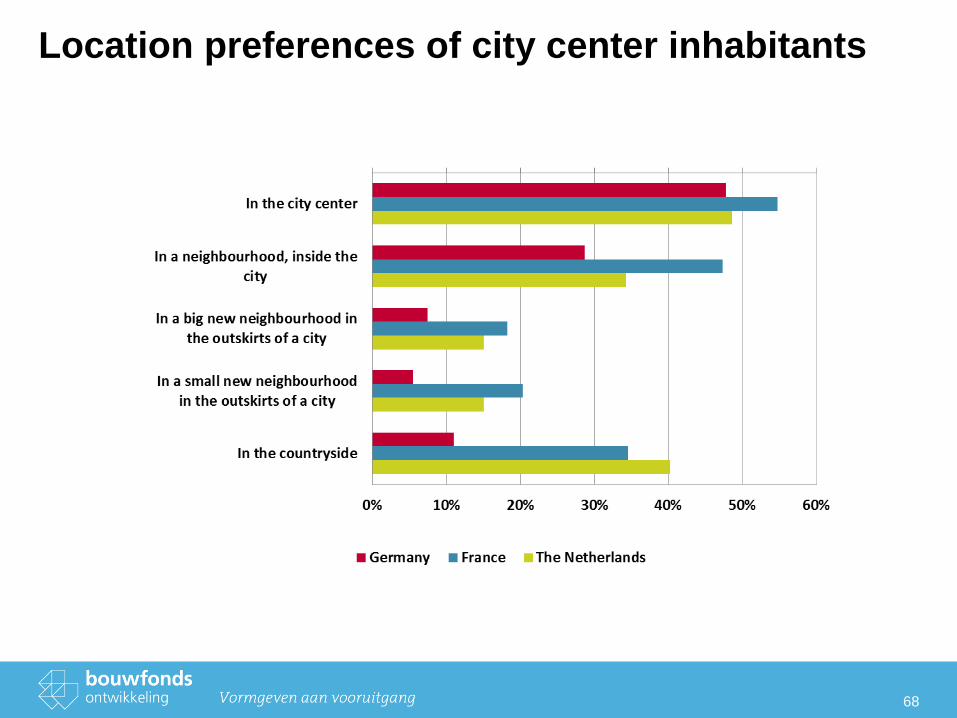
Location preferences of city center inhabitants
68
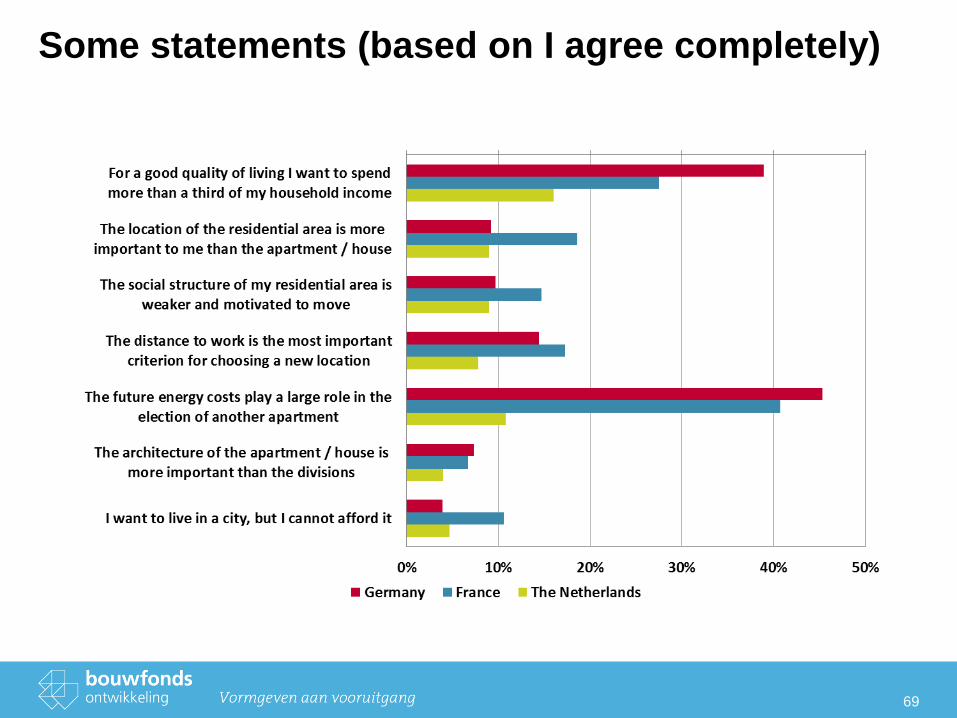
Some statements (based on I agree completely)
69
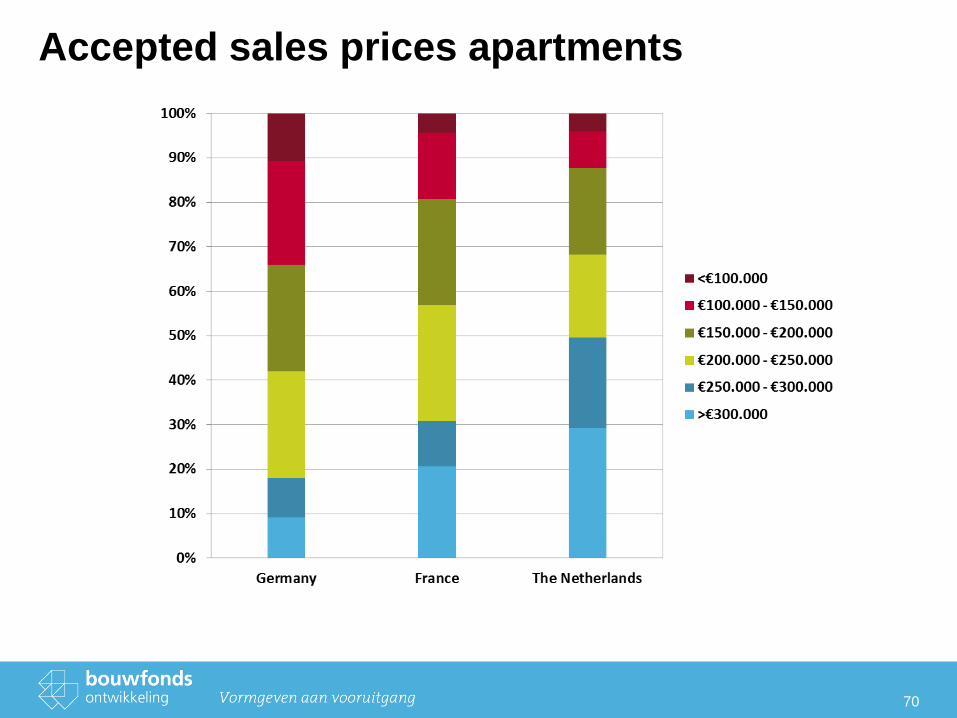
Accepted sales prices apartments
70
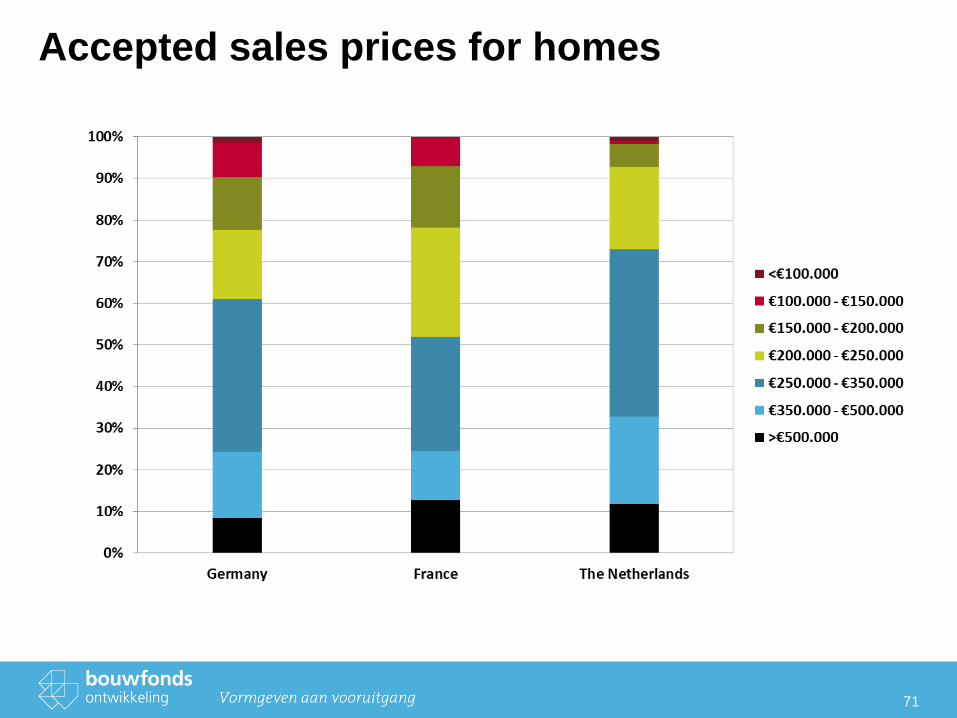
Accepted sales prices for homes
71
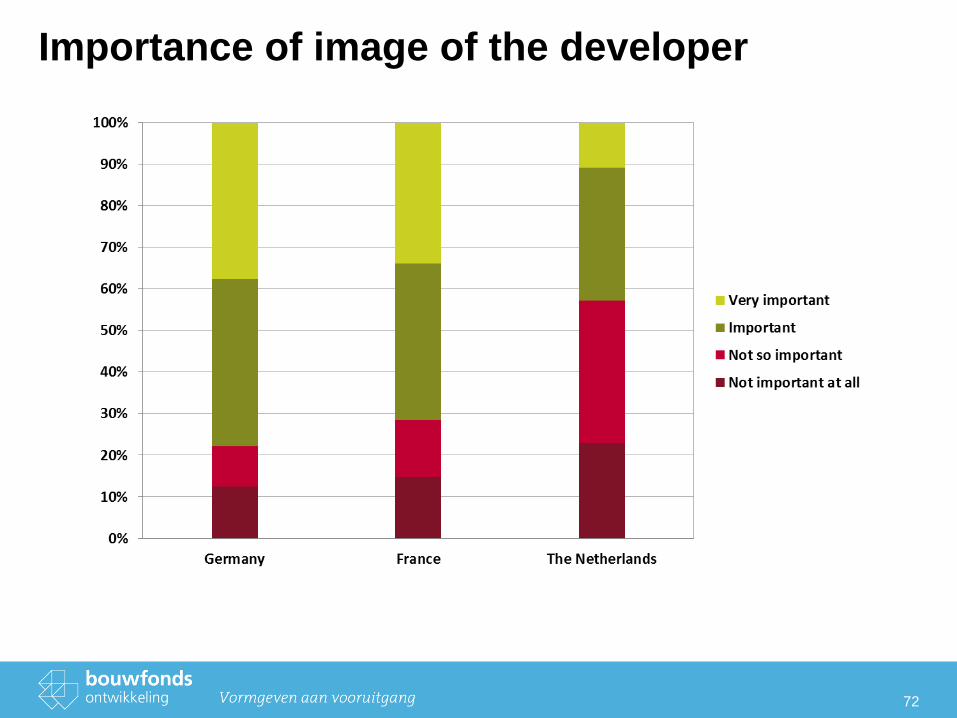
Importance of image of the developer
72
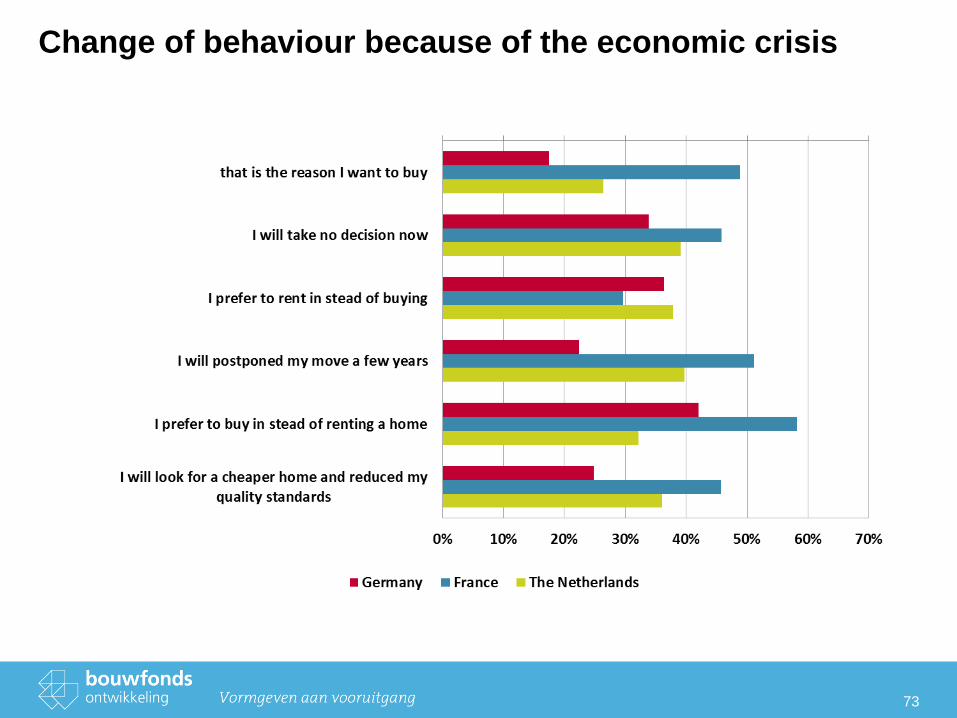
Change of behaviour because of the economic crisis
73
Researchtrends in the
residential market
75
Market research: knowledge is power
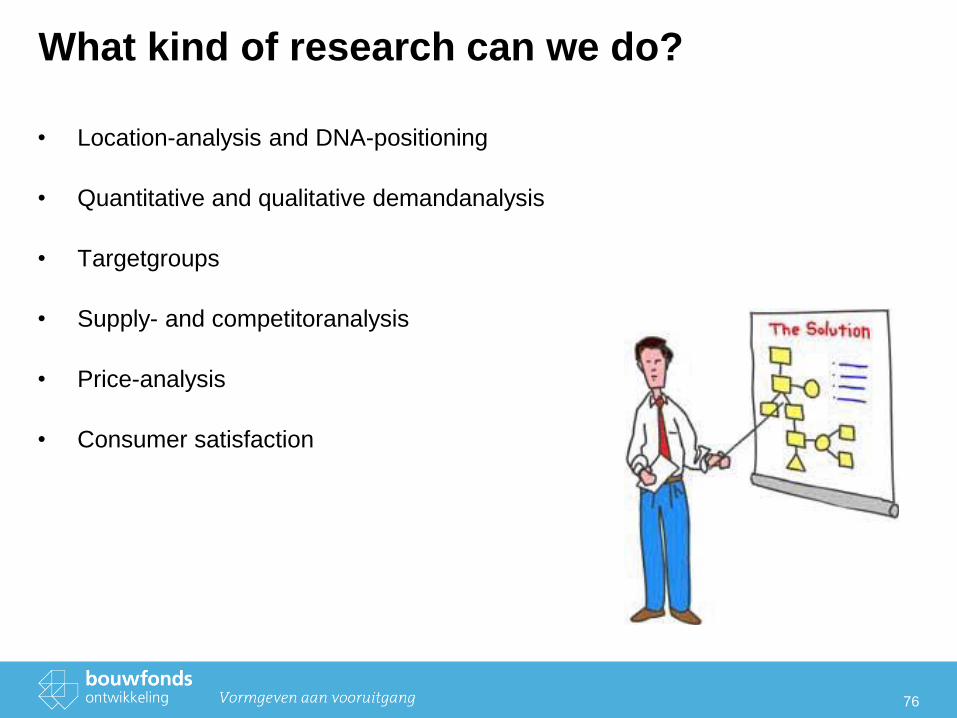
What kind of research can we do?
• Location-analysis and DNA-positioning
• Quantitative and qualitative demandanalysis
• Targetgroups
• Supply- and competitoranalysis
• Price-analysis
• Consumer satisfaction
76
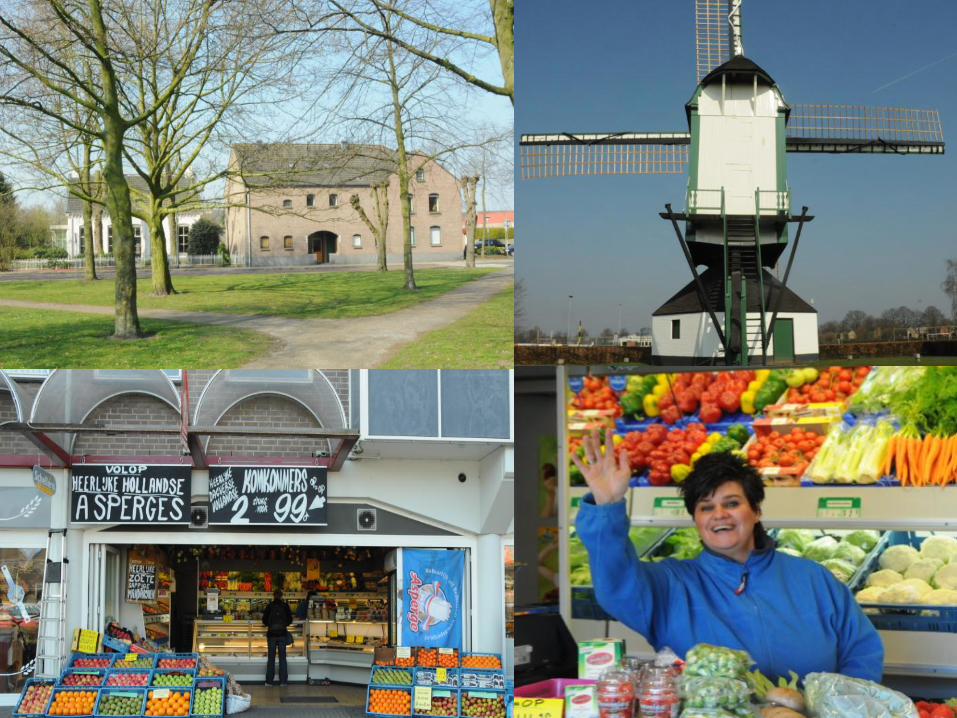
Deskresearch and location analysis

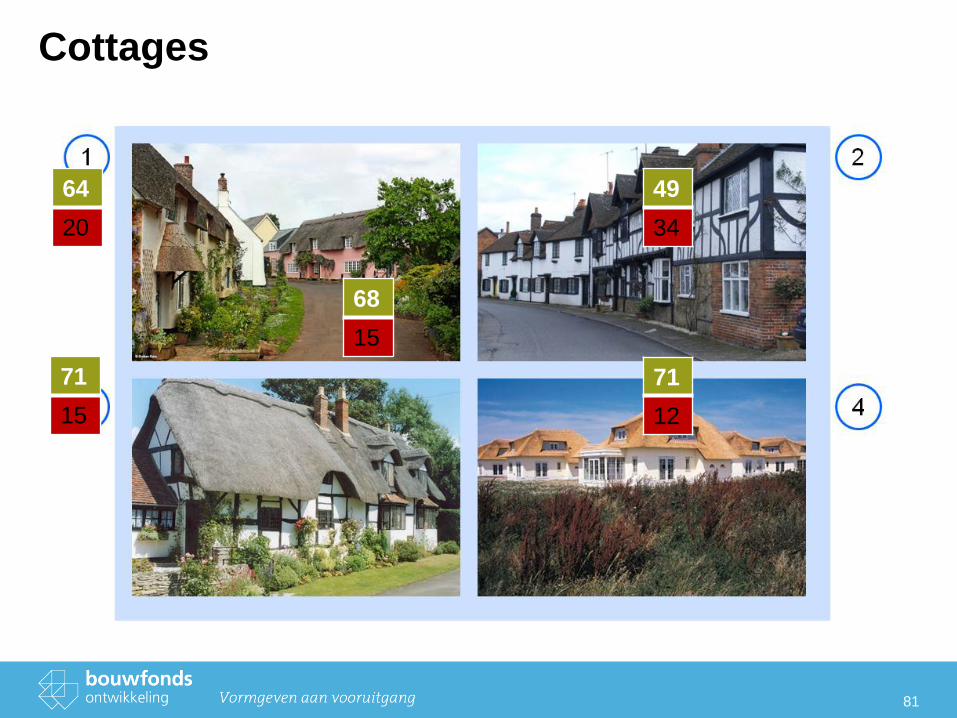
Cottages
81
64
20
49
34
71
12
71
15
68
15
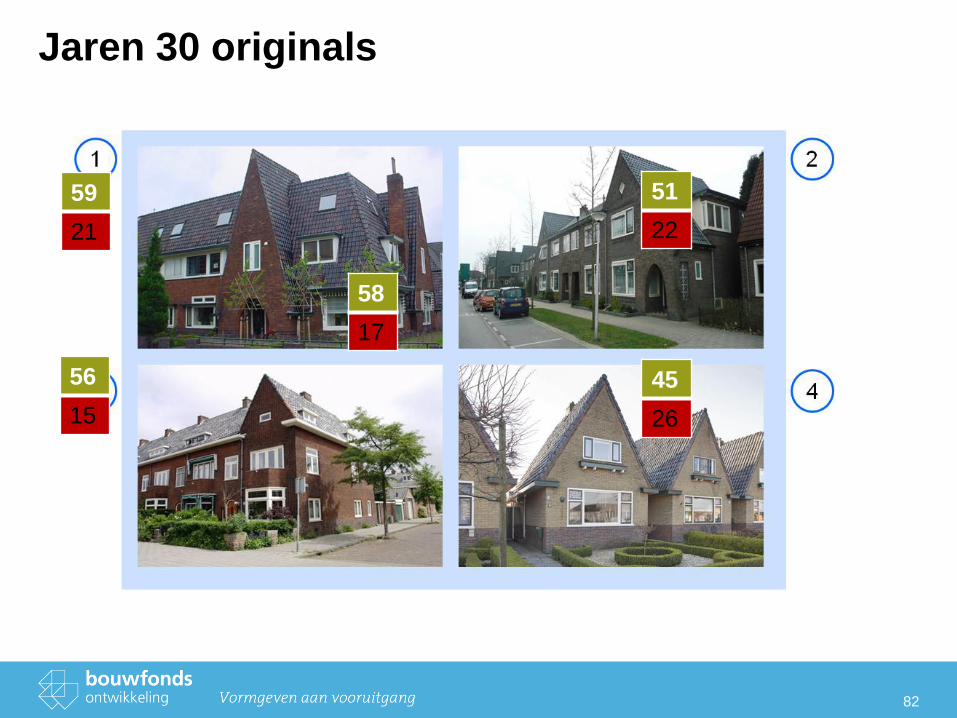
Jaren 30 originals
82
59
21
51
22
45
26
56
15
58
17
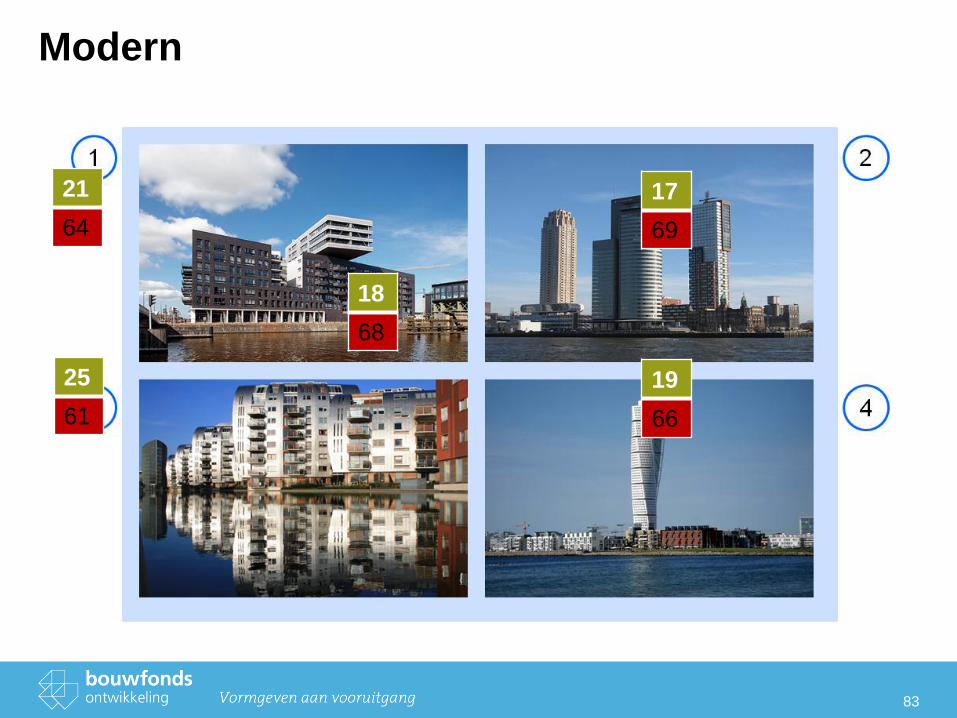
Modern
83
21
64
17
69
19
66
25
61
18
68
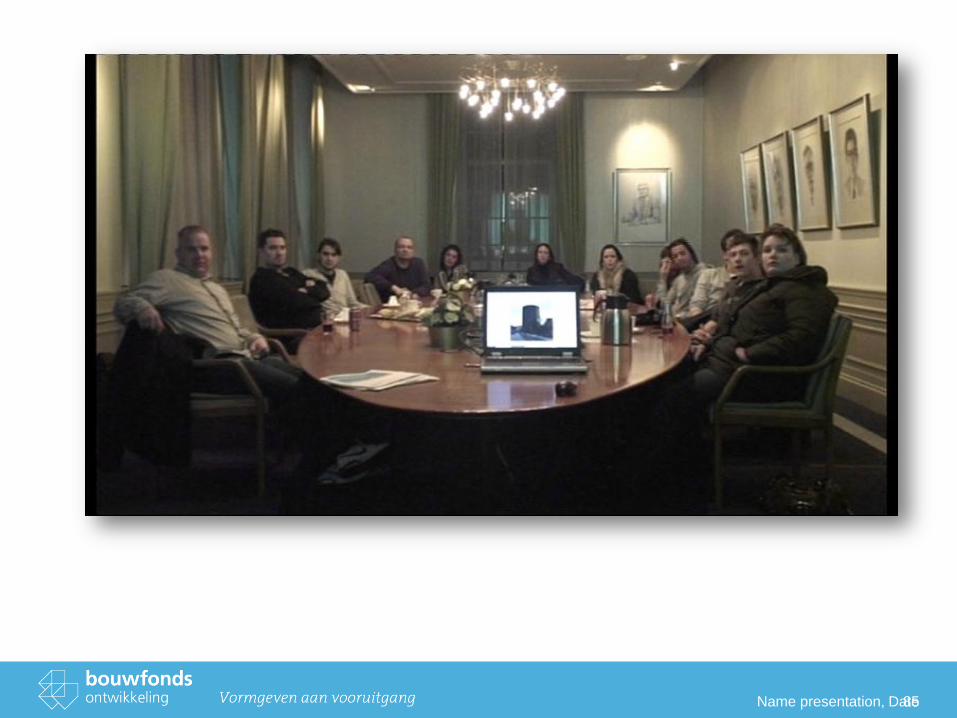
Focusgroupsessions
Name presentation, Date 85
86
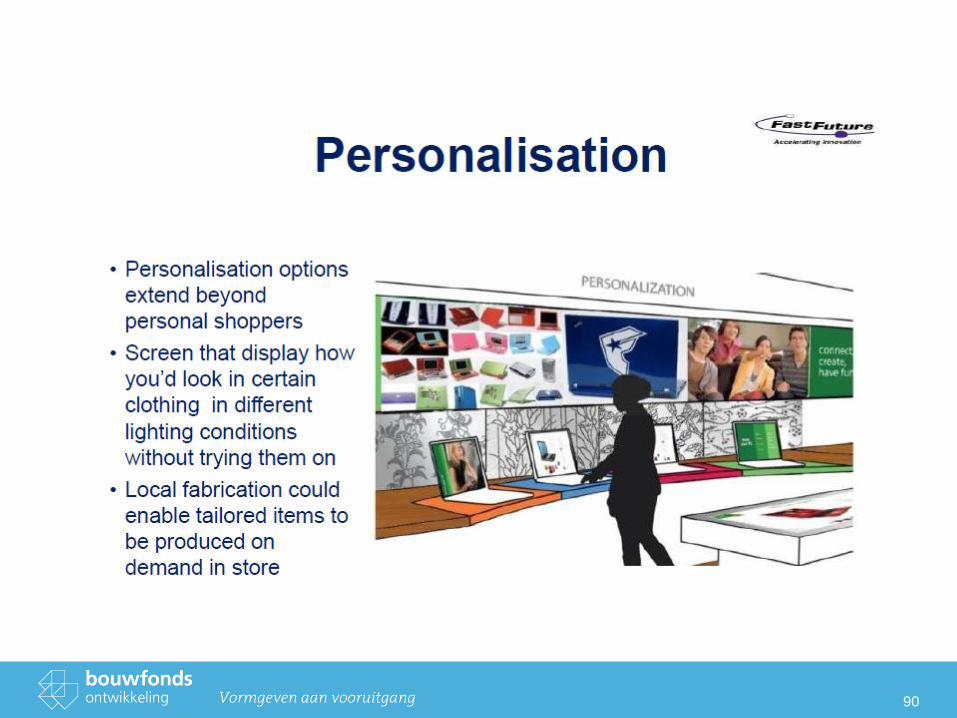
The 21e century:
big chances in
consumer behavior
87

88

89
90
91
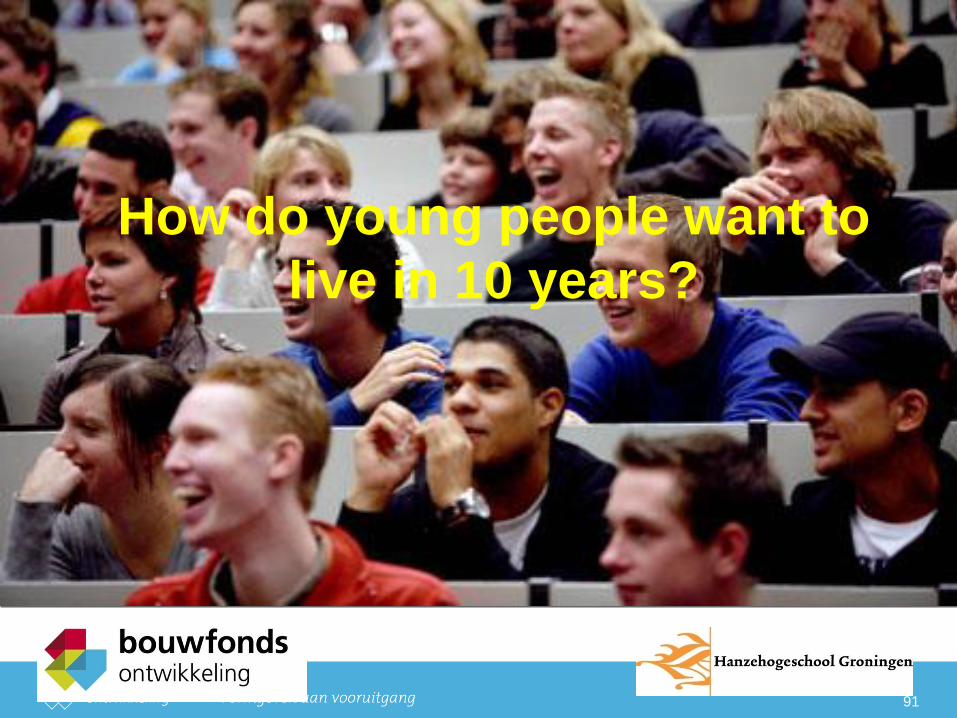
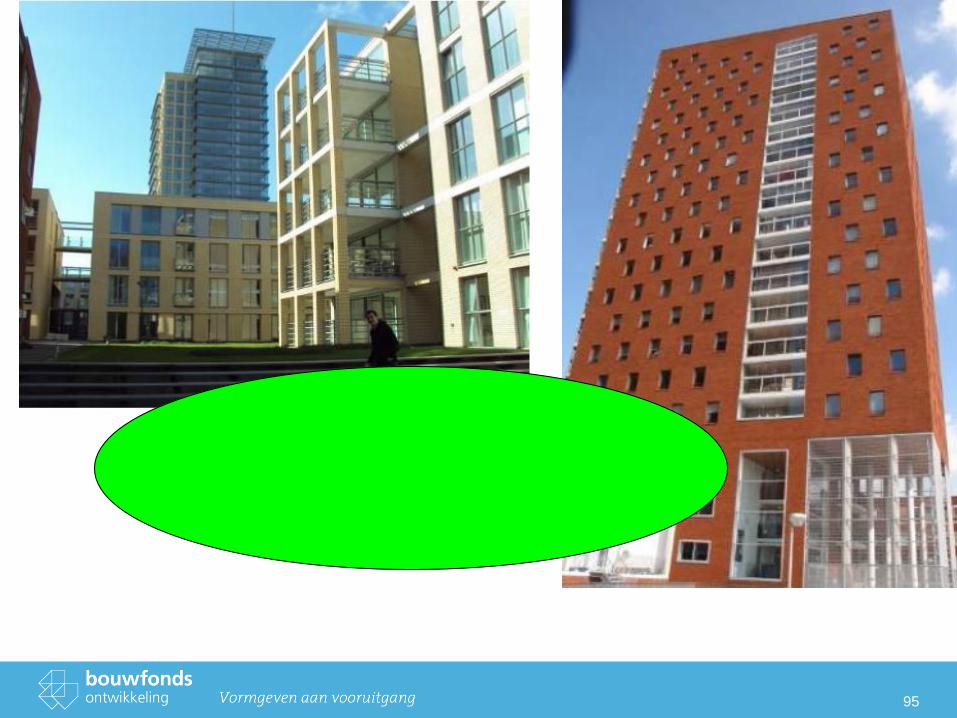
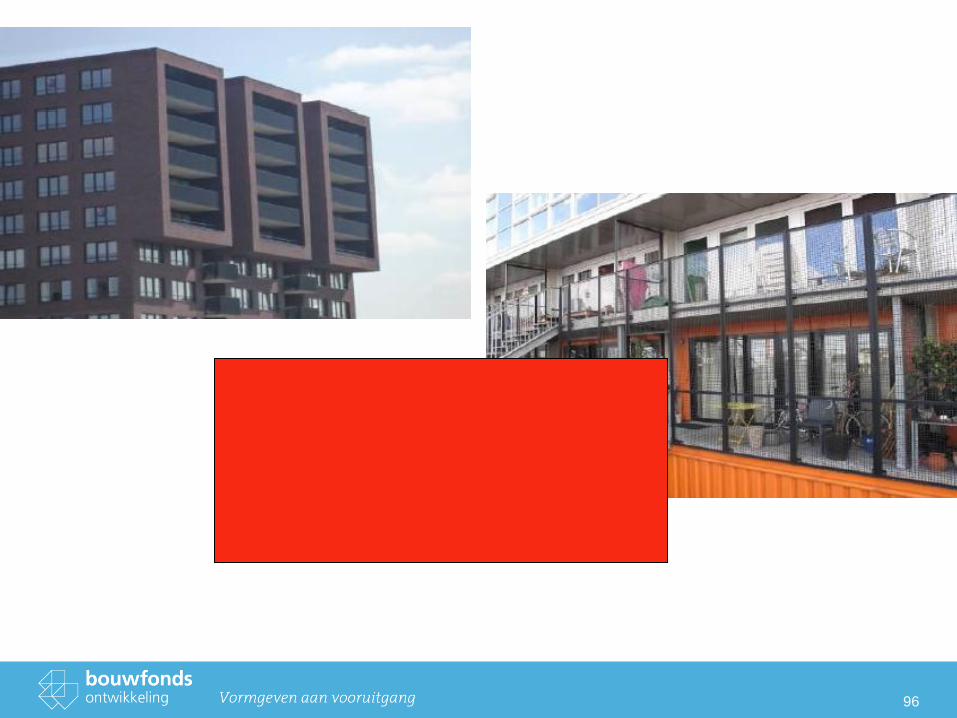
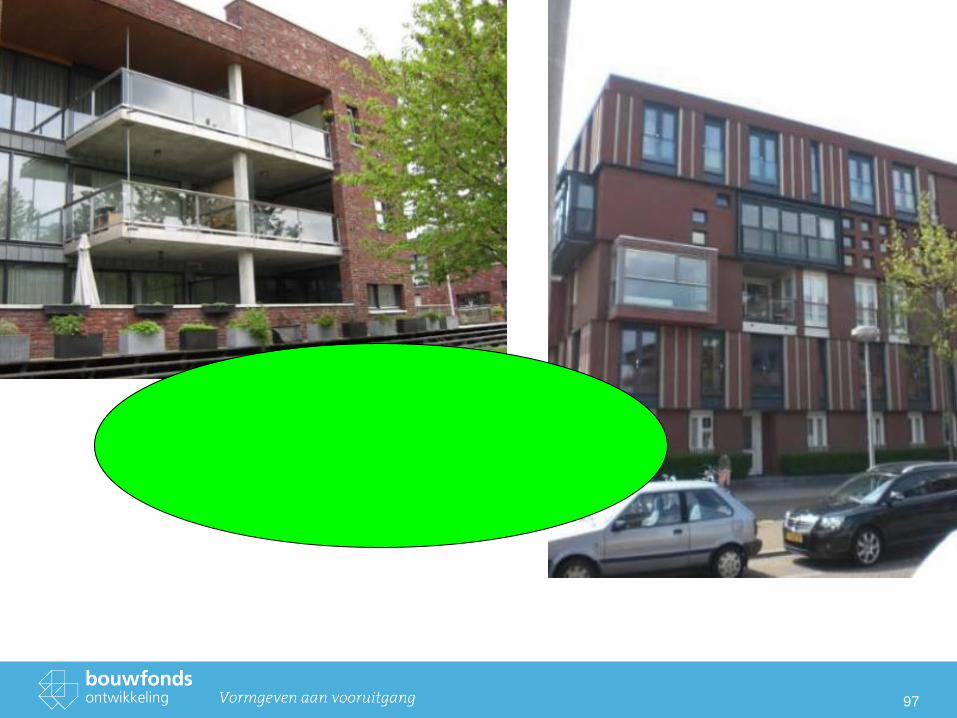
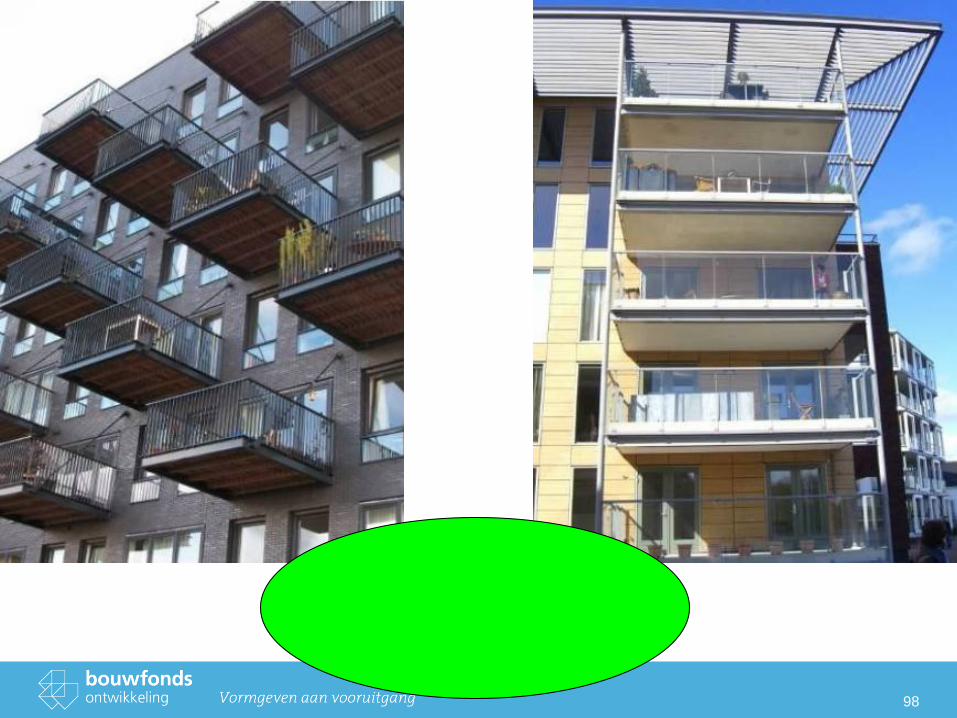
How do young people want to
live in 10 years?

92
93
94
95
96
97
98
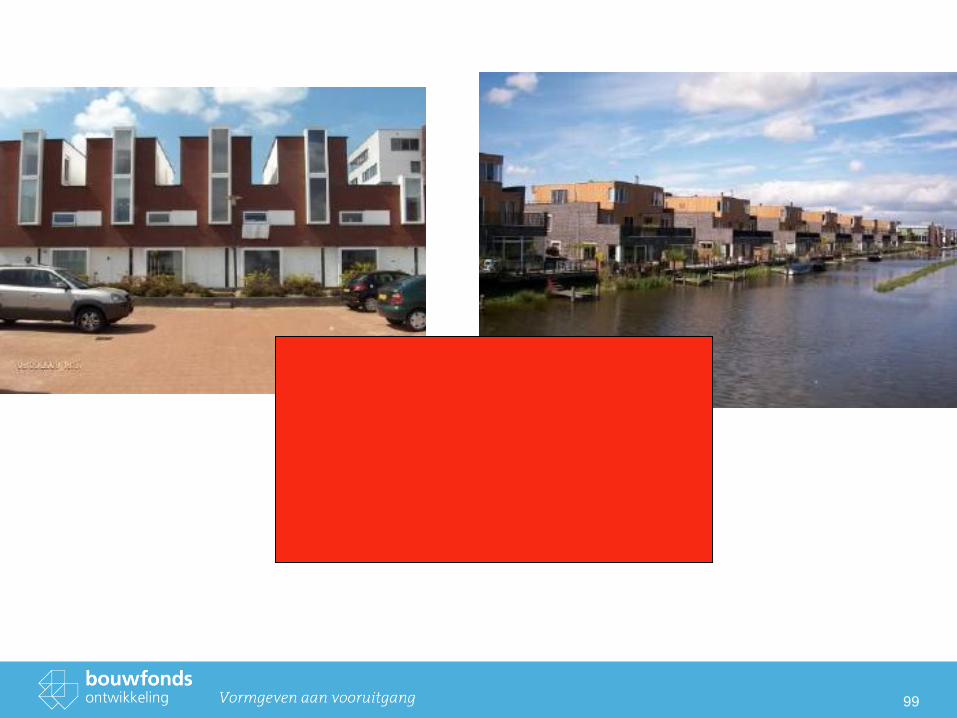
99
100
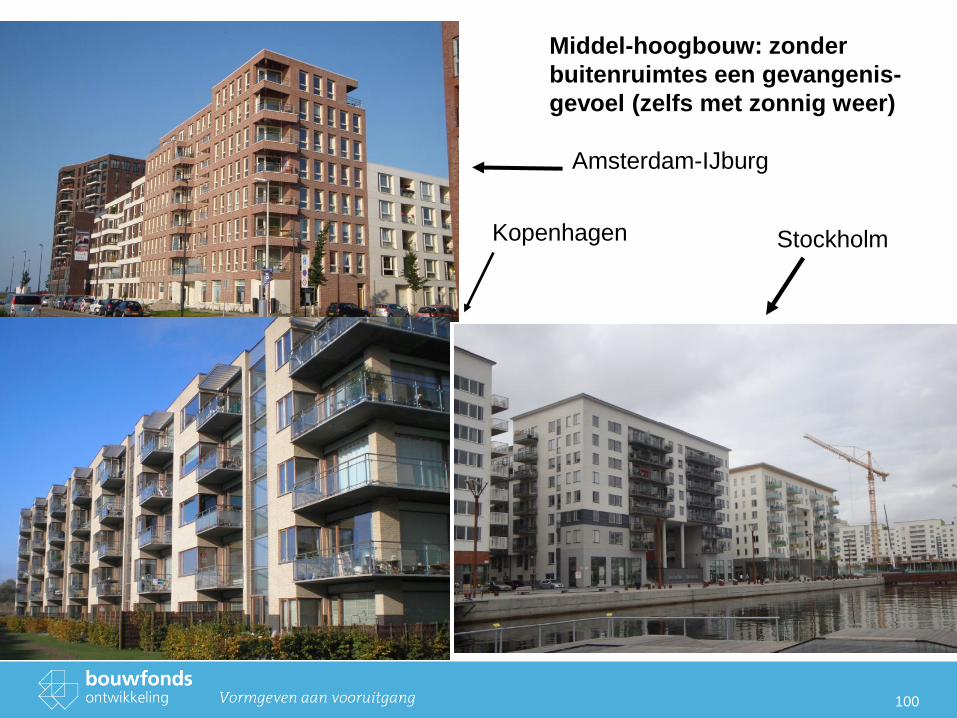
Middel-hoogbouw: zonder
buitenruimtes een gevangenis-
gevoel (zelfs met zonnig weer)
Amsterdam-IJburg
Kopenhagen Stockholm
Consumersurveys
102
103
104
Mosaic Bouwfonds
1. Mosaic Experian – Introduction into a marketing database
2. Mosaic Bouwfonds - Our custom made segmentation
3. Data used building the segmentation
4. Usage as marketingresearch instrument
5. Five reasons to work with Mosaic Bouwfonds
6. Mosaic in France
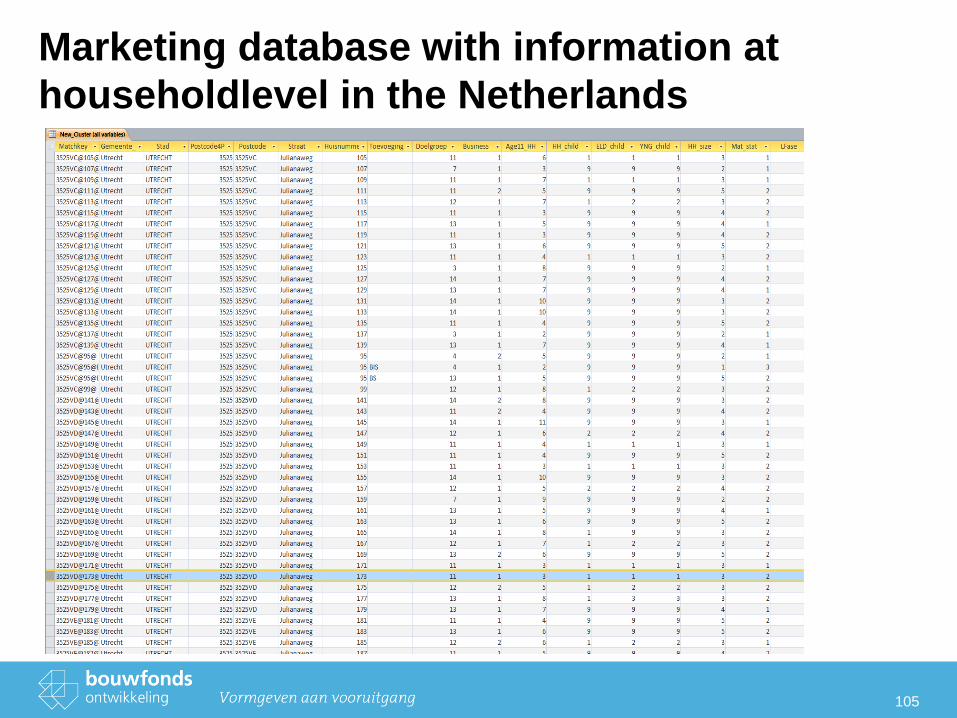
Marketing database with information at
householdlevel in the Netherlands
105
106
Mosaic Bouwfonds
1. Mosaic Experian – Introduction into a marketing database
2. Mosaic Bouwfonds Introduction into a custom made segmentation
3. Data used building the segmentation
4. Usage as marketingresearch instrument
5. Five reasons to work with Mosaic Bouwfonds
6. Mosaic in France
New Market Segmentation
107
Old Segmentation
• Who are they?
• In what house do they live?
Plus:
• Reason to move
• House preferences
• Price preferences
• Search behaviour
• Search and buy behaviour
• Media preferences
108
109
110
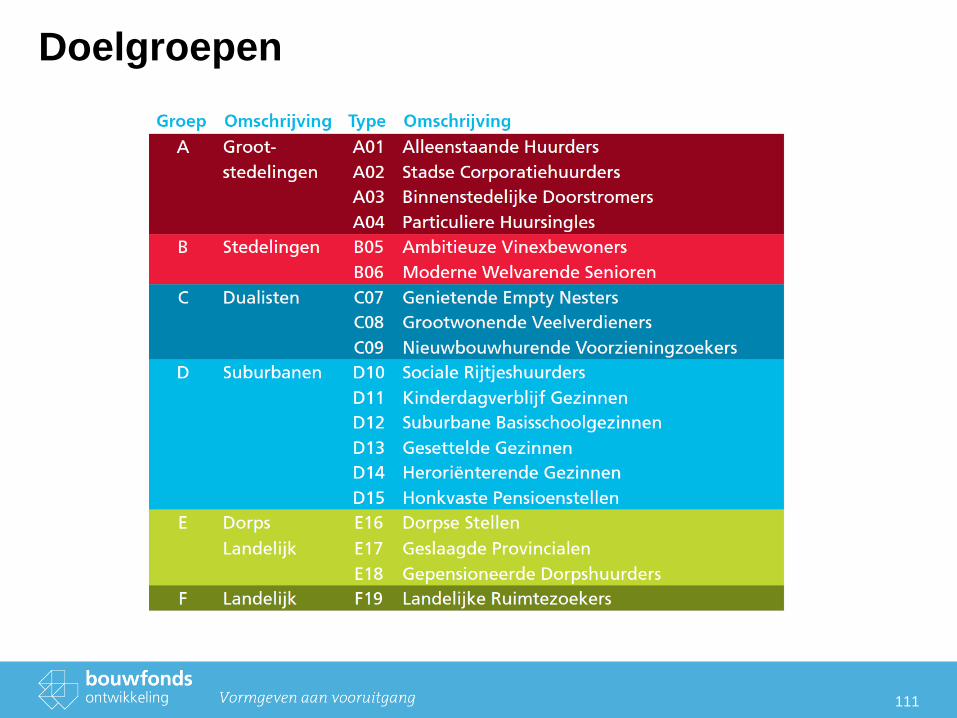
Doelgroepen
111
112
Mosaic Bouwfonds
1. Mosaic – Introduction into a marketing database
2. Mosaic Bouwfonds Segmentation
3. Data used building the segmentation
4. Usage as marketingresearch instrument
5. Five reasons to work with Mosaic Bouwfonds
6. Mosaic in France
113
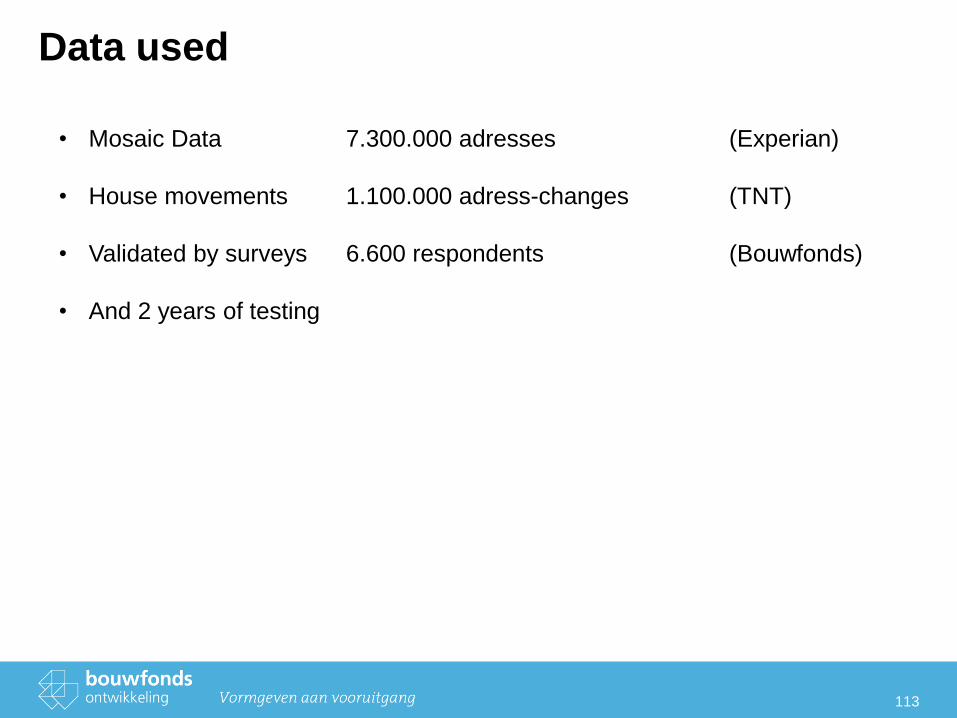
Data used
• Mosaic Data 7.300.000 adresses (Experian)
• House movements 1.100.000 adress-changes (TNT)
• Validated by surveys 6.600 respondents (Bouwfonds)
• And 2 years of testing
114
Mosaic Bouwfonds
1. Mosaic Experian – Introduction into a marketing database
2. Mosaic Bouwfonds Introduction into a custom made segmentation
3. Data used building the segmentation
4. Usage as marketingresearch instrument
5. Five reasons to work with Mosaic Bouwfonds
6. Mosaic in France
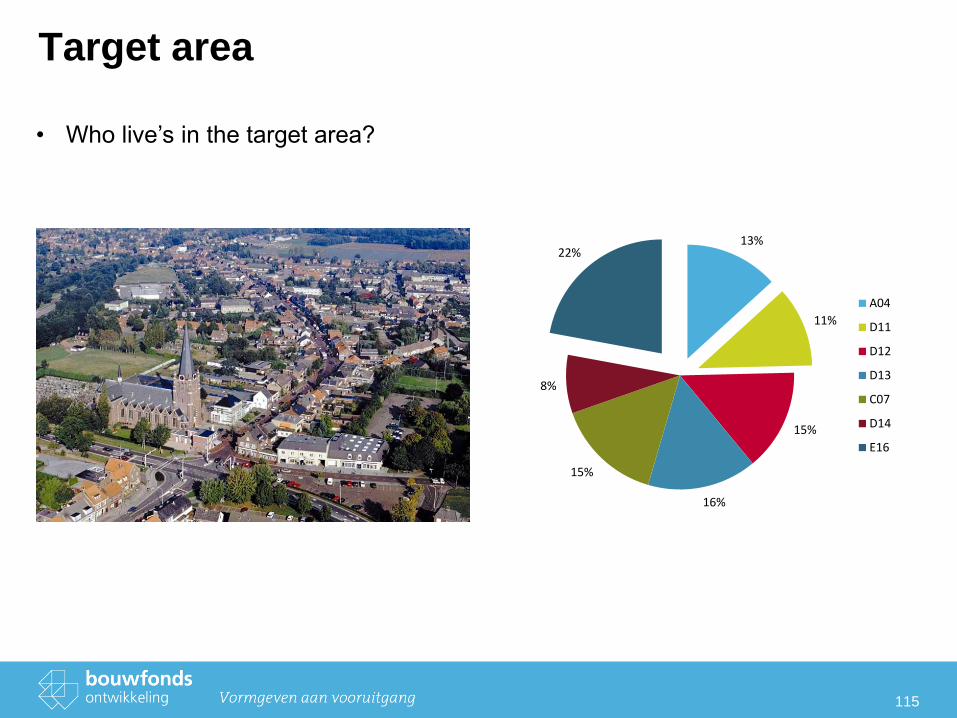
Target area
115
13%
11%
15%
16%
15%
8%
22%
A04
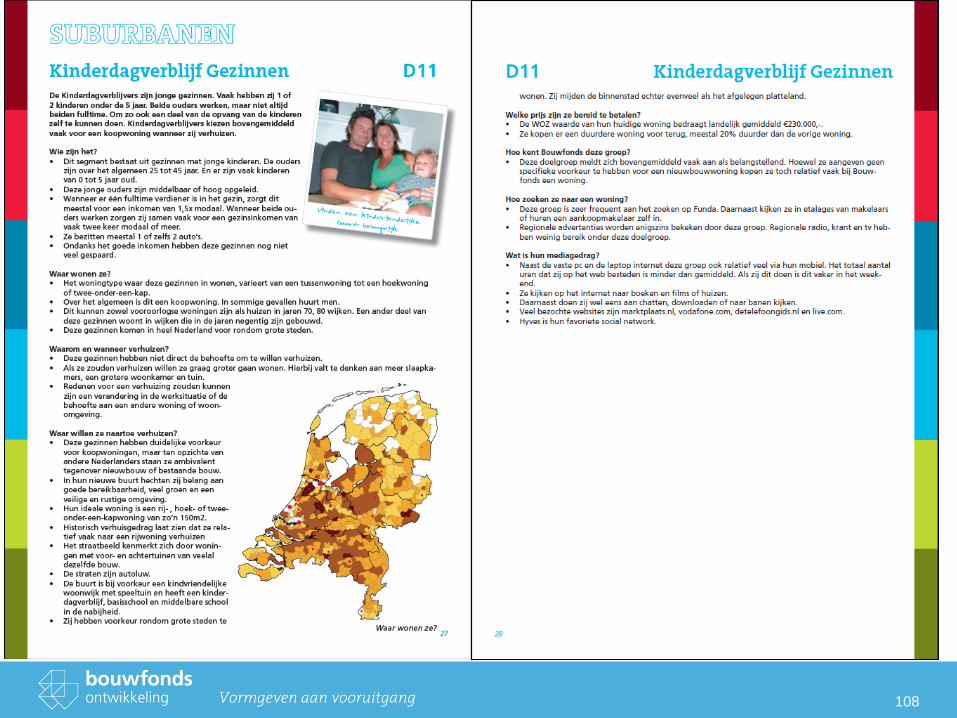
D11
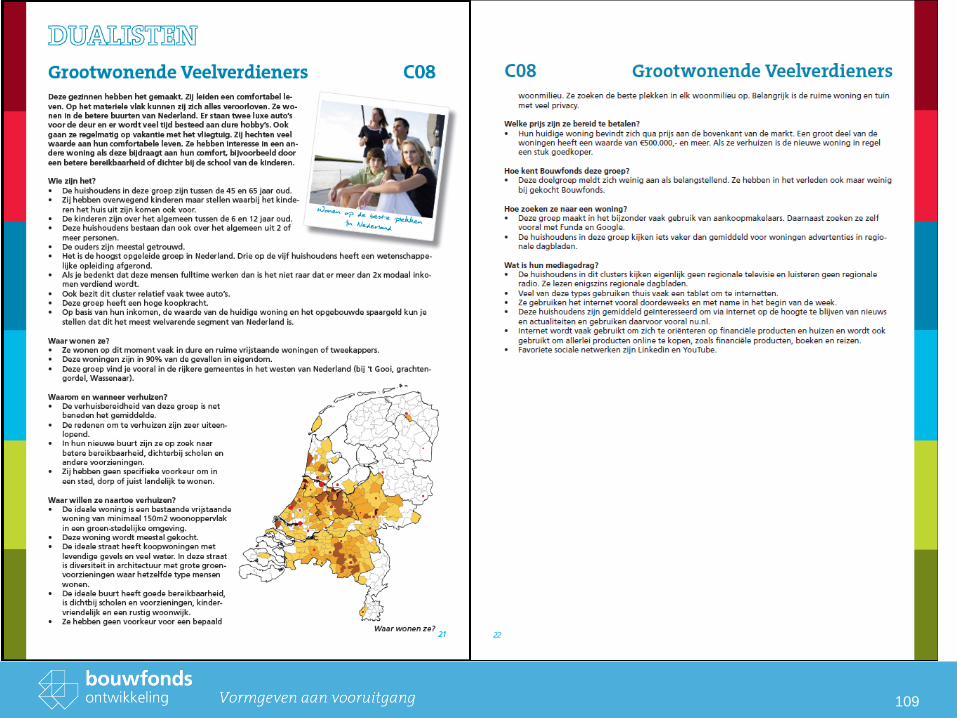
D12
D13
C07
D14
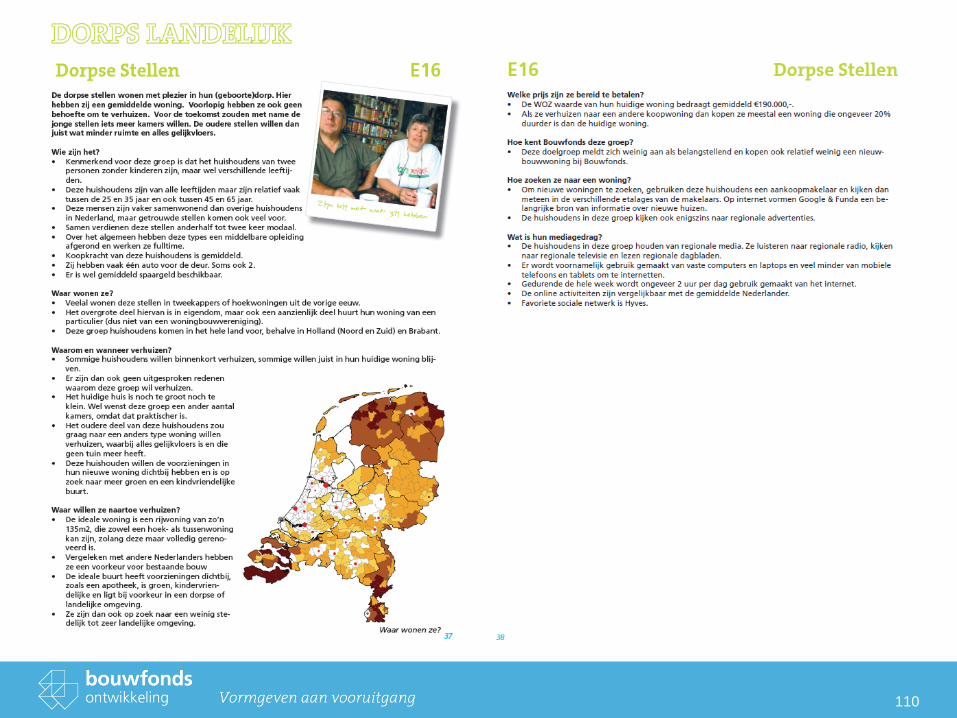
E16
• Who live’s in the target area?
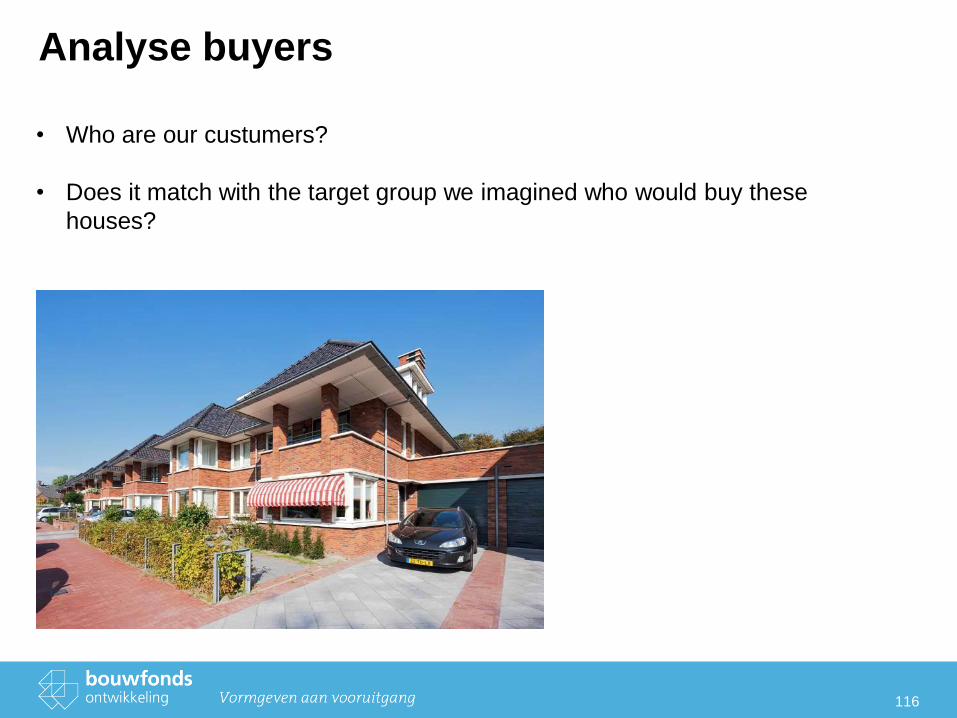
Analyse buyers
116
• Who are our custumers?
• Does it match with the target group we imagined who would buy these
houses?
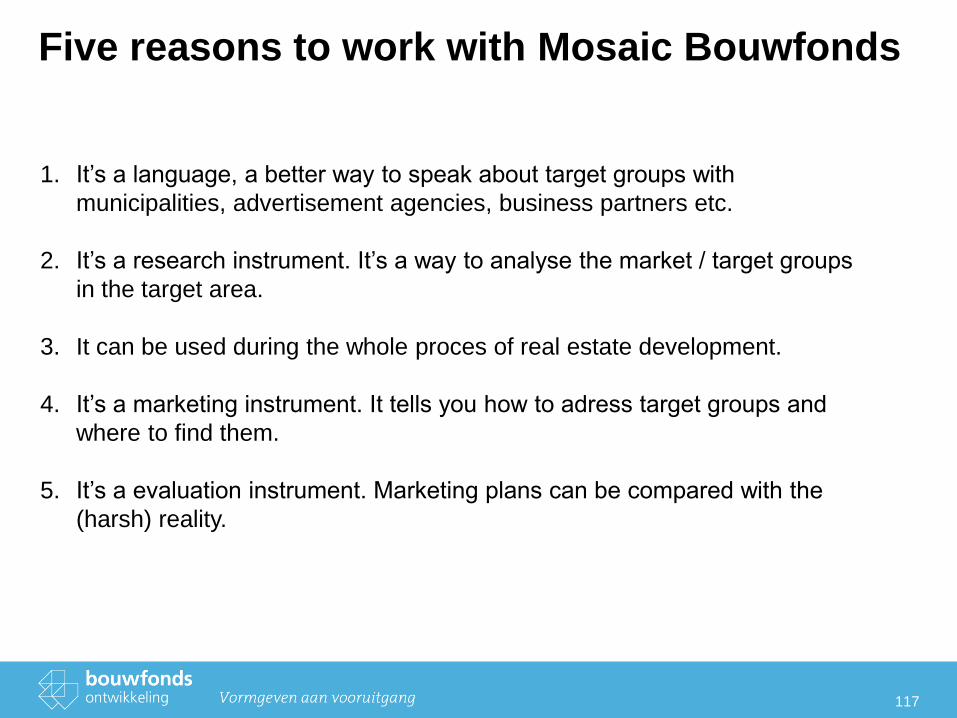
Five reasons to work with Mosaic Bouwfonds
117
1. It’s a language, a better way to speak about target groups with
municipalities, advertisement agencies, business partners etc.
2. It’s a research instrument. It’s a way to analyse the market / target groups
in the target area.
3. It can be used during the whole proces of real estate development.
4. It’s a marketing instrument. It tells you how to adress target groups and
where to find them.
5. It’s a evaluation instrument. Marketing plans can be compared with the
(harsh) reality.

118

119