researching the research: a central banking edition
TRANSCRIPT

www.cnb.cz
Research and Policy Notes ——— 3/2020
Researching the Research:
A Central Banking Edition
Simona Malovaná, Martin Hodula, Zuzana Rakovská
Cze
ch
Na
tio
na
l B
an
k —
——
Re
se
arc
h a
nd
Po
licy
No
tes
——
— 3
/20
20

The Research and Policy Notes of the Czech National Bank (CNB) are intended to disseminate the results of
the CNB’s research projects as well as the other research activities of both the staff of the CNB and
collaborating outside contributors, including invited speakers. The Notes aim to present topics related to
strategic issues or specific aspects of monetary policy and financial stability in a less technical manner than
the CNB Working Paper Series. The Notes are refereed internationally. The referee process is managed by
the CNB Economic Research Division. The Notes are circulated to stimulate discussion. The views
expressed are those of the authors and do not necessarily reflect the official views of the CNB.
Distributed by the Czech National Bank, available at www.cnb.cz
Reviewed by: Denis Essers (National Bank of Belgium)
Jan Brůha (Czech National Bank)
Project Coordinator: Jan Janků
Issued by: © Czech National Bank, December 2020
Researching the Research: A Central Banking Edition
Simona Malovaná, Martin Hodula, and Zuzana Rakovská ∗
Abstract
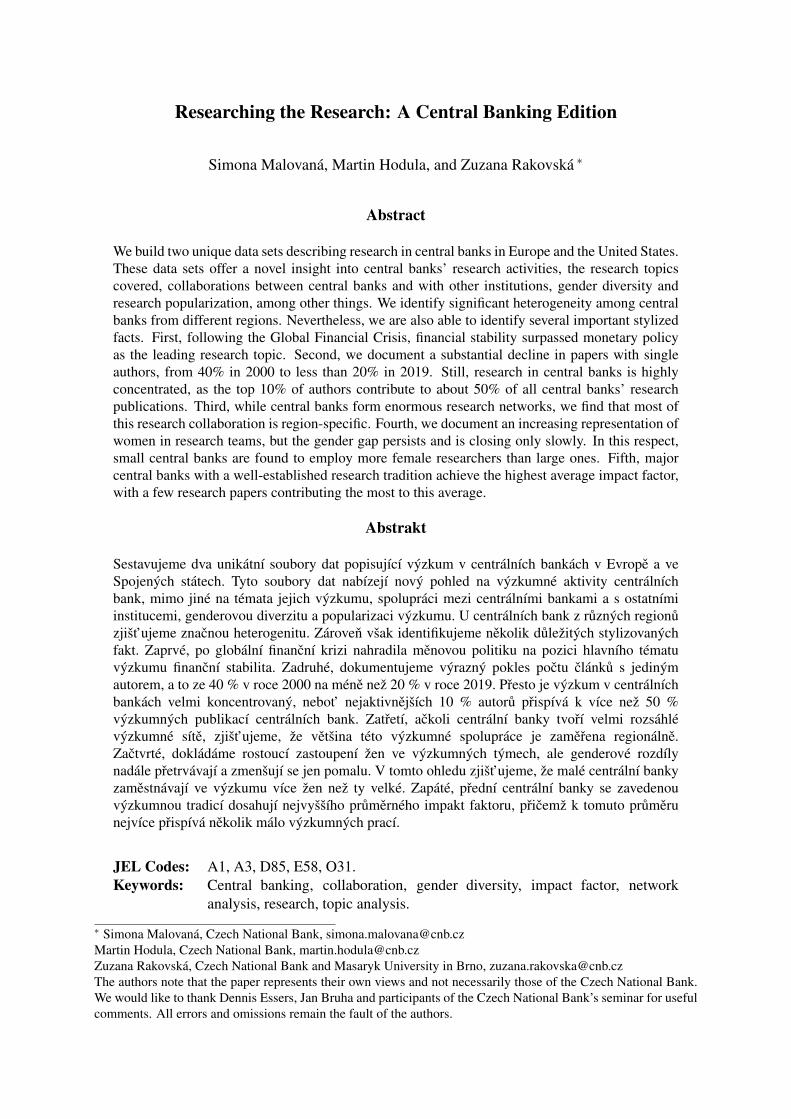
We build two unique data sets describing research in central banks in Europe and the United States.These data sets offer a novel insight into central banks’ research activities, the research topicscovered, collaborations between central banks and with other institutions, gender diversity andresearch popularization, among other things. We identify significant heterogeneity among centralbanks from different regions. Nevertheless, we are also able to identify several important stylizedfacts. First, following the Global Financial Crisis, financial stability surpassed monetary policyas the leading research topic. Second, we document a substantial decline in papers with singleauthors, from 40% in 2000 to less than 20% in 2019. Still, research in central banks is highlyconcentrated, as the top 10% of authors contribute to about 50% of all central banks’ researchpublications. Third, while central banks form enormous research networks, we find that most ofthis research collaboration is region-specific. Fourth, we document an increasing representation ofwomen in research teams, but the gender gap persists and is closing only slowly. In this respect,small central banks are found to employ more female researchers than large ones. Fifth, majorcentral banks with a well-established research tradition achieve the highest average impact factor,with a few research papers contributing the most to this average.
Abstrakt
Sestavujeme dva unikátní soubory dat popisující výzkum v centrálních bankách v Evrope a veSpojených státech. Tyto soubory dat nabízejí nový pohled na výzkumné aktivity centrálníchbank, mimo jiné na témata jejich výzkumu, spolupráci mezi centrálními bankami a s ostatnímiinstitucemi, genderovou diverzitu a popularizaci výzkumu. U centrálních bank z ruzných regionuzjišt’ujeme znacnou heterogenitu. Zároven však identifikujeme nekolik duležitých stylizovanýchfakt. Zaprvé, po globální financní krizi nahradila menovou politiku na pozici hlavního tématuvýzkumu financní stabilita. Zadruhé, dokumentujeme výrazný pokles poctu clánku s jedinýmautorem, a to ze 40 % v roce 2000 na méne než 20 % v roce 2019. Presto je výzkum v centrálníchbankách velmi koncentrovaný, nebot’ nejaktivnejších 10 % autoru prispívá k více než 50 %výzkumných publikací centrálních bank. Zatretí, ackoli centrální banky tvorí velmi rozsáhlévýzkumné síte, zjišt’ujeme, že vetšina této výzkumné spolupráce je zamerena regionálne.Zactvrté, dokládáme rostoucí zastoupení žen ve výzkumných týmech, ale genderové rozdílynadále pretrvávají a zmenšují se jen pomalu. V tomto ohledu zjišt’ujeme, že malé centrální bankyzamestnávají ve výzkumu více žen než ty velké. Zapáté, prední centrální banky se zavedenouvýzkumnou tradicí dosahují nejvyššího prumerného impakt faktoru, pricemž k tomuto prumerunejvíce prispívá nekolik málo výzkumných prací.
JEL Codes: A1, A3, D85, E58, O31.Keywords: Central banking, collaboration, gender diversity, impact factor, network
analysis, research, topic analysis.
∗ Simona Malovaná, Czech National Bank, [email protected] Hodula, Czech National Bank, [email protected] Rakovská, Czech National Bank and Masaryk University in Brno, [email protected] authors note that the paper represents their own views and not necessarily those of the Czech National Bank.We would like to thank Dennis Essers, Jan Bruha and participants of the Czech National Bank’s seminar for usefulcomments. All errors and omissions remain the fault of the authors.

2 Simona Malovaná, Martin Hodula, and Zuzana Rakovská
1. Introduction
Economic and financial research plays a pivotal role in central banks around the world.Research units are tasked with providing policymakers with inputs which help to expand theknowledge base needed for the central bank’s core activities. Given the fact that central bankingtasks continue to grow in complexity, the importance of research and the demands placed on it areexpected to grow too. Thus, the question is not whether to conduct research in central banks, buthow to organize it, how much to invest in it and how to assure effective transmission of researchoutcomes into the policy decision-making process. Nowadays, an increasing number of centralbanks have their own research divisions or whole departments staffed with both junior andsenior-level research economists.1 This is a manifestation of the general belief that sound policymust build on cutting-edge economic thinking. Moreover, research in central banks has establisheditself as a prominent contributor to the academic literature over time. Claveau and Dion (2018)show that major monetary economics journals are increasingly dominated by central banks’research papers. Another interesting trend is the visibly increasing share of non-US central bankerswho have been invited to the annual Jackson Hole Economic Policy Symposium.2 This hasallowed them to conduct high-level discussions about current topics, to evaluate the ex-anteappropriateness of intended measures and to analyse the efficiency of measures applied.
The importance of having a research department within a central bank is recognized bynumerous current and former central bank representatives. Cecchetti (2002) notes that centralbanks equipped with research departments make better monetary policy. Bolton et al. (2014)highlight that having a high quality research team is essential if central bankers and financialsupervisors are to meet the objectives given to them by their societies. Trichet (2007) states thatcentral banks need top-quality research on monetary and financial economics. Carney (2014)emphasizes analytical excellence and the development of a single research agenda as means topromote the good of the people. Mishkin (2010) states that the more monetary policy is informedby good science, the more successful it will be. There are, in fact, numerous official discoursesgoing in the same direction.3
In our paper, we provide a comprehensive international overview of the research conducted incentral banks. We perform our exploration across both the cross-sectional and the time dimension.Specifically, we aim to shed some light on how central banks organize and communicate theirresearch activities, how they perform in terms of research outputs, and what the recent trends arein areas such as the research topics covered, collaborations between central banks and with otherinstitutions, and gender diversity. For this purpose, we create two unique data sets. The first onecontains information on central banks’ research activities in three main areas: research publications,popularization of research and organization of research. Each area is evaluated on a number ofdifferent factors, together making a list of 26 items. The second data set comprises informationabout more than 20,000 research papers published in European and US central banks over the periodof 2000–2019. To the best of our knowledge, neither of these two data sets has previously beenconstructed. As such, they offer a unique insight into central banks’ research activities, allowingus to explore heterogeneity among central banks from different regions and changes in research
1 The high level of specialization and proficiency in economics and finance is also apparent from the governorappointments. Lebaron and Dogan (2016) analyse the biographies of 312 incumbent and former central bankgovernors from across the world, observing a high qualification level, predominantly in economics.2 The proportion of market participants fell from 27% in 1982 to 3% in 2013 as they were “replaced” by non-UScentral bankers, whose share increased from 3% to 31% (The Economist, 2014).3 Similar speeches on the importance of research in central banks were given at the end of the millennium as well– see Taylor (1998).

Researching the Research: A Central Banking Edition 3
conducted before and after the Global Financial Crisis (GFC) of 2007–2009. Documenting theseissues may help central banks to identify best practices.
We complement the existing body of literature along at least three dimensions. First, we addto the literature examining the research conducted in academia. This includes studies that analysethe formation of research networks among academics (Adams, 2012) and studies commenting onthe demographics and trends in the articles published in economic journals (Card and DellaVigna,2013; Hamermesh, 2013). Our paper verifies whether some of the trends observed in academicresearch regarding the number of coauthors, network density, distribution of authorship and othersare also present in central banks’ research. In this respect, our findings largely complement thoseof Essers et al. (2020), who employed data on 6,152 IMF Working Papers written in the period of1990–2017, including authors’ names and emails, number of pages and citations, and JEL codes,using the IMF website catalogue. In addition, they complemented the data with employee-levelinformation. Our analysis offers a rather different perspective, as it includes an international sampleof central banks and supranational institutions, while it supports many of the findings of Esserset al. (2020). Second, our paper echoes the literature on central bank communication (Dincer andEichengreen, 2007; Blinder et al., 2008) by offering a unique view on how research – one of theunderlying processes behind policy decision-making – is conducted. Third, we contribute to thegrowing body of literature on gender gaps in central banks (Charléty et al., 2017; Diouf and Pépin,2017) by studying the gender structure of research teams.
The rest of the paper is organized as follows. Section 2 describes two unique data sets on centralbanks’ research. Section 3 discusses the main purpose of research in central banks and categorizesthe main research activities performed by them. Section 4 gets more into the detail and presentsa few stylized facts on the topics researched in central banks, authorship networks, the genderstructure of research teams and the impact factor of central banks’ publications. Section 5 concludes.
2. Data Sets on Central Banks’ Research Activity
We construct two unique data sets allowing us to explore various attributes of research incentral banks. We focus our attention on two regions – the US and Europe. We complement theseregions with data on two additional international institutions, namely the Bank for InternationalSettlements (BIS) and the European Central Bank (ECB, also including the European SystemicRisk Board, ESRB), as both encompass research activities serving policy conduct in central banks.Altogether, we compile information on 55 central banks. We include all 12 regional FederalReserve Banks in the Federal Reserve System and the Federal Reserve Board (FRB), and40 European national central banks. Within Europe, we further distinguish between three regionalareas - the Euro Area original members (EA orig.), Western and Northwestern Europe (W &NWE), and Eastern and Southeastern Europe and the Baltic Countries (E & SEE, BC; see Table 1).We hypothesize that research quantity, quality and collaboration, among other things, will bedifferent between the regions. For instance, we assume a more dense collaboration network withinthe Euro Area original members, reflecting a longer period of mutual cooperation via variousworking groups and research networks. Furthermore, we assume higher quality of researchconducted by central banks in W & NWE relative to E & SEE, BC due to a longer tradition ofresearch in both central banks and academia. As such, the differentiation between these regionswill help us to explore the potential heterogeneity.

4 Simona Malovaná, Martin Hodula, and Zuzana Rakovská
Table 1: Division of Central Banks in Europe into Regions
Euro AreaOriginal Members(EA orig.)
Western andNorthwestern Europe(W & NWE)
Eastern andSoutheastern Europeand Baltic Countries(E & SEE, BC)
Research ScoreData Set&IDEAS/RePEcData Set
AT Austria DK Denmark AL AlbaniaBE Belgium IS Iceland BG BulgariaDE Germany NO Norway CY CyprusES Spain SE Sweden CZ Czech RepublicFI Finland SW Switzerland EE EstoniaFR France UK United Kingdom GR GreeceIE Ireland HR CroatiaIT Italy HU HungaryLU Luxembourg LT LithuaniaNL Netherlands LV LatviaPT Portugal MK North Macedonia
MT MaltaPL PolandRO RomaniaRS SerbiaSK SlovakiaSL SloveniaUA Ukraine
OnlyResearch ScoreData Set
BA Bosnia andHerzegovina
BY Republic of BelarusMD Republic of MoldovaME MontenegroXK Republic of Kosovo
Note: The Research Score Data Set includes an additional five central banks in Europe which report somecharacteristics of their research but do not have any public research publication series, or the series is very short,or the publications are not in English.
The first data set leverages information available on each of the 55 central banks’ websitesand social media accounts. The data set (hereafter referred to as the Research Score Data Set)comprises information on central banks’ research activities in three main areas: researchorganization, publications and popularization. Each area is evaluated using several differentfactors, together making a list of 26 items (see Tables A1, A2 and A3 in Appendix A). The itemsinclude, for example, the types of research publication series, the extent of research opportunitiesoffered, the level of autonomy of the research departments and the degree to which US andEuropean central banks use their websites, social media (Twitter, LinkedIn and YouTube) andadditional forms of communication such as blogs, newsletters and bulletins to promote theresearch. Out of the 26 items, 21 were harvested from banks’ websites and four from banks’ socialmedia accounts, and the last item was collected as a single observation from the IDEAS/RePEcwebsite (see the next paragraph). The data were collected during the observation period ofFebruary–March 2020 and should therefore be interpreted as of these months. Each item isassigned a score of between 0 and 1: 1 if the bank engages in the given activity in full; 0.50/0.25 ifthe activity is in place only partially; and 0 otherwise. To obtain a separate measure for each of thethree areas and a single overall measure for all 26 items, the research scores are constructed as thesum of the scores assigned to the individual items; the individual items are not weighted. As such,we get an Overall Research Score, a Research Organization Score, a Research Publication Score

Researching the Research: A Central Banking Edition 5
and a Research Popularization Score. All the scores are calculated on the level of individual centralbanks and visualized in the form of a geographical heat map (see Figure B1 in Appendix B).
The second data set comprises information about more than 20,000 research paperspublished in 50 central banks over the period of 2000–2019.4 This data set was extracted fromthe IDEAS/RePEc website using the web-scraping technique, and it includes the paper’s title, theauthors’ names and reported affiliations, the abstract, keywords and JEL codes, and an indicationof whether the paper has been published in a scientific journal.5,6 We harvested information onworking paper series, discussion paper series and occasional paper series, and on other researchpublication series similar to those three (for instance, research publication series with a specialfocus, such as MPC discussion papers or financial stability papers).7 The final data set (hereafterreferred to as the IDEAS/RePEc Data Set) went through numerous controls to ensure itscompleteness and correctness. Nevertheless, it was not possible to extract and match allinformation. For example, it is not possible to match the author to his or her affiliation if the namelisted in the paper differs from the name registered in the database (if it has changed due tomarriage, for example). It is also not possible to match a working paper to its journal version if thetitle has changed significantly. Moreover, not all the harvested information is reported for eachresearch paper. For instance, abstracts are assigned to more than 99.6% of publications, keywordsto about 83% and JEL codes to about 78%. About 69% of all authors have an assigned affiliation.In addition, the data are subject to the completeness and quality of reporting by central banks,listed journals and authors themselves. A few central banks in Europe either do not report theirresearch publications in the database at all, or do not have such a series. Therefore, someinformation was harvested manually where available to complete the coverage of Europeancountries (see Tables A4–A5 in Appendix A). We excluded entries with non-English abstracts(only about 2.3%) and we expanded the IDEAS/RePEc Data Set with some additional informationon impact factor and the gender of the authors. Gender is identified using the R package genderbased on the authors’ first name (85% of all first names are recognized and assigned a gender withan average probability (precision)8 of 98%). Impact factors, as reported by the IDEAS/RePEcdatabase, are assigned both to the central banks’ research publication series and to the scientificjournals in which some of the research papers are published.
4 Five central banks in Europe which report some characteristics of their research but do not have any publicresearch publication series, or the series is very short, or the publications are not in English, were omitted from thesecond data set.5 The data was extracted from the IDEAS/RePEc database during the first half of 2020. As such, it represents theinformation which applies to the date on which it was collected. For example, the author’s affiliation representsthe affiliation reported by her at that time. As such, it does not represent a historical record of the affiliations towhich the author reported at the time of paper’s publication.6 A scientific journal is any publication series referred to as a journal by IDEAS/RePEc. As such, it includes centralbanks’ in-house journals.7 The publication series were selected based on their research character so as to create a more or less homogeneousgroup, which means that rather short and analytical publication series were not included. We also excluded in-house journals, as these are by their nature closer to scientific journals than working paper series. Moreover, if theworking paper (discussion paper, occasional paper, etc.) is then published in the central bank’s in-house journal, itis indicated in our sample.8 The gender is inferred using historical data sets of first names and dates of birth. In this way it is possible toreport the probability that a name was male or female. For more details, see the documentation on the package.

6 Simona Malovaná, Martin Hodula, and Zuzana Rakovská
3. How to Understand and Organize Research in Central Banks
The term “research” is not well understood by many. Even in central banks, the views on whatconstitutes research may vary – both across different central banks and even among the employeesof a bank (Meyer et al., 2008).9 Research is characterised by a high degree of uncertainty,complexity and uniqueness of the questions researched and methods applied, and by high demandson resources.10 In this regard, research differs from analysis. Analytical tasks are usually lesscomplex and more repetitive and, to some extent, can be performed using automated data-retrievaltechniques. As such, analysis is always associated with a lower degree of uncertainty, i.e. it ispossible to predict relatively well what the output will be. While both analysts and researcherswork with economic and financial data, researchers tend to work on both the front end (performingestimates and interpreting the results) and the back end of the data (compiling and analysing),whereas most analysts work only on the back end.
Both basic and applied research should be present in central banks, as they complement eachother. Basic research is generally tasked with thoroughly investigating a problem to push back thefrontiers of knowledge. Applied research, on the other hand, is supposed to have an immediateuse and visible value added. Although basic research may not have any immediate application, itmay have positive long-term spillovers for the institution and for the economy as a whole. In thecontext of central banking, basic research is motivated by a desire to increase understanding of thefundamental principles grounding the institution. Such research can try to understand and review,for example, the central bank’s role in society, its contribution to public welfare, its aim and impact,or the functioning of the whole economy, including financial institutions and financial markets.Applied research, on the other hand, is usually designed to answer a specific research questionaimed at an immediate application. This can include, for example, assessing the transmission of aparticular monetary, macroprudential or supervisory policy instrument, or developing and refininga particular methodology, model or indicator. One type of research cannot (or should not) livewithout the other. Basic research provides fundamental knowledge that applied research can buildupon. Likewise, basic research benefits from specific improvements and new fundamental questionsgenerated by applied research.
Research in central banks usually stands somewhere between basic and applied research.Policymakers appreciate frontier thinking but are generally more interested in research thataddresses practical issues faced by the central bank. This is where the two types of research mayclash. With basic research, value added is mainly assessed by some form of publication metric,such as the impact factor of the journal publication. However, applied research tends to addressaspects of less interest to journal editors and may not even be meant for journal publication in thefirst place. This is apparent from Figure 1, which shows that the average share of central banks’research papers published in scientific journals is close to 40% and rising only slightly over time(see Figure 1, panel A).11 On top of that, the heterogeneity among central banks is quitepronounced (see Figure 1, panel B). Assessing the merits of applied research is thus much moredifficult (Caballero et al., 2012). One cannot simply apply academic criteria to central bankresearch publications. Many central banks use their own publication series to exchange ideas about
9 Meyer et al. (2008) in their report noted that “the Committee [the External Review Committee of economicresearch activities at the Bank of Canada] discovered that the term ’research’ has a very wide range of meaningsfor many senior managers as well as staff economists at the Bank”.10 By high demands on resources we mean especially human resources. Research is time demanding and requireshigh expertise, which may eventually translate into high financial costs per project.11 The noticeable decline in working papers published in journals since 2014 is due to publishing delays (Björkand Solomon, 2013).

Researching the Research: A Central Banking Edition 7
bank-specific topics with other central banks and regulatory institutions, academia or the widereconomic community. Central banks’ paper series might be technical and also theoretical innature, but, in essence, they form an easily accessible knowledge base. In this regard, researchpublications help to increase central banks’ transparency. They can also serve as a strongconceptual and empirical basis for conducting monetary policy and maintaining price and financialstability. Mudge and Vauchez (2016) consider this approach to be one of the building blocks of theEuropean Central Bank.
Figure 1: Share of Central Banks’ Research Papers Published in Scientific Journals
(A) Overall View
2000 2003 2006 2009 2012 2015 2018
0%
20%
40%
60%
80%
100%
0
250
500
750
1,000
1,250
1,500
−−−
Total no. of papers
No. of published papers
Share of published papers (rhs)
(B) Share of Published Papers Regionally
0%
20%
40%
60%
80%
100%
EA
ori
g.
W &
NW
E
E &
SE
E,
BC
US
EC
B &
BIS
Note: Panel A: The total number of research papers published by the 50 central banks in their own publicationseries between 2000 and 2019 is 21,908; the total number of central banks’ research papers published in scientificjournals is 7,455. Panel B: Each point of the distribution refers to the share of central banks’ research paperspublished in scientific journals in the given year between 2000 and 2019. In four instances the share is 100%, withthe number of working papers produced being only one or two in a given year and for a given central bank.Source: IDEAS/RePEc Data Set
In-house research in central banks has value added along multiple dimensions. First, thereare the direct benefits. Research can aid policymakers in dealing with current policy issues, suchas determining the driving factors of current phenomena, analysing the impact of measures takenand quantifying the implications of alternative policy choices. Under the same category, researchis well suited to deal with future policy issues as well. Second, there are plenty of indirect, oftenoverlooked, benefits (see the next paragraph).
Research in central banks is important for spreading knowledge both inside and outside theinstitution. High-quality research publications can enhance a central bank’s reputation and increaseits credibility and make it easier to defend policy actions both publicly and privately (Issing, 2005;Dincer and Eichengreen, 2007; Blinder et al., 2008). A modern central bank strives to be predictableto the market most of the time and extensively communicates its decisions to the public. Moreover,having high-quality research is self-enforcing, as the central bank has a greater chance of attracting(and keeping) high-quality economists. These benefits are important to maintain, even at the costof letting some research time be spent on topics outside the central bank’s mandate, i.e. the centralbank can deploy some of its research capacity for the public good.

8 Simona Malovaná, Martin Hodula, and Zuzana Rakovská
Figure 2: Overall Research Scores of Central Banks – US and Europe
Note: The information was collected manually using the central banks’ websites and social media accounts. Thedetailed data behind the scores can be found in Tables A1 and A2. The choropleth maps do not reflect the scoresfor the Federal Reserve Board (FRB), the European Central Bank (ECB, including the ESRB) and the Bank forInternational Settlements (BIS).Source: Research Score Data Set
There is a high-degree of heterogeneity as to the amount of research activities carried on byindividual central banks. The research activities performed by central banks are not limited topublications only. Figure 2 depicts the degree of engagement in various research activities,summarized in the Overall Research Score, for all the national central banks in our sample (seeSection 2). The maximum score is 17 (Bank of England) and the minimum is 2 (the central banksof Romania and the Republic of Moldova). The difference is especially pronounced betweencentral banks in Eastern and Western Europe, with a higher Overall Research Score achieved in theWest (see Figure 2). Nevertheless, there are three exceptions – the Czech National Bank, theCentral Bank of Hungary and the Bank of Lithuania, which all exhibit an above-average OverallResearch Score.12 Even though each of these three central banks achieves its high score bydifferent means (i.e. by engaging in a different set of research activities), all of them are catchingup quite well with the well-established and more research-oriented central banks in Europe.Unsurprisingly, all the US Federal Reserve Banks achieve a high Overall Research Score ofbetween 12.5 and 16.75, reflecting the high importance assigned to research in the system. Allthese institutions are recognized for their intense investment in scientific prestige and scholarlyresearch.
The Overall Research Score consists of three sub-indices - a Research Organization Score, aResearch Publication Score and a Research Popularization Score. Each of the followingsubsections focuses on one area (for more details on the sub-indices, see Appendix A).
12 For more details on the Czech National Bank’s research model, see Malovaná (2020).

Researching the Research: A Central Banking Edition 9
3.1 Research Organization in Central Banks
The vast majority of the central banks in our sample have a separate research department.13
Most of these departments (divisions, units) fall under the area of monetary policy, forecasting orgeneral economic analysis. Even though the majority of the central banks in our sample (28 outof 55) have a legal mandate to maintain financial stability, only a few of them have reflected thisin the organizational structure of their research activities. Only eight central banks have their ownfinancial research department – three among the US Federal Reserve banks, four among the centralbanks of the E & SEE, BC region, and the ECB.
Some central banks have affiliated research institutes, which usually focus on a specialeconomic topic. The purpose of such affiliated institutes is to conduct high-quality research and toact as a centre of excellence for the selected area. An example of such an institute in Europe is theBank of Finland Institute for Economies in Transition, which specializes in research of economiesin transition. In the US, there is, for example, the Consumer Finance Institute at the FederalReserve Bank of Philadelphia, which has expertise in the consumer credit and payments markets.The activities of affiliated centres are usually performed by researchers drawn from across thecentral bank, but there are also some institutes formed of employees from academia only (theEinaudi Institute for Economics and Finance created by the Bank of Italy) and institutes with amixture of the two (the Center for Excellence in Finance and Economic Research at the Bank ofLithuania).
3.2 Publication Activities of Central Banks
Central banks publish their research outcomes in various publication series. The mostprevalent form of research publication series are working paper series (28 out of 40 central banksin Europe and all 12 Federal Reserve Banks), discussion paper series (eight central banks inEurope) and occasional paper series (five central banks in Europe). In addition, many central banksalso use more specific series, such as technical publications (Research Technical Papers – CentralBank of Ireland), policy-related publications (Research and Policy Notes – Czech National Bank)or finance-related publications (Financial Stability Papers – Bank of England; Banking andFinancial Studies – Deutsche Bundesbank). An overview of central banks’ publication series canbe found in Tables A4 and A5 in Appendix A.
The existence of an in-house research publication series is an important determinant of a well-established scientific institution; however, there are also other aspects to be considered. TheResearch Publication Score summarizes information not only on the existence of such a series, butalso on open-source research data and the presentation of central banks’ publication activity via itsown website and via IDEAS/RePEc. A number of central banks publicly share their research data,14
which then creates a positive externality, as it allows other researchers to replicate the results or tofollow up on that research. Nevertheless, these activities are dominated by the US Federal ReserveBanks (11 out of 12), while there are only five central banks in Europe that share their researchdata publicly.15 Next, a number of central banks promote successful placement of their papers in
13 There are six central banks for which we report no research unit, five of them located in the E & SEE, BCregion (Bosnia and Herzegovina, Croatia, Republic of Kosovo, Romania and Ukraine) and one, the Central Bankof Iceland, in the W & NWE region (see Tables A1 and A3 for more details).14 We consider here only research data that can be shared publicly. Naturally, some data used in central bankpublications cannot be publicly shared due to confidentiality reasons.15 Denmark, Germany, Lithuania, the Netherlands and the United Kingdom (see Tables A1 and A3 for moredetails).

10 Simona Malovaná, Martin Hodula, and Zuzana Rakovská
peer-reviewed journals on their websites. This tendency, however, is recognized mainly across theUS Federal Reserve Banks, while central banks in Europe seem to lag behind.16
3.3 Research Popularization in Central Banks
Central banks are dedicating more and more resources to communicating and enhancing thevisibility of their research. Popularization is an important part of overall research activities, asit connects the central bank and its researchers to the wider economic community. There are anumber of ways of increasing the visibility of research outcomes; we have identified three sets ofsuch activities within central banks: (1) use of social media, (2) a separate website dedicated toresearch, and (3) additional forms of presentation or communication, such as blogs, newsletters andbulletins.
First, central banks are becoming more active on social media. Almost all central banks inEurope (except for the Central Bank of Montenegro) and all the US Federal Reserve Banks use atleast one social media platform as a modern channel of communication. The most frequently usedsocial media among central banks are Twitter and LinkedIn. The majority of these central bankseven have their own YouTube channel. Many of these central banks use social media for researchpopularization. This trend is more common and more frequent among the US Federal ReserveBanks and larger central banks in Europe with a well-established research tradition. Moreover, fourUS Federal Reserve Banks (New York, Philadelphia, Richmond and Cleveland) and two nationalcentral banks in Europe (the Bank of England and the Bank of Finland) have established a separateTwitter account exclusively for posts about research work. Central banks in the E & SEE, BCregion lag behind, as only 22% of them use social media for research purposes (see Figure B2 inAppendix B).
Second, central banks are leveraging the potential of their own websites to increase thevisibility of their in-house research. The majority of central banks in Europe (80%), all the USFederal Reserve Banks, the ECB and the BIS have a separate website dedicated to researchactivities.17 They use this website to highlight research topics prioritized by the central bank (morethan 50% of the central banks in our sample),18 to promote research events such as conferencesand workshops (94%), to offer some form of fellowship or traineeship (60%) and to communicateopportunities for external collaboration (64%). Central banks are less active when it comes to theorganization of research competitions and awards (20%, mostly from the E & SEE, BC region) andcalls for projects (14%). Central banks also promote these activities via social media orconventional media. Another way to increase the visibility of research is via individualresearchers’ profiles, which provide a more personalized view. Central banks may use this tool toboost the scientific prestige of their research staff. All the US Federal Reserve Banks and themajority of central banks in Western Europe (including the ECB and the BIS) promote theirresearchers on their websites. However, less than one third of central banks in the E & SEE, BCregion follow this practice.
Third, some central banks are exploiting the potential of additional forms of presentation andcommunication, such as research blogs, bulletins and newsletters. These types of presentation
16 Even though almost all the central banks in our sample successfully placed at least one research paper in ascientific journal, only 30% of central banks in Europe report that on their websites.17 Seven banks in the E & SEE, BC region and one central bank in the EA orig. region have no research website(see Tables A1 and A3 for more details).18 More than 67% of central banks in Europe engage in such activity, while only 42% of the US Federal ReserveBanks do so.

Researching the Research: A Central Banking Edition 11
rarely offer new information, but they do summarize existing research outcomes and activities in amore “digestible” (i.e. shorter, simpler and non-technical) form. The use of these additional formsof presentation and communication of research outcomes is concentrated in the US and WesternEurope. Only about one third of central banks in the E & SEE, BC region use one or more of them.Research newsletters are the most common among these three (employed by 55% of central banksin our sample). However, they take the form usually of a simple e-mail notification about websiteupdates (67%) and less frequently of an original document (23% are e-mail campaigns; 10% arenew research publications). Research blogs and research bulletins are less common. Only aboutone third of central banks in the US and Western Europe use research blogs, and about one quarterof these central banks publish research bulletins.
4. Research in Central Banks: Some Stylized Facts
There is a significant heterogeneity in research publication activity among central banks fromdifferent regions. Table 2 presents basic summary statistics for the IDEAS/RePEc Data Set usedin the rest of this section (for more details on the data set, see Section 2). The US Federal ReserveBanks, including the FRB, achieve the highest figures in most categories, reflecting the importantrole of research in the US system. The share of research papers published by the US Federal ReserveBanks and the FRB in scientific journals between 2000 and 2019 is more than 40%. Central banksin the original EA member states and supranational institutions (the BIS and the ECB, including theESRB) have shares about 10 pp lower. The US Federal Reserve Banks and the FRB also have thehighest number of publications per author, reflecting higher productivity and/or an opportunity todevote more time to research. Fairly similar “productivity” can be observed in the BIS and the ECB.The US Federal Reserve Banks and the FRB show a relatively high share of authors with multipleaffiliations, which translates to stronger collaboration networks (see Subsection 4.2) with positivesynergies for the quantity and quality of research outcomes. However, the male-to-female authorsratio is the second worst among the regions, with 3.4 times more male than female authors (see alsoSubsection 4.3). Interestingly, central banks from the W & NWE and E & SEE, BC regions showthe highest heterogeneity in most categories, as is apparent from high standard deviations.

12 Simona Malovaná, Martin Hodula, and Zuzana Rakovská
Table 2: Summary Statistics – IDEAS/RePEc Data Set
EA orig. W &NWE
E & SEE,BC
USA ECB &BIS
Total
No. of CB research papers 6,692 1,880 1,982 8,161 3,193 21,908No. of journal publications 2,147 520 399 3,252 1,137 7,455No. of authors 4,741 1,512 1,577 4,069 1,433 13,332
of which:Female authors 1,201 316 429 867 307 3,120Male authors 2,586 936 724 2,653 894 7,793Registered in IDEAS/RePEc 2,253 799 713 2,206 621 6,592
of which:- with multiple affiliations 620 155 184 514 158 1,631- with affiliation to CB 1,008 471 371 727 276 2,853- with affiliation to CB and
197 76 112 187 34 606at least one other affiliation
Mean and standard deviationShare of CB research papers 32.8 27.4 15 40.4 30.8 27.7published in journals (6.5) (14.3) (9.2) (7.5) (7.1) (13.4)Publications per author 1.6 1.4 1.3 2.2 1.9 1.6
(0.5) (0.3) (0.3) (0.4) (0.6) (0.5)Male-to-female authors ratio 2.5 3.3 2.1 3.4 3.5 2.7
(0.8) (1.0) (2.3) (0.6) (1.0) (1.6)Share of authors registered 48.5 55.6 37.6 58.4 43.3 51.6in IDEAS/RePEc (7.6) (24.4) (22.9) (9.5) (3.4) (20.2)
of which:- with multiple affiliations 14.3 10 8.9 14.4 11.1 11.9
(3.9) (3.4) (6.3) (4.6) (0.2) (5.5)- with affiliation to CB 21.5 34.1 23.1 18.2 13.3 26
(7.5) (25.8) (17.2) (2.6) (10) (20.3)- with affiliation to CB and 4.9 4.1 6.8 5.5 1.8 5.6
at least one other affiliation (2.7) (1.5) (5.5) (3.4) (1.2) (4.2)
Note: The data are subject to completeness and quality of reporting by central banks, journals and authorsthemselves. They cover the 2000–2019 period. Standard deviations in brackets. CB – central bank, EA orig.– Euro Area original members, W & NWE – Western and Northwestern Europe, E, SEE & BC – Eastern andSoutheastern Europe, and Baltic Countries. For more details on the composition of each geographical region, seeTable 1; for more details on the data themselves, see Section 2.Source: IDEAS/RePEc Data Set
4.1 Topics Researched in Central Banks
In terms of JEL codes, the broad research areas selected by central banks are fairly stableover time, reflecting central banks’ core activities. Unsurprisingly, more than half of theresearch falls into two categories – E: Macroeconomics and Monetary Economics andG: Financial Economics (see Figure 3, panel A).19 This reflects the two main objectives – pricestability and financial stability – and the two main sets of instruments – monetary policy andprudential policy – usually assigned to central banks. Even though some central banks may not bedirectly assigned the goal of financial stability, they have to be interested in the pursuit of this goal,because any disruption to financial institutions and financial markets has a direct impact on themonetary policy transmission mechanism (Smets, 2014). The third most common area of researchaccording to JEL codes is C: Mathematical and Quantitative Methods. This reflects the strongrigorous basis of the policy decision-making process in central banks, and consequently the needfor quantitative research inputs into the policy discussion. A more detailed breakdown of JEL19 In contrast, Essers et al. (2020) report that almost half of all the IMF Working Papers published in the period1990–2017 address research topics connected to E: Macroeconomics and Monetary Economics or F: InternationalEconomics.

Researching the Research: A Central Banking Edition 13
categories shows that the main focus of central banks’ research is indeed on financial institutionsand financial markets, monetary policy, prices and business cycle fluctuations, and money, creditand interest rates (see Figure 3, panel B).
Figure 3: JEL Code Analysis
(A) All JEL Codes
0%
20%
40%
60%
80%
100%
2000 2003 2006 2009 2012 2015 2018
E
G
C
F
D
other
(B) JEL Codes C–G
0%
20%
40%
60%
80%
100%
2000 2003 2006 2009 2012 2015 2018
G2
E5
E3
E4
G1
other C−G
Note: The figure depicts the percentage of publications with a particular JEL code assigned. E: Macroeconomicsand Monetary Economics, G: Financial Economics, C: Mathematical and Quantitative Methods, F: InternationalEconomics, D: Microeconomics; G2: Financial Institutions and Services, E5: Monetary Policy, Central Banking,and the Supply of Money and Credit, E3: Prices, Business Fluctuations, and Cycles, E4: Money and Interest Rates,G1: General Financial Markets.Source: IDEAS/RePEc Data Set
Following the GFC, financial stability has emerged as the leading research topic. A simpleword cloud of keywords and words in abstracts shows that central banks’ research agenda beforethe GFC focused mostly on monetary policy issues and macroeconomic topics in general, such asinflation targeting, exchange rate dynamics, convergence and unemployment (see Figure 4, upperblue part). Following the outbreak of the GFC in 2008, the topics visibly changed in favour ofthe macro-finance area (see Figure 4, lower red part). The leading research agenda after the GFCis related to financial stability policy conduct, with numerous papers analysing the role of creditdynamics and performing financial risk assessments.
Looking at the dynamics of the five most common keywords, we spot some long-term trendsreflecting economic developments and policy challenges (see Figure 5). First, the keywordsnicely mirror changes in policy mandates. That is obvious from the increasing dominance of thekeywords “financial”, “credit” and “bank”. These keywords reflect the rising interest of centralbanks in research topics related to the conduct of financial stability policies. There is an apparentstructural break that occurred somewhere around the outbreak of the GFC in 2008. This is whenthe relative share of financial issues overtook that of monetary issues. Second, we document arather stable role of inflation-related topics in relative terms. The absolute number of the keyword“inflation” has been gradually rising since 2000, reflecting the fact that the majority of the centralbanks analysed operate in fully fledged inflation targeting regimes. Cumulatively, the first fivewords appear in 46% of all central banks’ research papers with reported keywords over the periodanalysed.

14 Simona Malovaná, Martin Hodula, and Zuzana Rakovská
Figure 4: Word Cloud Before and After the GFC
(A) Keywords
2000−2007
2008−2019
financia
l
monetaryexchange
cre
dit
inflation
crisis
finance
risk
econometric
policyeconomic
models
foreignrates
ratepri
ces
regulation
economics
theory
liquidity
stock
debtglobal
sovereign
macroprudential
price
bayesian
money
systemic
interest
business
rules
lending
household
shocks
default
dsge
housingsu
rvey
investments
model
lower
market
banks
mortgagefirm
cycles
bound
phillipseuro
labor
technolo
gy
curv
e
spill
ove
rs
frictions
stress
area
equilibrium
factor
pricing
states
constraints
transmission
zero
forecasting
pro
ductivity
wage
wages
rigidity
inequality
nominal
macroeconomics
premium
uncertainty
new
data
systems
cycleinterbank
heterogeneity
flows
house
great
var
firms
dynamic
open
stabilitybond
supply
term
tax
search
dynamics
fiscal
volatility
crises
central
integration
estimation
federal
income
capital
choice
employment
investment
portfolio
contagion
effects
expectations
forecasts
lab
ou
rvalue
growth
currency
loans
cost
competition
lea
rnin
g
public
real
securities
developmentconsumer
asset
output
forecast
equity
european
taxation
mo
rtg
ag
es
wealth
co
sts
analysis
payment
mark
ets
international
system
reserve
corporate
pan
el
trade
unemployment
funds
time
stochastic
optimal
emerging
structure
government
structural
information
distribution
institutions
change
regression
channel
demand
small
banking
management
economies
bank
bonds
vector
economy
union
balanceeffic
iency
macroeconomicconsumption
insurance
adju
stm
ent
(B) Abstracts
2000−2007
2008−2019
financialcrisis
inflation
credit
rate
exchange
banks
global
monetary
risk
pricemodel
output
debt
money
equilibrium
impact
mo
de
ls
firms
stock
liquidity
lending
pricesem
pir
ical
rate
s
shocks
interest
found
housing
optimal
show
policy
real
nominal
loans
may
negative
used
evid
ence
lower
changes
find
growth
households
higher
effects
changereturns
activityhousehold
volatility
degree
two
shock
domestic
us
investment
bank
econom
y
study
one
increase
differences
supply
government
policies
defa
ult
survey
can
balance
whether
sector
banking
effect
estimates
euro
rela
tive
measures
cost
macroeconomic
currency
result
loan
across
international
costs
estimated
bond
information
gdp
economic
un
ce
rta
inty
low
general
structure
particular
howeverstate
time
resu
lts
trade
area
large
income
productivity
using
conditions
assets
current
u.s
high
foreign
lab
or
studies
firm
public
bu
sin
ess
less
future
als
o
centralanalysis
consistent
share
findings
ma
rke
ts
welfare
sta
nd
ard
small
implications
states
key
use
local positive
variables
asset
system
economies
factors
increases
dynamic
characteristics
fiscal
new
increased
significantly
capital
second
countries
suggests
level
well
among
individual
str
uctu
ral
provides
wage
dis
trib
utio
n
market
literature
tax
average
resp
on
se
associated
period
since
expectations
siz
e
main
relationship
percent
provide
likely
aggregate
forecasts
labour
number
panel
country
framework
first
with
in
terms
dynamics
potential
european
approach
important
evenyears
performance
factor
different
role
estim
ate
suggest
based
employmentrecent
significant
accountthree
examine
private
stability
value
sample
equity
due
data
unemployment
measure
cycle
demand
consumption
set
Note: Only keywords (the most frequent words in abstracts) with a minimum count of 150 (1,500) are included.The upper (blue) part of the clouds reflects the period 2000–2007, while the lower (red) part refers to the period2008–2019. We report word clouds based on both keywords and abstracts because about 17% of the publicationsin our sample do not report keywords, while more than 99% report abstracts.Source: IDEAS/RePEc Data Set
Figure 5: The Five Most Common Keywords in Central Banks’ Research Papers
(A) Absolute Amount
0
50
100
150
200
2000 2003 2006 2009 2012 2015 2018
−−
financial
monetary
−−
bank
credit − inflation
(B) Relative Share of Each Keyword in Total No.of Research Papers
0%
5%
10%
15%
20%
25%
2000 2003 2006 2009 2012 2015 2018
−−
financial
monetary
−−
bank
credit − inflation
Note: Panel A: Based on 18,256 research papers with keywords published by all European, US and supranationalcentral banks as indicated in Section 2 in the period 2000–2019. Panel B: The relative share is calculated as theratio of the frequency of each keyword to the total number of research papers with reported keywords in everygiven year.Source: IDEAS/RePEc Data Set

Researching the Research: A Central Banking Edition 15
4.2 Authorship Networks
Research in central banks is heading towards a more collaborative environment. We followAdams (2012) and consider authorship as a proxy for research collaboration. While the number ofpublications per author per central bank is decreasing steadily over time (see Figure 6, panel A),the number of authors per publication is increasing (see Figure 6, panel B). What is most strikingis the drop in the share of publications with a single author from 40% in 2000 to less than 20%in 2019. The share of publications with exactly three authors, on the other hand, has more thandoubled in the last two decades, reaching 30% in 2019. It is also becoming increasingly common tohave publications with four and five or more authors. This is consistent with the general tendencyin economic research identified by numerous studies over the last couple of years (see, for example,Card and DellaVigna, 2013; Hamermesh, 2013; Kuld and O’Hagan, 2018; Essers et al., 2020).20
The rising number of collaborators is generating positive knowledge spillovers not only to the directcollaborative partners (Azoulay et al., 2010; Borjas and Doran, 2015), but also indirectly to otherresearchers who are connected to them within a complex network (Hsieh et al., 2018). Among otherthings, there is compelling evidence that teaming up is good for individual productivity (Ductoret al., 2014; Ductor, 2015).
Figure 6: Collaboration Between Researchers
(A) No. of Papers per Author per CB
0.0
0.2
0.4
0.6
0.8
1.0
0.0
0.6
1.2
1.8
2.4
3.0
2000 2003 2006 2009 2012 2015 2018
Min−Max
25−75%
−−
Mean
Top 20% authors (rhs)
(B) No. of Authors per Paper(Share of Total)
0%
10%
20%
30%
40%
50%
2000 2003 2006 2009 2012 2015 2018
−−
1
2
−−
3
4
−−
5+ authors
Note: Panel A: Calculated as the number of research publications published by the central bank in the given yeardivided by the number of authors participating in the research publications in the given year. Panel B: Calculatedas the number of publications with the given number of authors in the given year divided by the total number ofpublications in the given year.Source: IDEAS/RePEc Data Set
20 Using article information from the top five and top three economic journals respectively, Card and DellaVigna(2013) and Hamermesh (2013) show that the distribution of the number of authors has shifted steadily rightward.Specifically, Card and DellaVigna (2013) report that the number of authors per paper increased from 1.3 in 1970 to2.3 in 2012. This is confirmed by Kuld and O’Hagan (2018) on a large sample of the top 255 economic journals.They show that the share of multi-authored papers increased from 50% in 1996 to over 75% in 2014. Similarly, bystudying the history of IMF Working Papers, Essers et al. (2020) found that both the number of authors publishingwithin the IMF and the number of publications issued in the IMF has increased over the last few decades, with theformer having the faster pace.

16 Simona Malovaná, Martin Hodula, and Zuzana Rakovská
The closer collaboration among researchers reflects more intensive cooperation both insideand outside the network of central banks. The increasing number of authors per central bankpublication is due to a larger number of researchers affiliated with a central bank and also to a largernumber of those affiliated with an institution other than a central bank (see Figure 7, panel A).The number of researchers in both groups was growing at a similar pace until the GFC; after that,researchers affiliated to the central bank took the lead.21 This may reflect a combination of factors– for example, greater cooperation between central banks (see below) stemming from a need toshare very specific knowledge and data, or more resources devoted to research by individual centralbanks.
Although the number of authors involved in central bank research is growing steadily, theimportance of a relatively small number of top researchers remains high. In other words, arelatively small proportion of authors contribute to a relatively large proportion of central banks’publications (see Figure 7, panel B). Specifically, the top 10% of authors contributed to about 50%of all central banks’ research publications in our sample. Quantity, however, does not necessarilyreflect quality (see Section 4.4).
Figure 7: Authors’ Affiliation and the Role of Leading Researchers
(A) Authors Based on Their First Affiliation
0
200
400
600
800
1,000
2000 2003 2006 2009 2012 2015 2018
− −No. of CB’s authors No. of other authors
(B) Importance of Leading Researchers
Share of researchers
Share
of public
ations
0%
20%
40%
60%
80%
100%
0% 20% 40% 60% 80% 100%
− −All publications Journal publications
Note: Panel A: The absolute number of authors affiliated either to the central bank or to some other institution(based on the first reported affiliation if there are multiple ones). Panel B: The percentage share of individualauthors (researchers) in the total number of authors in our sample in relation to the percentage share of publicationsauthored by these researchers in the total number of publications in our sample.Source: IDEAS/RePEc Data Set
Central banks form enormous research networks. We study the collaboration networks at thelevel of individual institutions. We calculate the bilateral connections between central banks andother institutions based on papers using the IDEAS/RePEc Data Set (see Section 2). Each edge inour network represents a collaborative connection between authors based on their reportedaffiliation and the central bank in which the research paper was published. The former is either the
21 Note that the authors’ affiliation was harvested from the IDEAS/RePEc database (see Section 2). As such, itrepresents the self-reported affiliation at the time the data were collected and does not represent a record of theauthor’s historical affiliations.

Researching the Research: A Central Banking Edition 17
reported affiliation from IDEAS/RePEc (95.8%) or the affiliation extracted manually from theresearch papers (4.2%; see the column Data Source in Table A4). The nodes are individualinstitutions. The edge width reflects the total number of these collaborative connections in a givenperiod. As such, the width of the edges does not reflect the total number of research papersbetween the two central banks but rather the total number of collaboration relationships. For thepurposes of our analysis, we use a five-year window scheme, which allows us to avoid exceptionalcases in the evolution of the network. The evolution of the network is captured by comparing thechanges in the network between four non-overlapping periods, 2000–2004, 2005–2009,2010–2014 and 2015–2019. To make the network more visually tractable, we divide the resultinganalysis into three parts. First, we take a closer look at the collaboration networks formed bycentral banks in the European region. Second, we focus on the Federal Reserve System in the US.Third, we analyse the cooperation networks that are formed by central banks with institutions otherthan central banks (e.g. universities, research institutes and international organizations).
Research collaboration between national central banks in Europe has grown considerablyover time.22 There is a distinct difference in the density of the collaboration network between thefirst and the second decade analysed (see Figure 8). Over the first five-year period (2000–2004),just eight central banks accounted for 80% of all publications, of which only three central banks– the Bank of England, Deutsche Bundesbank and Banco de Espana – accounted for 50% of allpublications. During the subsequent five-year period (2005–2009), the cooperation between theseinstitutions intensified, while some formerly isolated central banks joined the research network. Thecentral banks that increased their collaboration with the leading research cluster the most were fromCentral Europe (Poland and the Czech Republic) and the Baltic region (Estonia and Lithuania).
The density of the research collaboration network increased significantly in the yearsfollowing the GFC (see Figure 8). This may have been due to several factors combined. First, itmay have been the outcome of an increase in knowledge integration, especially in the new EUmember states that joined the EU in 2004, 2007 and 2013. Second, the European System ofCentral Banks (ESCB) encompasses many research networks and working groups that are meant tostimulate interaction between researchers and promote information exchange. The ECB is usuallythe leading and coordinating institution. Past and present examples of such platforms include theHousehold Finance and Consumption Research Network (HFCN), the Euro Area Business CycleNetwork (EABCN), the Wage Dynamics Network (WDN) and the Macroprudential ResearchNetwork (MaRs).23 Third, the GFC, among other things, revealed a dark side of highly connectedfinancial markets (Stiglitz, 2010; Haldane and May, 2011; Acemoglu et al., 2015; Acharya et al.,2017). The fact that dense interconnection serves as a mechanism for the propagation of shocks isnow widely acknowledged. As a result, researchers in central banks have begun to form moreintense scientific networks, which has led to shared knowledge, data points and even wholedatabases. This has been reflected in an increased number of publications.
22 We only consider publications issued by national central banks, not those published by the ECB or the BIS.These two supranational institutions are analysed separately (see Figure B3).23 See Research networks on the ECB’s website.

18 Simona Malovaná, Martin Hodula, and Zuzana Rakovská
Figure 8: Collaboration Networks Between Central Banks – Europe
Note: Each edge between two central banks (nodes) represents authors affiliated to one of the two central bankswhose paper was published in the other central bank. The width of the edge reflects the total number of suchauthors. As such, the width of the edges does not reflect the total number of research papers between the twocentral banks but rather the total number of collaboration relationships. Central banks shown in red account for80% of publications (dark red for 50% and light red for the additional 30%).BoE: Bank of England, CNB: Ceská Národní Banka, BdI: Banca d’Italia, BdE: Banco de Espana, BdF: Banquede France, SR: Sveriges Riksbank, NB: Norges Bank, SP: Suomen Pankki, BdP: Banco de Portugal, CBoI:Central Bank of Ireland, ON: Oesterreichische Nationalbank, DNB: de Nederlandsche Bank, SN: SchweizerischeNationalbank, DB: Deutsche Bundesbank, LiB: Lietuvos Bankas, LaB: Latvijas Banka, EP: Eesti Pank, NBP:Narodowy Bank Polski, NBS: Národná Banka Slovenska, MNB: Magyar Nemzeti Bank, BoG: Bank of Greece,CBoC: Central Bank of Cyprus, CBCG: Centralna Banka Crne Gore, NBoU: National Bank of Ukraine, NBS:Narodna Banka Srbije, NBnRSM: Narodna Banka na Republika Severna Makedonija, SI: Sedlabanki ÍslandsSource: IDEAS/RePEc Data Set

Researching the Research: A Central Banking Edition 19
The US Federal Reserve System is a complex collaborative network of individual reservebanks, with a few leading the research activities. The density of the research collaborationnetwork has remained very high throughout the two decades (see Figure 9). There is no significantdifference between the first and the second decade like that seen in Europe. The US network ismuch richer and more evenly distributed than the European network. In the US, we do not identifyany “lost sheep”, as all of the individual Federal Reserve Banks and the FRB have establishedstrong collaborations with the rest. In terms of the authorship counts, we can identify a cluster offour US central banks that can be (historically) considered the leading ones, accounting jointly for50% of the total publications. These are the Federal Reserve Bank of San Francisco, the FederalReserve Bank of Chicago, the Federal Reserve Bank of New York and the Federal Reserve Board.
The ECB quickly established itself as a leading research institution in Europe.24 The FRB, asa leading research institution, served as a model when the DG Research (a separate research unit)was formed in the ECB (Mudge and Vauchez, 2016). Therefore, the ECB quickly established avery strong scholarly profile, in line with its aim to be a research-oriented central bank. The ECBhas maintained a fruitful research collaboration with the EA national central banks over the twodecades, while its collaboration with central banks outside the EA has intensified only graduallyover time (see Figure B3). While at its origin, the ECB primarily recruited its researchers from theUS job market, nowadays the team at the DG Research is mainly Europe-centric and researchersare often recruited from the national central banks of the ESCB.
The US Federal Reserve Banks and the central banks in Europe maintain fruitfulcollaborations with academia and research institutions. The research collaboration betweencentral banks and other institutions (e.g. universities, research institutes and internationalorganizations) has increased over the last two decades (see Figure 10). Most of this researchcollaboration is region-specific, meaning that central banks usually collaborate with institutions intheir own countries or regions (such as national universities). A relatively small set of institutionscollaborate with central banks in all four regions (in dark blue) or in three out of the four regions(in light blue). The institutions with the most authored publications with central banks arerenowned research institutes and universities (see Figure 11). In the US, these are the NationalBureau of Economic Research (NBER), the Institute of Labor Economics (ILE), the Centre forEconomic Policy Research (CEPR) and the University of Pennsylvania (Penn). Another of themost active research collaborators with the US Federal Reserve Banks is the InternationalMonetary Fund (IMF). Other academic collaborators hail mostly from US universities.Surprisingly, there are also some important links to universities outside the US, namely theUniversita Commerciale Luigi Bocconi and the National University of Singapore. In Europe, mostauthorship relations are found for the CEPR, while the rest are top-shelf European universities.The CEPR is also the single most important collaborator for all four regions considered.
As pointed out by Claveau and Dion (2018), the relationship between researchers from centralbanks and those from other research institutions can be considered a two-way stream. On the onehand, central banks actively invite other researchers to collaborate on policy-related topics, whichmay be pursued either via various visiting research programmes or by direct cooperation with theseinstitutions. On the other hand, researchers in central banks are entitled to spend some time on basicresearch in addition to applied (policy-oriented) research. This allows them to collaborate on topicswhich may be of greater interest to academics.
24 We analyse the ECB separately from the European national central banks due to its supranational character. TheECB is also a relatively young institution, at least when compared to some of its centuries-old national counterparts.The ECB was founded on 1 June 1998 alongside the European System of Central Banks (ESCB).

20 Simona Malovaná, Martin Hodula, and Zuzana Rakovská
Figure 9: Collaboration Networks Between Central Banks – United States
Note: Each edge between two central banks (nodes) represents authors affiliated to one of the two central bankswhose paper was published in the other central bank. The width of the edge reflects the total number of suchauthors. As such, the width of the edges does not reflect the total number of research papers between the twocentral banks but rather the total number of collaboration relationships. Central banks shown in red account for80% of publications (dark red for 50% and light red for the additional 30%).FRB: Federal Reserve Board (Board of Governors of the Federal Reserve System), FRBA: Federal Reserve Bankof Atlanta, FRBB: Federal Reserve Bank of Boston, FRBC: Federal Reserve Bank of Chicago, FRBC: FederalReserve Bank of Cleveland, FRBD: Federal Reserve Bank of Dallas, FRBKC: Federal Reserve Bank of KansasCity, FRBM: Federal Reserve Bank of Minneapolis, FRBNY: Federal Reserve Bank of New York, FRBP: FederalReserve Bank of Philadelphia, FRBR: Federal Reserve Bank of Richmond, FRBSF: Federal Reserve Bank of SanFrancisco, FRBSL: Federal Reserve Bank of St Louis.Source: IDEAS/RePEc Data Set

Researching the Research: A Central Banking Edition 21
Figure 10: Collaboration Networks Between Central Banks and Other Institutions
Note: Each grey node represents one institution other than the central bank to which the authors in our sample areaffiliated. Central banks are divided into four regions and represented by dark red nodes. Each edge representsauthors affiliated to an institution other than the central bank whose paper was published in the central bank inthe given region. The width of the edges does not give any information in this case. Central banks shown in redaccount for 80% of publications (dark red for 50% and light red for the additional 30%).Institutions with authored publications with central banks in all four regions are shown in dark blue; institutionswith authored publications with central banks in three out of the four regions are shown in light blue.Source: IDEAS/RePEc Data Set

22 Simona Malovaná, Martin Hodula, and Zuzana Rakovská
Figure 11: Institutions with Most Authorships with Central Banks (Top 1%)
Note: The top 1% of institutions based on the number of collaborations with central banks between 2000 and 2019.Each edge represents authors affiliated to an institution other than the central bank whose paper was published inthe central bank. The width of the edge reflects the total number of such authors. As such, the width of the edgesdoes not reflect the total number of research papers between the two but rather the total number of collaborationrelationships. Central banks are shown in blue. Institutions with more than 150 collaborations with central banksover the period 2000–2019 are shown in dark red.LU: Lindenwood University, NUS: National University of Singapore, JHU: Johns Hopkins University, WashU:Washington University in St. Louis, GSU: Georgia State University, NBER: National Bureau of EconomicResearch, ILE: Institute of Labor Economics, CEPR: Centre for Economic Policy Research, Penn: Universityof Pennsylvania, IMF: International Monetary Fund, GoUS: Government of the United States, UCLB: UniversitaCommerciale Luigi Bocconi, EmoryU: Emory University, UMN: University of Minnesota.UK: Univerzita Karlova v Praze, ESRI: Economic and Social Research Institute, CREST: Centre de Rechercheen Économie et Statistique, AMU: Aix-Marseille Université, ULis: Universidade de Lisboa, CEPR: Centrefor Economic Policy Research, UStra: Université de Strasbourg, LSE: London School of Economics, BIH: BIHandelshoyskolen, RG: Rijksuniversiteit Groningen, VU: Vrije Universiteit Amsterdam, FU: Fordham University,UPN: Université Paris-Nanterre, CEPII: Centre d’études prospectives et d’informations internationales, NOVA:Universidade Nova de Lisboa, UU: Universiteit Utrecht, ULB: Université Libre de Bruxelles, BGSE: BarcelonaGraduate School of Economics, PSE: Paris School of Economics, CFM: Centre for Macroeconomics, SGH: SzkołaGłówna Handlowa w Warszawie, KU: KU Leuven.Source: IDEAS/RePEc Data Set

Researching the Research: A Central Banking Edition 23
Looking at the authorship network connections from a different angle may give us anestimate of researchers’ mobility. As mentioned above, the networks presented are formed ofcollaborative connections between authors based on their affiliation and the central bank in whichthe research paper was published. Panel A in Table 3 provides a numerical representation of thesenetwork graphs. In particular, it reports the count of relationship pairs between authors based ontheir reported affiliations and the publishing central bank. If the author reports affiliations tomultiple institutions, a relationship pair is created for each institution–central bank pair. Incontrast, panel B in Table 3 employs an approach which disregards the information about thepublishing central bank and, as such, takes into account information about authors’ reportedaffiliations only. Under this approach, therefore, each relationship pair represents an institutionalconnection between individual authors.25
The affiliations reported in the IDEAS/RePEc Data Set usually reflect the current institutionalassignment of the authors, as they are directly from the authors’ profiles on the IDEAS/RePEcwebsite. However, the publication itself is historically linked to a given central bank. As such, theaffiliations recorded in this publication are fixed, regardless of the authors’ mobility acrossinstitutions. For most research papers, it can be expected that at least one of the authors wasaffiliated with the given central bank at the time of publication. Therefore, if the reportedaffiliations of all the authors differ from the publishing central bank, it is very likely that at leastone author has changed her affiliation since then. For this reason, comparing panel A and panel Bgives a rough estimate of researchers’ mobility between central banks and from central banks toother research institutions. Even though it is not possible to track each individual movement ofresearchers between central banks and to other research institutions, this comparison provides atleast a simplified view of this trend.
The distribution of collaborative connections calculated based on the two approaches differsbetween regions, indicating researchers’ mobility to the ECB, the BIS and academia. Takinginto account the publishing central bank (the first approach), the most network connections existbetween authors from the group of original Euro Area member states, followed by the ECB & BISand connections to other research institutions (see Table 3, panel A). These make up about 70%of all network connections.26 By the nature of the calculation, the second approach yields fewernetwork connections on aggregate than the first one (see the examples in footnote 25). However,we can see that the absolute number of connections has increased significantly for the ECB &BIS–ECB & BIS bucket, and also for some collaboration pairs with other research institutions (seeTable 3, panel B). This most likely reflects higher mobility to these institutions. In particular, theresult suggests that researchers tend to leave national central banks for supranational institutions and
25 To better understand the difference between the two representations of our authorship network, let’s assumethree basic examples. First, let’s assume that central bank X published a research paper authored by two researcherswho are both affiliated with the same central bank Y. In this case, panel A would show two network connectionsbetween X (the publishing central bank) and Y (the authors’ affiliation), while panel B would report only onenetwork connection between Y and Y, as both authors are affiliated with the same institution. Second, let’s assumethat central bank X published a research paper written by a single author with a reported affiliation to central bankY and another research institution Z. Panel A would report two network relationships – one between X and Y andthe other between X and Z. However, panel B would show only one relationship, between Y and Z. Third, let’sassume that central bank X published a research paper written by a single author with only one affiliation to thesame central bank, i.e. to X. Panel A would show one network connection, between X and X, while panel B wouldnot report any connection.26 27% for the EA orig.–EA orig. bucket, 12.1% for the ECB & BIS–ECB & BIS bucket, and 29.8% for allconnections with other research institutions.

24 Simona Malovaná, Martin Hodula, and Zuzana Rakovská
for research institutions other than central banks.27 Besides researchers’ mobility, the differencebetween the two approaches may also reflect researchers affiliated with the ECB & BIS or otherresearch institutions publishing their papers in national central banks without the collaboration ofresearchers from national central banks. However, we consider this highly unlikely or limited inscope.
Table 3: Number of Collaborations Among Central Banks and Between Central Banks and OtherResearch Institutions
(A) Based on Author’s Self-Reported Affiliation and Publishing Central Bank
EA orig. E & SEE,BC
W & NWE ECB & BIS US Otherinstitutions
EA orig. 22,133 1,819 956 5,555 3,813 7,175(27.0%) (2.3%) (1.2%) (6.8%) (4.7%) (8.8%)
E & SEE, BC 2,499 42 1,522 279 1,821(3.1%) (0.1%) (1.9%) (0.4%) (2.3%)
W & NWE 3,268 559 294 1957(0.7%) (0.4%) (2.4%)
ECB & BIS (4.0%) 9,869 595 3,728(12.1%) (0.8%) (4.6%)
US 4,537 9,576(5.6%) (11.7%)
(B) Based Purely on Author’s Self-Reported Affiliation
EA orig. E & SEE,BC
W & NWE ECB & BIS US Otherinstitutions
EA orig. 3,099 240 108 3,317 333 7,352(6.2%) (0.5%) (0.2%) (6.6%) (0.7%) (14.7%)
E & SEE, BC 762 22 483 26 1,899(1.5%) (0.0%) (1.0%) (0.1%) (3.8%)
W & NWE 533 339 140 1,807(1.1%) (0.7%) (0.3%) (3.6%)
ECB & BIS 12,806 531 5,123(25.5%) (1.1%) (10.2%)
US 2,916 8,307(5.8%) (16.6%)
Note: The percentage share in parentheses is calculated as the individual counts divided by the total number ofnetwork connections. Panel A: The counts represent network connections between the publishing central bankand the authors’ affiliations. Panel B: The counts represent network connections between the authors’ affiliationsregardless of the publishing central bank.
27 The mobility towards these institutions is also apparent from higher relative shares of network connections (thenumber in parentheses in Table 3). The relative share is significantly higher in panel B than in panel A in the ECB& BIS–ECB & BIS bucket and the ECB & BIS–EA orig. bucket, and for most connections with other researchinstitutions.
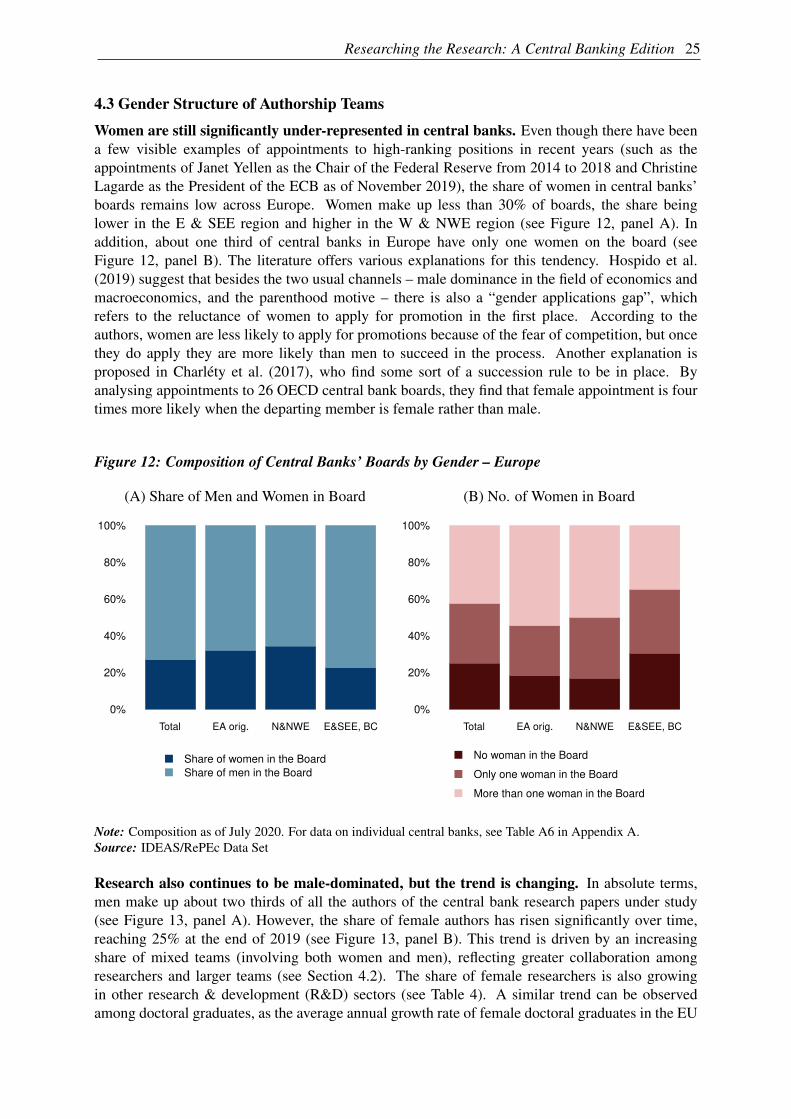
Researching the Research: A Central Banking Edition 25
4.3 Gender Structure of Authorship Teams
Women are still significantly under-represented in central banks. Even though there have beena few visible examples of appointments to high-ranking positions in recent years (such as theappointments of Janet Yellen as the Chair of the Federal Reserve from 2014 to 2018 and ChristineLagarde as the President of the ECB as of November 2019), the share of women in central banks’boards remains low across Europe. Women make up less than 30% of boards, the share beinglower in the E & SEE region and higher in the W & NWE region (see Figure 12, panel A). Inaddition, about one third of central banks in Europe have only one women on the board (seeFigure 12, panel B). The literature offers various explanations for this tendency. Hospido et al.(2019) suggest that besides the two usual channels – male dominance in the field of economics andmacroeconomics, and the parenthood motive – there is also a “gender applications gap”, whichrefers to the reluctance of women to apply for promotion in the first place. According to theauthors, women are less likely to apply for promotions because of the fear of competition, but oncethey do apply they are more likely than men to succeed in the process. Another explanation isproposed in Charléty et al. (2017), who find some sort of a succession rule to be in place. Byanalysing appointments to 26 OECD central bank boards, they find that female appointment is fourtimes more likely when the departing member is female rather than male.
Figure 12: Composition of Central Banks’ Boards by Gender – Europe
(A) Share of Men and Women in Board
Total EA orig. N&NWE E&SEE, BC
0%
20%
40%
60%
80%
100%
Share of women in the Board
Share of men in the Board
(B) No. of Women in Board
Total EA orig. N&NWE E&SEE, BC
0%
20%
40%
60%
80%
100%
No woman in the Board
Only one woman in the Board
More than one woman in the Board
Note: Composition as of July 2020. For data on individual central banks, see Table A6 in Appendix A.Source: IDEAS/RePEc Data Set
Research also continues to be male-dominated, but the trend is changing. In absolute terms,men make up about two thirds of all the authors of the central bank research papers under study(see Figure 13, panel A). However, the share of female authors has risen significantly over time,reaching 25% at the end of 2019 (see Figure 13, panel B). This trend is driven by an increasingshare of mixed teams (involving both women and men), reflecting greater collaboration amongresearchers and larger teams (see Section 4.2). The share of female researchers is also growingin other research & development (R&D) sectors (see Table 4). A similar trend can be observedamong doctoral graduates, as the average annual growth rate of female doctoral graduates in the EU

26 Simona Malovaná, Martin Hodula, and Zuzana Rakovská
was 2.4% between 2007 and 2016, while that of male doctoral graduates was only 1.4% (EuropeanCommission, 2019). While Boschini and Sjögren (2007) find women are less likely to coauthor thanmen, we are witnessing that the trend is changing (albeit at a slow pace), at least in central banks’research. Still, all-male research teams continue to dominate, with a more than 50% share of allteams in 2019. Auriol et al. (2020) argues that it is important to monitor the gender gap in research,because the topics favoured by female economists might deviate from those favoured by men. Ifwomen are less represented in research teams, then these topics might become systematically under-invested and, as a result, their policy impact might be lost in the economy.
Figure 13: Distribution of Authors by Gender
(A) Total No. of Authors by Gender (in thous.)
Female authors Male authors
05
10
15
20
25
30
(B) Composition of Teams(Share of Total)
0%
10%
20%
30%
40%
50%
60%
70%
2000 2003 2006 2009 2012 2015 2018
−−
Male teams
Female teams−−
Mixed teams
Female authors
Note: Gender of authors identified based on their first name using the R package gender and the related database;see Section 2.Source: IDEAS/RePEc Data Set
Small central banks engage more female researchers. The relationship between the share offemale authors and the total number of authors per central bank per year seems to follow adownward-sloping convex curve. This means that with an increasing total number of authors, theshare of female authors decreases faster. However, this relationship differs between regions (seeFigure 14). Smaller central banks in Europe (in terms of total number of authors) engage morefemale researchers. On the other hand, central banks in the US and in the EA original memberstates employ a lower share of female researchers. A similar pattern was observed by Auriol et al.(2020), who showed that the more prestigious the research institution is, the fewer femaleeconomists are present. The authors also found that this systematic under-representation is presentalready at entry level and that the ranking of the institution causes the gap to be even wider.Regarding the gender structure of authors, the situation seems to be the least balanced in the ECBand the BIS. In these institutions, the share of female authors is the lowest, while the total numberof authors is among the highest. The reasons may be (at least) twofold. There may be significantlyfewer female researchers publishing, and therefore, with a higher total number of authors, the shareof female authors decreases, or male researchers may be preferred in various ways (for example, inrecruitment, in the formation of teams or in the publication process).

Researching the Research: A Central Banking Edition 27
Table 4: Share of Female Researchers in Different Sectors (%)
CentralBanks
BusinessEnterprise
Sector
GovernmentSector
HigherEducation
Sector
PrivateNon-profit
SectorEurope Total 27.0 19.9 40.1 39.6 44.2EA Original Members 26.7 19.1 38.9 37.6 45.0W and NW Europe 26.2 20.5 38.4 43.3 42.0E and SE Europe, and BC 31.7 23.8 43.8 40.5 41.12000–2004 21.5 18.2 35.5 32.8 40.12005–2009 25.9 19.2 39.3 38.4 43.52010–2014 28.2 20.3 41.4 41.2 44.72015–2017 29.5 21.0 43.8 43.1 49.1
Note: The data cover the period of 2000–2017. Unlike the RePEc/IDEAS Data Set, the Eurostat database contains data on only15 E & SEE, BC countries: RO, MT, GR, AL, SL, BG, CY, CZ, EE, HR, LV, LT, HU, MK, SK, RS, PL, UA. Figure 13 refersto data on the whole sample (including the US, the ECB and the BIS); therefore, it may differ slightly from the numbers in thistable.Source: RePEc/IDEAS Data Set (central banks), Eurostat (other sectors)
Central banks rank in the lower half of R&D institutional sectors in terms of the proportionof women in research. Table 4 shows that the private non-profit, government and higher-educationsectors exhibit higher shares of female researchers than central banks, while the lowest percentageis recorded by the business enterprise (BE) sector. This comparison should be taken with caution,because the figures for central banks refer to authors of research papers while those for other sectorsrepresent the headcount of R&D personnel as reported in the enterprise survey.28 Nevertheless, byassuming that researchers usually present their results in the form of a research paper, this can beconsidered a reasonable approximation.
In 2015–2017, women made up more than 40% of the research population in the private non-profit,government and higher-education sectors. These three sectors together employed more than 99%of all researchers in the EU as of 2018 (European Commission, 2019), which suggests a graduallyclosing gap. Nevertheless, women are still vastly under-represented in business enterpriseresearch.29 That central banks lie somewhere between the shares for business enterprises andhigher education is not surprising. Based on OECD (2015, p. 90), the R&D activities ofcorporations from the financial sector and its sub-sectors, and hence also central banks’ R&Dactivities, fall under either of the two R&D categories.
28 The data are gathered via national questionnaires in paper and/or electronic format, and the statistical unit usedis enterprise. R&D personnel include all those engaged directly in the R&D activities of the given enterprise(https://ec.europa.eu/).29 One of the possible drivers of this result is the constant shortage of female graduates (and also doctoral graduates)in the several narrow fields of science, technology, engineering and mathematics (STEM) (Huyer, 2015; EuropeanCommission, 2019). Research in these fields covers a significant portion of business enterprise research, so it isreasonable to assume that this broadly discussed issue also affects the gender disparity in science.

28 Simona Malovaná, Martin Hodula, and Zuzana Rakovská
Figure 14: Relationship Between the Share of Female Authors and the Total Number of Authors
2000−2010
Tota
l no. of auth
ors
per
CB
per
year
Share of female authors
0
50
100
150
200
250
300
350
0% 20% 40% 60% 80% 100%
2011−2019
Tota
l no. of auth
ors
per
CB
per
year
Share of female authors
0
50
100
150
200
250
300
350
0% 20% 40% 60% 80% 100%
EA orig.E & SEE, BC
W & NWEECB & BIS US
Note: Gender of authors identified based on their first name using the R package gender and the related database;see Section 2.Source: IDEAS/RePEc Data Set
4.4 Impact Factor
The impact factor is a standard measure for assessing the academic quality of a scientificpublication. We present a few comparative figures for the simple impact factor30 for centralbanks’ publication series and for scientific journals in which the central banks’ research paperswere published (for more details on data, see Section 2). It is important to consider both centralbanks’ research papers and subsequent journal publications, since even an article not meant forpublication in a scientific journal may have a large impact. In fact, this is much more common forcentral banks’ publication series than for academic publication series. In central banks, manyresearchers without an academic career path are top-field professionals whose work, even ifpublished “only” as a working paper or a staff note, may have high value added and greaterapplicability in the decision-making process.
The impact factor of central banks’ research publications varies substantially both betweenand within the regions. Not surprisingly, the ECB, the BIS and the US Federal Reserve banks,including the FRB, receive the highest impact factors for their in-house research publication series(see Figure 15, panel A). The recorded dispersion is relatively large in the case of the US FederalReserve Banks and the FRB, ranging from as little as 2 to 16; the Federal Reserve Bank of SanFrancisco and the Federal Reserve Bank of New York rank the highest, while the Federal Reserve
30 There are different types of impact factors. RePEc/IDEAS reports, among others, a simple impact factor, arecursive impact factor and a discounted impact factor. The simple impact factor is calculated as the number of allcitations of papers in a particular series or journal divided by the number of papers in the series or journal (self-citations are not considered). The recursive impact factor is calculated in the same way, except that each citationcarries some weight. The discounted impact factor gives more weight to what is cited now. For more details, seeZimmermann (2012).

Researching the Research: A Central Banking Edition 29
Bank of Cleveland and the Federal Reserve Bank of Kansas City rank the lowest. Whenconsidering only those papers which have been published in scientific journals, we find the USregion on top, followed by the two supranational institutions and the W & NWE region (seeFigure 15, panel B). Interestingly, there is a high correlation between the impact factor assigned tothe central banks’ research publication series and the average impact factor of the papers publishedin scientific journals (see Figure 16). The impact factors of the US Federal Reserve Banks and theFRB and the ECB and the BIS reflect the high emphasis placed on research in these institutions,the high share of researchers from academia involved in the research, and the related highimportance given to publishing in high-impact journals. Another significant factor contributing tothe relatively high average impact factor is the fact that research papers on the US economy (andother large economies or international samples) generally have a higher probability of publicationin a high-impact scientific journal. It is usually harder to publish small country-specific research orapplied research which is of interest to a particular central bank but of little interest to aninternational scientific journal.
Figure 15: Simple Impact Factor – Regional Distribution
(A) Central Banks’ Series
0
5
10
15
20
EA
ori
g.
W &
NW
E
E &
SE
E,
BC
US
EC
B &
BIS
(B) Papers Published in Scientific Journals
0
5
10
15
20
25
30
35
40
45
EA
ori
g.
W &
NW
E
E &
SE
E,
BC
US
EC
B &
BIS
Note: Panel A: The simple impact factor assigned to central banks’ publication series (working paper series,discussion series, occasional papers, etc.). Panel B: The distribution of the non-zero simple impact factor assignedto the scientific journals in which the central banks’ research papers were published. It accounts for 7,411 papersbetween 2000 and 2019 in total (data as of March 2020). Recursive and discounted impact factors are reported inAppendix B.Source: IDEAS/RePEc Data Set

30 Simona Malovaná, Martin Hodula, and Zuzana Rakovská
Figure 16: Simple Impact Factor – Individual Central Banks
0
5
10
15
20
25
30
BdI
BdE
BdF
SP
BdP
CB
oI
ON
DN
BD
B SI
NB
vB
BC
dL
BoE
SR
NB
SN
NB
PN
BS
MN
BN
BU
NB
Sr
NB
Ma
HN
BC
NB
LiB
LaB
EP
BoG
CB
oC
BC
tME
CB
ES
RB
BIS
FR
BF
RB
CH
FR
BD
FR
BK
CF
RB
MF
RB
NY
FR
BP
FR
BR
FR
BS
LF
RB
CF
RB
AF
RB
BF
RB
SF
Journal Publications − 25−75%Journal Publications − Mean
0
CB Series − Mean
Note: The interquantile range and mean in blue refer to the non-zero simple impact factor assigned to the scientificjournals in which the central banks’ research papers were published. The dark red line refers to the simple impactfactor assigned to the central banks’ publication series. Horizontal lines separate individual regions as follows: EAorig., W & NWE, E & SEE, BC, ECB & BIS and US. Only central banks with publication series with an impactfactor assigned in the IDEAS/RePEc database are reported. Recursive and discounted impact factors are reportedin Appendix B.Source: IDEAS/RePEc Data Set
Even though numerous studies have addressed the problematic nature and the misuse ofjournal impact factors for judging the value of scientific research (Seglen, 1997; Simons,2008; Vanclay, 2012), this practice continues. The impact factor is derived from the number ofcitations received by the papers in a particular series or journal. As such, it may help researchersand others in searching for bibliographic references to a particular paper and enabling mutualcommunication. However, it does not say much about the actual impact of that particular paper forthat particular field. The informative value of the impact factor may be limited due to the fact that asmall number of papers published in a series or journal may have received a large proportion of thecitations. The overall impact factor is then boosted by this small share of papers and says nothingabout the quality of the other papers published in that series or journal. This pattern is also visiblein our data, which show that a very small proportion of central banks’ research papers published inscientific journals contribute the most to the average and median impact factor (see Figure 17,panel A). The same pattern persists if we divide the sample into individual regions, with aheightened effect in the US, the ECB and the BIS (panel B). These central banks are the ones withthe highest average impact factors. This means that the quality of the research in central banksshould not be evaluated based on the average impact factor, as this can be skewed by a few journalpublications.
Nevertheless, the impact factor has become the one of the most important, if not the only,measure of the scientific performance of researchers and the quality of their published work.In the competition for faculty appointments and research funding, an increasing emphasis is beingplaced in academia on publishing in scientific journals with a high impact factor. We presume thatthis trend is less common among researchers in central banks, as they are not usually financially

Researching the Research: A Central Banking Edition 31
rewarded based on their publications in scientific journals and are not dependent on external researchfunding. In other fields, especially medicine and biology, this behaviour is sometimes referred toas “impact factor mania” (Casadevall and Fang, 2014) or “impactitis” (van Dienst et al., 2001).31
Surprisingly, researchers with a higher number of articles published have a more negative opinionabout the impact factor (Buela-Casal and Zych, 2012). That said, some studies find that the impactfactor does not guarantee quality (Eisner, 2018). In the field of medicine, a large proportion ofstudies cannot be reproduced, while the number of retracted papers is positively correlated with thejournal impact factor, indicating that poor research quality and fraud can sometimes be encouragedby the need to publish in high-impact scientific journals (Eisner, 2018; Christensen and Miguel,2018). Both the research and the community utilizing its outcomes would benefit from researchersbeing less concerned about the journal impact factor and more concerned about the quality, clarityand understandability of the message reported and the applicability of the outcomes. Rather thanfocusing on publishing in high-impact journals, researchers should try more actively to deliver theiroutcomes to a much broader readership (for example via non-technical summaries, blog posts andtraditional and social media).
Figure 17: Importance of Publications in High Impact Factor Journals
(A) Total Distribution
Share of journal publications
Sim
ple
im
pa
ct
facto
r
0% 20% 40% 60% 80% 100%
0
10
20
30
40
50
60
70
− −Mean SIF Median SIF
(B) Regional Distribution
Share of journal publications
Me
an
sim
ple
im
pa
ct
facto
r
0% 20% 40% 60% 80% 100%
0
10
20
30
40
50
60
70
−−
EA orig.
W & NWE
−−
E & SEE, BC
US − ECB & BIS
Note: The equivalent figures for the recursive and discounted impact factors are reported in Appendix B.Source: IDEAS/RePEc Data Set
5. Conclusions
In this paper, we explore research in 55 central banks in Europe and US, focusing on the quantity andquality of publication activity, topic analysis, the cooperation network between individual centralbanks and with academia, the gender structure of teams and research popularization, among otherthings. For this purpose, we employ two unique data sets containing information on different aspectsof central banks’ research and on more than 20,000 research papers published in these central banksover the 2000–2019 period.
31 Casadevall and Fang (2014) argue that this behaviour persists because it has significant benefits for bothindividual researchers and scientific journals, who pursue their own self-interests.

32 Simona Malovaná, Martin Hodula, and Zuzana Rakovská
There is a significant heterogeneity in research activities across central banks from differentregions. This heterogeneity is mostly apparent between larger, well-established central banks witha longer research tradition, usually located in the US and Western and Northwestern Europe, andsmaller central banks, usually located in Eastern and Southeastern Europe. The well-establishedcentral banks produce more research papers per author, publish a higher proportion of these papersin scientific journals and generally achieve a higher average impact factor. On the other hand, theyemploy fewer female researchers relative to male researchers. Furthermore, the vast majority of thecentral banks in our sample have a separate research department, but only a minority distinguishbetween financial and economic research in their organizational structure. Central banks are alsodedicating more and more resources to communicating and enhancing the visibility of their research.They are becoming more active on social media and are exploiting the potential of additional formsof presentation and popularization, such as research blogs, bulletins and newsletters. However, theuse of social media for research popularization is more common among the US Federal ReserveBanks and larger central banks in Europe with a well-established research tradition.
We have identified seven stylized facts of research in central banks. First, in terms of the topicsresearched, financial stability has emerged as the leading topic after the GFC. Based on a wordcloud of keywords and words in abstracts, we find that monetary policy issues and macroeconomictopics in general dominated before the GFC, while the macro-finance area has taken over since then.
Second, research in central banks is becoming increasingly collaborative. While the number ofpublications per author per central bank is decreasing steadily over time, the number of authors perpublication is increasing. What is most striking is the drop in share of the publications with a singleauthor, from 40% in 2000 to less than 20% in 2019. The share of publications with exactly threeauthors, on the other hand, has more than doubled in the last two decades, reaching 30% in 2019.It is also becoming increasingly common to have publications with four and five or more authors.Partly as a result of the increasingly collaborative environment, the number of papers published incentral banks’ series has more than doubled over the period under review.
Third, central banks form enormous research networks. The closer collaboration amongresearchers reflects more intensive cooperation both inside and outside the network of centralbanks. In other words, the increasing number of authors per central bank publication is due to alarger number of researchers affiliated with a central bank and also to a larger number of thoseaffiliated with an institution other than a central bank. Still, we find that most of this researchcollaboration is region-specific, meaning that a central bank is more likely to collaborate with aresearch institution from its own country or region. Further, our alternative approach to networkanalysis suggests that researchers tend to leave national central banks to relocate to supranationalinstitutions, identifying a potential problem associated with human capital flight.
The second and third stylized facts are consistent with the general tendencies in economic researchidentified by numerous studies over the last couple of years (see, for example, Card and DellaVigna,2013; Hamermesh, 2013; Kuld and O’Hagan, 2018; Essers et al., 2020). They may to a large extentreflect the increasing scale and complexity of central banks’ duties, as well as increasing integration,especially among European countries, and increasing interconnectedness of world economies andfinancial systems. Surprisingly, the increased collaboration with academia has not been reflectedin an increased share of central banks’ papers published in academic journals. This share stands atnearly 40% if we abstract from publishing delay.
Fourth, a relatively small proportion of authors contribute to a relatively large proportion ofcentral banks’ research papers. Specifically, the top 10% of authors contributed to about 50% of

Researching the Research: A Central Banking Edition 33
all central banks’ research publications in our sample. This finding suggests (albeit very indirectly)that even central banks may be prone to the “extinction effect” that has been found to be present inacademic research (Azoulay et al., 2010). Specifically, the departure of a leading researcher mayresult in a decrease in the quality of a central bank’s research publications.
Fifth, the number of female researchers relative to male researchers is increasing over time,but the gap still persists. The share of female authors in our sample rises from about 19% in 2000to 25% in 2019. This trend is driven by an increasing share of mixed research teams (involving bothwomen and men), while the share of all-women research teams remains stable over the whole periodanalysed. Further, small central banks engage more female researchers than larger central banks.A similar pattern was observed by Auriol et al. (2020), who showed that the more prestigious theresearch institution is, the fewer female economists are present. As for the relative comparison withother R&D sectors, central banks stand somewhere between the business enterprise sector and thegovernment and higher education sectors.
Sixth, larger, well-established central banks with a longer research tradition achieve a higherimpact factor for their in-house research publication series and for the average impact of theirpapers published in scientific journals. Nevertheless, the impact factor should be interpreted witha grain of salt, because it is derived from the number of citations received by papers in a particularseries or journal. The informative value of the impact factor may be limited due to the fact that asmall number of papers published in a series or journal may have received a large proportion of thecitations. The overall impact factor is then boosted by this small share of papers and says nothingabout the quality of the other papers published in that series or journal.
Seventh, a relatively small proportion of central banks’ research papers published in scientificjournals contribute the most to the average and median impact factor. This indicates that thebias described in the previous paragraph may also apply to the impact factor of central banks’ in-house publication series. This may be true because there is a high positive correlation between theimpact factor assigned to central banks’ in-house publication series and the average impact factorof the papers published in a scientific journal.

34 Simona Malovaná, Martin Hodula, and Zuzana Rakovská
References
ACEMOGLU, D., A. OZDAGLAR, AND A. TAHBAZ-SALEHI (2015): “Systemic Risk and Stabilityin Financial Networks.” American Economic Review, 105(2):564–608.
ACHARYA, V. V., L. H. PEDERSEN, T. PHILIPPON, AND M. RICHARDSON (2017): “MeasuringSystemic Risk.” The Review of Financial Studies, 30(1):2–47.
ADAMS, J. (2012): “The Rise of Research Networks.” Nature, 490(7420):335–336.
AURIOL, E., G. FRIEBEL, AND S. WILHELM (2020): “Women in European Economics.” Mimeo.
AZOULAY, P., J. S. GRAFF ZIVIN, AND J. WANG (2010): “Superstar Extinction.” The QuarterlyJournal of Economics, 125(2):549–589.
BJÖRK, B.-C. AND D. SOLOMON (2013): “The Publishing Delay in Scholarly Peer-reviewedJournals.” Journal of Informetrics, 7(4):914–923.
BLINDER, A. S., M. EHRMANN, M. FRATZSCHER, J. DE HAAN, AND D.-J. JANSEN (2008):“Central Bank Communication and Monetary Policy: A Survey of Theory and Evidence.”Journal of Economic Literature, 46(4):910–45.
BOLTON, P., S. G. CECCHETTI, AND L. REICHLIN (2014): “External Evaluation ofResearch at the Banque de France.” Available at (26 March 2020): https://www.banque-france.fr/sites/default/files/media/2016/10/25/eer-final-report-29.09.pdf
BORJAS, G. J. AND K. B. DORAN (2015): “Which Peers Matter? The Relative Impacts ofCollaborators, Colleagues, and Competitors.” Review of Economics and Statistics, 97(5):1104–1117.
BOSCHINI, A. AND A. SJÖGREN (2007): “Is Team Formation Gender Neutral? Evidence fromCoauthorship Patterns.” Journal of Labor Economics, 25(2):325–365.
BUELA-CASAL, G. AND I. ZYCH (2012): “What Do the Scientists Think About the ImpactFactor?” Scientometrics, 92(2):281–292.
CABALLERO, R., J. GALÍ, L. REICHLIN, AND L. SERVÉN (2012): “Researchat the Bank of Spain: An Evaluation.” Available at (26 March 2020):https://www.bde.es/f/webpi/SES/home/files/report_eval.pdf
CARD, D. AND S. DELLAVIGNA (2013): “Nine Facts About Top Journals in Economics.” Journalof Economic Literature, 51(1):144–61.
CARNEY, M. (2014): “One Mission. One Bank. Promoting the Good of the People of the UnitedKingdom.” Speech at Cass Business School, City University, London, 18.
CASADEVALL, A. AND F. FANG (2014): “Causes for the Persistence of Impact Factor Mania.”mBio, 5(2):1–5.
CECCHETTI, S. G. (2002): “Research in Central Banks.” Available at (26 March 2020):https://szgerzensee.ch/fileadmin/Dateien_Anwender/Dokumente/newsletter/September02.pdf
CHARLÉTY, P., D. ROMELLI, AND E. SANTACREU-VASUT (2017): “Appointments to CentralBank Boards: Does Gender Matter?” Economics Letters, 155:59–61.
CHRISTENSEN, G. AND E. MIGUEL (2018): “Transparency, Reproducibility, and the Credibilityof Economics Research.” Journal of Economic Literature, 56(3):920–980.

Researching the Research: A Central Banking Edition 35
CLAVEAU, F. AND J. DION (2018): “Quantifying Central Banks’ Scientization: Why and How ToDo a Quantified Organizational History of Economics.” Journal of Economic Methodology,25(4):349–366.
DINCER, N. N. AND B. EICHENGREEN (2007): “Central Bank Transparency: Where, Why,and with What Effects?” NBER Working Paper No. 13003, National Bureau of EconomicResearch.
DIOUF, I. AND D. PÉPIN (2017): “Gender and Central Banking.” Economic Modelling, 61:193–206.
DUCTOR, L. (2015): “Does Co-Authorship Lead to Higher Academic Productivity?” OxfordBulletin of Economics and Statistics, 77(3):385–407.
DUCTOR, L., M. FAFCHAMPS, S. GOYAL, AND M. J. VAN DER LEIJ (2014): “Social Networksand Research Output.” Review of Economics and Statistics, 96(5):936–948.
EISNER, D. A. (2018): “Reproducibility of Science: Fraud, Impact Factors and Carelessness.”Journal of Molecular and Cellular Cardiology, 114:364–368.
ESSERS, D., F. GRIGOLI, AND E. PUGACHEVA (2020): “Network Effects and ResearchCollaborations.” IMF Working Paper 20/144, International Monetary Fund.
EUROPEAN COMMISSION (2019): “She Figures 2018.” Publications Office Luxembourg.
HALDANE, A. G. AND R. M. MAY (2011): “Systemic Risk in Banking Ecosystems.” Nature, 469(7330):351–355.
HAMERMESH, D. S. (2013): “Six Decades of Top Economics Publishing: Who and How?”Journal of Economic Literature, 51(1):162–72.
HOSPIDO, L., L. LAEVEN, AND A. LAMO (2019): “The Gender Promotion Gap: Evidence fromCentral Banking.” Working Paper Series 2265, European Central Bank.
HSIEH, C.-S., M. D. KONIG, X. LIU, AND C. ZIMMERMANN (2018): “Superstar Economists:Coauthorship Networks and Research Output.” CEPR Discussion Paper 13239, Centre forEconomic Policy Research.
HUYER, S. (2015): Is the Gender Gap Narrowing in Science and Engineering. In UNESCOScience Report: Towards 2030, pages 85–103. UNESCO.
ISSING, O. (2005): “Communication, Transparency, Accountability: Monetary Policy in theTwenty-first Century.” Federal Reserve Bank of St. Louis Review, 87(March/April 2005).
KULD, L. AND J. O’HAGAN (2018): “Rise of Multi-authored Papers in Economics: Demise ofthe ’Lone Star’ and Why?” Scientometrics, 114(3):1207–1225.
LEBARON, F. AND A. DOGAN (2016): “Do Central Bankers’ Biographies Matter?” Sociologica,10(2):1–37.
MALOVANÁ, S. (2020): “How to Organize Research in Central Banks: The Czech National Bank’sExperience.” Research and Policy Note 1/2020, Czech National Bank.
MEYER, L., M. EICHENBAUM, D. GALE, A. LEVIN, AND J. MCANDREWS (2008): “ExternalReview of Economic Research Activities at the Bank of Canada.” Available at (26 March2020): https://www.bankofcanada.ca/wp-content/uploads/2011/05/ext_review.pdf

36 Simona Malovaná, Martin Hodula, and Zuzana Rakovská
MISHKIN, F. S. (2010): Will Monetary Policy Become More of a Science? In The Science andPractice of Monetary Policy Today, pages 81–103. Springer.
MUDGE, S. L. AND A. VAUCHEZ (2016): “Fielding Supranationalism: The European CentralBank as a Field Effect.” The Sociological Review, 64(2):146–169.
OECD, F. M. (2015): “Guidelines for Collecting and Reporting Data on Research andExperimental Development (2015).” Organisation for Economic Co-operation andDevelopment.
SEGLEN, P. O. (1997): “Why the Impact Factor of Journals Should Not Be Used for EvaluatingResearch.” BMJ, 314(7079):498–502.
SIMONS, K. (2008): “The Misused Impact Factor.” Science, 322(5899):165–165.
SMETS, F. (2014): “Financial Stability and Monetary Policy: How Closely Interlinked?”International Journal of Central Banking, 10(2):263–300.
STIGLITZ, J. E. (2010): “Risk and Global Economic Architecture: Why Full Financial IntegrationMay Be Undesirable.” American Economic Review, 100(2):388–92.
TAYLOR, J. B. (1998): “Applying Academic Research on Monetary Policy Rules: An Exercise inTranslational Economics.” The Manchester School, 66(S):1–16.
THE ECONOMIST (2014): “How Jackson Hole Became Such an Important EconomicTalking Shop.” Available at (14 August 2020): https://www.economist.com/the-economist-explains/2014/08/20/how-jackson-hole-became-such-an-important-economic-talking-shop
TRICHET, J.-C. (2007): “The Role of Research in Central Banks and at the ECB.” Speech atthe Award of the Germán Bernácer Prize Ceremony, Madrid, 21 May 2007. Available at (26March 2020): http://www.ecb.europa.eu/press/key/date/2007/html/sp070522.en.html
VAN DIENST, P. J., H. HOLZEL, D. BURNETT, AND J. CROCKNER (2001): “Impactitis: NewCures for an Old Disease.” Journal of Clinical Pathology, 54(11):817–819.
VANCLAY, J. K. (2012): “Impact Factor: Outdated Artefact or Stepping-stone to JournalCertification?” Scientometrics, 92(2):211–238.
ZIMMERMANN, C. (2012): “Academic Rankings with RePEc.” FRB of St. Louis WorkingPaper 2012-023A, Federal Reserve Bank of St. Louis.

Researching the Research: A Central Banking Edition 37
Appendix A: Data

38 Simona Malovaná, Martin Hodula, and Zuzana Rakovská
Tabl
eA
1:R
esea
rch
Scor
eD
ata
Set(
1)
Cod
eC
entr
alB
ank
AB
CD
EF
GH
IJ
KL
MN
OP
QR
ST
UV
WX
YZ
Eur
ope
AL
Ban
kae
Shqi
peri
se1
00
11
00
10
11
00.
250.
50
00
01
00
10
00
0A
TO
este
rrei
chis
che
Nat
iona
lban
k1
00
10
0.5
11
01
00
0.25
00
11
01
01
10
01
0B
YN
atio
nalB
ank
ofth
eR
epub
licof
Bel
arus
10
01
00
00
01
00
00
00
00
10
00
00
00
BE
Nat
iona
lBan
kof
Bel
gium
10
01
01
01
01
10
0.25
01
11
01
01
10
00
1B
AC
entr
alna
Ban
kaB
osne
IHer
ceg
00
00
00
01
01
00
00
00
00
10
00
00
01
BG
Bul
gari
anN
atio
nalB
ank
11
01
00.
50
01
00
00
00
00
01
01
10
00
0H
RH
rvat
ska
Nar
odna
Ban
ka0
00
00
00
10
00
00.
250
00
00
10
01
00
11
CY
Cen
tral
Ban
kof
Cyp
rus
10
00
00
01
00
00
00
00
00
10
00
10
00
CZ
Ces
káN
árod
níB
anka
11
01
11
11
01
01
0.5
01
00
01
00
11
01
0D
KD
anm
arks
Nat
iona
lban
k1
00
10
0.5
11
00
00
00
00
00
10
01
00.
50
1E
EE
esti
Pank
10
01
01
11
01
00
0.25
00
00
01
01
10.
50
11
FISu
omen
Pank
ki1
01
10
11
01
11
10.
250
10
11
10
11
0.5
00
0FR
Ban
que
deFr
ance
10
01
00
11
01
11
0.5
00
11
01
11
11
00
1D
ED
euts
che
Bun
desb
ank
10
01
01
10
11
00
0.25
01
11
01
11
11
0.5
01
GR
Ban
kof
Gre
ece
10
01
01
01
01
10
00
00
00
10
00
00
00
HU
Mag
yarN
emze
tiB
ank
11
01
10.
51
10
10
00
00
01
01
01
11
00
1IS
Cen
tral
Ban
kof
Icel
and
00
01
11
01
00
00
00
01
00
10
01
00
00
IEC
entr
alB
ank
ofIr
elan
d1
00
00
00
01
11
00
01
01
01
00
00
00
1IT
Ban
cad’
Ital
ia1
01
11
10
10
10
00.
50.
50
01
01
01
10
00
1X
KB
anka
Qen
dror
eR
epub
likës
sëK
osov
ës0
00
01
00
10
00
00
00
00
01
00
00
00
0
LVL
atvi
jas
Ban
ka1
00
10
11
11
00
10.
250
11
00
10
00
00
00
LTL
ietu
vos
Ban
kas
10
11
01
11
11
00
0.25
00
00
01
01
11
0.5
11
LU
Ban
que
Cen
tral
edu
Lux
embo
urg
10
01
00.
51
10
00
00.
250
00
00
10
11
00
00
MT
Ban
kC
entr
alit
a’M
alta
10
01
00.
50
10
11
00
00
01
01
01
11
00
0M
DB
anca
Nat
iona
laa
Mol
dove
i1
00
00
00
00
00
00
00
00
01
00
00
00
0M
EC
entr
alna
Ban
kaC
rne
Gor
e1
00
00
00
10
10
00
00
00
01
00
00
01
0N
Lde
Ned
erla
ndsc
heB
ank
10
01
01
11
01
00
00.
50
00
01
01
11
0.5
00
MK
Nar
odna
Ban
kana
Rep
.Sev
erna
Mak
edon
ija1
00
10
10
10
10
00
00
00
01
00
10
00
0
NO
Nor
ges
Ban
k1
00
10
11
10
10
10.
250
00
00
10
11
10
11
PLN
arod
owy
Ban
kPo
lski
10
01
10.
50
10
10
00
00
10
01
01
10
00
0PT
Ban
code
Port
ugal
10
01
0.5
11
10
11
00
00
00
01
10
10.
50
00
RO
Ban
caN
atio
nala
aR
oman
iei
00
00
00
00
01
00
00
00
00
10
00
00
00
RS
Nar
odna
Ban
kaSr
bije
10
01
00
01
01
00
00
00
00
10
01
00
00
SKN
árod
náB
anka
Slov
ensk
a1
10
11
10
10
00
00
00
00
01
11
10
00
0SI
Ban
kaSl
oven
ije1
00
10
00
11
10
00
00
00
01
00
10
01
0E
SB
anco
deE
span
a1
00
10
10
10
11
00
0.5
00
00
10
11
00
01
SESv
erig
esR
iksb
ank
10
01
00.
51
10
10
00
0.5
00
00
10
11
10
01
CH
Schw
eize
risc
heN
atio
nalb
ank
10
01
00
01
01
10
0.25
0.5
01
00
10
01
00
01
UA
Nat
iona
lBan
kof
Ukr
aine
00
01
00.
51
10
10
00
00
00
01
01
10
01
1U
KB
ank
ofE
ngla
nd1
01
10
11
10
01
10.
250
10
11
11
11
0.5
0.5
01
Not
e:Se
eth
eno
tes
toTa
ble
A2.

Researching the Research: A Central Banking Edition 39
Tabl
eA
2:R
esea
rch
Scor
eD
ata
Set(
2)
Cod
eC
entr
alB
ank
AB
CD
EF
GH
IJ
KL
MN
OP
QR
ST
UV
WX
YZ
US
US
Fede
ralR
eser
veB
oard
11
01
0.5
01
01
10
00
00
11
21
01
10
0.5
01
US
Fede
ralR
eser
veB
ank
ofA
tlant
a1
11
10.
50
11
11
01
0.25
01
10
01
01
10
0.5
00
US
Fede
ralR
eser
veB
ank
ofB
osto
n1
01
10
11
10
10
00.
250
11
10
10
11
10.
50
0U
SFe
dera
lRes
erve
Ban
kof
Cle
vela
nd1
01
10
11
10
10
00
00
01
11
00
10.
50.
50
1
US
Fede
ralR
eser
veB
ank
ofD
alla
s1
01
10
01
10
10
00.
250
01
10
11
01
10.
50
1U
SFe
dera
lRes
erve
Ban
kof
Chi
cago
10
01
00
11
01
01
0.5
01
00
01
01
10.
50.
50
1
US
Fede
ralR
eser
veB
ank
ofK
ansa
sC
ity1
00
10
11
10
11
00.
250
10
10
10
11
0.5
0.5
01
US
Fede
ralR
eser
veB
ank
ofM
inne
apol
is1
01
10
11
10
10
00.
250
10
10
10
11
10
01
US
Fede
ralR
eser
veB
ank
ofN
ewY
ork
10
01
00.
51
10
10
10.
250
11
11
10
11
0.5
0.5
01
US
Fede
ralR
eser
veB
ank
ofPh
ilade
lphi
a1
01
10
01
10
10
00.
50
11
11
10
01
10.
50
0
US
Fede
ralR
eser
veB
ank
ofR
ichm
ond
10
01
00
11
01
00
0.5
01
11
11
00
10.
50.
50
1
US
Fede
ralR
eser
veB
ank
ofSa
nFr
anci
sco
10
11
00
11
01
01
0.25
01
01
01
01
10.
50.
50
1
US
Fede
ralR
eser
veB
ank
ofSt
Lou
is1
11
11
11
10
10
10.
50
00
00
10
01
0.5
0.5
01
Inte
rnat
iona
l-
Ban
kfo
rInt
erna
tiona
lSe
ttlem
ents
10
11
11
11
01
00
0.25
01
11
01
11
11
0.5
11
-E
urop
ean
Cen
tral
Ban
k1
10
11
11
11
11
00
01
11
01
11
11
01
1-
Eur
opea
nSy
stem
icR
isk
Boa
rd1
00
11
0.5
11
01
00
00
00
00
10
00
01
00
Not
e:T
his
tabl
efo
rms
the
Res
earc
hSc
ore
Dat
aSe
t.C
olum
nsA
toZ
show
the
scor
esof
the
indi
vidu
alite
ms:
0–
nosu
chch
arac
teri
stic
isin
plac
ein
the
give
nC
B;1
–th
egi
ven
char
acte
rist
icis
inpl
ace
infu
ll;0.
25or
0.5
–th
egi
ven
char
acte
rist
icis
inpl
ace,
buto
nly
part
ially
.C
olum
ns:A
–Is
ther
ea
sepa
rate
rese
arch
depa
rtm
ent?
B-I
sfin
anci
alre
sear
chse
para
ted
inth
eC
B’s
orga
niza
tiona
lstr
uctu
re?
C–
Isth
ere
anas
soci
ated
rese
arch
inst
itutio
n?D
–Is
ther
ea
sepa
rate
web
site
forr
esea
rch?
E–
Isth
ere
ase
para
tew
ebsi
tefo
rfina
ncia
lres
earc
h?(i
f0.5
,the
nfin
anci
alre
sear
chca
nbe
sepa
rate
dfr
omot
herr
esea
rch,
fore
xam
ple
byta
gs,b
utth
ere
isno
sepa
rate
web
site
fori
t)F
–A
reth
ere
sear
char
eas
prom
oted
onth
ere
sear
chw
ebsi
te?
(if0
.5,t
hen
the
rese
arch
area
sar
est
ated
only
brie
fly)G
–Is
ther
ea
web
page
whi
chsu
mm
ariz
esre
sear
cher
s’pr
ofile
s?H
–Is
ther
ea
wor
king
pape
r(W
P)se
ries
publ
ishe
dby
the
CB
?I-
Isth
ere
adi
scus
sion
pape
r(D
P)se
ries
publ
ishe
dby
the
CB
?J
–Is
ther
ean
yot
herp
ublic
atio
nse
ries
exce
ptfo
rthe
WP
and
DP
seri
es?
K–
Doe
sth
eC
Bpu
blis
hits
own
rese
arch
bulle
tin?
L–
Isth
ere
are
sear
chbl
ogin
the
CB
?M
–Is
ther
ea
rese
arch
new
slet
ter
inem
ailf
orm
?(i
f0.
25,t
hen
the
rese
arch
new
slet
ter
take
sth
efo
rmof
emai
lnot
ifica
tions
abou
tupd
ates
tore
sear
chw
ebsi
tes;
if0.
5,th
enth
ere
sear
chne
wsl
ette
rta
kes
the
form
ofan
emai
lcam
paig
n)N
–Is
ther
ea
rese
arch
new
slet
teri
npd
f/do
cum
entf
orm
?(i
f0.5
,the
nth
ere
sear
chne
wsl
ette
rtak
esth
efo
rmof
apd
f/do
cum
ent)
O–
Hav
eth
ere
been
any
post
sre
late
dto
the
rese
arch
activ
ities
ofth
eC
Bon
Lin
kedI
nin
the
last
6m
onth
s(a
sof
Febr
uary
/Mar
ch20
20)P
–H
ave
ther
ebe
enan
ypo
sts
rela
ted
toth
ere
sear
chac
tiviti
esof
the
CB
onY
ouTu
bein
the
last
6m
onth
s(a
sof
Febr
uary
/Mar
ch20
20)Q
–H
ave
ther
ebe
enan
ypo
sts
rela
ted
toth
ere
sear
chac
tiviti
esof
the
CB
onTw
itter
inth
ela
st6
mon
ths
(as
ofFe
brua
ry/M
arch
2020
)R–
Isth
ere
ase
para
teTw
itter
acco
untf
orre
sear
ch?
S–
Doe
sth
eC
Bha
vea
ReP
Ec
acco
unt?
T–
Doe
sth
eC
Bad
vert
ise
any
calls
forp
roje
cts
onits
web
site
?U
–D
oes
the
CB
offe
rany
form
ofre
sear
chco
oper
atio
n?V
–A
reth
ere
any
rese
arch
even
tsor
gani
zed
byth
eC
B?
W–
Isth
ere
any
web
page
whi
chlis
tsth
ejo
urna
lar
ticle
sw
ritte
nby
the
CB
’sst
aff?
(if0
.5,t
hen
jour
nala
rtic
les
wri
tten
byth
eC
B’s
staf
fcan
beac
cess
edon
lyvi
ath
ere
sear
cher
s’pr
ofile
page
s)X
–D
oes
the
CB
prov
ide
data
sour
ces
fori
tsre
sear
chpu
blic
atio
ns?
(if0
.5,
then
the
CB
prov
ides
rese
arch
data
inge
nera
l,bu
tthe
seda
tase
tsar
eno
texp
licitl
yco
nnec
ted
togi
ven
rese
arch
publ
icat
ions
)Y–
Doe
sth
eC
Bor
gani
zean
yre
sear
chco
mpe
titio
nsor
appr
aisa
ls?
Z–
Doe
sth
eC
Bof
fera
nytr
aine
e/in
tern
ship
prog
ram
me
conn
ecte
dto
rese
arch
?

40 Simona Malovaná, Martin Hodula, and Zuzana Rakovská
Table A3: Items Included in the Research Scores
Item OverallResearch
Score
ResearchOrganization
Score
ResearchPublication
Score
ResearchPopularization
Score
Item OverallResearch
Score
ResearchOrganization
Score
ResearchPublication
Score
ResearchPopularization
ScoreA Y Y N N N Y N N YB Y Y N N O Y N N YC Y Y N N P Y N N YD Y N N Y Q Y N N YE Y Y N N R Y N N YF Y N N Y S Y N Y NG Y N N Y T Y N N YH Y N Y N U Y N N YI Y N Y N V Y N N YJ Y N Y N W Y N Y N
K Y N N Y Y Y N Y NL Y N N Y Z Y N N YM Y N N Y AA Y N N Y
Note: See the notes to Table A2.
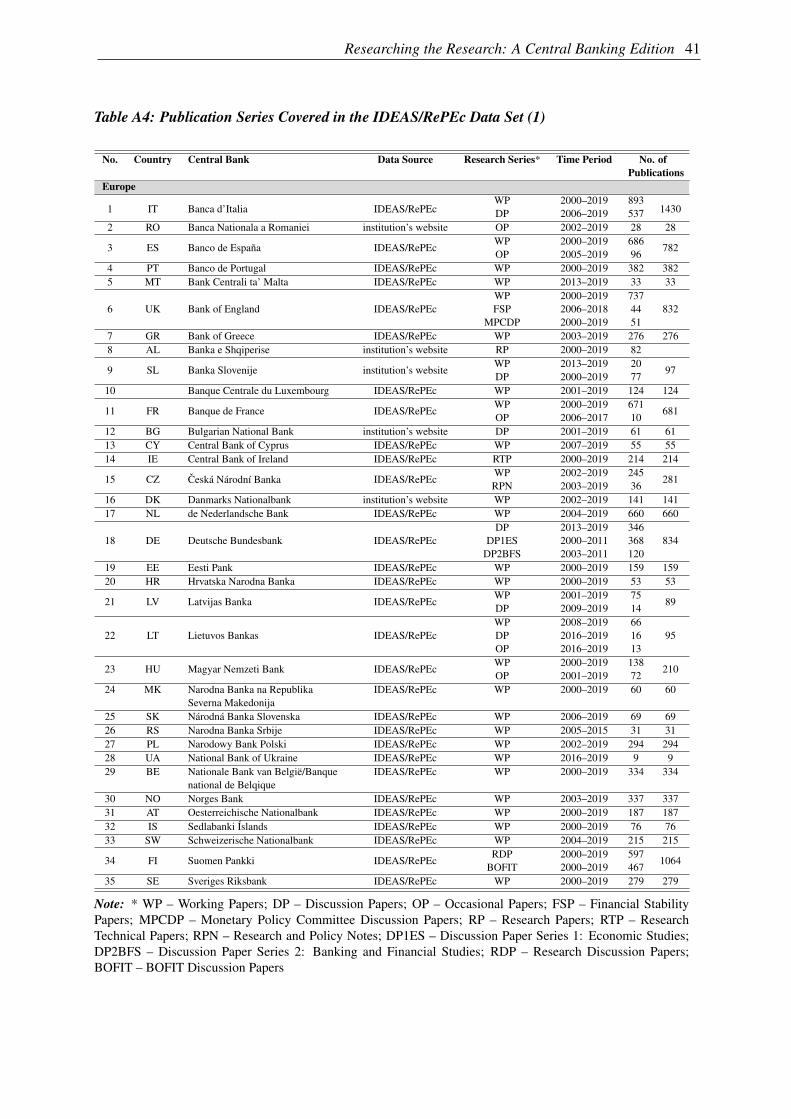
Researching the Research: A Central Banking Edition 41
Table A4: Publication Series Covered in the IDEAS/RePEc Data Set (1)
No. Country Central Bank Data Source Research Series* Time Period No. ofPublications
Europe
1 IT Banca d’Italia IDEAS/RePEcWP 2000–2019 893
1430DP 2006–2019 5372 RO Banca Nationala a Romaniei institution’s website OP 2002–2019 28 28
3 ES Banco de España IDEAS/RePEcWP 2000–2019 686
782OP 2005–2019 96
4 PT Banco de Portugal IDEAS/RePEc WP 2000–2019 382 3825 MT Bank Centrali ta’ Malta IDEAS/RePEc WP 2013–2019 33 33
6 UK Bank of England IDEAS/RePEcWP 2000–2019 737
832FSP 2006–2018 44MPCDP 2000–2019 51
7 GR Bank of Greece IDEAS/RePEc WP 2003–2019 276 2768 AL Banka e Shqiperise institution’s website RP 2000–2019 82
9 SL Banka Slovenije institution’s websiteWP 2013–2019 20
97DP 2000–2019 77
10 Banque Centrale du Luxembourg IDEAS/RePEc WP 2001–2019 124 124
11 FR Banque de France IDEAS/RePEcWP 2000–2019 671
681OP 2006–2017 10
12 BG Bulgarian National Bank institution’s website DP 2001–2019 61 6113 CY Central Bank of Cyprus IDEAS/RePEc WP 2007–2019 55 5514 IE Central Bank of Ireland IDEAS/RePEc RTP 2000–2019 214 214
15 CZ Ceská Národní Banka IDEAS/RePEcWP 2002–2019 245
281RPN 2003–2019 36
16 DK Danmarks Nationalbank institution’s website WP 2002–2019 141 14117 NL de Nederlandsche Bank IDEAS/RePEc WP 2004–2019 660 660
18 DE Deutsche Bundesbank IDEAS/RePEcDP 2013–2019 346
834DP1ES 2000–2011 368DP2BFS 2003–2011 120
19 EE Eesti Pank IDEAS/RePEc WP 2000–2019 159 15920 HR Hrvatska Narodna Banka IDEAS/RePEc WP 2000–2019 53 53
21 LV Latvijas Banka IDEAS/RePEcWP 2001–2019 75
89DP 2009–2019 14
22 LT Lietuvos Bankas IDEAS/RePEcWP 2008–2019 66
95DP 2016–2019 16OP 2016–2019 13
23 HU Magyar Nemzeti Bank IDEAS/RePEcWP 2000–2019 138
210OP 2001–2019 72
24 MK Narodna Banka na RepublikaSeverna Makedonija
IDEAS/RePEc WP 2000–2019 60 60
25 SK Národná Banka Slovenska IDEAS/RePEc WP 2006–2019 69 6926 RS Narodna Banka Srbije IDEAS/RePEc WP 2005–2015 31 3127 PL Narodowy Bank Polski IDEAS/RePEc WP 2002–2019 294 29428 UA National Bank of Ukraine IDEAS/RePEc WP 2016–2019 9 929 BE Nationale Bank van België/Banque
national de BelqiqueIDEAS/RePEc WP 2000–2019 334 334
30 NO Norges Bank IDEAS/RePEc WP 2003–2019 337 33731 AT Oesterreichische Nationalbank IDEAS/RePEc WP 2000–2019 187 18732 IS Sedlabanki Íslands IDEAS/RePEc WP 2000–2019 76 7633 SW Schweizerische Nationalbank IDEAS/RePEc WP 2004–2019 215 215
34 FI Suomen Pankki IDEAS/RePEcRDP 2000–2019 597
1064BOFIT 2000–2019 467
35 SE Sveriges Riksbank IDEAS/RePEc WP 2000–2019 279 279
Note: * WP – Working Papers; DP – Discussion Papers; OP – Occasional Papers; FSP – Financial StabilityPapers; MPCDP – Monetary Policy Committee Discussion Papers; RP – Research Papers; RTP – ResearchTechnical Papers; RPN – Research and Policy Notes; DP1ES – Discussion Paper Series 1: Economic Studies;DP2BFS – Discussion Paper Series 2: Banking and Financial Studies; RDP – Research Discussion Papers;BOFIT – BOFIT Discussion Papers

42 Simona Malovaná, Martin Hodula, and Zuzana Rakovská
Table A5: Publication Series Covered in the IDEAS/RePEc Data Set (2)
No. State Central Bank Data Source Research Series* Time Period No. ofPublications
US36 Georgia Federal Reserve Bank of Atlanta IDEAS/RePEc WP 2000–2019 494 494
37 Massachusetts Federal Reserve Bank of Boston IDEAS/RePEcWP 2000–2019 310
358SRAWP 2007–2019 48
38 Ohio Federal Reserve Bank of Cleveland IDEAS/RePEc WP 2000–2019 499 499
39 Texas Federal Reserve Bank of Dallas IDEAS/RePEcWP 2000–2019 197
570GIWP 2007–2019 373
40 Illinois Federal Reserve Bank of Chicago IDEAS/RePEc WP 2000–2019 477 47741 Missouri Federal Reserve Bank of Kansas City IDEAS/RePEc WP 2000–2019 278 27842 Minnesota Federal Reserve Bank of
MinneapolisIDEAS/RePEc WP 2000–2019 166 166
43 New York Federal Reserve Bank of New York IDEAS/RePEc WP 2000–2019 806 80644 Pennsylvania Federal Reserve Bank of
PhiladelphiaIDEAS/RePEc WP 2000–2019 657 657
45 Virginia Federal Reserve Bank of Richmond IDEAS/RePEc WP 2000–2019 262 26246 California Federal Reserve Bank of San
FranciscoIDEAS/RePEc WP 2000–2019 571 571
47 Missouri Federal Reserve Bank of St. Louis IDEAS/RePEc WP 2000–2019 876 876
48 Federal Reserve Board IDEAS/RePEcFEDS 2000–2019 1537
2147Washington, D.C. IFDP 2000–2019 610International49 - Bank for International Settlements IDEAS/RePEc WP 2000–2019 752 75250 - European Central Bank IDEAS/RePEc WP 2000–2019 2335 233551 - European Systemic Risk Board IDEAS/RePEc WP 2016–2019 106 106
Note: * WP – Working Papers; SRAWP – Supervisory Research and Analysis Working Papers; GIWP –Globalization Institute Working Papers; FEDS – Finance and Economics Discussion Series; IFDP – InternationalFinance Discussion Papers

Researching the Research: A Central Banking Edition 43
Tabl
eA
6:C
ompo
sitio
nof
Cen
tral
Ban
ks’B
oard
sby
Gen
der
No.
Cen
tral
Ban
kB
oard
’sN
ame
Com
posi
tion
Mal
eFe
mal
eG
over
nor∗
1B
anca
d’It
alia
Gov
erni
ngB
oard
41
mal
e2
Ban
caN
atio
nala
aR
omal
eiei
Boa
rdof
Dir
ecto
rs9
0m
ale
3B
anco
deE
span
aG
over
ning
Cou
ncil∗
∗4
6m
ale
4B
anco
dePo
rtug
alB
oard
ofD
irec
tors
41
mal
e5
Ban
kC
entr
alit
a’M
alta
Boa
rdof
Dir
ecto
rs5
2m
ale
6B
ank
ofE
ngla
ndM
onet
ary
Polic
yC
omm
ittee
81
mal
e7
Ban
kof
Gre
ece
Gen
eral
Cou
ncil
111
mal
e8
Ban
kae
Shqi
peri
seSu
perv
isor
yC
ounc
il4
4m
ale
9B
anka
Slov
enije
Gov
erni
ngB
oard
41
mal
e10
Ban
que
Cen
tral
edu
Lux
embo
urg
Cou
ncil
72
mal
e11
Ban
que
deFr
ance
Gen
eral
Cou
ncil
45
mal
e12
Bul
gari
anN
atio
nalB
ank
Gov
erni
ngC
ounc
il4
3m
ale
13C
entr
alB
ank
ofC
ypru
sB
oard
ofD
irec
tors
71
mal
e14
Cen
tral
Ban
kof
Irel
and
Com
mis
sion
63
mal
e15
Ces
káN
árod
níB
anka
Ban
kB
oard
70
mal
e16
Dan
mar
ksN
atio
nalb
ank
Boa
rdof
Gov
erno
rs3
0m
ale
17de
Ned
erla
ndsc
heB
ank
Gov
erni
ngB
oard
42
mal
e18
Deu
tsch
eB
unde
sban
kE
xecu
tive
Boa
rd4
2m
ale
19E
esti
Pank
Exe
cutiv
eB
oard
21
mal
e20
Hrv
atsk
aN
arod
naB
anka
Cou
ncil
53
mal
e21
Lat
vija
sB
anka
Cou
ncil
42
mal
e22
Lie
tuvo
sB
anka
sB
oard
41
mal
e23
Mag
yarN
emze
tiB
ank
Boa
rd4
0m
ale
24N
arod
naB
anka
naR
epub
lika
Seve
rna
Mak
edon
ijaC
ounc
il3
3fe
mal
e25
Nár
odná
Ban
kaSl
oven
ska
Ban
kB
oard
50
mal
e26
Nar
odna
Ban
kaSr
bije
Boa
rd1
3fe
mal
e27
Nar
odow
yB
ank
Pols
kiM
onet
ary
Polic
yC
omm
ittee
91
mal
e28
Nat
iona
lBan
kof
Ukr
aine
Boa
rd5
1m
ale
29N
atio
nale
Ban
kva
nB
elgi
ë/B
anqu
ena
tiona
lde
Bel
qiqu
eB
oard
ofD
irec
tors
60
mal
e30
Nor
ges
Ban
kE
xecu
tive
Boa
rd4
6m
ale
31O
este
rrei
chis
che
Nat
iona
lban
kG
over
ning
Boa
rd4
0m
ale
32Se
dlab
anki
Ísla
nds
Boa
rd2
2m
ale
33Sc
hwei
zeri
sche
Nat
iona
lban
kG
over
ning
Boa
rd2
1m
ale
34Su
omen
Pank
kiB
oard
21
mal
e35
Sver
iges
Rik
sban
kE
xecu
tive
Boa
rd4
2m
ale
36C
entr
alB
ank
ofB
osni
aan
dH
erze
govi
naG
over
ning
Boa
rd4
5m
ale
37N
atio
nalB
ank
ofth
eR
epub
licof
Bel
arus
Boa
rd4
1m
ale
38N
atio
nalB
ank
ofM
oldo
vaE
xecu
tive
Boa
rd4
0m
ale
39C
entr
alB
ank
ofM
onte
negr
oC
ounc
il6
0m
ale
40C
entr
alB
ank
ofth
eR
epub
licof
Kos
ovo
Exe
cutiv
eB
oard
30
mal
eN
ote:
∗So
met
imes
refe
rred
toas
the
Pres
iden
tort
heC
hair
man
.∗∗
Exc
ludi
ngno
n-vo
ting
mem
bers
.Com
posi
tion
asof
July
2020
.

44 Simona Malovaná, Martin Hodula, and Zuzana Rakovská
Appendix B: Additional Figures
Figure B1: Research Score Groups
(A) Research Publications Score
(B) Research Popularization Score

Researching the Research: A Central Banking Edition 45
(C) Research Organization Score
Note: The detailed data behind the individual scores can be found in Tables A1 and A2. The choropleth maps donot reflect the scores for the Federal Reserve Board (FRB), the European Central Bank (ECB, including the ESRB)and the Bank for International Settlements (BIS).Source: Research Score Data Set
Figure B2: Central Banks on Social Media
Note: The data about the utilization of social media were collected manually using central banks’ websites andsocial media accounts. Other includes services such as Spotify, Pinterest and Slideshare. To obtain the informationabout the use of social media for research purposes, we manually analysed each central bank’s posts in the last6 months on the three most-frequently used social media platforms – YouTube, Twitter and LinkedIn. The periodof data collection was February to March 2020.Source: Research Score Data Set

46 Simona Malovaná, Martin Hodula, and Zuzana Rakovská
Figure B3: Authorship Networks Between Central Banks – Regionally
Note: Based on authors’ self-reported affiliation in IDEAS/RePEc.The edge width indicates the relative frequency of authorships between the listed central banks (i.e. the number ofpublications in the given time period). Central banks shown in red account for 80% of publications (dark red for50% and light red for the additional 30%).Source: IDEAS/RePEc Data Set

Researching the Research: A Central Banking Edition 47
Figure B4: Recursive Impact Factor – Regional Distribution
(A) Central Banks’ Series
0
0.5
1
1.5
2
2.5
EA
ori
g.
W &
NW
E
E &
SE
E,
BC
US
EC
B &
BIS
(B) Papers Published in Scientific Journals
0
1
2
3
4
5
6
7
EA
ori
g.
W &
NW
E
E &
SE
E,
BC
US
EC
B &
BIS
Note: See the note to Figure 15.Source: IDEAS/RePEc Data Set
Figure B5: Discounted Impact Factor – Regional Distribution
(A) Central Banks’ Series
0
1
2
3
4
5
EA
ori
g.
W &
NW
E
E &
SE
E,
BC
US
EC
B &
BIS
(B) Papers Published in Scientific Journals
0
5
10
15
EA
ori
g.
W &
NW
E
E &
SE
E,
BC
US
EC
B &
BIS
Note: See the note to Figure 15.Source: IDEAS/RePEc Data Set

48 Simona Malovaná, Martin Hodula, and Zuzana Rakovská
Figure B6: Recursive Impact Factor – Individual Central Banks
0
2
4
6
8
10
BdI
BdE
BdF
SP
BdP
CB
oI
ON
DN
BD
B SI
NB
vB
BC
dL
BoE
SR
NB
SN
NB
PN
BS
MN
BN
BU
NB
Sr
NB
Ma
HN
BC
NB
LiB
LaB
EP
BoG
CB
oC
BC
tME
CB
ES
RB
BIS
FR
BF
RB
CH
FR
BD
FR
BK
CF
RB
MF
RB
NY
FR
BP
FR
BR
FR
BS
LF
RB
CF
RB
AF
RB
BF
RB
SF
Journal Publications − 25−75%Journal Publications − Mean
CB Series − Mean
Note: See the note to Figure 16.Source: IDEAS/RePEc Data Set
Figure B7: Discounted Impact Factor – Individual Central Banks
0
1
2
3
4
5
BdI
BdE
BdF
SP
BdP
CB
oI
ON
DN
BD
B SI
NB
vB
BC
dL
BoE
SR
NB
SN
NB
PN
BS
MN
BN
BU
NB
Sr
NB
Ma
HN
BC
NB
LiB
LaB
EP
BoG
CB
oC
BC
tME
CB
ES
RB
BIS
FR
BF
RB
CH
FR
BD
FR
BK
CF
RB
MF
RB
NY
FR
BP
FR
BR
FR
BS
LF
RB
CF
RB
AF
RB
BF
RB
SF
Journal Publications − 25−75%Journal Publications − Mean
CB Series − Mean
Note: See the note to Figure 16.Source: IDEAS/RePEc Data Set

Researching the Research: A Central Banking Edition 49
Figure B8: Importance of Publications in High Impact Factor Journals – Recursive ImpactFactor
(A) Total Distribution
Share of journal publications
Re
cu
rsiv
e im
pa
ct
facto
r
0% 20% 40% 60% 80% 100%
0
2
4
6
8
10
12
− −Mean RIF Median RIF
(B) Regional Distribution
Share of journal publicationsM
ea
n r
ecu
rsiv
e im
pa
ct
facto
r0% 20% 40% 60% 80% 100%
0
2
4
6
8
10
12
−−
EA orig.
W & NWE
−−
E & SEE, BC
US − ECB & BIS
Note: See the note to Figure 17.Source: IDEAS/RePEc Data Set
Figure B9: Importance of Publications in High Impact Factor Journals – Discounted ImpactFactor
(A) Total Distribution
Share of journal publications
Dis
co
un
ted
im
pa
ct
facto
r
0% 20% 40% 60% 80% 100%
0
5
10
15
20
25
− −Mean DIF Median DIF
(B) Regional Distribution
Share of journal publications
Me
an
dis
ou
nte
d im
pa
ct
facto
r
0% 20% 40% 60% 80% 100%
0
5
10
15
20
25
−−
EA orig.
W & NWE
−−
E & SEE, BC
US − ECB & BIS
Note: See the note to Figure 17.Source: IDEAS/RePEc Data Set

CNB Working Paper Series (since 2019)
WP 9/2020 Ivan Sutóris The intertemporal cost of living and dynamic inflation: The case of the
Czech Republic
WP 8/2020 Martin Hodula
Jan Janků
Martin Časta
Adam Kučera
On the determinants of life and non-life insurance premiums
WP 7/2020 František Brázdik
Tibor Hlédik
Zuzana Humplová
Iva Martonosi
Karel Musil
Jakub Ryšánek
Tomáš Šestořád
Jaromír Tonner
Stanislav Tvrz
Jan Žáček
The g3+ model: An upgrade of the Czech National Bank’s core
forecasting framework
WP 6/2020 Volha Audzei
Jan Brůha
A model of the Euro Area, China and the United States: Trade links
and trade wars
WP 5/2020 Dominika
Ehrenbergerová
Martin Hodula
Zuzana Rakovská
Does capital-based regulation affect bank pricing policy?
WP 4/2020 Alexis Derviz Sovereign capital, external balance, and the investment-based
Balassa-Samuelson effect in a global dynamic equilibrium
WP 3/2020 Milan Szabo Growth-at-risk: Bayesian approach
WP 2/2020 Martin Hodula
Ngoc Anh Ngo
Finance, growth and (macro)prudential policy: European evidence
WP 1/2020
Michal Franta
Ivan Sutóris
Dynamics of Czech inflation: The role of the trend and the cycle
WP 12/2019
Josef Bajzík
Tomáš Havránek
Zuzana Iršová
Jiří Schwarz
The elasticity of substitution between domestic and foreign goods:
A quantitative survey
WP 11/2019
Martin Hodula
Simona Malovaná
Jan Frait
Too much of a good thing? Households’ macroeconomic conditions
and credit dynamics
WP 10/2019
Martin Hodula
Simona Malovaná
Jan Frait
Introducing a new index of households’ macroeconomic conditions
WP 9/2019
Jiří Panoš
Petr Polák
How to improve the model selection procedure within a stress testing
framework?
WP 8/2019
Sebastian Gechert
Tomáš Havránek
Death to the Cobb-Douglas production function? A quantitative survey
of the capital-labor substitution elasticity

Zuzana Iršová
Dominika
Kolcunová
WP 7/2019 Alexis Derviz Coexistence of physical and crypto assets in a stochastic endogenous
growth model
WP 6/2019 Dominika
Ehrenbergerová
Simona Malovaná
Introducing macro-financial variables into semi-structural model
WP 5/2019 Martin Hodula Monetary policy and shadow banking: Trapped between a rock and
a hard place
WP 4/2019 Simona Malovaná
Žaneta Tesařová
Banks’ credit losses and provisioning over the business cycle:
Implications for IFRS 9
WP 3/2019 Aleš Bulíř
Jan Vlček
Monetary policy is not always systematic and data-driven: Evidence
from the yield curve
WP 2/2019 Dominika
Kolcunová
Simona Malovaná
The effect of higher capital requirements on bank lending: The capital
surplus matters
WP 1/2019 Jaromír Baxa
Tomáš Šestořád
The Czech exchange rate floor: Depreciation without inflation?
CNB Research and Policy Notes (since 2019)
RPN 3/2020 Simona Malovaná
Martin Hodula
Zuzana Rakovská
Researching the research: A central banking edition
RPN 2/2020 Simona Malovaná
Josef Bajzík
Dominika
Ehrenbergerová
Jan Janků
A prolonged period of low interest rates: Unintended consequences
RPN 1/2020 Simona Malovaná How to organize research in central banks: The Czech National
Bank's experience
RPN 4/2019 Tomáš Konečný
Lukáš Pfeifer
Macroprudential ring-fencing
RPN 3/2019 Petr Polák
Jiří Panoš
Impact of expectations on IFRS 9 loan loss provisions
RPN 2/2019 Jan Filáček
Ivan Sutóris
Inflation targeting flexibility: The CNB’s reaction function under
scrutiny
RPN 1/2019 Iveta Polášková
Luboš Komárek
Michal Škoda
The contemporary role of gold in central banks’ balance sheets

www.cnb.cz
CZECH NATIONAL BANK
Na Příkopě 28
115 03 Praha 1
Czech Republic
ECONOMIC RESEARCH DIVISION
Tel.: +420 224 412 321
Fax: +420 224 412 329
http://www.cnb.cz
e-mail: [email protected]
ISSN 1803-7097