researches on the impact of welding on the fatigue life · researches on the impact of welding on...
TRANSCRIPT
U.P.B. Sci. Bull., Series D, Vol. 75, Iss. 4, 2013 ISSN 1454-2358
RESEARCHES ON THE IMPACT OF WELDING ON THE FATIGUE LIFE
Claudiu BABIS1, Oana CHIVU2, Dan DOBROTA 3 Welding represents a manufacturing process widely used within all
branches of industry. It is worth mentioning that an increasing number of welded structures are subject to cyclic loads, responsible for the fatigue phenomenon. Hence, the paper aims at highlighting, in case of welded structures dynamically stressed, the impact of the welding manufacturing process on the fatigue life. Thus, the fatigue life for small wide plate samples was comparatively determined in three cases: samples with seam weld deposit; samples with ground seam weld deposits and samples without seam weld deposit. Once the fatigue tests completed and durability curves set, we reached some conclusions.
Key words: variable stresses; fatigue life; durability curves
1. Introduction
The studies carried out before nowadays have proved that the decrease of the fatigue strength of parts when being welded, occurs even if there is a high quality welding which does not change the flow of the power lines of that part [1], [2], [3]. The explanation consists in the fact that, during the welding, the thick layer of the melt additive material flows over the basic material, cools fast and does not have enough heat to efficiently melt the basic material [4], [5]. The melted layer solidifies quickly, the gas inclusions and impurities are not completely eliminated and they turn into power concentrators, which are more intense in the superficial layers of the deposited material, invisible from outside causing the decrease of the fatigue strength [7], [8]. The remaining stresss which inevitably appear in the welding process also contribute to the decrease of the fatigue strength [9]. Welds fatigue is a very complex phenomenon, because the welding strongly affects the basic material after the subsequent heating and cooling process, and the fusion process with the additive materials causes the apparition in the region of the weld seam of some inhomogeneous materials[10], [11], [12]. Furthermore, a welded joint is not lacking in defaults, since inclusions, pores, cavities etc. may often appear, forming power concentrators and causing a change in the behavior 1 Assistent Lecturer. PhD. Eng. POLITEHNICA University of Bucharest, Romania, Depart. of Materials and Welding Technologies, e-mail: [email protected], 2 Lecturer. PhD.Eng. POLITEHNICA University of Bucharest, Romania, Depart. of Materials and Welding Technologies, e-mail: [email protected], 3Proffesor Phd. Eng. CONSTANTIN BRANCUSI University of TG.-JIU, Romania, Depart. of Materials and Welding Technologies, e-mail: [email protected]
186 Claudiu Babis, Chivu Oana, Dan Dobrota
to fatigue of the welded joint. As a consequence of the structure of welded seams, fatigue failure does not occur in the welded seam but in the region thermally influenced in the basic material [13], [14]. Thus, the analyses to fatigue present a practical interest for all types of welded structures.On the other side, the progresses in this field in the last year's request the development of new methods of analyzing the behavior to fatigue taking into consideration the local geometry of the weld seam and the effects of the basic and additive materials[15], [16], [17], [18]. Regarding the behavior to fatigue of the welded joints, different methods of assessing the fatigue strength are presented, depending on the type of welded structure (vehicles, naval structures) [19], [20]. In addition, there have been recently developed a general analysis on the assessment of welded joints through local approaches, together with the analysis procedures and application examples [20], [21]. There are presented different approaches for the analysis to the fatigue of welded structures [21], which fall within the following categories: an approach which takes into account the nominal stress variation caused by external or internal loads and the properties related to the cross section, an approach which takes into account the structural stress variation, and also the discontinuity effect appearing in the welded joints.
2. Research methodology
The research conducted consists of a comparative analysis of three distinct cases of the fatigue life of some samples obtained by appropriate grinding of wide plate samples. The first case deals with seam weld deposit, the second case with ground seam weld deposit and, the third case is concerned with samples without seam weld deposits.
3. Shape and dimensions of samples
Fig. 2 illustrates the shape and dimensions of the samples to be subject to fatigue tests. Each sample I; II and III is obtained from a 7 mm thick, 30 mm wide and 390 mm long wideplate. The three samples I; II and III are made of common steel S235JR according to NF EN 10028-2.
The samples presented in Fig. 2 will bring about three samples of approximately 130 mm long and 5 mm wide, the width is obtained by previous mechanical grinding on both sides of the wideplate width. Once samples 1; 2 and 3 have been extracted, three sets of samples will be obtained as follows: set 1: I1; I2 and I3 corresponding to sample I; set 2: II1; II2 and II3, corresponding to sample II and set 3: III1;III2 and III3, corresponding to sample III. A stress variation ΔF1=±10 KN; ΔF2=±8 KN and ΔF3=± 6,5 KN respectively will be applied to samples 1; 2 and 3 corresponding to each sample/set in order to obtain a durability curve for each of the sample/set.

Researches on the impact of welding on the fatigue life 187
a b c
Fig.2 Shape and dimensions of weld deposited samples The stress cycle will be alternating and symmetric and the stress factor is a
tensile-pressure type. Once the durability curves marked on each sample, comparisons and analyses will be made of the impact of weld depositing process, grinding and non weld deposited bead on fatigue life.
Fig. 3 shows the shape and dimensions of samples 1; 2 and 3, as resulted from samples I; II and III as mentioned above.
a b c
Fig. 3 Shape and dimensions of samples dynamically stressed a –samples with seam weld deposit; b – samples with ground seam weld deposit; c – samples without seam weld deposit The samples I; II and III differ on the way they are obtained, as follows: -the first sample set I1; I2 and I3 respectively, corresponding to the first
sample I is obtained from a 7 X 30 X 390 mm wideplate with cycling weld deposition, by means of a manual welding SMEI covered electrode procedure, a 3 mm thick, 15 mm wide and 390 long weld bead, the resulting dimension of the samples obtained being 10 X 5 X 130 mm. A 10 mm tickness is achieved since 3 more mm are added to the initial 7 mm tickness of the wideplate.
-the second sample set II1; II2 and II3 respectively, corresponding to sample II, is obtained similarly, in addition, the 3 mm weld bead will be ground on the surface of the wideplate and the final dimension of the samples obtained is
188 Claudiu Babis, Chivu Oana, Dan Dobrota
7 X 5 X 130 mm. A 7 mm thickness is achieved since the final 10 mm thickness of the wideplate after welding is reduced to 7 mm as a result of grinding.
- the third sample set III1; III2 and III3 respectively, corresponding to sample III, is obtained from the same 7 X 30 X 400 mm wideplate, without seam welding and the final dimension of the samples obtained is 7 X 5 X 130 mm. A 7 mm thickness is achieved since, in this case, there is no seam weld deposit on the wideplate.
4. The Welding Parameters
In the case of welding deposits as applied to samples I and II, SUPERBAZ E 7018 electrodes were used, in conformity with AWS A5.1, with a 3.25 mm electrode wire diameter. Tabel 1 indicates the weld deposit parameters corresponding to samples I and II.
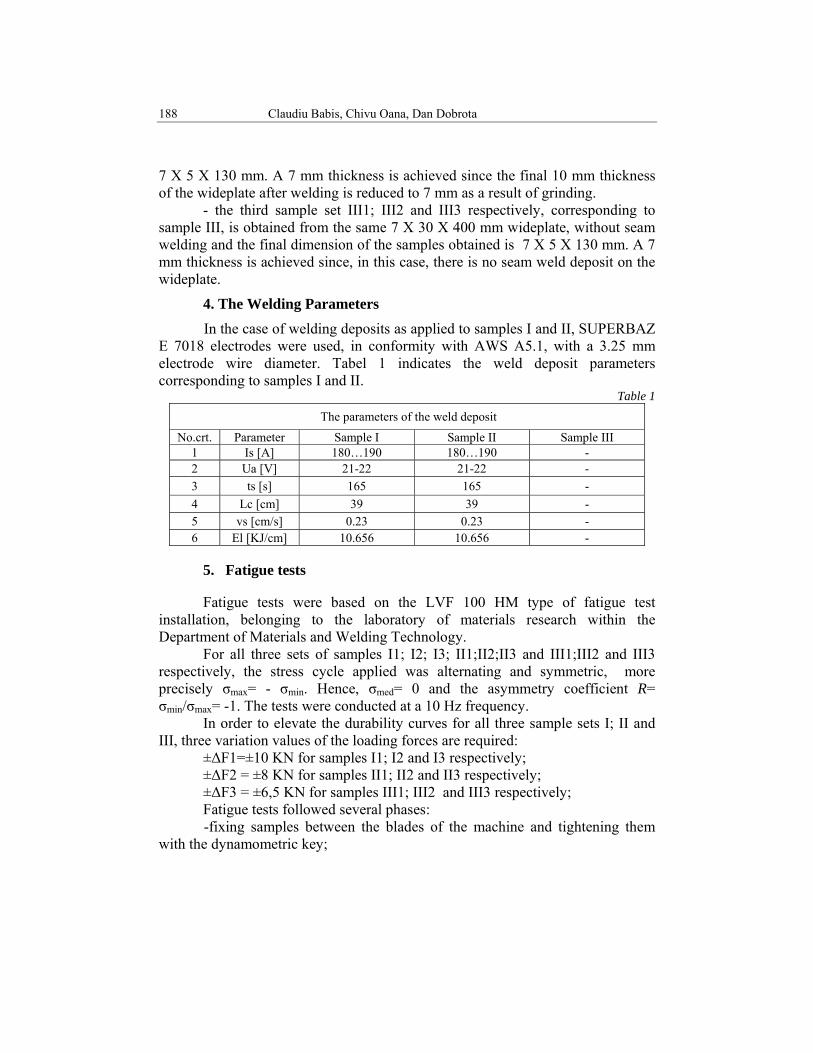
Table 1 The parameters of the weld deposit
No.crt. Parameter Sample I Sample II Sample III 1 Is [A] 180…190 180…190 - 2 Ua [V] 21-22 21-22 - 3 ts [s] 165 165 - 4 Lc [cm] 39 39 - 5 vs [cm/s] 0.23 0.23 - 6 El [KJ/cm] 10.656 10.656 -
5. Fatigue tests
Fatigue tests were based on the LVF 100 HM type of fatigue test installation, belonging to the laboratory of materials research within the Department of Materials and Welding Technology.
For all three sets of samples I1; I2; I3; II1;II2;II3 and III1;III2 and III3 respectively, the stress cycle applied was alternating and symmetric, more precisely σmax= - σmin. Hence, σmed= 0 and the asymmetry coefficient R= σmin/σmax= -1. The tests were conducted at a 10 Hz frequency.
In order to elevate the durability curves for all three sample sets I; II and III, three variation values of the loading forces are required:
±ΔF1=±10 KN for samples I1; I2 and I3 respectively; ±ΔF2 = ±8 KN for samples II1; II2 and II3 respectively; ±ΔF3 = ±6,5 KN for samples III1; III2 and III3 respectively; Fatigue tests followed several phases:
-fixing samples between the blades of the machine and tightening them with the dynamometric key;
Researches on the impact of welding on the fatigue life 189
- selection of the loading variation program, of the loading stress cycle and work frequency. Stress variations as above mentioned: ±ΔF1=±10 KN; ±ΔF2 = ±8 KN and ±ΔF3 = ±6,5 KN, the stress cycle was alternative and symmetric and the frequency was 10 Hz; - extraction of frames during trials that show the number of cycle left until the cracking moment; Then, the data were collected and the durability curves were processed by means of “Math Cad” program.
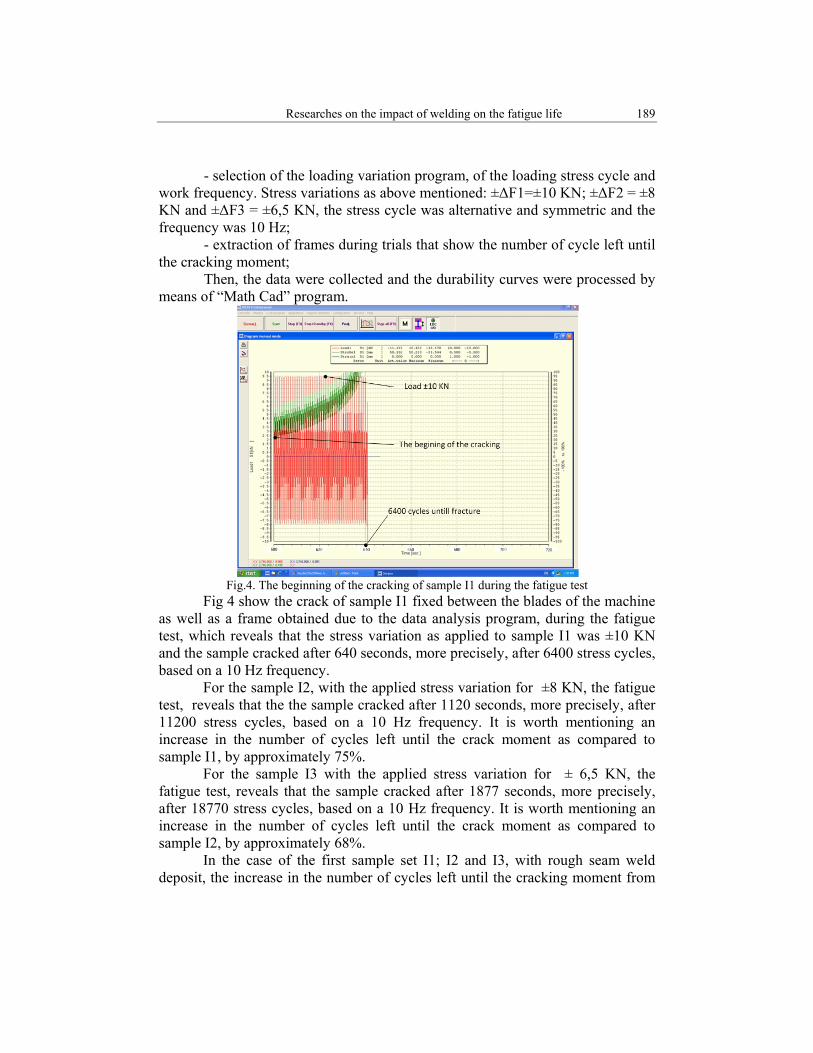
Fig.4. The beginning of the cracking of sample I1 during the fatigue test
Fig 4 show the crack of sample I1 fixed between the blades of the machine as well as a frame obtained due to the data analysis program, during the fatigue test, which reveals that the stress variation as applied to sample I1 was ±10 KN and the sample cracked after 640 seconds, more precisely, after 6400 stress cycles, based on a 10 Hz frequency.
For the sample I2, with the applied stress variation for ±8 KN, the fatigue test, reveals that the the sample cracked after 1120 seconds, more precisely, after 11200 stress cycles, based on a 10 Hz frequency. It is worth mentioning an increase in the number of cycles left until the crack moment as compared to sample I1, by approximately 75%.
For the sample I3 with the applied stress variation for ± 6,5 KN, the fatigue test, reveals that the sample cracked after 1877 seconds, more precisely, after 18770 stress cycles, based on a 10 Hz frequency. It is worth mentioning an increase in the number of cycles left until the crack moment as compared to sample I2, by approximately 68%.
In the case of the first sample set I1; I2 and I3, with rough seam weld deposit, the increase in the number of cycles left until the cracking moment from

190 Claudiu Babis, Chivu Oana, Dan Dobrota
6400 cycles for I1 until 18770 for I3 accounts for a decrease in stress variation as applied to the samples, from ±10 KN to ±6,5 KN.
Moreover, research was conducted to analyze the variation of cycles until the cracking moment provided the samples II1; II2 and II3, similar to samples I1; I2 and I3 in shape and dimensions, are subject to grinding, thus, reducing the crack area from 50 mm2 to 35 mm2 – as shown in Figs. 3 a and b.
Fig.5. The beginning of the cracking of sample II1 during the fatigue test
As a consequence, figure5 illustrate the cracking moment of sample II1 fixed between the blades of the machine as well as a frame obtained due to the data analysis program, during the fatigue test, which reveals that the stress variation as applied to sample II1 was ±10 KN and the sample cracked after 821 seconds, more precisely, after 8210 stress cycles, based on a 10 Hz frequency. It is worth mentioning an increase in the number of cycles left until the cracking moment of sample II1 (with ground seam weld bead and an reduced area of 35 mm 2) as compared to sample II1, by approximately 28%.
In conclusion, even if the crack area for sample II1 has been reduced, the number of cycles left until the cracking moment has grown due to the fact there is no longer a ground weld bead.
For the sample II2 with the applied stress variation for ± 8 KN, the fatigue test, reveals that sample cracked after 1460 seconds, more precisely, after 14600 stress cycles, based on a 10 Hz frequency. It is worth mentioning an increase in the number of cycles left until the cracking moment of sample II2 as compared to sample I2, by approximately 30%.
Simillary for the sample II3 with the applied stress variation for ± 6,5 KN, the fatigue test reveals that the sample cracked after 2413 seconds, more precisely, after 24130 stress cycles, based on a 10 Hz frequency. It is worth mentioning an

Researches on the impact of welding on the fatigue life 191
increase in the number of cycles left until the crack moment of sample II3 as compared to sample I3, by approximately 28%.
It is worth mentioning the fact that by reducing the grinding area as in the case of sample set II as compared to sample set I, there is a growth of resistance to fatigue by approximately 30 % .
The figure 6 shows that the stress variation as applied to sample III1 was ±10 KN and the sample cracked after 920 seconds, more precisely, after 9200 stress cycles, based on a 10 Hz frequency. It is worth mentioning an increase in the number of cycles left until the crack moment of sample III1 as compared to sample II1, by approximately 28% and by 44% as compared to sample I1, with a grinding area reduced from 50 mm2 to 30 mm2, there is no weld bead.
For sample III 2 with the applied stress variation for ± 8 KN, the fatigue test reveals that the sample cracked after 1618 seconds, more precisely, after 16180 stress cycles, based on a 10 Hz frequency. It is worth mentioning an increase in the number of cycles left until the crack moment of sample III2 as compared to sample II2, by approximately 10% and by 44% as compared to sample I2, with a grinding area reduced from 50 mm2 to 30 mm2, there is no weld bead.
Also, for the sample III 3 with the applied stress variation for ± 6,5 KN the fatigue test reveals that the sample cracked after 2682 seconds, more precisely, after 26820 stress cycles, based on a 10 Hz frequency. It is worth mentioning an increase in the number of cycles left until the crack moment of sample III3 as compared to sample II3, by approximately 10% and by 44% as compared to sample I3, with a grinding area reduced from 50 mm2 to 30 mm2, there is no weld bead.
Fig.6. The beginning of the cracking of sample III1 during the fatigue test

192 Claudiu Babis, Chivu Oana, Dan Dobrota
6. Research results
Table 2 presents all data collected during fatigue tests for all the nine samples, of which: three them - seam welded based ( I1; I2; I3), another three - ground seam welded based ( II1; II2; II3 ) and the last three – no seam welded based ( III1; III2; III3).
Table 2 Fatigue tests data
No. Sample status Reference F [Hz] ±ΔF Duration [s] N 1 seam welded
based
I1
10
±ΔF1=±10 640 6400 2 I2 ±ΔF2=±8 1120 11200 3 I3 ±ΔF2=±6,5 1877 18770 4 Ground seam
welded based
II1 ±ΔF1=±10 821 8210 5 II2 ±ΔF2=±8 1460 14600 6 II3 ±ΔF2=±6,5 2413 24130 7 No seam welded
based
III1 ±ΔF1=±10 920 9200 8 III2 ±ΔF2=±8 1618 16180 9 III3 ±ΔF2=±6,5 2682 26820
References in Tabel 2 indicate: F-frequency; ±ΔF variation of stress applied; N-number of cycles left until cracking moment.
As shown in the table above, taken as an example the unwelded samples (III1; III2; III3), resistance to fatigue drops by approximately:
- 10 % in case of ground seam weld deposit II1; II2 and II3; - 40% in case of rough seam weld deposit III1; III2 and III3. The results prove a negative impact of the weld bead deposited on the
sample surface. This impact is reduced by approximately 30% provided the respective weld bead is ground as compared to the latter case. Thus, we can admit that this grinding process of the weld bead can be considered as an improvement technique of fatigue life.
7. Marking durability curves
The durability curve (σ f n - Wohler’s curve) for steels can be approximated according to logarithmic scales (lg-lg), in the form of a logarithmic regression expressed as:
(1)where: lg A is the junction point between the curve and the vertical axis; 1/p – inclination of the straight line; Δσ - variation of stress due to variation of force exerted between a maximum and a minimum; n- number of cycles.
Equation (1) can be also depicted as: (2)
If lgA ha a certain value r, then, equation (2 ) becomes ( 3 ). 10 (3)

Researches on the impact of welding on the fatigue life 193
10
(4)
Equation (4) represents the variation of the durability curve based on linear coordinates.
By means of Mathcad program, for samples I1; I2 and I3, we have obtained the values p=2 and r=5.83, for which the graph of the function σI n reaches the test points of the type I samples, aI= (6400; 11200; 18770) and f1=( 10; 8 6)-Fig. 7.
In the case of the sample set II1; II2; II3, ground seam weld based, the Mathcad program obtained the following values p=2 and r= 5.94 for which the graph of the function ΔσII n , reaches the test points aII= ( 8210; 14600; 24130) and f2=( 10; 8; 6)-Fig. 8.
Fig.7 Durability curve in linear coordinates for samples I1; I2 and I3; material S235JR; symmetric cycle- σmed= 0; σmax= - σmin; R= -1; frequency=10 Hz
Fig.8 Durability curve in linear coordinates for samples II1; II2 si II3; material S235JR; symmetric cycle- σmed= 0; σmax= - σmin; R= -1; frequency=10 Hz

194 Claudiu Babis, Chivu Oana, Dan Dobrota
Fig. 9 Durability curve in linear coordinates for samples III1; III2 and III3; material
S235JR; symmetric cycle- σmed= 0; σmax= - σmin; R= -1; frequency=10 Hz.
For the third sample set III1; III2; III3, no seam welded based, the Mathcad program obtained the following values p=2 and r= 6 for which the graph of the function ΔσIII n reaches the test points aIII= ( 9200; 16180; 26820) and f3=( 10; 8; 6)-Fig. 9.
The linear configuration of all the three functions σI n , σII n and σIII n is shown in Fig. 10
Fig. 10 Durability curves in linear coordinates for samples -rough seam welded
based – I1; I2; I3 (red); ground seam welded based – II1; II2; II3 ( blue ); no seam welded based– III1; III2; III3 ( green );
material S235JR; symmetric cycle- σmed= 0; σmax= - σmin; R= -1; frequency=10 Hz

Researches on the impact of welding on the fatigue life 195
8. Conclusions
Fig. 7 indicate that for a certain stress variation value, drawing a parallel to the horizontal axis, samples without a seam welded base III1; III2 III3 (green curve) record the greatest number of stress cycles left until the cracking moment.
For the same stress variation value, on the same parallel to the horizontal axis, samples II1; II2; II3 (blue curve) with a ground seam welded base, resist to a smaller number of stress cycles until cracking (by approximately 10%) as compared to samples III1; III2 and III3 a seam welded base.
Regarding the rough seam welded based samples, resistance to fatigue is by 30% lower as compared to ground seam welded based samples II1; II2 and II3 and by approximately 40 % lower as compared to the samples with no seam welded base III1; III2 and III3 respectively.
It becomes noteworthy the fact that the existence of a weld bead on a machine part exerts a negative effect on the number of cycles until cracking, reduced to almost 40% as compared to the situation in which the machine part is not seam welded based. This reduction of fatigue life when welding is applied occurs even if the welding is of high quality and does not modify the forces within the respective machine part. This is due to the fact that, during welding, the thin layer of the melted material drips over the original material, cools off quickly and it is not hot enough to melt the original material. Hence, there is no proper welding, the melted layer hardens quickly, gases and pollutants are not entirely exhausted and they transform into stress concentrators highly visible in the faying surface of the weld deposits but invisible from the exterior and lead to fatigue resistance. Furthermore, welding residual stresses also reduce resistance to fatigue, when a weld bead is applied. By processing both the machine part and the welded bead, cutting off a few millimiters, most of these defects are eliminated (representing the stress concentrators), thus, the machine part becomes more resistant to fatigue.
R E F E R E N C E S
[1] C. Lindgren, J.O. Sperle, M. Jonsson, “Fatigue strength of spot welded beams in ligh strength steels”, Welding in the World, vol 37,1996, pp. 90-104.
[2] P. Lazzarin, F. Berto, D. Radaj,” Fatigue testing of welded joints of local criteria: a comparison between the fictitious notch radius-based criterion and the criterion involving strain energy density in a finite volume”, Welding International vol.22, 2008, pp. 635-640.
[3] Z-G. Xiao, K. Yamada, A method of determining geometric stress for fatigue strength evaluation of steel welded joints. International Journal of Fatigue, vol. 26, 2004, pp. 1277-1293 .
[4] W. Fricke, “ Fatigue analysis of welded joints: state of development”, Marine structures vol. 16, 2003, pp. 185-200.
[5] A. Ohta, T. Mawari, “ Fatigue strength of butt welded Al-Mg aluminium alloy: tests with maximum stress at yield strength”, Fatigue & Fracture of Engineering Materials & Structures, vol.13, 1990, pp. 53-58.

196 Claudiu Babis, Chivu Oana, Dan Dobrota
[6] P-C. Wang, K. W. Ewing, ” Fracture mechanics analysis of fatigue resistance of spot welded coach-peel joints”, Fatigue & Fracture of Engineering Materials & Structures, vol. 14, 1991, pp. 915-930.
[7] M. Czechowsk, “Low-cycle fatigue of friction stir welded Al-Mg alloys”, Journal of Materials Processing Technology, vol.1, 2005, pp.164-165.
[8] T. Partanen, E. Niemi, “Hot spot stress approach to fatigue strength analysis welded components: Fatigue test data for steel plate thicknesses up to 10 mm”, Fatigue & Fracture of Engineering Materials & Structures, vol.19,1996, pp. 709-722.
[9] G. Bussu, P.E. Irving, “The role of residual stress and heat affected zone properties on fatigue crack propagation in friction stir welded 2024-T351 aluminium joints”, International Journal of Fatigue, vol.25, 2003, pp.77-88.
[10] C-H. Lee, K-H. Chang, G-C. Jang, C-Y Lee, “ Effect of welded geometry on the fatigue life of non-load-carrying fillet welded cruciform joints”, Engineering Failure Analysis, vol.16, 2009, pp. 849-855.
[11] S. Han, B. Shin, “The use of hot spot stress for estimating the fatigue strength of welded components”, Steel research, vol.71, 200, pp.466-473.
[12] M. Fermer, H. Svensson, “ Industrial experiences of FE-based fatigue life predictions of welded automotive structures”, Fatigue & Fracture of Engineering Materials & Structures, vol.24, 2001, pp.489-500.
[13] O. Akihiko, M. Toshio, S. Naouyuki, “ Evaluation of effect of plate thickness on fatigue strength of butt welded joints by a test maintaining maximum stress at yield strength”, Engineering Fracture, vol.37, 1990, pp.987-993.
[14] T.M. Roberts, O Dogan, “ Fatigue of welded stud shear connectors in steel-concrete-steel sandwich beams”, Journal of Constructional Steel Research, vol.45, 1998, pp.301-320.
[15] B. Chang, Y. Shi, L. Lu, “ Studies on the stress distribution and fatigue behavior of welded-bonded lap shear joints”, Journal of Materials Processing Technology, vol.108, 2001, pp.307-313.
[16] D. Zivkovic, B. Anzulovic, “ The fatigue of 5083 aluminium alloy welds with the shot-peened crater hot cracks’, Materials & Design, vol.26, 2005, pp. 247-250.
[17] S. Barter, L. Molent, S. Goldsmith, R. Jones, “ An experimental evaluation of fatigue crack growth “, Engineering Failure Analysis, vol.12, 2005, pp. 99-128.
[18] V. Dattoma, C. Pappalettere, “ Local strain for fatigue strength of welded structures, Journal of Strain Analysis for Engineering Design, vol.36, 2001, pp. 605-610.
[19] F. Lefebvre, S. Ganguly, I. Sinclai, “ Micromechanical aspects of fatigue in a MIG welded aliminium airframe alloy- Part 1” Microstructural Characterization, Material Science and Engineering, vol.397, 2005, pp. 338-445.
[20] D. P. Kihl, S. Sarkani, “ Mean stress effects in fatigue of welded steel joints. Probabilistic Engineering “, Mechanics, vol. 14, 1999, pp.97-104.
[21] G. Wang, M.E. Barkey, “ Fatigue cracking and its influence on dynamic response characteristics of spot welded samples”, Experimental Mechanics, vol.44, 2004, pp.512-521.