researcharticle population-basedincidenceratesof ... · diarrhea patients who visited non-study...
TRANSCRIPT

RESEARCH ARTICLE
Population-Based Incidence Rates ofDiarrheal Disease Associated with Norovirus,Sapovirus, and Astrovirus in KenyaKayoko Shioda1,2*, Leonard Cosmas3, Allan Audi4, Nicole Gregoricus1, Jan Vinjé1, UmeshD. Parashar1, Joel M. Montgomery3, Daniel R. Feikin3¤a, Robert F. Breiman3¤b, Aron J. Hall1
1 Division of Viral Diseases, National Center for Immunization and Respiratory Diseases, Centers forDisease Control and Prevention, Atlanta, Georgia, United States of America, 2 Oak Ridge Institute forScience and Technology, Oak Ridge, Tennessee, United States of America, 3 Division of Global HealthProtection, Center for Global Health, Centers for Disease Control and Prevention, Nairobi, Kenya, 4 KenyaMedical Research Institute, Center for Global Health Research, Nairobi, Kenya
¤a Current address: Division of Viral Diseases, National Center for Immunization and Respiratory Diseases,Centers for Disease Control and Prevention, Atlanta, Georgia, United States of America¤b Current address: Emory Global Health Institute, Emory University, Atlanta, Georgia, United States ofAmerica* [email protected]
Abstract
Background
Diarrheal diseases remain a major cause of mortality in Africa and worldwide. While the bur-
den of rotavirus is well described, population-based rates of disease caused by norovirus,
sapovirus, and astrovirus are lacking, particularly in developing countries.
Methods
Data on diarrhea cases were collected through a population-based surveillance platform
including healthcare encounters and household visits in Kenya. We analyzed data from
June 2007 to October 2008 in Lwak, a rural site in western Kenya, and from October 2006
to February 2009 in Kibera, an urban slum. Stool specimens from diarrhea cases of all ages
who visited study clinics were tested for norovirus, sapovirus, and astrovirus by RT-PCR.
Results
Of 334 stool specimens from Lwak and 524 from Kibera, 85 (25%) and 159 (30%) were pos-
itive for norovirus, 13 (4%) and 31 (6%) for sapovirus, and 28 (8%) and 18 (3%) for astro-
virus, respectively. Among norovirus-positive specimens, genogroup II predominated in
both sites, detected in 74 (87%) in Lwak and 140 (88%) in Kibera. The adjusted community
incidence per 100,000 person-years was the highest for norovirus (Lwak: 9,635; Kibera:
4,116), followed by astrovirus (Lwak: 3,051; Kibera: 440) and sapovirus (Lwak: 1,445;
Kibera: 879). For all viruses, the adjusted incidence was higher among children aged <5
years (norovirus: 22,225 in Lwak and 17,511 in Kibera; sapovirus: 5,556 in Lwak and 4,378
PLOSONE | DOI:10.1371/journal.pone.0145943 April 25, 2016 1 / 20
OPEN ACCESS
Citation: Shioda K, Cosmas L, Audi A, Gregoricus N,Vinjé J, Parashar UD, et al. (2016) Population-BasedIncidence Rates of Diarrheal Disease Associated withNorovirus, Sapovirus, and Astrovirus in Kenya. PLoSONE 11(4): e0145943. doi:10.1371/journal.pone.0145943
Editor: Rodney D Adam, Aga Khan UniversityHospital Nairobi, KENYA
Received: June 26, 2015
Accepted: December 10, 2015
Published: April 25, 2016
Copyright: This is an open access article, free of allcopyright, and may be freely reproduced, distributed,transmitted, modified, built upon, or otherwise usedby anyone for any lawful purpose. The work is madeavailable under the Creative Commons CC0 publicdomain dedication.
Data Availability Statement: All data are notavailable in our manuscript because they containpersonally identifiable information. To protectparticipant confidentiality, a redacted version of thestudy data are available upon request, and thecorresponding author (Kayoko Shioda) will be thecontact for requesting data ([email protected]).
Funding: This research was supported by anappointment to the Research Participation Programat the Centers for Disease Control and Preventionadministered by the Oak Ridge Institute for Science
in Kibera; astrovirus: 11,113 in Lwak and 2,814 in Kibera) compared to cases aged�5
years.
Conclusion
Although limited by a lack of controls, this is the first study to estimate the outpatient and
community incidence rates of norovirus, sapovirus, and astrovirus across the age spectrum
in Kenya, suggesting a substantial disease burden imposed by these viruses. By applying
adjusted rates, we estimate approximately 2.8–3.3 million, 0.45–0.54 million, and 0.77–0.95
million people become ill with norovirus, sapovirus, and astrovirus, respectively, every year
in Kenya.
IntroductionAlthough global deaths from diarrheal disease have decreased from 2.6 million to 1.3 millionbetween 1990 and 2013 [1], it remains a major health concern, particularly in Africa. Diarrhealillness was estimated to be one of the top causes of years of life lost in sub-Saharan Africa in2013, along with HIV/AIDS, lower respiratory infections, and malaria [1]. Young children areknown to be the most affected population, and there were an estimated 450 million diarrhealepisodes among children<5 years of age in 2010 in Africa [2]. The burden of rotavirus, whichremains the leading cause of severe diarrheal disease in children worldwide, has been well char-acterized in both developed and developing countries [3–8]. Although norovirus, sapovirus,and astrovirus are also recognized as contributors to diarrheal disease [9], population-basedrates of disease associated with these viruses are not available in sub-Saharan African countries.With the expected decline of rotavirus disease after vaccine implementation [10–13], monitor-ing for other diarrheal pathogens will be important to assess changes in their relative burden inorder to implement appropriate public health measures, especially in regions with high inci-dence of diarrheal diseases.
To help fill this gap, we aimed to estimate population-based rates of diarrheal illness associ-ated with norovirus, sapovirus, and astrovirus in Kenya. We used a unique active surveillancesystem for infectious disease syndromes implemented by the Kenya Medical Research Institute(KEMRI) and the United States Centers for Disease Control and Prevention (CDC) to achievethis goal.
Materials and Methods
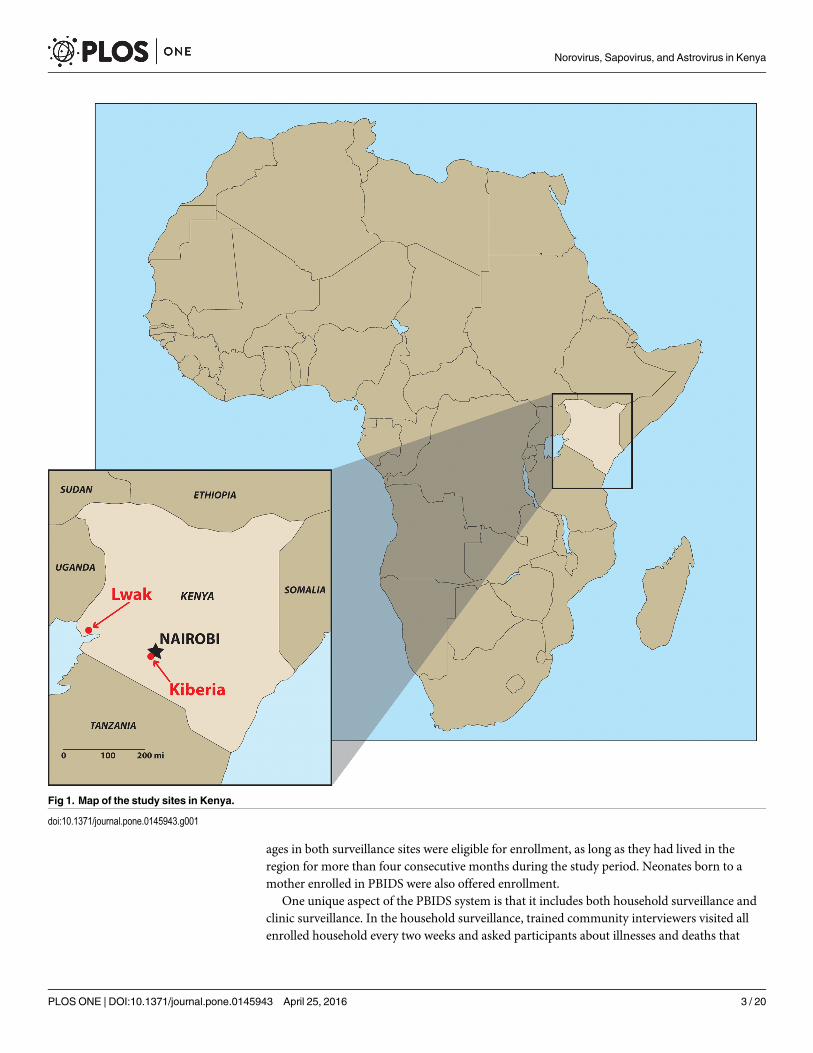
Population-based infectious disease surveillanceThe population-based infectious disease surveillance (PBIDS) system was launched in late2005 by CDC and KEMRI. The system encompassed two sites in Kenya: Lwak and Kibera (Fig1). Lwak is a rural location in Nyanza province (current Kisumu Country) near Lake Victoriain Western Kenya, which is one of the poorest areas in the country. Kibera is an urban slum inNairobi, which is the capital and the largest city in Kenya. The geographic characteristics ofthese surveillance areas have been described previously [14, 15]. The study periods for thisanalysis was from June 2007 to October 2008 (one year and five months) in Lwak and fromOctober 2006 to February 2009 (two years and five months) in Kibera.
The PBIDS system has been described in detail [15]. Briefly, it targets infectious disease syn-dromes, such as diarrheal disease, febrile illness, pneumonia, and jaundice. All residents of all
Norovirus, Sapovirus, and Astrovirus in Kenya
PLOS ONE | DOI:10.1371/journal.pone.0145943 April 25, 2016 2 / 20
and Education through an interagency agreementbetween the U.S. Department of Energy and CDC.
Competing Interests: The authors have declaredthat no competing interests exist.
ages in both surveillance sites were eligible for enrollment, as long as they had lived in theregion for more than four consecutive months during the study period. Neonates born to amother enrolled in PBIDS were also offered enrollment.
One unique aspect of the PBIDS system is that it includes both household surveillance andclinic surveillance. In the household surveillance, trained community interviewers visited allenrolled household every two weeks and asked participants about illnesses and deaths that
Fig 1. Map of the study sites in Kenya.
doi:10.1371/journal.pone.0145943.g001
Norovirus, Sapovirus, and Astrovirus in Kenya
PLOS ONE | DOI:10.1371/journal.pone.0145943 April 25, 2016 3 / 20

occurred since the last visit using standardized questionnaires. If a participant was absent orunable to answer the questions, a proxy who had the information of the participant’s healthwas interviewed. Mothers or other primary caretakers were interviewed if children were notable to answer the questions. Community interviewers also conducted focused physical examson sick participants during the visit. The exam consisted of measuring axillary temperatureand respiratory rate, evaluating for signs of respiratory distress in ill children, and observingsigns of dehydration. For the clinic surveillance, a centrally located health care facility was iden-tified in each study site, which was located within 5 km or 1 km of all people living in Lwak andKibera, respectively. All surveillance participants received free medical care at these study clin-ics for all acute infectious conditions. Detailed information was collected for all sick visits usingstructured questionnaires and specimens were collected from patients meeting case definitions(see below).
Specimen collection and diagnosticsAt the study clinics, stool specimens were collected from consenting patients of all ages whomet at least one of three criteria. The first criterion was uncomplicated diarrhea, which wasdefined as three or more loose stools within a 24-hour period, without signs or symptoms ofdehydration or dysentery. Because there were many patients meeting this criterion, a maxi-mum of six stool specimens were collected from patients with uncomplicated diarrhea per dayin each study site: three from patients�5 years of age and three from patients<5 years of age.The second criterion was having complicated diarrhea based on the presence of signs andsymptoms of dehydration, which was defined as drinking eagerly, being unable to drink orbreastfeed, emesis, slow capillary refill (two seconds or more), irritability, sunken eyes, lethargyor unconsciousness. In this group, stool specimens were attempted to be collected from all con-senting patients. The third criterion was having dysentery, which was defined as reported orvisible blood in one or more stool within 24 hours of clinic visit. We aimed to collect stool spec-imens from all patients meeting this criterion. If participants were unable to produce stool atthe clinic, patients were sent home with stool cups and instructions, and stool specimens werecollected from their homes within four hours of clinic visits.
The stool specimens were aliquoted at KEMRI-CDC laboratories in Kenya and stored at−80°C and then an aliquot from each patient was batch shipped to the CDC laboratory inAtlanta, Georgia, on dry ice to test for norovirus, sapovirus, and astrovirus. Viral nucleic acidwas extracted from stool suspensions according to the MagMAX-96 Viral RNA Isolation KITprotocol (Ambion, Austin, Texas) on the KingFisher instrument (Thermo Scientific, Vantaa,Finland). Viral nucleic acid was then tested for norovirus genogroup I and II, sapovirus, andastrovirus using TaqMan real-time reverse-transcription polymerase chain reaction (RT-qPCR) [16–20].
In addition to these three enteric viruses, stool specimens were tested for rotavirus using acommercially available enzyme immunoassay kit (Rotaclone, Meridian Premier, Charlotte,North Carolina), as previously described [21], and were cultured for Salmonella, Shigella, Cam-pylobacter, and Vibrio species by standard techniques [22].
Analysis of incidenceData were analyzed using SAS, version 9.3 (SAS Institute, Cary, North Carolina). Crude inci-dence was calculated as the number of diarrheal illness episodes with stool specimens testingpositive for norovirus, sapovirus, or astrovirus among PBIDS participants per 100,000 partici-pant person-years of observation (PYO). If a patient experienced multiple episodes of diarrheamore than 14 days apart from each other, we considered them as unique episodes and counted
Norovirus, Sapovirus, and Astrovirus in Kenya
PLOS ONE | DOI:10.1371/journal.pone.0145943 April 25, 2016 4 / 20

them separately in the numerator. PYO was calculated by dividing the sum of person-days forall participants who met the surveillance inclusion criteria by 365.25. A participant who movedaway from the surveillance area for longer than four consecutive months was not counted inthe denominator for calculation of PYO during or after the leave. If that person returned to thesurveillance area, he/she was not counted in denominator or numerator until confirmed to beliving in the surveillance area for at least four consecutive months and re-consented to partici-pate in the study.
To assess the seasonality of norovirus, sapovirus, and astrovirus-associated diarrheal ill-nesses, we calculated annualized crude incidence rates in each month as follows:
Annualized crude incidence per 100; 000 PYO in each month
¼ Average number of positive specimens in each monthPYO
� 12� 100; 000
In order to estimate incidence of the viral diarrhea cases at the outpatient and communitylevels, we applied three adjustment factors to the crude incidence rates to account for thepotentially undetected cases at the study clinics. The first adjustment factor was the proportionof patients whose stool specimens were submitted and tested among all diarrhea cases meetingstool-sampling criteria (PSS). This factor accounted for patients who visited the study clinicsand met the stool specimen collection criteria, but did not provide a specimen, and patientswhose specimens were excluded due to technical issues. The formula below shows how we cal-culated the adjusted incidence at the study clinic:
Study clinic incidence ¼ Crude incidencePSS
The second adjustment factor was the proportion of diarrhea patients who visited the studyclinic among diarrhea patients who visited any clinics including non-study clinics (PSC). Thedenominator of this proportion was obtained from the household surveillance, which detecteddiarrhea patients who visited non-study clinics. The outpatient incidence was calculated as fol-lows:
Outpatient incidence ¼ Crude incidencePSS � PSC
The third adjustment factor was the proportion of diarrhea patients who visited any clinicamong all diarrhea patients identified in the community, including those who did not seekmedical care (PMC). The household surveillance data enabled us to detect all diarrhea patientsin the study sites, and collect information as to whether they accessed any clinic, the determi-nants of which include a variety of factors. For example, the symptoms were not severe enoughto warrant a clinic visit, or simply people made a decision about accessing (or was able toaccess) a clinic, which may have been unrelated to illness severity. The community incidencewas defined as follows:
Community incidence ¼ Crude incidencePSS � PSC � PMC
These adjusted incidence rates and their respective 95% credible intervals (CI) were com-puted using Monte Carlo simulation. We constructed a normal distribution around each ofthree adjustment factors based on their numerators and denominators, and randomly selectedone value from each of the distributions. The crude incidence rates were then divided by these
Norovirus, Sapovirus, and Astrovirus in Kenya
PLOS ONE | DOI:10.1371/journal.pone.0145943 April 25, 2016 5 / 20

selected values. This process was repeated 100,000 times and the median was reported as thepoint estimate of adjusted incidence and 2.5th and 97.5th percentile as the 95% CI.
Ethical approvalsWritten informed consent was obtained for data collection at the clinics and households. Theprotocol, surveillance questionnaires and consent forms were reviewed and approved by theEthical Review Committee at KEMRI (protocol number 932 and 1899) and the InstitutionalReview Board of CDC-Atlanta (protocol number 4566).
Results
Characteristics of the study populationThe patients of this study submitted a total of 336 and 558 stool specimens in Lwak and Kibera,respectively, during the study periods. In Lwak, two stool specimens were excluded from analy-sis, because these specimens were collected within 14 days since the collection of the initialspecimens from the same patients and, thus, considered part of the same episode. In Kibera, atotal of 34 stool specimens were excluded from the analysis; 33 were excluded because of miss-ing date of birth, date of specimen collection, or patient ID number, and one was excludedbecause it was collected within 14 days of another specimen from the same patient. Thus, atotal of 334 and 524 stool specimens representing unique episodes of diarrhea were included inthe analysis in Lwak and Kibera, respectively. Of these, 18 and 27 patients experienced morethan one unique episode of diarrhea during the study periods in Lwak and Kibera, respectively.
Both genders were well represented among the study populations in both sites; 155 (46%)and 257 (49%) episodes of diarrhea were observed among males in Lwak and Kibera, respec-tively. The surveillance participants in Lwak were older (median age 27.0 years, range 0–85years) than Kibera (median age 9.6 years, range 0–67 years). Children<5 years of age repre-sented 19% of the study population in Lwak and 40% in Kibera.
Prevalence of enteric pathogensIn both study sites, norovirus was the most common etiology, detected in 85 (25%) of 334 spec-imens in Lwak and 159 (30%) of 524 specimens in Kibera (Table 1). Among norovirus positivespecimens, genogroup (G) II predominated in both sites, detected in 74 (87%) in Lwak and 140(88%) in Kibera. Coinfection with GI and GII was found in 6 (7%) norovirus-positive speci-mens in Lwak and 14 (9%) in Kibera. Overall, the prevalence of sapovirus and astrovirus waslow (3–8%) in both study sites. Sapovirus was more prevalent than astrovirus in Kibera, whilethe opposite was found in Lwak. All viruses were more frequently detected among diarrheapatients aged<5 years compared to those�5 years of age in Kibera (p<0.05). The same trendwas observed in Lwak, but the difference between the two age groups was not statisticallysignificant.
As shown in Table 2, 311 specimens were positive for at least one of norovirus, sapovirus, orastrovirus. Of these, 28 (9%) and 82 (26%) also tested positive for rotavirus and bacteria,respectively. The proportion of rotavirus coinfection was the highest among patients with com-plicated diarrhea (9/50, 18%), while coinfection with bacteria occurred most frequently amongpatients with dysentery (40/84, 48%). Among the 82 specimens in which coinfections of bacte-ria and at least one of norovirus, sapovirus, or astrovirus were found, Shigella spp. (n = 65,79%) were most frequently identified, followed by Campylobacter spp. (n = 9, 11%), and Salmo-nella spp. (n = 7, 9%). Given the potential for asymptomatic (i.e., non-etiologic) detection of
Norovirus, Sapovirus, and Astrovirus in Kenya
PLOS ONE | DOI:10.1371/journal.pone.0145943 April 25, 2016 6 / 20

norovirus, sapovirus, and astrovirus, we excluded stool specimens from the numerator ofcrude incidence calculation if they were coinfected with rotavirus and/or bacteria.
Clinical profile of norovirus, sapovirus, and astrovirusThe patients with multiple enteric viruses were excluded from the analysis of the clinical profileof norovirus, sapovirus, and astrovirus infections. Uncomplicated diarrhea was most com-monly observed among the three types of diarrhea used as the stool collection criteria, followedby dysentery (Table 3). The majority of patients had 3–10 loose stools per day for 1–4 days,regardless of etiology. Vomiting and fever (temperature greater than 37.0°C) were observed inless than half of the patients. No significant difference in clinical profile was observed amongthe three different viral etiologies.
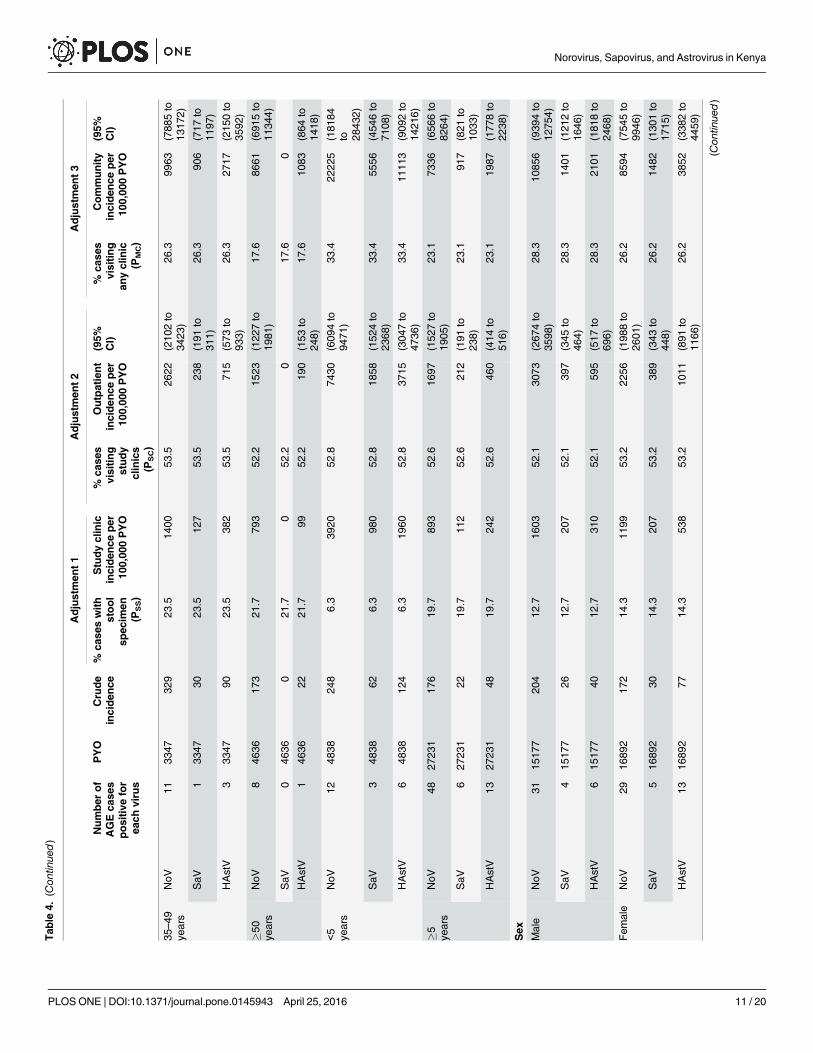
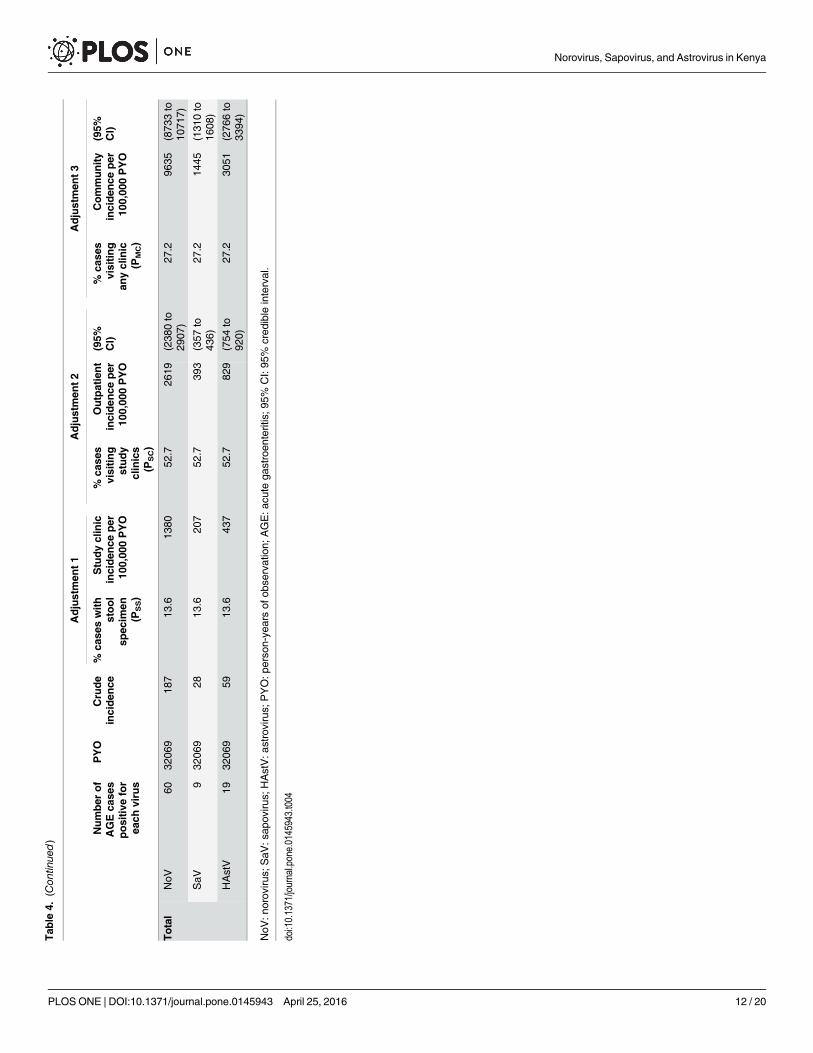
Crude and adjusted incidence of diarrheal illnessThe overall crude incidence rates of norovirus, sapovirus, and astrovirus-associated diarrhealillnesses were 187, 28, and 59 per 100,000 PYO in Lwak (Table 4) and 184, 39, and 20 per100,000 PYO in Kibera (Table 5). The crude incidence rates of all viruses were the highestamong children<12 months of age in both sites. As shown in Fig 2, there was no clear season-ality of crude incidence rates of diarrheal illness associated with these enteric viruses. Theannualized crude incidence of norovirus and astrovirus exhibited a large peak in November
Table 1. Demographic characteristics and detection of enteric viruses among patients with diarrhea, Lwak and Kibera, Kenya.
Lwak Kibera
Number ofunique
episodesof diarrhea
NoV GI + NoV GII + Any NoV + Sapovirus + Astrovirus + Number ofunique
episodesof diarrhea
NoVGI +
NoVGII +
AnyNoV +
Sapovirus + Astrovirus +
Agegroup,no. (%)
<12monhts
27 1 (4) 9 (33) 10 (37) 2 (7) 5 (19) 43 6 (14) 16 (37) 20 (47) 7 (16) 5 (12)
12–23months
20 2 (10) 4 (20) 6 (30) 0 (0) 2 (10) 52 5 (10) 15 (29) 16 (31) 4 (8) 5 (10)
24–59months
17 0 (0) 5 (29) 5 (29) 1 (6) 1 (6) 114 7 (6) 40 (35) 42 (37) 11 (10) 4 (4)
5–9years
19 2 (11) 4 (21) 5 (26) 0 (0) 4 (21) 57 3 (5) 13 (23) 16 (28) 5 (9) 2 (4)
10–17years
40 0 (0) 9 (23) 9 (23) 1 (3) 2 (5) 32 0 (0) 11 (34) 11 (34) 0 (0) 0 (0)
18–34years
98 7 (7) 20 (20) 25 (26) 8 (8) 6 (6) 149 8 (5) 34 (23) 40 (27) 3 (2) 1 (1)
35–49years
59 5 (8) 14 (24) 16 (27) 1 (2) 4 (7) 60 4 (7) 8 (13) 11 (18) 1 (2) 0 (0)
�50years
54 0 (0) 9 (17) 9 (17) 0 (0) 4 (7) 17 0 (0) 3 (18) 3 (18) 0 (0) 1 (6)
Gender,no. (%)
Male 155 5 (3) 42 (27) 46 (30) 7 (5) 10 (6) 257 14 (5) 65 (25) 72 (28) 17 (7) 7 (3)
Female 179 12 (7) 32 (18) 39 (22) 6 (3) 18 (10) 267 19 (7) 75 (28) 87 (33) 14 (5) 11 (4)
Total,no. (%)
334 17 (5) 74 (22) 85 (25) 13 (4) 28 (8) 524 33 (6) 140 (27) 159 (30) 31 (6) 18 (3)
NoV GI: norovirus genogroup I; NoV GII: norovirus genogroup II; +: positive.
doi:10.1371/journal.pone.0145943.t001
Norovirus, Sapovirus, and Astrovirus in Kenya
PLOS ONE | DOI:10.1371/journal.pone.0145943 April 25, 2016 7 / 20

and April, respectively, in Lwak, but a similar trend by month was not observed in Kibera. Theannualized crude incidence of sapovirus was low throughout the year in both sites.
The proportion of diarrhea patients with a stool specimen (PSS) was low in both sites (14%in Lwak and 12% in Kibera), and appeared to be even lower among younger children (Tables 4and 5). About half (53%) of the patients who sought medical attention in Lwak and 80% ofthem in Kibera presented at the study clinics (PSC). After adjusting the crude incidence rates byPSS and PSC, the overall outpatient incidence rates of norovirus, sapovirus, and astrovirus-asso-ciated diarrheal illnesses became 2,619, 393, and 829 per 100,000 PYO in Lwak and 1,937, 414,and 207 per 100,000 PYO in Kibera. In both sites, norovirus was the most prevalent among allage groups. The highest outpatient incidence rates for all viruses detected were observedamong children<12 months of age (Fig 3A). The outpatient incidence associated with detec-tion of norovirus decreased by 17% in Lwak and 62% in Kibera in children 12–23 months ofage compared to children<12 months of age.
Table 2. Detection of enteric pathogens stratified by stool specimen collection criteria, Kenya.
Uncomplicated diarrheaa Complicated diarrheab Dysenteryc
(n = 483) (n = 101) (n = 274)
Single infection, no. (%)
NoV 102 (21) 23 (23) 31 (11)
SaV 9 (2) 4 (4) 7 (3)
HAstV 12 (2) 6 (6) 4 (1)
RV 20 (4) 4 (4) 5 (2)
Bacteria 71 (15) 11 (11) 76 (28)
Coinfection, no. (%)
NoV + RV 6 (1) 5 (5) 1 (0)
NoV + Bacteria 25 (5) 2 (2) 24 (9)
NoV + RV + Bacteria 3 (1) 2 (2) 4 (1)
NoV + SaV 4 (1) 0 (0) 0 (0)
NoV + SaV + RV 0 (0) 1 (1) 0 (0)
NoV + SaV + Bacteria 1 (0) 1 (1) 1 (0)
NoV + SaV + HAstV 0 (0) 1 (1) 1 (0)
NoV + HAstV 0 (0) 1 (1) 0 (0)
NoV + HAstV + RV 2 (0) 1 (1) 0 (0)
NoV + HAstV + Bacteria 1 (0) 0 (0) 1 (0)
SaV + HAstV 3 (1) 2 (2) 0 (0)
SaV + RV 2 (0) 0 (0) 0 (0)
SaV + Bacteria 2 (0) 0 (0) 5 (2)
HAstV + RV 1 (0) 0 (0) 0 (0)
HAstV + Bacteria 4 (1) 1 (1) 5 (2)
RV + Bacteria 6 (1) 3 (3) 9 (3)
No pathogens detected, no. (%) 209 (43) 33 (33) 100 (36)
NoV: norovirus; SaV: sapovirus; HAstV: astrovirus; RV: rotavirus.
There were 19 specimens that lacked bacteria and/or rotavirus testing, and they are included in the table as bacteria negative and/or rotavirus negative.
Data from two study sites are combined in this table.a Uncomplicated diarrhea is defined as three or more loose stools within a 24-hour period, without signs or symptoms of dehydration or dysentery.b Complicated diarrhea is diarrhea with dehydration, which was defined as drinking eagerly, being unable to drink or breastfeed, emesis, slow capillary
refill (two seconds or more), irritability, sunken eyes, lethargy or unconsciousness.c Dysentery is defined as reported or visible blood in one or more stool within 24 hours of clinic visit.
doi:10.1371/journal.pone.0145943.t002
Norovirus, Sapovirus, and Astrovirus in Kenya
PLOS ONE | DOI:10.1371/journal.pone.0145943 April 25, 2016 8 / 20

The overall healthcare seeking rate for acute diarrheal illness (PMC) was lower in Lwak (27%)versus Kibera (47%) and decreased as age increased in both sites (Tables 4 and 5). By adjustingthe outpatient incidence rates by PMC, the overall community incidence rates per 100,000 PYO ofall viruses were found to be higher in Lwak (norovirus: 9,635; sapovirus: 1,445; astrovirus: 3,051)than in Kibera (norovirus: 4,116; sapovirus: 879; astrovirus: 440). Overall, the community inci-dence rates of all viruses were the highest among children aged<24 months and decreased asage increased (Fig 3B). In Kibera, the community incidence of all viruses were low among peopleaged�5 years, but an increase in norovirus was observed among people aged�50 years.
DiscussionTo our knowledge, this is the first study to estimate the outpatient and community incidencerates of norovirus, sapovirus, and astrovirus-associated diarrheal illnesses across the whole age
Table 3. Clinical profile of diarrheal patients by etiology, Kenya.
Norovirus Sapovirus Astrovirus
(n = 156) (n = 20) (n = 22)
No. (%) No. (%) No. (%)
Type of diarrhea
Uncomplicated Diarrheaa 102 (65) 9 (45) 12 (55)
Complicated Diarrheab 23 (15) 4 (20) 6 (27)
Dysenteryc 31 (20) 7 (35) 4 (18)
Diarrhea duration (days)
1–4 134 (86) 12 (60) 17 (77)
5 10 (6) 4 (20) 1 (5)
�6 12 (8) 4 (20) 4 (18)
Maximum number of stools in 24 hoursd
1–3 5 (9) 2 (33) 0 (0)
3–10 49 (89) 4 (67) 5 (100)
�11 1 (2) 0 (0) 0 (0)
Vomit
Yes 41 (35) 5 (42) 7 (35)
No 77 (65) 7 (58) 13 (65)
Maximum temperature (°C)
�37.0 117 (76) 15 (75) 13 (59)
37.1–38.4 26 (17) 3 (15) 6 (27)
38.5–38.9 4 (3) 0 (0) 1 (5)
�39.0 6 (4) 2 (10) 2 (9)
Dehydration
Yes 23 (15) 4 (20) 6 (27)
No 133 (85) 16 (80) 16 (73)
Patients with multiple enteric viruses were excluded from the table.
Data from two study sites are combined in this table.a Uncomplicated diarrhea is defined as three or more loose stools within a 24-hour period, without signs or symptoms of dehydration or dysentery.b Complicated diarrhea is diarrhea with dehydration, which was defined as drinking eagerly, being unable to drink or breastfeed, emesis, slow capillary
refill (two seconds or more), irritability, sunken eyes, lethargy or unconsciousness.c Dysentery is defined as reported or visible blood in one or more stool within 24 hours of clinic visit.d The data on maximum number of stool specimens was not available for Lwak.
doi:10.1371/journal.pone.0145943.t003
Norovirus, Sapovirus, and Astrovirus in Kenya
PLOS ONE | DOI:10.1371/journal.pone.0145943 April 25, 2016 9 / 20

Tab
le4.
Crudean
dad
justed
inciden
ceratesfornorovirus,
sapovirus,
andas
trovirus-as
sociated
diarrhea
lilln
ess,
Lwak
,Ken
ya.
Adjustmen
t1
Adjustmen
t2
Adjustmen
t3
Number
of
AGEca
ses
positive
for
each
virus
PYO
Crude
inciden
ce%
case
swith
stool
spec
imen
(PSS)
Studyclinic
inciden
ceper
100,00
0PYO
%ca
ses
visiting
study
clinics
(PSC)
Outpatient
inciden
ceper
100,00
0PYO
(95%
CI)
%ca
ses
visiting
anyclinic
(PMC)
Community
inciden
ceper
100,00
0PYO
(95%
CI)
Age
group
<12
mon
ths
NoV
510
4947
76.2
7700
54.3
1417
8(105
07to 21
589)
40.7
3490
0(256
69to 53
294)
SaV
210
4919
16.2
3080
54.3
5671
(420
3to
8635
)40
.713
960
(102
68to 21
318)
HAstV
310
4928
66.2
4620
54.3
8507
(630
4to
1295
3)40
.720
940
(154
02to 31
976)
12–23
mon
ths
NoV
495
342
07.0
5955
50.8
1173
6(848
6to
1866
3)33
.235
308
(254
77to 56
276)
SaV
095
30
7.0
050
.80
33.2
0
HAstV
295
321
07.0
2978
50.8
5868
(424
3to
9331
)33
.217
654
(127
38to 28
138)
24–59
mon
ths
NoV
328
3610
65.8
1822
53.1
3438
(241
2to
5892
)27
.712
423
(866
9to
2137
0)
SaV
128
3635
5.8
607
53.1
1146
(804
to19
64)
27.7
4141
(289
0to
7123
)
HAstV
128
3635
5.8
607
53.1
1146
(804
to19
64)
27.7
4141
(289
0to
7123
)
5–9
years
NoV
553
5793
11.6
804
50.5
1596
(113
1to
2621
)24
.465
54(459
1to
1086
0)
SaV
053
570
11.6
050
.50
24.4
0
HAstV
453
5775
11.6
643
50.5
1277
(905
to20
97)
24.4
5243
(367
3to
8688
)
10–17
years
NoV
866
6212
013
.588
753
.316
66(128
1to
2341
)23
.969
92(528
7to
9924
)
SaV
166
6215
13.5
111
53.3
208
(160
to29
3)23
.987
4(661
to12
41)
HAstV
166
6215
13.5
111
53.3
208
(160
to29
3)23
.987
4(661
to12
41)
18–34
years
NoV
1672
2922
124
.889
253
.116
82(141
9to
2053
)28
.958
32(483
8to
7166
)
SaV
472
2955
24.8
223
53.1
421
(355
to51
3)28
.914
58(121
0to
1792
)
HAstV
472
2955
24.8
223
53.1
421
(355
to51
3)28
.914
58(121
0to
1792
)
(Con
tinue
d)
Norovirus, Sapovirus, and Astrovirus in Kenya
PLOS ONE | DOI:10.1371/journal.pone.0145943 April 25, 2016 10 / 20
Tab
le4.
(Con
tinue
d)
Adjustmen
t1
Adjustmen
t2
Adjustmen
t3
Number
of
AGEca
ses
positive
for
each
virus
PYO
Crude
inciden
ce%
case
swith
stool
spec
imen
(PSS)
Studyclinic
inciden
ceper
100,00
0PYO
%ca
ses
visiting
study
clinics
(PSC)
Outpatient
inciden
ceper
100,00
0PYO
(95%
CI)
%ca
ses
visiting
anyclinic
(PMC)
Community
inciden
ceper
100,00
0PYO
(95%
CI)
35–49
years
NoV
1133
4732
923
.514
0053
.526
22(210
2to
3423
)26
.399
63(788
5to
1317
2)
SaV
133
4730
23.5
127
53.5
238
(191
to31
1)26
.390
6(717
to11
97)
HAstV
333
4790
23.5
382
53.5
715
(573
to93
3)26
.327
17(215
0to
3592
)
�50
years
NoV
846
3617
321
.779
352
.215
23(122
7to
1981
)17
.686
61(691
5to
1134
4)
SaV
046
360
21.7
052
.20
17.6
0
HAstV
146
3622
21.7
9952
.219
0(153
to24
8)17
.610
83(864
to14
18)
<5
years
NoV
1248
3824
86.3
3920
52.8
7430
(609
4to
9471
)33
.422
225
(181
84to 28
432)
SaV
348
3862
6.3
980
52.8
1858
(152
4to
2368
)33
.455
56(454
6to
7108
)
HAstV
648
3812
46.3
1960
52.8
3715
(304
7to
4736
)33
.411
113
(909
2to
1421
6)
�5 years
NoV
4827
231
176
19.7
893
52.6
1697
(152
7to
1905
)23
.173
36(656
6to
8264
)
SaV
627
231
2219
.711
252
.621
2(191
to23
8)23
.191
7(821
to10
33)
HAstV
1327
231
4819
.724
252
.646
0(414
to51
6)23
.119
87(177
8to
2238
)
Sex
Male
NoV
3115
177
204
12.7
1603
52.1
3073
(267
4to
3598
)28
.310
856
(939
4to
1275
4)
SaV
415
177
2612
.720
752
.139
7(345
to46
4)28
.314
01(121
2to
1646
)
HAstV
615
177
4012
.731
052
.159
5(517
to69
6)28
.321
01(181
8to
2468
)
Fem
ale
NoV
2916
892
172
14.3
1199
53.2
2256
(198
8to
2601
)26
.285
94(754
5to
9946
)
SaV
516
892
3014
.320
753
.238
9(343
to44
8)26
.214
82(130
1to
1715
)
HAstV
1316
892
7714
.353
853
.210
11(891
to11
66)
26.2
3852
(338
2to
4459
)
(Con
tinue
d)
Norovirus, Sapovirus, and Astrovirus in Kenya
PLOS ONE | DOI:10.1371/journal.pone.0145943 April 25, 2016 11 / 20
Tab
le4.
(Con
tinue
d)
Adjustmen
t1
Adjustmen
t2
Adjustmen
t3
Number
of
AGEca
ses
positive
for
each
virus
PYO
Crude
inciden
ce%
case
swith
stool
spec
imen
(PSS)
Studyclinic
inciden
ceper
100,00
0PYO
%ca
ses
visiting
study
clinics
(PSC)
Outpatient
inciden
ceper
100,00
0PYO
(95%
CI)
%ca
ses
visiting
anyclinic
(PMC)
Community
inciden
ceper
100,00
0PYO
(95%
CI)
Total
NoV
6032
069
187
13.6
1380
52.7
2619
(238
0to
2907
)27
.296
35(873
3to
1071
7)
SaV
932
069
2813
.620
752
.739
3(357
to43
6)27
.214
45(131
0to
1608
)
HAstV
1932
069
5913
.643
752
.782
9(754
to92
0)27
.230
51(276
6to
3394
)
NoV
:norov
irus;
SaV
:sap
oviru
s;HAstV:a
strovirus;
PYO:p
erso
n-ye
arsof
obse
rvation;
AGE:a
cute
gastroen
teritis;9
5%CI:95
%cred
ible
interval.
doi:10.1371/journal.pone.0145943.t004
Norovirus, Sapovirus, and Astrovirus in Kenya
PLOS ONE | DOI:10.1371/journal.pone.0145943 April 25, 2016 12 / 20

Tab
le5.
Crudean
dad
justed
inciden
ceratesfornorovirus,
sapovirus,
andas
trovirus-as
sociated
diarrhea
lilln
ess,
Kibera,
Ken
ya.
Adjustmen
t1
Adjustmen
t2
Adjustmen
t3
Number
of
AGEca
ses
positiv
efor
each
virus
PYO
Crude
inciden
ce%
case
swith
stool
spec
imen
(PSS)
Studyclinic
inciden
ceper
100,00
0PYO
%ca
ses
visiting
study
clinics
(PSC)
Outpatient
inciden
ceper
100,00
0PYO
(95%
CI)
%ca
ses
visiting
anyclinic
(PMC)
Community
inciden
ceper
100,00
0PYO
(95%
CI)
Age
group
<12
mon
ths
NoV
1615
4310
375.2
1978
576
.825
768
(209
30to 33
448)
57.2
4507
2(363
95to 58
670)
SaV
515
4332
45.2
6183
76.8
8053
(654
1to
1045
3)57
.214
085
(113
73to 18
334)
HAstV
515
4332
45.2
6183
76.8
8053
(654
1to
1045
3)57
.214
085
(113
73to 18
334)
12–23
mon
ths
NoV
1122
3749
26.1
8057
82.9
9718
(831
7to
1165
0)50
.019
452
(165
77to 23
420)
SaV
322
3713
46.1
2197
82.9
2650
(226
8to
3177
)50
.053
05(452
1to
6387
)
HAstV
322
3713
46.1
2197
82.9
2650
(226
8to
3177
)50
.053
05(452
1to
6387
)
24–59
mon
ths
NoV
2964
0645
310
.841
8083
.050
37(451
5to
5687
)43
.511
590
(103
11to 13
182)
SaV
664
0694
10.8
865
83.0
1042
(934
to11
77)
43.5
2398
(213
3to
2727
)
HAstV
164
0616
10.8
144
83.0
174
(156
to19
6)43
.540
0(356
to45
5)
5–9
years
NoV
1284
8514
117
.680
184
.794
6(809
to11
36)
44.1
2145
(180
4to
2615
)
SaV
584
8559
17.6
334
84.7
394
(337
to47
3)44
.189
4(752
to10
90)
HAstV
184
8512
17.6
6784
.779
(67to
95)
44.1
179
(150
to21
8)
10–17
years
NoV
885
8293
22.8
410
84.7
484
(400
to60
9)41
.011
86(946
to15
33)
SaV
085
820
22.8
084
.70
(0to
0)41
.00
(0to
0)
HAstV
085
820
22.8
084
.70
(0to
0)41
.00
(0to
0)
18–34
years
NoV
1920
698
9220
.544
773
.061
2(541
to70
4)42
.314
51(125
4to
1693
)
SaV
220
698
1020
.547
73.0
64(57to
74)
42.3
153
(132
to17
8)
HAstV
120
698
520
.524
73.0
32(28to
37)
42.3
76(66to
89)
(Con
tinue
d)
Norovirus, Sapovirus, and Astrovirus in Kenya
PLOS ONE | DOI:10.1371/journal.pone.0145943 April 25, 2016 13 / 20

Tab
le5.
(Con
tinue
d)
Adjustmen
t1
Adjustmen
t2
Adjustmen
t3
Number
of
AGEca
ses
positiv
efor
each
virus
PYO
Crude
inciden
ce%
case
swith
stool
spec
imen
(PSS)
Studyclinic
inciden
ceper
100,00
0PYO
%ca
ses
visiting
study
clinics
(PSC)
Outpatient
inciden
ceper
100,00
0PYO
(95%
CI)
%ca
ses
visiting
anyclinic
(PMC)
Community
inciden
ceper
100,00
0PYO
(95%
CI)
35–49
years
NoV
566
6075
25.5
294
67.8
435
(366
to52
7)39
.910
92(893
to13
61)
SaV
166
6015
25.5
5967
.887
(73to
105)
39.9
218
(179
to27
2)
HAstV
066
600
25.5
067
.80
(0to
0)39
.90
(0to
0)
�50
years
NoV
314
5820
618
.511
1279
.014
16(998
to23
10)
42.5
3347
(224
7to
5630
)
SaV
014
580
18.5
079
.00
(0to
0)42
.50
(0to
0)
HAstV
014
580
18.5
079
.00
(0to
0)42
.50
(0to
0)
<5
years
NoV
5610
187
550
7.9
6981
81.1
8604
(790
8to
9427
)49
.117
511
(160
42to 19
250)
SaV
1410
187
137
7.9
1745
81.1
2151
(197
7to
2357
)49
.143
78(401
1to
4812
)
HAstV
910
187
887.9
1122
81.1
1383
(127
1to
1515
)49
.128
14(257
8to
3094
)
�5 years
NoV
4745
883
102
20.9
491
77.3
636
(588
to69
0)42
.215
06(137
9to
1651
)
SaV
845
883
1720
.984
77.3
108
(100
to11
7)42
.225
6(235
to28
1)
HAstV
245
883
420
.921
77.3
27(25to
29)
42.2
64(59to
70)
Sex
Male
NoV
5128
442
179
11.9
1508
80.0
1885
(173
8to
2056
)47
.439
79(364
9to
4360
)
SaV
1228
442
4211
.935
580
.044
3(409
to48
4)47
.493
6(859
to10
26)
HAstV
328
442
1111
.989
80.0
111
(102
to12
1)47
.423
4(215
to25
6)
Fem
ale
NoV
5227
629
188
11.8
1598
80.3
1991
(183
6to
2172
)46
.742
60(391
0to
4669
)
SaV
1027
629
3611
.830
780
.338
3(353
to41
8)46
.781
9(752
to89
8)
HAstV
827
629
2911
.824
680
.330
6(283
to33
4)46
.765
5(602
to71
8)
Total
NoV
103
5607
018
411
.815
5280
.119
37(182
8to
2059
)47
.141
16(387
1to
4389
)
SaV
2256
070
3911
.833
180
.141
4(390
to44
0)47
.187
9(827
to93
8)
HAstV
1156
070
2011
.816
680
.120
7(195
to22
0)47
.144
0(413
to46
9)
NoV
:norov
irus;
SaV
:sap
oviru
s;HAstV:a
strovirus;
PYO:p
erso
n-ye
arsof
obse
rvation;
AGE:a
cute
gastroen
teritis;9
5%CI:95
%cred
ible
interval.
doi:10.1371/journal.pone.0145943.t005
Norovirus, Sapovirus, and Astrovirus in Kenya
PLOS ONE | DOI:10.1371/journal.pone.0145943 April 25, 2016 14 / 20

spectrum in Africa. Our analysis demonstrated a substantial disease burden imposed by theseviruses in both rural and urban Kenya. Norovirus had the highest incidence rates in both sites.In addition, sapovirus and astrovirus, for which epidemiological data remain limited globally,were also found to be of considerable disease burden in Kenya. The combination of householdsurveillance and clinic surveillance enabled us to identify patients with diarrhea in the studysites comprehensively, and provided robust estimates of incidence at the outpatient and com-munity levels by adjusting for the proportion of patients that were missed at the study clinics.These adjustments revealed the total community burden of disease associated with each virus,which could not have been observed from the crude incidence rates alone. For example, theoverall crude incidence of norovirus was about same in Kibera than in Lwak, but the overalloutpatient and community incidence rates were calculated to be about 1.4 and 2.3-fold higherin Lwak than in Kibera, respectively. These findings demonstrated the importance of assessinghealthcare seeking behaviors and access to care issues in the context of surveillance studies fordisease burden estimates. We did not detect an apparent or consistent trend in seasonality ateither study site. Both study sites have two rainy seasons (fromMarch to May and from Octo-ber to November) [15], but no viruses at either of the sites peaked during both rainy seasons.
According to the 2009 census, there were 26.1 million and 12.5 million people of all ages liv-ing in rural and urban Kenya, respectively [23]. By applying the adjusted incidence rates inLwak to the population in rural Kenya and those in Kibera to the population in urban Kenya,
Fig 2. Annualized crude incidence rates of enteric viruses per 100,000 PYO bymonth, Lwak and Kibera, Kenya.NoV: norovirus; SaV: sapovirus;HAstV: astrovirus; PYO: person-years of observation. Study period was from June 2007 to October 2008 in Lwak and from October 2006 to February 2009 inKibera. Data in the samemonths were combined together and annualized crude incidence rates per 100,000 PYO in each month were calculated as follows:
Average number of positive specimens in each monthPYO
� 12� 100; 000:
doi:10.1371/journal.pone.0145943.g002
Norovirus, Sapovirus, and Astrovirus in Kenya
PLOS ONE | DOI:10.1371/journal.pone.0145943 April 25, 2016 15 / 20

Fig 3. Adjusted outpatient (A) and community (B) incidence rates of enteric viruses per 100,000 PYO by age group, Lwak and Kibera, Kenya.NoV:norovirus, SaV: sapovirus, HAstV: astrovirus; PYO: person-years of observation. The outpatient incidence was calculated by dividing the crude incidence bythe proportion of patients who submitted stool specimen among all diarrhea patients meeting stool-sampling criteria (PSS) and the proportion of diarrheapatients who visited the study clinic among diarrhea patients who visited any clinics including non-study clinics (PSC). The community incidence wascalculated by dividing the outpatient incidence by the proportion of diarrhea patients who visited any clinics among all diarrhea patients identified in thecommunity, including those who did not seek medical care (PMC).
doi:10.1371/journal.pone.0145943.g003
Norovirus, Sapovirus, and Astrovirus in Kenya
PLOS ONE | DOI:10.1371/journal.pone.0145943 April 25, 2016 16 / 20

we estimate that each year, about 2.8–3.3 million, 0.45–0.54 million, and 0.77–0.95 million peo-ple across all ages in Kenya become ill with diarrheal illness in the presence of norovirus, sapo-virus, and astrovirus, respectively. Of these, approximately 0.85–1.0 million, 0.14–0.17 million,and 0.22–0.27 million people of all ages with norovirus, sapovirus, and astrovirus-associateddiarrheal illnesses seek outpatient care each year in Kenya, respectively. These extrapolationsare based on the assumption that the incidence estimated in the single rural and urban studysites reflect the incidence in all rural and urban areas of Kenya, respectively. This assumptionmay not be appropriate especially for urban areas where the population size is not stablebecause of frequent movement in and out of the area. Due to this assumption and other limita-tions discussed later, these extrapolations may not yield precise national estimates. Nonethe-less, the magnitude of these estimates suggests the significant burden of these enteric viruses onthe people and healthcare system in Kenya and the importance of targeted public health inter-ventions for these enteric viruses. Compared to the outpatient incidence of rotavirus estimatedin the same sites among children aged<5 years from 2007 to 2010 (before introduction of rota-virus vaccine into the national immunization program in 2014) [14], the outpatient incidenceof norovirus was estimated to be 10% higher in Lwak and 46% higher in Kibera among thesame age group. Among the total population across all age groups, the outpatient incidence ofnorovirus was about 2-fold higher than that of rotavirus in both sites. Although rotavirus wasdetected by enzyme immunoassay in the previous study, which is less sensitive than RT-PCR,these findings suggest that norovirus is comparably or even more prevalent than rotavirusamong diarrhea patients in the outpatient setting. As diarrheal disease caused by rotavirusdecreases with the introduction of rotavirus vaccines [24, 25], the relative burden of norovirusis expected to increase in the future.
Comparison of our study findings with similar studies conducted in developed countriesreveals consistent trends and key differences. For example, the estimated community incidencerates of norovirus disease per 100,000 population across all age groups was 6,500–7,000 in theU.S. [26–28], 3,800 in the Netherlands [29], and 4,500–4,700 in the United Kingdom [30, 31].Although these estimates were computed by various methods, rates of norovirus-associateddiseases appear to be 1.2–2.1-fold higher in Kenya compared to those in developed countries.With regard to adjustment factors for healthcare utilization, the rate of stool specimen submis-sion was low (5–11%) among younger children and was the highest (21–26%) among patientsaged 18–49 years in both sites in Kenya (Table 3). This is contrary to a previous study’s obser-vation in the U.S., where young children and the elderly were more likely to submit stool speci-mens and only less than 1% of patients aged 16–25 years provided specimens [28]. Thisobservation highlights the importance of obtaining the site specific adjustment factors in orderto estimate an outpatient and community incidence of diseases.
An important limitation of this study is the lack of non-diarrheal or healthy control speci-mens. As such, we were not able to adjust the attributable fraction to account for asymptomaticviral detection, as has been done previously [14]. However, we conservatively limited our inci-dence estimates for norovirus, sapovirus, and astrovirus to only include diarrhea patients thatwere not positive for another known pathogen (i.e., enteric bacteria or rotavirus), providingsome reassurance that these were etiologic detections. Other studies have detected these virusesmore frequently in specimens collected from cases compared to those from controls, suggestingthat these three viruses are indeed etiologic causes of diarrheal illnesses [32–34]. It should bealso noted that specimens were not tested for other causes of diarrhea, such as parasites andadenovirus. Although norovirus was detected as a single pathogen in 11% of dysentery cases,these cases may have been caused by other pathogens that were not tested in our study or mayrepresent false negatives of the bacteria testing. There is also a potential that the clinic surveil-lance missed patients with mild diarrhea, because we did not collect stool specimens from all
Norovirus, Sapovirus, and Astrovirus in Kenya
PLOS ONE | DOI:10.1371/journal.pone.0145943 April 25, 2016 17 / 20

patients who experienced uncomplicated diarrhea. As norovirus is known to more often causeless severe diarrhea, some cases with norovirus-associated uncomplicated diarrhea were likelymissed at the study clinics, possibly causing an underestimation of our incidence rates. Anotherpotential limitation is selection bias among patients that submitted stool specimens and soughtmedical care at the study clinics, which would limit the representativeness of the data on viraldetection from stools. In addition, because our study periods were not a set on full calendaryears, there is potential for seasonal bias; however, our study was performed for at least one fullcalendar year in both sites and our analysis showed there was no clear seasonality in either site.
In conclusion, our study is the first to provide population-based incidence estimates of diar-rheal illness associated with norovirus, sapovirus, and astrovirus across the age spectrum inKenya, and one of the few studies providing such estimates worldwide. The substantial diseaseburden of norovirus, which is comparable to that of rotavirus, underscores the potential valueof targeted interventions, such as vaccines, to reduce the health burden of norovirus. Data fromour study can inform cost-effectiveness of potential vaccines against norovirus and help definea public health strategy for controlling these enteric viruses in developing countries.
AcknowledgmentsDisclaimer: The findings and conclusions in this report are those of the authors and do notnecessarily represent the official position of the Centers for Disease Control and Prevention.
Author ContributionsConceived and designed the experiments: JV UDP JMM DRF RFB AJH. Performed the experi-ments: LC AA NG. Analyzed the data: KS LC AA AJH. Contributed reagents/materials/analy-sis tools: KS LC AA NG AJH. Wrote the paper: KS.
References1. GBD 2013 Mortality and Causes of Death Collaborators. Global, regional, and national age-sex specific
all-cause and cause-specific mortality for 240 causes of death, 1990–2013: a systematic analysis forthe Global Burden of Disease Study 2013. Lancet. 2014. Epub 2014/12/23. doi: 10.1016/s0140-6736(14)61682-2 PMID: 25530442.
2. Fischer Walker CL, Perin J, Aryee MJ, Boschi-Pinto C, Black RE. Diarrhea incidence in low- and mid-dle-income countries in 1990 and 2010: a systematic review. BMC Public Health. 2012; 12:220. Epub2012/03/23. doi: 10.1186/1471-2458-12-220 PMID: 22436130; PubMed Central PMCID:PMCPMC3323412.
3. Tsolenyanu E, Seheri M, Dagnra A, Djadou E, Tigossou S, Nyaga M, et al. Surveillance for rotavirusgastroenteritis in children less than 5 years of age in Togo. Pediatr Infect Dis J. 2014; 33 Suppl 1:S14–8. Epub 2013/12/18. doi: 10.1097/inf.0000000000000046 PMID: 24343607.
4. Abebe A, Teka T, Kassa T, Seheri M, Beyene B, Teshome B, et al. Hospital-based surveillance for rota-virus gastroenteritis in children younger than 5 years of age in Ethiopia: 2007–2012. Pediatr Infect DisJ. 2014; 33 Suppl 1:S28–33. Epub 2013/12/18. doi: 10.1097/inf.0000000000000048 PMID: 24343610.
5. Khagayi S, Burton DC, Onkoba R, Ochieng B, Ismail A, Mutonga D, et al. High burden of rotavirus gas-troenteritis in young children in rural western Kenya, 2010–2011. Pediatr Infect Dis J. 2014; 33 Suppl 1:S34–40. Epub 2013/12/18. doi: 10.1097/inf.0000000000000049 PMID: 24343611.
6. Mwenda JM, Tate JE, Parashar UD, Mihigo R, Agocs M, Serhan F, et al. African rotavirus surveillancenetwork: a brief overview. Pediatr Infect Dis J. 2014; 33 Suppl 1:S6–8. Epub 2013/12/18. doi: 10.1097/inf.0000000000000174 PMID: 24343616.
7. Ogilvie I, Khoury H, Goetghebeur MM, El Khoury AC, Giaquinto C. Burden of community-acquired andnosocomial rotavirus gastroenteritis in the pediatric population of Western Europe: a scoping review.BMC Infect Dis. 2012; 12:62. Epub 2012/03/21. doi: 10.1186/1471-2334-12-62 PMID: 22429601;PubMed Central PMCID: PMCPMC3342230.
8. Gastanaduy PA, Hall AJ, Curns AT, Parashar UD, Lopman BA. Burden of norovirus gastroenteritis inthe ambulatory setting—United States, 2001–2009. J Infect Dis. 2013; 207(7):1058–65. Epub 2013/01/10. doi: 10.1093/infdis/jis942 PMID: 23300161.
Norovirus, Sapovirus, and Astrovirus in Kenya
PLOS ONE | DOI:10.1371/journal.pone.0145943 April 25, 2016 18 / 20
9. Ahmed SM, Hall AJ, Robinson AE, Verhoef L, Premkumar P, Parashar UD, et al. Global prevalence ofnorovirus in cases of gastroenteritis: a systematic review and meta-analysis. Lancet Infect Dis. 2014;14(8):725–30. Epub 2014/07/02. doi: 10.1016/s1473-3099(14)70767-4 PMID: 24981041.
10. Armah GE, Sow SO, Breiman RF, Dallas MJ, Tapia MD, Feikin DR, et al. Efficacy of pentavalent rotavi-rus vaccine against severe rotavirus gastroenteritis in infants in developing countries in sub-SaharanAfrica: a randomised, double-blind, placebo-controlled trial. Lancet. 2010; 376(9741):606–14. Epub2010/08/10. doi: 10.1016/s0140-6736(10)60889-6 PMID: 20692030.
11. GroomeMJ, Page N, Cortese MM, Moyes J, Zar HJ, Kapongo CN, et al. Effectiveness of monovalenthuman rotavirus vaccine against admission to hospital for acute rotavirus diarrhoea in South Africanchildren: a case-control study. Lancet Infect Dis. 2014; 14(11):1096–104. Epub 2014/10/12. doi: 10.1016/s1473-3099(14)70940-5 PMID: 25303843.
12. Feikin DR, Laserson KF, Ojwando J, Nyambane G, Ssempijja V, Audi A, et al. Efficacy of pentavalentrotavirus vaccine in a high HIV prevalence population in Kenya. Vaccine. 2012; 30 Suppl 1:A52–60.Epub 2012/05/02. doi: 10.1016/j.vaccine.2011.08.043 PMID: 22520137.
13. Madhi SA, Cunliffe NA, Steele D, Witte D, Kirsten M, Louw C, et al. Effect of human rotavirus vaccineon severe diarrhea in African infants. N Engl J Med. 2010; 362(4):289–98. Epub 2010/01/29. doi: 10.1056/NEJMoa0904797 PMID: 20107214.
14. Breiman RF, Cosmas L, Audi A, Mwiti W, Njuguna H, Bigogo GM, et al. Use of population-based sur-veillance to determine the incidence of rotavirus gastroenteritis in an urban slum and a rural setting inKenya. Pediatr Infect Dis J. 2014; 33 Suppl 1:S54–61. Epub 2013/12/18. doi: 10.1097/inf.0000000000000094 PMID: 24343615.
15. Feikin DR, Olack B, Bigogo GM, Audi A, Cosmas L, Aura B, et al. The burden of common infectious dis-ease syndromes at the clinic and household level from population-based surveillance in rural andurban Kenya. PLoS ONE. 2011; 6(1):e16085. Epub 2011/01/27. doi: 10.1371/journal.pone.0016085PMID: 21267459; PubMed Central PMCID: PMCPMC3022725.
16. Podkolzin AT, Fenske EB, Abramycheva NY, Shipulin GA, Sagalova OI, Mazepa VN, et al. Hospital-based surveillance of rotavirus and other viral agents of diarrhea in children and adults in Russia,2005–2007. J Infect Dis. 2009; 200 Suppl 1:S228–33. Epub 2009/10/13. doi: 10.1086/605054 PMID:19817602.
17. Hill VR, Mull B, Jothikumar N, Ferdinand K, Vinjé J. Detection of GI and GII Noroviruses in GroundWater Using Ultrafiltration and TaqMan Real-time RT-PCR. Food and Environmental Virology. 2010; 2(4):218–24
18. Trujillo AA, McCaustland KA, Zheng DP, Hadley LA, Vaughn G, Adams SM, et al. Use of TaqMan real-time reverse transcription-PCR for rapid detection, quantification, and typing of norovirus. J Clin Micro-biol. 2006; 44(4):1405–12. Epub 2006/04/07. doi: 10.1128/jcm.44.4.1405–1412.2006 PMID:16597869; PubMed Central PMCID: PMCPMC1448641.
19. Kageyama T, Kojima S, Shinohara M, Uchida K, Fukushi S, Hoshino FB, et al. Broadly reactive andhighly sensitive assay for Norwalk-like viruses based on real-time quantitative reverse transcription-PCR. J Clin Microbiol. 2003; 41(4):1548–57. Epub 2003/04/19. PMID: 12682144; PubMed CentralPMCID: PMCPMC153860.
20. Oka T, Katayama K, HansmanGS, Kageyama T, Ogawa S,Wu FT, et al. Detection of human sapovirusby real-time reverse transcription-polymerase chain reaction. J Med Virol. 2006; 78(10):1347–53. Epub2006/08/24. doi: 10.1002/jmv.20699 PMID: 16927293.
21. Dennehy PH, Gauntlett DR, Spangenberger SE. Choice of reference assay for the detection of rotavi-rus in fecal specimens: electron microscopy versus enzyme immunoassay. J Clin Microbiol. 1990; 28(6):1280–3. Epub 1990/06/01. PMID: 2166080; PubMed Central PMCID: PMCPmc267919.
22. Krieg N, Holt J, Bergey (1984). Bergey’s manual of systematic bacteriology/Krieg Noel R., editor, vol-ume 1; Holt John G., editor-in-chief. Baltimore: Williams &Wilkins 4 v.xxvii, 2648.
23. Kenya National Bureau of Statistics. The 2009 Kenya Population and Housing Census. 2010.
24. Payne DC, Vinje J, Szilagyi PG, Edwards KM, Staat MA, Weinberg GA, et al. Norovirus and medicallyattended gastroenteritis in U.S. children. N Engl J Med. 2013; 368(12):1121–30. Epub 2013/03/22. doi:10.1056/NEJMsa1206589 PMID: 23514289.
25. Hemming M, Rasanen S, Huhti L, Paloniemi M, Salminen M, Vesikari T. Major reduction of rotavirus,but not norovirus, gastroenteritis in children seen in hospital after the introduction of RotaTeq vaccineinto the National Immunization Programme in Finland. Eur J Pediatr. 2013; 172(6):739–46. Epub 2013/01/31. doi: 10.1007/s00431-013-1945-3 PMID: 23361964.
26. Hall AJ, Lopman BA, Payne DC, Patel MM, Gastanaduy PA, Vinje J, et al. Norovirus disease in theUnited States. Emerg Infect Dis. 2013; 19(8):1198–205. Epub 2013/07/24. doi: 10.3201/eid1908.130465 PMID: 23876403; PubMed Central PMCID: PMCPMC3739528.
Norovirus, Sapovirus, and Astrovirus in Kenya
PLOS ONE | DOI:10.1371/journal.pone.0145943 April 25, 2016 19 / 20

27. Scallan E, Hoekstra RM, Angulo FJ, Tauxe RV, Widdowson MA, Roy SL, et al. Foodborne illnessacquired in the United States—major pathogens. Emerg Infect Dis. 2011; 17(1):7–15. Epub 2011/01/05. doi: 10.3201/eid1701.091101p1 PMID: 21192848; PubMed Central PMCID: PMCPMC3375761.
28. Hall AJ, Rosenthal M, Gregoricus N, Greene SA, Ferguson J, Henao OL, et al. Incidence of acute gas-troenteritis and role of norovirus, Georgia, USA, 2004–2005. Emerg Infect Dis. 2011; 17(8):1381–8.Epub 2011/08/02. doi: 10.3201/eid1708.101533 PMID: 21801613; PubMed Central PMCID:PMCPMC3381564.
29. Verhoef L, Koopmans M, VANPW, Duizer E, Haagsma J, Werber D, et al. The estimated disease bur-den of norovirus in The Netherlands. Epidemiol Infect. 2013; 141(3):496–506. Epub 2012/05/19. doi:10.1017/s0950268812000799 PMID: 22595489.
30. Phillips G, Tam CC, Conti S, Rodrigues LC, Brown D, Iturriza-Gomara M, et al. Community incidence ofnorovirus-associated infectious intestinal disease in England: improved estimates using viral load fornorovirus diagnosis. Am J Epidemiol. 2010; 171(9):1014–22. Epub 2010/04/03. doi: 10.1093/aje/kwq021 PMID: 20360244.
31. Tam CC, Rodrigues LC, Viviani L, Dodds JP, Evans MR, Hunter PR, et al. Longitudinal study of infec-tious intestinal disease in the UK (IID2 study): incidence in the community and presenting to generalpractice. Gut. 2012; 61(1):69–77. Epub 2011/06/29. doi: 10.1136/gut.2011.238386 PMID: 21708822;PubMed Central PMCID: PMCPMC3230829.
32. Chhabra P, Payne DC, Szilagyi PG, Edwards KM, Staat MA, Shirley SH, et al. Etiology of viral gastro-enteritis in children <5 years of age in the United States, 2008–2009. J Infect Dis. 2013; 208(5):790–800. Epub 2013/06/13. doi: 10.1093/infdis/jit254 PMID: 23757337.
33. Becker-Dreps S, Bucardo F, Vilchez S, Zambrana LE, Liu L, Weber DJ, et al. Etiology of childhood diar-rhea after rotavirus vaccine introduction: a prospective, population-based study in Nicaragua. PediatrInfect Dis J. 2014; 33(11):1156–63. Epub 2014/06/01. doi: 10.1097/inf.0000000000000427 PMID:24879131; PubMed Central PMCID: PMCPMC4216626.
34. Dennehy PH, Nelson SM, Spangenberger S, Noel JS, Monroe SS, Glass RI. A prospective case-con-trol study of the role of astrovirus in acute diarrhea among hospitalized young children. J Infect Dis.2001; 184(1):10–5. Epub 2001/06/09. doi: 10.1086/321007 PMID: 11398103.
Norovirus, Sapovirus, and Astrovirus in Kenya
PLOS ONE | DOI:10.1371/journal.pone.0145943 April 25, 2016 20 / 20