research study on colo drawing phenomena in high polymers · research study on colo drawing...
TRANSCRIPT

C\f
K ' I
TECHNICAL REPORT
67-10 CM
RESEARCH STUDY ON COLO DRAWING
PHENOMENA IN HIGH POLYMERS
M
TrrrrnreHö USE FOB FKDBKAL SCIENTIFIC AND
TC^mCJj^^MATION Miorofiobe aarteupf
0 i - k£]!ll
n f>.
I by
I R. D. Andrews, Jr., S. W. Allison, D H. Ender
i
R.M. Kimmel, and W. Whitney
Massachusetts Institute of Technology I
Fibers and Polymers Division
Department of Mechanical Engineering
Cambridge, Massachusetts 02139
f-r-v •
U SIQ88Ä8 Contract No. DA19-129-AMC-238 N
! I I
D August 1966
UMITEO]:i?T|S'.ARlM •; ;'N A TI C.Kr-t A3 iJR A T 0 RI f S '
Na(!C^.,.M^ss0uwtts.';flt7BO^
I Clothing and Organic Materials Division
C&0M-25 i

The findings in this report are not to be construed as an official Department of the Army position, unless so designated by other authorized documents.
Citation of trade names in this report does not constitute an official indorsement or approval of the use of such items.
DDC AVAILABILITY NOTICE
Distribution of this document is unlimited
DISPOSITION INSTRUCTIONS
Destroy this report when no longer needed return it to the originator.
Do not

Distribution of this document is unlimited
AD
cw" »SITE KSTIH 008 Kff SEITlOfl
•'"STIFICATIS«
°l^'31ITIM/A«!'.A?iUTy p.r.H
TECHNICAL REPORT 67-10-CM
wit, i,
/
AVAIL, m r s •••! RESEARCH STUDY ON COLD DRAWING PHENOMENA IN I HIGH POLYMERS
by
R. D. Andrews, Jr., S. W. Allison, D. H. Ender, R. M. Kimme1, and W. Whitney
Massachusetts Institute of Technology Fibers and Polymers Division
Department of Mechanical Engineering Cambridge, Massachusetts 02139
Contract No. DA19-129-AMC-238(N)
Project Reference 1K024401A113
Series: C&OM-25
August 1966
Clothing and Organic Materials Division U. S. ARMY NATICK LABORATORIES
Natick, Massachusetts 01760

FOREWORD
The ability of polymeric materials to yield and draw can play an important role in the dissipation of energy during ballistic impact. In addition, knowledge of the mechanisms operating to produce yielding in amorphous and crystalline polymers can advance our scientific understanding to a point where improved polymeric materials may be prepared.
The work covered in this report was performed over a two- year period by Dr. R. D. Andrews, Mr. S. W. Allison, Mr. D. H. Ender, Mr. R. H. Kimmel, and Dr. W. Whitney of Massachusetts Institute of Technology under Contract DA19-129-AMC-238(N).
It represents work on amorphous polystyrene, polymethyl methacrylate, polycarbonate, polyamide, polyacrylonitrile and other polymers under various uniaxial, biaxial, and triaxial stress conditions (notched). This has resulted in yield and fracture criteria and theoretical proposals for the mechanisms involved in yielding.
The U. S. Army Natick Laboratories Project Officer was Mr. Roy C. Laible and the Alternate Project Officer was Mr. Anthony L. Alesi, Materials Research Branch, Clothing and Organic Materials Division.
S. J. KENNEDY Director Clothing & Organic Materials Division
APPROVED:
DALE H. SIELING, Ph.D. Scientific Director
W. M. MANTZ Brigadier General, USA Commanding
iii
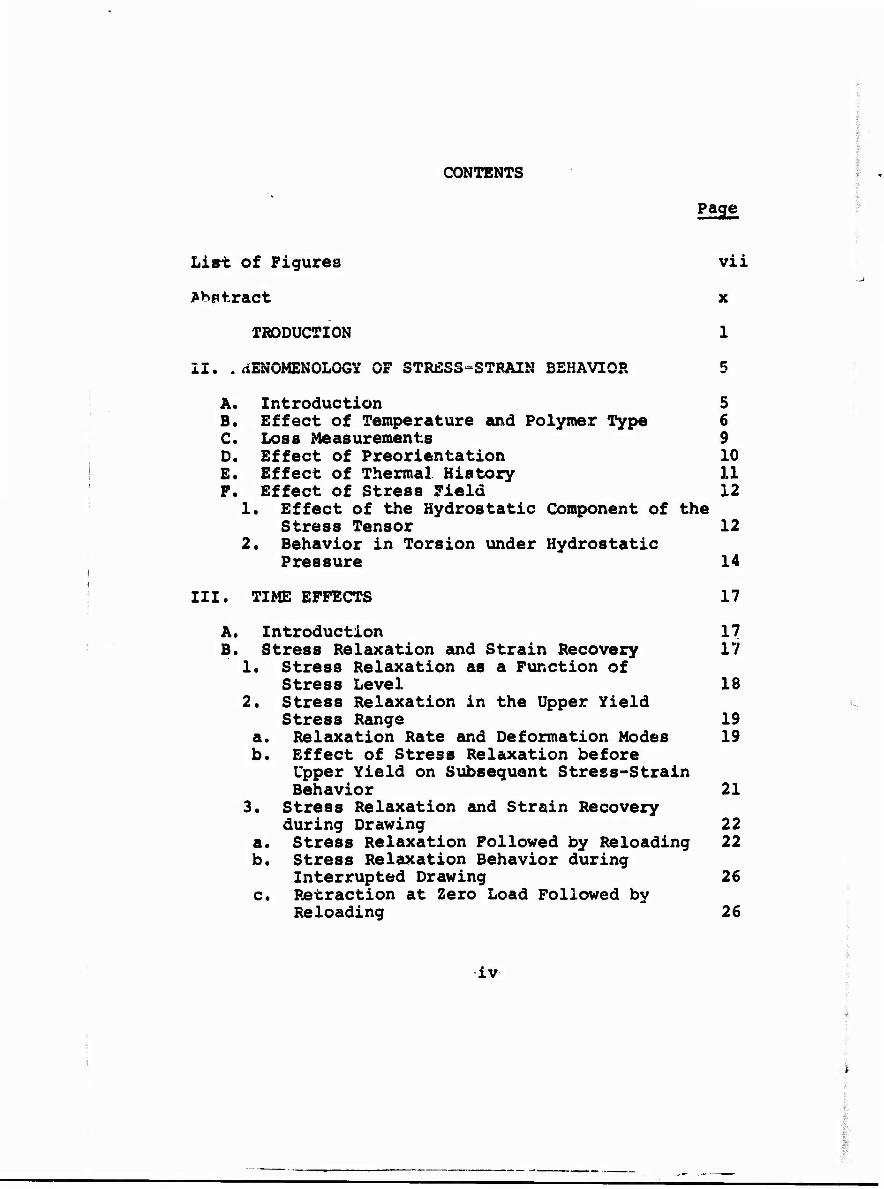
CONTENTS
Page
List of Figures vii
*bfltract x
TRODUCTION 1
II. *dENOMENOLOGY OF STRESS-STRAIN BEHAVIOR 5
A. Introduction 5 B. Effect of Temperature and Polymer Type 6 C. Loss Measurements 9 D. Effect of Preorientation 10 E. Effect of Thermal History 11 F. Effect of Stress Field 12
1. Effect of the Hydrostatic Component of the Stress Tensor 12
2. Behavior in Torsion under Hydrostatic Pressure 14
III. TIME EFFECTS 17
A. Introduction 1? B. Stress Relaxation and Strain Recovery 17
1. Stress Relaxation as a Function of Stress Level 18
2. Stress Relaxation in the Upper Yield Stress Range 19
a. Relaxation Rate and Deformation Modes 19 b. Effect of Stress Relaxation before
Upper Yield on Subsequent Stress-Strain Behavior 21
3. Stress Relaxation and Strain Recovery during Drawing 22
a. Stress Relaxation Followed by Reloading 22 b. Stress Relaxation Behavior during
Interrupted Drawing 26 c. Retraction at Zero Load Followed by
Reloading 26
IV

d. Retraction of Strain after Drawing 28 e. Other Stress-Time Histories 28
C. Delayed Drawing under Dead Load 29 1. Introduction 29 2. Experimental Procedure 30 3. Results: Polystyrene 31 4. Results: Polymethyl Methacrylate 34 5. Discussion of Results 36 a. Effects of Stress and Temperature 36 b. Effect of Moisture on PMMA 39 c. Effect of Thermal History on PMMA 39 d. Relation between Constant Strain Rate
and Constant Load Drawing 40
IV. MODES OF DEFORMATION 42
A. Introduction 42 B. Macroscopic Yielding Modes 43
1. Geometry of Neck Formation 43 a. Introduction 43 b. Experimental Procedure 43 c. Results 44 d. Discussion of Results 4£
2. Volume Changes during Yielding 47 C. Microscopic Yielding Modes 49
1. Deformation Bands in Compression 49 a. Introduction 49 b. The Band Propagation Angle 50 c. Temperature and Preorientation Effects
in Polystyrene 51 d. Deformation Band Propagation and the
Load Drop after Yielding 52 2. Deformation Phemomena in Tension 53 a. Constant Strain Rate and Stress
Relaxation Experiments 5.3 b. Creep Experiments 55
3. General Discussion 58
V. BIREFRINGENCE STUDIES 59
A. Introduction 59 B. Polyaerylonitrile Studies 60
1. Introduction 60 2. Experimental Procedure 61 3. Birefringence Changes during Stress-
Strain Curves 61 4. Effects of Environment 65
v

C. Hot vs. Cold Extension of Polystyrene and Polymethyl Methacrylate 67
VI. THEORETICAL DISCUSSION OF POLYMER YIELDING 71
A. Introduction 71 B. Continuum (Molecular) Theories of Yield 72
1. Defect Model 73 2. Fiber Bundle Model 78 3. Intermolecular Bonding and Stress-
Induced Transitions 80 C. Comparison of Mathematical Formulations 82 D. Neck Formation and Draw Ratio 87
VII. CONCLUSIONS 90
VIII. RECOMMENDATIONS FOR FUTURE WORK 94
IX. ACKNOWLEDGMENTS 98
References 99
Figures 102-161
VI

LIST OF FIGURES
Page
1 Stress-Strain Properties vs. Temperature 102 2 Strain Properties vs. Temperature 103 3 Mechanical Damping vs. Temperature
Measured by Ball Rebound Test 104 4 Yield Stress of Polystyrene vs. Inclination 105 5 Deformation Parameters vs. Inclination
between Stress and Orientation Directions 106 6 Yielding of Polystyrene 107 7 Pressurized Chamber for Torsion Experiments 108 8 Sequential Stress Relaxation of Polystyrene 109 9 Stress Relaxation of Polystyrene in
Compression 110 10 Stress-Time Behavior in Various Types of
Test of Polystyrene in Compression at Room Temperature 111
11 Stress Relaxation of Polystyrene Film at Room Temperature 112
12 Interrupted Drawing of Polymers (Schematic) 113 13 Reappearance of Yield Drop after Various
Times of Stress Relaxation in Interrupted Drawing of Formvar 114
14 Reappearance of Yield Drop after Various Times of Stress Relaxation in Interrupted Drawing of Nylon 115
15 Reappearance of Yield Drop after Various Times of Stress Relaxation in Interrupted Drawing of Lexan 116
16 Reappearance of Yield Drop after Various Times of Stress Relaxation in Interrupted Drawing of Saran 117
17 Alternating Periods of Drawing and Stress Relaxation 118
18 Interrupted Drawing with Unloading Period 119 19 Reloading Slopes (S3 of Fig. 14) vs.
Recovery Time 120 20 Retraction under Zero Load after Drawing 121 21 Effect of Combined Relaxation and Recovery
Periods 122 22 Effect of Combined Relaxation and Recovery
Periods 123 23 Apparatus for Orienting Polymer Sheets 124 24 Apparatus for Creep Measurement under
Controlled Temperature 125
vii

25 Types of Elongation vs. Time Curves Observed 126 26 Characteristic Parameters of Drawing Curves 127 27 Delay Times and Regions of Deformation Type—
Preoriented Polystyrene 128 28 Delay Elongations and Regions of Deformation
Type—Preoriented Polystyrene 129 29 Internal Cracks and Shear Bands in
Polystyrene 130 30 Shear Band Field in Neck of Polystyrene 131 31 Delay Times and Regions of Deformation Type—
PMMA 132 32 Delay Elongations and Regions of Deformation
Type—PMMA 133 33 Effect of Moisture Absorption on Delay Time 134 34 Elongation of PMMA under Constant Tensile
Load 135 35 Effect of Thermal Treatment on Elongation
of PMMA under Constant Tensile Load 136 36 Dependence of Delay Time on Stress Level at
Different Temperatures—Preoriented Polystyrene 137
37 Dependence of Delay Time on Stress Level at Different Temperatures—PMMA 138
38 Stress-Strain Curves of PMMA for Various Extension Rates 139
39 Measured and Predicted Delay Times 140 40 Typical Neck Photograph and Corresponding
Profile Plot ^ 141 41 Neck Profile Sequence 142 42 Variation of Neck Shape with Extension Rate 143 43 Variation of Neck Shape with Temperature 144 44 The Variation of the Neck Slope with
Preorientation 145 45 Variation of True Stress-Strain Curves with
Extension Rate 146 46 True Stress vs. True Strain at Constant
Extension Rate 147 47 Variation of the True Stress-Strain Curve
with Preorientation 148 48 Volume Changes in Formvar 149 49 Necks and Bands in Formvar Film 150 50 Crazes in Polystyrene 151 51 Open Craze in Polystyrene 151 52 Deformation Bands in Polystyrene 152 53 Surface of Polystyrene Specimen after Cold
Drawing 152
Vlll

54 Polyacrylonitrile—Engineering Stress vs. Elongation—Constant Strain Rate 153
55 Polyacrylonitrile—Birefringence vs. Elongation—Constant Strain Rate 154
56 Polyacrylonitrile—Temperature Dependence of Strain-Optical Coefficient 155
57 Polyacrylonitrile—Temperature Dependence of Modulus 156
58 Polyacrylonitrile—True Stress vs. True Strain —Necking and Drawing at 135°C 157
39 Polyacrylonitrile—Birefringence vs. True Strain—Necking and Drawing at 135°C 158
60 Birefringence vs. Strain during Shrinkage at 105°C~ PMMA " 159
61 Birefringence vs. Strain of PS Measured in Neck of Partially Cold-Drawn Specimen at Room Temperature 160
62 Birefringence vs. Strain of PMMA during Induction Period 161
IX

ABSTRACT
A fundamental study of the phenomenon of cold-drawing (plastic yield) in polymers has been carried outf through which a better understanding of several of the features of this process has been achieved. The effects of temperature, thermal history, stress-field, chemical structure and pre- orientation on the stress-strain behavior of bo^h glassy and crystalline polymers have been explored. The behavior of several polymers, particularly polystyrene and polymethyl methacrylate, in stress relaxation, relaxation-recovery cycling and creep, especially with respect to delayed draw- ing, was investigated in detail. The geometry of neck formation has been quantitatively investigated by photo- graphic techniques, and volume changes during compression have been measured usim; a mercury dilatometer. Micro- scopic modes of yielding, particularly the formation of deformation bands» are described. Birefringence changes during deformation of polyacrylonitrile under various conditions and during hot and cold extension of polystyrene and polymethyl methacrylate are presented and related to the molecular processes believed to be occurring. The development of a molecular theory of drawing is attempted through three different paths of approach: (1) a defect model analogous to dislocations, (2) a mathematical model of the "fiber bundle" type, and (3) a description in terms of the breakdown of secondary intermolecular cohesive bonding. General conclusions and recommendations for future studies in these areas are presented.

RESEARCH STUDY ON COLD DRAWING PHENOMENA IN HIGH POLYMERS
I. INTRODUCTION
This Final Report covers the work carried out during the period of a two-year contract with the U. S. Array Natick Laboratories, having as its aim a fundamental study of the phenomenon of cold drawing (or plastic yield) in solid polymers. This was a continuation of the work begun under a previous six-month contract [DA 19-129-AMC-100(N), covering the period 5/1/63 to 10/31/63] with the Army Natick Laboratories, which involved an exploratory study of this area, using glassy amorphous polymers (polystyrene and polymethyl methacrylate) exclusively.1 The use of glassy amorphous polymers avoids the complications asso- ciated with crystalline morphology and structure which are encountered in crystalline polymers; also, since the yield and drawing behavior of amorphous and crystalline polymers seen to be remarkably similar, there is considerable advantage in first studying the yield phenomenon in amor- phous polymers. We have continued to employ this strategy of attack on the problem during the present two-year contract, confining our attention primarily to amorphous glassy polymers; however, we have also carried out detailed measurements on polyacrylonitrile, a polymer with ill- defined crystallinity,as well as preliminary investigation of some polymers with well-characterized crystallinity.
The phenomenon of plastic yield in polymers is of considerable importance both from a practical and from a theoretical standpoint. From the practical standpoint this process has been of major importance in the textile industry for several years, since synthetic fibers are routinely subjected to a "drawing" process after spinning in order to orient them and increase their tensile strength (or "tenacity"). Processes of "cold-forming" are also under consideration in the plastics industry at the present time; these would utilize the yield property of the polymers, just as "cold-stamping" or "l#ire drawing" utilizes the same property of metals to give a rapid method of shaping and fabricating metal parts. The yield phenomenon is also of importance in connection with the problem of impact strength and impact response, since the common classifica- tion of materials into the brittle vs. ductile categories

is based entirely on whether the material will show plastic yield prior to fracture. Consideration of the role of plastic yield in the ballistic response of polymers, where very high speed impact is involved, is of obvious impor- tance. The effects of complex stress fields must also be taken into account in order to give a satisfactory des- cription of ballistic response0 Delayed yield under creep conditions (constant dead load), which we have observed in our studies and investigated in some detail, may also be a significant failure mechanism in cases where dimensional stability is a critical factor.
From the theoretical standpoint, an understanding of the plastic yield effect is clearly necessary in achieving any sort of adequate understanding of the mechanical properties (or stress response) of solid polymers. Yield and fracture are the two phenomena which are of greatest interest in the stress response of a polymer in the high stress range. It may seem surprising that the nature of these processes is not better understood at the present time, considering their fundamental importance. Most studies of stress response have been concerned with the linear viscoelastic type of behavior observed at low stresses, and this range of behavior is now fairly well understood (at least from the phenomenological standpoint; the molecular theory is by no means completely established*. The non-linear viscoelasticity which is observed in the intermediate ranges of stress is also not well understood, and is only now beginning to receive careful study. An adequate elucidation of the nature of the yield process could very well aid in achieving an understanding of both non-linear viscoelasticity and the fracture process.
Because of the broad and fundamental nature of the yield phenomenon, it has many aspects which can be studied, and it is of interest from many different points of view. An understanding which will be adequate for one purpose— because it emphasizes certain features which are relevant in that specific case—may be inadequate for another. This means that a study such as this cannot take an approach in which yield is regarded as a problem to be "solved" by some obvious, direct line of attack; rather, it must be examined in a broad way» using several exploratory lines of approach, with the aim of achieving an understanding of as many facets of the phenomenon as possible. This is particularly necessary when the phenomenon as a whole is so poorly understood«, Experimental knowledge is particu- larly needed at the present time, but the theoretical

aspects of the problem cannot be neglected« The ultimate aim of this research would be to achieve a comprehensive understanding of the various aspects of the phenomenon which would include an understanding of the relation between the yield process and the chemical and molecular structure of the polymer, and additionally the relation to the crystalline and morphological structure in the case Of crystalline polymers.
In the study which is being reported here, we have pursued several different lines of investigation. These have included a study of the time effects associated with drawing (e.g., effects of interrupted drawing and drawing with a delay time under dead load). Since the phenomenon of neck formation and propagation is one of the most strik- ing features associated with drawing, we have investigated this aspect of the process by the use of sequence photo- graphy. Some general idea was obtained of the effects of stress fields other than simple tension, and attention was paid to the different deformation modes encountered (including the localisation of deformation in shear bands— a frequently observed effect analogous to the "Luder's bands", or "slip bands", observed in metals). Effects of molecular orientation, temperature, stress level, thermal history (annealing) and absorbed moisture (acting as a plasticizer) were also investigated. Birefringence effects associated with drawing were studied, particularly in connection with the drawing of polyacrylonitrile; this polymer also provided a useful bridge between amorphous and crystalline polymers. The phenomenological theory of drawing has been treated through a consideration of yield criteria and the possible applicability of an equation of state approach. The development of a "molecular" theory of drawing has also been attempted through three different path« of approach: (1) a description in terms of a defect model analogous to the dislpcation mechanism operative in metals and other crystalline non-polymeric solids, (2) the development of a mathematical model of the "fiber bundle" type, in which the yield deformation is assumed to result from a microscopic breaking and re-forming process similar to that involved in the rupture of a yarn, and (3) a description in terms of the breakdown of secondary intermolecular cohesive bonding in the glassy state.
The results mentioned above are presented in some de- tail in the body of this report. However, because of the extent of the work carried out during the two-year period, it is not feasible to attempt to present all of the

detailed results obtained. Rather, an attempt has been made to give an overall picture of the various types of studies which were carried out, and the most significant results obtained. Where details could not be presented, we have in some cases referred the reader to other sources where further details may be found. This report, there- fore, has the e&sential character of a summary report, despite its size. It is planned to publish much of this material in journal articles during the next year or two, and these articles will allow more detail to be presented and more complete literature references to be given. There has been a general increase of research interest in the plastic yield of solid polymers recently. References are given in some cases to related recent work by other investigators, but no attempt has been made to give exhaustive or complete references of this type; it is planned to do this in the final publications.
2 II. PHENOMENOLOGY OF STRESS-STRAIN BEHAVIOR
A. INTRODUCTION
A general description of the type of yielding of concern here is most easily understood in terms of stress- strain behavior. A typical stress-strain curve contains at least five distinct portions. Upon initial loading, the stress-strain curve rises in an almost linear way up to relatively high stresses. Gradually, as the stress continues to rise, the material "strain-softens" and the local slope of the stress-strain curve decreases towards zero at the upper yield point. Whether the slope ever goes to zero, or the curve has a maximum depends on sample geometry and stress field, but there is, in general, a true strain-softening of the material in all stress fields, In some stress fields, after the upper yield point, the deformation mode is formed, such as a neck in the tensile case, or a kink in uniaxial compression. In the former case, the stress-strain curve drops as the instability is formed, then levels out at a constant stress as steady state propagation of the local mode over the entire sample takes place by a process of sequential local strain softening and hardening. Finally, when all the material in a sample has been yielded or drawn to a certain extent, further deformation of the yielded material occurs only at increasing stresses. The two significant material properties for this yielding process are, therefore, those that produce strain softening and strain hardening. The details of the exact shape of the stress-strain curve and local deformation mode are more dependent on experi- mental variables.
There are a large number of material and experimental variables that determine the nature of the observed deformation and yielding, or conversely, that can be used to characterize the nature of the yielding process, fcolymer or material variables can be grouped in several categories: chemical structure variables (which determine the nature of the intra- and inter-molecular forces); polymerization variables (molecular weight, cross-linking, branching, stereo-regularity); pre-treatment variables (orientation)? thermodynamic properties (Tq, secondary transitions, Tm); and crystallinity variables (amount, crystal type, morphology). Some of the important experi- mental variables are: temperature, strain rate, environ- ment, adiabaticity, pressure, stress-field, and stress-
5

strain-temperature history.. (These categories are of course overlapping to some extent.)
This review of some of the pertinent variables serves to put our work in a better perspective. By necessity we were restricted to an exploration of only a limited number of these variables. We chose those experimental variables which were both experimentally accessible and which showed promise of contributing to our understanding of the yield process. The materials which we used were those which, in general, were readily available in convenient form. In particular, polystyrene and poly- methyl methacrylate, which we investigated in detail, are high molecular weight, glassy, amorphous polymers with quite different chemical structure, yet very nearly equal glass transition temperatures. The pre-treatment variable, orientation, was used extensively. Almost all of the experimental variables were utilized, the Aonly restriction being that strain rates be kept low enough so that isothermal conditions could be assumed during de- formation. For characterization of the material response to these experimental variables, the range of deformation behavior around the upper yield point was most closely analyzed, using parameters of stress, strain and time.
B. EFFECT OF TSMBKRAT.URE AND POLYMER ■ TYPE 1 ■ i i i i i ii ■
Compressive tests have been used in this part of the study to determine the temperature and material dependence of both elastic and yielding behavior. Tensile behavior, as a function of these variables, has not been studied, but appropriate comparison tensile data can be found in a report previously issued by this Laboratory, and by the U. S. Army Natick Laboratories . The polymers that were most thoroughly studied were polystyrene (PS), polymethyl methacrylate (PMMA) and Lexan polycarbonate (PC). These were chosen as being representative of the range of glassy behavior from brittle to ductile.
The following quantities, which have been defined in the above-mentioned report, are redefined here because of their frequency of use in the discussion which follows. Modulus (E) was calculated from the slope of the initial straight-line portion of the load-elongation curve; proportional limit sttcss (op.L.) anä strain Up#L#) were calculated from the point on the load-elongation*curve where the curve begins to deviate from a straight line; the upper yield stress (ov) and total strain at yield (e^)

were calculated from the point of maximum load on the load- elongation curve (peak point); the "plastic" strain at yield (eM was calculated as the difference between the total ana elastic strains (extrapolation of elastic part of curve to the yield load)• All stresses were calculated using the original cross-sectional area where this had the smallest value, and all strains were calculated by using the original approximate length of the gauge section (the section with constant cross-sectional area).
Extensive investigation of the compressive stress- strain properties of the three glassy polymers mentioned above was undertaken for several reasons«, First, the compressive properties could be compared to the available tensile data2 to determine the effect of these opposite stress fields. Second (and most important)/ compression tests allow the study of yielding behavior without the complications of the crazing, cracking, and fracture that accompany tensile tests. Also, there are no problems of gripping the specimen, although there still are end effects of greater or lesser severity depending on the end geometry. A special compression apparatus was built for use on the Instron tensile tester.
The stress-strain properties of the three polymers (polystyrene, polymethyl methacrylate, and Lexan poly- carbonate) are shown in figures 1 and 2. The specimens used for PS and PMMA were of two types: cylindrical spec- imens with end fillets; and rectangular columns with end fillets and with a small cross notch in one side. For the latter specimen, the minimum cross sectional area (at the notch) was used in calculating stress values.
The results for the two types of specimen were similar, except that for PMMA the cylindrical specimens showed similar moduli and yield stresses, but much larger total and plastic strains at the yield point than the notched rectangular specimens. Since this difference may well be connected with initiation of localized deformation modes, only the results with notched PMMA specimens are presented in figures 1 and 2, so that material comparisons can be made. All specimens were about one inch long, in the gauge section, and the machine crosshead rate was 0.02"/min, unless indicated otherwise.
The most striking difference between the stress and modulus porperties of the three polymers in figure 1 is

that the polycarbonate is much less temperature, dependent and has lower values of all properties than the other two polymers«, The polymers are consistent, though, in the way that the proportional limit and yield stresses are approximately linear functions uf temperature and extra- polate to zero somewhere near the glass points of the respective polymers (see arrows in figure 1)„ Compared to the tensile data for PMMA and PS, the slope of the yield stress vs. temperature curve for PMMA in compression is about twice that for tension, whereas for PS in compression, this slope is only slightly larger than in tension.
This difference between polymers could be a reflec- tion of the different effect that hydrostatic stress has on the yielding behavior of the two polymers, It might also be due to the fact that the PMMA tensile data were being limited to a small temperature range just under uhe glass point and thus were not truly representative.
The strain parameters for these three polymers are shown in figure 2 as functions of temperature. Looking at the proportional limit strain first, we see that it decreases in a regular way for PS and PMMA, indicating relatively more decrease of proportional limit stress than modulus with increasing temperature. For PC, on the other hand, it goes through a slight maximum, indicating quite a different relative temperature dependence of the modulus and proportional limit stress for this polymer. Even though PS har the highest proportional ligit strain (and stress) in the temperature range below 70 C, it is seen to have the lowest strains at yield (total and plastic)• As mentioned above, this is characteristic of polystyrene and is reflected in the sharpness of the upper yield peak. It will be shown that the*extreme localiza- tion of the plastic deformation mode for PS also reflects this sharp upper yield point.
The total strain at the yield peak decreases with increasing temperature for all the polymers in about the same way, thus showing that the upper yield point is not determined by a constant strain criterion. Rather, it seems that the shape of the stress-strain curves remains about the same and just the limits, both elastic and plastic, become less in magnitude as the temperature increases. The one exception to this is the plastic strain at the yield point (ep), shown in figure 2. It is seen that for PMMA, the plXstic strain is low at low tempera-

tures and increases as the temperature is raised. The behavior is opposite for PC. Furthermore, the plastic strain for PS is very low and appears to be independent of temperature.
A variety of other polymers was*tested in compression at room temperature using rectangular cross*section samples with small side notches. The objective here was to investigate a range of materials and stress-strain properties and to see which materials would deform in a localized way with the notch as a stress concentrator. None of the materials (with the exception of the styrene derivatives) showed as extreme a local yield as poly- styrene, even though some of the plastic strain at yield values were as low as in polystyrene (less than 1%). Both PVC and Formvar showed relatively local yielding in the form of kink bands, as seen in polarized light, but no deformation bands were seen. However, isotactic polystyrene, poly a-methyl styrsne, and styrene-acrylonitrile (75/25) copolymer all showed at least some very distinct deformation bands.
C. LOSS MEASURBfEKTS
A dynamic property, specifically dynamic loss, was obtained on pieces of the polystyrene, polymethyl metha- crylate, and polycarbonate sheets from which the previously reported stress-strain specimens had been cut. The dynamic loss was obtained over the same temperature range as the stress-strain tests. Because one of the projected applications of these data was correlation with deformation band propagation (see Section IV.C.l below)_which occurs with internal strain rates of up to 100 sec" , a dynamic test in the corresponding frequency range was designed.
We are indebted to T. J. Hammack (Fibers and Polymers Division, M.I.T.) for the design and construction of the apparatus used—a bouncing-ball rebound tester. Essentially, the apparatus consisted of a 1/2" diameter steel ball which was released mechanically to drop onto a sheet of plastic. The height of the rebound was read by eye on an adjacent meter stick. The tester was calibrated by selecting polystyrene, known to have a low loss at room temperature, as the standard material. Several bounces were made at each temperature and the rebound readings averaged to the nearest millimeter. The yield point of the materials

was not exceeded (no indentations remained on the surfaces), and the elastic strain rate was estimated to be of the order of 10-100 sec" (frequency, 10-100 cps). The equation used for calculating damping, expressed as log decrement, (A), was:
_ TTG" _ TT(6Q-B> m ~ "GT 60 KX)
where: B = bounce height in cm.
G1,G" = real and imaginary parts of shear modulus.
The results of these dynamic loss measurements for PS, PMMA, and PC (Lexan) (relative to PS at room temperature) -.re plotted vs. temperature (in figure 3) . It is clear thot both PC and PMMA have values of dynamic loss that are an order of magnitude higher than PS at room temperature and that, while the value for PC goes through a definite minimum as the temperature rises, the values for PMMA and PS rise sharply with temperature. At temperatures above 50°C, the loss for all three polymers is rising with temperature, with PMMA having the most and PC the least amount of loss at any given temperature.
D. EFFECT OF PREORIENTATION-
Briefly, preorientation entails heating a sample to a temperature above the glass point, stretching it a pre- scribed amount, and then cooling it back into the glassy state, whereby most of the stretch and molecular chain orientation put into the sample in the rubbery state is retained in the glassy state. Results and discussions of the effects of preorientation in tensile tests of PS can be found in reference (2). Some PS samples were cut from preoriented sheets, so that the preorientation direc- tion was at various angles to the long dimension of the column, i.e. the compressive stress direction. These were tested in compression, as described above, and the results (for notched samples) are presented in figure 4. There is very little dependence of the yield stress on the orienta- tion angle, just a slight (5%) increase at higher angles, where the compression axis is almost normal to the preorientation direction.
Also shown in figure 4 are a series of results at a higher temperature and a series at higher strain rate. There seems to be less of a dependence on angle for the former and more for the latter, but the differences are
10

still very small. The strain rate and temperature coefficients of these yield stress data are about 1000 psi/log cycle of strain rate, and 180 psi/°C, respectively. Un-notched samples were also tested at several of the birefringence levels and gave similar but slightly lower and less consistent yield stress results. It is felt that: the chief effect of the notch, which is across the narrowest (thickness) direction, is to initiate a consistent deform- ation mode across the sample. Otherwise, in un-notched samples, a variety of deformation modes—banding, kinking and buckling—take place, usually across the narrow direct'on.
Some of the other stress-strain properties were not quit»?, as insensitive to angle as were'the yield: arid pro- portional limit stresses. As seen in figure 5, where data obtained on the samples of intermediate orientation at 21°C and 0.02"/iriin are plotted, the total strain at yield increases and the modulus decreases as the pre- orientation angle is increased. The plastic strain at yield also seems to show a slight dependence on the angle.
E. EFFECT OF THBWBtt-4HOTOTg-■
The effect on stress-strain properties of varying quenching rates through T was investigated because, theoretically, it should Be possible in this way to vary the "free volume" in the glassy state and to relate this "free volume" change to mechanical properties. Furthermore, this information would be useful in separa- ting the effects of quenching from those of hot stretch (preorientation) in the preorientation experiments mentioned above. The thermal histories investigated for PS and PMMA were: as received; annealed just under Tg for 10 hours; heated 20°C above Tg and quenched into ice water and into liquid nitrogen. All samples were equilibrated at 70°C, 65% R.H. for at least 24 hours before being tested. A hydrostatic weighing method was devised for the measurement of sample density and this seemed to work reasonably well, with an apparent accuracy of +0.0002 gms/cc. Because the density changes produced Tn the samples were small (PS varied from 1.050 - 1.052 gms/cc, PMMA varied from 1.194 - 1.197 gms/cc) and because of the possibility of incomplete wetting of the sample, the absolute values of the densities were not precise enough to be used as parameters in the presentation of the data below.
11

The effect of thermal pretreatment on stress-strain properties in compression at 21°C is as follows. For PMMA the yield stress decreased by 8% and the modulus by 6.5% after a water quench, and decreased by 13.2 and 16%, respectively, after a liquid nitrogen quench. For PS, the yield stress decreased by 13% and the modulus by 8.4% after the water quench. Since these modulus and stress values decreased by about the same proportion, it is not surprising to find very little overall change in any of the strain values.
The changes in the stress-strain data are roughly similar for increasing test temperature and for decreasing (initial) sample density (i.e.>faster quenching from above T„, giving more £rozen-in free volume). Calculations, using the glassy thermal expansion coefficient {<*„) to define an equivalence of density changes (Ap) produced by quench and changes that would be produced by temperature change (AT), indicate that the extremes of density pro- duced by these quench pretreatments should have been equivalent to about an 8°C change in test temperature, (1/Ap ■ AV/V » oigAT) , where ag is the coefficient of thermal expansion in the glassy state.
F. EFFECT OF ST3ESS FIELD
Yielding seems to be a very general phenomenon in glassy polymers, provided that fracture does not take place first. This can be illustrated for polystyrene in tension by using molecular preorientation to raise the tensile strength to values above the yield stress, in which case" the mode of failure changes from brittle fracture to yielding. Under compressive stresc, PS normally shows yield rather than fracture. Thus, glassy polymers such as PS are not brittle materials in the classic sense described by tho Griffith criterion, even though they are ordinarily regarded as "brittle" materials under practical use conditions.
1» Effect of the Hydrostatic Component oft Stress Tensor "~~ ' "" ~"~~ " ~ * 'w*
Glassy polymers actually behave more like clasric plastic materials at high strains and stresses, and we have carried out a preliminary exploration of this plastic behavior as a function of the nature of the stress field. Experiments have been run on PS at room temperature (22°c)
12

at a strain rate of about 10"4 sec"1 in the following stress fields: (1) uniaxial tension, (2) uniaxial com- pression, (3) torsional shear, (4) plane strain compress- ion, and (5) biaxial tension. There were slight differences in sample geometry, presence or degree of preorientation, and sample material in these experiments, but since other observations have indicated that none of these variables has a very significant effect on the value of the yield stress, we have disregarded these minor differences and have collected these values in the plot of figure 6. Values of yield stress were calculated from the load peak in the stres? strain curve. The principal stresses are denoted as o, and 02 on the two axes in the usual way (03 = 0). The relationship between principal stress axis and sample axis depends, of course, on the tyje of experi- ment. A line has been drawn to connect the yield stress data, and the resulting figure, which is symmetrical around the 01 ■ 02 diagonal, is commonly referred to as a "yield locus". The numbers in circles refer to the different types of experiment listed above. The "fracture locus" for unoriented PS is also sketched in the figure for comparison, and since it lies within the yield locus in parts of the tensile and shear quadrants, it is clear that fracture will take place before yield in unoriented PS in these stress fields.
The most important conclusion to be drawn from figure 6 is that there is a significant effect of the mean stress (hydrostatic component of the stress tensor) in the yield- ing of PS. This dependence on the mean stress is seen in a simple way in the significant difference between the values of the yield stress for uniaxial tension and compression (10,000 psi vs. 14,000 psi, respectively). The yield locus corresponding to the Tresca yield criterion, which applies to plastic yielding ir metals, is also sketched in figure 6 as a dashed line and is represented by the equation
where T^X is the maximum shear stress, o^ and 03 are the principal stresses and y is the yield stress in uniaxial tension. The predominant role of the shear stress, with no dependence on mean stress, is clear from the Tresca criterion, One advantage of setting up such a yield criterion is that is allows the prediction of yield stresses in more complex types of stress field from a knowledge of basic material constants, such as the value of the yield stress, y, in a
13

simple uniaxial stress field.
The yield behavior shown by PS, where dilatation (or mean stress) effects are prominent, seems more analo- gous to the behavior of soils than to the behavior of such solids as metals and ceramics. It is best represented by the Mohr yield criterion which contains a term with the mean hydrostatic stress, ora = (01+02+03)73 combined with a material parameter (tan <fr), which relates to the direction of the yielding mode.
a _ Vr+ om tan $ (3) Tmax
°1 _ °3
One reason for the greater importance of volume effects in glassy polymers may be the fact that the ratio of yield stress to bulk modulus, a quantity which is proportional to volume change at the yield point, is orders of magnitude higher for the glassy polymers than for metals, even though the absolute magnitude of the yield stresses is similar for the two classes of materials. These experiments have been further discussed recently3.
2. Behavior in Torsion under Hydrostatic Pressure
The following experiments were initiated as a more ideal method of studying the effects of pressure and stress field on yielding. With this method, (torsion of thin wall tubes) the basic shear stress field is of a particularly simple nature, and it is possible to vary the superposed pressure independently of the shear stress. Thus, a more complete exploration of three-dimensional stress space is possible. Although the results of tests with PS were incomplete, it seems useful to summarize the technique and method of analysis.
A sketch of the device constructed to perform these torsion experiments under pressure is shown in figure 7. The specimen (1) is held firmly by two torque rods(2) and (3), which are attached to a hand-driven torsion de -ice (not shown in the sketch). When a torque is applied to the specimen, the fluted section (4) of low torsional stiffness enables the end of rod ;2) to undergo a small but measurable amount of elastic twist with respect to the fixed frame of the machine without any complications which could have been produced by friction f.:om the Bridgman» type high pressure seals. Pressurized water is introduced into the pressure chamber (7) through the pressure line (6)
14

The water is pressurized around the specimen by means of a hand pump to about 5000-6000 psi.
A number of experiments were performed on both solid and thin-walled tubular specimens under superposed pressures of up to 10,000 psi. In these experiments the pressurizing fluid was tap water which was contaminated with hydraulic oil. In all experiments fracture preceded plastic deforma- tion. Examination of the fractured specimens showed that fracture was always helicoidal with its origin lying inside the gauge section.
The specimens which fractured at low superposed pressures showed many crazing cracks on the surface while those fracturing at high superposed pressures did not show any crazing cracks. The results of four selected experiments are reported in Table I.
The results given in the table indicate a reduction of the tensile strength of the polystyrene specimens in the pressurized environment. If the Griffith theory of brittle fracture under multi-axial stress conditions is assumed to be Vcilid in these experiments, the fracture should obey the Griffith equation4,
(S, - S0)2 + 8 S (S. + S0) = 0 (4)
± i o i i
where the symbols have the meanings indicated in Table I.
Experiment #4 which is typical for the case of uniaxial compression gives the propagation stress for deformation bands through the specimen instead of the fracture stress. The value S entered for experiment #4, therefore, is a lower limit°for the t nsile strength as calculated from the Griffith equation—the actual value, in all probability, being much higher. On the other hand, the tensile strength S calculated from the Griffith equation for the first three experiments listed in Table I is only around 650 psi. This indicates that the pressurizing medium made up of tap water contaminated with hydraulic oil has had an embrittling effect on the polystyrene specimens. Protection of the surfaces of solid specimens with hydraulic sealing tape or with a tightly fitting rubber tube was evidently not effective in preventing contact of the pressurizing medium with the surface, as the results indicate. These results suggest that the experiments should be repeated with another pressur- izing medium free of embrittling effects such as, perhaps, dry silicone oil.
15
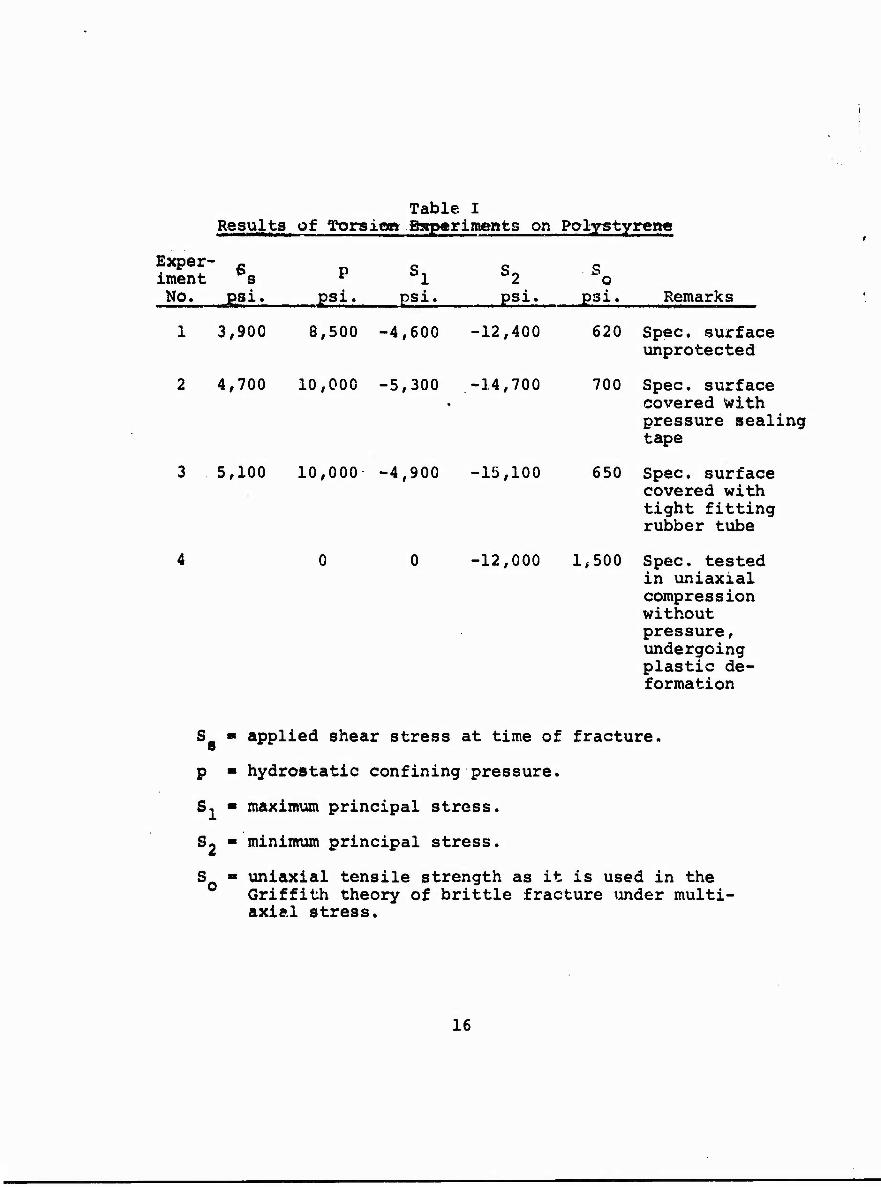
Table I Results of Torsion: 8stp«riments on Polystyrene
Exper- Ä c c c iment tes p bl b2 o No. Psi« psi. psi. psi. psi. Remarks
1 3,900 8,500 -4,600 -12,400 620 Spec, surface unprotected
2 4,700 10,000 -5,300 -14,700 700 Spec, surface covered with pressure sealing tape
3 5,100 10,000- -4,900 -15,100 650 Spec, surface covered with tight fitting rubber tube
4 0 0 -12,000 1,500 Spec, tested in uniaxial compression without pressure, undergoing plastic de- formation
Sa " applied shear stress at time of fracture.
p ■ hydrostatic confining pressure.
S, ■ maximum principal stress.
S- ■ minimum principal stress.
S ■ uniaxial tensile strength as it is used in the Griffith theory of brittle fracture under multi- axial stress.
16

III. TIME EFFECTS —J— -
A. INTRODUCTION
Important rate effects are noticed in the yielding and drawing processes in glassy amorphous polymers. In connection with the practical problem of the high-speed "strength" of polymers, these rate effects are usually characterizedcby stress-strain tests run over a range of strain rates. Although much data of this sort have been accumulated->, there are inherent limitations to this approach. Practically, the range of strain rates usually available on the conventional testing machines is not large, though the use of time-temperature superposition can be used to extend the effective range of testing rates6. Furthermore, stress-strain data are not the simplest type to analyze and interpret because of the continual change of stress and strain (also true and plastic strain rate) during the test. The only quantity held constant during the test is strain rate.
Stress relaxation (at constant strain), creep recovery (at zero stress), and creep (under constant load) are simpler types of experiment»,which are frequently: used at low stresses, where linear viscoelastic theory is applicable.
One of our objectives in the work here was to use these methods of stress relaxation, creep under dead load, and creep recovery in the high stress range of yielding, where non-linear viscoelastic and plastic effects are observed and the deformation may not be homogeneous. We have also studied the more complicated time effects associated with drawing by experiments that interrupt the yielding process; in this way, it is also possible to more closely associate the time effects with particular modes of yield deformation.
B. STRESS RELWAATION AND STRAIN RECOVERY
These experiments were carried out by straining at a constant rate to (a) stress levels up to the range of the upper y^eld stress, and to (b) strains beyond the upper yield point and into the drawing range. The strain- ing was then interrupted in various ways to create differ- ent types of histories. When the sample was then restrained at a constant rate, the change of properties ("hardening"
17

or "softening") could be clearly observed. The histories employed during the interruption period included stress relaxation at constant strain, creep recovery at zero strtss, and various combinations of the two, and the basic experi- mental variables were stress field, stress level, and time.
1» Stress Relaxation as a Function of Stress Level.
Stress relaxation behavior before the upper yield point was studied as a function of the stress level for both tension and compression.
Polystyrene (Compression)—The most complete stress relaxation data were obtained for a compression sample and the schematic stepwise loading history is shown in figure 8. The sample was strained at a relatively rapid rate to each successive load level at lüO-pound increments, allowed to relax for thirty minutes, then strained to the next level, and this process repeated. The extrapolation of each relaxation curve is shown as a dotted line. By keeping track of the displacement of the machine cross- head and making appropriate corrections, a load(stress)- strain curve was calculated. As shown in figure 8, this curve was linear with an elastic modulus of 3.4 x 10^ psi in the entire load range studied.
Because of the linearity of the load-strain curve, it seemed that the stress relaxation curves might obey the Boltzmann superposition principle (i.e., be independently and linearly additive). Thus, the difference between any one stress relaxation curve, say at 400 pounds, and the extrapolation (dotted line) of the previous curve should represent the stress relaxation behavior of that increment alone. In this way, the stress relaxation behavior of successive load increments could be determined independently.
Several of the curves of stress-difference vs. time for this sample are shown in figure 9, where the curves are designated by their initial or highest stress for each cycle and normalized according to this stress (oQ). The relaxation curves for low initial stresses are very flat, as ordinarily observed in the viscoelastic relaxation of glassy polymers. As the stress level is increased, the relaxation becomes more rapid and the curves shift to shorter times and become more sigmoidal. The relaxation curves at high stress levels show almost complete decay in about three cycles of log time, indicating that they
18

are approaching the Maxwellian shape corresponding to a single relaxation time. If a relaxation time for the other curves is defined as the time where the stress (difference) rails to 0.36 of its original value, then a curve of relaxation time vs. stress level can be constructed as shown in figure 10. If, from stress-strain experiment*», the yield stress and the time of loading to the upper yield stress are included in the same plot, the data from the two different types of experiments seem to fall on the same curve. It would appear, then, that this curve might well represent the strain rate dependence of the upper yield point over quite a range of rates.
In an attempt to identify the beginning of yielding in stress-strain data, the proportional limit stress (where the stress-strain curve starts to deviate from linearity) vs. the corresponding time values is also plotted in figure 10 In terms of the stress relaxation curves of figure 9, these time and stress combinations correspond to relaxation of only 5-15% of the original stress.
Polystyrene (Tension)—A number of samples of oriented 0.0017" polystyrene film (An0 = 20 x 10"
4 measured in the plane of the film) were tested in stress relaxation at various stress levels. Data given in figure 11 show that the behavior was similar to that discussed above for the bulk compression sample, even though equal stress increments were not used for the film. The significant deviations corresponding to the onset of yield occur at stress values which are low compared to the stress values in compression and even compared with the upper yield stress in tension (10,800 psi at 0.5 minute loading time)«
2. Stress Relaxation in the Upper Yield Stress Range
a. Relaxation Rate and Deformation Modes
Since the stress relaxation rate has been seen to increase progressively as the stress level is raised towards the upper yield stress, we will n^w consider the question of what happens right, around the upper yield stress, where the nature of the deformation mode begins to become compli- cated» In the present section, emphasis will be placed on the stress-strain-time behavior; the details of the various deformation modes are discussed below and thus will be mentioned here only where necessary for understanding of the relaxation data. Some definitions of verms are important at this point, however. In the film samples, a
19

neck is defined as any area on the fi^m which has yielded through the whole thickness direction. These areas are of two types. A micro neck is defined as a small yielded area (usually less than 1/16 inch in the tensile direc- tion) not extending across the whole width of the sample; this usually starts at one edge and grows across the width to the other edge like a crack or tear. A macro neck, on the other hand, is defined as a neck which already ex<- tends across the whole width of the sample, and therefore grows by increasing its length in the tensile direction.
In the experiments discussed in the preceding section, a step-by-step increase in load level was employed in order to study incremental relaxation behavior at different stress levels. In the present experiments, the sample was immediately loaded into the stress range where yielding is observed, and incremental relaxation behavior was studied by applying strain increments which maintained the sample in,this stress range. The computation of the incremental relaxation behavior was done as before, i.e., as the difference between the experimental relaxation curve and the extrapolated preceding relaxation curve.
In general, it was found that the propagation of different deformation modes could be associated with different rates of stress relaxation. For example, during the slow, pseudo-stable propagation of deformation bands or micro-necks across the width of the film, the relaxa- tion rate was relatively slow, although it had a concave downward shape vs. log time. When the plastic yielding zone (whether a micro neck or more diffuse form of yield- ing) reached the other side of the sample, thus forming a macro neck, an abrupt increase in the relaxation rate occurred. This higher relaxation rate is generally associated wijth the propagation of a macro neck—an observation which is further explored below during relaxation after drawing.
Experiments on PS film strips at slightly higher stresses showed similar yielding effects during their initial relaxation period. For example, some samples, loaded to just under the yield point, underwent what may be defined as "spontaneous necking"—a process whereby a sample undergoes a delayed necking at a constant strain which is less than the usual yield strain. This is behavior complementary to that observed in a dead load creep experi- ment in which a sample undergces a delayed necking at a
20

constant load which is less than the usual yielJ " -<ad. In the case of these film samples, it was possible to observe the details of the deformation modes during the "delay time", which is the elapsed period of time prior to macro- scopic necking, and to relate the stress -relaxation curvej to the growth of micro necks. Generally, as the micro necks spread across the sample width, they become unstable and their rate of growth constantly increases (even against linear time), and consequently the stress relaxation rate increases.
b. Effect of Stress Relaxation Before Upper Yield on Subsequent Stress-Strain Behavior "*
The influence of relaxation on stress-strain behavior was also studied by running stress relaxations and load- unload histories on samples before they had reached the upper yield stress. The stress-strain properties of the samples upon restraining after these histories can then be compared with the properties of a virgin sample. Because the stress-strain behavior of these materials had been extensively studied, most of these histories were studied on Formvar and Lexan films.
The general result obtained is that stress-relaxation at a high stress but before necking, results in a reload- ing curve to the upper yield stress which has a greater slope (higher modulus) and a higher and sharper upper yield peak(relative to its subsequent steady-state drawing stress). These increases in slope and height of upper yield peak appear to be greater the longer the relaxation time and the higher the stress level during the relaxation. This hardening and strengthening effect of stress relaxation when carried out before the upper yield point, was also found for PMMA samples in tension at 75°C and in compression at 22°C, although the magnitude of increase of the upper yield stress is not as large in PMMA as in PS.
It is probably this hardening effect of stress relaxation that causes the stress-strain behavior of the compression sample illustrated in figure 8 to be apparently linear up to such high stress levels. In other words, each period of stress relaxation hardens the sample so that upon application of the subsequent load increment, a constant high modulus is shown, even up to very high stresses.
21

3. Stress Relaxation and Strain Recovery during Drawing
Some very significant and revealing experiments ou time effects can be performed during the course of steady- state drawing, which help to clarify the nature of the "plastic atate of glassy polymers. These experiments, in which drawing or yielding is interrupted and resumed, were first reported by yincent7. The interruption of yielding can be carried out in two ways: (1) the straining can be simply stopped, and the sample allowed to undergo stress relaxation at constant strain, or (2) the straining can be reversed so as to remove all stress from the sample during the interruption period. The effects of these two types of interruption are quite different. Figure 12 illustrates this schematically, in the form of a load- elongation history of a tensile specimen strained at constant machine crosshead rate. The first loading takes the specimen through the yield point (Ly1), formation of a neck, and into steady-state drawing at Lp1. If the crosshead of the machine is then stopped, the sample undergoes stress relaxation at constant strain. Upon reloading, the slope (S2) of the load vs. elongation curve is much steeper than the original slope (Sl) , and a new value of the upper yield point (Ly2) is obtained, the level of which is dependent on the time of stress relaxation.
If the load on the sample is completely released at a rapid rave by reversing the crosshead, and the sample is allowed to retract freely, as in the second sequence of figure 12, the slope (S3) of the load**elongation curve on reloading (measured at an arbitrarily selected load value less than the drawing load) is much lower than the original (S1) and no upper yield point (yield peak) is observed. In all the steps of this sequence, the nteady- state drawing load remains about constant (L^1 - XJD2 = Lp3)• Variations and combinations of these two b?sic histories, such as: retraction/partial reloading/relaxation/ reloading, were also investigated and the results will be discussed below.
a' Stress Relaxation Followed by Reloading '
The type of experiment to be discussed here has been illustrated in figure 12. Since a large number of experiments were carried out, the results will be viscussed for the different polymers individually in the sections which follow. All the results are expressed in terms of
22

loads or load ratios. Stresses are not calculated because of the lack of precision in defining the actual cross-sectional area undergoing deformation. Due to minor thickness variations an^ other experimental var- iables, such as multiple neck formation, the yield and drawing loads were not always constant from sample to sample, so the yield drop is expressed as a relative yield drop, ALyD/LD =(Ly - ED)/LD. The load decay during stress relaxation from the original (Lp) to the final load (Lp) is similarly expressed as a relative relaxation, ALoF/L0 = (L0 - LF)/L0.
The data are presented below äs relative yield drop (ALyD/LD) vs. the log of stress relaxation time. This quantity could equally well have been plotted vs. relative stress decay (ALoF/L0), because, for the three materials most extensively investigated (Formvar, Lexan and Nylon 6-10), there is a linear relationship between relative stress decay and log stress relaxation time. In these polymers, there is about a 12% stress reduction for each cycle of log time, independent of the original stress or material.
Formvar
The increase of the upper yield peak with increasing time of stress relaxation is shown in figure 13 for Formvar film at 22°C. Most of this increase occurs over only three cycles of log time, and from this ^urve it is possible to define a "relaxation time" of about three minutes for whatever process is involved here. It should be noted that the final limit^i-.g value of relative yield drop (.15) after very long times of stress relaxa- tion is only about half the initial relative yield drop (.30) when necking first took place. This is probably related to the fact that the neck already exists; this may be important either because of the nature of the stress concentration in the neck shoulder, or the reduced cross-sectional area of the neck, which is almost exactly one-half of the original cross-sectional area.
For Formvar the slopes of the loading curves after stress relaxation (measured at an arbitrarily fixed load lftvel) were all about the same as the original loading slope, independent of the stress-relaxation time or height of the upper yield point. The sharpness of the upper yield point and its position, i.e., amount of
23

plastic strain at yield (e?) , aliojuc about the same. Although the'upper yield-»p&Lrtts- were slightly .more r rounded arid occurred at higher strains in the experiments at vezy short relaxation times, where the yield drops were low, the shape of the loading curve for Formvar was nearly constant*-önly the height changed appreciably.
The increase in height of the upper yield peak is a function not only o* the time of stress relaxation, but also of the stress range in which the relaxation took place. The effect of this stress range will be described in more detail below, but essentially the data show thatr, for a given stress relaxation time., when the relaxation takes place below a certain minimum load level, no upper yield point is seen upon reloading*
•Nylon
The increase of the upper yield peak with increasing time of stress relaxation is shown in figure 14 for Nylon- film at 22°C. The increase is seen to be more abrupt* than for Formvar. Most of the increase occurs over less" than two cycles of log time, for which a "relaxation timer" of about five minutes can be defined. The final limiting value of the relative yield drop (0.17) reached at long times of relaxation is again about half the original (0.34) The scatter in the data is much less than in the case of Formvar. This is probably due to the more uniform thick- ness of the Nylon. Multiple neck formation was frequeirfcly seen in Nylon arid as many as five separate necks were- observed to form in a sample with an original gattge lengtn of 2". This strong tendency to.multiple necking.in Nylon was also commented on by Williams and Bender®';*.
For Nylon, the slopes of the reloading curves after stress relaxation (again measured at an arbitrary fixed- load level) were a function of the stress relaxation- time. From a low of 0„13 (arbitrary units) at the shortest- timr of relaxation, the slopes increased to about 0.30 (at four minutes of relaxation) and then remained constant for longer times. The initial loading slopes before necking were closer to 0.50. There was some slightvvaria- ticn in the sharpness of the upper yield peak and in the amount of plastic strain at the yield point (e^) as a result of the relaxation. This may be connected with the details of the micro deformation modes, described elsewhere.
24

Lexan
The increase of the upper yield peak with increasing time of stress relaxation is shown in figure 15 for strips of Lexan film. These samples were stretched at 22°C at two Instron crosshead speeds, 1.0"/min and 0.2"/min. Just as for the two polymers previously discussed, the curve obtained from the 0.2"/min tests has the same sigmoidai shape, about the same relaxation time of three minutes, and a limiting, long-time value of the yield drop (0.042) about half the original (0.085). Thus, the yielding behavior is similar to that of the other polymers even though the yield drop has a very mud. smaller magnitude (less than 10% of drawing load).
In the l"/min tests, the drawing loads observed were almost exactly the same as for the slower speed. Yet, it is observed that the upper yield point undergoes an increase in magnitude in the usual way as a result of stress relaxation, but has a shorter relaxation time associated with it. The ratio of "relaxation times" (for the yield peak increase) for the two crosshead speeds is larger than the factor of 5 in crosshead speed.
Saran
The increase of the upper yield peak w: Hi increasing stress relaxation time for Saran at two crosshead speeds, is shown in figure 16, and contrasts greatly with the Lexan results. The curves for Saran at the two cross- head speeds have the same shape and are displaced along the log time axis approximately by the same factor of 5 as the ratio of crosshead speeds.
Two significant observations concerning this polymer should be noted. First, no evidence of inhomogeneous deformation (band formation) could be seen by viewing, either normally or between crossed polariz?rs, even when a definite upper yield point and yield drop appeared on the load-elongation curve after periods of stress relaxa- tion. Second, there is no upper yield point or yield drop upon initial loading and the drawing curve has a definite upward slope to it rather than remaining level (see figure 17). This phenomenon is seen often for drawn fibers, and in the metals and ceramics field, and has been designated as a "constant rate of strain harden- ing". Upon reloading after stress relaxation, however, a
25

definite yield peak appears, as shown in figure 17. This is followed by_ drawing, which continues along the same strain hardening line of upward slope, but displaced in time as a result of the relaxation interval. If the yield peak is disregarded, the drawing load appears to begin to increase again only after the load exceeds the previous load maximum-;
b. Stress Relaxation Behavior during Interrupted brawing.
Some comments can be made regarding the detailed nature of the stress relaxation curves obtained during intexruptred drawing. One general observation is that the relaxation rate following interrupted drawing is initially higher than the rate for undrawn material at the same stress level. However, at longer tirues of relaxation (102 - 103
minutes), the relaxation rates for drawn and undrai n material are similar. Another general result is t. at many of the differences and similarities between the history; dependent stress-strain properties of the different polymers, described above, are reflected by analogous differences and similarities in the relaxation curves-. The more exact relationships between relaxation behavior during interrupted drawing and the stress-strain properties obtained on subsequent reloading can only be established by further investigation.
c. Retraction at.ZerovLoad Followed bylKeloading.
This type of experiment is illustrated in figure 12. Here, the Instron crosshead is reversed while the sample is undergoing drawing. After a given period at zero load, during which the sample retracts freely, the sample is reloaded at the original crosshead rate. Almost all the materials investigated showed no evidenc i of an upper yield point after this history—rather, :he load gradually and asymptotically increased to the drawing level when elongation was resumed. (The upper yield peak is recovered at long times of unloading, however.) The slope of the reloading curve at a specified load value, usually taken as 70-80% of the drawing load, was used as an index of the change of material behavior after this history, in the usual way. The retraction of strain at zero load was measured for some of the materials as a function of time.
26

This softening effect of unloading is very similar to the "Eauschinger effect" which has been studied extensively for many metals. The Bauschinger effect, originally defined as the lowered deformation resistance in one direction after prestraining in the opposite direction, can be regarded in a'more general sense as referring to any unloading-loading cycle^0. This softening effect in glassy polymers is illustrated for Formvar film samples in tension in figure 18, where the unloading and loading were all done at the same crosshead rate. The load- elongation plot shows a hysteresis effect, a low proportion- al limit stress (linear elastic limit) on reloading, and a rounding of the "corner" of the reloading curve. These are all characteristic of the Bauschinger effect. The solid reloading line in figure 18 represents a sample immediately reloaded just after the unloading reached zero stress; the dotted line is for a sample left at zero load for 20 minutes before reloading. The 'Bausch ".nger strain", equivalent to the plastic strain of the reloading curve (the difference between the reloading curve and the extra- polation of the original elastic modulus) is also shown in figure 18 as a function of the reloading load.
Figure 19 presents thr> reloading slopes (as defined above) of Formvar, Nylon and Lexan as a function of time at zero load. The values of the slopes as presented are in arbitrary units, but the change of these slopes is proportional to the change in modulus of the respective polymers. Even though there is quite a bit of experimental scatter, it can be seen that, in general, tn«L results are more complicated than for the relaxation histories des- cribed previously. The slope values first decrease, then rise again towards the original value as the cime at zero load increases. Using the arbitrary units of figure 19, the slopes of these polymers on initial loading (before necking) were: Formvar = 4.5 to 5.5, Nylon = 5.0, Lexan = 1.3 to 2.5.
The appearance of a minimum in these curves of re- loading slope vs. recovery time suggests that two processes are operative, one which "softens", and another which "hardens" the material with increasing time. The "soften- ing"' process, illustrated as an increased Bauchinger effect with increased time in figure 18, is most evident after short times at zero load. The "hardening" process seems to become operative only after the "softening" process slows down, The "hardening" process is no doubt related to the increase of upper yield peak after relaxation,
27

as described above, but, in the relaxation case, the "hardening" process is shifted to shorter times as the- relaxation takes place rt higher stress levels. The rate of the "softening" process appears to be related to the rate of strain retraction at zero load, measurements of which are discussed in the following section.
d. Retraction of Strain aiter^Drawing:
The sample retraction observed after the load is reduced from the c" rawing value to zero is shown for several samples ir figure 20, where retraction in inches is plotted vs. log time. The data show, at least for the PMMA samples, tha^ the retraction occurs at ever decreasing rates, even agaim t log time, and would undoubtedly level out at long times. This is the type of curve obtained »in normal viscoel&stic retraction experiments. The decreasing part of the curves of reloading slope vs. time » at zero load (figure 19) could perhaps be associated with this effect.
To get an idea of the magnitude of total retraction, a Nylon strip sample was loaded through the yield point to a steady drawing load, unloaded and then allowed to retract for 1200 minutes. The total strain attained under load was 34%. The total retraction after 1200 minutes was about 18%, of which 16% would be viscoelastic or time dependent retraction, and 2% immediate elastic retraction on unloading. Thus, about one-half of the total "plastic" strain was actually recoverable on stand- ing, in contract to the usual definition of plastic strain. (The plastic strain would be totally recoverable if the sample were heated above the melting point.)
e. Other Stress-Time ^Histories
The following results indicate that the processes of retraction and relaxation during interrupted drawing have distinct and opposite effects on subsequent stress- strain behavior. Hardening can be associated with relaxa- tion and softening can be associated with retraction, at least at short times. Relative proportions of these two effects can be obtained by suitable combinations of these two types of history,
Drawing/Retraction/Stres Relaxation
This history is schematically illustrated in figure
28

21, where typical differences in stress-strain behavior upon sequential loading are shown. In the histories illustrated, the free relaxation periods were both of one minute duracion, but the stress level of the relaxation period is varied.
The results in figure 21 indicate that stress relaxa- tion for one minute does not modify the effect of a previous free retraction of equal duration unless the stress level for the relaxation is above 10 lbs. (above 50% of upper yield load or 60% of drawing load). However, at initial 1 ds for relaxation higher than 10 lbs. both the slope ot the reloading curve and the rela- tive yield drop increase towards their upper limits.
Quite similar results were obtained for Lexan film samples subjected to a 0.4 minute free retraction period followed by a one-minute stress relaxation period. As above, the slope of the reloading curve and the relative yield drop increased to their upper limits provided stress relaxation was carried out at load levels above 60% of the drawing load. The effect of stress relaxation time at constant initial load was also investigated. As the strrss relaxation time increased, the relative yield drop got closer to what had been obtained before' (figure 15) as a result of stress relaxation without a preceding free retraction period. In other words, the effect of a free retraction period on stress-strain behavior becomes less important as either the stress level or relaxation time of an intervening stress relaxation period becomes greater.
Drawing/Stress Relaxation/Retraction
This history is, in a way, the reverse of the preceding one. Here, we ask what is the residual effect of a stress relaxation period starting from the drawing load, if it is followed by a period of free retraction at zero load. This type of history is illustrated in figure 22, along with the results for Pormvar. The systematic decrease to zero of the relative yield drop with increased free retraction time suggests that all that is needed to erase a previous stress relaxation effect is about an equal time of free retraction at zero load.
C. DELAYED DRAWING UNDER DEAD LOAD.-
1. Introduction 29

2 In the previous report mentioned above , some
experiments on PS were described in which cold*-drawing-
was initiated with a constant load attached to the polymer- specimen. This type of experiment has also been described previously in the literature8'11. In drawing experiments carried out at constant strain rate, the formation and propagation of a neck after some degree of uniform extension is the phenomenon typically observed. This formation and propagation of a neck is also observed in many cases for the constant load experiments, but other, seemingly uniform modes of extension also occur. Drawing initiates some time after load application; the time required has been termed the "delay time". This delay time may vary from seconds to many hours, depending on material properties and experimental conditions. At sufficiently low stress levels the polymer deforms uni- formly (no localized necking) and at a decreasing rate- under a constant load, due to viscoelastic creep. Drawing takes place when the stress is sufficiently high. In the studies reported here, we have attempted to establish the conditions under which one or the other mode of deformation occurs, and to study quantitatively the effects of the most important experimental variables.
12 It was established previously that temperature, stress level and molecular preorient&tion are i nportant variables affecting the dead load drawing behavior. This information was used to plan the present experiments. In the course of the present work it was found that thermal history, and in tne case of PMMA, moisture absorption, are also experimental variables of considerable importance.
2. Experimental Procedure
Specimens of both PS and PMMA were milled from cast sheet, l/16th inch thick. The parallel gauge section of the test specimen was 1.8 by 0.25 in, with a fillet radius of 7/16th in. The thickness of the preoriented specimens varied according to the degree of preorientation; the starting thickness was always l/16th in.
A special preorienting device (see figure 23) was built, consisting of two heated aluminum plates, the temperature of which could be held constant at any desired value. The plates were arranged in such a way as to provide a vertical air space between them, into which strips of polymer were inserted. Convection of outside air into the heated slot was prevented by felt strips
30

glued to the edges of the plates. The polymer strips were held by a clamp at each end, the lower clamp being movable by hand. After a heating time of the order of ten minutes, the plates were moved apart and the strip quickly extended to the desired length and allowed tc cool in the room temperature air.
The birefringence produced by this hot orientation procedure was used as a measure of the degree of molecular preorientation. Birefringence was measured with wedge compensators having retardation ranges from nearly zero to 25 orders for the mercury green line (5461 A). These wedge compensators were milled from oriented PS or PMMA pieces.
The dead load experiments were carried out in a thermostated chamber with forced air circulation (figure 24) which was specially designed and built for the purpose. The temperature variations at any specimen position were smaller than +0.5°C. The chamber allowed three specimens to be run at the same time. The length changes were either measured with a cathetometer or were recorded on drums wrapped with chart paper and driven at a constant rotation rate by synchronous motors. Ballpoint pens were attached to-the connecting rods carrying the weights and these gave a continuous trace of the specimen length on the drums.
The temperature chamber contained windows to permit observation of the samples, including visual or photo- graphic monitoring of their shape changes and modes of deformation and approximate measurement of changes in their optical, anisötropy.
3. Results; Polystyrene
In order to obtain drawing in PS, some pre- orientation had to be introduced in the direction of tha stress. The preorientation serves to raise the fracture stress to values above t-he yield stress. The glass transition temperature of the polymer used was 90°C, and it was preoriented at 115°C. The higher the orienta- tion, the more cautiously the specimens had to be machined, as there was a tendency for them to split in the orienta- tion direction.
Temperature, stress and preorientation were varied
31

in such a way that the experimental points could be regarded as being the lattice points of a three-dimensional lattice. Temperature was varied in steps of 5° or 10 °C, stress in increments of 400 or 800 psi, and three preorientation levels were used (An = 1, 5 and 10 x 10~3).
Three different types of elongation-time curve (figure 25) were observed in these experiments. When the specimen drew with a neck (curve a), deformation first took place homogeneously for some time and at a slow rate. The rate then increased until a constant rate, several times higher than the initial one, was again reached. Simul- taneous with this acceleration of deformation rate, the appearance of a constriction somewhere along the specimen was observed. This developed into a neck; when the steeper slope was reached, the neck had formed and the specimen was drawing by propagation of the neck. When the aeck had reached the ends of the specimen, elongation became slow and homogeneous again. The intersection of the first and second straight line regions of the drawing curve (figure 26) was taken as defining the delay time, t^, and the delay strain, e^. These two quantities were tabulated from the experiments.
Sometimes deformation remained homogeneous. In this case, high strains were sometimes reached after sufficiently long times (figure 25b); however, in other cases deforma- tion rate decreased progressively with time and only com- paratively small strains were attained even after very long times (see figure 25c).
Figures 27 and 2 8 are representative results for delay times and delay elongations for the polymer samples with preorientation An = 10 x 10" 3. These results are in the form of a combination table and graph. A complete presentation of the results obtained for all three pre- orientations has been given in a recent publication^-3. At any fixed value of preorientation, the delay times (figure 27) increase with decreasing stress and decreasing temp- erature, as would he intuitively expected. Below a certain critical stress, which decreases with increasing temperature, extension is homogeneous. The stress-temperature plane is thus divided into two distinct regions—one in which cold-drawing takes place by the formation and propagation of a neck, and another in which the deformation is homo- geneous and consists merely of viscoelastic creep. In the region above the boundary line, type "a" deformation (figure 25) is obtained; below tha boundary line, type "c"
32

deformation takes place. The third type of deformation, "homogeneous drawing" (figure 25b),was observed in the vicinity of the boundary line, particularly at higher temperatures. At the lowest degree of preorientation (An = 1 x 10"3), drawing occurred only in a limited region at high temperatures and low stresses. At higher stresses specimens failed by fracture, either immediately or after some time, before cold drawing had started13.
The change in deformation mode is also reflected in the delay elongations (figure 2 8). The elongation at which necking initiates is usually of the order of 5 to 10%. In the region of "homogeneous deformation", much higher strains than this can be reached after sufficient time, without the occurrence of necking. These specimens apparently reached the stress necessary for necking only after some reduction in cross-section had taken place by homogeneous creep. This borderline case could perhaps be avoided by carrying out the experiments at a strictly constant stress rather than at constant load. This was not done for the sake of experimental simplicity.
At the onset of necking, localized areas of high strain were always seen in the samples. These "deformation bands"I'l^ ran across the specimen at an angle of approx- imately 50° to the stress axis. The band? usually formed to some degree along the entire gauge length. The neck would form either where the band density was highest, or where some of the individual bands were particularly pronounced. Sometimes a great number of bands formed simultaneously and so densely that no single neck was formed, and drawing took place entirely by proliferation of the band structure. On superficial observation, the spec- imen appeared to be drawing homogeneously, but closer inspection revealed a great number of these shear deforma- tion bands.
When the deformation remained truly homogeneous (type "c" extension, figure 25), no bands could be observed during the experiment, nor could they be detected by microscopic inspection afterwards. The origin points of the deformation bands were often imperfections at the edges of the specimen. In all specimens crazes and internal cracks developed to some degree after load application and these became sources of deformation bands. Figure 29 shows an example of this. The row of cracks which can be seen in this photograph developed in the interior of the specimen in the center of the specimen
33

gauge area when the specimen was stressed. Band structures could be observed particularly in the neck of the PS specimens and in the undrawn material close to the neck. In the drawn region of the specimens, over which the neck had passed, the bands had disappeared. Figure 30 shows part of a neck in a flat specimen with a dense pattern of intersecting deformation bands.
4. Results; Polymethyl Methacrylate
Commercial PMMA cast sheet produced by Rohm and Haas Company (Plexiglas II UVA) was used in this study. The polymer had a glass transition temperature of approx- imately 106°C. The experiments were all carried out on samples without preorientation, since PMMA will draw with- out precrientation (unlike PS). In many of the measure- ments on PMMA the windows of the chamber were used to project an image of the specimen on a ground glass screen by means of a point light source. A carbon arc, focus .d by a condenser lens on a pin hole in a thin brass sheet/ served as the point light source. With this simple arrangement, optical inhomogeneities developing during deformation were easily observed as dark areas in the projected image (Schlieren" patterns).
The time allowed for thermal equilibration of the specimen in the test chamber before load application was kept constant to reduce variations due to thermal history effects. Initially, all specimens were kept for three or more weeks in air of 65% RH and 22°C. These conditions result in 0.6% absorbed moisture in PMMA. When it was found that moisture is one of the important variables in the yielding of PMMA, further experiments were made with dried specimens. Three days' exposure in 80°C dry air was chosen as the drying procedure. No further witer loss was observed on more prolonged heating, as indicated by ^ample weight.
The behavior of the PMMA in dead load experiments was very similar to that of polystyrene. At low stress the specimens deformed by creep, but above a certain charac- teristic stress an instability in the elongation vs. time curve appeared of the nature shown in figure 26. The occurrence of the instability was first indicated by optical inhomogeneities (bands) growing froi the specime I edges, oblique to the stress direction, tow-rds the centar of the sample. These bands were detectable by Schlieren observations before the rapid part of the < <ld drawing
34

curve had occurred and they continued to persist in the neck or in the homogeneously drawing sample. The typical phases of their appearance and their relation to the specimen behavior were, in fact, the same as described above for polystyrene. Varying density of their formation indicated that necking would occur (where their density was greatest); uniform denisty indicated that macro- scopically homogeneous deformation would take place ("homogeneous drawing"). For both modes of drawing the curve of figure 26 is typical. When only viscoelastic creep was observed, there was no indication of band forma- tion. The use of the Schlieren technique to observe the deformation bands in PMMA was necessary because they are difficult to see clearly by visual observation, unlike the bands in PS. In some of our early studies, in fact, it was concluded incorrectly from visual observations that defor- mation bands did not form in PMMA.
Figures 31 and 32 present the delay time and delay elongation values determined from tests at various combina- tions of stress and temperature. At each temperature there is a critical stress, lying on the boundary drawn as a solid line, below which the deformation remains homogeneous in a microscopical sense (i.e., no bands are observed and the deformation consists merely of viscoelastic creep), and above which delayed drawing occurs. This stress decreases with increasing temperature, just as in the case of polystyrene. Also, as for polystyrene, a large scatter of experimental delay times at the boundary between homogeneous and inhomogeneous extension is observed which is believed to be the consequence of doing a constant load rather than a constant true stress experiment—the specimen reduces its cross-section by creep until the stress becomes high enough for yielding to occur.
Polymethyl methacrylate is known to absorb water. To obtain some knowledge of the magnitude of the effect of water absorption on the yielding behavior, several samples were exposed at room temperature to 0%, 65%, and 100% RH, respectively. Alter three weeks, the weight did not change further and the specimens had 0f0.6 and 2.0% equilibrium moisture content.
Figure 33 presents the delay time data of the samples described above measured at 80°C. The delay time is strongly reduced by increased moisture; 2% moisture is equivalent to a temperature increase of nearly 25°C.
35 •

Measurements of the stress relaxation of PMMA by McLoughlin and TobolskylS showed that at least at small strairs, the mechanical properties depend greatly on the rate at which the polymer was cooled through the glass transition region. Figures 34 and 35 give elongation vs. time curves of specimens which have been thermally pre- treated under the conditions indicated. The specimens quenched from 150° to 0°C (figure 34, bottom) deform much more rapidly than the original polymer under the same stress (figure 34, top). The tendency to neck was also much reduced in the quenched specimens; drawing occurred rather uniformly, without a pronounced neck.
The curves of figure 35, from specimens with a variety of thermal histories, all tested at the same temperature and the same stress, also show large differences in behavior. The annealed material shows greater rigidity (a reduced ease of deformation). The specimens were permitted to reach equilibrium with 65% RH air before the test.
An attempt was made to correlate the change in drawing behavior with density changes produced by the thermal treatments, The weight change upon immersion in water due to buoyancy of the sample was measured. It was possible to r-Jce the measurements rapidly enough so that water absori j.on remained negligible. The density found was 1.187 g/vm^, and did not seeia to show any systematic change due to thermal treatments. Changes might be detectable by use of a more se.,cdtive method.
5. Discussion of Results
a. Effects of Stress and Temperature
The behavior of PS and PMMA in these tet ts is so similar that many of their characteristics car. be discussed together,
The delayed drawing of both polymers appears to occur in three steps:
1. Appearance and growth of oblique deformation bands (ore-drawing phenomenon).
2. Increase of band density and frequently thrs simultaneous formation of a neck (initiation of drawing).
36

3. Either neck propagation or drawing by shear band proliferation (completion of drawing).
The same phenomena have been observed in tests at constant strain rate, and with other polymers. The ultimate sample strain (draw ratio) attained when the drawing took place by shear band multiplication was the same as in the • experiments where necking took place. In a test at constant strain rate, the load drop after yielding causes a drop in stress in the regions still undrawn, and thus reduces the probability of formation of further ©hear bands in the sections of the specimen outside the neck, or the further growth of the bands already initiated in those regions. The "homogeneous" shear band drawing is, therefore, not ordinarily observable in drawing tests at constant strain rate. The reason that neck formation initiates at a particular-point.on the sample in the constant load draw- ing is undoubtedly a result of either a mechanical. imperfection in the sample (such as a slight local narrow- ing of cross-section) or a small temperature gradient, since there would otherwise be no tendency for localization of strain at any particular point.
When the logarithm of the delay time is plotted vs. initial applied stress at different temperatures, straight lines ar«? obtained which also seem approximately uniformly spaced vs. temperature (see figures 36 and 37).
For PS, the effect of temperature and stress on log t(j is the same at different degrees of preorientation. The delay time does, however, increase slightly with in- creasing preorientation, in agreement with previous observations12.
The experimental points drawn above the upper '^rder of the graph in figures 36 and 37 correspond to experi- ments where only viscoelastic creep occurred. These points, therefore, indicate merely the duration time of the experiment rather than a delay time; but it is clear that these points no longer fall on the straight lines for the samples which showed delayed necking and drawing. These specimens showed neither deformation bands nor necks. The strains reached by the samples which deformed by creep in the region just below the boundary line in figures 2 8 and 32 were, after a sufficient length of time, much higher than the delay strains of the samples which drew inhomogeneously, again indicating a major, qualitative
37

change in the nature of the deformation.
The fact that deformation bands are always present in the case of delayed drawing and consistently absent in viscoelastic creep, taken together with the existence of two distinct regions in the temperature-stress; plane where these two modes of deformation take place, leads us to conclude that the boundary line between the two regions represents a critical öt-ress required for the formation and propagation of deformation bands. Below tt-a boundary line in figures 27 and 31, the stress is too lew eitner to form or to propagate shear bands. Whether the format." on or the propagation of the bands is the controlling process, and what role the strain plays in the initial appearance of bands, will require further and more quantitative ob- servations to decide.
We conclude further that the delay time is the time necessary for the initiation and the growth of deformation bands over a certain distance which is probably related to the specimen dimensions transverse to the stress axis. To understand how the delay time is divided between initiation and propagation time again will require a more quantitative study of the band behavior.
It is interesting to note that delayed yielding is also observed in metals^'^7. Only metals with an upper yield point (peak in the load-elongation curve) show the effect. One finds also in metals (as we did for poly- styrene) a critical stress below which yielding does not occur in finite time. The delay time is observed to be a function of the grain diameter in this case. It is believed to be the t me necessary for the slip band density within grains to increase to a critical value so that macroscopic yielding can take place. This occurs by thermally activated release of dislocations from pinning points. Although it is difficult to visualize an exact analogy with the above dislocation mechanism for the case of an amorphous polymer, van analogy could perhaps be drawn between crystallographic slip planes and shear deformation bands. The viscoelastic process at the propagating tip of the band would then be equivalent to the production of slip bands in neighboring grains through the grain boundaries. The time scale of these processes is presumably governed by viscoelasticity in the case of the.polymer, and in the case of the metal by the thermally activated freeing and generation of dislocations within grains.
38

b. Effect of Moisture on PMMA
The data of figures 31, 32, and 37 were obtained from specimens with a moisture content of 0.6%, correspond- ing to 65% RH. Under testing conditions at elevated temp- erature these specimens will have lost water during heating up and testing. The moisture content was thus no longer constant or uniform, to an extent depending on temperature and time. After having found the large influence of ab- sorbed water on drawing (figure 33) we measured the delay times of some thoroughly dried specimens. In a plot of log (t^) vs. stress, the lines of constant temperature were displaced in the direction of increased delay time equi- valent to a 10°C temperature drop. A change of slope due to drying, which was observed when moisture content was increased to 2%, was not found.
Drying had an effect on the crazing behavior of the polymer (see also section IV.C.3). The dried specimens did not show large crazes, which had been observed regularly in the samples containing moisture, but only microcrazes of the order of 10 microns in length. These microcrazes. disturbed the deformation bands less, thus making their observation much easier. We assume -«-hat drying the outside of the specimens during the test introduces tensile stresses in a thin surface layer, which add to the applied test load and increase the tendency to crazing in this surface layer. The drying treatment, consisting of an exposure to 80°C dry air for three days, also anneals the polymer and this may influence the crazing behavior also.
c. Effect of Thermal History on PMMA
Measurements of stress relaxation of glassy PMMA by McLoughlin and Tobolsky^2 cited earlier showed a profound influence of the cooling rate through the glass transition on subsequent relaxation rate. The more rapid the cooling, the faster the stress relaxes. They explained this by the freezing-in of empty space (free volume) during a rapid quench. The result of similar pretreatments in our own experiments (figures 34 and 35) affects the deformation behavior at high stresses in the expected manner. The rapidly cooled specimens, which are expected to have the most frozen-in free volume, deform faster than the slowly cooled ones. In addition, in the more severly quenched specimens yielding did not set in as abruptly and with ouch a clearly definable delay time, and necking was not so clearly observable, as in well-annealed or original material,
39

By introducing additional free volume, the polymer started to show behavior intermediate between that of the original glassy polymer and the behavior of a viscous liquid.
<*• Relation Between Constant Strain Rate and Constant Load Drawing"""""*" ""~~"~
The question arises as to how the two experiments by which yielding is produced—the constant rate of extension-
and the constanc oad experiment—are related« The existence of an equation of state for the material would allow a direct answer to this question. SucVi an equardoir of state specifies a unique relation between the force y P# the sample length L, and the velocity v, with which the ends of the tensile specimen move apart; that is?
F = F(L,v) (5)
This equation requires that the three quantities a e uniquely related, independently of the path by whi»;h a momentary state was reached. There ir. evidence that such a relation does not exist in a strict sense. Keeping this in mind, we will proceed to use equation (5) as a first: approximation. A useful way to describe the properties of the real polymer might be in terms of deviations from this type of relationship. By forming the total differential of (5), setting dF = 0, and dividing by dL we obtain the relation
(nWH)L(£)F-°- From tensile tests at various strain rates it is known that for polymers, the load increases with strain ratel8A9; that is,
(H\ > o. Since this discussion is in terms of fore J and length, the yielding criterion for the constant rate of extension test is
(Sr)v" °- (8)
For yielding in the constant load test, we therefore
40

obtain
0. IÄ) ■ (9)
This criterion will be valid at an inflection point in the L vs. time curve. Beyond the yield elongation, (3F/3L)V<0 so from (6) and (7), (3v/3L)F > 0.
We consider the relation F(L, v) only prior to yielding because of the complications in specimen geometry afterwards. Figure 38 shows engineering stress-strain curves of PMMA measured at 100°C at a number of strain rates. The data have been obtained from the same type of specimen as was used.in the delayed drawing experiments. To facilitate mathematical representation, the experimental curves have been smoothed out by the following procedure. The upper yield points of the measured curve were plotted vs. log v. They followed the linear relation
a = 3600 + 725 log v, (10)
where oUy is expressed in psi and v is expressed in minutes. The yield maximum for each strain rate was then calculated from equation (10) and each curve was redrawn by multiplying all stress values by the ratio of extrapolated to experimental yield maximum. The yield maxima fell experimentally on a straight line, parallel to the initial slope of the load- elongation curves.
We now consider the curves of figure 38 to be the relations F(L,v = const). From these we calculate the time for a specimen to yield in a constant load experiment. This is easily done by integration of the time intervals dt = dL/v along a line of constant stress between zero elongation and the elongation where it is tangent to a constant strain rate curve. The contribution of the elastic deformation to the time integral is negligible, compared to the times involved in our experiments. The integration is therefore only over AL« (see figure 38). The result of the graphical integration for a number of stresses can be represented by the equation
log (td) = 3.2 - o/725 - (11)
where log (t^) is expressed in min., for the range of strain rates shown in figure 38.
41

A comparison of the predicted values of delay time with those experimentally observed for the same temperature is shown in figure 39. The experimental delay times appear to be about four times larger than the values predicted. The slopes of both experimental and predicted straight lines are in good agreement, however. This discrepancy is believed to be due to our experimental definition of delay time (figure 26). This graphical definition allows easy evaluation of the delay time from the experimental elongation vs. tiiue curves, but actually does not conform with the criterion of equation (9). When we made precise creep measurements which established more accurately the initial part - t the elongation vs. time curve, it was found that the in: Lection point where creep rate acceleration begins, which cc rres- ponds to the upper yield point, occurs at time value 3 3.5 to 5 times shorter than the delay time as defined graphically by the intersection point. This brings the curves of figure 39 into close agreement.
It is known that polymers which cold draw at normal strain rates will in many cases not cold draw (yield) when strained very slowly7. Our studies on PMMA and PS under constant load show that below a :ertain stress level, yielding does not occur. This is precisely what the above treatment would predict. If the ux^per yield point disappears from the stress-strain curve at constant strain rate, then one of the necessary requirements for delayed yielding has also disappeared and equation (6) predicts uniform deformation under constant load for all strains; that is, Ov/3L)„ is always negative.
£ »
IV. MODES OF DEFORMATION
A. INTRODUCTION
Some indication of the various deformation modes shown by glassy amorphous polymers during yielding has been discussed above in the appropriate experimental context. In summary, it has been demonstrated that these materials can deform homogeneously or inhomogeneously, the latter occurring on scales of magnitude from that commensurate with sample dimensions to beyond the limits of optical microscopy. The particular active mode is very dependent ' upon sample history (thermal and strain) and especially on experimental conditions.
In this section, the emphasis is placed on discussion
42

of the detailed nature of some of these deformation modes, rather than the circumstances of their occurrence. Both shear and hydrostatic modes and effects are discussed, and an arbitrary distinction between macroscopic or bulk phenomena and microscopic or local modes (not traversing the sample cross section) is made.
B. MACROSCOPIC YIELDING MODES — I ■ ——«^« II—————— ■ ■ — ■!■—II ■—.— I
20 1. Geometry of Neck Formation
a. Introduction
Up to the present time, very little emphasis has been placed on the most common and moat striking character- istic of cold drawing—that is, the formation and propa- gation of the neck. As early as 1947, Miklowitz21 pointed out that in a series of six or seven experiments, which he carried out on Nylon, the neck which formed during cold drawing decreased in length (or increased in sharpness) as the rate of stretching was increased. In the course of this study Miklowitz prepared strain profiles of the necked regions ot samples tested under differing conditions of strain rate but he made no attempt to generalize upon his results or to extend his experiments to include the effects of other variables.such as temperature and orientation on the neck shapes.
Miklcwitz performed his experiments nearly twenty years ago, but since then there has been published no further detailed study of neck formation and propagation. Despite the lack of experimental data on the subject certain assumptions have been made about neck geometry and the effects of testing variables on it. It has been widely believed that: (1) the neck shoulder becomes increasingly steeper as the material is stretched at higher rates, and (2) the neck becomes more diffuse as the temperature of stretching is increased. The first of these assumptions, of coursfc, is based upon the limited experiments of Miklowitz.
On the basis of the results presented below, it appears that neither of these assumptions is entirely valid. In fact, these assumed recking characteristics are correct only over a limited range of strain rate and temperature.
b. Experimental Procedure
43

Cylindrical samples (for which a single profile view completely characterizes the geometry) were strained in the Instron at various extension ratet and temperatures (using an air thermostat especially constructed for the purpose). The sample profile was observed during the test by taking sequence photographs at roughly uniform time intervals during the deformation. Reference marks were scribed on the unstrained samples (using India ink) to allow diameter measurements to be made ar fixed points along the sample using photographs taken at different sample extensions.
An example of the typical results of a neck geometry experiment is shown in figure 40. The reference marks mentioned above can be seen in the photograph which is one of a series taken during a stress-strain test at the condi- tions indicated.
The plot below the photograph shows the detailed neck geometry of this sample. The circles represent diameter values read by projecting the original photograph aid measuring the diameter at various points with dividers. These distances have then been converted to fraction of original diameter (D/D0), where D0 represents the original machined diameter before the test. This is plotted vs. axial distance along the sample, in inches.
c. Results
Experiments were first carried out on PMMA samples milled from cast Plexiglas II UVA sheet to a 0.2 in. diameter and one inch gauge length. It was found, however, in such samples, that the neck did not attain a final steady-state shape, despite the fact that the load-elonga- tion curve soon reached a constant and apparently steady- state drawing load. Consequently, samples of the same diameter (0.200 in.) but with double the gauge length (2 in.) were machined from the same cast sheet and photographs taken as these samples were strained at a constant rate on the Instron machine. In these samples, the neck seemed to initiate at a strain between the uppsr and lower yield strains. The load-elongation curve settled down to a final, apparently steady-state drawing stress (after the yield peak) at an overall sample extension of about 15%. The neck did not stabilize, however, until about 60% overall strain (based on the gauge length) was reached. Thus, the stabilization of neck geometry between 15 and 60% overall 3train takes place at constant external
44

load, Note that this behavior is somewhat contrary to the usual assumptions that the neck has completely formed at the upper yield point and has stabilized in shape by the time the lower yield point is i ached.
The progressive development of a neck profile with increasing overall strain is illustrated in figure 41 for an experiment at 75°C and 0.2 in/min. crosshead rate using a sample with 2 in. gauge length. The profiles were read from photographs taken at different values of overall strain (or crosshead displacement) designated as AH and expressed simply in inches. The sample diameter is plotted as D/D0 vs. distance along the strained sample in inches as above. For values of AH above 1.0, the neck shape seems stabilized. The sharpness of the neck can b6 expressed in a quantitative way by its slope at the steepest point (inflection point of the profile curve). This is shown as a dotted line for the curve at A£ = 1.3"; the slope of the neck at this point was computed as 0.978 inches per inch distance along the sample axis.
The variation of neck sharpness (of the stabilized steady-state neck) with extension rate and temperature was investigated and the results are presented in figures 42 and 43. The important result obtained is that neck sharpness goes through a maximum vs. both (log) strain rate and temperature. The effect of strain rate was investi- gated at two temperatures (75°C and 95°C) and this same behavior of going through a maximum was observed at both temperatures. Duplicate experiments were run in a few cases, as shown, to indicate the general precision of the data. An adequate theory of the necking and drawing mechanics must succeed in explaining this pattern of behavior.
In order to determine the effect of preorientation on the geometry of the neck, several sheets of PMMA (Plexiglas II UVA) were stretched at temperatures above Tg and then rapidly cooled to prevent relaxation. Cylindrical samples with gauge lengths of 2 inches were prepared from regions of uniform birefringence following the same procedure as was used in the pre" 1ction of unoriented samples. A series of four specimens with progressively higher amounts of preorientation as measured by birefringence was then tested on the Instron at a temperature of 75°C, and an extension rate of 0.5 in/min.
An analysis of l:he sequence photographs and a compari- son of *;ie profile plots or ained from them indicated that
45

as the amount of preorientation in the gauge section of the samples increased, the degree of strain localization decreased. In other words, as the preorientation was increased, the neck became more diffuse. The slope of the steady-state neck vas calculated for each sample and plotted against the initic- birefringence of the sample, giving the results shown in figure 44. The neck slope is seen to decrease very rapidly as the preorientation increases from zero, but then levels off at a value of about 0.2 in"*.
The effect of the test temperature on the neck geom- etry of samples having a fixed amount of preorientation was also investigated. Three samples were prepared, each with an initial birefringence of 2.8-2.S x 10_4. Each sample was stretched at a rate of 0.5 in/min. Testing temperatures of 65°, 75°, and 95°C were used. Profile plots derived from these experiments indicated a general decrease in the neck slope as the temperature increased. In fact, at the highest temperature no neck was observed to form, although a gradient in the diameter was observed from one end of the sample to the other. Apparently, the length of the neck under these experimental conditions was greater than the gauge length of the sample.
d. Discussion of Results
The mechanics of neck formation and propagation are not yet clear. The general principle can be enunciated that neck formation and propagation take place because the sample can deform more e?sily in this way than by homogeneous extension. This is a principle of minimum work, and it must then be explained why the inhomogeneous deformation constitutes such a minimum work path. One approach to such an explanation involves the assumption of a strain-soften- ing and strain-hardening process occurring in the material in sequence. Any such approach requires a knowledge of material properties as a function of strain. The load vs. elongation curve me^jured in a drawing experiment does not correspond to the scress-strain properties of a microscopic volume element of the material, because of the inhomo- geneous nature of the strain. However, by combination of the load-elongation curve with sequence photographs, something approaching the true tensile stress-rstrain curve of the material (for homogeneous deformation) can be obtained from measurements on one point of the specimen— the point where the neck initiates—which remains a point of minimum diameter. The local strain at this point can be calculated from the diameter, assuming that strain
46

produces no volume (density) change in the material. The local stress at this point is calculated by dividing the external load by the cross-sectional area at this point,, The stress field at this point will be essentially one of pure tension, unlike the situation in the neck itself, since the sides of the specimen are parallel to the sample axis here.
Examples of the true stress-strain curves derived in this way are shown at different strain rates at 75°C, and at different temperatures at a fired strain rate (A£ * 0.5 in./min., gauge length = 2 in.) in figures 45 and 46. Since photographs were not available for the smallest strains, this part of the curve had been sketched in by dashed lines. After the abrupt onset of yield, at a stress value which is clearly rate- and temperature-dependent, there seems to be ordinarily a slight decrease of stress with increasing strain, followed by a pronounced increase of stress with further strain. It is interesting that the general stress level of these curves seems to vary linearly with the logarithm of strain r?te, but linearly with linear temperature; this type of dependence has been observed in other experiments.
True stress-strain curves have also been calculated for oriented PMMA. A series cf these curves for various amounts of preorientation is given in figure 47. Each of trtese curves corresponds to a testing temperature of 75°C and an extension rate of 0.5 in./min. One can observe an increase in the tendency to strain-harden as the amount of preorientation is increased (the stress-strain curve for unoriented PMMA is also indicated in figure 47 for comparison purposes). Such an increase is expected on the basis of the classical assumption that strain-hardening is due to the lining up of polymer chains.
It has been reported previously2 that the draw ratio of polystyrene is a strong function of the amourt of preorientation in both dead load creep tests and tensile stress-strain experiments. These experiments on PMMA indicate that a similar relationship between the amount of preorientation and the draw ratio holds for this material as well. v
2. Volune Changes During Yielding
In order to establish more clearly *-he role of bulk and local volume changes in the yielding process, direct
47

measurements of volume changes of compression samples undergoing deformation were carried out2. The sample was strained in a dilatometer, filled with mercury and provided with a capillary tube open to the atmosphere. The mercury level therefore moves in response to changes of sample volume in the dilatometer. The dilatometer it- self was made of stainless steel. The design was of a simple piston and cylinder type (clearance, less than 0.0005") in which the sample was subjected to a uniaxial compression between the flat parallel surfaces of the end of the piston and the cylinder baae. The dilatometer and capillary tube were carefully calibrated. Volume changes of less than 0.0005 cc could be determined.
Experiments were run on samples of polystyrene, poly- me^hyl methacrylate, polycarbonate (Lexan), and polyvinyl formal (Formvar) at 22°C. These were run through the upper yield peak/most frequently at constant strain rate. Experiments of other, more complicated, types were also run, such as: stress relaxation from various points on the load-elongation curve, creep at constant load, and types of interrupted yielding histories.
Typical results of a simple loading cycle at constant strain rate are illustrated in figure 48 for Formvar at 22°C. Figure 48a is the load-contraction curve for the sample with the yield point indicated by an arrow and an extrapolation of the initial linear elastic region shown. (The slope of this line is, of course, Young's Modulus.) Figures 48b and 48c, in which the volume change of the sample is plotted vs. load and contraction respectively, show several interesting points. We consider the "plastic" volume change as the difference between the actual sample volume and the linear extrapolation of the elastic volume decrease (which is due to the Poisson's ratio effect). For the experiment shown, it is seen that even though the total sample volume decreases as the yield point is approached, the plastic volume increases. The magnitude of the plastic yolume change at the yield point, v , is indicated in figure 48b. We see from figure 48c that after yielding, the sample deforms plastically at' constant volume (Poisson's ratio «0.5) which is the usual at-sumption. It should be noted also that the slope of the linear elastic region.in figure 48b is the reciprocal of the bulk modulus of the material.
The magnitude of plastic voll.-'- change at the yield point was different for the different polymers. It was
40

greatest for PMMA, which yielded in a homogeneous way, and least for PS, for which the yielding mode is one of very localized deformation bands, described in previous reports. The detailed nature of the curve of plastic volume vs. load around and after the yield point was quite variable, and is probably dependent on complicated experimental variables.
During the periods of stress relaxation at constant strain, the total volume increased, whereas the plastic volume decreased as functions of time. In a compression creep test on PS, both total and plastic volume decreased during the delay time before yielding, but they increased again once yielding began at significant rates.
This general volume-change behavior is compatible with a representation of a glassy polymer as essentially a close-packed structure. This structure responds elasti- cally to hydrostatic stresses, whereas a portion of the sample has to expand, if only in a local sense, to allow yielding and the movement of molecules past one another under the influence of shear stresses. This plastic volume component would be expected to be always positive, e"ven though the total volume change will change sign with different stress fields (tension vs. compression).
C. MICROSCOPIC YIELDING MODES
1. Deformation Bands in Compression
a. Introduction
The first experiments on deformation bands in PS ,. were mostly descriptive and have been previously reported These experiments were carried out in compressive stress fields so that the competing tensile processes of crazing, cracking, and fracture would be minimized.
The principal conclusions of these studies can be summarized. Deformation band initiation and growth are associated with permanent plastic shear deformation. The bands as seen edge on are thin (10~2 to 10"^m m.) plate- like regions of intense shear and follow the theoretical maximum shear stress plane of the particular geometry considered. They thus are easily differentiated from crazes and cracks which are more nearly parallel to the principal stress directions. As plastic deformation proceeds, the individual bands do not appear to widen;
49

instead, more bands form beside the original ones. Macroscopic, homogeneous shear can also occur at high plastic strains. More detailed experiments involving cleavage of deformed specimens demonstrated the extent and character of these bands through the interior of the spec- imens and ending at the surfaces. The strain inside of these bands was consistently of the order of unity.
Several interesting aspects of the nature of these deformation bands has been further investigated. The consistency of the band propagation angle, the temperature and preorientation effects on band propagation, and the relationship of band propagation to the load-elongation curve will be briefly discussed.
b. The Band Propagation Angle
The fact that the band propagation angle is always at about 35° to the compressive stress axis is not limited to the specific geometry of the sample. Whether initiated at a fillet, at a notch, or at a surface flaw in an unnotched sample, the propagation angle is the same. Godrick22 has suggested that this propagation angle results from a propagation mechanism involving pure shear plus a rotation due to a kinking effect. This is the type of kinking observed in metals, and it requires the assumption that a sufficient amount of strain softening occurs in initial shear planes to promote the continuation of shear on these planes rather than on more favorably oriented planes after rotation occurs. For this mechanism the amount of rotation depends on the shear strain in a band.
Ah alternate suggestion fcr explaining the constancy of the 35° propagation angle is based on the nature of the stress field and, thus, would not depend on strain parameters - It was shown above in Section II.F.1 that the yield stress for PS depended en the mean (hydrc'static) stress. Following the reasoning of the Mohr yield criter-v ion* yielding occurs .first on the plane where the resolved shear stress first reaches the shear resistance in the same direction. This shear direction (e) varies from 0° to 45° from the compressive axis, because, while the shear component is a maximum at 45°, the hydrostatic component varies from zero at 0° to a maxinum at 90°. Frdm the data • on the pressure dependence of yield stress.for PS, the direction of propagation of the yielding mode is cal- culated to be near 35° to the compressive axis. This
50

propagation angle is also exhibited in preoriented samples (see below), where the amount of band strain would be expected to be much less than in the unoriented samples^. Thus, a stress field, rather than a strain criterion appears to govern the band propagation.
c. Temperature and Preorientation Effects in PS
The temperature dependence of band formation has-
been studied fr - near Tg down to -196°C2 . As the
temperature is lowered, less homogeneous or diffuse shear strain takes place and the bands become more distinct and better defined. At temperatures far, below Tg essentially all the plastic strain before the upper yield point can be accounted for by the bands. As the temperature is raised to near Tg, the deformation bands become less distinct with slightly greater width/length ratios and more homogeneous shear occurs. In experiments run at a strain- rate of 0.02 min~l, only a very few distinct bands could be observed in samples tested at 75°C. The temperature dependence of the mechanical properties (stresses and strains) for these samples has been discussed in Section II.B.
Experiments on PS samples that had been preoriented by various amounts and tested with the angle between the compression and preorientation directions as an additional variable were described previously and their compressive stress-strain behavior was discussed (see Section II.D).
The observations on the effect of these variables on deformation band formation and propagation can be summarized. Neither the amount nor direction of pre- orientation had a large effect on the bands. The two chief effects of the amount of preorientation, within the range investigated (i.e., birefringence from 6 to 70 x 10"*), were that at high praorientction, cracking in planes containing the preorientation axis became very prevalent and that the variations in behavior seen with change of preorientation angle were accentuated. It seems that band propagation is easiest in the direction of the preorientation axis, and hardest across the pre- orientation axis. Furthermore, if certain shöar directions become less favorable, deformation can shift to other planes containing the orientation axis. The fact that the direction and amount of preorientation has such a slight effect on the band propagation "directions helps to confirm the hypothesis, mentioned above, that this band propagation
51

direction is primarily governed by a stress criterion.
d. Deformation Band Propagation and the Load Drop after Yielding" —->-~~
The preliminary observations of band formation during compression stress-strain tests indicated that the bands initiated (first became visible) at the proportional limit (end of the linear elastic region) and that the yield load occurred when the bands extended across an entire cross-section. Several questions remained though; what/ effect did sample size (ratio of band length to cross- section) have on the yield load and what mechanism could explain the drop in load after the bands extended across a cross-section.
Although the size effect was not extensively investi- gated, it appears that in larger samples single bands have a finite length; that is, they do not extend across the cross-section. Thus, the deformation in the larger samples was accommodated by a sequential array of bands across the section or by a combination of bands and homogeneous shear deformation.
The explanation of the load drops after the yield load has not been satisfactorily resolved in terms of deformation band propagation. Since there is severe strain hardening within the bands themselves (shown by the almost constant limiting strain in them) and since they do not appreciably widen in the stress direction, the load drops which reflect macroscopic strain softening, cannot be explained by the nature of the bands. A possibility is that the inhomogeneous deformation resulting from the bands provides stress concentrations and initiation sites for further, easier deformation. But it is observed that the deformation during and after the yield drop is generally macroscopic and diffuse and thus not necessarily related to band initiation or propagation.
Another possibility is that load drops arise from shape changes. Ir. most experiments the specimen contains a single transverse notch in its gauge section, and the bands grow out of this region, apparently when the local concentrated stress reaches a critical value. Since the shape change resulting from the partial penetration of two <~}0 bands into the specimen can be approximated by an edge dislocation with Burgers vector parallel to the compression axis, the problem of the climb of an edge dislocation across
52

a speciman under a critical local compressive stress was studied* It was reasoned that the shape change resulting from the presence of the dislocation would be a concave curvature of the sample toward the notch. This would then require the application of a bending moment at the parallel compression faces which would give rise to a tensile stress component at the site of the dislocation, requiring an increase in the compressive load to keep the compressive climb stress a constant. The results of the analysis showed that the major component of the load drop could indeed be attributable to such a shape change during deformation when the specimen is singly notched or when deformation preferentially starts from one surface in an unnotched specimen.
However, load drops have also been observed in doubly notched specimens (i.e., with notches on opposite sides of the gauge section) and in specimens with a central hole to initiate banded deformation22. This behavior is very difficult to understand in terms of the above mechanism. Such complications in the compression experiment provided the incentive to perform the torsion experiments using notched thin-wall tubes which have been described above (section II.F.2).
2. Deformation Bands in Tension
a0 Constant Strain Rate and Stress Relaxation Experiments ^ ~"~~ "*" " "*" "
Localized deformation bands have been observed in bulk tensile specimens of PS tested at 25°C and they appear to be similar, but not identical to the bands in PS compression samples. The tensile bands are of the order of microns in thickness, and form conjugated sets near, but not in, the directions of 45° to the principal stress axis. The bands were identified as light streaks when viewed edge-on between crossed polarizers and as characteristic waves of colors, when viewed through the plane of the bands,
The close relationship between these bands, craze marks, and macro necking modes is discussed below for the case of dead load creep experiments, but a description of a particular PS sample in stress relaxation will serve as a further example. This sample was 0.038 x 0.295 inch in cross-section, 1-5/8-inch gauge length, and had a pre- orientation birefringence of 51 x 10~4. The deformation modes to be described developed at very slow rates during
53

stress relaxation at constant strain at 25°C, in the stress range of 8000-3000 psi. One gross neck grew from one side of the sample to the other at an angle of 57° from the tensile direction. From the contraction in thickness, an approximate drawing extension in the middle of the neck was estimated to be 30%. Many surface crazes, normal to the tensile direction, were evident in the undrawn material above and below this macro neck. Interspersed between, and connecting, the ends of the crazes were light streaks' identified as deformation band sets, which made angles of about 55° with the tensile axis. Conjugate sets of deformation bands were also observed along the edges of the sample in the vicinity of the macro neck. It is presumed that both the crazes and deformation bands were formed just before or during the propagation of the macro neck, because the deformation bands that are observed in the neck itself are rotated towards the tensile axis due to the extension taking place in the neck, and are rotated to one side, in addition, due to the angular direction of neck propagation. A similar sample with three times the preorientation birefringence (150 x 10~4) had a much more diffuse macro neck and many fewer crazes and deformation bands.
Closer observation of the relationship between micro and macro deformation modes was accomplished during studies of tensile necking phenomena in thin film strips of poly- styrene, Formvar, and Nylon 6-10. In these thin films it was possible to observe (using a microscope) deformation bands, micro necking and macro necking in the plane of the film during and after yielding and drawing, and to relate qualitatively the occurrence of, and transitions between, these modes as a functiori of the stress-strain history. The relation to stress-strain behavior is covered in more detail in Section IIIB. A particularly significant result of this study was that Formvar, a glassy polymer, and Nylon 6-10, a partially crystalline polymer, showed remarkably similar types and behavior of the various deformation modes, as well as stress-strain behavior.
A picture of a typical Formvar film (0.004" thick) during drawing is shown in figure 49, where the different deformation modes are all seen. This picture was taken with .parallel polarizer and analyzer set at 45° to the tensile axis. The macro neck is at the tottom of the picture, short micro necks project from the neck shoulder into the undrawn material in tRe middle of the picture and thin dark streaks are seen throughout the undrawn material.
54

These streaks are at about 55° to the tensile axis and are a first retardation order brown color in this parallel polarized light. They develop during the first loading, but continue to grow at points other than at the neck, even during steady state drawing at constant load. Occasionally, several were noticed to get darker, then develop high order retardation colors while transforming into a micro neck. Actually, on closer examination, the region of the micro neck was seen to acquire a greater density of streaks before necking, rather than one streak growing larger.
Samples of PS film with a slight preorientation were studied for deformation mode under stress relaxation and slow stress-strain conditions. Crazing, micro necking and macro necking were the deformation modes observed and the particular deformation mode and/or propagation behavior was very dependent on stress level and strain rate. The pre-yield streaks discussed above for Formvar were not observed in these tests on PS. Crazing occurred generally at lower stresses and at shorter times than any sort of yielding phenomenon.
Birefringence measurements were made on the interior of several well developed micro necks. The angle that the principal optic axis makes with the tensile axis was in the range of 5°-8°, which matched the offset angle at the edge of the sample. Retardation in the neck was of the order of 1,75 fringes, which corresponds to a birefringence of between 0.03-0.04 for drawing extensions of 50%-100%. This corresponds very well with the values of the birefrin- gence in the necks of cold drawn bulk tensile samples^3
and monofilaments^^.
b. Creep Experiments
In our studies of the microscopic deformation phenomena which occur during delayed drawing under dead load, we have been mainly concerned with the detection and observation of shear or deformation bands. Among all of the phenomena which have been discussed above, they are the ones that can most easily escape detection. This is primarily because only the optical anisotropy of the polymer and not its light absorption changes within such a band. In PMMA, deformation bands are particularly hard to detect. This is apparently due both tc the small transverse dimensions of the bands and also to their small optical anisotropy, which,, for equal strains, is only one-tenth that of PS.
55

Several methods were tried in an attempt to improve the visibility of deformation bands. For macroscopic observation, the Schlieren method mentioned previously was found to be very useful. Though more sophisticated Schlieren systems were tried, it turned out that a simple method, observation of the shadow of the specimen cast on a ground glass plate by a point light source, gave the best results. The method, as practiced, did not permit single bands to be resolved, but showed areas of optical inhomogeneity as dark and light streaks on the ground glass screen. These inhomogeneities are believed to consist of shear bands and the method therefore was useful to observe their growth and intersection.
For the detection of details of the shear bands, another method was developed. Before deformation the specimen was coated in vacuum with a thin metal film. By choosing the right metal and layer thickness, the film could be made to adhere to the polymer even during deforma- tion. We have used platinum, chromium and aluminum in layer thicknesses which, judged by their light absorption, ranged from semi-transparent to nearly completely trans- parent. Under the light microscope the shear.bands appeared as cracks in the metal film. The complementary experiment of coating the polymer with metal after draw- ing was also performed. After coating, the polymer was allowed to retract at a temperature above the glass transition temperature. The metal film cracked in a similar fashion as during drawing, showing that the polymer also recovers along the shear bands.
In light-microscopical observation of uncoated sur- faces in transmitted light it was found that band struc- tures as well as other surface features are observable by phase contrast microscopy even though in many instances normal or polarizirig microscopy does not show such details. An alternative route <chosen for the study of the surface topography was by electron microscopy. A replicating technique*5 of high resolution was adapted to our purpose.
Below we discuss some of the deformation phenomena we have observed, using these methods, in PS and PMMA samples during dead load deformation (creep) experiments.
Polystyrene
The more typical surface structures of polystyrene in various stages of deformation are shown in figures 50
56
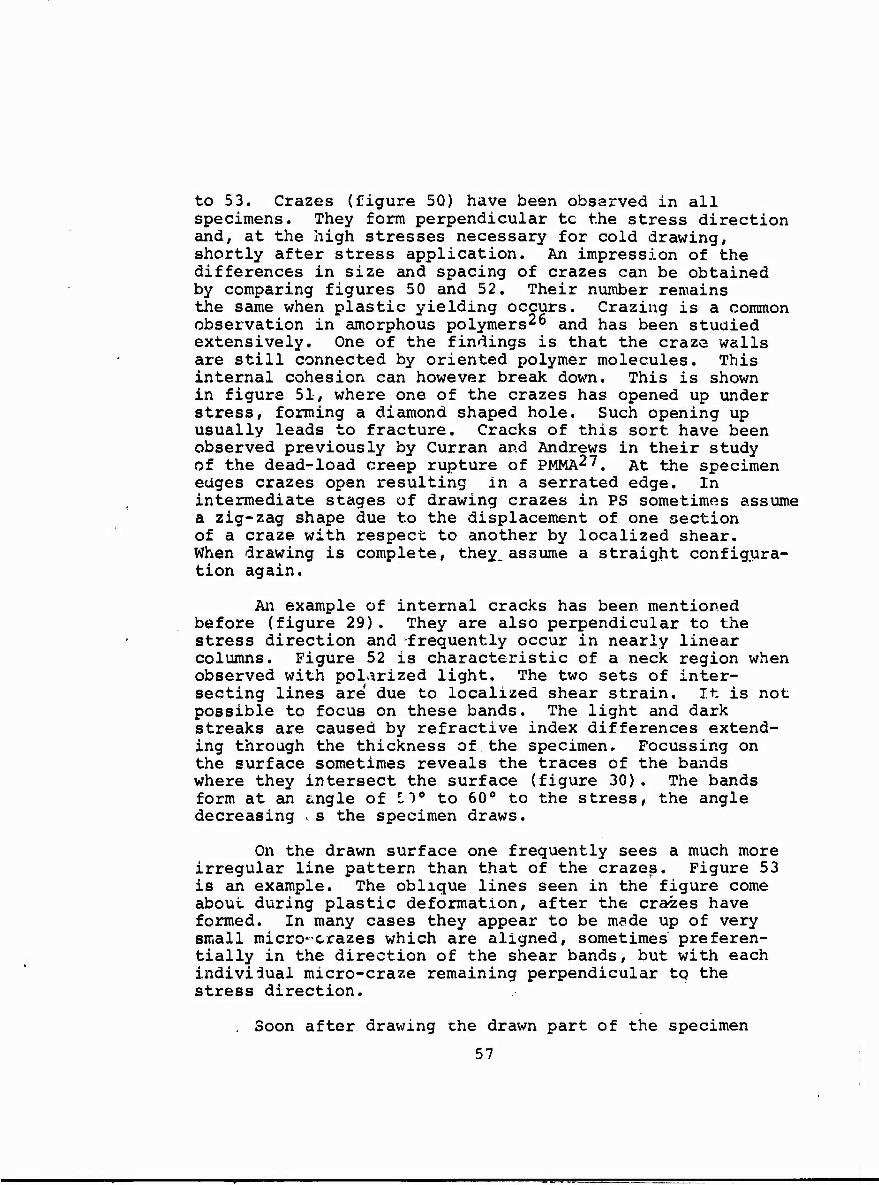
to 53. Crazes (figure 50) have been observed in all specimens. They form perpendicular tc the stress direction and, at the high stresses necessary for cold drawing, shortly after stress application. An impression of the differences in size and spacing of crazes can be obtained by comparing figures 50 and 52. Their number remains the same when plastic yielding occurs. Crazing is a common observation in amorphous polymers26 and has been studied extensively. One of the findings is that the craze walls are still connected by oriented polymer molecules. This internal cohesion can however break down. This is shown in figure 51, where one. of the crazes has opened up under stress, forming a diamond shaped hole. Such opening up usually leads to fracture. Cracks of this sort have been observed previously by Curran and Andrews in their study of the dead-load creep rupture of PMMA27. At the specimen edges crazes open resulting in a serrated edge. In intermediate stages of drawing crazes in PS sometimes assume a zig-zag shape due to the displacement of one section of a craze with respect to another by localized shear. When drawing is complete, they_assume a straight configura- tion again.
An example of internal cracks has been mentioned before (figure 29). They are also perpendicular to the stress direction and -frequently occur in nearly linear columns. Figure 52 is characteristic of a neck region when observed with polarized light. The two sets of inter- secting lines are due to localized shear strain. It is not possible to focus on these bands. The light and dark streaks are caused by refractive index differences extend- ing through the thickness of the specimen. Focussing on the surface sometimes reveals the traces of the bands where they intersect the surface (figure 30). The bands form at an single of 11° to 60° to the stress, the angle decreasing ks the specimen draws.
On the drawn surface one frequently sees a much more irregular line pattern than that of the crazes. Figure 53 is an example. The oblique lines seen in the figure come about during plastic deformation, after the craves have formed. In many cases they appear to be made up of very small micro-crazes which are aligned, sometimes' preferen- tially in the direction of the shear bands, but with each individual micro-craze remaining perpendicular to the stress direction.
Soon after drawing the drawn part of the specimen
57

turns opaque if the load is not removed. This is often an indication of incipient fracture, which occurs at the place where the specimen had first started to draw. The opaqueness occurs only in a thin surface layer, while the spcicioiien center remains transparent. The structure of the opaque polymer has not been determined.
Polymathyl Methacrylate
Localized modes of yielding were not observed for PMMA samples in compression1. A close examination of PMMA specimens drawn under tensile load has, however, revealed the existence of shear bands for this polymer as well as for PS. We were able to obtain clear evidence of the:.r presence from specimens with craze-free surfaces. In the presence of crazes, regions of high snear strain, which appear to be associated mostly with the tips of crazes, are also seen. Surfaces of PMMA samples show a much more uniform appearance than those of PS. This is, at least in part, a consequence of the higher uniformity of the PMMA sheets from which we made our samples. Cracks, crazes and aligned or random microcrazes are also common in PMMA, figures 50 and $1 being typical for PMMA as well as for PS. Opaqueness caused by prolonged stress- ing of the drawn polymer has not been seen in PMMA. It should be noted also that the crazing of PMMA was reduced or even eliminated when the specimens were dried before drawing.
3. General Discussion
It is now well established that macroscopic deforma- tion of a polymer sample, whether in tension or compression, and whether at constant strain rate, constant elongation or constant load, is accompanied by a variety of deformation phenomena on a microscopic level. These include shear or deformation bands, cracks, crazes and various surface fissures. Deformation bands are the phenomenon most clearly related tc yielding. Some aspects of this relationship have been explored in the preceding sections. It is still not completely clear which other phenomena have an effect on the yielding behavior 'of the polymer. Crazes, for example, which develop before yielding begins, are known to act as stress concentrations from which yielding originates. The drawing behavior, however, seems quantitatively the same with or without them.
It is known that these micromodes of deformation
58

are influenced in their details by the conditions under which the deformation is carried out. This relationship is a very complicated one, which we have investigated only briefly. A particular problem lies in the necessity for differentiating among features which are associated directly with yielding and those which were originally in the sample, or which were produced by a pretreatment such as preorientation.
Further detailed investigation of these phenomena, their interrelationships, their dependence on experimental parameters and their influence on the drawing process is obviously indicated.
V. BIREFRINGENCE STUDIES
A. INTRODUCTION
One of the objectives of this project was to explore the use of birefringence measurements as a method of obtaining valuable information concerning the mechanism of the drawing process and the nature of the oriented states produced by extension under various conditions. Some previous results using birefringence as a measure of chain orientation for hot stretched and cold drawn polystyrene were reported in our previous report on drawing2 where the results implied that drawn PS attained H constant orientation state independent of preorientation (from hot stretching) prior to drawing. One phase of our birefringence studies reported below has explored these results further for both PS and PMMA.
Another of the objectives of the present investiga- tion was to extend our studies of cold-drawing to include crystalline as well as amorphous polymers. As a means of combining the birefringence studies with the investiga- tion of a crystalline polymer, we decided to study the drawing of polyacrylonitrile (PAN) by extension at constant strain rate, at different temperatures, and to measure the birefringence changes of the sample during the course of such an experiment. We had already obtained a great deal of birefringence data on this polymer, some of which have been published28; and we also have a considerable background of experience in interpreting its birefringence behavior. It seemed also that PAN would be a good polymer to serve as a bridge between the glassy amorphous poly.uers (polystyrene and PMMA) which we have used extensively and the more usual crystalline polymers, since it seems to show
59

a particularly simple sort of crystallinity and remains a transparent, single-phase material even when it "crystal- lizes". This simplifies the interpretation of birefrin- gence effects, as compared to the usual crystalline poly- mers which are two-phase materials and consequently show the complicating phenomenon of "form birefringence".
B. POLYACRYLONITRILE STUDIES29
1. Introduction
Polyacrylonitrile (PAN) is a polymer of great practical importance in the synthetic textile field, since it is the basic constituent of the acrylic (e.g., Acrilan and Orlonjai,-3 modacrylic (e.g., Dynel) fibers. We used solvent-cast film samples rather than fibers, however, for experimental convenience (particularly as regards the birefringence measurements).
PAN appears to have two glass transitions—one near 95°C and the other at about 140°C. Some preliminary investigations have shown that these glass transition temperatures define region« of different kinds of mechanical behavior. Below 95° the polymer behaves in a brittle, glassy manner. Above 140° the polymer is very weak, and when strained, fails in some sort of "plastic" mode. Between 95° and 140°, the polymer necks and draws. In thin films such as we employ (1-2 mils), very high true, strains (as high as 13) can be attained in this region.
Based on our previous birefringence studies of PAN, and a thorough study of the literature on its physical and chemical properties, we hav«3 recently proposed-^ »31 a theory of tne solid state structure of this polymer, and the nature of its glass transitions. We have described the structure as a "hetero-bonded" single phase, in which the secondary intermolecular forces are of two typec: dipole-dipole associations and some weaker type oi van der Waals bonding. Since the two types of bonding are of different strengths, they will dissociate at different temperatures, and we assume that the two glass transitions are due to the dissociation of these two types of bonding. TIJ« 140° transition seems to be due to the dissociation of the dipole-dipole bonding between nitrile sidegroups, and this also produces large birefringence effects (such as can be seen in temperature cycling of a sample under dead load).
60

2* Experimental Procedure
Since we had a large Instron testing machine available, we d-signed and constructed equipment which could be used in conjunction with this machine. An oven with temperature control had already been constructed for use with the Instron as described above, in connection with the studies of neck geometry as a function of temperature and strain rate, but was very suitable for use in the present studies as well. Birefringence measurements were made by the usual Senarmont compensator method, and an optical bench in two pieces was constructed which could be mounted on the vertical support beams of the Instron (one section in front of the sample and temperature box,
;ahd one section behind). One-half inch diameter aluminum and stainless steel rods form the supports of the bench. The optical equipment can be removed or mounted quite rapidly (in about 15 minutes, including adjustments for5
proper alignment). In order to allow convenient access to the inside of the oven, part of the front half of the optical bench can slide forward on its support rods, so that the oven door can be opened.
3. Birefringence Changes During Stress-Strain Curves — - -
Stress-strain-birefringence measurements were performed on strips of polyacrylonitrile film at eight different temperatures between room temperature and 183°C The measurements were all made at a constant elongation rate of 1% per minute. The PAN samples used for these experiments were solvent-cast films 0.0017 in. (1.7 mils) thick, cut into strips 1/2 in. wide and about 3 in. long. The films were cast from 15% solution in dimethyl forma- mide (DMF) and were subsequently dried in a vacuum oven for 17 hours at 90°C. The DMF was not completely re- moved by this treatment and there is some discussion below as to how this retained solvent is influencing the observec behavior.
Figure 54 shows curves of engineering stress (stress on original cross-section) vs. per cent elongation for samples stretched at the eight test temperatures. At 110°C and 135°C, the samples formed stable necks and drew to large extensions. At 85°C and below, the samples reached high stresses at comparatively low elongations and broke in a brittle manner. Above 140°C the samples seemed to form "unstable necks" and broke in some sort
61
of "plastic" or "ductile fracture" mode at low stresses and elonqations. The apparent breaking elongation thus goes through a maximum somewhere close to 140°C and the apparent yield stress decreases with increasing tempera- ture, though not in a linear manner as was found for poly- styrene and poiymethyl methacrylate.
Figure 55 shows the birefringence changes (vs. elongation) accompanying the stress-strain curves of figure 54. The insert shows the birefringence-elongation curves at low temperatures plotted on an expanded scale. Note that the results are plotted in terms of the "corrected extinction angle"—an experimental quantity which includes a correction for the thickness change of the sample during the experiment and which is therefore directly proportional to the birefringence of the sample. (Actual birefringence values can be calculated by multiplying the corrected extinction angle values by 6.0 x 10⁻⁵.)
Between room temperature and 85°C, the birefringence- elongation curves show a combination of two types of behavior: a glassy-type response giving positive birefrin- gence effects with increasing elongation, and a rubbery- type response giving negative birefringence effects with increasing elongation. The transition between these two types of behavior can apparently be brought about either by higher temperatures or by higher elongations (or stresses).
At 60°C the initial slope of the birefringence- elongation curve is zero (apparently due to a balance of the two effects of opposite sign), but at higher elonga- tions the slope becomes negative. At 85°C the transition to a totally negative response is complete.
We have generally interpreted the positive bire- fringence response of a glassy monosubstituted vinyl polymer as indicating that the sidegroups (from which the birefringence effect primarily arises) are tilting in the direction of the strain, little or no long-range chain backbone motion being possible. In the region of the .. glass transition the chain backbones become more free to move and they themselves orient in the stretching direc- tion. This forces the sidegroups to move in a direction perpendicular to the stretching direction, producing a negative birefringence effect. We might note hure that it seems possible that we are inducing the same sort of
62

transition by higher elongations (or stresses) as by temperature. Such a concept of a stress-induced transition (discussed further in Section VI below) might have impor- tant implications for yielding phenome a.
Between 85°C and 140°C, relatively large negative birefringence effects can be produced. Since we were watching the undrawn region of the sample in these experi- ments, the birefringence becomes essentially constant as the sample starts drawing, indicating that the increase of total sample deformation is taking place almost entirely by neck propagation. At temperatures above 140°C, the birefringence effects become progressively smaller in magnitude, reflecting .a decrease in the effectiveness of sidegroup orientation.
Of interest also are the initial slopes of the birefringence-elongation curves in figure 55, i.e., the ratio of birefringence to strain or the "strain-optical coefficient (St.-O.C.)". The temperature dependence of this quantity is shown in figure 56. The St.-O.C. is positive around room temperature. It drops to negative values around the lower glass transition and seems to level off in the temperature region between the two glass transitions. It then drops again to larger negative values around the 140°C transition before rising to much smaller negative values as the temperature is increased further.
Thus, several different orientation states, or alternatively, different forms and degrees of sidegroup orientation, can be seen.from these data. We see a glassy (positive) form of orientation at low temperatures, which gradually changes to a more rubbery (negative) form as the 90°C transition is approached. Even more sidegroup orientation is possible around the 140°C transition, but at higher temperatures, the side groups progressively lose their ability to orient with strain in such a way as to produce negative birefringence effects. This last effect is a very curious one, which requires further investigation.
The chain backbone mobility is probably reflected most clearly in the plot of log modulus vs. temperature in figure 57. These values represent the initial slopes of the stress-strain curves in figure 54. The polymer has a typical glassy modulus value around room temperature. As the 90°C transition is approached, the modulus falls by about a factor of 20. At higher temperatures it remains
63

about constant, although a slight upward trend is evident.
We usually expect a drop in the modulus of an amorphous polymer by about a factor of 1000 at the glass transition temperature. The behavior of PAN is therefore anomalous in this respect. We would also normally expect a sharper drop in the modulus-temperature curve at the transition. In this connection, it seems likely that the retained solvent in our samples is producing this more gradual drop by acting as a plasticizer, which makes the polymer softer at lower temperatures. That there is little change in, the modulus at high temperatures suggests that, although the ability of the sidegroups to orient is changing drastically, the chain backbone responds to strain in a roughly constant manner.
The data presented here indicate how critically the two transitions in PAN affect its behavior at the molecular level. It is apparent that the 140°C transition is closely associated with the nitrile groups because of the large birefringence effect's associated with this« transition. The 90°C transition seems to be involved with larger sections of the chain backbones. Since drawing only odours at temperatures between the two transitions, the birefringence effects associated with drawing should be an important key to the interpretation of the detailed molecular mechanism of drawing of this polymer.
We found that it is possible to make some estimates of the width changes of the drawn region during the drawing of a sample at a constant extension rate. Since we can also measure the initial and final thickness of the polymer sample, we can construct approximate curves for the changes in width and thickness during drawing, assuming that the thickness changes in roughly the same way as the width. (The validity of this assumption for our thin films has yet to be completely verified.) Thus, having the actual width and thickness at any time, it is possible to calculate true stress, true strain, and the corrected extinction angle or the birefringence (birefringence «• (6.0 x 10"*) x corrected extinction angle).
The true stress-true elongation curve for a strip of polyacrylonitrile film being extended at 1%/min. at 135°C is shown in figure 58. (The load-elongation curve for this sample is similar to that shown in figure 54.)
64

The curve seems to consist of two straight-line regions, one small region at very low elongations (less than 5%) and another of lower slope extending from 25% elongation to 1200% elongation. It is very unusual for a polymer to reach such a high elongation, let alone show this kind of linear relation between stress and strain.
The birefringence changes during drawing also show unusual and unexpected results. Observations of poly- styrene and polymethyl methacrylate which we have described above indicate that the birefringence along a polymer speci- men during the various stages of a drawing experiment is a simple function of the local strain at that point, and yielding is not accompanied by any discontinuous change of the birefringence. Data for polyacrylonitrile is shown in figure 59. Here we see the birefringence at the center of the drawn region plotted vs. the true strain at that point. Before neckint, occurs, the birefringence decreases with increasing elongation and as the sample necks and draws, the material outside of the neck remains at the birefrin- gence value reached just before necking. This behavior is consistent with a proportionality between birefringence and local strain. As the polymer yields, however, «-he birefringence in the neck changes very abruptly from a moderately large negative value to a positive value. As the drawing continues, the birefringence decreases gradually, eventually passing to negative values. At the high strains, the birefringence levels off at a moderate negative value of birefringence (about -0.002). This final value of birefringence, at extremely high strains, j.s consistent with our previous observations, that very large values of birefringence cannot be obtained in even the most highly drawn PAN filaments.
4. Effects of Environment
Additional information that would be extremely useful in interpreting the behavior during drawing could be provided by the birefringence changes during retraction of a drawn sample. Previous experience28 has shown us that retraction does not seem to occur on heating a drawn sample to high temperatures. This is probably due to the inter- molecular cross-linking reaction which takes place at temperatures at which retraction would be expected. However, the stress-strain behavior of polyacrylonitrile has been shown^2 to be quite sensitive to various solvents and plasticizers. One interesting aspect cf this solvent sensitivity is a sudden dissolving of the polymer sample in certain solvents on reaching the yield point.
65

In view of these effects of solvents cr> polyacrylonitrile, we designed and built equipment to allow stress-strain- birefringence and retraction measurements to be conducted on polyacrylonitrile films in various solvents at elevated temperatures. The structure was compact enough to be placed in the'air thermostat for the Instron which we had previously used in our experiments. In effect, this solvent-testing device replaced the clamps of the Instron. A liquid-containing cell was placed around the sample, uhe sides and bottom of which were stainless steel, with the front and back being well-annealed parallel optical glass plates (1/4" thick). The seal between the parts of the cell was a soft epoxy resin. Thus, the cell could 1 e used to contain almost any liquid and simultaneously allow measurements of an optical nature, such as birefringence and length change, to be made.
Measurements of the birefringence changes of samples of polyacrylonitrile during straining at 2% per minute at 60°C were carried out in mixtures of water and DMF (dimethyl formamide) with DMF concentrations from 0% to, 100% in 25% intervals. The changes in sample appearance proved more interesting than the actual birefringence changes. The former are summarized below.
sample environment
100% H^O
25%*. DMF - 75% HgO
50% DMF - 50% H20
75% DMF - 255 H^O
100% DMF
sample appearance after test
white and opaque ,
white and lightly crazed
white, lightly crazed, fine band structure at 45-50°
clear, large crazes hori- zontal ly across entire sample
(sample dissolves as soon as stress is applied).
The whitening or blushing of the sample is apparently due to void formation caused by the extraction by the water of the DMF initially present, in the solvent-cast (from DMF) films. When this effect is suppressed by lower- ing the water concentration, the effects of the DMF are clearly seen and very striking crazes are produced. We vere not able to reproduce the experiments of Rosenbaum31
in 100% DMF. Apparently his drawn fibers did not dissolve in the solvent as did our undrawn films.
66

An attempt was made to measure the retraction behavior of a PAN film partially drawn at 125°C, by heating it in air (under no load) to about 170°C. The drawn region showed completely reversible behavior both in length and bire- fringence changes. The undrawn region however retracted (in length) with an accompanying decrease in its birefrin- gence of about 24%. This evidence, combined with'the birefringence results, indicates the special nature of the drawn PAN. These retraction effects require more detailed investigation.
C. HOT vs. COLD EXTENSION OF POLYSTYRENE AND POLYMETHYL METHACRYLATE ,
We have observed that the birefringence produced by a given extension (in both polystyrene and PMMA) is very different depending on whether the polymer was extended by hot stretching (above Tg), or by cold drawing. The birefringence is significantly larger in the case of cold drawing for equal extensions. If it is assumed that birefringence gives a direct measurement of the degree of molecular orientation, this indicates that the relation between molecular orientation and gross external extension of the sample is different in/cold drawing and hot stretch- ing, and that the nature of the molecular orientation may even be different in the two cases. This is certainly the case for the polyacrylonitrile samples discussed above. It may be assumed that in the case of hot stretching the relationship between birefringence and sample strain is given by the rubber elasticity theory of birefringence developed by Kuhn and Grün, provided that no molecular flow takes place (since the theory describes the behavior of a crosslinked rubber network).
It has been found that PMMA and polystyrene seem to respond differently to stretching when they are being oriented by hot stretching above T„. The PMMA seems to behave in a fairly rubbery way well above the glass transi- tion. An explanation of this is suggested in a recent Russian publication by Shishkin and Milagin . They assume that PMMA above its glass trai^ition is actually in a crosslinked state, where the cross links are not chemical linkages between the molecules, but association bonds 'between the dipoles of the ester sidegroups. This association bonding persists even to r,00°C and above, and the temperature dependence of the concentration of these association bonds allows an explanation of the dependence
67

of birefringence on strain at different temperatures on the basis of the rubber elasticity theory. This same conclusion was arrived at independently in our own labor?- tory by another line of thinking before we discovered the above publication. There should be no such association network in polystyrene above its glass transition, because the molecule contains no dipolar groups which could associate in thiSi,way. Some molecular flow may therefore ta\e place during the hot stretching of polystyrene, so thai complete recovery would not be obtained during shrinkage above T .
y
To investigate some of these birefringence and shrink- age effects, oriented PMMA samples were prepared by three different procedures: by hot stretching alone (above Tg), by a combination of hot stretching followed by cold draw- ing, and by cold drawing alone (below Tg). Extension and birefringence values for such a set of PMMA samples were as follows:
Birefringence x 103
Hot Total
0.62 0.62 0.41 1.30
1.25
The elongation values are based on the original lsngth of the sample in all cases.
The elongation possible during cold drawing was set by the natural draw ratio, but the elongation of the hot stretched sample could be matched fairly closely tc the total elongation of the sample with the combination exten- sion. The higher birefringence values produced by cold drawing are clearly seen from this table with the combina- tion sample falling in an intermediate position, as expected. When these samples were heated at a temperature well above the glass transition, in an unrestrained state, all of these speoimens showed complete shrinkage recovery to their original unoriented length, indicating that no molecular flow took place during the orientation process. The birefringence -also went to zero in all cases when shrinkage was complete. -A similar series of experiments of PS was not entirely conclusive and requires further verification. It appeared that the hot oriented specimen recovered less than the hot and cold drawn one and both did not recover completely.
68
Elongation (%)
Hot Cold Total
192 115
192 92 207
120 120

A similar set of samples were heated to 105°C and allowed to retract freely. The birefringence and elongation were measured during the shrinkage, and the resulting curves are shovvn in figure 60. The orientation data for each sample are also indicated on the figure. Elongation values are again based on the original unstretched length of the sample. The complete shrinkage curves are not shown, since shrinkage and birefringence change were too rapid to follow initially, and became very slow as time progressed. The curves shown here were followed out for at least 30 minutes.
Other experiments in which samples with both hot and cold extension were gradually heated in the neighborhood of the glass transition indicated that the strain put in by cold drawing would shrink out at a temperature slightly below that at which shrinkage of the hot orientation took place. This seems to suggest that the orientation put in by cold drawing (or the structure of tne oriented state produced by cold drawing) is not identical with that produced by hot stretching. This is in accord with the difference in the magnitude of the birefringence effects produced by hot stretching and cold drawing. The birefringence of a polystyrene sample which had been pre- oriented, then partially cold drawn in a dead-load experi- ment, was measured after cooling it to room temperature. The birefringence through the necked region was computed from the fringe pattern and the specimen thickness, and it was found that the birefringence increased progressively from the low to the highly drawn part of the neck (figure 61). We also measured the birefringence changes of a sample of PMMA with zero preorientation during the delay period prior to yield. The specimen dimonsions were recorded photographically at the same t.i e as the retarda- tion measurements were being made. Sin». the specimen became inhomogeneous as the delay time was approached, and the rapid yield and drawing process which then took place could not be followed by the techniques used here, only the birefringence changes in the region of homogeneous deformation prior to yield were obtained (see figure 62). For this polymer also the birefringence is seen to increase progressively with strain, but in a very non-linear way as compared to polystyrene. The first appearance of deformation inhomogeneities (localized bands) which precede neck formation was well within the strain range covered here (0-12% overall sample elongation).
It appears that the birefringence along a polymer
69

specimen during drawing is a function of local strain. In some exploratory tests, however, it as found that the birefringence falls off with tins, if the specimen is first strained, then held at constant length. In analogy with stress-relaxation, the rate of birefringence change must be temperature dependent also. The birefringence in cold drawing is therefore expected to be a function of tempera- ture and rate of deformation as well as strain. More thorough investigations ,of these variables would be of great ^alue in following the chain conformation changes during cold drawing.
70

VI,. THEORETICAL DISCUSSION OF POLYMER YIELDING
A. INTRODUCTION
In conjunction with the experimental investigations carried out in this project, we have also given some con- sideration to'the theoretical aspects of the yield and drawing process. There are several features of the process which require an adequate theoretical understanding. In terms of the continuum properties of the solid polymer itself, an understanding is needed of both the "strain- softening" process which allows yield to initiate, and the "strain-hardening" process which causes the yield to term- inate at a certain point, and thus allows a stable drawing process to occur by neck propagation. Such behavior is in contrast to a continuing growth of the initial neck to the point where the iterial finally pulls apart, as is commonly observed with s. c metals such as copper, The initiation of the yield b- structural softening" is probably the first process to attempt to understand. It is this process alone which is being observed in the study of delay times in cfead- load drawing experiments.
Also requiring a more detailed understanding is the phenomenon of deformation band formation, in particular, why the material tends to form these bands rather than yielding homogeneously. This seems to be an important part of the initial yield step. The softening and harden- ing procecses must be occurring in sequence in the local yield region, during the initiation and propagation of these bands. The band structure may also be playing an important role in the formation, stabilization and propa- gation of the neck; some speculations on this point are presented at the end of this section. The "strain harden- ing" process has generally been assumed to be a result of the molecular orientation produced by the drawing; however, hardening has also been observed to take place as a function of time in interrupted drawing experiments, and a more detailed investigation of this effect is needed. In our studies of neck geometry, we attempted to obtain some information on hardening vs. strain and the role of molecular orientation by deriving ehe true stress-strain curve as a function of preorientation (introduced by hot- stretching) . However, there is some doubt as to whether these curves are actually the true stress-strain curves of the bulk polymer, or whether they may not rather represent
71

the stress-strain relation of a composite structure consisting of a lattice of deformation bands and a matrix of unyielded polymer.
A thorough discussion of the theory of yield and drawing should of course involve a survey of the published literature on this subject, and an indication of the lines of historical development. Space does not permit the presentation of such a background survey here; we will discuss primarily work which was carried out as a direct part of the present study. We would hope to be able to present such a comprehensive survey of the work of other investigators in other publications. A comparison of the mathematical form of the relations between yield stress, strain rate, and temperature proposed by several different investigators is, however, presented in a later part of this section.
We have also given no specific discussion of the behav- ior of crystalline polymers here. Because of the similarity of the phenomenology of drawing in crystalline and amorphous polymers, it seems likely that the basic theory of drawing is very similar for both. One significant difference, however, is that very high draw ratios are sometimes .obtained for crystalline polymers, but not in amorphous polymers; this may be a consequence of a significant difference in the strain-hardening process, and may provide an experimen- tal approach for a more detailed study of the strain- hardening efffit.
B. CONTINUUM (MOLECULAR) THEORIES OF YIELD
Disregarding the question of localized deformation band formation, we have considered three different approaches to the theory of yielding at the molecular level. Each approach is capable of at least a conceptual explana- tion of the complexities of the yielding process, although the derivation and underlying assumptions of each model are different. These models are designated here as the "defect", "fiber bundle", and "bonding" models.
Some of the distinctions and differences in these models can be summarized as follows. All three are rate theories, based on a summation of localized events and containing a dependence on temperature and polymer history (variable structure). Whereas the defect model treats the "movement" of defects in a stressed continuum as the deformation-producing event, the fiber bundle and bonding
72

models treat the stress-supporting elements themselves. The fiber bundle model, like the bonding model, assumes a rate of both breaking and reforming of the stress-supporting elements, but the elements involved are not precisely de- fined, and a variable distribution in stress and time, but not in total number, is essential to the proper function- ing of the model. The defect and bonding models, on the other hand, depend on a variable number of elements, the elements themselves having a characteristic size or strength in their contribution to the plastic strain.
These different models are not necessarily mutually exclusive. They represent different conceptual approaches, but some compromise between, or blend of, these different points of view may eventually provide the most satisfactory model.
1. Defect Model
Many of the aspects of the yielding behavior oftglassy polymers appear to have closer analogies with metal and ceramic mechanics than with the classical concepts of polymer mechanics such as viscoelasticity, rubber elasticity, and melt viscosity. The most striking visual similarity is the occurrence, in both metals and glassy polymers, of localized, inhomogeneous deformation regions (bands) during plastic deformation. In stress-strain properties, both metals and glassy polymers demonstrate true strain-soften- ing and yield phenomena in a variety of stress fields, as well as strain-hardening effects. Furthermore, they both are materials which are rigid at low stresses and, there- fore, are probably both close packed structures on a moleculer scale.
Many aspects of polymer properties and behavior are, of course, quite different from those of metals and ceramics, especially on the molecular or microscopic structural level. Chief among these differences are the presence of non-crystalline regions and the existence of one-dimensional chains in the polymer structure. The lack of crystalline ordering of the structure has important consequences in regard to any defect model of the glass. The defect cannot be defined or described in terms of any regular molecular structure or arrangement, as is done in the case of dislocations in crystalline materials. Further- more, the glassy structure does not present any unique plane or direction in which deformation by defect movement is preferred, even though there is a high degree of bond
73

anisotropy on the molecular scale.due to the chain nature of polymers. Therefore, deformation would be expected to be difficult for polymers, even if defects were plentiful, because of the tangled structure. A further consequence of the chain nature of polymers is the connectivity of atoms along a chain. Thus, when considering elemental slip processes of atoms or molecules past one another, one must take into account that these slip elements are probably not independent of their immediate surroundings. In other words, the movement of one part of a polymer chain by necessity involves at least the parts of the chain immediately on either side of the moving part. Thus, the effective size of a polymer defect would be expected to be somewhat larger than a dislocation in a metal. The chains would also be an integral part of the strain hardening or maximum extension effect in polymeis. As extension proceeds, chain orientation occurs and a greater proportion of strong intra-chain bonds resists further deformation. This sets a limit to the extent of yield.
In the development of a defect model of «tj. material and its deformation behavior, a basic assumption is that the plastic deformation of a polymer can be described as the result of the "movement" of a number of individual defects. Thus, each defect contributes a displacement to the total plastic strain (ep) by an amount equal to its characteris- tic dimension (fc) in the time 1/v (where v is velocity) and that there are a number (n) of these contributions. It may be assumed that there is an initial number (n0) of defects present in an unstrained material, this number not being determined by thermal equilibrium, but by the previous thermal and mechanical history of the sample. It is further assumed that the velocity of "movement", or equivalently the rate of plastic strain producing contribu- tions of these defects has a very high stress dependence and the usual exponential dependence on temperature, characteristic of thermally activated processes. Finally, the number of active defects is considered to be a function of the current history, that is, of plastic strain or time of deformation. Experimental support for these assump- tions is of varying degress. The nature of possible defects has been discussed, but proof of their size, number, and behavior is lacking. The time, temperature and pressure dependence can be correlated with published yield stress data, and the nature of the structure term has been confirmed by consideration of the details of the complete stress-strain-time curves for glassy polymers.
74

From these assumptions, it is possibJe to write down an Eyring type rate equation for plastic strain rate (ep) as a function of stress (a), activation energy (E_ct), size of defect (-ß) , and number of defects (n) .
£P = *nv = *n[* ™ exp -(%)sinh(f^)] (12) ,
where kT/h is a frequency factor and the expression in the brackets can be designated as a velocity. The sinh(x) term can be replaced by 1/2 exp(x) if it is kept in mind that this substitution is only valid in the high stress range where x is large (i.e., ep should go to zero as a goes to zero, which is not true for the exp expression).
Mb3o E .\ •-P *2 kT — " act
e = fc2n __ exp^ e j (13)
This basic rate equation (neglecting such things as pressure dependence, etc., can be further simplified by combining constants, so that
.-P e = GTN exp (g° ~ A ) (14)
where A = E /k, H = fc3/2k, Q = f>2k/h, N ■ n, and T = temperature.
While A, H, and G are constants, characteristic of the defects, the structure term N is assumed to be a function of the deformation during constant strain rate experiments and thus must be expanded. In previous work /both strain- softening and strain-hardening were included in the structure term
P n + ae N " %f(A) (15)
where n is the original number of defects, a and y are constants, and f(x) is a function of extension ratio (X = 1 + ep) not unlike the non-Gaussian correction for rubber networks at high extensions.
75
It is useful tc speculate on how some of the complicated time effects during yielding, discussed above in St tion III, could be explained by this defect model of Reformation. Assuming that deformation is slow enough so that temperature fluctuations are not significant, it seems reasonable that the marked changes in stress-strain behavior or delay time in creep arise from changes in the structure of the material, specifically the population of defects. It is known from the theory of yielding based on dislocation generation and movement that the two parameters that most affect the height and sharpness of the upper yield point are the number of original dislocations (n0) and the stress dependence of the dislocation velocity. Since it is assumed that for an isothermal experiment, T, Eact, and f> all remain constant in the rate equation, then n, the number of defects, must be the only time- dependent quantity in the glassy structure. The functional form would probably include a decay term whereby the defect population would decrease with time in a relatively simple way if other variables, such as strain, were held constant. The decay rate would depend on the number present. During a stress-strain experiment, though, this decay would be only one of the components determining defect population; there would also be the multiplication terms related to increasing strain, for example. It is conceivable that a balance of these effects could lead to the attainment of a steady-state numL .r of defects during yielding, or even to a decrease of defect population in such a way that the strain-hardening behavior can be expressed as a time function. This sort of time function would differ from that suggested by the "fiber bundle" concept, in that the latter treats a constant number of elements that have a . distribution in stress and time, whereas this defect model treats a model of constant (homogeneous) stress with the number of elements variable in time. But both concepts contain positive (hardening) and negative (decay or softening) terms, allowing for attainment of a steady state,
Two additional concepts are needed before the time effects (Section III) can be adequately discussed. The first is that, since the time effect experiments were done on tensile film samples where neck formation and propaga- tion were prominent, one has to assume not only that the defect model applies to this macro, inhomogeneous tensile yielding mode, but also that the volume of the deforming material remains constant, once steady state drawing has started. We have, in fact, confirmed this in our studies
76
of PMMA neck shape; neck shapes are nearly constant during drawing, as well as during stress relaxation and reloading history sequences. If this is so, the defect model of yielding has to contain a strain-hardening term, as dis- cussed above. Then, a constant average defect population, designated as nD,can be assumed to exist in the deformation zone of the sample at the beginning of the stress relaxa- tion period.
The second important concept concerning the time- dependent defect population, expressed as the relative population during drawing (n^) compared to the original (n0) is that there might be a thermodynamic equilibrium popula- tion (nT) still smaller than n0;. By allowing that the defect population, during stress relaxation, can decrease to less than the original number, allowance for hardening over and above the rigidity on original loading has been made. But, because the attainment of nT is no doubt pre- cluded by kinetic effects below Tg, this effect would probably only be important in a polymer sample quenched rapidly through the glass transition.
Assuming, for simplicity, that under any given conditions of T, P, £, etc., there is a maximum number, n^, and a minimum number, n0, of defects, then it should be possible to formulate the change of stress-strain properties after various histories in terms of the time-dependence of the number of defects present at the beginning of reloading. As an illustration, the history described in Section III.B.3, consisting of: (a) drawing, (b) stress relaxation at constant strain, (c) reloading with an increased apparent modulus through another yield point, can be discussed with the following simple picture. During stress relaxation, even though the defects are still moving and multiplying because of the finite stress, there is a net decrease in defect population as the effect of defect decay with time overcomes the effect of defect increase due to multiplication. With long enough time, the defect popula- tion would approach nG as the stress relaxation rate approached the normal glassy rate at low stress. Then, at the start of reloading, the stress has a finite value at which value on the first loading there were more defects. Therefore, the stress has to rise rapidly so that the velocity increase will compensate f,or the small defect population. An upper yield point,'then, occurs as multi- plication brings the defect population back up to n^. In this .way, it is seen how the height of the second upper yield point and the reloading modulus could depend on the
• 77

defect population at the beginning of the reloading. This defect population would probably be a function of both time and stress level during stress relaxation, as suggested by the experimental results (figures 13 and 21, for example). Fitting of the experimental results to a time-dependent function for n with a characteristic "relaxation time" for defect disappearance looks promising from preliminary attempts. It has been observed that the "plastic volume", which was -suggested above to be a measure of the defect population, and the load during stress relaxation at high stresses both decrease and appear to be linearly related.
These effects of hardening and associated regain of upper yi^ld point in glassy polymers are similar to.what has been called "strain-aging" effects in steels and several other metals, whereby after initial yielding the metal is unloaded, aged for a time at a temperature usually higher than the test temperature, then reloaded. The fact that another upper yield point is observed in steels on reloading has been explained by saying that during aging the number of active dislocations is reduced by a pinning mechanism so that they have to be unpinned again upon reloading. For other metals, such as copper, it is known from other experiments that the number of vacancies, dis- locations, and other defects decreases during aging or annealing processes, Thus, the analogy with the defect model of glassy polymers presented here is at least plausible, except that the effect of aging for these poly- mers at room temperature for a short time depends on stress level. Effects exactly similar to those in metals could be obtained with glassy polymers by aging or annealing them in the unloaded stage just below their glass-transition temperature, or for longer times at room temperature.
Stress-strain tests at constant strain rate are probably not the easiest way to look at the relationship between time effects and yielding parameters. It would seem that creep tests at constant load or "spontaneous necking" tests at constant strain would be simpler cases to explore. J. J. Gilman34 has applied the formulation of the dislocation model to dead load creep tests on LiF and found that delay times before the onset of high rate creep were accurately predicted. In fact, the discussion of an equation of state for yield in Section Ill.C.S.d above is the first simplified stage in the use of rate equations in analysis of delay times for polymers.
2. Fiber Bundle Model 78

An alternate approach to the dislocation analogy treated above which can be found in the literature35 involves the explanation of plastic yield by use of the high-stress form of the Eyring viscosity equation:
= C exp (- ^]sinh(g)= A sinh(g) (16)
where c is strain rate, C is a constant with dimensions of a reciprocal time, Ea is the energy of activation for viscous flowz v is a quantity with the dimensions of a volume, and s is the mean stress per molecular group. This equation, though it gives a reasonable account of the influence of stress level and temperature on deformation rate, fails badly to describe all of the phenomena observed in the yielding of glassy polymers, such as a well-defined yield at constant strain rate, a delay time to yield under dead load, and hardening effects during stress relaxation at constant strain (when drawing is interrupted).
A model has therefore been constructed here, using the Eyring equation as a starting point, but incorporating an additional assumption, which seems to be a logically necessary one; that is, that the stress on a molecular group, rather than being taken equal to the mean stress I, is taken as dependent on the prior history of this group. If it has just rearranged or "jumped" under the influence of the applied stress, the stress, s, acting on this group is assumed to be zero. As other groups subsequently yield or jump, the value of s acting on this group rises until the element "jumps" again. The jump probability per unit time is taken to be A sinh(sv/kT). The total stress applied to the system must, of course, be supported by the individual elements in any cros action of the specimen, but the jumps that relieve s s at some sites lead to a higher stress at the other: This re-distribution of stress from "broken" to still-re .ring elements is a characteristic of statistical theories of fracture of fiber bundles. However, a procesi of re-formation of "broken" elements is assumed here. <
These considerations lead to a description of the time behavior of the system in terms of a distribution function n(s>t) giving the number of elements supporting stress s at time t. The function n(s,t) is subject to the following conditions:
79
/
/
n(s,t) ds = N (The number of molecular groups per unit cross- sectional area) (17)
s n ds = £ (The applied stress) (18)
e - g / n A sinh «-= ds (where g is a ' ' dimensionless
constant). (19)
The equation which governs the change of n(s,t) with time is non-linear, and a complete solution has not yet been obtained. However, a solution for steady state conditions, combined with certain qualitative considerations based on the form the solution must take, lead to the conclusion that a fair description of the influence of stress history on the material, and hence of the existence of phenomenological plasticity, can be provided in these terms. A somewhat more complete discussion of this model has been presented in a recent publication3 .
3. Intermolecular Bonding and Stress»Induced Transitions
Theories of cold-drawing have been proposed previously which were related to the glass transition phenomenon. One, proposed many years ago by Müller, assumes that the work of drawing heats the polymer locally (at the neck) to the glass temperature (T~). A second assumes that enough free volume is introduced into the glass by straining (e.g., by the Poissonjs ratio effect) to produce the glass transition. However, both of these theories are open to criticism on the basis of known experimental facts, even though it would seem that something like a glass transition effect is needed to allow the magnitude of straining and the molecular slippage and orientation which are observed during the cold-drawing process.
It would seem possible to propose still another "glass transition" theory of cold-drawing, in which.it is assumed that the glass transition is "stress-induced", in a way other than«through free volume change—perhaps, by the elastic strain energy. Let us further assume that the essential nature of the glass transition phenomenon consists in the breaking or loosening of cohesive bonds between the chains (which are frozen and rigid in the glassy state).
80

This is something of a departure from the usual theories of the glass transition, but is the approach used in Section V.B.I to explain the glass transition behavior of poly- acrylonitrile. It has also been utilized in a recent publication37 in connection with the interpretation of dynamic mechanical loss spectra. The detailed nature of the cohesive bonding will depend on the chemical structure of the polymer, and the existence of more than one type of cohesive bonding could explain the existence of more than one glass transition in some glassy polymers (in such a case, all but one would customarily be referred to as "secondary transitions"). Within this framework, a cohesive bond in -.he glassy state would be regarded as the analog of a "fiber" in the fiber bundle model and a broken bond, the analog of a crystal dislocation in the defect model. The advantage of the bonding model is the specification of the nature and strength of the elementary unit involved in the deformation process.
It seems likely that only a "partial" glass transition would be necessary for cold-drawing, and not a complete transition to a rubbery state. In addition, such a transition might be anisotropic, allowing the molecules to slip preferentially in a certain direction, in contrast to the usual thermal type of glass transition. One of the important by-products of an understanding of the molecular or microscopic mechanism of yield and drawing in glassy polymers might therefore be an improved theoretical under- standing of the nature of the glass transition.
In the development of a microscopic mechanism of the yield process, the initiation of the yield would seem to be the feature capable of the simplest treatment, as noted previously. This can be observed particularly well in experiments of drawing under dead load, which have been described in a previous section. These display the time effects involved in the initiation of yield in a particular- ly helpful way, as a "delay time" in neck formation.
If it is assumed that the initiation of yield is the result of a stress-induced glass transition (probably a partial rather than complete transition) the sudden ini- tiation of a neck must be the final catastrophic result of a gradual breakdown of cohesive bonding between the molecules, and is a consequence of the kinetics of the bond-breakdown process. The fact that time effects are connected with the glass transition is well known. A useful analogy for the yield initiation might be that of a
31

branching chain reaction (such as nuclear fission) where a critical boundary (e.g., of temperature and pressure or concentration) exists, above which the reaction "runs away" and becomes explosive—i.e., becomes catastrophic in a rate sense. This would seem to be analogous to the boundary observed in dead load drawing, above which necking and drawing takes place, but below which only creep is observed. Another .feature which seems evident is that the nature of the microscopic processes involved should not be different above and below such a boundary; the boundary represents merely the critical kinetic conditions for explosive popu- lation growth. Consequently, if a bonding breakdown is responsible for necking and drawing, it should similarly be responsible for the viscoelastic behavior observed below the critical stress level required for yield.
C. COMPARISON OF MATHEMATICAL FORMULATIONS
Because of the wide use and inherent reasonableness of theories based, either directly or indirectly, upon an Eyring type stress-biased thermally activated rate process, it seems useful to examine these various treatments for points of similarity and difference. Many of these formulations were derived from experimental curve fitting and only afterwards justified theoretically, and thus a useful comparison of experimental data can be made here also.
The most basic point of departure for all these formulations is that a. characteristic stress (the yield stress) varies linearly with the log of the strain rate, at least for reasonable rates well below sonic velocities. This general experimental fact appear' in all the formula- tions. Temperature is the other most important and well- investigated experimental variable, but the representation of temperature dependence in ther.e formulations varies somewhat. Other experimental variables such as pressure and complicated loading histories have not been extensively investigated. Polymer variables are usually included äs th* empirical constants of the equations. But there is no allowance for variability of polymer structure (crystalline morphology, density of glass), except for molecular orientation, and there is little correlation attempted with other polymer properties.
The most general form of these theories is shown in equation 20 where £ is a strain rate, o is a stress and
82

A, B, C are constants.
1 To - Al e * c 6XP I -B—J (20a)
a = A + B ln(Ci) (20b)
The discussion of the range of validity (in c and e ) of these equations will be deferred until later, as will the derivation from more basic principles. Although there are assumptions and simplifications involved, if e is taken to be the overall strain rate (derived from crosshcad rate) and o is taken to be the yield stress (oy) (either offset or maximum load point), the following formulae can be compared with the data on polymers.
Robertson-^ has studied the stress-strain properties of Lexan polycarbonate as a function of temperature, strain rate, and orientation (strain). He presents a constitutive equation of the following form
e = C, exp Vx (21) . (9-T) (1 + afic)
where T is temperature, JJ is an orientation function, and Ci and C2 are constants. Since the yield point occurs at low enough strain levels, the ft function can be ignced. Transforming equation (21) into form (2Cb) we get:
ay = - + -~ in (L-) -c2 c± (22)
A = i-, B = u2- c2
C = 1_ C (23)
Thus, all the temperature dependence is contained in the parameter B.
Lohr 38 in two recent articles, has reported studies of the yield stress of both glassy and crystalline pclymers as functions of temperature and strain rate. His data can be represented by an equation of the form
83

oy = Kx + K2 £n(e aT) (24)
with the simple correspondence between (20b) and (24) being
A = Kr B = K2, C = aT (25)
where K, and K2 are constants depending on the polymer and choice of reference temperature and aT is a temperature dependent shift factor used for shifting data along the tni axis. Here, then, all of the temperature dependence is contained in parameter C.
39 Roething has investigated PMMA and PEMA over a range of strain rates and temperatures, including^the T„ range. Because'his data, when plotted against log e, shows two linear portions, he represents the behavior as Eyring type viscosity with two species of flow units, corresponding to the behavior above and below the glass transition. The basic equation is
q , . r .- , AH. -j JI . E (£-) sinlT1 [(C. 1) exp (-&)\ (26)
where A. and C. are constants and the AH. are the activation energies for trie two processes denoted by the index i. Taking the usual high-stress limit of the Eyring type equation where
sinh x a x- exp x if x > 3.5 (2~)
equation (26) is put into the form of equation (20b)
o. AH. 2!c.
J + i- Jln(—-i) - (28) 'y " RA7T 57 *"v—
and AH. 2C.
A"Rä7' BSBA-< C'-¥- (29)
The temperature dependence, then, is here directly included 84

in the parameters B and C, and indirectly in A through the choice of processes involved. Polymer variables are also included in all three parameters. In the data of Lohr on semicrystalline polymers, two straight line regions of behavior are also evident, but he arbitrarily picks one or the other to fit to his equation (24).
40 Kaelble has developed a theory of yielding based directly on the WLF equation, which applies not only to yielding but also to large strain and rupture behavior as well, using the analysis of T. Smith of rupture of rubbery networks41. Although the basis of Kaelble's theory of yielding is the idea of Tg being lowered by the hydrostatic component of the tensile stress, which has limited validity, the constitutive equation is still of interest.
exp rC3a - C4AT ] (30)
where
c3 = v c*-*M)f- f = free volume at T , AT = !~T - T 1 a a' L a-» g
-C, AT aT'= exp ^—^-£^3 WLF shift factor.
Rearranged into the form of equation (20b), at a it becomes *
C4 AT + ü7*n(!aT) (31)
and C4 AT
B = C ' ^3 C- ^ e (32)
Beside the fact that the temperature dependence is included in all three parameters, though in different ways, this formulation is interesting in that superposition of the total stress-strain behavior is possible. Thus, even
85

though the strain dependence in parameter C and the T_ temperature dependence (through AT) are both derived from mechanical behavior above Tg (rubbery and viscous flow, respectively), they seem to fit correctly the stress- strain behavior below Tg in the glassy state. The inclusion of the "structure factor" (f(e)) is significant here.
It is interesting to compare the basic behavior with the defect theory discussed in Section VI.B.l. Further development of the ideas in that section leads to the general yield stress equation for glassy polymers:
Ag , T . = —- + —- in
H- H- (cgFgT/ (33)
Where S is a strain rate, Fg is a structure factor (linear in strain), and A? and H? are constants dependent on the polymer, G9 being related to H9. Compared to equation (20b), the parameters are
tf B T__
Hg C ■
GgFgT (34)
where both B and C are linear functions of temperature and C contains a strain dependence. The dependence on T„ is contained in the parameter A through Ag. .
A comparison of these equations, all of which appear to fit the experimental data reasonably well, reveals many similarities and a few important differences. In this comparison, it must be kept in mind that there might be differences in the definition or characterization of the yield point and in the definition of which strain rate to use, total or non-elastic (plastic) strain rate. But these slight differences, discussed below, are minimized at the yield point.
The parameter A of equation (20b) is represented in all of the treatments except that of Kaelble as temperature
86

independent, and, where specified, includes an activation energy term characteristic of the polymer. Similarly, parameter B, in all but Lohr's treatment, is linearly related to temperature and is a polymer constant. Parameter C, in all but Robertson's treatment, is a decreasing function of temperature though not exactly linear in Kaelble's and Lohr's treatment. Furthermore, in the two treatments that claim to apply to strains other than the yield point there is a reciprocal dependence of parameter C on total strain (Kaelble) or on plastic strain (Whitney).
Since the equations fit their respective yield stress data fairly well, it is not surprising that the value of the polymer constants in similar treatments are about the same for the same polymer. There is little attempt, however, to investigate how these constants might relate to other characteristics of the polymer, in the sense of chemical, conformational, or morphological structure. The relation to T is the only explicit correlation with polymer properties.
D. NECK FORMATION AND DRAW RATIO
The problem of neck formation is perhaps the most obvious phenomenon associated with polymer yielding* As such, it is useful to offer some observations on this subject, which, although of a speculative nature, might be helpful in pointing the way to the ultimate resolution of this problem.
Although most discussions have approached the problem of neck formation in terms of the stress-strain properties of the material considered as a homogeneous continuum, the detailed observations of neck initiation and propagation in the dead-load (creep) drawing discussed in a preceding section seem to indicate that the development of a neck may be connected in a very direct way with the development of deformation bands in the specimen, although this is not yet certain. Since the bands which have been observed start to develop nrior to the formation of the neck, it v, ild seem that they can hardly fail to have an influence on tue mechanics of the neck formation and propagation; in fact, it seems more likely that they play a key role in the overall process. The formation of these deformation bands has been observed in many polymers, both amorphous and crystalline, and their appearance during the yield process may be a perfectly general phenomenon for all polymers (although this point cannot yet be regarded as established).
87

In cases where deformation bands accompanying neck formation have been seen, the typical sequence of behavior observed in neck initiation and propagation is the follow- ing:
(a) Growth of deformation bands in the specimen. (b) Formation of a neck at the point on the specimen
where the concentration of deformation bands is greatest.
(c) Tilting of the bands into the axial direction as the undrawn material containing the band structure feeds into the neck.
(d) Disappearance of the bands as the neck moves further along the specimen, leaving a drawn region which appears to be homogeneous, and in which bands can no longer be seen.
Setting aside the question of why such localized deformation bands tend to form in the first place, their propagation through the specimen requires a localized softening and yield (compared to the surrounding bulk material) followed by a hardening which arrests the local yield at a certain, point. The band itself may then be regarded as consisting of "strain-hardened" polymer. Since the bands tend to grow in from the various lateral faces of the sample, they will eventually form an intersecting lattice in three dimensions, embedded in a matrix of unyielded material. The details of the structure of this lattice, if it indeed exists, are still open to question. The specimen could thus be regarded as a composite structure somewhat similar to a fiberglass-reinforced plastic, except that the rigid network is made up of some kind of cells rather than filaments. A better analogy would perhaps be a composite with a honeycomb core. The formation of a neck then requires the localized collapse of the rigid lattice, which acts as the primary load-bearing element of the structure, in the axial direction (this would resemble the folding-up of an umbrella). This lattice collapse requires the yield of the undrawn matrix material, and lattice and matrix coalesce into uniformly (homogeneously) yielded and strain-hardened polymer as the neck propagates away from this point.
The fact that a localized neck tends to form in the specimen is not at all surprising from a consideration of this model since such a lattice might be unstable and would tend to collapse when strained; this collapse would take place first at some local point in a sample which is
88

not perfectly homogeneous, as is observed. The strain hardening when the lattice is fully extended, and the propagation of the neck by a "collapse wave" in the lattice C'-n easily be visualized; the collapse of the lattice at one point will make it easier for the adjoining parts of the lattice to collapse in turn. The gross features of neck formation and propagation when accompanied by deformation bands might thus be understood in terms of this picture of a collapsing lattice composite, However, a full understanding still requires a knowledge of the material properties on the molecular (or bulk homogeneous) level. This will be necessary to understand how deformation bands form initially, and how the matrix material yields as the lattice collapses. (The photograph in figure 30 indicates that the band concentration becomes quite dense in a specimen neck, and this is probably part of the answer as to how the matrix material yields.)
This approach also has important relevance to another basic problem—that of explaining the "draw ratio" of a polymer (the magnitude of extension produced by the draw- ing process). If the drawing can be visualized as a process of lattice collapse, then the draw ratio shou.'d be merely a combination of the strain m jnitude in the deform- ation bands and the geometrical extension factor resulting from the lattice collapse. Since the deformation bands always form at a roughly 45° angle for different polymers, the lattice collapse factor should be about the same for all polymers. Variations in the "natural draw ratio" for different polymers should then be primarily a result of differences in the magnitude of strain in their deforma- tion bands. Data of this type are not now available on a wide enough variety of polymers to allow such a. correlation to be verified at the present time. However, the magnitude of the strain in the deformation bands of polystyrene has been estimated (Section IV.D.) to be approximately unity (i.e. 100% extension) and combination of this with a lattice collapse factor where the bands are at an angle of perhaps 50-55° to the sample axis would give a value of the draw ratio which is in good agreement with that experimentally observed for polystyrene (150-200% elongation, for polymer containing only a small amount of preorientation).
89

VII. CONCLUSIONS
During the period of the present contract, we have had the opportunity to extend our studies of cold-drawing to provide a more satisfactory understanding of several of the important aspects of the phenomenon. Based on the results of our previous six-month exploratory contract, we have followed out some of the lines of investigation indicated there in greater detail, and have done some further exploratory work as well. We have extended our work to a wider range of polymers (including crystalline as well as amorphous types).
The time effects associated with the drawing process have been investigated in different ways and in considerable detail. Measurements of stress relaxation before and after yield, and of interrupted drawing, indicate definite soft- ening and hardening effects taking place as a function of time in both amorphous end crystalline polymers in the ranges of stress level and strain where yield takes place. This must reflect reversible changes in the solid state structure of the polymer. There are large differences in the effect of interrupting drawing during the neck propa- gation stage, depending on whether the sample is held at constant strain or is completely unloaded and allowed to retract during the interruption period; hardening takes place in the first case, softening (initially, followed by re-hardening) in the second.
The phenomenon of delayed drawing under dead-load (creep) conditions has been carefully investigated, for polystyrene and polymethyl methacrylate, as a function of stress level, temperature, and pre-orientation of the polymer. The delay time for initiation of necking under these conditions has been particularly studied. It is found that there is a critical stress level, which decreases with increasing temperature, above which delayed drawing takes place, but below which only viscoelastic creep is observed. Since drawing always seems to be preceded by the formation of localized shear bands, it seems probable that this critical stress represents the stress required for their formation or propagation. The logarithm of the delay time is found to be a linear function of both stress and temperature. The delay time depends only slightly on preorientation.
Sequence photographs of samples of PMMA during stress- SO

strain curves have shown that he usual assumption that the neck stabilizes its shape at the beginning of the lower yield stress region is not correct and that the via" that the neck forms at the yield peak needs to be modified. The neck is not clearly £9en until a point well beyond the yield peak, and it does not reach its steady-state shape until a point well along in the level region of the stress-strain curve. The sharpness of the steady-state neck seems to go through a maximum vs. both temperature and strain rate. From these photographic studies, an attempt was also made to derive the "true stress-strain curve" of the material (in the sense of the homogeneous properties of the bulk polymer) from successive measurements of external load and local sample diameter,at the point where the neck first formed. The fact that the "strain hardening" of PMMA takes place at progressively lower strains as the degree of pre- orientation increases can be seen from these curves.
There seems some doubt, however, that the above curves represent the true stress-strain properties of the bulk polymer. It was believed from early observations that PMMA did not draw by shear band formation, However, it now appears that the shear bands in PMMA, although difficult to see by eye, are actually present and can be seen by "schlieren" techniques, although it is not clear whether these bands are the same in nature as those in other polymers. If the formation of shear bands precedes necking in a similar fashion for all polymers, then perhaps the formation and propagation of a neck actually represents the initiation and spread of a "collapse wave" in a composite bulk structure consisting of a lattice or network of inter- secting deformation bands embedded in a matrix of undrawn polymer. This picture of the polymer structure during drawing also gives a method of lescribmg the "natural draw ratio" of a polymer; an estimate of the natural draw ratio of polystyrene by this mathod gives a value in good agreement with the experimental value of 150-200% extension.
Studies of the effects of absorbed moisture and of temperature history (quenching and annealing in various combinations) on the dead-load drawing of PMMA indicate that these treatments produce very important effects, in addition to affecting the value of the delay time. Drying PMMA enhances the visible formation of deformation bands, and rapid quenching produces specimens in which the tendency to localized necking during drawing is greatly reduced, so chat the sample shows almost "homogeneous" drawing.
91
Attempts were made to observe directly the volume changes of samples during yield in compression, by use of a mercury dilatometer. The results indicate that a volume expansion accompanies the onset of yield, and in general accompanies any "softening" of the polymer. These results, combined with the results of yield experiments in different stress fields, indicate that the hydrostatic component of the stress tensor (which would be related to volume changes) plays a very important role in the yield criterion of polymers, unlike the case of metals, but resembling the behavior of granular soils. It is not completely clear whether these volume changes should be interpreted in terms of the "free volume" of the polymer.
The possible applicability of an equation of state to the yielding process (in which deformation rate is one of • the parameters or state variables) has been checked by attempting to correlate the delay time for drawing of PMMA under dead load with the rate dependence of the stress- strain curve of the same polymer in tests at constant strain rate. The results indicate that such a correlation is possible, and thus that an equation of state can probably be applied, provided the delay time is defined in a way slightly different from that which we have conventionally used.
Some drawing studies have been carried out on poly- acrylonitrile (PAN), which is useful as a bridge between amorphous and crystalline polymers, since it has some of the characteristics of both types of polymer. Birefringence measurements have also been made on this polymer in some detail. The birefringence changes produced by drawing of this polymer are somewhat complex. One interesting phenom- enon which has been observed is that a striking birefringence change which is observed when a slightly oriented sample is cooled through the 140 °C transition region is completely eliminated when the polymer is drawn. Birefringence measurements on other polymers indicate that the sign of the birefringence produced by cold drawing is the same as that produced by hot-stretching, indicating that molecular chains are being extended in the process. However, the magnitude öf birefringence produced by a given strain is greater ±n cold-drawing than in hot-stretching, indicating that the efficiency of orientation in the cold-drawing process is greater.
In order to explain (or represent) the soften .ng of
92

the solid polymer which is involved in yield, we have developed three theoretical approaches to this problem. One involves a treatment of "defects" in. the solid structure, analogous to the theory of dislocations used to explain yield in metals and other crystalline materials. The second involves an analogy with the theory of fracture of a "fiber bundle", in which the Eyring flow theory is modi- fied to allow for redistribution of stress among flowing elements which release stress by jumpii.g and then re-form. The third approach is formulated in terms of a large-scale breakdown of secondary cohesive bonding between the polymer molecules, which can be visualized as a stress-induced glass transition. No conclusive decision can be made at present as to the relative merits of these different approaches; further work is needed to see which fits the facts most successfully. The "strain-hardening" effect is probably associated with molecular orientation, but since hardening is also observed when drawing is interrupted by a period of stress relaxation at constant strain, further study of this hardening effect is obviously needed.
93

VIII. RECOMMENDATIONS FOR FUTURE WORK
Based on the results of the present investigation, some recommendations can be made for future work which will he needed in order to obtain a still more complete under- standing of the yield and drawing process in solid polymers.
Continuing evidence of the importance of the formation of localized deformation bands in the normal drawing process, which involves the formation and propagation of a neck in the specimen, indicates that a more detailed study of the nature and formation of these deformation bands would be desirable. Their geometry nnd the mechanics of their initiation, propagation and termination are not satisfac- torily understood at the present time. A knowledge of why they form in preference to homogeneous deformation of the bu3k material is needed. It seems likely that such an understanding will be required to achieve a realistic and totally satisfactory understanding of the phemomenon of neck formation and propagation. Measurement of the magnitude of - the shear strain in the deformation bands of several poly- mers, and an attempt to correlate these values with the "natural drav ratio" for the same polymers would be very dosirable, for reasons pointed out in the previous section; this could provide at least a partial theory of the, draw ratio, which lik= neck formation is another very obvious and central characteristic of the drawing process.
Another related area requiring further investigation is the nature of pretreatment effects (quenching, annealing, moisture and other plasticizer effects) on the drawing process. Since quenching has been found to suppress neck formation, this may be a way to achieve and study the truly homogeneous bulk drawing prccess. The true stress-strain curve of the bulk material might be obtained in this way. This would be the type of data needed in an equation of state of the bulk material. These various effects may be related to the free volume in the bulk polymer, and further attempts should be made to correlate the results of these conditioning treatments with the specific volume or free volume of th« polymer. High-pressure studies might be useful in this connection, as a means of altering these volume relationships. Solvent swelling might also be a helpful technique. If the yield or drawing could be carried out by a process of homogeneous deformation, this could with some justification be treated as a process of solid-
94
State "flow". The ability to evaluate an activation energy from the temperature dependence of such a flow process would extend the possibilities of a continuum mechanics treatment of the yield process of the sort implicit in the use of an equation of state.
The time effects associated with drawing should be studied in more detail» The study thus far of the delay times associated with drawing under dead load has given very useful information particularly about the long-time region and the low-stress boundary where delay times become infinite and below which viscoelastic creep rather than yield is obtained. More information about the short-time and high-stress behavior is needed, which could be provided by high-speed testing. It is believed that at high stresses there is a boundary beyond which fracture is observed rather than yield (i.e., a brittle-ductile transition). We have not yet observed this boundary or attempted to map its position. This would have particular relevance to the problem of ballistic response, and would define the limits of applicability of an equation of state describing the yield process. This also has obvious relations to the general problem of what defines or determines the "toughness" of a polymer.
The structural hardening and softening associated with interrupted drawing should also be investigated further. Measurements of the strain changes during interruption per- iods in which the sample is completely unloaded and allowed to retract would be desirable in completely characterizing the softening and final re-hardening which takes place under these conditions. An attempt to observe the softening which occurs prior to yield (e.g. in a dead-load experiment during the delay period) should be attempted using other physical methods (such as dielectric, NMR, or light scattering). Birefringence measurements have not shown any significant changes during this period.
The role of transition temperatures in the drawing process needs to be clarified, This question is frequently raised, and requires an answer. This is a relevant question, since these transitions are responsible for the softening of polymers under purely thermal conditions (where the polymer is heated with no stress, or negligible stress, applied). One approach to this problem would be to study yield and drawing in the temperature ranges of such transitions, determining for example the yield stress as a function of
95

temperature in the transition region. It would be particu- larly helpful to study in this way polymers showing multiple transitions (both amorphous polymers showing primary and secondary glass transitions and crystalline polymers show- ing both first order and second order transitions). The position of such transitions could be changed in some cases by absorbed moisture or addition of other plasticizers, to provide an additional experimental variable.
Crystalline polymers should receive more study than we have been able to devote to them so far. Our observations in the present project have continued to confirm the sur- prising similarity in the yield and drawing behavior of crystalline and amorphous polymers, in view of their obviously great differences in solid state structure and morphology. Nevertheless, the yield and drawing behavior of crystalline polymers is of great practical interest and importance, and some study should be devoted specif: cally to them—preferably in parallel with corresponding measurements on amorphous polymers. The morphological changes accompany- ing the drawing of crystalline polymers provide an obvious area of investigation, but such changes may be only an incidental effect, and not a controlling feature of the yield mechanism. A significant problem tor study which could be carried out even without the specialized equipment (such as an electron microscope) needed for morphological studies, would be to attempt to characterize the relative roles of the crystalline and amorphous regions in the drawing process. The amorphous regions of nylon can be selectively cross- linked, for example, by an exposure to the vapor of . toluene di-isocyanate for suitable combinations of tempera- ture and time; this should affect the behavior of the amorphous regions. Irradiation of polyethylene produces inte.rlamellar cross-linking which should affect any process of interlamellar slip. The use of stereospecific structure as a parameter to control degree of crystallization or crystallizability should also be helpful in this connection, since crystalline and glassy amorphous (ata^tic) polymers of the same chemical type could be studied and compared. Polymers such as polyethylene terephthalate, which can be quenched into an amorphous glassy state, but which will crystallize on drawing, should also provide useful informa- tion on the role of crystalline structure in the overall drawing process.
No brief listing such as this can attempt to cover all of the possible areas of research which would cast useful light on the nature of the yield process, and lead to its
96

better understanding» Many approaches are possible, and the suggestions offered here are influenced considerably by the results already obtained. One further area may be men- tioned, however, which would seem to have great interest for detailed study and which has important relations to the theory of structural softening which has been described in the preceding section oi' this report as the "bonding breakdown" theory. This is the study of the mechanical breakdown of gels—an example of the type of behavior generally described as "thixotropy".
This should provide a highly relevant analogy to the structural softening taking place in the solid state. Gels of this type can be made with polymer and plasticizer (or solvent) and the/ concentration could be varied in suitable systems from dilute gel to swollen polymer to solid polymer. Such gels are often thermally reversible (i.e., they will break down to solutions on heating, and re-form the gel on cooling). In some cases, a "glass transition" has been observed in these gels—a temperature where the thermal expansion coefficient of the gel changes, just as in a glassy polymer. The kinetics of bonding breakdown in dilute gels could probably be deduced quantitative1" using the theory of rubber elasticity and treating the be iing points as cross-links in a rubbery network. The combined effects of temperature and stress could thus be studied in a situation where the mechanical breakdown is clearly due to a breakdown of intermolecular bonding; and the pro- gressive change in behavior could be followed over the composition range leading all the way to 100% polymer.
97

IX. ACKNOWLEDGMENTS
We would like to express our appreciation to the U. S, Army Natick Laboratories, Natick, Massachusetts for their support of this fundamental investigation of cold-drawing. In particular, we would like to mention the helpful support and encouragement received from Dr. G, A. Thomas, Mr. A. L. Alesi and Mr. R. C. Laible of the Clothing and Organic Materials Division. The contribution of the "fiber bundle" analogy to cold-drawing by Professor M. Goldstein, now at Yeshiva University, during his tenure as Visiting Professor at M.I.T. is deeply appreciated. We would also like to record here the valued participation in this project of Professor A. S. Argon, Mr. J. A. Godrick, and Mr. J. Gibbins of the Department of Mechanical Engineering, M.I.T., who carried out the measurements of torsional stress-strain behavior of a cylindrical sample under hydrostatic pressure.
98

REFERENCES
1. R. D. Andrews, Jr. and W. Whitney, "Study of the Phenomenon of Cold-Drawing (Plastic Yield) in High Polymers." U. S. Army Natick Laboratories, Natick, Massachusetts (August 1964), C & OM-3, also issued by the Textile Division, Dept. of Mechanical Engineering, M.I.T., as Report TD-123-64 (May 1964).
2. This subject has been discussed in greater detail in W. Whitney, Sc.D. Thesis, Dept. of Civil Engineering, M.I.T., (November 1964).
3. W. Whitney and R. D. Andrews, IUPAC Macromolecular Symposium, Prague (September 1965). Preprint 373 (to be published, J. Polymer Sei.),
4. See for instance F. A. McClintock and A. S. Argon, Mechanical Behavior of Materials, Addison Wesley (1966)"
5. See for instance A. G. H. Dietz and F. R. Eirich (editors) High Speed Testing, Interscience, New York (yearly). ~~'" '
6. See for instance A. V. Tobolsky, Properties and Structure of Polymers, Wiley, New York (1960). Chapt. IV.
7. P. I. Vincent, Polymer 1, 7 (1960).
8. M. L. Williams and M, F. Bender, J. Appl. Phys. 34:, 3329 (1963).
9. M. L, Williams and M. F. Bender, Textile Res. J. _33_/ 1023 (196 3).
10. G. E. Dieter, Mechanical Metallurgy, McGraw-Hill, New York (1961) p. 350 ff.
11. J. W. Kauffman and W. George, J. Colloid Sei. 6_, 450 (1951).
12. D. W. Morrison, B.S. Thesis, Dept. of Metallurgy, M.I.T. (May 1964) .
13. D. H. Ender and R. D. Andrews, J. Appl, Phys. 3£, 3057 (1965).
99

14. W. Whitney, J. Appl. Phys. 34, 3633 (1963).
15. J. R. McLoughlin and A. V. Tobolsky, J. Polymer Sei. 7, 658 (1951).
16. D. S. Wood and D. S. Clark, Trans. Amer. Soc. Metals 43, 571 (1951).
17. T. L. Russell, D. S. Wood and D. S. Clark, Acta Met. 9, 1054 (1961).
18. R. G. Cheatham and A. G. H. Dietz, Trans. ASME 74, 31 (1952).
19. J. K. Knowles and A. G. H. Dietz, Trans. ASME 77, 177 (1955).
20. For a more detailed presentation of the material in this section see S. W. Allison, M.S. Thesis, Pept. of Civil Engineering, M.I.T. (1964).
21. J. Miklowitz,, JL. Colloid Sei. 2, 193 (1947).
22. J. A. Godrick, M.S. Thesis, Dept. of Mechanical Engineering, M.I.T. (May, 1964).
23. S. Cooper, B.S. Thesis, Dept. of Chemical Engineering, M.I.T. (May 1964) .
24. R. D. Andrews and J. Rudd, J. Appl. Phys. 28, 1091 (1957). ~~
25. W. L. Grube and S. R. Rouze, ASTM Proceedings 52, 573 (1952).
26. 0. K. Spurr and W. D. Neigisch, J. Appl. Polymer Sei. 6, 585 (1958).
27. R. J. Curran and R. D. Andrews, M.I.T. Dept. of Civil Engineering Report No. R63-55 (December 1963),
28. R. D. Andrews and R. M. Kimmel, J. Appl. Phys. 35, 3194 (1964). " —
29. Furtbrr discussion of the material in this section can be found in R. M. Kimmel, M.S. Thesis, Dept. of Machanical Engineering, M.I.T. (May 1965),
100

30. R. D. Andrews and R. M. Kimmel, J. Polymer Sei. 33, 167 (1965).
31. R. M. Kimmel and R. D. Andrews, J. Appl. Phys. 36, 3063 (1965).
32. S, Rosenbaum, J. Polymer Sei. A9, 2085 (1965).
33. N. I. Shishkin and M. F. Milagin, Sov. Phys;-Solid State 4, 1967 (1963) .
34. J. J. Oilman, J. Appl. Phys. 36, 2772 (1965).
35. R. E. Robertson, J, Appl. Polymer Sei T_, 443 (1963).
36. M. Goldstein, J. Polymer Sei. B4, 87 (1966).
37. R. D. Andrews and T. J. Hammack, J. Polymer Sei. B3, 655 (1965).
38. J. J. Lohr, Trans. Soc. Rheology £, 65 (1965).
39. J. A. Roetling, Polymer 6, 311 (1965).
40. D. H. Kaelble, paper presented before Fourth Inter- National Congress on Rheology, Providence, Rhode Island, (1964).
41. T. L. Smith, J. Polymer Sei. 32, 99 (1958).
101

i o
9 ft
W
3
CO
o
a
a B «
CO
■o 1-1 a
h4
rH «UfO Qt 09 I c » o O U M •H 4* 4i CO X U
■* a
a a
Strtea-Strain Proptrtl«! va. Twtritigt A PS - Polyatyrana • PMNA - PolTMthyl ■athaerylat« o pc - Polyoarbenata
Taraparatura (°C) PIO. 1
102

Strain Properties vs. Temperat - tre
A PS - Polystyrene • PMMA - Polymethyl methacrylate O PC - Polycarbonate
£y Total strain at yield point i 1 1 1 1 1 j r~
t» Plastic strain at yield point
l*x Proportional limit strain S -
Strain
Strain
-ao iO HO GO 90 I do lao HO
Temperature (°C)
103 Pia. 2

1.0 —
5
O.I -
O.Oi
ifaohanleal Damping vt.
T«mp«raturt Maaaurtd by Ball
Rtbound Tait
20 HO t>0 -k \00
Temperatur«, (° C)
104 FIO. 3

YIELD STREoS OF POLYSTYRENE ru. INCLINATION
BETWE2N STRESS AND ORIENTATION DIREOTIORS ,0,
\sooo
21 C, 0.02"/*in
10000
Yield Stress
(psi)
5*0001
57 C, 0.02"/iuin
Pr«orientation Birefringence
eo a? * lo-1* • 10 »JO"4
ao 4. Ho "go- to
Angle between Preoriontatlon Direction and Compression
Axle (deg.)
105 Pia. 4
too

Soformation Parametero TO. I&olinatloa
Betweon Streue «rid Orientation Dlrtotlono
toutarmmm
Total Strain » Yitld
(%)
Plaatie Strain
• Tie
Noduiua a.«
(poi x 10"5)
Angle (dog.)
PIö. 5 IÖ6

♦<c
<i v
MOHR YIELD CRITERION
® Fracture Ewalope (Unorlentad P3)
TRESCA YIELD CRITERION
--15000 (pal)
YIELDING OF POLYSTYRENE
H+ffT
FIG. 6
107

PRESSURE CHiUOER
FOR
TORSION
EXPERIMENTS
FIG. 7
108

SEQUENTIAL 3TRE33 RELAXATION OF POLYSTYRENE
cue
i\ <^ ^ -J-. \
GOO ~* — -
M — HOO
•a at
3 zoo
n i i i i < 1 . ■ i t 30 60 90 120 150 180
Time (r. invite a)
210 240
POLYSTYRENE
Compression
to ja
$00
(,00 -
Hoo -
100
Modulus 3.4 x 10⁵ psi
l«*,0CO
11,000
- 10,000
Stress t.ooo (psi)
G>,000
H.000
7,000
0
Strain (%
FIG. 8
109

in
a o
a
n 3 o
o
3 M
5
G9 o o* c5 ö
c e
%
FIG. 9
110

•H 00 a
o <n 4) U •P CO
dt
6
STRMS-TIME BEHAVIOR IN VARIOUS TYPES OF TEST
OF POLYSTYRENE IN COMPRESSION AT ROOM TEMPERATURE T T T
I6O0O -
laooo
8000
proportionaly limit
upper yield
HOQO
e\A ^rom otreaa-atraln teats
O from atraaa-ralaxatlon teata
D from oreep teat
0.1 1.0 SO [00 \ooo
Relaxation Tin», (min)
PIO. 10
111

STRESS RELAXATION OF P0L2ÄTOTWE FILM
AT ROOM TEMPERATURE
10-
0.8
Stress
Ratio
Tit^, 0.*i
0.*
s >aoo fB)
J»»I
0.1 1.0 IO 100 1000
Tina (rain)
FIO. 11
112

o •ri
a © ja o tn
s
C o
a
S 3
avcrc
113
PIO. 12

REAPPEARANCE OF YIELD DROP AFTER VARIOUS TIMES OF
STRESS-RELAXATION IN INTERRUPTED DRAWING OP PORMVAR
O tension
(3 compression
0.16-
g-au ä O
o >
H «) «
0.08-
ao^j-
1000
Stress Relaxation Time
(min)
PIO. 13 114

REAPPEARANCE OF YIELD DROP AFTER VARIOUS TIMES OF
STRESS RELAXATION IN INTERRUPTED DRAWING OF NYLON
o.\ \o (00 1000
Stress Relaxation Time
(min)
115 FIO. 14

s o o M H
s § >
0 § H
B 9 ««
m B n o «
s 8 M
a 9 Ö I«
o it» K
H «A e !H
M B fe w s O «t
ro K w <n Ck o 1 ;#
3 g EH to
fa O
! EH
§ •P
3 a 09 CD
a c/5
> «H ■P 10 i-l «
® o A a
116 PIO. 15

REAPPEARANCE OF YIELD DROP AFIER VARIOUS TIMES OF
STRESS RELAXATION IN INTERRUPTED DRAWING OF SARAN
Stress Relaxation Time
(min)
PIO. 16 117

§ 4* ft
V
!
§ «H
I W
H W
1 PIO. 17
116

Load (lbs)
ZMTXRRUPTSD DRAWING WITH IHLOADINQ PERIOD
FGRKVAR
L>
.013
.010
.ooth "Bauschinger elongation" Q§£
(inches) .OOM
.00*1-
>■■ \ lflOMdlate
reload
reload after
20 rain
at 0 Load
•Of
"Elongation" (inches)
- 1 f
1 1 /
• 1 1
1 1
1 1
1 / 1 /
1 /
^ri. i ._i •
Load (lbs)
PIO. 13
J.19

H
O
to
o
«1
3 0)
9
5 B
"2 a)
4*
O ri - Ö o
(^6) ■•dote SuipvoTSH
Pia. 19 120

i 11Ü T i i £*i A < < Ifc V'C 5 is fl V.I »t A—li'C',JL'l'Ai\i'.u''h
flAVMHC-*
|\
«TT-H
l£
_Ll_1_
' , aoistixiilp
>vjoi.a
I-
I c o -P O
is a>
PIG. 20
121

EFFECT OF COMBINED RELAXATION AND RECOVERY PERIODS
PORMVAR
Slope
Time Time Time Time
FORMVAR
Slope
0.0%
Relative
Drop
Load at Start of Strese Relaxation, L0
(lbs)
Fia. 21
122

EFFECT OF COMBINED RELAXATION AND RECC7ERY PERI0D3
Load
SLOP*
' Stress Relaxation
Free Retraction
Elongation Time Elongation
FORMVAR
Free Retraction Time
(min)
Slope
FIO. 22 123

Kpparatua for Orienting Polymer Sheen
Upper Clamp
Heated Aluminum plait-
Polymer Sheet
Heated Aluminum Plate
Insulation
Table Top
Lower Clamp
mounted on
Sliding Plate
Track for Lower Clamp
i is !'•
i )
Lroy A
Pia. 23
124

temperature controller
air circulation
window (rear and front)
specimen and gripe
heac exchanger
heater '••
blower, v
•elector switch for 6 thermo- couple« distri- buted in box
recording drum
synchronous motor
weights
frame
Apparatus for Creep Measurement under Controlled Temperature
FIG. 24
125

TYPES OF ELONGATION VS. TIME CURVES OBSERVED
10 20 30 TIME.tnin
40 50
500 1000 TIME.rnin FIG. 25
126

CHARACTERISTIC PARAMETERS OF
DRAWING CURVES
ELONGATION
DELAY TIME
DELAY STRAIN - &C//1.
ELASTIC STRAIN - blt/l. FIG. 26
127

DELAY TIMES AND REGIONS OF DEFORMATION TYPE
PREORIENTED POLYSTYRENE An«IOIO'3
6800
6400 1.5 INHOMOGENEOUS DEFORMATION (NECKING)
6000
5600 8.6 1.2
5200
4800 31 2.8 -
.95
4400
4000 "^40^ 33 4.4
I 3600
ft 3200 CRI050 CR^°< 16 3.0 .6
fc 2800 3J0
2400 CR,08° >? 13 2.9
2000 > k68/48
1600 N II
1200 N7 800 CRI000
400 HOMOGENEOUS DEFORMATION V 0 \
50 85 60 65 70 75 80 es TEMPERATURE, 9C
L Dtloy tJmti v% iitttd in minutts.
2.CR* indicottt homogtntou* dtformation only woBObstrvtdinontxptrimtnt
lotting X minuttt. FIG. 27
128

DELAY ELONGATIONS (X) AND REGIONS OF DEFORMATION TYPF
PREORIENTED POLYSTYRENE (An ■ 10* I0"8)
6800
—.- 6400 5.4 INHOMOGENEQUS 1
( NECKING
REFORMATION
6000 >
5600 6.1 4.8 — -
5200
4800 7.6 7.6. 5.0
4 40 0
5 4000 TVo*» 8.7 5.4 Q.
- 3600
5.0 2 3200 6$ en lOSO 20.6 >
^^^—, 5.0
fc 2800
2400 7.6
0,1050 *22.8
4.8
2000 — - *
1600 8.7
1 200
V 800 • f 25.0 . e.1740^
40 0 HOMOGENEOUS DEFORMATION x 0 N
50 55 60 65 TO 75 60 es
TEMPERATüRE, *C
CR > elongation givtn wot measured after x minutes of homogeneous drawing. FIG. 28
129

INTERNAL CRACKS AND SHEAR BANDS IN POLYSTYRENE
FIG. 29

SHEAR BAND FIELD IN NECK OF POLYSTYRENE
Pia. 30
1 ?1
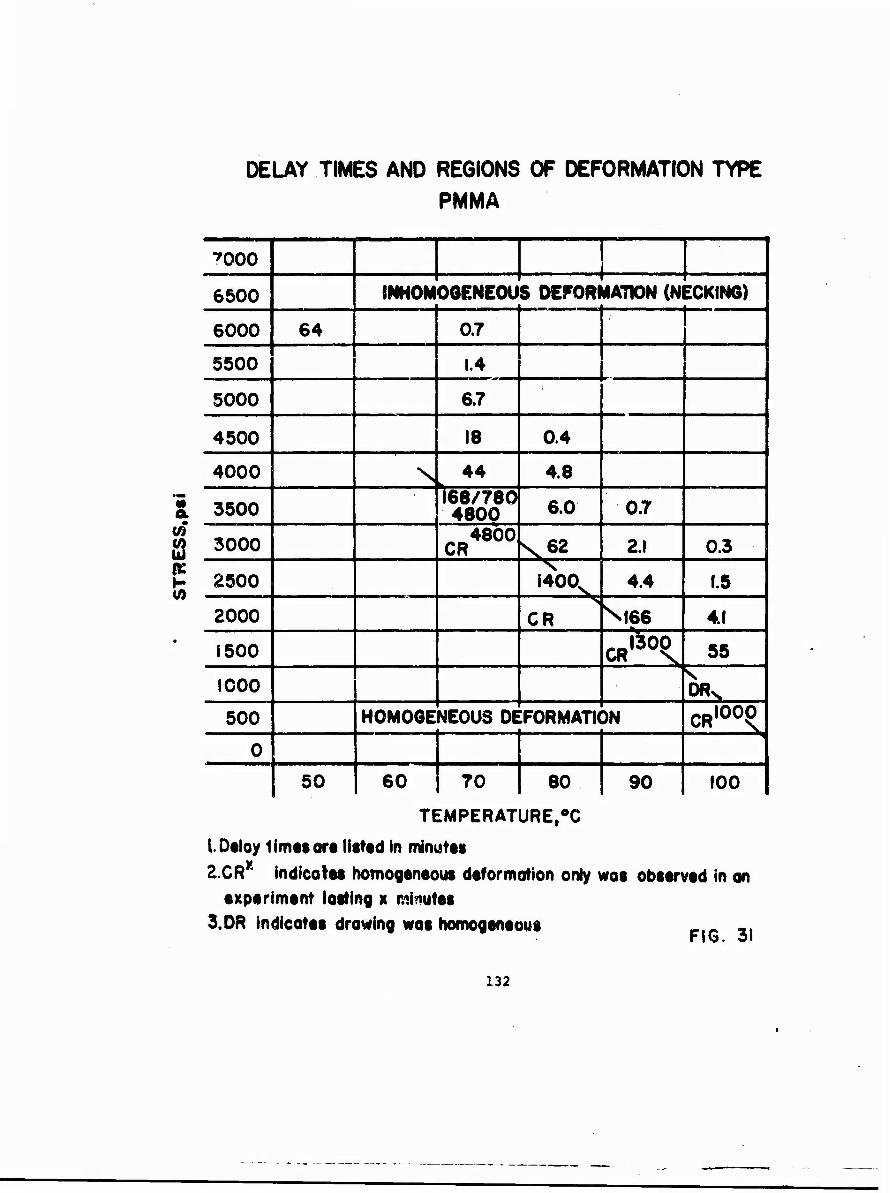
DELAY TIMES AND REGIONS OF DEFORMATION TYPE
PMMA
7000
6500 »«HOMOGENEOUS DEFORMATON (NECKING)
6000 64 0.7
5500 1.4
5000 6.7
4500 18 0.4
4000 N 44 4.8
£ 3500 [168/780 4800 6.0 0.7
<2 3000 CR48Ö° V62 2.1 0.3
H 2500 in ,40\
4.4 1.5
2000 CR S|66 4.1
1500 CHA(\ 55
1000 s DR^
500 HOMOGE «JEOUS DE :FORMATK )N CR,00e
0
50 60 70 80 90 100
TEMPERATURE,°C
LDeloy limes art listed in minutes 2.CR* indicates homogeneous deformation only was observed in on
experiment lasting x minutes 3.DR indicates drawing was homogeneous „,„ ,,
FIG. 31
132

M a CO CO UJ x
DELAY EL0N6ATI0NS(%) AND REGIONS OF DEFORMATION TYPE
PMMA
7000
6500 INHOM« DGENEOUi 3 DEFORMATION (NECKING)
6000 11.9 9.8
5500 as 5000 10.2
4500 10.4
4000 N 12.9 8.3
3500 11.5/18.8 20.8 10.0 7.9
3000 3.0 , CR4800 \J04 7.9 8.4
2500 19.8 v 9.2 7.3
2000 ^
^20.8 10.4
1500 6.3 CRBOOV 10.9
1000 ^208 DRs
500 HOMOGE ̂ lEOUS DE FORMATIC )N CRIöOONW
0
50 60 70 80 90 100
TEMPERATURE,°C
I.CRx indicates homogeneous deformation only wot observed in an experiment lasfing x minutes
2.DR Indicates drawing was homogeneous FIG. 32
133

UJ 2
_i UJ O
Z o z o
0. at: o to CD «;
cc
U. O
O UJ u. Ü. UJ
o O «ttnujui^wii AVH3Q FIG. 33
134

ELONGATION OF PMMA UNDER CONSTANT TENSILE LOAD
TEMPERATURE: K>OaC
10 20 TIME, minutes
30
QUENCHED FROM 130 TO 0°C
1000
TIME,minutos 30
FIG 34
135
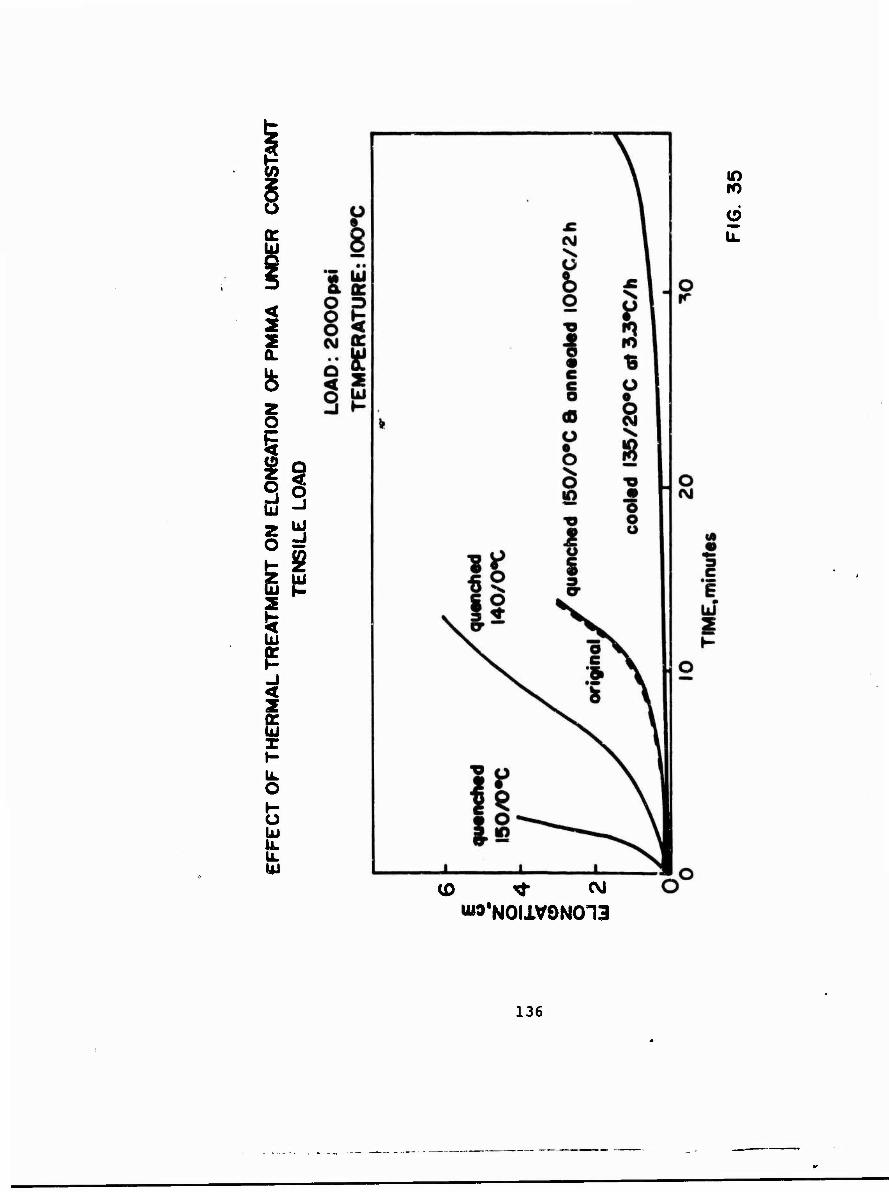
2 O
S3 2 y o =
I is s i Z
U. o »- o (u u. LL Ui
in ro
O
(0 *■ CM
wo8NOIlVON013
136

DEPENDENCE OF DELAY TIME ON STRESS LEVEL AT DIFFERENT
TEMPERATURES - PREORIENTED POLYSTYRENE ( An » 5 x IO~3 )
c i
»if 2
5 hi O
l_i_i
2000
STRESS, pst
137

DEPENDENCE OF DELAY TIME ON STRESS LEVEL
Al DIFFERENT TEMPERATURES PMMA
2000 4000 STRESS.pt!
6000 FIG. 37
138

STRESS-STRAIN CURVES OF PMMA FOR VARIOUS EXTENSION RATES
T T
40CO
3000
<n Ui
2000
1000
T
TEMPERATURE IOO»C GAUGE LENGTH 1.8 in
*, Vln/min L AIP
1.0
.06 STRAIN
.08
FIG 38
139
4.

< _i UJ o o UJ
Ü <
SS2 o z < o UJ o: D (A < UJ 2
t^nujuj'gwii XV13Q FI6. 39
140

aTYPICAL NECK PHOTOGRAPH
_0_ 1.00
0.75
PMMA (PLEXIGLAS H UVA)
—-O—o—o
o.so T» 93#C 00* 0.20 (In)
0.26 L0« 1.0 (In) • • 0.2 (ln/ln/.nin)
o on 1 . 1 - -L, - . -1 1 : L . 1 .2 .4 .6 .6 1.0 12 14
OJSTANCE ALONG SAMPLE AXIS (in.)
b. CORRESPONDING PROFILE PLOT
FIG. 40
141

Id ü Z LÜ 3 O Ul * c
• Ul
w E
~«*
< 2
U. • CM 2 2 ^d n oc s; a. *1
K<J X O Ul
s
csi
Q CSI
to
52 <
Ul -J 0.
< CO
o z o .J <
Ul o z <
CO
00 CD <N >a/a
o FI0.4I
142

-iO
Ld
< AC
o z Ul o Z JJ)
< o
Q. O
Ul
111
< > Hi
Q. < X CD
z
< ÜC
O 55
X LU
a o in iß H 0> K
H •
0
X X L CM O © ±> * --odd
3d01S MD3N
CVJ d
o
FIG.42
143

U) Q. <
'« < LU K
- 2 ÜJ
2 Li. s I O UJ
2x
< >
00
O O
o 0>
c -I
E
m o
o e
G: O 3 CO (-
<
tu c «;
UJ I-
LU
< or
o CO z UJ h- X UJ
o
<0 CM O CO to
3d01S X03N d
cvi Ö
O <0
FIG. 43
144

ÜJ
fei
c «3
z o
< 5 w P 1 H O H £ < -j z
2 en ui < S > * o UJ o
IO u z o
0C U. UJ
SE 5
3d01S X03N FIG. 44
145

< s
CO ÜJ yj
lü £ < X O - H 5 ^ 5 55 °<z 56S g CO*
<o
q csi
00
(0
E v « ■ ■
S*- ooo tf) N M N N
^•"5 ^ *3 ^5 H i a A S
.CVIZ <
.9(0 LÜ
-cpH
-10
IE>MH
CSJ
0» 00 (0 in ro CM ISd'gplXSSBHlS 3flMi
O
Flo. 45
146

> i/i (/) UJ Q.
UJ
<
52 < u| K »- c
</> Wo
UJ H.£ => Z*3
2 < (/) Z o Ü
o e o e
o c\i
00
< CM ac
SUJ
• CO
<0
(SI
00 ISd'e
to m «• •*> „01 X S33U1S 30H1
FI6. 46
147

O 0> CD K <0 ~oixisd 'ssadis anai
FIG. 47
148

(%) 39NVH0 awrnoA & 30NVH0 iwnioA
Ü
00
o
>
o Ü.
C/5 tU
z < X o
csan) oven
149
LÜ
-J O >
-/

OQ 17
7)
^3
1
~1
\
wnwE C:HI*Wü£ üP)
rovD (r BW'^
150 eti

o ft
in
M fa
a o
1 I. II '■ i
1' ....
1 !''' 'Till ! i ' L
1 ' ! 1 f
"' J I 11 1
i i '1 ■ 1 5
f
',f i''V ( ill . ■ • '■ l'
L. . ' •«
ll ,[i 1- ,1:1
o in
<3 M fa
1.5 1
?/

tu w W
(0
O
fr. o w
to
Ö
§ § o: o
o o
wwm (»r
?
■\YKf}fifl nw.ü>y]
mV;\W**h mu,h Uw\
in
B
1 .V \ ■ ,'. I I 1
Ft Öl
O A«
ö
2 w
in
152

.5xlCp
5.0
4.5
4.0
£ 3.5
(0
u 3.0 a: 0)
o 2.5
*3°C ^453°C
S0°C
r—i 1 r
ELONGATION RATE « 1%/wlft
IIO°C
I35°C
J___J I J L 0 10 20 30 40 50 60
ELONGATION (ptr cent)
POLYACRYLONITRILE ENGINEERING STRESS VS. ELONGATION
FIG. 54
153
,'/

*■» -10
I «««•
UJ -16 o
10 20 30 40 50 ELONGATION (ptrctnt)
POLYACRYLONITRILE BIREFRINGENCE VS. ELONGATION
FIG. 55
154

IM to to
o
o <0
*» o ? t
u K 3 o »-
M < ^m c UI a
o x o w
i-
o »
s
-?
Ui o z _J ÜJ = UJ - (DC O U »- z r 2 Ulk
two ° ä _l < Q «J >• ^ ui o
a: §- 3 Q. »- o < i a: z °- 5
£
O ♦'
01 10 * p o o
1 1 1
« M
1N3I01Ü300 IVOIXdO-NIVMXS
155

(!•«) sninaow u,ocn FIG. 57
156

'A U
i V) > (A
13 n «j
u p
<
1 a o as <
x
9 a wi *• m CM
FI6. 58
157

(•) 310NV N0U0NI1X3 03X93)1)103 FIG. 59
158

*0I* 30N3QNUU3UI8 O
FIG. 60
159

BIREfRIHGENCE vs. STRAIN OF P8 MEASURES IN MEGS OF
PARTIALLY QOLD-DRAWN SPECIMEN AT ROOM TEMPERATURE
/¥
II
10
I Drawing oondltlonst
C = 1600 ptl
T = 75°0
* S o
C
at center of specimen..
^an pre orientation
O.I strain
at edge of specimen
0.2
na. 6i
160

BIREFRINGENCE vs. dTRAIti OF PMMA, DURING
INDUCTION PERIOD (HOMOGENEOUS DEFORMS A JN)
Drawing conditionss
<r = 3500 psi " T = 80°C
z«ro preorlentation I I
.oa 04
strain
of fO ISL
FIG. 62
161

ilojclassififid. Security Classification
DOCUMENT CONTROL DATA • R&D (Security claaalllcatlon of tltlm, body of abstract and indaalni annotation mult ba antarad whan tha ovarali report la clataltlad)
1 ORIGINATING ACTIVITY (Corporate author)
Massachusetts Institute of Technology Fibers and Polymers Division, Dept. Me^h. Engineering Cambridge, Massachusetts 0213a
2a. REPORT SECURITY C L AtSI FIC A TION
Unclassified 2b GROUP
J REPORT TITLB
RESEARCH STUDY ON COLD DRAWING PHENOMENA IN HIGH POLYMERS
4 OESCRIPTIVF NOTES (Typa ol taport and incluaira dataa)
Final Report January 196H - January 1956 5 AUTHORfS) (Laat nmma. Ural nama, initial)
Andrews, R. D., Jr., Allison, S. W., Ender, D. H., K.immel, R. M,, and Whitney, W.
6 REPORT DATE
August 1966 • a. CONTRACT OR «RANT NO.
DA19-129-AMC-238(N) b. PROJECT NO.
1K024H01U13
7a. TOTAL NO. OF PACE*
166 7b. NO. OF REFS
9a. ORIGINATOR'S REPORT NUMBERC5;
9b. OTHER REPORT HOfS) 'Any othat numbara that may ba maaimad dtla raport)
67-10-CM C60M-25 10. A V A IL ABILITY/LIMITATION NOTICES
Distribution of this docuir nt is unlimited. Release to CF^TI is authorized.
It. SUPPLEMENTARY NOTES 12 SPONSORING MILITARY ACTIVITY
U. S. Army Natick Laboratories Natick, Massachusetts 01760
IS ABSTRACT
A fundamental study of the phenom-».<;n of cold-drawing (plastic yield) in polymers has been carried out, through which a better understanding of several of the features of this process has been achieved. The effects of temperature, thermal history, stress-field, chemical structure and pre-orientation on the stress-strain behavior of both glassy and crystalline polymers have been explored. The behavior of sc <sral polymers, particularly polystyrene and polymethyl methacry- late, in stress relaxation, relation-recovery cycling and creep, especially with respect to delayed drawing, was investigated in detail. The geometry of neck formation has been quantitatively investigated by photographic techniques, and volume changes during compression have been measured using a mercury dilatometer. Microscopic modes of yielding, particularly the formation of deformation bands, are described.. Birefringence changes during deformation of polyacrylonitrile under various conditions and during hot and cold extension of polystyrene and poly- methyl meChacrylate are presented and related to the molecular processes believed to be occurring. The development of a molecular theory of drawing is attempted through three different paths of approach: .(1) a defect model analogous to dis- locations, (2) a mathematical model of the "fiber bundle',' type, and (3) a des- cription in terms of the breakdown of secondary intermolecular cohesive bonding. General conclusions and recommendations for future studies in these areas are pre- sented.
DD FORM 1 JAN «4 1473 Unclassified
Security Classification

^classified Security Classification
TT KEY WORDS
Plastic deformation Yield Plastics Polymers High Fracture (Mechanics) Strength Cold working Impact strength Creep (Materials) Drawing
ROLE I»T
6 5 9 9 0 7 7 7 7 7
LINK B
9
0
LINK C
HOL E
INSTRUCTIONS
1. ORIGINATING ACTIVITY: Enter the name and address of the contractor, aubcontractor, grantee, Department of De- fense activity or other organization (corporate author) issuing the report.
2«. REPORT SECURITY CLASSIFICATION: Enter the over- all security classification :' the report. Indicate whether "Restricted Data" is included. Marking is to be in accord- ance with appropriate security regulations.
2fc. GROUP: Automatic downgrading is specified in DoD Di- rective 5200.10 and Armed Forces Industrial Manual. Enter the group number. Also, when applicable, show that optional markings have been used for Group 3 and Group 4 as author- ized.
3. REPORT TITLE: Enter the complete report title in ail capital letters'. Titles in all cases should be unclassified. If a meaningful title cannot be selected without classifica- tion, show title classification in t-'il capitals in parenthesis immediately following the titie.
4. DESCRIPTIVE NOTES: If appropriate, enter the type cf report, e.g., interim, progress, summary, annual, or final. GiVe the inclusive dates when a specific reporting period it co"ered.
5. AUTHOR(S): Enter the name(s) of authoKs) as shown on or in the report. Enter last name, first name, middle initial. If military, show rank and branch of service. The name of the principal author is an absolute minimum requirement.
6. REPORT DATE: Enter the date jf the report as day, month, year, or month, year. If more than one date appears on the report, use date of publication.
7«. TOTAL NUMBER OF PAGES: The total page count should follow normal pagination procedures, i.e., enter the number of pages containing information.
7ft. NUMBER OF REFERENCES: Enter th« total number of references cited in the report.
8* CONTRACT OR GRr VT NUMttER: If appropriate, enter the applicable number of t le contract or grant under which the report was written.
8ft, 8c, at id. PROJECT NUMBER: Enter the rnpropriate military department identification, such as project number, ttubproject number, system numbers, task number, etc
9a. ORIGINATOR'S REPORT NUMBER(S): Enter the offi- cial report number by which the document will be identified and controlled by the originating activity. This .lumber must be unique to this report.
9b. OTHER REPORT NUMdER(S): If the report has been assigned any other report numbers (either by the originator or Ly the sponsor), also enter this number(s).
10. AVAILABILITY/LIMITATION NOTICES: Enter any lim- itations on further dissemination of the report, other than those imposed by security classification, using standard statements such as:
(1) "Qualified requesters may obtain copies of this report from DDC"
'2) "Foreign announcement and dissemination of this report by DDC is not authorized."
(3) "U. S. Government agencies may obtain copies of this report dirsctly from DDC. Other qualified DDC users shall request through
(4) "U. S. military agencies may obtain copies of this report directly from DDC Other qualified users shall request through
(5) "All distribution of this report is controlled. Qual- ified DDC users shall request through
If the report has been furnished to the Office of Technical Services, Department of Commerce, for sale to the public, indi- cate this fact and enter the price, if known,
IL SUPPLEMENTARY NOTES: Use for additional explana- tory notes.
12. SPONSORING MILITARY ACTIVITY: Enter the name of the departmental project office or laboratory sponsoring (pay- ing lor) the research and development. Include address. 13. ABSTRACT: Enter an abstract giving a brief and fsctual summary of the document indicative of the report, even though it may also appear elsewhere in the body of the technical re- port. If additional space is required, a continuation sheet shall be attached.
It is highly desirable thet the abstract of classified re- ports be unclassified. Each paragraph of the abstract shall end with an indication of the military security classification of the information in the paragraph, represented as (TS), (S), (C), or (U).
There is no limitation on the length of the abstract. How- ever, the suggested length is fror» '.50 to 225 words.
14. KEY WORDS: Key words are technically meaningful terms or short phrases that characterize a report and may be used as index entries for cataloging the report. Key words must be selected so that no security classification is required. Iden- fiers, such as equipment model designation, trade name, -niH- tary project code name, geographic location, may be used as key words but will be followed bv an indication ot technical context. The aasignment of links, rules, and weights is optional.
Unclassified
Secu ity Classification