research spatial patterns of wood traits in china paper
TRANSCRIPT
RESEARCHPAPER
Spatial patterns of wood traits in Chinaare controlled by phylogeny andthe environmentgeb_582 1..10
Shi-Bao Zhang, J. W. Ferry Slik, Jiao-Lin Zhang and Kun-Fang Cao*
Key Laboratory of Tropical Forest Ecology,
Xishuangbanna Tropical Botanical Garden,
Chinese Academy of Sciences, Kunming,
Yunnan 650223, China
ABSTRACT
Aim Wood properties are related to tree physiology and mechanical stability andare influenced by both phylogeny and the environment. However, it remainsunclear to what extent geographical gradients in wood traits are shaped by eitherphylogeny or the environment. Here we aimed to disentangle the influences ofphylogeny and the environment on spatial trends in wood traits.
Location China.
Methods We compiled a data set of 11 wood properties for 618 tree species from98 sampling sites in China to assess their phylogenetic and spatial patterns, and todetermine how many of the spatial patterns in wood properties are attributable tothe environment after correction for phylogenetic influences.
Result All wood traits examined exhibited significant phylogenetic signal. Thewidest divergence in wood traits was observed between gymnosperms andangiosperms, Rosids and Asterids, Magnoiliids and Eudicots, and in Lamiales. Formost wood traits, the majority of trait variation was observed at genus and specieslevels. The mechanical properties of wood showed correlated evolution with wooddensity. Most of the mechanical properties of wood exhibited significant latitudinalvariation but limited or no altitudinal variation, and were positively correlated withmean annual precipitation based on both Pearson’s correlation analysis and thephylogenetic comparative method. Correlations at family level between meanannual temperature and wood density, compression strength, cross-section hard-ness, modulus of elasticity and volumetric shrinkage coefficient became significantafter correction for phylogenetic influences.
Main conclusions Phylogeny interacted with the environment in shaping thespatial patterns of wood traits of trees across China because most wood propertiesshowed strong phylogenetic conservatism and thus affected environmental toler-ances and distributions of tree species. Mean annual precipitation was a key envi-ronmental factor explaining the spatial patterns of wood traits. Our study providesvaluable insights into the geographical patterns in productivity, distribution andecological strategy of trees linking to wood traits.
KeywordsChina, climate, geographical variation, phylogeny, phylogenetically comparativemethod, trees, trait evolution, wood properties.
*Correspondence: Kun-Fang Cao, KeyLaboratory of Tropical Forest Ecology,Xishuangbanna Tropical Botanical Garden,Chinese Academy of Sciences, Kunming,Yunnan 650223, China.E-mail: [email protected],
INTRODUCTION
Knowledge of the spatial patterns of wood traits is essential for
understanding possible changes in ecosystem functions under
different global change scenarios, as wood traits are highly rel-
evant to ecosystem biogeochemistry, tree growth and mortality
and plant life-history strategy (van Gelder et al., 2006; Chao
et al., 2008; Poorter et al., 2010). For example, previous studies
have shown that wood density (WD) is an important variable
for reliably estimating the above-ground biomass of tropical
Global Ecology and Biogeography, (Global Ecol. Biogeogr.) (2010)
© 2010 Blackwell Publishing Ltd DOI: 10.1111/j.1466-8238.2010.00582.xwww.blackwellpublishing.com/geb 1
forests (Baker et al., 2004), and a good predictor of leaf area of
shrubs in tropical rain forests (Swenson & Enquist, 2008). Cli-
matic change, such as increasing levels of nitrogen deposition
and atmospheric carbon dioxide, may result in a decline in the
average WD of trees by enhancing radial growth within a forest
(Telewski et al., 1999; Stegen et al., 2009). Wood traits also deter-
mine decomposition rates of tree biomass, and thus affect
carbon and nutrient cycling in forest ecosystems (Chave et al.,
2009; Weedon et al., 2009).
It has been shown that some wood traits, such as WD, vary
with geographical gradients (Baker et al., 2004; Slik et al., 2010),
but it is still ambiguous how they vary with altitude or latitude.
For example, several studies have shown that WD decreased
significantly with increasing latitude or altitude across Neotro-
pical tree species or at a global scale (Chave et al., 2006; Swenson
& Enquist, 2007; Patiño et al., 2009), but Slik et al. (2010) found
that WD increased with altitude in Bornean forests. The spatial
variation in wood traits is probably linked to the spatial patterns
of climatic factors and the anatomy of xylem and mechanical
strength, which affect the survival and growth of trees under
diverse environmental conditions (van Gelder et al., 2006;
Chave et al., 2009; Robert et al., 2009). For example, Wiemann &
Williamson (2002) found that WD was negatively correlated
with mean annual precipitation (MAP) and positively with
mean annual temperature (MAT) in North and South American
forests, while Patiño et al. (2009) found WD to be curvilinearly
related to MAP, and showed a maximum at MAP of 2000–
3000 mm in Amazonian forests. However, ter Steege et al. (2006)
suggested that the geographical variation in WD of trees in
South America was affected primarily by forest dynamics, which
in turn was driven by a gradient of soil fertility and dry season
length. Also, there were no significant differences in modulus of
elasticity (MOE) and modulus of rupture (MOR) in 32 Austra-
lian woody species between low-rainfall and high-rainfall sites
(Onoda et al., 2010).
Until now, studies of wood traits have focused on wood
density, ignoring other important wood traits. Since many wood
traits are known to interact with each other to regulate tree
hydraulic conductivity, mechanical support, storage of nutrients
and water and growth and mortality of trees (King et al., 2006;
Stegen et al., 2009; Zhang & Cao, 2009; Zanne & Falster, 2010),
it is important to determine how these traits covary along spatial
gradients. For example, wood properties such as MOE, MOR
and WD that are related to the mechanical strength of trees, are
also correlated with xylem cavitation resistance (Hacke et al.,
2001; Jacobsen et al., 2005). However, little is known about the
spatial patterns of wood traits in China, the only country that
hosts a continuous succession from tropical seasonal rain
forests, subtropical evergreen broadleaved forests, subalpine
conifer forests, temperate deciduous broadleaved forests and
boreal forests from 18.0° to 53.3° N latitude. Although it is
believed that the physiology, xylem structure and wood traits of
a tree can be shaped by phylogeny and the environment (Read &
Stokes, 2006; Swenson & Enquist, 2007; Chave et al., 2009), it
remains unclear to what extent geographical gradients in wood
traits are shaped by each of these two factors. In the present
study, we compiled a national data set of 11 wood properties for
618 tree species from 98 sample sites spread across forests over
China, and characterized the effects of phylogeny, temperature
and precipitation on wood traits. We hypothesized that wood
properties would exhibit significant geographical patterns
that are controlled by both environmental and phylogenetic
constraints.
MATERIALS AND METHODS
Data for 11 wood traits as indicated in Appendix S1 in Support-
ing Information were compiled from the literature (Cheng,
1985; Cheng et al., 1992; Ye et al., 1999). The data included 618
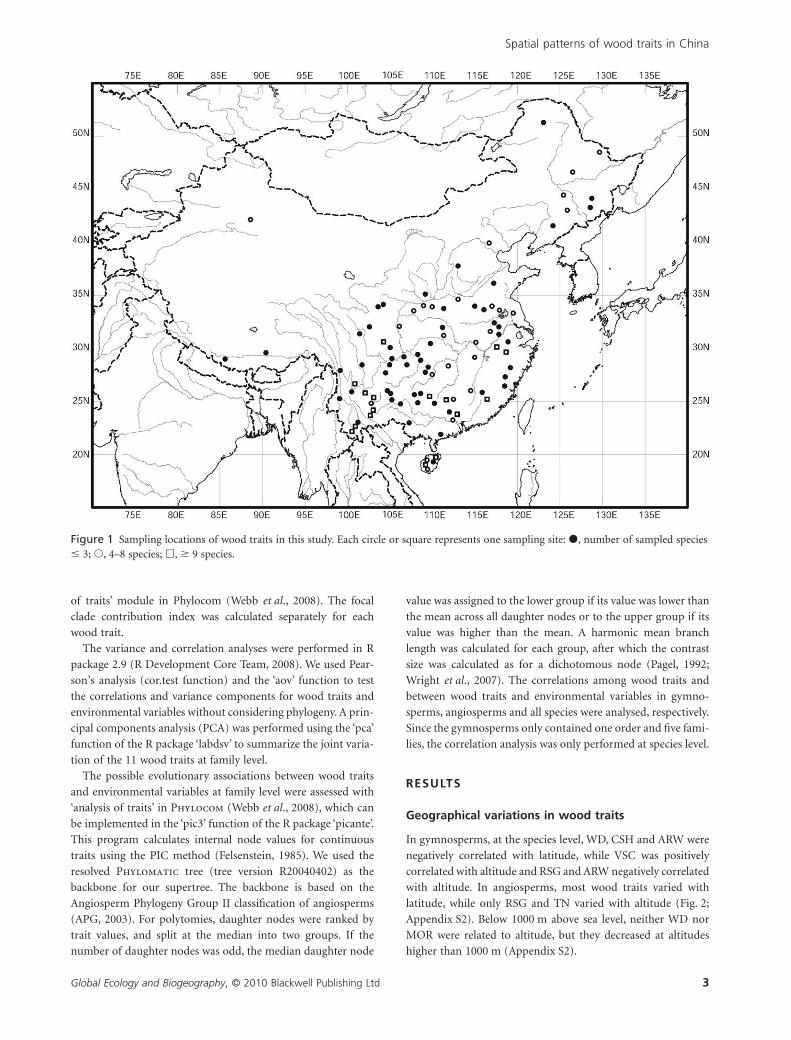
species (representing c. 25% of China’s tree species), consisting
of 535 angiosperm species and 83 gymnosperm species, from 98
sampling sites (Fig. 1) spanning most woody vegetation types
across China. Annual stem radial growth (ARW, mm) was used
as a measure of radial growth rate. The mean values of WD
(g cm-3), MOR (MPa), compression strength parallel to the
grain (CSG, MPa), cross-section hardness (CSH, MPa), MOE
(GPa), radial cleavage strength along the grain (RCG, MPa),
radial shearing strength parallel to the grain (RSG, MPa), tough-
ness (TN, Pa), tensile strength parallel to the grain (TSG, MPa)
and volumetric shrinkage coefficient (VSC, %) were based on
the mean of 3–15 trees for each species at the same site (at 15%
wood water content).
Altitude, latitude, MAT (°C) and MAP (mm) for each of the
98 sample sites were determined from Google Earth and the
China Meteorological Data Sharing Service System (http://
cdc.cma.gov.cn/shishi/climate.jsp). The taxonomic assignments
of species to division, order and family were based on the APGII
system (APG, 2003) and the Angiosperm Phylogeny website
(http://www.mobot.org/MOBOT/Research/APweb/welcome.
html). The 618 species were assigned into 20 orders and 53
families.
The original wood traits of species and the environmental
variables were standardized by log10-transformation before sta-
tistical analysis. To determine how total wood trait variance was
partitioned among taxonomic levels, a hierarchical analysis of
variance (nested ANOVA) was performed at five taxonomic
levels (division/order/family/genus/species) using the ‘varcomp’
function of the R package ‘ape’.
The contribution of focal clades to present-day variation in
wood traits was calculated using the method of Webb et al.
(2008). According the description of Moles et al. (2005), the
contribution index is calculated by the product of component
one times component two, as explained below. The first compo-
nent is calculated as the ratio of trait variation (sum of squares)
attributable to the divergence at the focal node to the variation
due to subsequent radiations within the subclades. The second
component is the sum of squares of the present-day species in
the clade divided by the sum of squares of all the present-day
species in the whole tree. The internal node values were calcu-
lated using phylogenetically independent contrasts (PIC)
(Felsenstein, 1985), after which each variance component was
calculated from internal node averages estimated by the ‘analysis
S.-B. Zhang et al.
Global Ecology and Biogeography, © 2010 Blackwell Publishing Ltd2
of traits’ module in Phylocom (Webb et al., 2008). The focal
clade contribution index was calculated separately for each
wood trait.
The variance and correlation analyses were performed in R
package 2.9 (R Development Core Team, 2008). We used Pear-
son’s analysis (cor.test function) and the ‘aov’ function to test
the correlations and variance components for wood traits and
environmental variables without considering phylogeny. A prin-
cipal components analysis (PCA) was performed using the ‘pca’
function of the R package ‘labdsv’ to summarize the joint varia-
tion of the 11 wood traits at family level.
The possible evolutionary associations between wood traits
and environmental variables at family level were assessed with
‘analysis of traits’ in Phylocom (Webb et al., 2008), which can
be implemented in the ‘pic3’ function of the R package ‘picante’.
This program calculates internal node values for continuous
traits using the PIC method (Felsenstein, 1985). We used the
resolved Phylomatic tree (tree version R20040402) as the
backbone for our supertree. The backbone is based on the
Angiosperm Phylogeny Group II classification of angiosperms
(APG, 2003). For polytomies, daughter nodes were ranked by
trait values, and split at the median into two groups. If the
number of daughter nodes was odd, the median daughter node
value was assigned to the lower group if its value was lower than
the mean across all daughter nodes or to the upper group if its
value was higher than the mean. A harmonic mean branch
length was calculated for each group, after which the contrast
size was calculated as for a dichotomous node (Pagel, 1992;
Wright et al., 2007). The correlations among wood traits and
between wood traits and environmental variables in gymno-
sperms, angiosperms and all species were analysed, respectively.
Since the gymnosperms only contained one order and five fami-
lies, the correlation analysis was only performed at species level.
RESULTS
Geographical variations in wood traits
In gymnosperms, at the species level, WD, CSH and ARW were
negatively correlated with latitude, while VSC was positively
correlated with altitude and RSG and ARW negatively correlated
with altitude. In angiosperms, most wood traits varied with
latitude, while only RSG and TN varied with altitude (Fig. 2;
Appendix S2). Below 1000 m above sea level, neither WD nor
MOR were related to altitude, but they decreased at altitudes
higher than 1000 m (Appendix S2).
Figure 1 Sampling locations of wood traits in this study. Each circle or square represents one sampling site: �, number of sampled species� 3; �, 4–8 species; �, � 9 species.
Spatial patterns of wood traits in China
Global Ecology and Biogeography, © 2010 Blackwell Publishing Ltd 3
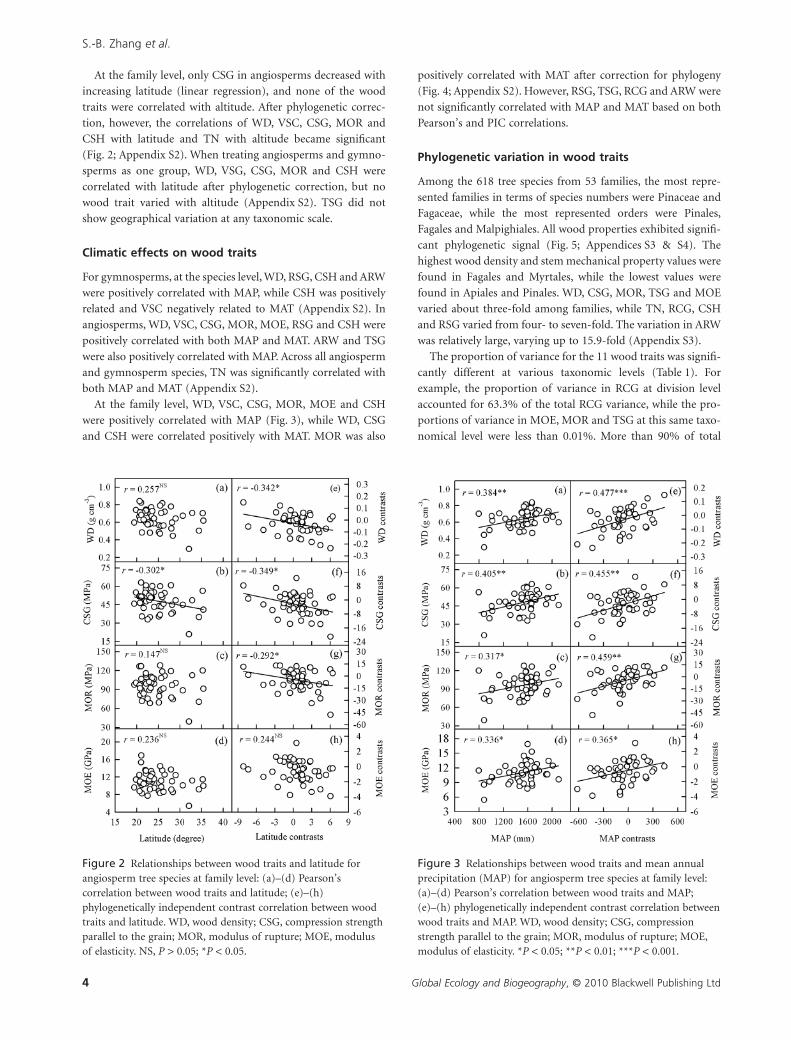
At the family level, only CSG in angiosperms decreased with
increasing latitude (linear regression), and none of the wood
traits were correlated with altitude. After phylogenetic correc-
tion, however, the correlations of WD, VSC, CSG, MOR and
CSH with latitude and TN with altitude became significant
(Fig. 2; Appendix S2). When treating angiosperms and gymno-
sperms as one group, WD, VSG, CSG, MOR and CSH were
correlated with latitude after phylogenetic correction, but no
wood trait varied with altitude (Appendix S2). TSG did not
show geographical variation at any taxonomic scale.
Climatic effects on wood traits
For gymnosperms, at the species level, WD, RSG, CSH and ARW
were positively correlated with MAP, while CSH was positively
related and VSC negatively related to MAT (Appendix S2). In
angiosperms, WD, VSC, CSG, MOR, MOE, RSG and CSH were
positively correlated with both MAP and MAT. ARW and TSG
were also positively correlated with MAP. Across all angiosperm
and gymnosperm species, TN was significantly correlated with
both MAP and MAT (Appendix S2).
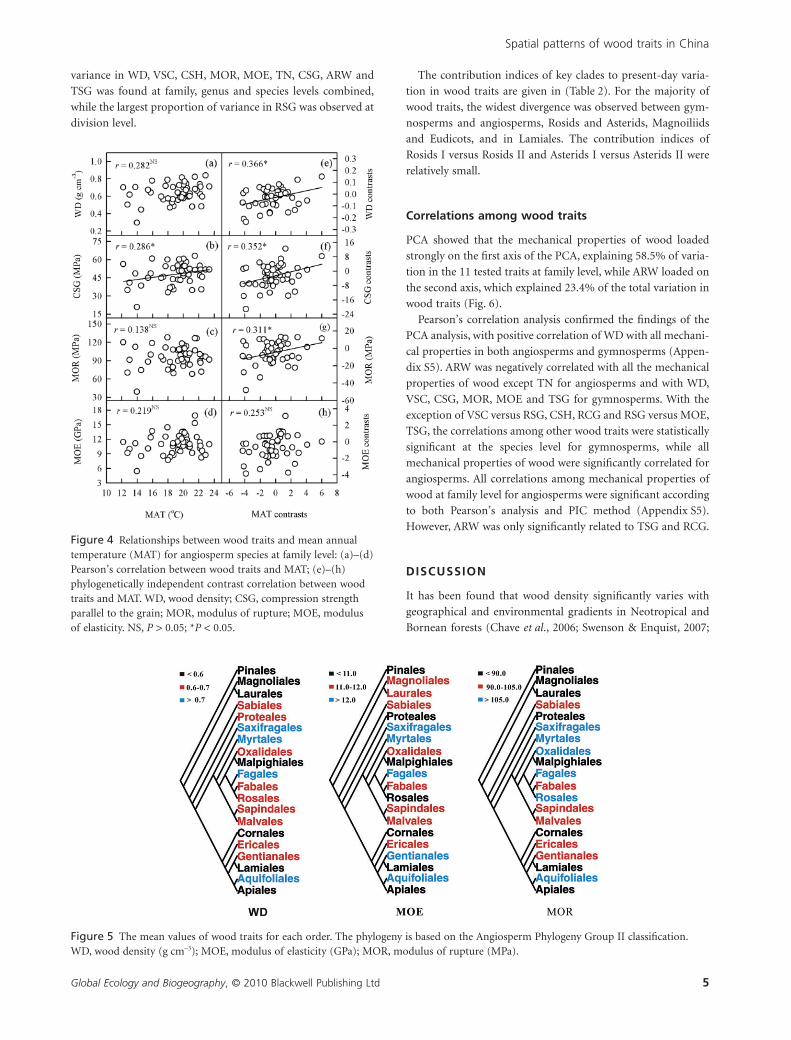
At the family level, WD, VSC, CSG, MOR, MOE and CSH
were positively correlated with MAP (Fig. 3), while WD, CSG
and CSH were correlated positively with MAT. MOR was also
positively correlated with MAT after correction for phylogeny
(Fig. 4; Appendix S2). However, RSG, TSG, RCG and ARW were
not significantly correlated with MAP and MAT based on both
Pearson’s and PIC correlations.
Phylogenetic variation in wood traits
Among the 618 tree species from 53 families, the most repre-
sented families in terms of species numbers were Pinaceae and
Fagaceae, while the most represented orders were Pinales,
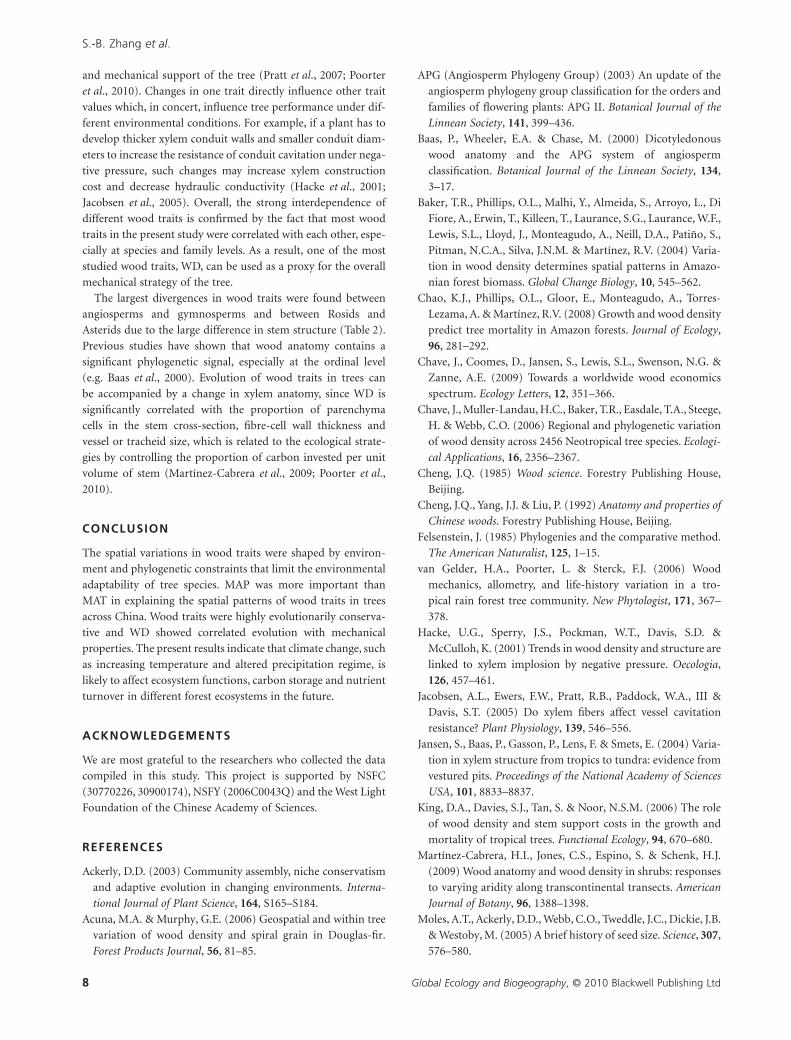
Fagales and Malpighiales. All wood properties exhibited signifi-
cant phylogenetic signal (Fig. 5; Appendices S3 & S4). The
highest wood density and stem mechanical property values were
found in Fagales and Myrtales, while the lowest values were
found in Apiales and Pinales. WD, CSG, MOR, TSG and MOE
varied about three-fold among families, while TN, RCG, CSH
and RSG varied from four- to seven-fold. The variation in ARW
was relatively large, varying up to 15.9-fold (Appendix S3).
The proportion of variance for the 11 wood traits was signifi-
cantly different at various taxonomic levels (Table 1). For
example, the proportion of variance in RCG at division level
accounted for 63.3% of the total RCG variance, while the pro-
portions of variance in MOE, MOR and TSG at this same taxo-
nomical level were less than 0.01%. More than 90% of total
Figure 2 Relationships between wood traits and latitude forangiosperm tree species at family level: (a)–(d) Pearson’scorrelation between wood traits and latitude; (e)–(h)phylogenetically independent contrast correlation between woodtraits and latitude. WD, wood density; CSG, compression strengthparallel to the grain; MOR, modulus of rupture; MOE, modulusof elasticity. NS, P > 0.05; *P < 0.05.
Figure 3 Relationships between wood traits and mean annualprecipitation (MAP) for angiosperm tree species at family level:(a)–(d) Pearson’s correlation between wood traits and MAP;(e)–(h) phylogenetically independent contrast correlation betweenwood traits and MAP. WD, wood density; CSG, compressionstrength parallel to the grain; MOR, modulus of rupture; MOE,modulus of elasticity. *P < 0.05; **P < 0.01; ***P < 0.001.
S.-B. Zhang et al.
Global Ecology and Biogeography, © 2010 Blackwell Publishing Ltd4
variance in WD, VSC, CSH, MOR, MOE, TN, CSG, ARW and
TSG was found at family, genus and species levels combined,
while the largest proportion of variance in RSG was observed at
division level.
The contribution indices of key clades to present-day varia-
tion in wood traits are given in (Table 2). For the majority of
wood traits, the widest divergence was observed between gym-
nosperms and angiosperms, Rosids and Asterids, Magnoiliids
and Eudicots, and in Lamiales. The contribution indices of
Rosids I versus Rosids II and Asterids I versus Asterids II were
relatively small.
Correlations among wood traits
PCA showed that the mechanical properties of wood loaded
strongly on the first axis of the PCA, explaining 58.5% of varia-
tion in the 11 tested traits at family level, while ARW loaded on
the second axis, which explained 23.4% of the total variation in
wood traits (Fig. 6).
Pearson’s correlation analysis confirmed the findings of the
PCA analysis, with positive correlation of WD with all mechani-
cal properties in both angiosperms and gymnosperms (Appen-
dix S5). ARW was negatively correlated with all the mechanical
properties of wood except TN for angiosperms and with WD,
VSC, CSG, MOR, MOE and TSG for gymnosperms. With the
exception of VSC versus RSG, CSH, RCG and RSG versus MOE,
TSG, the correlations among other wood traits were statistically
significant at the species level for gymnosperms, while all
mechanical properties of wood were significantly correlated for
angiosperms. All correlations among mechanical properties of
wood at family level for angiosperms were significant according
to both Pearson’s analysis and PIC method (Appendix S5).
However, ARW was only significantly related to TSG and RCG.
DISCUSSION
It has been found that wood density significantly varies with
geographical and environmental gradients in Neotropical and
Bornean forests (Chave et al., 2006; Swenson & Enquist, 2007;
Figure 4 Relationships between wood traits and mean annualtemperature (MAT) for angiosperm species at family level: (a)–(d)Pearson’s correlation between wood traits and MAT; (e)–(h)phylogenetically independent contrast correlation between woodtraits and MAT. WD, wood density; CSG, compression strengthparallel to the grain; MOR, modulus of rupture; MOE, modulusof elasticity. NS, P > 0.05; *P < 0.05.
Figure 5 The mean values of wood traits for each order. The phylogeny is based on the Angiosperm Phylogeny Group II classification.WD, wood density (g cm-3); MOE, modulus of elasticity (GPa); MOR, modulus of rupture (MPa).
Spatial patterns of wood traits in China
Global Ecology and Biogeography, © 2010 Blackwell Publishing Ltd 5

Slik et al., 2010). Little is known about the geographical patterns
and environmental influences on other wood traits. In the
present study, we characterized the latitudinal and altitudinal
variation in 11 wood traits of 618 angiosperm and gymnosperm
tree species across China, and showed that these spatial patterns
were controlled by both the environment and phylogeny.
Geographical variation in wood traits
Most wood traits, such as WD, CSG, MOR, MOE and CSH
showed significantly decreasing values with increasing latitude,
while only TN, RSG and RCG showed limited altitudinal gradi-
ents (Fig. 2; Appendix S2). Our results were in contrast to the
findings on decreasing WD with altitude in the Neotropical
forests (Chave et al., 2006; Swenson & Enquist, 2007) and the
positive correlation between WD and altitude across tropical
tree species in Borneo (Slik et al., 2010). However our results
supported the negative correlation between WD and latitude as
found across Neotropical tree species (Chave et al., 2006;
Swenson & Enquist, 2007), and the lack of relationship between
WD and altitude for Douglas fir in north-western America
reported by Acuna & Murphy (2006). These contradictory
Table 1 Proportions of variance inwood traits at different taxonomic levels.Wood traits No. of species Division Order Family Genus Species
WD 618 8.9 < 0.1 19.2 45.2 26.7
VSC 490 13.3 < 0.1 17.8 35.5 33.4
CSG 576 1.7 < 0.1 17.0 41.9 39.5
MOR 540 < 0.1 < 0.1 14.2 32.0 53.8
MOE 489 < 0.1 2.5 19.1 39.3 39.2
RSG 317 15.2 10.5 < 0.1 43.6 30.7
TSG 247 < 0.1 < 0.1 26.6 42.4 31.0
TN 406 8.6 2.2 15.9 38.6 34.7
CSH 528 6.7 < 0.1 19.5 43.3 30.5
RCG 312 63.3 0.7 5.4 15.3 15.2
ARW 280 13.3 < 0.1 23.3 25.5 37.8
WD, wood density; VSC, volumetric shrinkage coefficient; CSG, compression strength parallel to thegrain; MOR, modulus of rupture; MOE, modulus of elasticity; RSG, radial shearing strength parallelto the grain; TSG, tensile strength parallel to the grain; TN, toughness; CSH, cross-section hardness;RCG, radial cleavage strength along the grain; ARW, annual stem radial growth.
Table 2 Contribution indices of key clades to present-day variation in wood traits.
WD VSC CSG MOR MOE TN CSH RCG RSG TSG ARW Clades involved
0.32 0.40 0.45 0.22 0.09 0.19 0.40 0.35 0.10 0.05 0.04 Gymnosperms versus Angiosperms
0.17 0.26 0.24 0.24 0.34 0.31 0.12 0.04 0.09 0.51 0.01 Rosids versus Asterids
0.11 0.09 0.14 0.12 0.12 0.02 0.13 0.05 0.13 0.25 0.05 Lamiales, Oleaceae versus Bignoniaceae, Lamiaceae
and Paulowniaceae
0.03 0.11 0.09 0.07 0.02 < 0.01 0.12 0.09 0.05 0.19 0.12 Magnoiliids versus Eudicots
0.03 0.04 0.04 0.01 0.02 0.12 0.02 < 0.01 < 0.01 < 0.01 0.01 Malpighiales, Ixonanthaceae versus Clusiaceae,
Euphorbiaceae, Euphorbiaceae and Salicaceae
0.02 < 0.01 0.04 0.04 0.02 0.01 0.03 < 0.01 < 0.01 0.01 0.04 Fagales, Fagaceae versus Betulaceae, Casuarinaceae,
and Juglandaceae
0.01 0.01 0.01 0.01 0.02 < 0.01 0.01 < 0.01 < 0.01 0.01 < 0.01 Pinales, Cephalotaxaceae versus Cupressaceae,
Pinaceae, Podocarpaceae and Taxaceae
0.01 < 0.01 0.03 0.08 0.02 0.03 0.05 0.05 0.07 0.10 < 0.01 Ericales, Myrsinaceae, Ebenaceae and Sapotaceae
versus Styracaceae, Symplocaceae and Theaceae
0.01 0.01 0.01 0.02 0.01 < 0.01 0.02 < 0.01 0.02 < 0.01 < 0.01 Sapindales, Anacardiaceae and Burseraceae versus
Meliaceae, Rutaceae, Sapindaceae and
Simaroubaceae
0.01 < 0.01 0.04 0.02 < 0.01 0.01 0.03 0.03 0.02 0.01 0.01 Rosales, Rhamnaceae versus Cannabaceae, Moraceae
and Ulmaceae
< 0.01 0.01 < 0.01 0.01 < 0.01 0.03 < 0.01 0.06 0.01 < 0.01 < 0.01 Rosids I versus Rosids II
< 0.01 0.04 < 0.01 < 0.01 0.10 0.01 < 0.01 < 0.01 0.01 0.01 – Asterids I versus Asterids II
The three largest contribution indices for each wood trait are shown in bold.WD, wood density; VSC, volumetric shrinkage coefficient; CSG, compression strength parallel to the grain; MOR, modulus of rupture; MOE, modulusof elasticity; TN, toughness; CSH, cross-section hardness; RCG, radial cleavage strength along the grain; RSG, radial shearing strength parallel to thegrain; TSG, tensile strength parallel to the grain; ARW, annual stem radial growth.
S.-B. Zhang et al.
Global Ecology and Biogeography, © 2010 Blackwell Publishing Ltd6

results could be caused by regional differences in species com-
position that are related to different biogeographic histories or
regional differences in environmental changes along latitudinal
and altitudinal gradients.
Our study showed that MAP was more important than MAT
in explaining the spatial variation in wood traits of trees across
China (Figs 3 & 4; Appendix S2). This was in line with the
finding on stronger correlation of wood density with precipita-
tion than with temperature for the forest trees in North and
South America (Martínez-Cabrera et al., 2009). In China, MAT
decreases with increasing latitude and altitude, while MAP is
curvilinearly related with altitude, increasing up to mid-
altitudes but decreasing with further increase in altitude towards
mountain tops (Appendix S2). This could explain why at species
level neither WD nor MOR were significantly correlated with
altitude below 1000 m elevation, but decreased with altitude
above 1000 m (Appendix S2), and most wood properties exhib-
ited significant latitudinal variation but limited or no altitudinal
variation.
The present study revealed the significant and positive corre-
lation of WD, MOR, MOE and CSH with MAP and MAT (Figs 3
& 4; Appendix S2). Our results confirmed the findings of a
positive correlation between WD and MAT in South America
reported by Wiemann & Williamson (2002) and Patiño et al.
(2009). However, they contradicted the findings of a negative
association between WD and MAP in tropical trees of South
America (Wiemann & Williamson, 2002; Swenson & Enquist,
2007), and the lack of association of WD with rainfall in South
America (Muller-Landau, 2004). Onoda et al. (2010) found that
WD was higher in low-rainfall sites than high-rainfall sites in
Australia, but MOE and MOR were not. Patiño et al. (2009)
observed a positive correlation between WD and MAP below
3000 mm, but a negative correlation when MAP exceeded
3000 mm in Amazon forests. The positive correlation of WD
with temperature could be linked to wood development by
decreasing vessel size and density and increasing cell wall thick-
ness with increasing temperature due to reduction in water vis-
cosity in xylem water pipes (Roderick & Berry, 2001; Thomas
et al., 2004, 2007). In contrast to the consistent correlation of
WD with MAT, there was a strong discrepancy in the relation-
ship between WD and rainfall among studies. This discrepancy
may be explained in part by differences in environmental
factors, such as soils and temperatures, among the sampling
sites. In our study, WD decreased with the increasing latitude
(Fig. 2), while latitude was negatively correlated with MAP
(r = 0.722, P < 0.0001; Appendix S2). The positive correlation
between WD and MAP found by the present study may there-
fore be a result of the wide latitudinal range covered by our study
which includes a continuous succession of forest ecosystems
ranging from tropical seasonal rain forests to boreal forests.
Most of other studies such as those cited above include fewer
types of forest ecosystems and a much smaller latitudinal
range.
The geographical variation in wood mechanical traits is also
related to the ecological strategy and evolutionary history of
trees. Stem structure and architecture are greatly influenced by
resource supply and environmental stress. Plants can adapt to
these stresses over evolutionary time through the adjustment of
stem structure and architecture (Read & Stokes, 2006); however,
species with different wood structures will occupy different
habitats due to environmental filtering (Martínez-Cabrera et al.,
2009). For instance, from tropical to temperate climates, vessel
element lengthen and vessel diameter decrease, while the inci-
dence of scalariform perforations and tracheids increases
(Jansen et al., 2004; Wheeler et al., 2007). In our study, some
relationships between wood traits, latitude and altitude became
significant after PIC, indicating that evolutionary constraints
due to phylogenetic conservatism affect the environmental tol-
erances of tree species and thus their latitudinal and altitudinal
ranges. Patterns of wood traits across China supported the idea
that species are not randomly distributed across sites but follow
the ‘habitat tracking’ hypothesis (Ackerly, 2003).
Evolution and correlation of wood traits
The present study showed that all of the examined wood prop-
erties exhibited a strong phylogenetic signal. Most variance in
wood traits was found at genus and species level (Appendix S3).
Only RCG exhibited the largest proportion of variance at divi-
sion level, being the most phylogenetically conservative trait
among the wood traits studied (Table 1). The present study and
previous studies have consistently shown that WD is phyloge-
netically conserved at different taxonomic levels (Baker et al.,
2004; Chave et al., 2006; Preston et al., 2006; Slik, 2006; Swenson
& Enquist, 2007). The strong phylogenetic conservatism in
almost all of the studied wood traits is likely to be related to their
basic and interrelated functions as they all influence and con-
tribute to stem water transport, stem water and nutrient storage
Figure 6 Principal components analysis (PCA) of 11 wood traitsfrom 53 families. WD, wood density; VSC, volumetric shrinkagecoefficient; CSG, compression strength parallel to the grain; MOR,modulus of rupture; MOE, modulus of elasticity; TN, toughness;CSH, cross-section hardness; RCG, radial cleavage strength alongthe grain; RSG, radial shearing strength parallel to the grain; TSG,tensile strength parallel to the grain; ARW, annual stem radialgrowth.
Spatial patterns of wood traits in China
Global Ecology and Biogeography, © 2010 Blackwell Publishing Ltd 7
and mechanical support of the tree (Pratt et al., 2007; Poorter
et al., 2010). Changes in one trait directly influence other trait
values which, in concert, influence tree performance under dif-
ferent environmental conditions. For example, if a plant has to
develop thicker xylem conduit walls and smaller conduit diam-
eters to increase the resistance of conduit cavitation under nega-
tive pressure, such changes may increase xylem construction
cost and decrease hydraulic conductivity (Hacke et al., 2001;
Jacobsen et al., 2005). Overall, the strong interdependence of
different wood traits is confirmed by the fact that most wood
traits in the present study were correlated with each other, espe-
cially at species and family levels. As a result, one of the most
studied wood traits, WD, can be used as a proxy for the overall
mechanical strategy of the tree.
The largest divergences in wood traits were found between
angiosperms and gymnosperms and between Rosids and
Asterids due to the large difference in stem structure (Table 2).
Previous studies have shown that wood anatomy contains a
significant phylogenetic signal, especially at the ordinal level
(e.g. Baas et al., 2000). Evolution of wood traits in trees can
be accompanied by a change in xylem anatomy, since WD is
significantly correlated with the proportion of parenchyma
cells in the stem cross-section, fibre-cell wall thickness and
vessel or tracheid size, which is related to the ecological strate-
gies by controlling the proportion of carbon invested per unit
volume of stem (Martínez-Cabrera et al., 2009; Poorter et al.,
2010).
CONCLUSION
The spatial variations in wood traits were shaped by environ-
ment and phylogenetic constraints that limit the environmental
adaptability of tree species. MAP was more important than
MAT in explaining the spatial patterns of wood traits in trees
across China. Wood traits were highly evolutionarily conserva-
tive and WD showed correlated evolution with mechanical
properties. The present results indicate that climate change, such
as increasing temperature and altered precipitation regime, is
likely to affect ecosystem functions, carbon storage and nutrient
turnover in different forest ecosystems in the future.
ACKNOWLEDGEMENTS
We are most grateful to the researchers who collected the data
compiled in this study. This project is supported by NSFC
(30770226, 30900174), NSFY (2006C0043Q) and the West Light
Foundation of the Chinese Academy of Sciences.
REFERENCES
Ackerly, D.D. (2003) Community assembly, niche conservatism
and adaptive evolution in changing environments. Interna-
tional Journal of Plant Science, 164, S165–S184.
Acuna, M.A. & Murphy, G.E. (2006) Geospatial and within tree
variation of wood density and spiral grain in Douglas-fir.
Forest Products Journal, 56, 81–85.
APG (Angiosperm Phylogeny Group) (2003) An update of the
angiosperm phylogeny group classification for the orders and
families of flowering plants: APG II. Botanical Journal of the
Linnean Society, 141, 399–436.
Baas, P., Wheeler, E.A. & Chase, M. (2000) Dicotyledonous
wood anatomy and the APG system of angiosperm
classification. Botanical Journal of the Linnean Society, 134,
3–17.
Baker, T.R., Phillips, O.L., Malhi, Y., Almeida, S., Arroyo, L., Di
Fiore, A., Erwin, T., Killeen, T., Laurance, S.G., Laurance, W.F.,
Lewis, S.L., Lloyd, J., Monteagudo, A., Neill, D.A., Patiño, S.,
Pitman, N.C.A., Silva, J.N.M. & Martínez, R.V. (2004) Varia-
tion in wood density determines spatial patterns in Amazo-
nian forest biomass. Global Change Biology, 10, 545–562.
Chao, K.J., Phillips, O.L., Gloor, E., Monteagudo, A., Torres-
Lezama, A. & Martínez, R.V. (2008) Growth and wood density
predict tree mortality in Amazon forests. Journal of Ecology,
96, 281–292.
Chave, J., Coomes, D., Jansen, S., Lewis, S.L., Swenson, N.G. &
Zanne, A.E. (2009) Towards a worldwide wood economics
spectrum. Ecology Letters, 12, 351–366.
Chave, J., Muller-Landau, H.C., Baker, T.R., Easdale, T.A., Steege,
H. & Webb, C.O. (2006) Regional and phylogenetic variation
of wood density across 2456 Neotropical tree species. Ecologi-
cal Applications, 16, 2356–2367.
Cheng, J.Q. (1985) Wood science. Forestry Publishing House,
Beijing.
Cheng, J.Q., Yang, J.J. & Liu, P. (1992) Anatomy and properties of
Chinese woods. Forestry Publishing House, Beijing.
Felsenstein, J. (1985) Phylogenies and the comparative method.
The American Naturalist, 125, 1–15.
van Gelder, H.A., Poorter, L. & Sterck, F.J. (2006) Wood
mechanics, allometry, and life-history variation in a tro-
pical rain forest tree community. New Phytologist, 171, 367–
378.
Hacke, U.G., Sperry, J.S., Pockman, W.T., Davis, S.D. &
McCulloh, K. (2001) Trends in wood density and structure are
linked to xylem implosion by negative pressure. Oecologia,
126, 457–461.
Jacobsen, A.L., Ewers, F.W., Pratt, R.B., Paddock, W.A., III &
Davis, S.T. (2005) Do xylem fibers affect vessel cavitation
resistance? Plant Physiology, 139, 546–556.
Jansen, S., Baas, P., Gasson, P., Lens, F. & Smets, E. (2004) Varia-
tion in xylem structure from tropics to tundra: evidence from
vestured pits. Proceedings of the National Academy of Sciences
USA, 101, 8833–8837.
King, D.A., Davies, S.J., Tan, S. & Noor, N.S.M. (2006) The role
of wood density and stem support costs in the growth and
mortality of tropical trees. Functional Ecology, 94, 670–680.
Martínez-Cabrera, H.I., Jones, C.S., Espino, S. & Schenk, H.J.
(2009) Wood anatomy and wood density in shrubs: responses
to varying aridity along transcontinental transects. American
Journal of Botany, 96, 1388–1398.
Moles, A.T., Ackerly, D.D., Webb, C.O., Tweddle, J.C., Dickie, J.B.
& Westoby, M. (2005) A brief history of seed size. Science, 307,
576–580.
S.-B. Zhang et al.
Global Ecology and Biogeography, © 2010 Blackwell Publishing Ltd8
Muller-Landau, H.C. (2004) Interspecific and inter-site varia-
tion in wood specific gravity of tropical trees. Biotropica, 36,
20–32.
Onoda, Y., Richards, A.E. & Westoby, M. (2010) The relation-
ship between stem biomechanics and wood density is modi-
fied by rainfall in 32 Australian woody plant species. New
Phytologist, 185, 493–501.
Pagel, M.D. (1992) A method for the analysis of comparative
data. Journal of Theoretical Biology, 156, 431–442.
Patiño, S., Lloyd, J., Paiva, R. et al. (2009) Branch xylem density
variations across the Amazon Basin. Biogeosciences, 6, 545–
568.
Poorter, L., McDonald, I., Alarcón, A., Fichtler, E., Licona, J.-C.,
Pená-Claros, M., Sterck, F., Villegas, Z. & Sass-Klaassen, U.
(2010) The importance of wood traits and hydraulic
conductance for the performance and life history
strategies of 42 rainforest tree species. New Phytologist, 185,
481–492.
Pratt, R.B., Jacobsen, A.L., Ewers, F.W. & Davis, S.D. (2007)
Relationships among xylem transport, biomechanics and
storage in stems and roots of nine Rhamnaceae species of the
California chaparral. New Phytologist, 174, 787–798.
Preston, K.A., Cornwell, W.K. & DeNoyer, J.L. (2006) Wood
density and vessel traits as distinct correlates of ecological
strategy in 51 California coast range angiosperms. New Phy-
tologist, 170, 807–818.
R Development Core Team (2008) R: a language and environ-
ment for statistical computing. R Foundation for Statistical
Computing, Vienna, Austria. Available at: http://www.R-
project.org (accessed 28 July 2009).
Read, J. & Stokes, A. (2006) Plant biomechanics in an
ecological context. American Journal of Botany, 93, 1546–
1565.
Robert, E.M.R., Koedam, N., Beeckman, H. & Schmitz, N.
(2009) A safe hydraulic architecture as wood anatomical
explanation for the difference in distribution of the man-
groves Avicennia and Rhizophora. Functional Ecology, 23, 649–
657.
Roderick, M.L. & Berry, S.L. (2001) Linking wood density with
tree growth and environment: a theoretical analysis based on
the motion of water. New Phytologist, 149, 473–485.
Slik, J.W.F. (2006) Estimating species-specific wood density
from the genus average in Indonesian trees. Journal of Tropical
Ecology, 22, 481–482.
Slik, J.W.F., Aiba, S.-I., Brearley, F.Q., Cannon, C.H., Forshed, O.,
Kitayama, K., Nagamasu, H., Nilus, R., Payne, J., Paoli, G.,
Poulsen, A.D., Raes, N., Sheil, D., Sidiyasa, K., Suzuki, E. & van
Valkenburg, J.L.C.H. (2010) Environmental correlates of tree
biomass, basal area, wood specific gravity and stem density
gradients in Borneo’s tropical forests. Global Ecology and Bio-
geography, 19, 50–60.
ter Steege, H., Pitman, N.C.A., Phillips, O.L., Chave, J., Sabatier,
D., Duque, A., Molino, J.-F., Prévost, M.-F., Spichiger, R.,
Castellanos, H., von Hildebrand, P. & Vásquez, R. (2006)
Continental-scale patterns of canopy tree composition and
function across Amazonia. Nature, 443, 444–447.
Stegen, J.M., Swenson, N.G., Valencia, R., Enquist, B.J. &
Thompson, J. (2009) Above-ground forest biomass is not con-
sistently related to wood density in tropical forests. Global
Ecology and Biogeography, 18, 617–625.
Swenson, N.G. & Enquist, B.J. (2007) Ecological and evo-
lutionary determinants of a key plant functional trait:
wood density and its community-wide variation across
latitude and elevation. American Journal of Botany, 94, 451–
459.
Swenson, N.G. & Enquist, B.J. (2008) The relationship between
stem and branch wood specific gravity and the ability of each
measure to predict leaf area. American Journal of Botany, 95,
516–519.
Telewski, F.W., Swanson, R.T., Strain, B.R. & Burns, J.M. (1999)
Wood properties and ring width responses to long-term
atmospheric CO2 enrichment in field-grown loblolly pine
(Pinus taeda L.). Plant, Cell and Environment, 22, 213–219.
Thomas, D.S., Montagu, K.D. & Conroy, J.P. (2004) Changes
in wood density of Eucalyptus camaldulensis due to tempera-
ture – the physiological link between water viscosity and
wood anatomy. Forest Ecology and Management, 193, 157–
165.
Thomas, D.S., Montagu, K.D. & Conroy, J.P. (2007) Temperature
effects on wood anatomy, wood density, photosynthesis and
biomass partitioning of Eucalyptus grandis seedlings. Tree
Physiology, 27, 251–260.
Webb, C.O., Ackerly, D.D. & Kembel, S.W. (2008) Phylocom:
software for the analysis of phylogenetic community structure
and trait evolution. Bioinformatics, 24, 2098–2100.
Weedon, J.T., Cornwell, W.K., Cornelissen, J.H.C., Zanne, A.E.,
Wirth, C. & Coomes, D.A. (2009) Global meta-analysis of
wood decomposition rates: a role for trait variation among
tree species? Ecology Letters, 12, 45–56.
Wheeler, E.A., Baas, P. & Rodgers, S. (2007) Variations in wood
anatomy: a global analysis based on the inside wood database.
IAWA Journal, 28, 229–258.
Wiemann, M.C. & Williamson, G.B. (2002) Geographical varia-
tion in wood specific gravity: effects of latitude, temperature,
and precipitation. Wood and Fiber Science, 34, 96–107.
Wright, I.J., Ackerly, D.D., Bongers, F., Harms, K.E., Ibarra-
Manriquez, G., Martinez-Ramos, M., Mazer, S.J., Muller-
Landau, H.C., Paz, H., Pitman, N.C.A., Poorter, L., Silman,
M.R., Vriesendorp, C.F., Webb, C.O., Westoby, M. & Wright, S.
(2007) Relationships among ecologically important dimen-
sions of plant trait variation in seven Neotropical forests.
Annals of Botany, 99, 1003–1015.
Ye, R.U., Mo, R.M. & Zou, S.Q. (1999) Picture index of broadleaf
tree and wood of Yunnan, China. Yunnan University Publish-
ing Press, Kunming.
Zanne, A.E. & Falster, D.S. (2010) Plant functional traits – link-
ages among stem anatomy, plant performance and life history.
New Phytologist, 185, 348–351.
Zhang, J.L. & Cao, K.F. (2009) Stem hydraulics mediates leaf
water status, carbon gain, nutrient use efficiencies and plant
growth rates across dipterocarp species. Functional Ecology,
23, 658–667.
Spatial patterns of wood traits in China
Global Ecology and Biogeography, © 2010 Blackwell Publishing Ltd 9
SUPPORTING INFORMATION
Additional Supporting Information may be found in the online
version of this article:
Appendix S1 Wood traits and environmental variables of 618
species in China.
Appendix S2 Correlations between wood traits and climatic
variables.
Appendix S3 Wood traits of 53 families.
Appendix S4 Wood traits of 20 orders.
Appendix S5 Correlation coefficients among wood traits.
As a service to our authors and readers, this journal provides
supporting information supplied by the authors. Such materials
are peer-reviewed and may be re-organized for online delivery,
but are not copy-edited or typeset. Technical support issues
arising from supporting information (other than missing files)
should be addressed to the authors.
BIOSKETCHES
Shi-Bao Zhang is a senior researcher at
Xishuangbanna Tropical Botanical Garden, Chinese
Academy of Sciences (CAS). His research interests
include the evolution of plant functional traits, plant
functional differentiation and ecological adaptation,
photosynthesis and photoprotection of tropical plants
in response to low temperature.
Kun-Fang Cao is a professor and a principal research
scientist at Xishuangbanna Tropical Botanical Garden,
CAS. His interests include plant physiological ecology,
especially plant hydraulics, water relations, evolution of
plant functional traits and ecological adaptation,
photosynthesis and photoprotection of tropical and
subtropical plants in response to chilling temperatures.
J. W. Ferry Slik is a professor in the Ecological
Evolution Group of Xishuangbanna Tropical Botanical
Garden, CAS. His research is focused on tree species
diversity and distribution patterns in relation to
environmental variables in lowland rain forests of
Borneo and Southeast Asia, as well as new species
identification techniques.
Editor: Arndt Hampe
S.-B. Zhang et al.
Global Ecology and Biogeography, © 2010 Blackwell Publishing Ltd10