research report south australian economic andbudget outlook
DESCRIPTION
Research report South Australian Economic and Budget OutlookTRANSCRIPT
AISR – South Australian Economic and Budget Outlook 1
4
Research report
South Australian Economic and Budget Outlook Associate Professor John Spoehr and Eric Parnis
July 2010
Report prepared for: Public Service Association of South Australia

AISR – South Australian Economic and Budget Outlook i
CONTENTS
1 KEY FINDINGS AT A GLANCE ............................................................................................................................. 1
2 CONTEXT ......................................................................................................................................................... 2
3 PUBLIC SECTOR AGEING, WORKFORCE REDUCTIONS AND THE RETENTION CHALLENGE AHEAD ........................ 3
4 ECONOMIC OUTLOOK ...................................................................................................................................... 5
4.1 LABOUR MARKET PERFORMANCE ............................................................................................................................... 7
5 BUDGETARY OUTLOOK .................................................................................................................................... 8
5.1 GST TAX REVENUE ................................................................................................................................................. 9
5.2 SOUTH AUSTRALIAN MID‐YEAR BUDGET REVIEW 2009‐10 REVISIONS ............................................................................. 10
6 ECONOMIC STIMULUS PACKAGE .................................................................................................................... 14
7 SUMMARY OF REVENUE AND EXPENDITURE VARIATIONS FOR SA .................................................................. 15
8 CREDIT RATINGS ............................................................................................................................................ 17
TABLE OF FIGURES
FIGURE 1 ............................................................................................................................................................................... 4
FIGURE 2 ............................................................................................................................................................................... 5
FIGURE 3 ............................................................................................................................................................................... 7
FIGURE 4 ............................................................................................................................................................................... 8
FIGURE 5 ............................................................................................................................................................................. 11
FIGURE 6 ............................................................................................................................................................................. 12
TABLE OF TABLES
TABLE 1: NUMBER OF FULL‐TIME EQUIVALENT EMPLOYEES IN SOUTH AUSTRALIAN PUBLIC SECTOR (JUNE OF EACH YEAR) .......................... 3
TABLE 2: KEY ECONOMIC INDICATORS ‐ SOUTH AUSTRALIA REAL GROWTH RATES (% PER ANNUM) .......................................................... 6
TABLE 3: KEY ECONOMIC INDICATORS ‐ AUSTRALIA REAL GROWTH RATES (% PER ANNUM) .................................................................... 6
TABLE 4: GST PAYMENTS AND GENERAL REVENUE ASSISTANCE BY STATE ($ MILLIONS) ........................................................................ 9
TABLE 5: NATIONAL GST RECEIPTS ‐ COMPARISON BETWEEN 2010‐11 BUDGET AND JULY ECONOMIC STATEMENT ($M) ........................ 10
TABLE 6: FISCAL OUTLOOK, SOUTH AUSTRALIA ($M) ................................................................................................................... 12
TABLE 7: MAJOR REVENUE VARIATIONS SINCE 2009‐10 BUDGET ($ MILLIONS) ................................................................................ 13
TABLE 8: ESTIMATES OF TOTAL REVENUE AND EXPENDITURE VARIATIONS. SOUTH AUSTRALIA ($M) ...................................................... 16
AISR – South Australian Economic and Budget Outlook 1
1 KEY FINDINGS AT A GLANCE
The economic assumptions driving the State Government’s decision to pursue public sector expenditure
and employment reductions over the next three years have been subject to considerable revision over
the last 12 months. The Australian and South Australian economies have proved resilient in the face of
the Global Financial Crisis. This has led to significant upward revisions in economic, employment and
revenue growth that were not anticipated in framing the 2009‐10 State Budget.
Despite global economic instability the South Australian economic and budget outlook is positive,
providing a foundation for growth rather than contraction in output, employment and budget revenue
over the medium term. The State Government is well positioned globally and nationally to pursue a
strategy of prudent fiscal expansion and public sector borrowing targeted at productivity enhancement
and social inclusion.
We conclude that:
1. The State Government’s most recent estimates (January 2010) show that the net operating balance
position for the State Budget is expected to have improved by $110 million in total over the period
2009‐10 to 2012‐13.
2. The most recent Commonwealth Government projections (July 2010) for GST payments and general
revenue assistance to South Australia have been revised upwards by $898.5 million over the period to
2012‐13 compared with the estimates published in its 2009‐10 Mid‐Year Economic and Fiscal Outlook
produced in late 2009. This does not include the amount of Commonwealth payments to the States in
the form of Specific Purpose Payments.
3. South Australia is receiving around $1.77 billion in economic stimulus funding from the Australian
government which has enabled a much higher level of capital expenditure to be achieved in the State
than has been possible in the recent past.
4. The combination of the Mid‐Year Budget Review net revenue improvement, the increase in GST and
general assistance revenue, and the economic stimulus contribution to South Australia leads to an
estimate of $2.8 billion extra net revenue for (or extra payments to) South Australia to 2012‐13.
5. The risk of a credit downgrade has been significantly reduced by the improved economic and financial
outlook. There is no realistic prospect of a credit downgrade given current economic and budgetary
conditions.
6. There is a medium to high risk of a negative impact on public service delivery of a rapidly
accelerating retirement flowing from the combination of public sector workforce ageing and the
proposed public sector employment reductions. This could deny elements of the public service the
skills and capabilities that are required to sustain existing service levels.
AISR – South Australian Economic and Budget Outlook 2
2 CONTEXT
The resilience of the national and South Australian economy in the wake of the Global Financial Crisis is
testament to the positive impact of the early introduction of the Economic Stimulus package by the Australian
Government and sustained demand for our commodities from China and India. In this context it is important
to avoid counter‐ stimulatory measures. The State Government’s proposed 1,600 FTE reduction in public
sector employment and associated expenditure reduction of $750 million over three years risks dampening
rather than stimulating economic demand.
The State Government’s fiscal case for major public sector expenditure reductions rested on assumptions
about a significant decline in economic growth and employment. As events have turned out an improved
economic outlook has led to significant upward revision in revenue to the State Budget. This was not
anticipated by the State Government when it framed the 2009‐10 State Budget and when it commissioned the
Sustainable Budget Commission to deliver proposals for expenditure reduction. The South Australian
Government established the Commission1 to “assist the Government to move the State’s finances back to a
sustainable position following the Global Financial Crisis”.2 The establishment of the Commission and its terms
of reference were based on the global financial crisis and consequent economic downturn which it stated at
the time “has helped push South Australia’s budget and financial position into a potentially unsustainable
position, in the absence of corrective action”.3
The Commission was asked to recommend specific actions, that if adopted would achieve the following savings
targets set by the State Government:
$150 million in 2010‐11;
$250 million in 2011‐12; and
$350 million in 2012‐13.4
This $750 million reduction in expenditure over 3 years is associated with a reduction of 1,600 FTE equivalent
employees in Government departments.5 6
Since the establishment of the Sustainable Budget Commission, the economic and fiscal outlook in Australia
and South Australia has improved markedly. This is reflected in economic and financial forecasts that are
discussed in greater detail later in the report. Despite this, the State Government has steadfastly refused to
alter the budget‐saving parameters of $750 million in savings and 1,600 FTE in job cuts.
Following sections of this report provide an update on Australian and South Australian economic and fiscal
conditions. Prior to this we provide an overview of key public sector employment trends that require the
consideration of the State Government in shaping budgetary policy. Finally the report provides a summary of
the positive net fiscal position that the State Government faces.
1 See http://www.treasury.sa.gov.au/dtf/financial_management/financial_publications_and_downloads/sbcphase1.jsp for details of the Sustainable Budget Commission 2 Government of South Australia (2009), Sustainable Budgets: Principles and Processes, First Report by the Sustainable Budget Commission, p.1 3 ibid 4 ibid p.9 5 ibid p.9 6 The State Public Sector is comprised of General Government: “the sector of Government that includes all government agencies that provide services free of charge or at prices significantly below the cost of production or provide regulatory services”; and public non‐financial corporations: “Government controlled entities that are mainly engaged in the production of market goods and/or non financial services, which recovers a significant portion of its cost through user charges”. See ibid p.49
AISR – South Australian Economic and Budget Outlook 3
3 PUBLIC SECTOR AGEING, WORKFORCE REDUCTIONS AND THE RETENTION
CHALLENGE AHEAD
The proposals for public sector expenditure reduction need to be viewed in the context of ageing of the public
sector workforce and the service delivery and workforce development imperatives that flow from this. It is
now well understood that the public sector workforce is ageing and that this will lead to the acceleration in the
retirement rate which is likely to generate public sector labour shortages unless strategies are put in place to
mitigate this. Sustained public sector workforce reduction will make the challenge more difficult as it will fuel
exit rather than foster retention. This section of the report examines some of the dimensions of this problem.
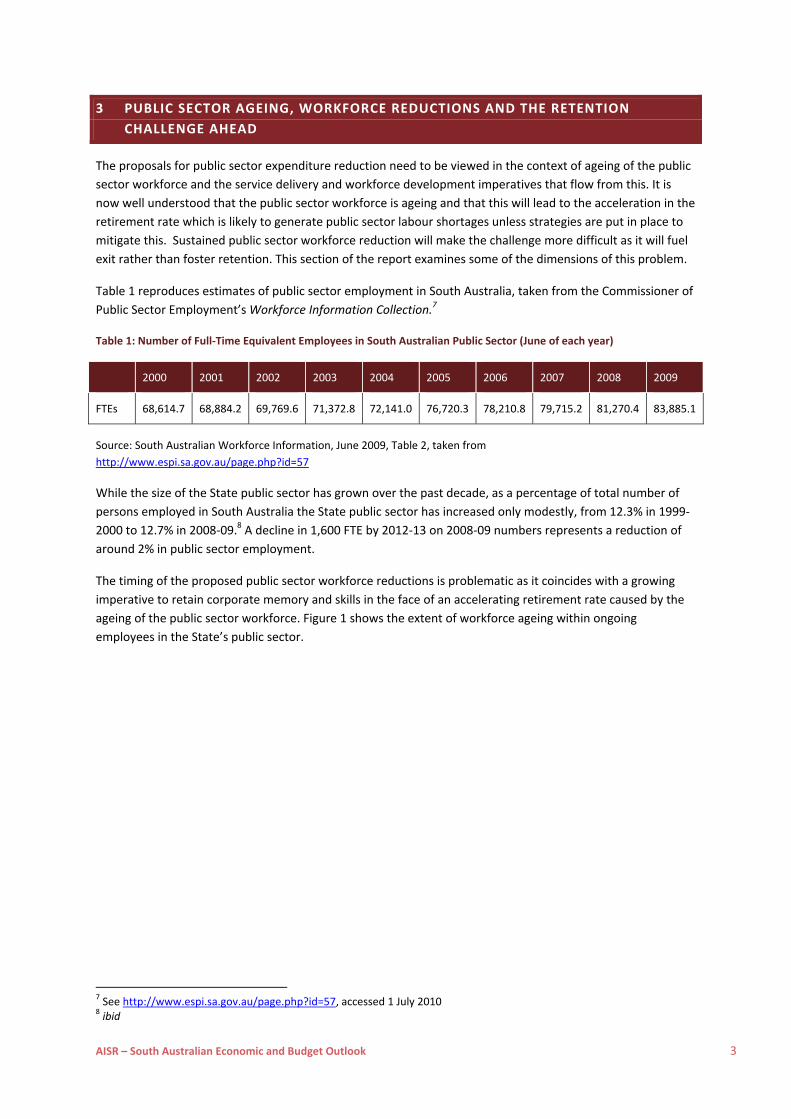
Table 1 reproduces estimates of public sector employment in South Australia, taken from the Commissioner of
Public Sector Employment’s Workforce Information Collection.7
Table 1: Number of Full‐Time Equivalent Employees in South Australian Public Sector (June of each year)
2000 2001 2002 2003 2004 2005 2006 2007 2008 2009
FTEs 68,614.7 68,884.2 69,769.6 71,372.8 72,141.0 76,720.3 78,210.8 79,715.2 81,270.4 83,885.1
Source: South Australian Workforce Information, June 2009, Table 2, taken from
http://www.espi.sa.gov.au/page.php?id=57
While the size of the State public sector has grown over the past decade, as a percentage of total number of
persons employed in South Australia the State public sector has increased only modestly, from 12.3% in 1999‐
2000 to 12.7% in 2008‐09.8 A decline in 1,600 FTE by 2012‐13 on 2008‐09 numbers represents a reduction of
around 2% in public sector employment.
The timing of the proposed public sector workforce reductions is problematic as it coincides with a growing
imperative to retain corporate memory and skills in the face of an accelerating retirement rate caused by the
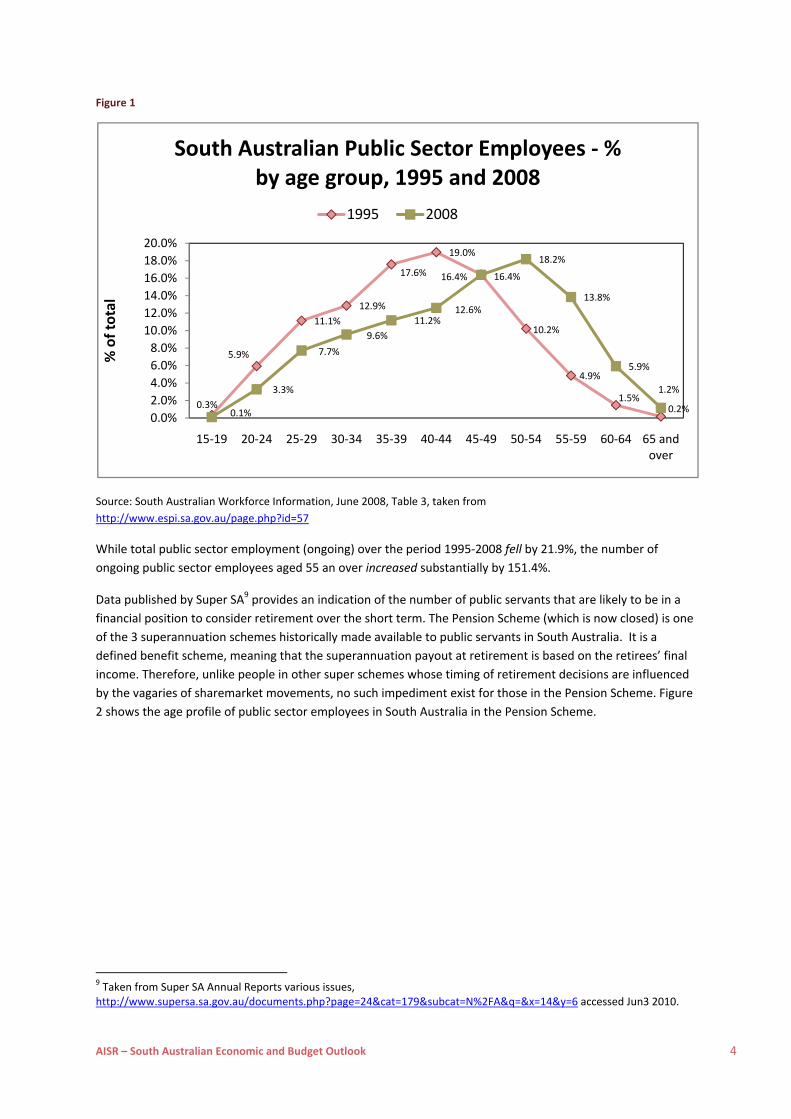
ageing of the public sector workforce. Figure 1 shows the extent of workforce ageing within ongoing
employees in the State’s public sector.
7 See http://www.espi.sa.gov.au/page.php?id=57, accessed 1 July 2010 8 ibid
AISR – South Australian Economic and Budget Outlook 4
Figure 1
Source: South Australian Workforce Information, June 2008, Table 3, taken from
http://www.espi.sa.gov.au/page.php?id=57
While total public sector employment (ongoing) over the period 1995‐2008 fell by 21.9%, the number of
ongoing public sector employees aged 55 an over increased substantially by 151.4%.
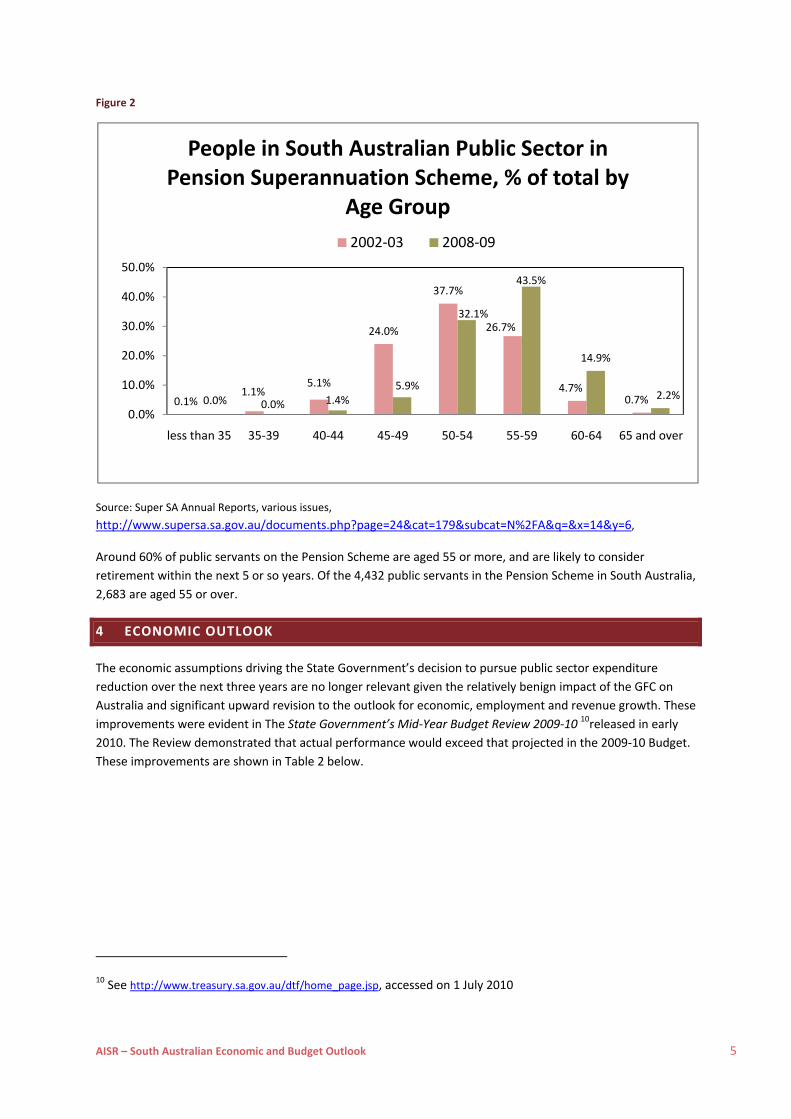
Data published by Super SA9 provides an indication of the number of public servants that are likely to be in a
financial position to consider retirement over the short term. The Pension Scheme (which is now closed) is one
of the 3 superannuation schemes historically made available to public servants in South Australia. It is a
defined benefit scheme, meaning that the superannuation payout at retirement is based on the retirees’ final
income. Therefore, unlike people in other super schemes whose timing of retirement decisions are influenced
by the vagaries of sharemarket movements, no such impediment exist for those in the Pension Scheme. Figure
2 shows the age profile of public sector employees in South Australia in the Pension Scheme.
9 Taken from Super SA Annual Reports various issues, http://www.supersa.sa.gov.au/documents.php?page=24&cat=179&subcat=N%2FA&q=&x=14&y=6 accessed Jun3 2010.
0.3%
5.9%
11.1%
12.9%
17.6%
19.0%
16.4%
10.2%
4.9%
1.5%0.2%0.1%
3.3%
7.7%
9.6%
11.2%12.6%
16.4%
18.2%
13.8%
5.9%
1.2%
0.0%
2.0%
4.0%
6.0%
8.0%
10.0%
12.0%
14.0%
16.0%
18.0%
20.0%
15‐19 20‐24 25‐29 30‐34 35‐39 40‐44 45‐49 50‐54 55‐59 60‐64 65 and over
% of total
South Australian Public Sector Employees ‐ % by age group, 1995 and 2008
1995 2008
AISR – South Australian Economic and Budget Outlook 5
Figure 2
Source: Super SA Annual Reports, various issues,
http://www.supersa.sa.gov.au/documents.php?page=24&cat=179&subcat=N%2FA&q=&x=14&y=6,
Around 60% of public servants on the Pension Scheme are aged 55 or more, and are likely to consider
retirement within the next 5 or so years. Of the 4,432 public servants in the Pension Scheme in South Australia,
2,683 are aged 55 or over.
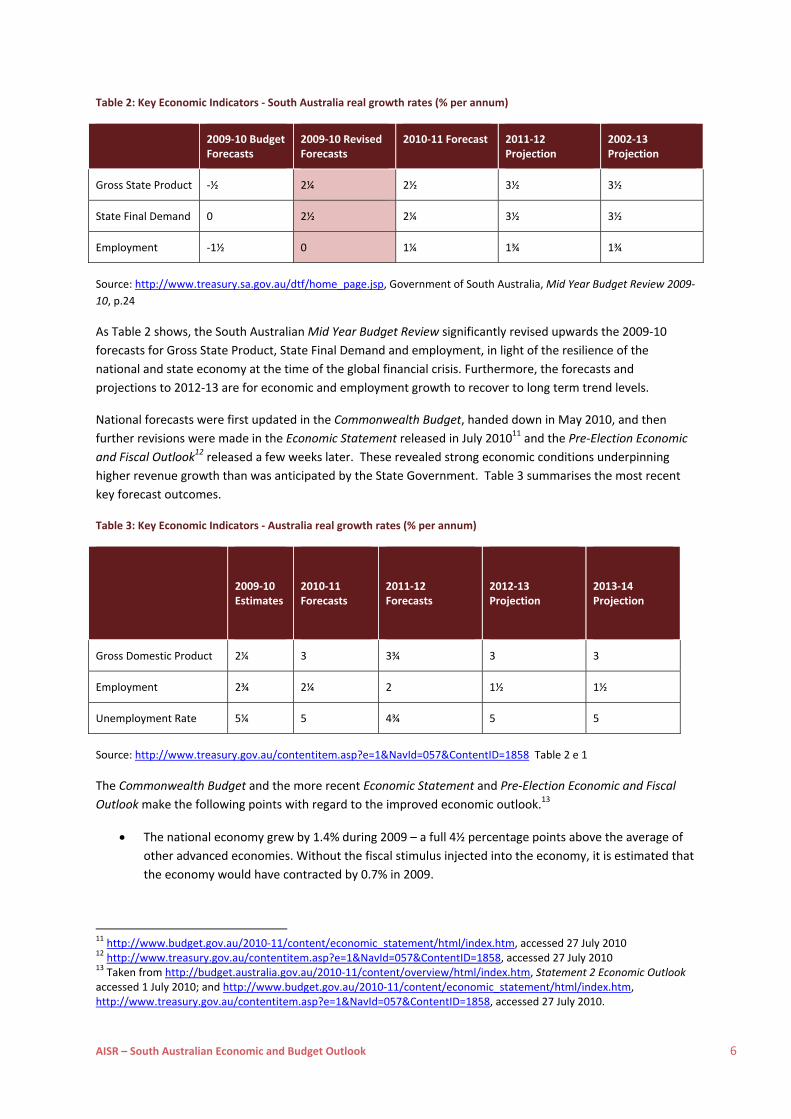
4 ECONOMIC OUTLOOK
The economic assumptions driving the State Government’s decision to pursue public sector expenditure
reduction over the next three years are no longer relevant given the relatively benign impact of the GFC on
Australia and significant upward revision to the outlook for economic, employment and revenue growth. These
improvements were evident in The State Government’s Mid‐Year Budget Review 2009‐10 10released in early
2010. The Review demonstrated that actual performance would exceed that projected in the 2009‐10 Budget.
These improvements are shown in Table 2 below.
10 See http://www.treasury.sa.gov.au/dtf/home_page.jsp, accessed on 1 July 2010
0.1%1.1%
5.1%
24.0%
37.7%
26.7%
4.7%0.7%0.0% 0.0% 1.4%
5.9%
32.1%
43.5%
14.9%
2.2%
0.0%
10.0%
20.0%
30.0%
40.0%
50.0%
less than 35 35‐39 40‐44 45‐49 50‐54 55‐59 60‐64 65 and over
People in South Australian Public Sector in Pension Superannuation Scheme, % of total by
Age Group
2002‐03 2008‐09
AISR – South Australian Economic and Budget Outlook 6
Table 2: Key Economic Indicators ‐ South Australia real growth rates (% per annum)
2009‐10 Budget Forecasts
2009‐10 Revised Forecasts
2010‐11 Forecast 2011‐12 Projection
2002‐13 Projection
Gross State Product ‐½ 2¼ 2½ 3½ 3½
State Final Demand 0 2½ 2¼ 3½ 3½
Employment ‐1½ 0 1¼ 1¾ 1¾
Source: http://www.treasury.sa.gov.au/dtf/home_page.jsp, Government of South Australia, Mid Year Budget Review 2009‐
10, p.24
As Table 2 shows, the South Australian Mid Year Budget Review significantly revised upwards the 2009‐10
forecasts for Gross State Product, State Final Demand and employment, in light of the resilience of the
national and state economy at the time of the global financial crisis. Furthermore, the forecasts and
projections to 2012‐13 are for economic and employment growth to recover to long term trend levels.
National forecasts were first updated in the Commonwealth Budget, handed down in May 2010, and then
further revisions were made in the Economic Statement released in July 201011 and the Pre‐Election Economic
and Fiscal Outlook12 released a few weeks later. These revealed strong economic conditions underpinning
higher revenue growth than was anticipated by the State Government. Table 3 summarises the most recent
key forecast outcomes.
Table 3: Key Economic Indicators ‐ Australia real growth rates (% per annum)
2009‐10 Estimates
2010‐11 Forecasts
2011‐12 Forecasts
2012‐13 Projection
2013‐14 Projection
Gross Domestic Product 2¼ 3 3¾ 3 3
Employment 2¾ 2¼ 2 1½ 1½
Unemployment Rate 5¼ 5 4¾ 5 5
Source: http://www.treasury.gov.au/contentitem.asp?e=1&NavId=057&ContentID=1858 Table 2 e 1
The Commonwealth Budget and the more recent Economic Statement and Pre‐Election Economic and Fiscal
Outlook make the following points with regard to the improved economic outlook.13
The national economy grew by 1.4% during 2009 – a full 4½ percentage points above the average of
other advanced economies. Without the fiscal stimulus injected into the economy, it is estimated that
the economy would have contracted by 0.7% in 2009.
11 http://www.budget.gov.au/2010‐11/content/economic_statement/html/index.htm, accessed 27 July 2010 12 http://www.treasury.gov.au/contentitem.asp?e=1&NavId=057&ContentID=1858, accessed 27 July 2010 13 Taken from http://budget.australia.gov.au/2010‐11/content/overview/html/index.htm, Statement 2 Economic Outlook accessed 1 July 2010; and http://www.budget.gov.au/2010‐11/content/economic_statement/html/index.htm, http://www.treasury.gov.au/contentitem.asp?e=1&NavId=057&ContentID=1858, accessed 27 July 2010.
AISR – South Australian Economic and Budget Outlook 7
The outlook for the domestic economy remains positive. There are early signs that economic activity
will gather momentum over 2010‐11 and 2011‐12, driven by a significant boost in the terms of trade
and expected strong investment.
The global economy is recovering, with strong growth in Asia but weak and uneven prospects in
advanced economies, although the outlook is clouded by substantial downside risks.
As South Australian economic conditions are heavily influenced by those experienced nationally, higher than
expected revenue will be available to the State Budget over the next three years. Estimates of this are
provided in Section 5 and an overall summary of the improved position taking account of stimulus package
benefits in Section 7.
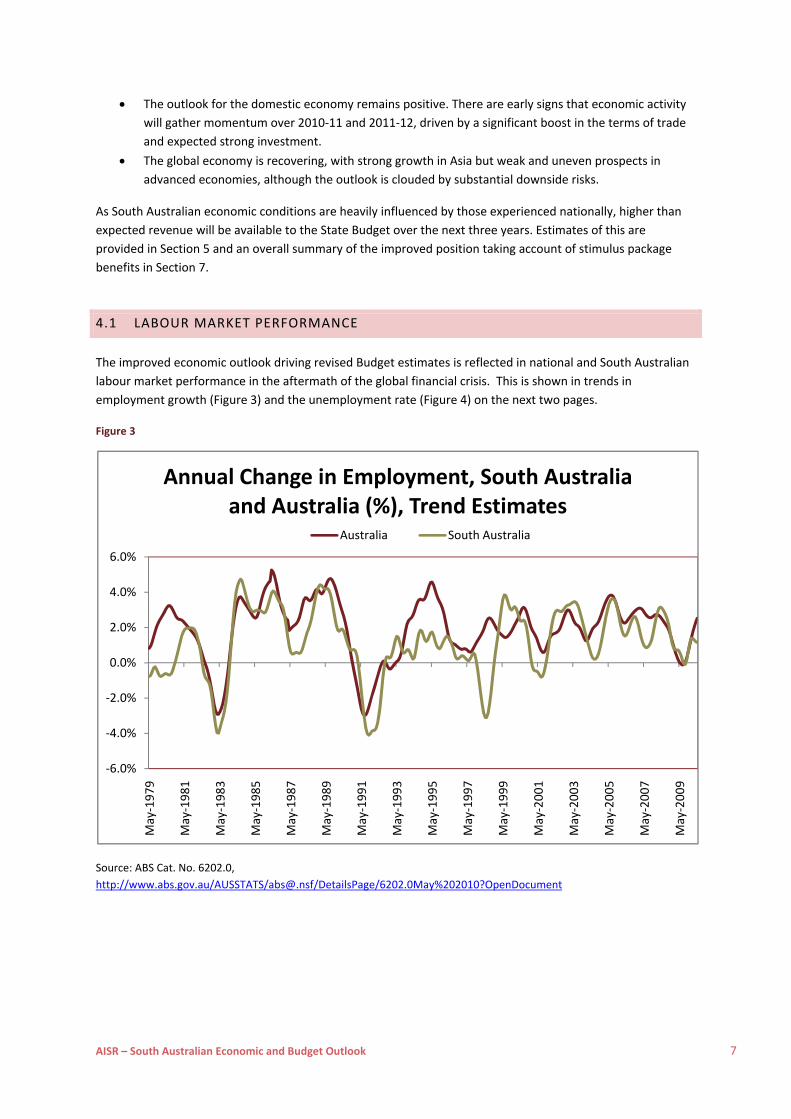
4.1 LABOUR MARKET PERFORMANCE
The improved economic outlook driving revised Budget estimates is reflected in national and South Australian
labour market performance in the aftermath of the global financial crisis. This is shown in trends in
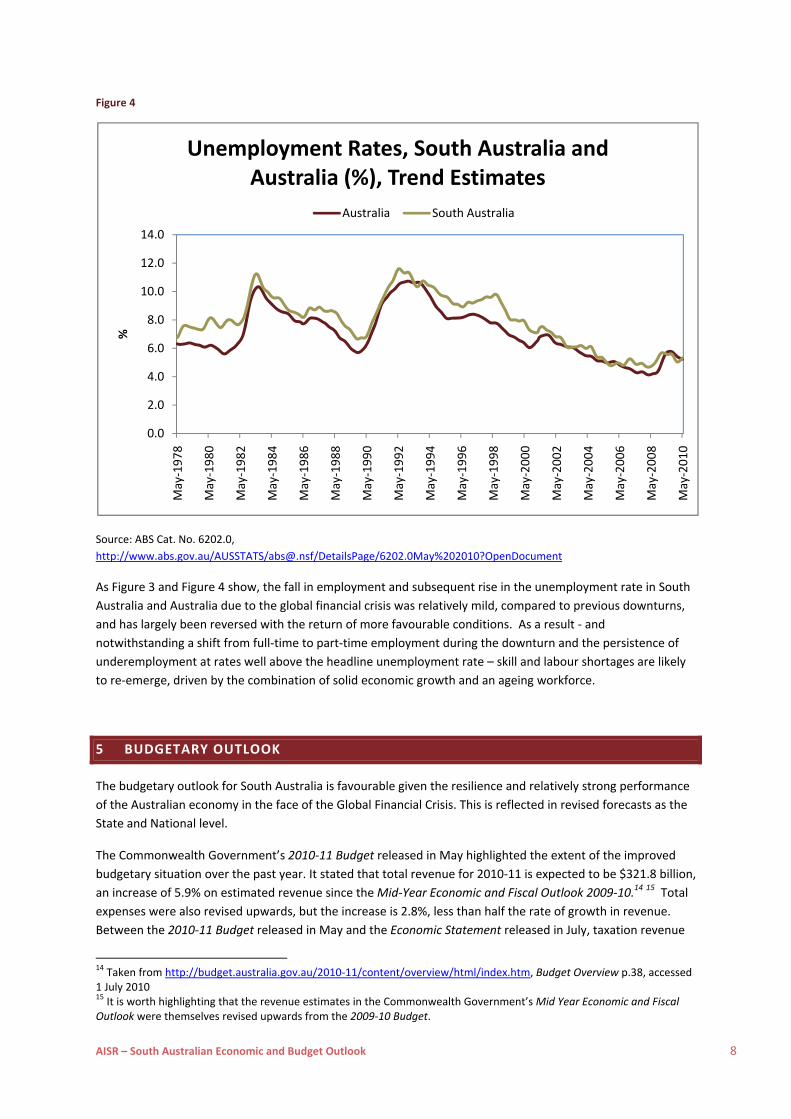
employment growth (Figure 3) and the unemployment rate (Figure 4) on the next two pages.
Figure 3
Source: ABS Cat. No. 6202.0,
http://www.abs.gov.au/AUSSTATS/[email protected]/DetailsPage/6202.0May%202010?OpenDocument
‐6.0%
‐4.0%
‐2.0%
0.0%
2.0%
4.0%
6.0%
May‐1979
May‐1981
May‐1983
May‐1985
May‐1987
May‐1989
May‐1991
May‐1993
May‐1995
May‐1997
May‐1999
May‐2001
May‐2003
May‐2005
May‐2007
May‐2009
Annual Change in Employment, South Australia and Australia (%), Trend Estimates
Australia South Australia
AISR – South Australian Economic and Budget Outlook 8
Figure 4
Source: ABS Cat. No. 6202.0,
http://www.abs.gov.au/AUSSTATS/[email protected]/DetailsPage/6202.0May%202010?OpenDocument
As Figure 3 and Figure 4 show, the fall in employment and subsequent rise in the unemployment rate in South
Australia and Australia due to the global financial crisis was relatively mild, compared to previous downturns,
and has largely been reversed with the return of more favourable conditions. As a result ‐ and
notwithstanding a shift from full‐time to part‐time employment during the downturn and the persistence of
underemployment at rates well above the headline unemployment rate – skill and labour shortages are likely
to re‐emerge, driven by the combination of solid economic growth and an ageing workforce.
5 BUDGETARY OUTLOOK
The budgetary outlook for South Australia is favourable given the resilience and relatively strong performance
of the Australian economy in the face of the Global Financial Crisis. This is reflected in revised forecasts as the
State and National level.
The Commonwealth Government’s 2010‐11 Budget released in May highlighted the extent of the improved
budgetary situation over the past year. It stated that total revenue for 2010‐11 is expected to be $321.8 billion,
an increase of 5.9% on estimated revenue since the Mid‐Year Economic and Fiscal Outlook 2009‐10.14 15 Total
expenses were also revised upwards, but the increase is 2.8%, less than half the rate of growth in revenue.
Between the 2010‐11 Budget released in May and the Economic Statement released in July, taxation revenue
14 Taken from http://budget.australia.gov.au/2010‐11/content/overview/html/index.htm, Budget Overview p.38, accessed 1 July 2010 15 It is worth highlighting that the revenue estimates in the Commonwealth Government’s Mid Year Economic and Fiscal Outlook were themselves revised upwards from the 2009‐10 Budget.
0.0
2.0
4.0
6.0
8.0
10.0
12.0
14.0
May‐1978
May‐1980
May‐1982
May‐1984
May‐1986
May‐1988
May‐1990
May‐1992
May‐1994
May‐1996
May‐1998
May‐2000
May‐2002
May‐2004
May‐2006
May‐2008
May‐2010
%
Unemployment Rates, South Australia and Australia (%), Trend Estimates
Australia South Australia
AISR – South Australian Economic and Budget Outlook 9
estimates were revised upwards nationally by around $150 million in 2010‐11 and by around 7.5 billion over
the 4 years to 2013‐1416. Subsequently, since the release of the Economic Statement, tax revenue estimates
have been revised downwards by around $300 million in each of the years to 2013‐14
5.1 GST TAX REVENUE
A major source of revenue for the States comes from the distribution of GST and General Revenue Assistance
from the Australian Government. The 2010‐11 Commonwealth Budget provided more up to date estimates of
GST payments to States than the South Australian Government’s Mid Year Budget Review (released in January
2010). Table 4 below reproduces the GST and general revenue assistance estimates provided in the
Commonwealth Budget.
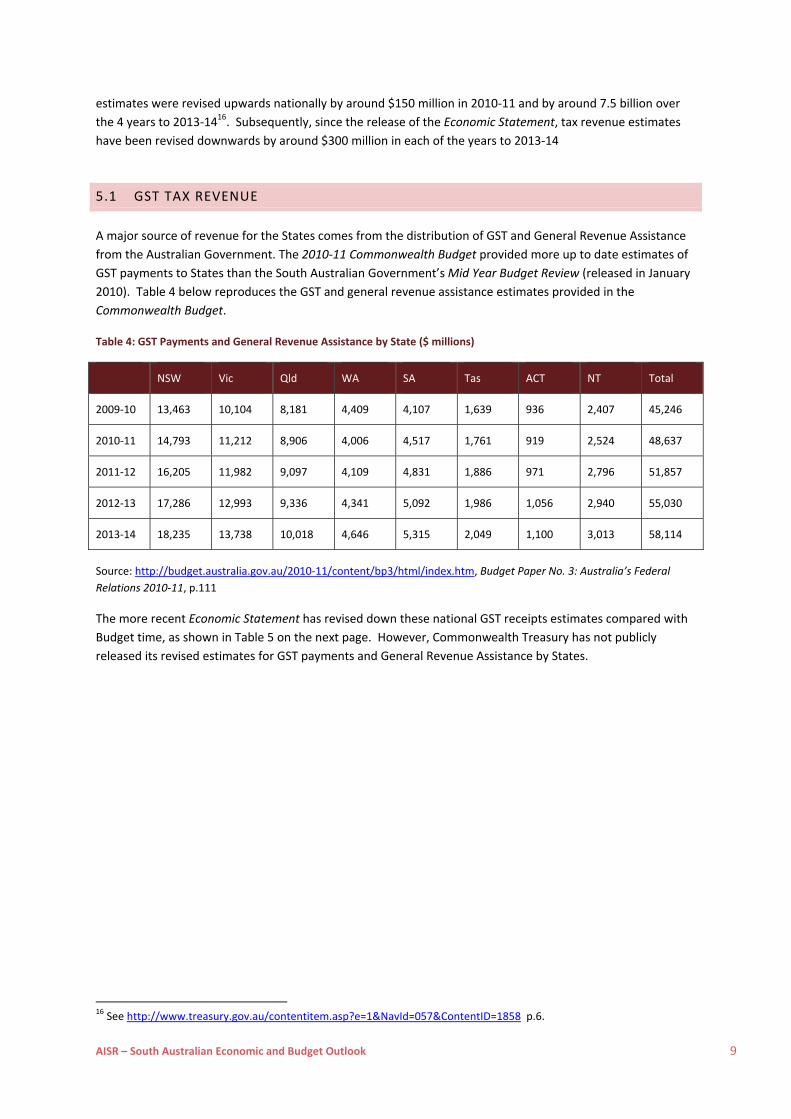
Table 4: GST Payments and General Revenue Assistance by State ($ millions)
NSW Vic Qld WA SA Tas ACT NT Total
2009‐10 13,463 10,104 8,181 4,409 4,107 1,639 936 2,407 45,246
2010‐11 14,793 11,212 8,906 4,006 4,517 1,761 919 2,524 48,637
2011‐12 16,205 11,982 9,097 4,109 4,831 1,886 971 2,796 51,857
2012‐13 17,286 12,993 9,336 4,341 5,092 1,986 1,056 2,940 55,030
2013‐14 18,235 13,738 10,018 4,646 5,315 2,049 1,100 3,013 58,114
Source: http://budget.australia.gov.au/2010‐11/content/bp3/html/index.htm, Budget Paper No. 3: Australia’s Federal
Relations 2010‐11, p.111
The more recent Economic Statement has revised down these national GST receipts estimates compared with
Budget time, as shown in Table 5 on the next page. However, Commonwealth Treasury has not publicly
released its revised estimates for GST payments and General Revenue Assistance by States.
16 See http://www.treasury.gov.au/contentitem.asp?e=1&NavId=057&ContentID=1858 p.6.
AISR – South Australian Economic and Budget Outlook 10
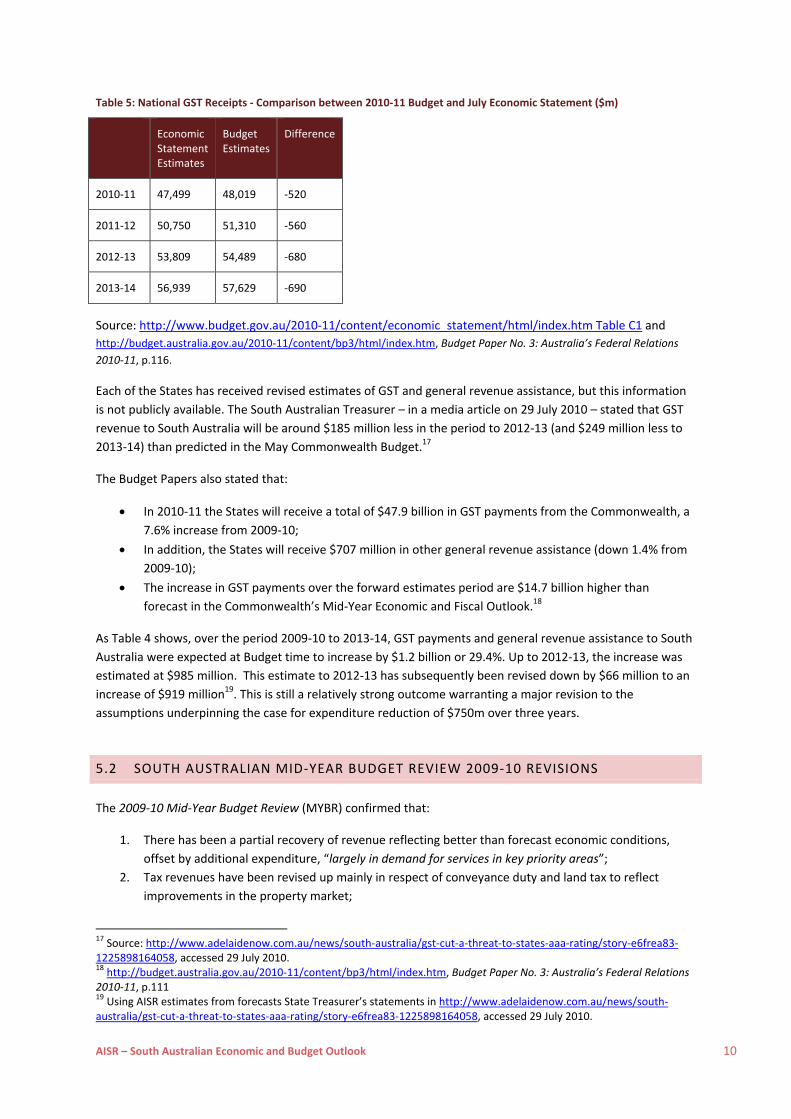
Table 5: National GST Receipts ‐ Comparison between 2010‐11 Budget and July Economic Statement ($m)
Economic Statement Estimates
Budget Estimates
Difference
2010‐11 47,499 48,019 ‐520
2011‐12 50,750 51,310 ‐560
2012‐13 53,809 54,489 ‐680
2013‐14 56,939 57,629 ‐690
Source: http://www.budget.gov.au/2010‐11/content/economic_statement/html/index.htm Table C1 and
http://budget.australia.gov.au/2010‐11/content/bp3/html/index.htm, Budget Paper No. 3: Australia’s Federal Relations
2010‐11, p.116.
Each of the States has received revised estimates of GST and general revenue assistance, but this information
is not publicly available. The South Australian Treasurer – in a media article on 29 July 2010 – stated that GST
revenue to South Australia will be around $185 million less in the period to 2012‐13 (and $249 million less to
2013‐14) than predicted in the May Commonwealth Budget.17
The Budget Papers also stated that:
In 2010‐11 the States will receive a total of $47.9 billion in GST payments from the Commonwealth, a
7.6% increase from 2009‐10;
In addition, the States will receive $707 million in other general revenue assistance (down 1.4% from
2009‐10);
The increase in GST payments over the forward estimates period are $14.7 billion higher than
forecast in the Commonwealth’s Mid‐Year Economic and Fiscal Outlook.18
As Table 4 shows, over the period 2009‐10 to 2013‐14, GST payments and general revenue assistance to South
Australia were expected at Budget time to increase by $1.2 billion or 29.4%. Up to 2012‐13, the increase was
estimated at $985 million. This estimate to 2012‐13 has subsequently been revised down by $66 million to an
increase of $919 million19. This is still a relatively strong outcome warranting a major revision to the
assumptions underpinning the case for expenditure reduction of $750m over three years.
5.2 SOUTH AUSTRALIAN MID‐YEAR BUDGET REVIEW 2009‐10 REVISIONS
The 2009‐10 Mid‐Year Budget Review (MYBR) confirmed that:
1. There has been a partial recovery of revenue reflecting better than forecast economic conditions,
offset by additional expenditure, “largely in demand for services in key priority areas”;
2. Tax revenues have been revised up mainly in respect of conveyance duty and land tax to reflect
improvements in the property market;
17 Source: http://www.adelaidenow.com.au/news/south‐australia/gst‐cut‐a‐threat‐to‐states‐aaa‐rating/story‐e6frea83‐1225898164058, accessed 29 July 2010. 18 http://budget.australia.gov.au/2010‐11/content/bp3/html/index.htm, Budget Paper No. 3: Australia’s Federal Relations 2010‐11, p.111 19 Using AISR estimates from forecasts State Treasurer’s statements in http://www.adelaidenow.com.au/news/south‐australia/gst‐cut‐a‐threat‐to‐states‐aaa‐rating/story‐e6frea83‐1225898164058, accessed 29 July 2010.
AISR – South Australian Economic and Budget Outlook 11
3. There have been upward revisions to GST grants to South Australia;
4. The MYBR includes grants towards the redevelopment of the Adelaide Oval as part of the
Government’s $450 million contribution.20 21
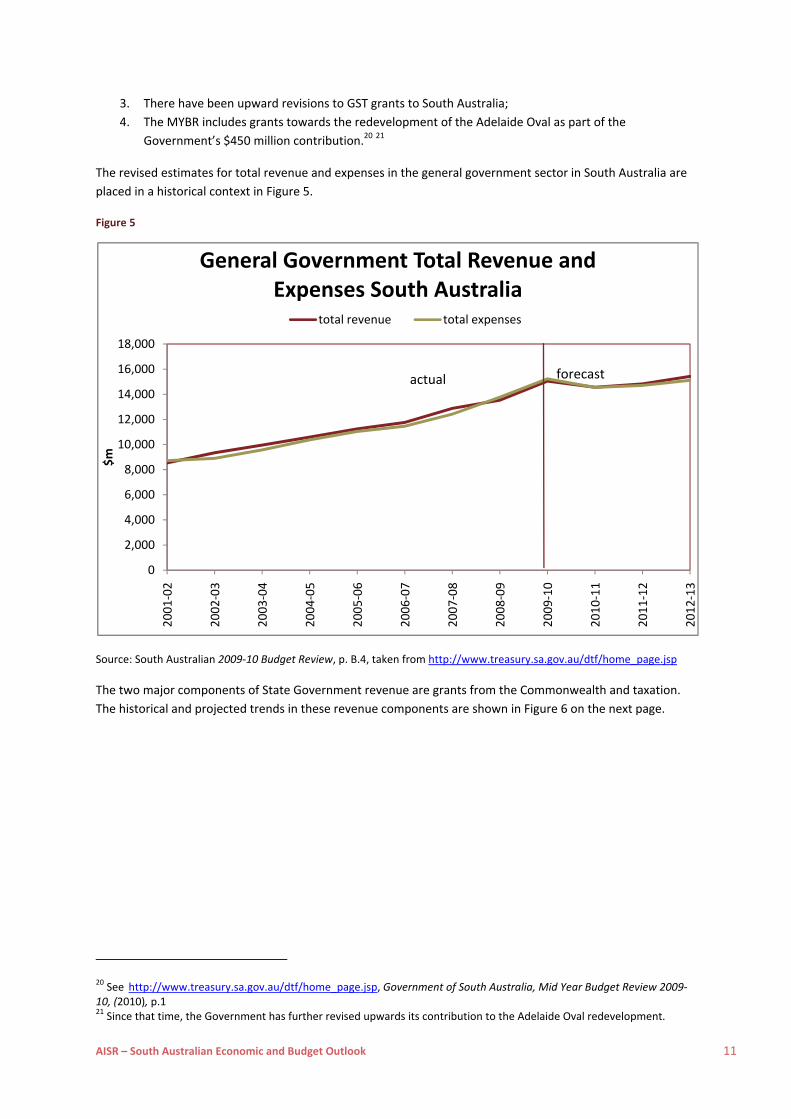
The revised estimates for total revenue and expenses in the general government sector in South Australia are
placed in a historical context in Figure 5.
Figure 5
Source: South Australian 2009‐10 Budget Review, p. B.4, taken from http://www.treasury.sa.gov.au/dtf/home_page.jsp
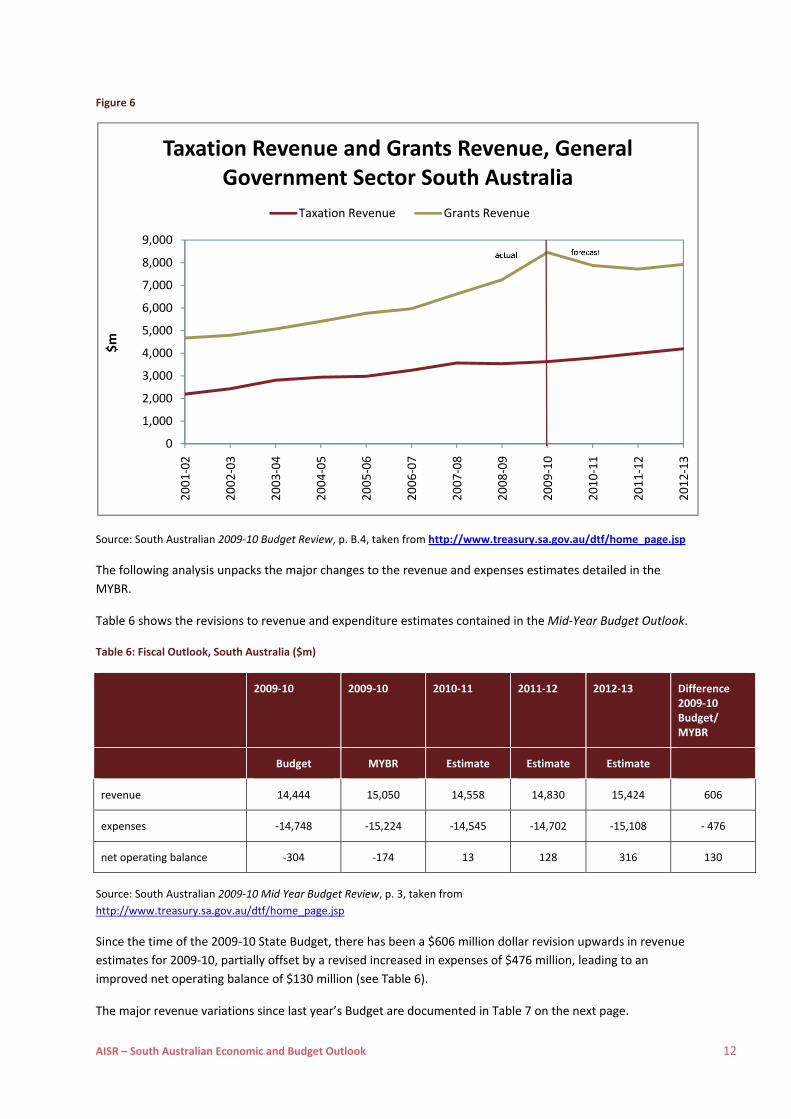
The two major components of State Government revenue are grants from the Commonwealth and taxation.
The historical and projected trends in these revenue components are shown in Figure 6 on the next page.
20 See http://www.treasury.sa.gov.au/dtf/home_page.jsp, Government of South Australia, Mid Year Budget Review 2009‐10, (2010), p.1 21 Since that time, the Government has further revised upwards its contribution to the Adelaide Oval redevelopment.
0
2,000
4,000
6,000
8,000
10,000
12,000
14,000
16,000
18,000
2001‐02
2002‐03
2003‐04
2004‐05
2005‐06
2006‐07
2007‐08
2008‐09
2009‐10
2010‐11
2011‐12
2012‐13
$m
General Government Total Revenue and Expenses South Australia
total revenue total expenses
actual forecast
AISR – South Australian Economic and Budget Outlook 12
Figure 6
Source: South Australian 2009‐10 Budget Review, p. B.4, taken from http://www.treasury.sa.gov.au/dtf/home_page.jsp
The following analysis unpacks the major changes to the revenue and expenses estimates detailed in the
MYBR.
Table 6 shows the revisions to revenue and expenditure estimates contained in the Mid‐Year Budget Outlook.
Table 6: Fiscal Outlook, South Australia ($m)
2009‐10 2009‐10 2010‐11 2011‐12 2012‐13 Difference 2009‐10 Budget/ MYBR
Budget MYBR Estimate Estimate Estimate
revenue 14,444 15,050 14,558 14,830 15,424 606
expenses ‐14,748 ‐15,224 ‐14,545 ‐14,702 ‐15,108 ‐ 476
net operating balance ‐304 ‐174 13 128 316 130
Source: South Australian 2009‐10 Mid Year Budget Review, p. 3, taken from
http://www.treasury.sa.gov.au/dtf/home_page.jsp
Since the time of the 2009‐10 State Budget, there has been a $606 million dollar revision upwards in revenue
estimates for 2009‐10, partially offset by a revised increased in expenses of $476 million, leading to an
improved net operating balance of $130 million (see Table 6).
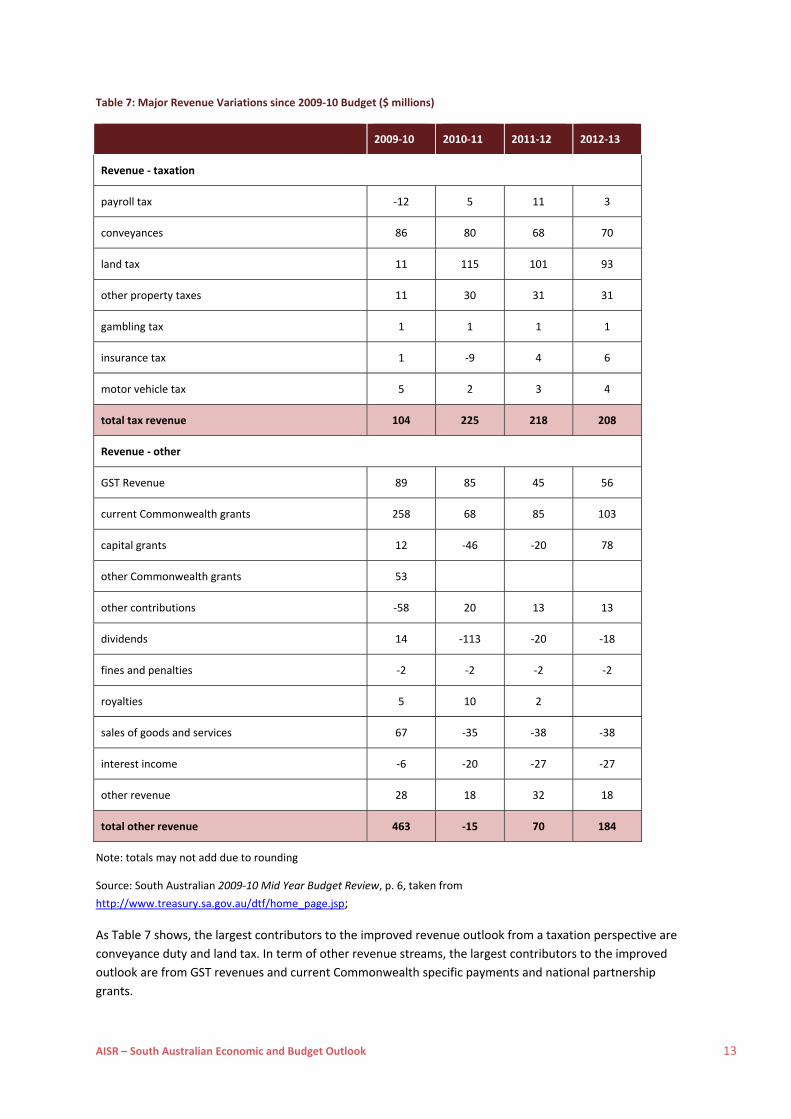
The major revenue variations since last year’s Budget are documented in Table 7 on the next page.
0
1,000
2,000
3,000
4,000
5,000
6,000
7,000
8,000
9,000
2001‐02
2002‐03
2003‐04
2004‐05
2005‐06
2006‐07
2007‐08
2008‐09
2009‐10
2010‐11
2011‐12
2012‐13
$m
Taxation Revenue and Grants Revenue, General Government Sector South Australia
Taxation Revenue Grants Revenue
AISR – South Australian Economic and Budget Outlook 13
Table 7: Major Revenue Variations since 2009‐10 Budget ($ millions)
2009‐10 2010‐11 2011‐12 2012‐13
Revenue ‐ taxation
payroll tax ‐12 5 11 3
conveyances 86 80 68 70
land tax 11 115 101 93
other property taxes 11 30 31 31
gambling tax 1 1 1 1
insurance tax 1 ‐9 4 6
motor vehicle tax 5 2 3 4
total tax revenue 104 225 218 208
Revenue ‐ other
GST Revenue 89 85 45 56
current Commonwealth grants 258 68 85 103
capital grants 12 ‐46 ‐20 78
other Commonwealth grants 53
other contributions ‐58 20 13 13
dividends 14 ‐113 ‐20 ‐18
fines and penalties ‐2 ‐2 ‐2 ‐2
royalties 5 10 2
sales of goods and services 67 ‐35 ‐38 ‐38
interest income ‐6 ‐20 ‐27 ‐27
other revenue 28 18 32 18
total other revenue 463 ‐15 70 184
Note: totals may not add due to rounding
Source: South Australian 2009‐10 Mid Year Budget Review, p. 6, taken from
http://www.treasury.sa.gov.au/dtf/home_page.jsp;
As Table 7 shows, the largest contributors to the improved revenue outlook from a taxation perspective are
conveyance duty and land tax. In term of other revenue streams, the largest contributors to the improved
outlook are from GST revenues and current Commonwealth specific payments and national partnership
grants.
AISR – South Australian Economic and Budget Outlook 14
The MYBO also states that the significant expenditure measures impacted on operating expenses over the
forward estimates period are:
1. The Adelaide Oval Redevelopment
2. Education Works Stage 2
3. Health service expenses and
4. The Targeted Voluntary Separation Program22 for public servants.
6 ECONOMIC STIMULUS PACKAGE
The strength of the Australian and South Australian economy in the midst of the global financial crisis can be
largely attributed to the economic stimulus package ‐ the Australian Government’s $42 billion Nation Building
and Job Plan23 (the Plan). As mentioned previously, the Commonwealth Budget Papers estimate that without
the Plan, Australia’s economy would have contracted by 0.7% in 2009. Instead, the economy grew by 1.4% in
2009. Furthermore, unemployment is now expected by the Australian Government to peak around 1½
percentage points less than in the absence of the stimulus; and the Government stimulus will support around
200,000 jobs Australia‐wide.24 The Plan, and its success in keeping Australia shielded from the worst of the
global financial crisis, provides a number of lessons, namely:
Unlike the response at the time of previous recessions, the Government’s quick and multi‐faceted
response at the time of the global financial crisis was instrumental in stabilising economic conditions.
In previous recessions, the Government’s actions were best characterised as too being little too late,
leading to a more protracted and deeper downturn. As a result, since the collapse of Lehman
Brothers in September 2008, while all the major advanced economies have recorded job losses,
Australia has managed to create over 107,000 jobs;25
A major emphasis of the Plan has been on infrastructure spending – spending that would not have
occurred in the absence of the Plan and which provides long term benefit.
The most recent Progress Report26 for the Plan states that at the end of 2009 nationally:
71% of the infrastructure stimulus projects are now under construction;
49,179 projects have been approved, 34,853 have commenced and more than 8,339 are complete;
$25.8 billion has been paid on targeted bonus payments, tax breaks and medium term
infrastructure27.
The components of the Plan are as follows:
One‐off cash payments ($12.2 billion);
Temporary business investment tax break for businesses buying eligible assets ($2.7 billion);
Constructing or upgrading buildings in Australian schools, universities and TAFEs ($19.3 billion)
20,000 new homes for social and defence housing ($5.9 billion)
Significantly increased funding for local community infrastructure and local road and rail projects
($3.3 billion) and
22 See http://www.treasury.sa.gov.au/dtf/home_page.jsp, Government of South Australia, Mid Year Budget Review 2009‐10, p.11 for more details. 23 For details of the Plan see http://www.economicstimulusplan.gov.au/pages/theplan.aspx. For details of project in South Australia resulting from the Plan see http://www.dtei.sa.gov.au/coordinator_general. 24 Commonwealth Coordinator‐General’s Progress Report to 31 December 2009 (2010), Australian Government National Building Economic Stimulus Plan, p.iii. 25 ibid p.6 26 ibid 27 ibid p.iv.
AISR – South Australian Economic and Budget Outlook 15
Increasing the energy efficiency of homes ($3 billion)28.
Details about individual projects in South Australia across all the components of the Stimulus Plan can be
found at http://www.dtei.sa.gov.au/coordinator_general. In aggregate, the 2009‐10 South Australian Budget
Papers stated that of the total injection from the Commonwealth’s Economic Stimulus Plan was expected to
be, “…$1.8 billion that includes funding for education ($1.3 billion), housing ($477 million) and transport ($29.0
million)”.29
In 2009‐10 alone, it is estimated that the economic stimulus spending in South Australia will generate around
11,000 jobs and will contribute $1.06 billion to South Australia’s Gross State Product.30
It is clear from the analysis above that economic stimulus measures have significant spill‐over and multiplier
effects. By implication, budget cuts like those proposed by the State Government have the potential to
suppress economic activity across a number of sectors.
7 SUMMARY OF REVENUE AND EXPENDITURE VARIATIONS FOR SA
The previous sections of this report demonstrated that economic budgetary and budgetary conditions have
improved significantly over the past year in South Australia. Manifestations of this improved outlook include:
1. Upward revisions to State revenue detailed in the Mid‐Year Budget Outlook, partially offset by
expenditure increases;
2. Upward revisions to Commonwealth GST and general revenue assistance revenues distributed to the
States
3. Increased grants to South Australia in the form of payments for economic stimulus measures.
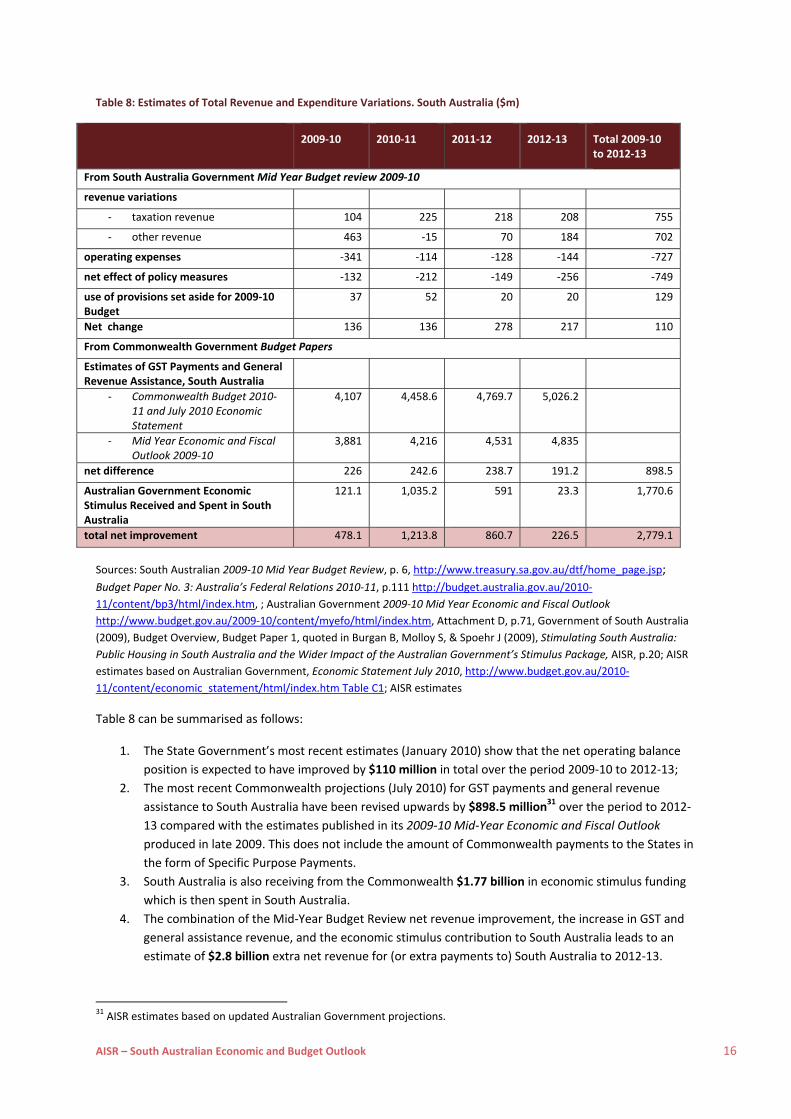
The net effect of these changes over the period to 2011‐13 is detailed in Table 8 on the next page.
28 ibid p.5 29 Government of South Australia (2009), Budget Overview, Budget Paper 1, quoted in Burgan B, Molloy S, & Spoehr J (2009), Stimulating South Australia: Public Housing in South Australia and the Wider Impact of the Australian Government’s Stimulus Package, AISR, p.20 30 ibid
AISR – South Australian Economic and Budget Outlook 16
Table 8: Estimates of Total Revenue and Expenditure Variations. South Australia ($m)
2009‐10 2010‐11 2011‐12 2012‐13 Total 2009‐10
to 2012‐13
From South Australia Government Mid Year Budget review 2009‐10
revenue variations
‐ taxation revenue 104 225 218 208 755
‐ other revenue 463 ‐15 70 184 702
operating expenses ‐341 ‐114 ‐128 ‐144 ‐727
net effect of policy measures ‐132 ‐212 ‐149 ‐256 ‐749
use of provisions set aside for 2009‐10 Budget
37 52 20 20 129
Net change 136 136 278 217 110
From Commonwealth Government Budget Papers
Estimates of GST Payments and General Revenue Assistance, South Australia
‐ Commonwealth Budget 2010‐11 and July 2010 Economic Statement
4,107 4,458.6 4,769.7 5,026.2
‐ Mid Year Economic and Fiscal Outlook 2009‐10
3,881 4,216 4,531 4,835
net difference 226 242.6 238.7 191.2 898.5
Australian Government Economic Stimulus Received and Spent in South Australia
121.1 1,035.2 591 23.3 1,770.6
total net improvement 478.1 1,213.8 860.7 226.5 2,779.1
Sources: South Australian 2009‐10 Mid Year Budget Review, p. 6, http://www.treasury.sa.gov.au/dtf/home_page.jsp;
Budget Paper No. 3: Australia’s Federal Relations 2010‐11, p.111 http://budget.australia.gov.au/2010‐
11/content/bp3/html/index.htm, ; Australian Government 2009‐10 Mid Year Economic and Fiscal Outlook
http://www.budget.gov.au/2009‐10/content/myefo/html/index.htm, Attachment D, p.71, Government of South Australia
(2009), Budget Overview, Budget Paper 1, quoted in Burgan B, Molloy S, & Spoehr J (2009), Stimulating South Australia:
Public Housing in South Australia and the Wider Impact of the Australian Government’s Stimulus Package, AISR, p.20; AISR
estimates based on Australian Government, Economic Statement July 2010, http://www.budget.gov.au/2010‐
11/content/economic_statement/html/index.htm Table C1; AISR estimates
Table 8 can be summarised as follows:
1. The State Government’s most recent estimates (January 2010) show that the net operating balance
position is expected to have improved by $110 million in total over the period 2009‐10 to 2012‐13;
2. The most recent Commonwealth projections (July 2010) for GST payments and general revenue
assistance to South Australia have been revised upwards by $898.5 million31 over the period to 2012‐
13 compared with the estimates published in its 2009‐10 Mid‐Year Economic and Fiscal Outlook
produced in late 2009. This does not include the amount of Commonwealth payments to the States in
the form of Specific Purpose Payments.
3. South Australia is also receiving from the Commonwealth $1.77 billion in economic stimulus funding
which is then spent in South Australia.
4. The combination of the Mid‐Year Budget Review net revenue improvement, the increase in GST and
general assistance revenue, and the economic stimulus contribution to South Australia leads to an
estimate of $2.8 billion extra net revenue for (or extra payments to) South Australia to 2012‐13.
31 AISR estimates based on updated Australian Government projections.
AISR – South Australian Economic and Budget Outlook 17
8 CREDIT RATINGS
One of the justifications that the State Government has used for the $750 million cuts relates to the threat of a
downgrading of South Australia’s AAA Credit Ratings by Standard and Poor’s and Moody’s32.
The Sustainable Budget Commission argues that “a lower credit rating for South Australia would directly increase Government borrowing costs, borne by taxpayers. Other indirect costs of a ratings downgrade potentially would be more important. A triple‐A credit rating tells investors the Government is managing the State’s finances and economy in a responsible manner. It’s an indicator of a stable investment environment”.33 Regardless of the merits of reducing debt to achieve an arbitrary net financial liabilities to revenue ratio set by credit ratings agencies, the reality is that South Australia is in a much improved financial position than was predicted when the savings targets were announced. Furthermore, Standard and Poor’s have acknowledged in their most recent assessment of South Australia that: “Like most states, South Australia has a history of capital expenditure under‐spending and is therefore less likely to achieve its forecast debt levels.34 The risk of a credit downgrade has been significantly reduced by the improved economic and financial outlook. There is no realistic prospect of a credit downgrade given current economic and budgetary conditions. Of greater concern is the potentially negative impact on public service delivery of a rapidly accelerating retirement rate flowing from the combination of public sector workforce ageing and the proposed public sector employment reductions. This could deny elements of the public service the skills and capabilities that are required to sustain existing service levels.
32 See Government of South Australia (2009), Sustainable Budgets: Principles and Processes, First Report by the Sustainable Budget Commission, 33 Ibid, p.15 34 Standard & Poor’s press release, “BULLETIN South Australia’s AAA/A‐1+ Ratings Unaffected by State Budget”, June 4 2009