research report on kajaria ceramics
TRANSCRIPT
1
Kajaria Ceramics is the largest manufacturer of ceramic/vitrified
tiles in India. It has an annual aggregate capacity of 54.10 mn. sq.
meters, distributed across seven plants-Sikandrabad in Uttar
Pradesh, Gailpur in Rajasthan, four plants in Morbi in Gujarat and
one at Vijayawada in Andhra Pradesh. The manufacturing units
are equipped with cutting edge technology. Intense automation,
robotic car application and a zero chance for human error are
just few reasons why Kajaria remains at the top in the industry.
Kajaria Ceramics has increased its capacity from 1 mn. sq. mtrs to
54.10 mn. sq. mtrs. in last 25 years and offers more than 1200 options in ceramic wall & floor tiles, vitrified tiles, designer tiles
and much more. These tiles come in a wide range of colours and textures to complement bathrooms, living rooms, corridors,
study rooms & kitchen, born our of an inspired creativity of those who feel that rooms should be an extension of the beauty
reflected. With an unparalleled commitment towards quality we have strived to adopt technologies and standards with the
changing times.
Equity Statistics
Current Market Price Rs. 566.85
52 Week High/Low -NSE Rs. 686.50/228.50
Market Capitalization Rs. Crore 4513.84
P/E Times 31.34
Industry PE Times 39.59
Book Value Rs. 62.08
Annual Financial Snapshots
Income Statement FY14 FY13 FY12
Net Sales (Rs. Crore) 1877.89 1588.20 1401.76
Growth in Net Sales (%) 18.24% 13.30% 39.53%
Networth (Rs. Crore) 517.58 356.79 281.90
Growth in Networth (%) 45.06% 26.56% 26.65%
Per Share Data
Book Value (Rs.) 65.17 48.49 38.31
Growth in Book Value (%) 34.39% 26.57% 26.64%
Earning Per Share (Rs.) 15.45 13.66 10.97
Growth in EPS (%) 13.10% 24.52% 33.13%
Key Financial Ratios
Return on Capital Employed (%) 33.18% 32.56% 34.50%
Current Ratio 0.71 0.58 0.93
Long Term Debt Equity Ratio 0.17 0.25 0.33
Interest Coverage (times) 5.88 4.48 3.47
Debtors Turnover Ratio 11.93 11.2 11.01
Inventory Turnover Ratio 9.53 7.34 7.04
No. of Independent Directors - 5
Management - Kajaria Ceramics
Name Designation
Ashok Kajaria Chairman & Managing Director
Rishi Kajaria Joint Managing Director
Sandeep Singhal Independent Director
D P Bagchi Independent Director
H Rathnakara Hegde Independent Director
Chetan Kajaria Joint Managing Director
B K Sinha Director - Technical
R K Bhargava Independent Director
R R Bagri Independent Director
M/s O P Bagla & Co. Charted Accountant
Share Holding Pattern in (%)
MAR' 14 DEC' 13 NOV' 13 SEP' 13
Promoter 52.09 52.09 52.09 53.51
FII 25.53 25.61 24.25 23.5
DII 3.94 3.78 1.35 1.45
Others 18.44 18.52 22.31 21.54
Total 100 100 100 100 Mutual Funds Holding as on 30th Sep 2014
Scheme Shares Price (in Rs.)
HDFC Equity Fund (G) 18,87,508 635.59
SBI Magnum Global Fund (G) 6,11,324 635.76
SBI Infrastructure Fund - Series I (G) 3,06,476 635.61
DSP BlackRock Tax Saver Fund (G) 2,40,872 635.6
Returns 1M 3M 6M 1Y
Kajaria -8.84% -5.11% 30.30% 143.91%
KAJARIA CERAMICS
Ceramics/Granite Fundamental Analysis NSE Code: KAJARIACER December 30, 2014

2
Peer Comparison (Year Ended -March 14)
Somany HSIL CERA Kajaria
Equity (Rs. Cr.) 7.26 13.21 6.33 15.12
BV 5.32 169.8 176.98 65.17
Face Value 10 2 5 2
Dividend - 150% 100% 175%
Promoters Holding 25.81% 51.57% 56.17% 52.09%
RONW -91.55% 5.01% 23.17% 23.70%
ROCE -42.50% 8.10% 33.35% 35.10%
Debt to Equity 0.94 0.82 0.19 0.12
Market Cap/Sales 0.62 1.43 3.17 2.57
P/E 35.57 33.12 35.29 31.34
Industry P/E 39.59
P/Bv 5.57 2.22 9.37 9.67
Quarterly Financial
Q2FY14 Q1FY14
Sep-14 Jun-14
Sales (Rs. Cr) 546.97 511.94
Growth in Sales (% Change) 15.35% 18.27%
Net Profit (Rs Crore) 39.22 36.34
Net Profit (% Change) 59.56% 51.48%
EPS 5.24 4.81
Growth in EPS 8.93% -8.20%
Promoter and Promoter Group Holding as 30th
Sept 2014
No. Name of the Shareholders Total Shares Held
Number %
1 Kajaria Exports Ltd 15,311,999 20.26
2 Kajari Securities Pvt Ltd 6,581,905 8.71
3 Cheri Ceramics Pvt Ltd 5,088,385 6.73
4 Pearl Tile Marketing Pvt Ltd 5,080,240 6.72
5 Ashok Kumar Kajaria 2,053,500 2.72
6 Versha Devi Kajaria 1,200,007 1.59
7 A.K Kajaria HUF 955,375 1.26
8 Rishi Kajaria 902,858 1.19
9 Chetan Kajaria 669,940 0.89
10 Rasika Kajaria 902,858 1.19
11 Shikha Kajaria 300,000 0.40
12 Kartik Kajaria 225,106 0.30
13 Parth Kajaria 225,000 0.30
14 Raghav kajaria 225,000 0.30
15 Vedant Kajaria 225,000 0.30
16 Rishi Kajaria (HUF) 21,500 0.03
17 Chetan Kajaria (HUF) 21,000 0.03
Total 39,371,815 52.03
Top Public Shareholders as on 30th
Sept 2014
No. Name of the Shareholders Total Shares Held
Number %
1 HSBC (Mauritius) Ltd 6,321,005 8.36
2 Swiss Finance Corporation (Mauritius) Ltd 3,257,538 4.31
3 Government Pension Fund Global 2,500,000 3.31
4 HDFC Trustee Company Ltd – HDFC Equity Fund 2,160,896 2.86
5 Westbridge Crossover Fund LLC 2,000,000 2.65
6 Macquarie Bank Ltd 1,925,118 2.55
Total 1,81,64,557 24.04
Latest Large Deal – in December 2014
Date Exchg. Qty Price Value (Cr)
Time
30.12.2014 NSE 100119 565 5.66 10:26
29.12.2014 NSE 100000 565 5.65 13:38
24.12.2014 NSE 291985 558 16.29 15:24
24.12.2014 BSE 100000 559 5.59 15:29
24.12.2014 NSE 100000 559 5.59 14:24
17.12.2014 BSE 200000 547 10.94 11:06
17.12.2014 NSE 100007 549 5.49 11:06
15.12.2014 BSE 100000 565 5.65 15:28
12.12.2014 NSE 100000 578 5.78 14:49
11.12.2014 NSE 99763 579 5.78 15:09
2.12.2014 NSE 164000 595 9.76 10:57
1.12.2014 BSE 310150 592 18.36 10:20
Total Quantity 1766024 568 100.54
Note:- No shares are pledged from the promoters and company
reported on 4th
Nov 20154 to the exchange that 38,85,420 equity
shares have allotted to M/s WestBridge Crossover Fund LLC (on
conversion of warrants in to equity shares) vide resolution passed
by the Board of the Directors on 27th
Oct 2014. As per the large
deals concern 17,66,024 shares traded on NSE and BSE on the
average price of Rs. 568 with value 100.54 Cr in December 2014.
3
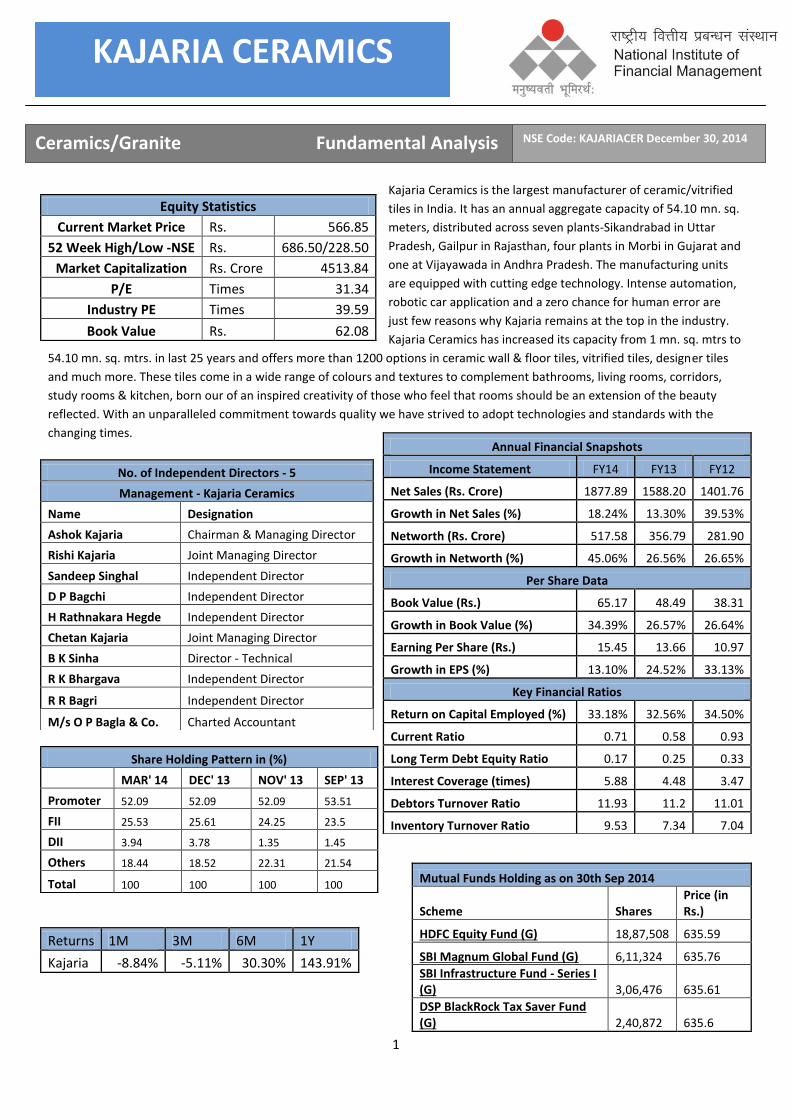
Kajaria gave the return of 143.91% in last 1 year and Index – Nifty gave only return of 31.77% in last 1 year.
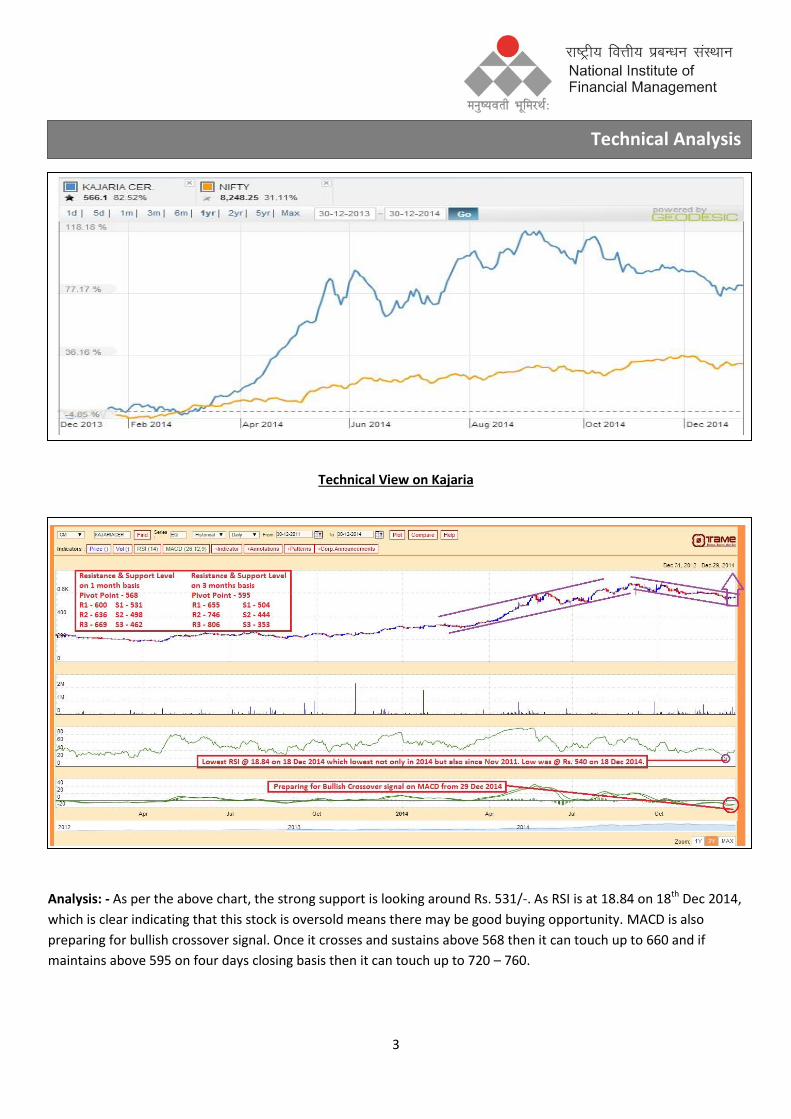
Technical View on Kajaria
Analysis: - As per the above chart, the strong support is looking around Rs. 531/-. As RSI is at 18.84 on 18th Dec 2014,
which is clear indicating that this stock is oversold means there may be good buying opportunity. MACD is also
preparing for bullish crossover signal. Once it crosses and sustains above 568 then it can touch up to 660 and if
maintains above 595 on four days closing basis then it can touch up to 720 – 760.
Technical Analysis

4
DISCLOSURES
The report is circulated for academic / research purpose only.
The paper is issued by Financial Market Wing of NIFM under the supervision of Dr. AM Sherry, Professor & Course Director Circulated by National Institute of Financial Management Address: National Institute of Financial Management, Sector – 48 , Pali Road, Near Badkhal Village, Faridabad – 121 001, Haryana, India www.nifm.ac.in