research performance progress report u.s. department …
TRANSCRIPT

RESEARCH PERFORMANCE PROGRESS REPORT
U.S. Department of Energy National Energy Technology Laboratory
Cooperative Agreement: DE-FE0031558
Project Title: Partnership for Offshore Carbon Storage Resources and Technology Development in the Gulf of Mexico
Principal Investigator: Dr. Susan Hovorka
PH: 512-471-4863 [email protected]
Co-Principal Investigator: Dr. Tip Meckel
PH: 512-471-4306 [email protected]
Co-Principal Investigator: Mr. Ramon Trevino
PH: 512-471-3362
Submission Date: April 30, 2019
DUNS Number: 170230239 The University of Texas at Austin
Jackson School of Geosciences Bureau of Economic Geology
University Station, Box X Austin, Texas, 78713
Project Period: April 1, 2018 – March 31, 2023
Reporting Period End Date: March 31, 2019
Report Frequency: Quarterly
Signature Submitting Official: _______________________________

EXECUTIVE SUMMARY OF RESEARCH DEVELOPMENTS DURING THIS QUARTER
Contracts for services and augmented funding were signed and executed. A geophysics post-doc was interviewed but not chosen for the position. Several items were ordered for future high resolution 3D (HR3D) seismic surveys. Two graduate students at the UT Jackson School of Geosciences accepted graduate research assistantships for the fall 2019 semester.
On February 11 and 12, 2019, GoMCarb and its sister Partnership, SECARB Offshore, held their first annual meeting on the campus of Lamar University in Beaumont, Texas. The meeting included a full day of formal presentations and a half day field trip. The meeting also included an internal Partners’ meeting attended by each, respective, Partnership’s members.
All seismic and well databases underwent a project database upgrade consisting of new geologic application suites with enhanced geologic workflows. In the Chandeleur Sound 3D seismic dataset, faults were mapped on the basis of seismic expression in section and horizontal slice views. In addition, initial “seed” horizons were interpreted at regularly spaced intervals.
In the High Island area, geologic characterization of a portion of the TexLa Merge regional 3D dataset was used to generate a static geological model of the area extending outward from the High Island 24L Field. The static geologic model was transferred to LLNL (Lawrence Livermore National Laboratory. LLNL generated a simulation mesh for the High Island 24L target based on fault and horizon surfaces provided by BEG.
Current findings from LBNL (Lawrence Berkeley National Laboratory) indicate that offshore and onshore CO2 well blowouts and high-pressure pipeline loss-of-containment (LOC) incidents will be very similar in terms of intra-well and intra-pipeline flow and phase-change processes. The main differences will arise from differences in how CO2 is transported after discharge from the well/pipe onshore above ground versus offshore in the water column. LBNL also reports that the ability to simulate CO2 migration and storage in heterogeneous formations requires understanding of the fundamental dynamic processes: channeling, invasion, lateral spreading and breakthrough (CISB) of supercritical CO2.
Research in the MVA effort continued to evaluate the potential of marine DAS (distributed acoustic sensing) for GCS (geological carbon sequestration) monitoring. LBNL explored data extraction and processing approaches using a seafloor passive DAS dataset acquired off the northern California coast in 2018. Lamar University worked on a literature survey of CO2 pipeline design and monitoring technologies for large-scale CO2 storage projects.
At a high level, there appears to be an alignment of interests and incentives to re-use existing oil and gas infrastructure in applications such as CO2 storage offshore. In order to assess the potential for oil and gas infrastructure re-use, an overall research approach was defined and summarized as a simplified workflow. In the previous quarter (Q4 2018), specific information for the High Island 10-L offshore lease block (well and pipeline data) was introduced as a proxy or test case to develop infrastructure re-use screening methodologies.
Lamar University hosted a teacher STEM workshop (Jan. 17, 2019) demonstrating carbon management technologies that are capable of lowering CO2 point source emissions. Using the teacher module “CO2 – Too Much of a Good Thing?” PI, Dr. Susan Hovorka, was interviewed for a podcast (1.5 hrs) by The American Shoreline.
Task 1.0 – Project Management, Planning, and Reporting Contracts for services and augmented funding were signed and executed. A geophysics post-doc was interviewed but not chosen for the position. Several items were ordered for future high resolution 3D (HR3D) seismic surveys. Two graduate students at the UT Jackson School of Geosciences accepted graduate research assistantships for the fall 2019 semester. First Annual Partnership Meeting
On February 11 and 12, 2019, the first two DOE-funded carbon capture and storage (CCS) partnerships to research offshore geological carbon storage met to discuss progress and future plans. This was the partnerships’ first annual meeting. Monday February 11, was devoted to partnership updates. In addition, several international CCS researchers and project managers comprised an international panel input, which provided an international perspective to offshore geo-sequestration. The international panel was led by Tim Dixon of IEAGHG who set the stage by sharing the importance of GoMCarb in the international deployment of carbon capture and offshore storage. While only four countries are currently actively storing CO2 offshore (Norway, Netherlands, Brazil, and Japan), projects in these countries have demonstrated viability of storage in areas where offshore is preferred over onshore sites. K12-B in the Netherlands was the first site in the world where CO2 was injected into the same reservoir from which it originated. The project utilizes a still-productive natural gas platform in the North Sea and has operated for 12 years without incident. In the Lula Oil Fields of Brazil, a CO2-EOR and storage operation takes place as part of a floating production, storage, and offloading (FPSO) offshore facility. Seven megatons have been injected as of December 2017. The CarbonNet project in Australia is investigating the feasibility of a commercial-scale, multi-user CCS network.
Philip Ringrose (Equinor) provided (via conference call) an overview of Norway’s three large offshore CCS projects, Sleipner, Snøhvit, and Northern Lights, which have stored more than 22 megatons of CO2 in 22 years of operation. Looking forward, scientists and strategists are setting their sights on a regional hub that could be a catalyst for CCS and CO2 value chains in Europe.
Jiro Tanaka and Ziqiu Xue reviewed the progress of CO2 injection at the Tomakomai CCS full-chain project in a busy port area of northern Japan. The Japanese project has injected >200,000 tonnes of anthropogenic CO2 captured from a nearby hydrogen production unit at an oil refinery. After 2.5 years of operation, the region experienced a non-project-related earthquake with a magnitude of 6.7 and an epicenter depth of 37 kilometers. After a two-month pause, the CCS project resumed injecting after confirmation that CO2 containment was not affected. The researchers presented data and results from their offshore monitoring before, during, and after the earthquake. There was no leakage from the reservoir or damage to the facilities.
Andrew Jupiter, former permanent secretary of the Ministry of Energy and Energy Industries for Trinidad and Tobago and now distinguished fellow at the University of the West Indies, discussed the potential of CCS to sustain the country of Trinidad and Tobago while simultaneously decreasing greenhouse gas emissions that put the small, natural-disaster-prone Caribbean island nation at risk. Andrew stated that, after exploring several mitigation options, CCS stands to be their best option. More than 80% of the country’s emissions originate from the petrochemical and power sectors (56% and 27%, respectively.) Within the larger petrochemical sector, more than 80% of greenhouse gases originate from ammonia and methanol production. The best CO2 sources to target (largest and most highly concentrated) are from ammonia synthesis (4 million metric tonnes annually) and process emissions from Atlantic (1 million metric tonnes per annum). The twin island republic is addressing this concern through innovative collaborations with government energy institutions toward sustainable development of known oil reserves using their Carbon Dioxide Enhanced Oil Recovery Road Map (CERM).

Susan Hovorka, senior research scientist at the Gulf Coast Carbon Center (GCCC), presented “Seeking First Projects in the U.S. Offshore” to provide context for the GoMCarb partnership. Essentially, deep saline geologic storage beneath near-shore waters contributes a significant amount of storage capacity to the U.S. while simultaneously reducing multiple risks associated with onshore storage. This is not only the case for national emission offsets. Rather, it’s a globally underused resource that’s available offshore of every continent, especially where a continental margin sedimentary wedge is thick and near offshore oil and gas industry infrastructure can be re-purposed for CO2 storage, saving time, energy, and most importantly, money and environmental impact. Hovorka posed the question, “Are we ready for investment in the U.S.?”, while presenting a slide showing the various projects, ranging from planning to complete deployment in Europe, Japan, China, and Australia.
Ramon Trevino (GCCC program manager) provided an overview of the GoMCarb Partnership’s scope of work, partners, available datasets, previous work and current research. Other GoMCarb research and outreach members gave short progress updates. Reynaldy Fifariz (GCCC) showed current detailed analyses of the analog High Island focus area, a geologically-representative reservoir within the GoM region of focus. Marcie Purkey Phillips (UT GBDS – Gulf Basin Depositional Synthesis) presented the integrated approach being utilized for the Chandeleur Sound focus area (i.e., biostratigraphy, wireline wells logs interpretation, seismic interpretation). Hilary Olson (UT PGE – Petroleum & Geosystems Engineering) discussed the project’s stakeholder communication and public outreach plan. Darshan Sachde of Trimeric reviewed CO2 transport infrastructure and scenario optimization from source to the wellhead. Quanlin Zhou (LBNL – Lawrence Berkeley National Lab) presented CO2 storage modeling and flow migration in heterogeneous saline formations. Curt Oldenburg (LBNL – Lawrence Berkeley National Laboratory) discussed (via conference call) simulations of onshore and offshore CO2 well blowouts. Jonathan Ajo-Franklin (LBNL) presented an overview of integrated seismic MVA, including DAS (distributed acoustic sensing) and persistent sources. Joshua White (LLNL – Lawrence Livermore National Laboratory) reviewed geo-mechanical risk assessment including rock deformation responses to injection.
The morning portion of the second day of the partnership meeting consisted of a field trip. The field trip group stopped at Walter Umphry State Park at the southern end of Sabine Lake and across a bridge from the Cheniere LNG (liquefied natural gas) facility in Cameron Parish, Louisiana (Figure 1.1). The discussion centered on modern geologic depositional systems as analogs for subsurface reservoirs that comprise the proposed geological storage capacity of the Gulf of Mexico. The specific topic was the Chenier Plain in southwest Louisiana. The root of the word, Chenier—chêne—means “oak” in French and chenier means “place of the oaks” because oaks prefer growing on the sandy beach ridges of the plain as opposed to the intervening marsh.

Figure 1.1 – Satellite map of the two field trip stops, Walter Umphrey State Park (TX) and Cheniere LNG Terminal (Cameron Parish, LA).
The paleo-beach ridges of the Chenier Plain resulted from progressive deltaic sedimentation and reworking of deltaic sediments by longshore currents over the past 3,000 years in the Sabine Pass area and points east.
At Walter Umphry State Park in Jefferson County, Texas, (Figure 1.2) Dr. Robert Finley, who retired from the Illinois State Geological Survey and is currently an advisory committee member of and consultant for the GoMCarb partnership, presented the geologic history of shoreline and fluvial-deltaic geology with Dallas Dunlap and Ramon Trevino offering support. His talk titled, “A Brief Look at the Role of Gulf Coast Geology in Effective Carbon Dioxide Storage: Analogs and Insights,” explored the Sabine Delta’s and the migrating Sabine Pass Channel’s role in accumulating ridges of sand that result in the landscape “striping” visible in aerial photos (strandplain deposits) (Figure 1.1).

Figure 1.2 – Group photo at Walter Umphrey State Park, stop 1 on the field trip. Note the facility in the background is the Cheniere LNG plant (stop 2) in Cameron Parish, LA.
Finley explained how the regional geology and its depositional heterogeneity may affect reservoir capacity in a CO2 storage project. The reservoirs in this region that would be targeted are lower- to middle-Miocene age fluvial deltaic and shore-parallel sediments which form a 1,500-foot thick sand package deposited 16 to 22 million years ago. The target sand package is overlain by a major transgressive unit, the Amphistegina B shale, which would form an areally extensive, regional seal for stored CO2. Geologists assessing any near-offshore Gulf of Mexico CO2 storage project will need to consider the areal and vertical extent of individual sandstones that form channel deposits or form ridges, such as found in the modern Chenier Plain. Changes in sandstone morphology and sediment type can result in flow barriers or baffles which in turn can impact injection pressure and storage capacity.
The field trip handout (Figures 1.3-1.6) and posters presented during the Umphry State park stop provided an overview of the role of depositional systems in macro-reservoir characteristics:

Figure 1.3 – Page 1 of field trip handout.

Figure 1.4 – Page 2 of field trip handout.

Figure 1.5 – Page 3 of field trip handout.

Figure 1.6 – Page 4 of field trip handout. Cheniere facility tour
Next stop on the Tuesday morning field trip was to Cheniere LNG’s Sabine Pass liquefaction project, or SPL project, nearby. Cheniere purchases natural gas from multiple sources, processes the natural gas into liquefied natural gas (LNG) and offers it at their facility port for customer pick up or transports it to regasification facilities around the world.
Cheniere Energy states that their company is the leading producer of LNG in the U.S. and is expected to be the top five producer globally by 2020. More than 500 cumulative cargoes have been shipped to 30 countries and regions worldwide.
After viewing a presentation on the company, their facilities and the science behind their process while eating lunch, a Cheniere representative answered a variety of questions from our group (Figure 1.7).

Figure 1.7 – Field trip group photo at the Cheniere LNG facility, Cameron Parish, Louisiana. Note the Cheniere company logo in the background, which represents the Chenier Plain on which the facility is built (also Figure 1.1).
Afterwards, another Cheniere representative gave us a tour of the facilities by bus. We viewed their gas-fired turbines, their supercooled refrigerated tanks for their step refrigeration process to liquefy the gas that includes propylene, ethylene, and methane refrigerants. Six liquefaction units (or “trains” as they’re known in the industry) are on the property. The land they acquired on the Louisiana coast allows room for growth and capacity expansion.
Just one of the several 183-feet-tall storage tanks on the 1,000-acre-plus property along Sabine Pass Channel holds approximately 27 million metric tons or about 3.4 billion cubic feet equivalent (BCFE) of LNG. One of these tanks is the equivalent amount that one ship cargo will transport from their terminal. It takes about 20-30 hours to fill a ship, which happens about six times per week, varying with the outside temperature (cooler temperatures produce more.)
With the 45Q U.S. federal tax credit now being used, one of the representatives suggested that their strategy personnel may review if carbon storage may be a future option for their company.
Afternoon working group sessions
The GoMCarb and SECARB Offshore Partnerships met separately to discuss and plan their research plans for the coming year. The GoMCarb research and outreach group shared informal updates with open discussions on their progress for each of the project tasks: resource characterization; risk assessment, simulation, and modeling; monitoring, verification, and assessment; infrastructure, operations, and permitting; and outreach.

Task 2.0 – Offshore Storage Resource Assessment
Subtask 2.1 – Database development: Subtask 2.1.1 – Geographic Focus Area A - Lake Jackson, Lake Charles, and Lafayette (OCS) districts
Conventional 3D Seismic During the recent reporting quarter, all seismic and well databases underwent a project database upgrade consisting of new geologic application suites with enhanced geologic workflows. Primarily this consisted of an Oracle database upgrade from Oracle 11 to Oracle 12. All user Windows and Linux systems were scheduled for migration and software upgraded. At the completion of the upgrade process, all related projects were validated for a successful data migration. Training on the new software functionality was performed with all students and research staff with no identified complications.
BOEM public datasets were downloaded to the GoMCarb BEG database and incorporated to the regional data-lake. This included 75 NW-SE oriented dip lines along the middle to upper Texas shelf, which linked state waters to the continental shelf edge in OCS waters. Two additional 3D seismic surveys were incorporated into the area to the east (West Cameron_Fairfield) and southeast (WestCameron_BOEM) of the Texla Merge seismic dataset (Figure 2.1.1.1). Other newly released seismic volumes were downloaded but not incorporated into the existing project as they are located south of the expanded study area or in deep-water environments (far beyond state waters).
Figure 2.1.1.1 – Map of Texas-Louisiana state waters with incorporated 3D seismic surveys.
Subtask 2.1.2 – Geologic Characterization of Chandeleur Sound, LA
Faults were first mapped on the basis of seismic expression in section and horizontal slice views. These uncorrelated fault segments were picked methodically throughout the 3D seismic volume. Semblance horizontal slices were used in the initial structural interpretation phase because this technology allows a mathematical assessment of the seismic data without being biased by previous interpretation. Semblance calculations compare waveform similarity between adjacent traces. Traces within a specified time window (40 ms) are cross-correlated with neighboring traces. The lowest correlation coefficient calculated will be assigned to the central sample.
Semblance values range from +100 to -100. A value of +100 indicates a perfect match between adjacent traces. Semblance values near +100 indicate no lateral variations in stratigraphy or structure, indicating zones of rock homogeneity. A value of -100 indicates significant trace similarity if the phase of one of the waveforms is inverted. This condition could be an indicator of offset (faulting) within the reference window. In addition, low semblance values (negative) may indicate significant lateral changes in rock type, pore fluid content, facies, fracturing, or any geologic parameter that can affect seismic reflection wave shapes. Fault segments are more pronounced on semblance horizontal slices (Figure 2.1.2.1) relative to conventional amplitude horizontal slices (Figure 2.1.2.2). Horizontal slices of the semblance volume, start-ing at 0 ms, were generated at 4 ms intervals for the entire 3D seismic volume. Fault segments were identified and mapped across horizontal slices at 100 ms intervals (Figure 2.1.2.3). The finer detailed horizontal slices (4 ms) were occasionally utilized to constrain fault plane correlations in more complex areas.

Figure 2.1.2.1 - Semblance attribute horizontal slice at 1300 ms.
Proprietary data redacted

Figure 2.1.2.2 - Amplitude attribute horizontal slice at 1300 ms.
Proprietary data redacted

Figure 2.1.2.3 Semblance attribute horizontal slice at 1300 ms, with fault interpretations (colored). Horizon Interpretation
Initial “seed” horizons were interpreted at regularly spaced intervals, then further constrained by arbitrary lines that closely flanked the fault planes to ensure maximum surface correlations. Seed horizons were interpreted up to the fault plane, but did not cross it (Figure 2.1.2.4). This provided gaps in the interpreted seed horizons that were used to calculate heaves and subsequently used to create intricate fault polygon maps associated with each surface. When sufficient coverage was obtained, the seed horizons were interpolated using a modest 11 x 11 trace smoothing filter. The related fault polygon files were then used to delete all interpolated picks within the interpreted fault polygons. Figure 2.1.2.5 is the interpreted two-way time structure map for the seed horizon H1. Figures 2.1.2.6 and 2.1.2.7 are the interpolated horizons generated from the initial seed horizons (H1 and H2).
Proprietary data redacted

Figure 2.1.2.4 - Arbitrary North-South cross section of the Chandeleur Sound 3D seismic volume with seed horizons H1 (red) and H2 (green) interpreted. Fault interpretations are colored maroon.
Proprietary data redacted

Figure 2.1.2.5 - Initial seed two-way time horizon H1. Fault polygons are in orange. Wells are posted in black.
Proprietary data redacted

Figure 2.1.2.6 - Interpolated two-way time structure map of horizon H1. Interpreted fault polygons are in orange.
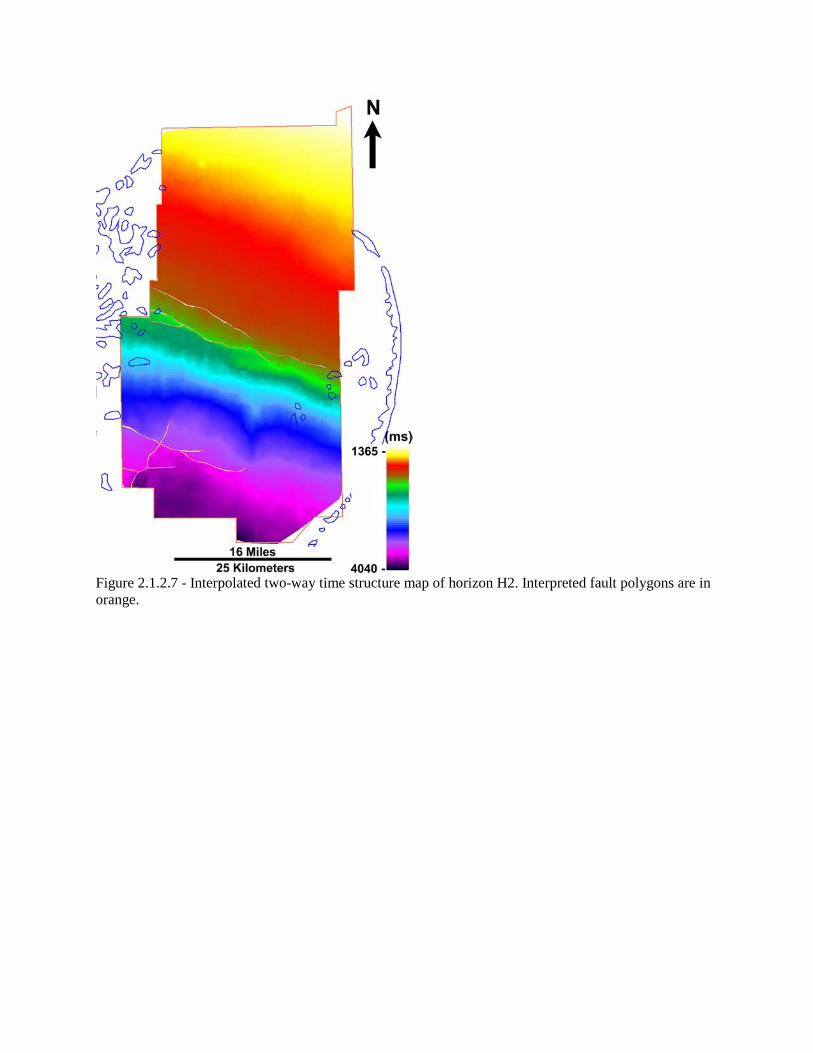
Figure 2.1.2.7 - Interpolated two-way time structure map of horizon H2. Interpreted fault polygons are in orange.

Subtask 2.1.3 Geologic Characterization of High Island, TX
General progress on re-processing and improving the utility of HR3D survey
(The following work to improve HR3D surveys was conducted in conjunction with DE-FE0026083. The, results, thereof, will be available to the GoMCarb Partnership.) The Partnership has access to three HR3D (high-resolution 3D) survey datasets within the greater High Island area of interest (Figure 2.1.3.1). Internally, the datasets are informally named GOM2012, GOM2013, and GOM2014 because they were acquired in the Gulf of Mexico (GOM) in 2012, 2013 and 2014, respectively.
Figure 2.1.3.1 - Map of the southeast Texas coastal region showing the locations of three HR3D (P-Cable) surveys within the study area. The outline of the 2012 survey is shown in black, the 2013 survey in yellow and the 2014 survey in orange. Note the outline of the city of Houston in dark gray and the boundary (red line) between State and Federal waters.

22
This quarter progress encountered several setbacks with the discovery of previously unknown problems which seem to cause data loss and data quality problems. In addition, the database for shot-receiver-cdp information became corrupted and had to be re-built delaying the work for several weeks.
The errors are of post GPS processing and small errors due to the hydrophone positions were further examined, and several new issues have been discovered.
New Problems Discovered
Missing data
Previously, the footprint of the survey and the banded phase shifts were discussed as possibly being positional problems. It was discovered that 5-8% or the shots were being dropped from the processing due to a geometry problem. These shots were never binned correctly, which resulted in them being omitted during the data stacking processing step (Figure 2.1.3.2). This may have contributed to the foot print problems as well as data gaps.
Figure 2.1.3.2: Geometry diagram of GOM2012 showing missing data; shots are the black dots and the receivers are pink.
The problem came from a property called “Shot-Receiver Relationship” which was missing for the affected shots. Rebuilding the database brought this information to light as the missing shots never were assigned a cdp (common depth point) location.
Data Values
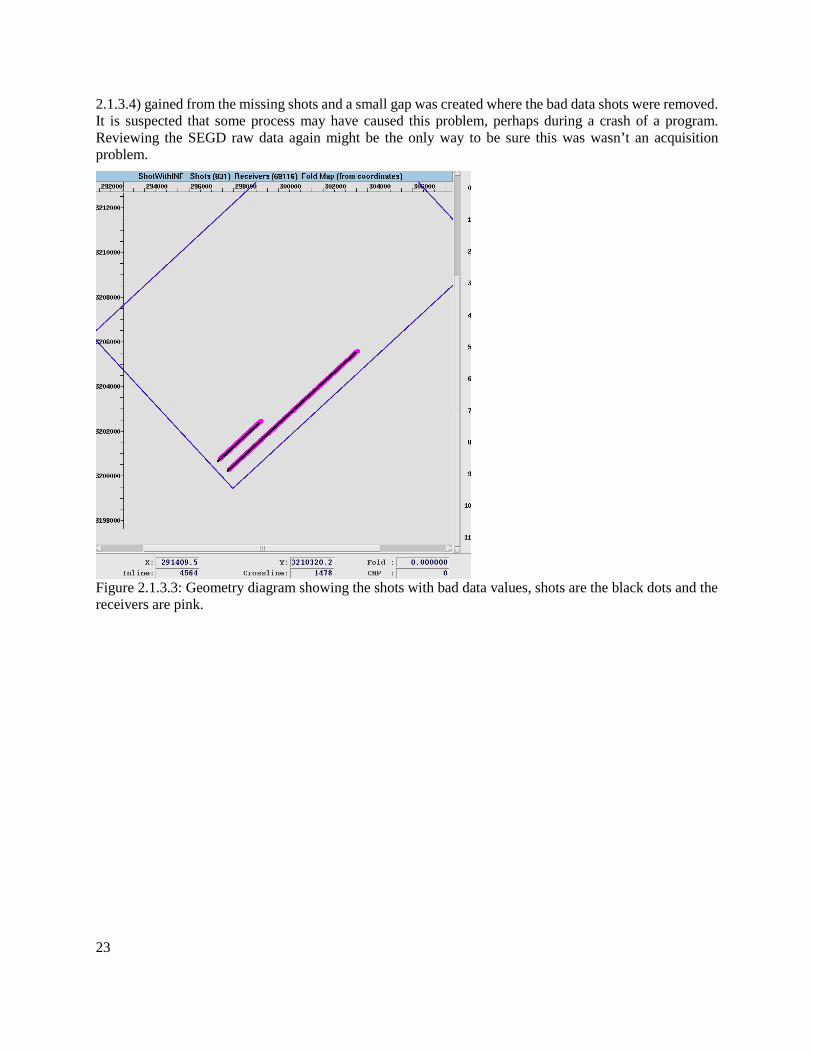
Shots were found containing all zeros and -inf (negative infinity?) values (Figure 2.1.3.3). When these data were combined with regular data the amplitude variations were distorted. The resulting fold map (Figure
23
2.1.3.4) gained from the missing shots and a small gap was created where the bad data shots were removed. It is suspected that some process may have caused this problem, perhaps during a crash of a program. Reviewing the SEGD raw data again might be the only way to be sure this was wasn’t an acquisition problem.
Figure 2.1.3.3: Geometry diagram showing the shots with bad data values, shots are the black dots and the receivers are pink.
24
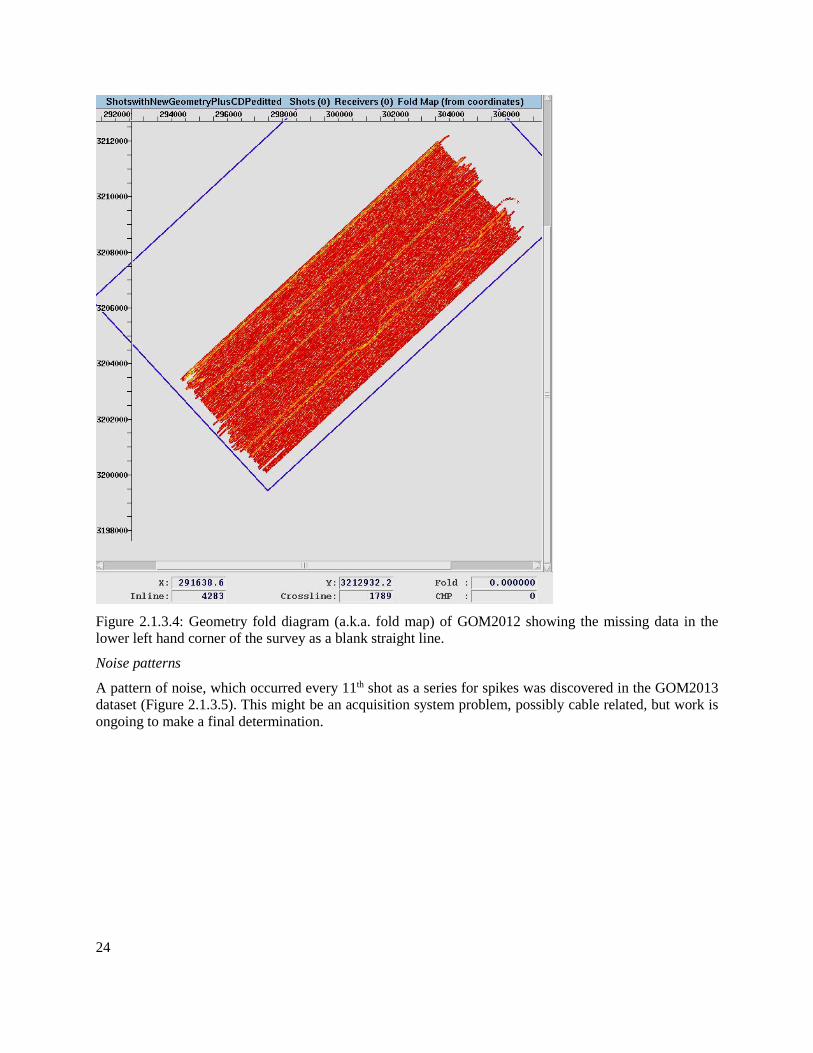
Figure 2.1.3.4: Geometry fold diagram (a.k.a. fold map) of GOM2012 showing the missing data in the lower left hand corner of the survey as a blank straight line.
Noise patterns
A pattern of noise, which occurred every 11th shot as a series for spikes was discovered in the GOM2013 dataset (Figure 2.1.3.5). This might be an acquisition system problem, possibly cable related, but work is ongoing to make a final determination.

25
Figure 2.1.3.5: Noise in shots shown by displaying channel 1 with each trace being a shot
After these database/noise/geometry issues are examined, corrected and removed, work will resume to finish positional uncertainty particularly using 3D information. Static Geologic Model Geologic characterization of a portion of the TexLa Merge regional 3D dataset (Figure 2.1.3.6) was used to generate a static geological model of the area extending outward from the High Island 24L Field (Figure 2.1.3.7). The characterization and geologic modeling resulted from ongoing project DE-FE0026083, "Offshore CO2 Storage Resource Assessment of the Northern Gulf of Mexico (Texas-Louisiana)."

26
Figure 2.1.3.6 – Map showing the locations of three regional 3D seismic surveys including the TexLa Merge, the western portion of which encompasses the High Island area of the upper Texas coast.
Figure 2.1.3.7 – (Right) map of the outline of the TexLa Merge regional 3D seismic dataset; note the polygon (color) of the High Island 24L Field and surrounding area (extension). (Left) Close-up view of the High Island 24L Field extension area static geologic model showing horizons (multi-colors), from shallower to deeper: Top Amph-B Shale, Bottom Amph-B Shale, Bottom Aggradational Package, MFS-10 and gridded fault (orange sub-vertical) planes.

27
The static model was transferred to the LLNL PI, Dr. Joshua White, and Drs. Herve Gross and Antoine Mazuyer (Total), both of whom attended the first annual Partnership meeting. By involving Drs. Gross and Mazuyer, the Partnership is able to leverage GoMCarb funding with an LLNL project funded by Total. The following workflow was used to transfer the static geologic model (Figure 2.1.3.8 - 2.1.3.14). Available export file formats for 3D Grid, Faults, Horizons, and Grids 1. Export 3D Grid Format: - VDB - Rescue (.bin) - Resqml (.resqml) - Eclipse format 2. Data Export (OpenWorks) 2.a. Faults.: - Landmark (all) - Comma separated values (csv) - ZMAP - Custom - Define New
Figure 2.1.3.8 - Export formats for faults 2.b. Horizons - Landmark (all) - Comma separated values (csv)

28
- Multi all format - Multi Line Shotpoint - Multi Line Trace Format - Multi XY Format - ZMAP - Custom - Define New
Figure 2.1.3.9 - Export formats for horizons 2.c. Grids (Gridded horizons, not 3D Grid) - Landmark (all) - Comma separated values (csv) - ZMAP - GXF Grid - XYZ Coordinates - Custom - Define New
29
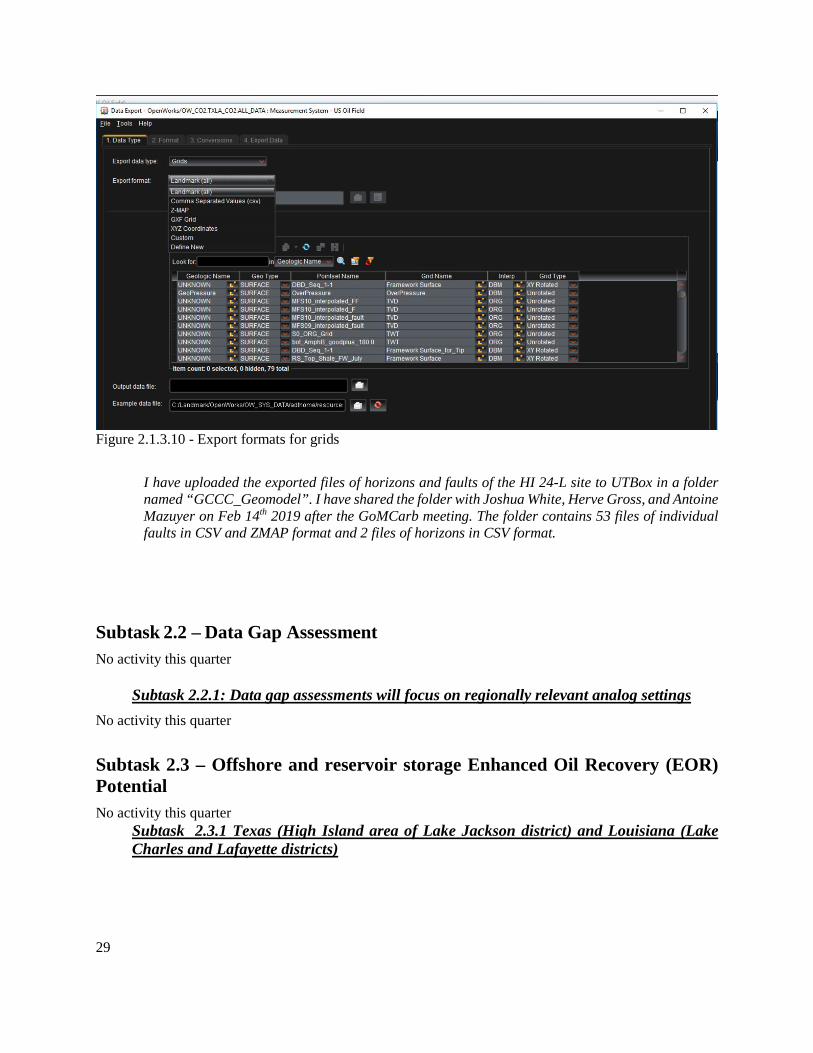
Figure 2.1.3.10 - Export formats for grids
I have uploaded the exported files of horizons and faults of the HI 24-L site to UTBox in a folder named “GCCC_Geomodel”. I have shared the folder with Joshua White, Herve Gross, and Antoine Mazuyer on Feb 14th 2019 after the GoMCarb meeting. The folder contains 53 files of individual faults in CSV and ZMAP format and 2 files of horizons in CSV format.
Subtask 2.2 – Data Gap Assessment No activity this quarter
Subtask 2.2.1: Data gap assessments will focus on regionally relevant analog settings No activity this quarter
Subtask 2.3 – Offshore and reservoir storage Enhanced Oil Recovery (EOR) Potential No activity this quarter
Subtask 2.3.1 Texas (High Island area of Lake Jackson district) and Louisiana (Lake Charles and Lafayette districts)

30
Task 3.0 – Risk Assessment, Simulation and Modeling Subtask 3.1 – Risk Assessment and Mitigation Strategies
Subtask 3.1.1 Assess the adaptation of existing tools to offshore settings LBNL (Lawrence Berkeley National Laboratory) reports, “During the second quarter of FY19, we wrote the conference proceedings paper and related powerpoint presentation for the Offshore Technologies Conference to be held in Houston May 6-10, 2019. Our talk (Oldenburg and Pan) will be given Thursday, May 9. Our current finding is that offshore and onshore CO2 well blowouts and high-pressure pipeline loss-of-containment (LOC) incidents will be very similar in terms of intra-well and intra-pipeline flow and phase-change processes, and that the main differences will arise from differences in how CO2 is transported after discharge from the well/pipe onshore above ground versus offshore in the water column. Given this finding, we carried out a literature search on CO2 transport in the water column. We found significant simulation capabilities have been developed by Sintef (Norway) for CO2 leakage into the subsea water column. During the quarter, we read and reviewed the Sintef work and made contact with the Sintef PI in this area.”
Subtask 3.1.2 Extend geomechanical assessment to additional areas of the basin
No activity this quarter.
Subtask 3.1.3 Dissolution and bubbling in water column No activity this quarter.
Subtask 3.1.4 Numerical modeling of heterogeneous reservoirs
LBNL (Lawrence Berkeley National Laboratory) reports, the ability to simulate CO2 migration and storage in these heterogeneous formations requires understanding of the fundamental dynamic processes: channeling, invasion, lateral spreading and breakthrough (CISB) of supercritical CO2. We have observed dynamic CISB occurring in centimeter-scale micromodels, decimeter-scale core samples, and meter-scale sandboxes. In this past quarter, we tried to understand dynamic CISB in the field at the Cranfield DAS site. A multiscale and multipath network of CO2-flow channels was imaged by geophysical monitoring and logging the following features:
a large-scale fluvial channel imaged by time-lapse 3-D seismic surveys,
small-scale channels in the cross section between the two monitoring wells imaged by daily ERT images and 2-D cross-well seismic surveys, and
2-3 intermediate-scale channels normal to the cross section and connected with the large-scale channel.
CO2 flow and storage dynamically change with time and injection rate for both drainage and imbibition. This field understanding of CISB is the first step in building the reservoir model for the GoMCARB sites. Subtask 3.2 – Geologic Modeling

31
Using the static geologic model as input, LLNL (Lawrence Livermore National Lab) generated a simulation mesh (Figure 3.1.2.1) for the High Island 24L target based on fault and horizon surfaces provided by BEG. The mesh smoothly conforms to the fault surfaces so that is it suitable for geomechanical simulations (see attached image showing one layer with branching fault structure). We are just awaiting porosity and permeability properties from BEG before beginning trial simulations.
Figure 3.1.2.1 – Simulation mesh generated from static geological model of the High Island 24L Field.
Subtask 3.2.1 – Reservoir modeling No activity during this quarter.
Subtask 3.2.2 Sub-basinal scale modeling No activity during this quarter.
Subtask 3.2.3 History matching experiment via modeling
No activity during this quarter.
Subtask 3.2.4 Economic modeling

32
No activity during this quarter.
TASK 4.0: Monitoring, Verification, and Assessment (MVA)
Subtask 4.1: MVA Technologies and Methodologies No activity during this quarter.
Subtask 4.1.1 Geochemical Monitoring of Seabed Sediments
No activity during this quarter.
Subtask 4.1.2 Geochemical Monitoring of Seawater Column
No activity during this quarter.
Subtask 4.1.3 UHR3D Seismic
No activity during this quarter.
Subtask 4.1.4 Distributed Acoustic Sensors
During Q2 FY19, research in the MVA effort continued to evaluate the potential of marine DAS (distributed acoustic sensing) for GCS (geological carbon sequestration) monitoring. We were exploring data extraction and processing approaches using a seafloor passive DAS dataset acquired off the northern California coast in 2018. A central focus of the last several months has been investigating passive imaging approaches that might be useful in this context, in the absence of controlled seismic sources in the water column or on the seabed. Using several regional earthquakes, we tested an autocorrelation-based reflection imaging algorithm which used EQ multiples recorded by DAS to generate a low-fold seismic image. Preliminary results from this approach seem promising and a section of the profile previously identified as a fault zone from boomer surveys was imaged. In the next quarter, we anticipate refining this approach as well as continuing design of a controlled source for continuous DAS imaging in the water column and near-seafloor sediment.
Another task we continued working on was identification of existing offshore fiber optic cables that might provide a location for a GoM test of these methodologies. Several candidate cables were found and we have initiated on-going discussions with owners regarding access for sensing applications.
Subtask 4.1.5 Pipeline MVA
Co-PI, Dr. Daniel Chen, (Project Partner Lamar University) worked on literature survey for CO2 Pipeline Design and Monitoring Technologies for Large-Scale CO2 Storage Projects. The details of this literature survey are as follows:
Abstract

33
Carbon Capture and Storage (CCS) has been gaining attention over the past few years as a crucial strategy for meeting CO2 emission reduction targets from industrial sources. Safe transportation of CO2 through pipelines to prevent any CO2 releases is of utmost importance. Various available technologies and upcoming modeling methods for CO2 pipeline design and monitoring have been discussed in this literature survey. In this review, challenges that pose a threat to the deployment of CO2 pipeline transport and the latest research and modeling efforts in this regard are presented. Validated CFD /ANN and analytical modeling studies on factors that need to be considered at the early stages of the project such as the effect of depressurization during CO2 releases, presence of impurities, corrosion/ fracturing/ material selection of the pipelines, the effect of terrain on CO2 dense phase properties, and the acceptable water content in liquefied CO2 are reviewed.
Introduction
High-pressure CO2 derived from carbon capture and sequestration (CCS) technology can be transported by pipelines before being injected into a reservoir for Enhanced Oil Recovery (EOR) or being used as a raw material for chemical feed stock of urea, soda ash, and polycarbonates. Transport of CO2 through pipes allows a large amount of CO2 from multiple sources to be transported long distances and comparatively cheaper with respect to other modes of transport such as via a barge and truck. However, despite all the benefits, there are challenges associated with pipeline transport of CO2 that need attention for a successful CCS project. The biggest challenges of CO2 pipeline transport are associated with flow assurance, cost, overall integrity, and health, safety and other environmental factors.
Objectives and Scope
CO2 transport by pipeline is being done in the USA for over 30 years. Various available technologies and upcoming modeling methods for CO2 pipeline design, monitoring, and risk assessment are discussed in this literature survey. Up-to-date CO2 pipeline monitoring and risk assessment technologies to minimize the hazards associated with accidental CO2 releases CO2 pipeline construction for CO2 storage purposes are reviewed.
LITERATURE SURVEY ON CO2 PIPELINE DESIGN & OPERATION BASICS
Effect of impurities
CO2 streams that have impurities may face more challenges when compared to pure CO2 streams. Issues like pipeline pressure, re-pressurization intervals, and pipeline integrity need to be considered when transporting CO2 with above-specification impurities. This applies to all modes of transport across a variety of terrains regardless of the CO2 phases (gaseous, liquid, or supercritical) [1-4]. Various CO2 emission sources and capture technologies will inevitably produce different levels of impurities present in CO2 streams. Skaugen et al. [5] show it costs roughly 20–40% more when transporting impure CO2 in comparison to pure CO2 in a pipeline. In another study done by Neele et al. [6] in IMPACTS project, it was concluded that it is more economical to remove CO2 impurities at capture rather than to deal with the downstream problems later on. Further, models that are capable of predicting thermophysical properties of CO2 with impurities need to be emphasized in CCS projects. Water is the most significant impurity to be removed as an above-specification water level in the CO2 stream can cause many problems in pipelines such as corrosion or hydrate formation [7]. H2O content should be controlled to below 350 ppm to prevent corrosion, below 250 ppm to avoid hydrates, and below 100 ppm. Further, if there is significant (>1000

34
ppm) moisture in the pipeline/injection systems, H2 levels need to be controlled below 100 ppm to prevent brittle fracture. Likewise, H2S levels need to be kept below 100 ppm to guard against corrosion [6,8]. Some trace compounds require more compression while some need higher strength to the pipeline to resist ductility issues [9,10]. There has been significant work performed on the effect of each impurity on the critical point of CO2 , pipeline sizing, re-pressurization distances, etc. It has been found that the presence of impurities such as CH4, N2, H2O and amines in the CO2 stream affects the solubility of H2O [11,12].
Pipeline Design considerations
Pipelines in the USA are divided into relatively small sections to reduce the blowdown and refilling times and limit the risk to the public in case of leaks. For a safe and cost-effective design of CO2 transport, it is important to understand transient behavior such as start-up, shutdown, etc. [6]. Severe pressure/temperature drops can be seen during depressurization. In a study conducted by Huh et al, both experiment and simulation of the transient behavior of CO2 pipeline transportation were conducted [5-7,13]. It was found that the behavior of dense phase CO2 can be very sensitive to steep elevations and impurities. Pipeline sizing, distance before depressurization, number of pumps, and sizes and energy requirements of pumping or compressor stations need to be thoroughly investigated while designing [14–18]. Consideration to corrosion problem that may arise from low pH and use of corrosion inhibitors to keep the pipeline integrity and to extend useful life are important to control annual operating costs [19-22]. Though options such as the use of corrosion inhibitors, pre-drying, or improved pipeline material selection are available, a better approach should be to operate CO2 pipelines under such conditions that the free water phase does not exist [23,24]. To avoid pipeline failure due to fracture propagation, use of fracture arrestors, selection of pipeline materials, or determination of operating conditions can be conducted in the design stage to prevent such failures.
Total annual cost can be estimated with rigorous modeling and simulation of CO2 transport via pipelines [25]. Since the concentration and species of the impurities can vary widely, actual stream composition needs to be provided to accurately model CO2 properties such as density, viscosity, critical constants, and phase behavior [26, 27, 28, 29].
Modeling of CO2 pipelines
In a review by Peletiri et al. [29] on CO2 pipeline design, it was found that most models ignored the effects of impurities while in practicality the properties (density, viscosity, and critical constants) are all changed by the presence of impurities [30]. Pressure drop due to velocity change as well as the impact of density and viscosity change (due to impurities) on the pipeline diameter and pressure drop are mostly ignored [29]. To design an efficient CO2 transport pipeline network and to control operating costs, factors including material roughness, pipe diameter, CO2 flow rate, pressure drop per unit length, viscosity/density of the fluid, differences in topography, as well as the environment temperature need to be considered [31, 32, 33]. In addition, the distance between the CO2 source and storage site, network topology, and CO2 transportation mode must be carefully studied [34-36].
Literature Survey on CO2 Pipeline Monitoring Technologies
Atmospheric CO2 sensors have been used to detect a slight increases in CO2 in the atmosphere due to pipeline leaks and to provide an alarm system for CO2 pipeline leaks in the Netherlands [37]. A sensor-based autonomous pipeline monitoring system (SPAMMS) has been proposed by Kim et al. [38]. SPAMMS consists of mobile sensors, fixed sensors, radio-frequency identification (RFID) technology, and

35
autonomous robots that can detect the type/ location of faults early on and take corrective actions in a timely and cost-effective manner.
Summary and Conclusions
This review has presented the major issues and identified knowledge gaps related to CO2 transport design and monitoring. Methods to assess the growth rate of a crack during its lifetime to schedule timely maintenance, root causes that challenge the deployment of CO2 pipeline transport such as threats to marine wildlife and populated urban areas, and validated computational fluid dynamics (CFD), artificial neural network (ANN), and analytical modeling studies have been covered. It was found that commercial deployment of carbon capture and sequestration (CCS) pipelines makes it crucial to evaluate the economics of CO2 transport, especially the issue of pipeline over-specification because of expected future use.
There exist needs for good computational fluid dynamics (CFD), artificial neural network (ANN), and analytical models that incorporate the right equation of state to account for factors that are important at the early design stage such as gaseous, liquid, or supercritical CO2 behavior, interaction with ocean water, pipeline material resistance to corrosion in the presence of impurities (water, H2, etc.), the effect of terrain/ocean depth or pressure on CO2 dense phase properties, acceptable water content in liquefied CO2, and pipeline fracture mitigation measures. Recommendations for the deployment of monitoring devices and design/modeling technologies are made for the future construction of sub-sea and on-land CO2 pipelines for storage of CO2 in onshore/offshore storage sites.
References
[1] Global CCS Institute. The Global Status of CCS. https://www.globalccsinstitute.com/publications/global-status-ccs-2013; 2013 46 (accessed June 8, 2017).
[2] Suzuki T, Toriumi M, Sakemi T, Masui N, Yano S, Fujita H, et al. Conceptual Design of CO2 Transportation System for CCS. GHGT-11 2013;37: 2989–96. doi: 10.1016/j.egypro.2013.06.185.
[3] Spinelli CM, Demofonti G, Biagio M Di, Lucci A. CO2 Full Scale Facilities Challenges For EOR/CCTS Testing On Transportation Issues, The International Society of Offshore and Polar Engineers; 2012.
[4] Wetenhall B, Race JM, Downie MJ. The Effect of CO2 Purity on the Development of Pipeline Networks for Carbon Capture and Storage Schemes. International Journal of Greenhouse Gas Control 2014; 30:197–211. doi: 10.1016/j.ijggc.2014.09.016.
[5] Skaugen, G., S. Roussanaly, J. Jakobsen, and A. Brunsvold. 2016. Techno-Economic Evaluation of the Effects of Impurities on Conditioning and Transport of CO2 by Pipeline. Int. J. Greenh. Gas Control. doi:10.1016/j.ijggc.2016.07.025.
[6] Neele, F., J. Koornneef, J. P. Jakobsen, A. Brunsvold, and C. Eickhoff. 2017. Toolbox of Effects of CO2 Impurities on CO2 Transport and Storage Systems. Energy Procedia. doi:https://doi.org/10.1016/j.egypro.2017.03.1789.
[7] Bilio, M., S. Brown, M. Fairwheather, and H. Mahgerefteh. 2009. CO2 Pipelines Material and Safety Considerations. IChemE Symp. Ser. HAZARDS XXI Process Saf. Environ. Prot.
[8] Cole IS, Corrigan P, Sim S, Birbilis N. 2011. Corrosion of pipelines used for CO2 transport in CCS: Is it a real problem? International Journal of Greenhouse Gas Control. 5: 749–56

36
doi:10.1016/j.ijggc.2011.05.010.
[9] DOE/NETL, 2012. CO2 Impurity Design Parameters. DOE/NETL.
[10] Roberts, Jennifer J. and Gilfillan, Stuart M. V. and Stalker, Linda and Naylor, Mark (2017) Geochemical tracers for monitoring offshore CO2 stores. International Journal of Greenhouse Gas Control, 65. pp. 218-234. ISSN 1750-5836
[11] Xiang, Y., Wang, Z., Yang, X., Li, Z. and Ni W. The upper limit of moisture content for supercritical CO2 pipeline transport. The Journal of Supercritical Fluids. 2012; 67: 14–21
[12] Thomas DC, Benson SM. Carbon Dioxide Capture for Storage in Deep Geologic Formations-Results from the CO2 Capture Project: Vol 1-Capture and Separation of Carbon Dioxide from Combustion, Vol 2-Geologic Storage of Carbon Dioxide with Monitoring and Verification. Elsevier 2005.
[13] Huh, C., M. I. Cho, S. Hong, and S. G. Kang. 2014. Effect of Impurities on depressurization of CO2 Pipeline Transport. In Energy Procedia. doi:10.1016/j.egypro.2014.11.280.
[14] Herzog H, Golomb D. Carbon capture and storage from fossil fuel use. Encyclopedia of Energy 2004; 1: 1–11.
[15] Nakaten N, Schlüter R, Azzam R, Kempka T. 2014. Development of a techno-economic model for dynamic calculation of cost of electricity, energy demand and CO2 emissions of an integrated UCG–CCS process. Energy. 66: 779–90. 49. doi:10.1016/j.energy.2014.01.014.
[16] International Energy Agency Greenhouse Gas R&D Programme. Transmission of CO2 and Energy. Cheltenham, International Energy Agency Greenhouse Gas R&D Programme. Cheltenham: 2002.
[17] Roddy DJ. Development of a CO2 network for industrial emissions. 2012. Applied Energy. 91:459–65. doi:10.1016/j.apenergy.2011.10.016.
[18] Belaissaoui B, Cabot G, Cabot M-S, Willson D, Favre E. 2012. An energetic analysis of CO2 capture on a gas turbine combining flue gas recirculation and membrane separation. Energy. 38: 167–75. doi:10.1016/j.energy.2011.12.018.
[19] George K, Waard K de, Nesic S. Electrochemical Investigation and Modeling of Carbon Dioxide Corrosion of Carbon Steel in the Presence of Acetic Acid, NACE International 2004.
[20] Eslami, A., Chen, W., Worthingham, R., Kania, R., & Been J. Effect Of CO2 On Near-Neutral Ph Stress Corrosion Cracking Initiation Of Pipeline Steel. NACE International 2010.
[21] Ashassi-Sorkhabi H, Ghasemi Z, Seifzadeh D. The inhibition effect of some amino acids towards the corrosion of aluminum in 1M HCl+1M H2SO4 solution. Applied Surface Science 2005; 249: 408–18. doi:10.1016/j.apsusc.2004.12.016.50
[22] Patchigolla K, Oakey JE, Anthony EJ. Understanding dense phase CO2 corrosion problems. Energy Procedia 2014; 63: 2493–9. doi:10.1016/j.egypro.2014.11.272.
[23] A Review of the CO2 Pipeline Infrastructure in the U.S. April 21, 2015 DOE/NETL-2014/1681; National Energy Technology Laboratory
[24] TECHNICAL SUPPORT DOCUMENT (EPA); Literature Survey of Carbon Capture Technology; Docket EPA-HQ-OAR-2013-0495, July 10, 2015.
[25] Ghazi, N., Race J. Techno-economic modelling and analysis of CO2 pipelines. The Journal of Pipeline Engineering 2013; 12: 83–92.

37
[26] Witkowski, A.; Rusin, A.; Majkut, M.; Stolecka, K. The analysis of pipeline transportation process for CO2 captured from reference coal-fired 900 MW power plant to sequestration region. Chem. Process Eng. 2014, 35, 497–514.
[27] McCoy, S.; Rubin, E. An engineering-economic model of pipeline transport of CO2 with application to carbon capture and storage. Int. J. Greenh. Gas Control 2008, 2, 219–229.
[28] Peletiri, S.P.; Rahmanian, N.; Mujtaba, I.M. Effects of impurities on CO2 pipeline performance. Chem. Eng. Trans. 2017, 57: 355–360.
[29] Peletiri, Suoton P.; Rahmanian, Nejat; Mujtaba, Iqbal M. 2018. "CO2 Pipeline Design: A Review." Energies 11, no. 9: 2184.
[30] Chapoy, A., Nazeri, M., Kapateh, M., Burgass, R., Coquelet, C., & Tohidi, B. (2013). Effect of impurities on thermophysical properties and phase behaviour of a CO2-rich system in CCS. International Journal of Greenhouse Gas Control, 19, 92-100.
[31] Ikeh L, Race JM, Aminu AG. Comparing the Effects of Pipe Diameter on Flow Capacity of a CO2 Pipeline. Nigeria Annual International Conference and Exhibition, Abuja, Nigeria: Society of Petroleum Engineers 2011.
[32] Demofonti G, Biagio M Di, Fonzo A, Lucci A, Spinelli CM. Definition of Requirements for Safe and Reliable CO2 Transportation Network Through an Integrated Laboratory, Computer Modelling, and Full Scale Methodology, International Society of Offshore and Polar Engineers 2013.
[33] Wang Z, Cardenas GI, Fimbres Weihs GA, Wiley DE. Optimal Pipeline Design with Increasing CO2 Flow Rates. Energy Procedia. 2013; 37: 3089–96. doi:/10.1016/j.egypro.2013.06.194.
[34] Aghajani, H., Race, J. M., Wetenhall, B., Fernandez, E. S., Lucquiaud, M., & Chalmers, H. (2017). On the potential for interim storage in dense phase CO 2 pipelines. International Journal of Greenhouse Gas Control, 66, 276-287
[35] Suzuki T, Toriumi M, Sakemi T, Masui N, Yano S, Fujita H, et al. Conceptual Design of CO2 Transportation System for CCS. GHGT-11 2013; 37: 2989–96. doi: 10.1016/j.egypro.2013.06.185.
[36] Spinelli CM, Demofonti G, Biagio M Di, Lucci A. CO2 Full Scale Facilities Challenges For EOR/CCTS Testing On Transportation Issues, The International Society of Offshore and Polar Engineers; 2012.
[37] Van Leeuwen, C., Hensen, A., & Meijer, H. A. (2013). Leak detection of CO2 pipelines with simple atmospheric CO2 sensors for carbon capture and storage. International Journal of Greenhouse Gas Control, 19, 420-431.
[38] Kim, J. H., G. Sharma, N. Boudriga, and S. S. Iyengar. 2010. SPAMMS: A Sensor-Based Pipeline Autonomous Monitoring and Maintenance System. In 2010 2nd International Conference on COMmunication Systems and NETworks, COMSNETS 2010. doi:10.1109/COMSNETS.2010.5432015.
Subtask 4.2: Plans for Testing of MVA Technologies
Subtask 4.2.1 Priority list for MVA Technologies and testing methods No activity during this quarter.

38
TASK 5.0: Infrastructure, Operations and Permitting The following summarizes the results of the work Trimeric Corporation performed for the University of Texas, Bureau of Economic Geology (UT BEG) as part of the DOE-sponsored Gulf of Mexico Partnership for Offshore Carbon Storage (GoMCarb) program for the period from January – March, 2019.
Subtask 5.1: CO2 Transport and Delivery Subtask 5.1.1 Data assessment near-shore sites
Infrastructure Re-Use: Research Process Overview
A key component of the effort under Task 5 includes the assessment of existing infrastructure for re-use in CO2 transport and storage applications. The major components of the CO2 transport and storage value chain are summarized in Figure 5.1.1.
Figure 5.1.1: Overview of Offshore CO2 Transport and Storage Process (Note: figure not to scale)
When viewed in the context of infrastructure re-use, pipelines, platforms, and wells represent infrastructure components that are actively used in the Gulf of Mexico by existing oil and gas operations and may potentially be re-purposed for CO2 transport and storage. Furthermore, decommissioning requirements for “idle iron” (or infrastructure that is no longer in service) present a major financial, regulatory, and environmental challenge to owners of the infrastructure. Therefore, at a high level, there appears to be an alignment of interests and incentives to re-use existing oil and gas infrastructure in applications such as CO2 storage offshore.
In order to assess the potential for oil and gas infrastructure re-use, an overall research approach was defined and summarized as a simplified workflow in Figure 5.1.2.

39
Literature Review
Subject Matter Expert Interviews
Consensus on Re-use Criteria?
Define Data Gaps & Needs
NO
Re-Use Feasible?
NOSummarize Obstacles to Re-Use and Path Forward
Define Screening Criteria for Re-Use
YES
Pilot Screening Criteria for Proxy
Sites (e.g., High Island
Block 10-L)
Refine Criteria
Extend Screening across GoMCarb
Region
Refine Criteria
Scenario Optimization:Source-Sink
Matching
Re-Usable Infrastructure in
Source-Sink Region?
Next Scenario/Region
Detailed Scenario Evaluation (e.g.,
contact operators, techno-economic
evaluation, risk assessment)
YES
NO
Next Scenario/Region
Definition Phase
Method & Data Development
Phase
Evaluation Phase
40
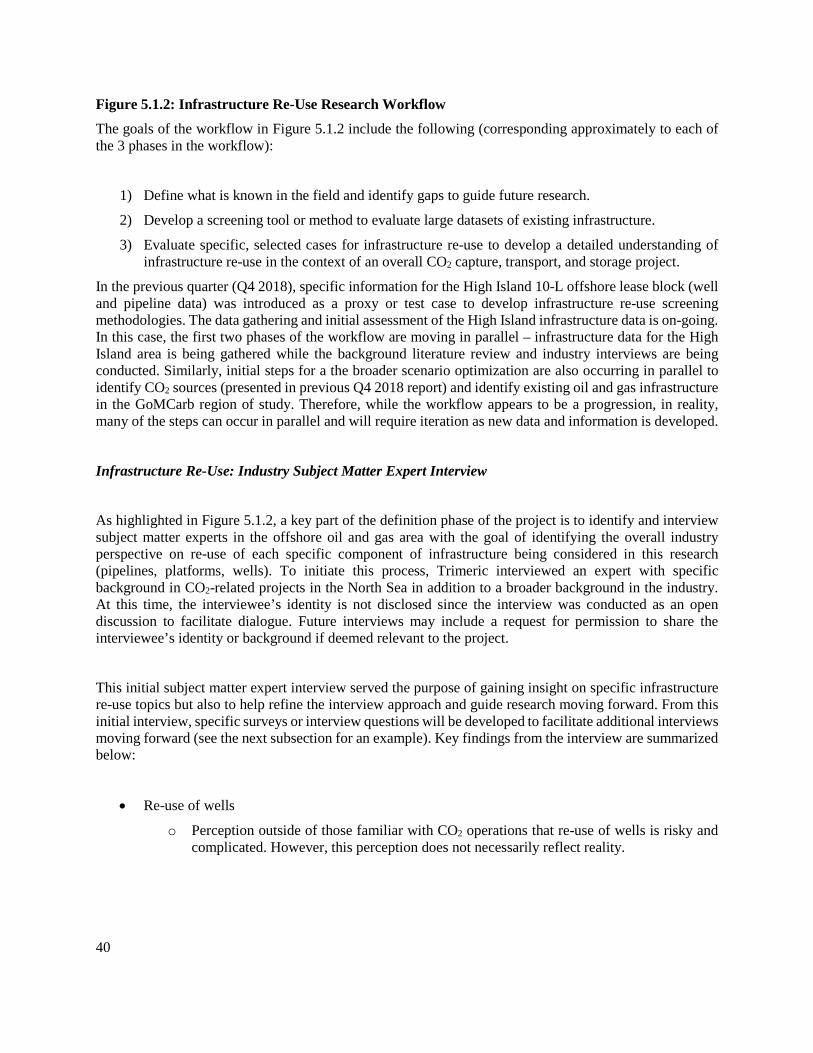
Figure 5.1.2: Infrastructure Re-Use Research Workflow
The goals of the workflow in Figure 5.1.2 include the following (corresponding approximately to each of the 3 phases in the workflow):
1) Define what is known in the field and identify gaps to guide future research.
2) Develop a screening tool or method to evaluate large datasets of existing infrastructure.
3) Evaluate specific, selected cases for infrastructure re-use to develop a detailed understanding of infrastructure re-use in the context of an overall CO2 capture, transport, and storage project.
In the previous quarter (Q4 2018), specific information for the High Island 10-L offshore lease block (well and pipeline data) was introduced as a proxy or test case to develop infrastructure re-use screening methodologies. The data gathering and initial assessment of the High Island infrastructure data is on-going. In this case, the first two phases of the workflow are moving in parallel – infrastructure data for the High Island area is being gathered while the background literature review and industry interviews are being conducted. Similarly, initial steps for a the broader scenario optimization are also occurring in parallel to identify CO2 sources (presented in previous Q4 2018 report) and identify existing oil and gas infrastructure in the GoMCarb region of study. Therefore, while the workflow appears to be a progression, in reality, many of the steps can occur in parallel and will require iteration as new data and information is developed.
Infrastructure Re-Use: Industry Subject Matter Expert Interview
As highlighted in Figure 5.1.2, a key part of the definition phase of the project is to identify and interview subject matter experts in the offshore oil and gas area with the goal of identifying the overall industry perspective on re-use of each specific component of infrastructure being considered in this research (pipelines, platforms, wells). To initiate this process, Trimeric interviewed an expert with specific background in CO2-related projects in the North Sea in addition to a broader background in the industry. At this time, the interviewee’s identity is not disclosed since the interview was conducted as an open discussion to facilitate dialogue. Future interviews may include a request for permission to share the interviewee’s identity or background if deemed relevant to the project.
This initial subject matter expert interview served the purpose of gaining insight on specific infrastructure re-use topics but also to help refine the interview approach and guide research moving forward. From this initial interview, specific surveys or interview questions will be developed to facilitate additional interviews moving forward (see the next subsection for an example). Key findings from the interview are summarized below:
• Re-use of wells
o Perception outside of those familiar with CO2 operations that re-use of wells is risky and complicated. However, this perception does not necessarily reflect reality.

41
o High standard for well-integrity/assurance may/likely will be required for CO2 storage projects with existing wells present due to concerns about CO2 leak pathways via existing wells.
o Common in on-shore EOR to re-use existing wells. Higher degree of risk to recover an existing well, but viewed as a routine and acceptable risk onshore.
Larger well-stock is required for EOR applications, which creates more of an incentive to re-use wells.
o Wells for CO2 injection storage project:
In general, if there is no utilization/EOR component to the project and there are only a limited number of injection wells required for a storage project, construction of a new well is likely the best option. This limits well-integrity risks for a project focused on CO2 storage and the upside of re-using wells is not as high as for an EOR project where many wells may be needed.
Caveat: If a relatively new platform with good records and a small number of wells is available, re-use of existing wells may merit additional consideration.
• In addition, for a field with existing wells, there may be a requirements to assess the integrity of all existing wells, even if not re-used. This is due to the potential for leaks. Therefore, this unavoidable cost for evaluating existing wells may also tilt economics in the favor re-using an existing well.
o Rule of Thumb: Post-1970 will indicate “modern” well construction, reducing risks of construction/integrity (does not address well lifetime or condition of well at time of abandonment).
o Risks of re-using a well:
Risk of what is left behind in abandoned wells. This is not well-documented and may not be discovered until re-entering the well. Represents a cost and schedule risk that should be factored into decision-making process for re-using a well.
Risk of a well with poor integrity.
• First study records of well.
• Performing testing and measurement when re-entering a well – expert’s experience is that well integrity is almost always worse than records.
• Virtually any well-integrity issue can be fixed – but it represents a cost and schedule risk. It is also hard to anticipate/plan/predict what it will take to fix a well-integrity issue before re-entering the well and potential costs may vary substantially depending on issues and specific well. This adds uncertainty upfront.
o It is good practice for injection and production projects to use new well-heads with higher alloys and higher pressure rating.
Need to consider CO2 resistant materials, such as elastomers in thread seals.
• Re-use of platforms

42
o Space is the biggest constraint for platform re-use
Pressure boosting would require additional space/utilities.
o Flow rate and pressure of CO2 arriving at the platform may also impact piping on the platform.
o If the project is CO2 injection only (not producing fluids, then additional space may be created by removing un-used equipment (separators, tanks, etc.)
PIG launcher and receiver will be needed on the platform for the pipeline.
o Platforms have a fixed number of slots limiting the number of wells that can be drilled from a single platform – often, all slots are used on an existing platform.
Slots can be added in some cases, but this requires additional engineering/costs
o General condition of a platform should also be assessed before considering re-use (e.g., conditions of control room,/accommodations, safe layout)
• Re-Use of Pipelines
o Pipelines are the limiting factor for the flow rate from the source – additional wells may be added, but pipeline capacity would be a much more significant expense.
o Pipeline consultant should be engaged for routing of pipelines since site-specific considerations are important.
o Existing pipelines may be OK (from material of construction perspective) with dry CO2
Diameter (flow capacity) and pressure rating will be the key limitations
• General comments/approach
o In expert’s experience, reservoir is the driver (particularly since those applications were EOR)
o For GoMCarb work:
First consider total rate and volume for injection. Evaluate if an existing pipeline can accommodate (followed by consideration of pressure rating)
If a new pipeline is required, consider existing pipeline routes when possible.
Find a reservoir around the pipeline that can accommodate the CO2 source (flow rate/capacity)
Finally, integrity of existing facilities should be considered:
• Platform: accommodations, control room, jacket, deck
• Wells: number of wells, age, depth (deeper = more expensive)
• Wells are more important than platforms.
Infrastructure Re-Use: Industry Subject Matter Interview Templates

43
Based in part on the preceding interview, Trimeric has started to develop interview templates or surveys to engage additional experts in the field. By using a consistent and focused set of questions, it may be possible to identify a consensus (or lack thereof) among industry experts regarding infrastructure re-use or identify specific data gaps or uncertainties. An example of an interview questions for well re-use are summarized as follows:
1) Prior to well-integrity assessment, are there screening criteria to eliminate candidate wells?
a. Age of wells?
b. Depth of wells?
c. Number of Wells in the Reservoir?
2) What is the minimum data you would want to have before considering re-use of a well?
3) What are the scenarios or criteria that would make you consider well re-use over a new well for CO2 injection, if any?
4) In your experience, do dry holes/dry wells indicate a higher risk of reservoir seal failure? Is it a useful data point to screen a reservoir?
5) How common is well re-use onshore?
a. Are there any aspects of re-use onshore that are good analogs for offshore re-use?
6) Are you aware of any well re-use offshore? If so, do you have any information on the process used to select and prepare the well for re-use?
7) If an existing depleted reservoir is being used for storage, is it your expectation that all wells in the field will need to have integrity verified (to some degree)?
a. If so, would that change your perspective on potentially re-using one or more of the existing wells for injection (incremental cost of re-using a well that must already be analyzed vs. drilling a new well in reservoir with other existing wells)?
8) Do you have any rules of thumb or data on the cost of well-integrity assessments, specifically offshore (if onshore, is the data applicable in any way offshore)?
a. What are the key factors that drive the cost of a well integrity assessment?
b. Could these factors be used to eliminate candidate wells upfront?
9) What are the key cost drivers for re-working a well for re-use?
a. Would these factors change offshore (vs. onshore) – i.e., are the factors or relative importance of each factor significantly different for an offshore re-use application?
10) What are the considerations for re-using a well for CO2 injection vs. other fluids/uses in initial well use (e.g., materials concerns, pressure concerns, other integrity concerns):
a. Well initially used for oil and/or gas recovery
b. Well used for water injection/re-injection

44
Similar interview questions are being developed for platforms and pipelines and potentially general questions regarding infrastructure re-use as part of a larger CO2 storage project.
Subtask 5.2: Scenario Optimization Mapping Existing Oil and Gas Infrastructure in GoM
In a previous quarterly report (Q4 2018), a CO2 source map was presented along the Texas Gulf Coast, including size of sources and screening by distance to the shore to facilitate offshore transport and storage. Other partners in the GoMCarb group are working to assess sinks (i.e., reservoirs) in the GoMCarb region. The source-sink pairings will form the backbone of the CO2 storage scenario optimization cases. However, re-use of existing infrastructure can also be accommodated in scenario optimization. As an initial step to facilitate this long-term project activity, Trimeric will gather data on existing infrastructure (primarily platforms and pipelines) and map them (and catalog them) alongside CO2 source data in the region. Figure 5.2.1 represents existing platforms (including those that require decommissioning) from a publicly available source.
Figure 5.2.1: Map of Existing Oil and Gas Platforms in the Gulf of Mexico. Red Triangles = “Idle Iron”. Yellow Dots = All other standing platforms. (Plough, 2017)

45
The source data for Figure 5.2.1 is based on publicly available data which Trimeric will access and use to merge with CO2 source data presented previously. The dataset appears to be limited to federal waters, however, so Trimeric will also attempt to incorporate corresponding state-level data.
Reference
Plough, A. (2017, August 3). American Idle: Decommissioning costs sink offshore drillers into latest crisis. Debtwire Investigations. Retrieved from http://investigations.debtwire.com/american-idle-decommissioning-costs-sink-offshore-drillers-into-latest-crisis/
Subtask 5.2.1 Analog Site Optimization No activity during this quarter
Subtask 5.3: Communication No activity during this quarter
TASK 6.0: Knowledge Dissemination No activity during this quarter Subtask 6.1: Stakeholder Outreach The following abstract was submitted and accepted for presentation at the April 16 symposium of the Texas Chapter of the ASBPA (American Beach and Shore Preservation Association) at Texas A&M University Corpus Christi: Abstract:
Sea level rise and increased storm severity from global climate change will damage coastal environments and communities. As a low-lying coastline regularly impacted by tropical cyclones, the Texas coast can benefit from climate change mitigation and adaptation strategies. One mitigation strategy is CCS, carbon capture and sequestration (or storage). CCS captures CO2 from point sources, concentrates it to a dense phase, transports it to selected sites, and injects it to depths between 1000 m and 3000 m (~3300 ft and 10,000 ft, respectively) in rock units qualified to retain large volumes of fluid in isolation from shallower resources and the earth’s surface. An important vehicle for the U.S. Department of Energy’s (DOE) CCS research has been the Regional Carbon Sequestration Partnerships (RCSP), which were established in 2003 “to develop the technology, infrastructure, and regulations needed to implement large-scale CO2 storage in different regions and geologic formations.” The Gulf Coast Carbon Center (GCCC) at the University of Texas, Bureau of Economic Geology participated in two of the RCSPs, the Southwest Regional Partnership (SWP) and the Southeast Regional Carbon Sequestration Partnership (SECARB). As part of SECARB, GCCC led an experiment at Denbury Onshore, LLC’s Cranfield Field near Natchez, MS, which monitored CO2 storage of over 5.3 million metric tons (MT) of CO2 at depths >3200 m (~11,000 ft) using many different tools and methods. The RCSPs focused on geologic sequestration (GS) onshore. GCCC is interested in 1) onshore and 2) offshore, deep, sub-seabed GS. The advantages of Offshore GS are: 1) few or no freshwater aquifers; 2) single landowners (i.e., federal or state governments), and 3) more efficient and effective monitoring, verification and accounting (MVA) technologies. In 2010, GCCC received grants

46
from DOE and the Texas General Land Office to study the feasibility of deep, sub-seabed GS beneath Texas’ offshore waters. The study identified up to 86 Gigatons (billion metric tons) of CO2 storage capacity near many of the U.S. largest CO2 point sources. Subsequent DOE-sponsored GCCC studies along the upper Texas and western Louisiana coastlines have identified specific sites (e.g., abandoned oil and gas fields) that could receive tens of MT of CO2. In 2018 DOE selected GCCC to lead a partnership modeled on the successful RCSPs to further study the CCS potential of near-shore state and federal waters of Texas and Louisiana. The 5-year “GoMCarb” Partnership includes industry, academia and government. It will undertake five activities: 1) offshore GS resource characterization; 2) risk assessment, simulation, and modeling; 3) MVA and assessment; 4) infrastructure, operations and permitting; and 5) knowledge dissemination. The Partnership will assemble the knowledge base required for secure, long-term, large-scale CO2 GS with or without enhanced hydrocarbon recovery and will identify and address knowledge gaps, regulatory issues, infrastructure requirements, and technical challenges associated with offshore CO2 GS. Lamar University hosted the February 2019 first annual Partnership meeting in Beaumont, TX. (Invoicing has been delayed.)
PI, Dr. Tracy Benson of project Partner, Lamar University, and Dr. Benson’s students continued literature searches for the simulation and equation of state modeling of CO2 stored in underground reservoirs. Stakeholders in the Beaumont area indicated a desire to have Lamar University fulfill the role of local CCS expert for local industry.
Outreach to K-12 Students in the Golden Triangle Area
Lamar University hosted a teacher STEM workshop (Jan. 17, 2019) demonstrating carbon management technologies that are capable of lowering CO2 point source emissions. The workshop used the teacher module “CO2 – Too Much of a Good Thing?” developed by University of Texas at Austin project PI, Dr. Susan Hovorka and project staff Hilary Olson. Thirty three area school teachers (elementary through high school) were introduced to the production of large scale CO2 and how to mitigate atmospheric increases through carbon storage technologies.

47
PI, Dr. Susan Hovorka was interviewed for a podcast (1.5 hrs) by The American Shoreline, https://anchor.fm/aspn/episodes/American-Shoreline-Podcast--Carbon-Sequestration-with-Dr--Susan-Hovorka-e3a3ns . Subtask 6.2: Technical Outreach No activity during this quarter
Subtask 6.3: Advisory Committee Advisory committee chair, Tim Dixon chaired the first session of the first annual GoMCarb Partnership

48
meeting at Lamar University. PLANS FOR THE NEXT PROJECT QUARTER In the next quarter, work will continue on:
Task 1 • Finish amending Partners’ subcontracts with augmented funding and scope. • Take possession of and test equipment ordered from Geometrics. • Conduct one or more conference call update/technical meetings with Partners.
Task 2
Subtask 2.1.3: • Work to be done in the future (on HR3D datasets) includes
o 3D Statics o 3D Balancing o 3D Deconvolution o FXY Filtering o Interpolation (Madagascar) o Fault and feature enhancement (OpenDtect)
Task 3 Risk Assessment, Simulation and Modeling
• Subtask 3.1.1: o Continue dialogue with Sintef on CO2 transport at high flow rates in the water column. o Continue development of low-temperature CO2 leakage simulation capabilities. o Begin consideration of likelihood of LOC from existing wells in the Texas Gulf Coast
region of interest. o Summarize the findings of field CISB at Cranfield in a journal paper and quantify these
processes in heterogeneous formations. • Subtask 3.1.2: Continue detailed geomechanical modeling; incorporate results from porosity
modeling (e.g., seismic inversion • Subtask 3.1.4: Continue design of a controlled source for continuous DAS imaging in the water
column and near-seafloor sediment.
Task 4 Monitoring Verification and Assessment • Subtask 4.1.4: Continue design of a controlled source for continuous DAS imaging in the water
column and near-seafloor sediment
Task 5 Infrastructure, Operations and Permitting
• Subtask 5.1: Continued development of existing infrastructure “database” for project region, starting in the High Island region. Trimeric has obtained additional data on wells in the region and will begin to define screening methods for the dataset.
• Subtask 5.1: Development of methodology to evaluate existing infrastructure for re-use in CO2

49
transportation with a focus of gathering and assessing industry expertise/experience on the subject (particularly leveraging knowledge internationally, e.g., North Sea). The industry survey’s presented in this report will be further developed and a list of industry experts/contacts will be developed.
• Subtask 5.2: Continued development of CO2 source list along the Texas coast, including outreach and education of industry in the region. Trimeric has engaged LNG operators in the region with the goal of understanding their needs and interest in CO2 capture and storage projects.
• Subtask 5.2: Add existing infrastructure data to CO2 source data (in maps and database/spreadsheets) to provide first steps for longer-term scenario optimization.
•
Task 6 •
STATUS OF PROJECT SCHEDULE AND MAJOR GOALS/MILESTONES OF PROJECT Schedule/Timeline
The project schedule/timeline is shown in the following Gantt chart.

50

51
MAJOR GOALS / MILESTONES
Task/ Milestone Number and Title
Planned Completion Date
Verification method Subtask
1 M1: Attend Kickoff meeting 4/30/2018 Submit Presentation File
1 M2-1: Partnership Fact Sheet 8/31/2018 Fact Sheet file 2 M3: Data submitted to NETL-EDX 1/31/2019 List of data submitted
2 M4: Identification of geologic storage prospects & data gaps 9/30/2019 Summary Report
3 M5: Risk assessment, simulation and modeling of prospects 3/13/2020 Summary Report
3 M6: Modified risk assessment, simulation and modeling of prospects
9/30/2020 Summary Report
4 M7: Modified MVA technologies and testing plan identified for prospects
2/26/2021 Summary Report
2 M8: Refinement of geologic storage prospects & data gaps 9/30/2021 Summary Report
6 M9: Summary of Advisory Committee recommendations 3/31/2022 Letter Report
6 M10: Outcomes of public acceptance studies 9/30/2022 Letter Report
1 M11: Upload results to EDX 3/3/2023 Summary Report
3. PRODUCTS Publications, conference papers, and presentations.
None generated this period. Websites
http://www.beg.utexas.edu/gccc/research/gomcarb Technologies or techniques
None generated to date. Inventions, patent applications, and/or licenses
None generated to date. Other products

52
None to date.
4. PARTICIPANTS & OTHER COLLABORATING ORGANIZATIONS
The University of Texas at Austin Bureau of Economic Geology, GCCC (Gulf Coast Carbon Center) Name: Susan Hovorka, PhD Project Role: Principal Investigator Nearest person month worked: 1 Contribution to Project: Leadership in planning and negotiating Name: Tip Meckel, PhD Project Role: Co-Principal Investigator Nearest person month worked: 1 Contribution to Project: Dr. Meckel presented the overview at the kick-off meeting Name: Ramón Treviño Project Role: Co-Principal Investigator (project manager) Nearest person month worked: 1 Contribution to Project: Mr. Treviño provided project management and project reporting; he acted at the primary contact for the DOE project manager and contracting specialist. Name: Michael DeAngelo Project Role: Researcher (geophysicist seismic interpreter) Contribution to Project: Mr. DeAngelo conducted structural interpretation of the “TexLa Merge,” “Texas OBS” and “Chandeleur Sound” regional 3D seismic datasets. Name: Katherine Romanak, PhD Project Role: sediment geochemist Nearest person month worked: 1 Contribution to Project: Liaison with Texas A&M GERG UT Institute for Geophysics, GBDS (Gulf Basin Depositional Synthesis) Industrial Associates Program Name: John Snedden Project Role: Senior Research Scientist Nearest person month worked: 1 Contribution to Project: Dr. Snedden provided expertise in seismic stratigraphy and siliciclastic depositional systems. Name: Jon Virdell Project Role: Project Manager Nearest person month worked: 1

53
Contribution to Project: Mr. Virdell provided project and GIS data management support. Name: Marcie Purkey Phillips Project Role: Biostratigrapher Nearest person month worked: 1 Contribution to Project: Mrs. Purkey Phillips contributed expertise in biostratigraphy and integrated well and seismic data in the Chandeleur 3D survey area. Fugro Marine Geoservices, Inc. Lamar University Louisiana Geological Survey TDI-Brooks, Inc. Trimeric Corp. U.S. Geological Survey (USGS) Lawrence Berkeley National Laboratory Lawrence Livermore National Laboratory