research papers contrast variation by dynamic nuclear ... · dj-parc center, japan atomic energy...
TRANSCRIPT
research papers
2036 http://dx.doi.org/10.1107/S1600576716016472 J. Appl. Cryst. (2016). 49, 2036–2045
Received 30 March 2016
Accepted 15 October 2016
Edited by M. Gradzielski, Technische
Universitat Berlin, Germany
1This article will form part of a virtual special
issue of the journal, presenting some highlights
of the 16th International Conference on Small-
Angle Scattering (SAS2015).
Keywords: small-angle neutron scattering
(SANS); contrast variation; dynamic nuclear
polarization; ternary mixtures; nanocomposites.
Contrast variation by dynamic nuclear polarizationand time-of-flight small-angle neutron scattering. I.Application to industrial multi-componentnanocomposites1
Yohei Noda,a* Satoshi Koizumi,a* Tomomi Masui,b Ryo Mashita,b Hiroyuki
Kishimoto,b Daisuke Yamaguchi,c Takayuki Kumada,c Shin-ichi Takata,d Kazuki
Ohishie and Jun-ichi Suzukie
aInstitute of Quantum Beam Science, Ibaraki University, Ibaraki, 316-8511, Japan, bSumitomo Rubber Industries Ltd,
Kobe, 651-0072, Japan, cMaterials Science Research Center, Japan Atomic Energy Agency, Ibaraki, 319-1195, Japan,dJ-PARC Center, Japan Atomic Energy Agency, Ibaraki, 319-1195, Japan, and eNeutron Science and Technology Center,
Comprehensive Research Organization for Science and Society (CROSS), Ibaraki, 319-1106, Japan. *Correspondence
e-mail: [email protected], [email protected]
Dynamic nuclear polarization (DNP) at low temperature (1.2 K) and high
magnetic field (3.3 T) was applied to a contrast variation study in small-angle
neutron scattering (SANS) focusing on industrial rubber materials. By varying
the scattering contrast by DNP, time-of-flight SANS profiles were obtained at
the pulsed neutron source of the Japan Proton Accelerator Research Complex
(J-PARC). The concentration of a small organic molecule, (2,2,6,6-tetramethyl-
piperidine-1-yl)oxy (TEMPO), was carefully controlled by a doping method
using vapour sorption into the rubber specimens. With the assistance of
microwave irradiation (94 GHz), almost full polarization of the paramagnetic
electronic spin of TEMPO was transferred to the spin state of hydrogen
(protons) in the rubber materials to obtain a high proton spin polarization (PH).
The following samples were prepared: (i) a binary mixture of styrene–butadiene
random copolymer (SBR) with silica particles (SBR/SP); and (ii) a ternary
mixture of SBR with silica and carbon black particles (SBR/SP/CP). For the
binary mixture (SBR/SP), the intensity of SANS significantly increased or
decreased while keeping its q dependence for PH = �35% or PH = 40%,
respectively. The q behaviour of SANS for the SBR/SP mixture can be
reproduced using the form factor of a spherical particle. The intensity at low q
(�0.01 A�1) varied as a quadratic function of PH and indicated a minimum
value at PH = 30%, which can be explained by the scattering contrast between
SP and SBR. The scattering intensity at high q (�0.3 A�1) decreased with
increasing PH, which is attributed to the incoherent scattering from hydrogen.
For the ternary mixture (SBR/SP/CP), the q behaviour of SANS was varied by
changing PH. At PH = �35%, the scattering maxima originating from the form
factor of SP prevailed, whereas at PH = 29% and PH = 38%, the scattering
maxima disappeared. After decomposition of the total SANS according to
inverse matrix calculations, the partial scattering functions were obtained. The
partial scattering function obtained for SP was well reproduced by a spherical
form factor and matched the SANS profile for the SBR/SP mixture. The partial
scattering function for CP exhibited surface fractal behaviour according to q�3.6,
which is consistent with the results for the SBR/CP mixture.
1. Introduction
Contrast variation in small-angle neutron scattering (SANS) is
a very useful technique for investigating multi-component
systems. For example, in a three-component (ternary) system,
contrast variation can emphasize the scattering from a specific
component. Therefore, by decomposing the result, we can
obtain the partial scattering functions. For this purpose,
ISSN 1600-5767

deuterium substitution has conventionally been used, which
takes advantage of the difference in neutron scattering length
between protons and deuterons. The deuterium substitution
technique can easily be applied to solutions or gels, owing to
the reasonable availability of deuterated solvents, whereas the
synthesis of deuterated polymers is more costly and requires
greater effort, especially for industrial materials. Hence,
alternative methods applicable to industrial polymer systems
are needed.
Besides deuterium substitution, contrast variation can also
be achieved by controlling the spin states of both neutrons and
protons. The coherent scattering length (bcoh,H) and in-
coherent scattering cross section (�inc,H) for hydrogen (or
protons) are given by the following equations (Sears, 1992):
bcoh;H ¼ �0:374þ 1:456PHPNð Þ � 10�12 cm ð1Þ
and
�inc;H ¼ 79:9 1� 23 PHPN �
13 P2
H
� �� 10�24 cm2; ð2Þ
where PN and PH denote the polarization of neutrons and
protons, respectively. Polarization is the difference in popu-
lations between up and down spins. Figs. 1(a) and 1(b) show
the PH dependence of bcoh,H and �inc,H, respectively. Note that
the variation in bcoh,H is about 2.5 times larger than that caused
only by deuterium substitution under ordinary conditions
(then PHPN = 0). For PHPN = 0, the coherent scattering length
of hydrogen is �0.374, whereas that for a deuteron is 0.667 �
10�12 cm (Sears, 1992).
Polarization at thermal equilibrium (TE) states for proton
(PH,TE) and electron spins (Pe,TE) can be described by
considering the Zeeman splitting energy and Boltzmann
statistics:
PH;TE ¼ tanhh- �HH0
kBT
� �; ð3Þ
Pe;TE ¼ tanhh- �e
�� ��H0
kBT
� �; ð4Þ
where h- is Planck’s constant divided by 2�, �H and �e are the
gyromagnetic ratios of a proton and an electron, respectively,
H0 is the magnetic field, kB is Boltzmann’s constant, and T is
the temperature.
Table 1 lists the polarization values at thermal equilibrium
evaluated according to equations (3) and (4). At room
temperature, up and down proton spins are almost equally
populated. With decreasing temperature, spin polarization
increases. However, even at 3.3 T and 1.2 K, the proton spin is
polarized up to only 0.3%. In contrast, the electron spin is
polarized up to 95% under the same conditions (at 3.3 T and
1.2 K). This is because of the large difference in gyromagnetic
ratio between the electron spin and the proton spin (|�e|/�H =
658). The large polarization of the electron spin can be
transferred to the proton spin by microwave irradiation with
energy equal to the simultaneous flipping of electron and
proton spins (Abragam & Goldman, 1978). Consequently,
high proton spin polarization is achieved. This is called
dynamic nuclear polarization (DNP) and requires electron
spin doping, a magnetic field, low temperature and microwave
irradiation.
For SANS investigations, proton spin polarization was first
applied to structural analysis on the ribosomal protein struc-
ture in solution (Stuhrmann et al., 1986). After that pioneering
work, several papers reported the utilization of proton spin
polarization in neutron scattering experiments (Kohgi et al.,
1987; Knop et al., 1992; Fermon et al., 1992; Grinten et al., 1995;
Brandt et al., 2006, 2007; Noda et al., 2009, 2011, 2013; Kumada
et al., 2010; Stuhrmann, 2015).
Bunyatova (2004) originally developed the vapour sorption
technique of TEMPO [(2,2,6,6-tetramethylpiperidine-1-yl)oxy]
research papers
J. Appl. Cryst. (2016). 49, 2036–2045 Yohei Noda et al. � Contrast variation by DNP and TOF-SANS 2037
Table 1Proton and electron spin polarization at thermal equilibrium (3.35 T).
Temperature Proton spin polarization Electron spin polarization
300 K 0.001% 0.7%4.2 K 0.082% 48%1.2 K 0.30% 95%
Figure 2Chemical structure formulae of (a) TEMPO and (b) styrene–butadienerandom copolymer, SBR.
Figure 1(a) Neutron coherent scattering length and (b) neutron incoherentscattering cross section of a proton as a function of proton spinpolarization PH.
radicals into solid polymer materials to create polarized
targets in nuclear physics experiments. Fig. 2(a) shows the
molecular structure formula of TEMPO. On the basis of this
technique, we prepared polymer systems for SANS studies
after the construction of a DNP cryostat (Kumada et al.,
2009a,b) and polarized neutron ultra-small-angle scattering
spectrometer (SANS-J-II) (Koizumi et al., 2007) at research
reactor JRR-3, Tokai, Japan. We investigated a polyethylene
film (Noda et al., 2009) and a di-block copolymer to evaluate
precisely the inhomogeneity of the proton polarization around
the doped TEMPO molecules (Noda et al., 2011). Subse-
quently, the vapour sorption technique was successfully
applied to silica-filled rubber, which is used for fuel-efficient
tyres (Noda et al., 2013). The vapour sorption technique can
be applied to industrial rubber products after a manufacturing
process.
A tyre, i.e. a multi-component nanocomposite, is an
attractive target for contrast variation SANS with DNP. To
improve wear and tear resistance, filler particles, such as
carbon black (CB) and silica particles (SP), are mixed into the
rubber matrix. The spatial distribution of filler particles in the
rubber matrix determines not only the tyre’s reinforcement
but also its energy loss performance (Schaefer et al., 2000;
Koga et al., 2005, 2008; Takenaka et al., 2009; Bouty et al., 2014;
Genix & Oberdisse, 2015). In accordance with the empirical
knowledge that a homogeneous dispersion of filler particles
lowers the energy loss, various attempts towards dispersion
control have been conducted (Byers, 2002). To optimize tyre
rubber performance, a reliable methodology for evaluating
the filler particle dispersion is critical.
The combination of CB and SP is frequently used for
manufacturing tyres. In addition to the above-mentioned
effects, CB is advantageous for specific UV resistance and
electric discharge. For precise structural analyses, we need to
decompose the total SANS observed for a multi-component
system into individual partial scattering functions.
In this article, we report our recent achievements on DNP
and contrast variation SANS on model mixtures for industrial
tyres. At the Materials and Life Science Experimental Facility
(MLF) of the Japan Proton Accelerator Research Complex
(J-PARC), we performed time-of-flight (TOF) SANS experi-
ments, employing a wide range of neutron wavelength (�).
This causes imperfect neutron polarization (PN), depending
on � and variations in the coherent and incoherent scattering
lengths.
2. Experimental
2.1. Sample preparation
As a model system for an industrial tyre, we prepared two
types of rubber specimen: a binary mixture of styrene–buta-
diene random copolymer (SBR) with silica particles (SBR/
SP), and a ternary mixture of SBR with silica and CB particles
(SBR/SP/CP). Fig. 2(b) shows the molecular structure formula
of SBR. As listed in Table 2, the samples consist of solution-
SBR (S-SBR, Buna VSL 4720, Lanxess Corp.), silica particles
(Seahostar KE-P10, Nippon Shokubai Co. Ltd), CB (N330,
Tokai Carbon Co. Ltd), silane coupling agent (Si 69, Evonik
Degussa GmbH) and other additives. We selected silica
particles with a narrow radius distribution.
All ingredients were mixed in a milling machine and the
resulting mixture was pressed into a mould and kept at 443 K
for 20 min. The thicknesses of the SBR/SP and SBR/SP/CP
specimens produced were 0.56 and 0.24 mm, respectively.
2.2. Vapour absorption of TEMPO into the rubber
In order to perform DNP, an electron spin source is
required in a specimen. By a vapour sorption technique, the
stable free radical molecule TEMPO (Fig. 2a) was introduced
into the rubbery mixture prepared in x2.1. The vaporized
TEMPO radicals were spontaneously absorbed and diffused
into the amorphous matrix of SBR. We placed the rubber
research papers
2038 Yohei Noda et al. � Contrast variation by DNP and TOF-SANS J. Appl. Cryst. (2016). 49, 2036–2045
Table 2Specimen composition in vol.%.
DCP is dicumyl peroxide, TBBS is N-tert-butyl-2-benzothiazyl sulfenamide,DPG is 1,3-diphenylguanidine and Acc. denotes accelerator.
Specimen S-SBR Silica CBStearicacid
Silane-couplingagent DCP
Acc.TBBS
Acc.DPG
SBR/SP 84.6 10.0 0.00 1.87 1.49 0.71 0.62 0.66SBR/SP/CP 82.7 10.0 2.00 1.83 1.50 0.69 0.60 0.65
Figure 3A photograph of the DNP cryostat.

mixtures with TEMPO inside a sealed container at 313 K for
1 week. Consequently, the vaporized TEMPO spontaneously
permeated the rubber matrix. By electron spin resonance
measurements, the TEMPO concentrations were determined
at 37 and 35 mM for the binary (SBR/SP) and ternary (SBR/
SP/CP) mixtures, respectively. These concentrations were
close enough to the optimum value (30 mM) for DNP.
The influence of the added TEMPO on the microstructure
should be noted. We confirmed experimentally that SANS
obtained for the mixture after TEMPO doping coincided with
that obtained for the mixture before doping. The static
structure, which is a target of this contrast variation SANS
study, was not affected by the addition of TEMPO. On the
other hand, regarding dynamic properties, the storage and loss
modulus (Busfield et al., 2000) and the longitudinal and
transverse proton relaxation times (Stapf & Kariyo, 2005)
were affected by the addition of small organic molecules (a
few per cent in weight), which is known as the ‘plasticizer’
effect.
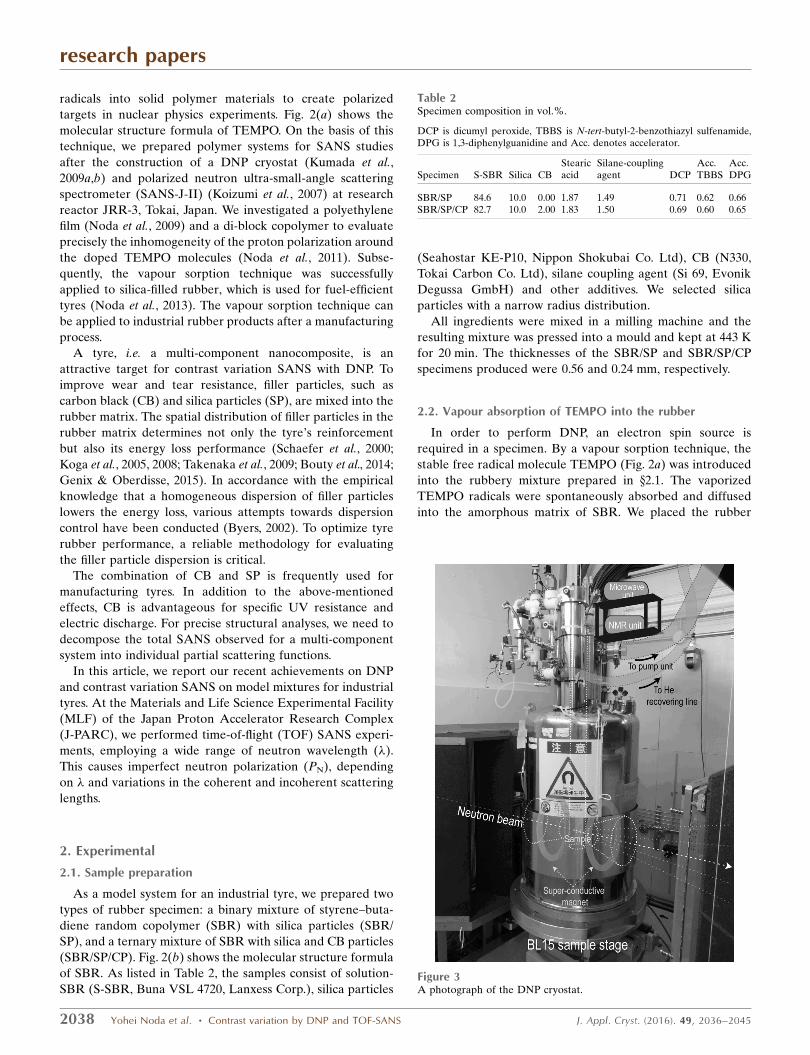
2.3. DNP
Fig. 3 shows the DNP cryostat used in this study (Kumada et
al., 2009a,b). A rubber specimen is placed in a chamber filled
with liquid 4He. By evaporating the liquid 4He, the specimen is
cooled to 1.2 K during continuous microwave irradiation
(94 GHz). The sample chamber is located between the split-
type superconducting magnet coils. The superconducting
magnet generates a magnetic field up to 3.5 T at the sample
position. The magnetic field is parallel to the neutron beam
direction. The inhomogeneity of the magnetic field (�B/B0)
was designed to be less than 10�4 to avoid proton spin
depolarization. The neutron beam passes along the central
axis of the magnet coils. The windows through which the
neutron beam passes are formed of thin aluminium plates,
which cause less background scattering.
Fig. 4(a) shows a photograph of the sample cell. On the
upstream side, a Cd plate with a 12 mm diameter hole is fixed.
A thin (0.1 mm) aluminium sheet is fixed inside to prevent
microwave leakage. The aluminium case has several holes for
research papers
J. Appl. Cryst. (2016). 49, 2036–2045 Yohei Noda et al. � Contrast variation by DNP and TOF-SANS 2039
Figure 4The sample cell of the DNP cryostat. Further detail for parts (a) to (c) isgiven in the text.
Table 3Specification of the DNP cryostat.
Magnetic field 3.35 T, parallel with neutron beam,inhomogeneity < 0.5 � 10�4 (relative)
Specimen temperature 1.2 K (single-shot), 4He evaporation cryostatMicrowave 94 GHz Gunn oscillatorNMR circuit 144 MHz, continuous-wave, frequency-sweep
Figure 5The DNP experimental layout on BL15 TAIKAN of the MLF at J-PARC.

circulating liquid He; the diameter of these holes is 0.5 mm,
which is much less than the 94 GHz microwave wavelength
(3 mm). Fig. 4(b) shows a photograph of the sample cell when
the upstream side cover is removed. Inside the aluminium
case, a polytetrafluoroethylene (PTFE) part supports a three-
turn NMR coil made of 0.1 mm-thick aluminium plate for PH
evaluation. PH is evaluated using the continuous-wave NMR
circuit, which is described later in x3.1. As shown in Fig. 4(c), a
sheet sample (14 � 14 � 1 mm) is inserted from the bottom
into the NMR coil. After insertion of the sample, the alumi-
nium block supporting the sample bottom is fixed by screws.
Microwave radiation (94 GHz) is generated by the Gunn
oscillator fixed over the top plate of the cryostat, which
irradiates the sample through a stainless steel pipe of length
1 m and inside diameter 6 mm, filled with a PTFE rod. The
specifications of the DNP cryostat are summarized in Table 3.
2.4. SANS
TOF-SANS experiments were performed on the TAIKAN
instrument (BL15) (Shinohara, Suzuki et al., 2009; Shinohara,
Takata et al., 2009; Takata et al., 2015) at the MLF of J-PARC.
The TAIKAN instrument is equipped with a magnetic
supermirror polarizer, composed of an Fe/Si multilayer (4Qc).
Fig. 5 shows a schematic diagram of the device allocations on
the SANS instrument. The roof of the shielding room has a
sliding hatch covering the sample stage. Through this sliding
hatch, the DNP cryostat was introduced onto the sample stage.
The DNP cryostat was originally designed for SANS-J-II at
JRR-3 and cannot fully cover the detectors of TAIKAN,
having detectors for neutrons with wider scattering angles (2�> 15�). The roof of the shielding room has two trenches under
the sliding hatch. Through these trenches, pipes and cables
were pulled out. The pipes are necessary to evaporate liquid
4He and to supply 4He gas. The cables are for energizing the
superconducting magnet, monitoring the signals from the
liquid helium level meter and the pressure and temperature
sensors, measuring the NMR signals, and supplying voltage to
the microwave generator. The mechanical booster pump unit
and the two electronic racks were placed on the roof of the
shield room. Consequently, we remotely controlled the
magnetic field, sample temperature, NMR measurements and
microwave irradiation.
3. Experimental results and discussion
3.1. Proton NMR
Prior to SANS experiments with proton spin polarization, it
is important to investigate the proton spin polarization
behaviour of the TEMPO-doped rubber specimens using
proton NMR. Fig. 6 shows the results of proton NMR. The
integrated NMR signal was calibrated in order to coincide
with the thermal equilibrium PH = 0.082% at 3.35 T and 4.2 K,
which is given according to equation (3). Then by NMR, we
can evaluate the bulk PH averaged over a whole specimen.
Fig. 7 shows the bulk PH as a function of microwave
frequency. By tuning the microwave frequency, the bulk PH is
converted from positive to negative. The microwave frequency
can easily be controlled by the voltage supplied to the Gunn
oscillator. The bulk PH also depends not only on the micro-
wave frequency but also on the sample temperature.
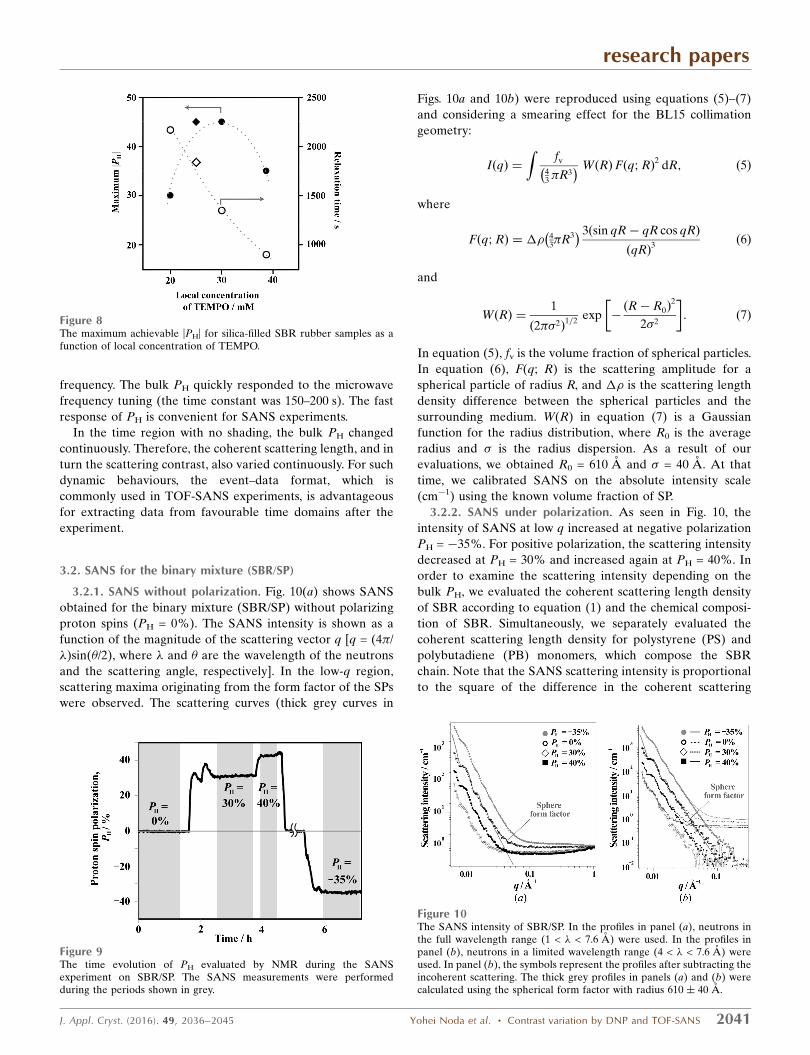
Fig. 8 shows the bulk PH determined as a function of
TEMPO concentration. At 30 mM, |PH| reaches a maximum
value. Fig. 8 also shows the proton spin relaxation time. As the
TEMPO concentration increases, the spin relaxation time
decreases monotonically owing to the increase in magnetic
field fluctuation which is caused by TEMPO radicals.
Fig. 9 shows the time profile of the bulk PH during the
SANS experiment on the binary mixture (SBR/SP). Each
SANS measurement was performed when the bulk PH was
kept constant, as indicated by the shaded areas in Fig. 9. From
1.8 to 2.2 h, the bulk PH was swept in order to search for the
contrast matching condition by changing the microwave
research papers
2040 Yohei Noda et al. � Contrast variation by DNP and TOF-SANS J. Appl. Cryst. (2016). 49, 2036–2045
Figure 6Proton NMR signal enhancement by DNP. TE denotes the signalobserved at a thermal equilibrium of 3.35 T and 4.2 K (PH = 0.082%). Thesample was a 25 mM TEMPO-doped SBR rubber without filler.
Figure 7The microwave frequency dependence of proton spin polarization. Thesample was a 25 mM TEMPO-doped SBR rubber without filler.
frequency. The bulk PH quickly responded to the microwave
frequency tuning (the time constant was 150–200 s). The fast
response of PH is convenient for SANS experiments.
In the time region with no shading, the bulk PH changed
continuously. Therefore, the coherent scattering length, and in
turn the scattering contrast, also varied continuously. For such
dynamic behaviours, the event–data format, which is
commonly used in TOF-SANS experiments, is advantageous
for extracting data from favourable time domains after the
experiment.
3.2. SANS for the binary mixture (SBR/SP)
3.2.1. SANS without polarization. Fig. 10(a) shows SANS
obtained for the binary mixture (SBR/SP) without polarizing
proton spins (PH = 0%). The SANS intensity is shown as a
function of the magnitude of the scattering vector q [q = (4�/
�)sin(�/2), where � and � are the wavelength of the neutrons
and the scattering angle, respectively]. In the low-q region,
scattering maxima originating from the form factor of the SPs
were observed. The scattering curves (thick grey curves in
Figs. 10a and 10b) were reproduced using equations (5)–(7)
and considering a smearing effect for the BL15 collimation
geometry:
IðqÞ ¼
Zfv
43�R3� � WðRÞFðq; RÞ2 dR; ð5Þ
where
Fðq; RÞ ¼ �� 43�R3� � 3ðsin qR� qR cos qRÞ
ðqRÞ3 ð6Þ
and
WðRÞ ¼1
2��2ð Þ1=2
exp �R� R0ð Þ
2
2�2
� �: ð7Þ
In equation (5), fv is the volume fraction of spherical particles.
In equation (6), F(q; R) is the scattering amplitude for a
spherical particle of radius R, and �� is the scattering length
density difference between the spherical particles and the
surrounding medium. W(R) in equation (7) is a Gaussian
function for the radius distribution, where R0 is the average
radius and � is the radius dispersion. As a result of our
evaluations, we obtained R0 = 610 A and � = 40 A. At that
time, we calibrated SANS on the absolute intensity scale
(cm�1) using the known volume fraction of SP.
3.2.2. SANS under polarization. As seen in Fig. 10, the
intensity of SANS at low q increased at negative polarization
PH = �35%. For positive polarization, the scattering intensity
decreased at PH = 30% and increased again at PH = 40%. In
order to examine the scattering intensity depending on the
bulk PH, we evaluated the coherent scattering length density
of SBR according to equation (1) and the chemical composi-
tion of SBR. Simultaneously, we separately evaluated the
coherent scattering length density for polystyrene (PS) and
polybutadiene (PB) monomers, which compose the SBR
chain. Note that the SANS scattering intensity is proportional
to the square of the difference in the coherent scattering
research papers
J. Appl. Cryst. (2016). 49, 2036–2045 Yohei Noda et al. � Contrast variation by DNP and TOF-SANS 2041
Figure 8The maximum achievable |PH| for silica-filled SBR rubber samples as afunction of local concentration of TEMPO.
Figure 9The time evolution of PH evaluated by NMR during the SANSexperiment on SBR/SP. The SANS measurements were performedduring the periods shown in grey.
Figure 10The SANS intensity of SBR/SP. In the profiles in panel (a), neutrons inthe full wavelength range (1 < � < 7.6 A) were used. In the profiles inpanel (b), neutrons in a limited wavelength range (4 < � < 7.6 A) wereused. In panel (b), the symbols represent the profiles after subtracting theincoherent scattering. The thick grey profiles in panels (a) and (b) werecalculated using the spherical form factor with radius 610 � 40 A.

length density. We found that the matching point between
silica and SBR appears at PH = 30% (Fig. 11a).
As shown in Fig. 10(a), at high q between 0.1 and 0.3 A�1,
the SANS exhibited q-independent behaviour. It can readily
be seen that the scattering intensity in this q region has
decreased with increasing PH. This is consistent with the
description for incoherent scattering according to equation
(2). However, the influence of the imperfect neutron polar-
ization on the incoherent scattering should be noted. If we
postulate PN = 0 in equation (2), we obtain
�inc;H ¼ 79:9 1� 13P
2H
� �� 10�24 cm2: ð8Þ
In Fig. 1(b), �inc,H with PN = 0 is shown by the dashed line,
indicating clearly different behaviour from the case with PN = 1.
In the TOF-SANS experiments, we utilized neutrons with a
wide � range simultaneously. The shorter-� neutrons contri-
bute to the higher-q region, whereas the longer-� neutrons
contribute to the lower-q region. Fig. 12 shows the PN
provided at TAIKAN as a function of �. PN has decreased with
decreasing � for � < 4 A, and become almost zero for � < 1 A.
Polarized neutrons are used effectively in polarization
analysis for separating coherent and incoherent scattering. In
this technique, by examining the spin-flip and non-spin-flip
contributions, we can separate the coherent and incoherent
scattering contributions. In the separation process, the
� dependence of PN can easily be corrected.
However, in the case of spin contrast variation, the
� dependence of PN affects not only the incoherent scattering
length but also the coherent scattering length. Therefore, in
the following analysis in this study, we only use data with 4 <
� < 7.6 A, where PN > 97% is satisfied. The results are shown
in Fig. 10(b). The observed q region is limited (q < 0.3 A�1)
because we excluded the shorter-� contribution.
3.2.3. Transmission under polarization. The transmission
(T) increased with increasing PH, as shown in Fig. 13(a). T is
given by
T ¼ exp ��tottð Þ; ð9Þ
where t is the sample thickness and �tot is given by
�tot ¼P
i
ni �tot;i: ð10Þ
Here, i is the index for labelling the nuclear species, ni is the
number density for the labelled nuclear species and �tot,i is the
total cross section (the sum of coherent scattering, incoherent
scattering and absorption cross sections) of the labelled
nuclear species. For protons, the total scattering cross section
(�tot,H) is given by
�tot;H ¼ 81:99� 66:97PHð Þ � 10�24 cm2; ð11Þ
and for SBR/SP, �tot = 4.49 � 3.48PH cm�1. In Fig. 13(a), T
calculated by equation (9) is indicated by the dotted line. The
transmission determined experimentally is consistent with the
evaluation by equation (9), although the values are slightly
high. The difference might be attributed to sample thickness
distribution or multiple and inelastic scattering.
3.2.4. In the low-q region. The scattering intensity at low q
(q = 0.01 A�1) is shown as a function of PH in Fig. 13(b). In the
low-q region, the coherent scattering originating from silica
particles is dominant. The solid line in Fig. 13(b) exhibits a
contrast factor in between those of the silica and SBR phases
[(�SP � �SBR)2], where �SP is the scattering length density of
silica (3.08 � 1010 cm�2) and �SBR is the scattering length
density of SBR [(0.62 + 8.39PH) � 1010 cm�2]. The evaluated
solid line agrees well with the experimental results.
3.2.5. In the high-q scattering region. The scattering
intensity at high q (q = 0.3 A�1) is shown as a function of PH in
Fig. 13(c). In this high-q region, incoherent scattering (Iinc) is
dominant because the coherent scattering intensity from silica
particles decreases drastically with increasing q. Iinc is given by
Iinc ¼�inc
4�; ð12Þ
where �inc is the sum of the incoherent scattering cross section
per unit volume,
�inc ¼P
i
ni �inc;i: ð13Þ
Here, i is the index for labelling nuclear species, ni is the
number density for the labelled nuclear species and �inc,i is the
incoherent scattering cross section of the labelled nuclear
species. Using �inc,H in equation (2) for SBR/SP, equation (13)
transforms to
research papers
2042 Yohei Noda et al. � Contrast variation by DNP and TOF-SANS J. Appl. Cryst. (2016). 49, 2036–2045
Figure 11(a) Neutron scattering length density as a function of PH. (b) Schematicsof the microstructure of SBR/SP/CP. The degree of shading reflects theneutron scattering length density.
Figure 12Neutron spin polarization as a function of neutron wavelength, �,obtained for the BL15 supermirror polarizer.

�inc ¼ 4:14 1� 23 PH �
13 P2
H
� �cm�1: ð14Þ
The calculated results are shown in Fig. 13c by the dotted line,
which does not reproduce the experiments well. By consid-
ering multiple scattering effects, Iinc is given by the following
equation (Shibayama et al., 2005):
Iinc ¼exp �inctð Þ � 1
4�t: ð15Þ
In Fig. 13(c), the solid grey line is calculated using equation
(15) and a thickness t = 0.056 cm. It is closer to the experi-
mental result, but still lower. This discrepancy might be
attributed to the coherent scattering contribution that still
exists in the high-q region. As shown in Fig. 11, the coherent
scattering length densities of the PS and PB composing SBR
deviate from each other for negative PH. Thus, local concen-
tration fluctuations between PS and PB might give rise to
coherent scattering, even at high q.
3.3. SANS for the ternary mixture (SBR/SP/CP)
Fig. 14(a) shows the SANS results obtained for the ternary
mixture system (SBR/SP/CP). According to the discussion in
x3.2 for the data reduction, we employed the limited wave-
length range of 4 < � < 7.6 A, which gives PN > 97%. As
expected for a ternary mixture, the q dependence of the SANS
varies significantly with changing proton spin polarization; the
scattering maxima due to silica particles were observed for
PH = 0% and PH = �34%, whereas they disappeared for PH =
29% and PH = 38%. As already shown in Fig. 11, the scattering
length densities of silica and SBR match at PH = 30%. Around
the matching point, the CB contribution was observed more
clearly.
3.3.1. Partial scattering function decomposition. The
SANS intensity for the ternary mixture is given by the sum of
three partial scattering functions [SSP–SP(q), SCP–CP(q) and
SSP–CP (q)] as follows:
I q; PHð Þ ¼ �SP � �SBR PHð Þ 2
SSP�SPðqÞ
þ �CP � �SBR PHð Þ 2
SCP�CPðqÞ
þ 2 �SP � �SBR PHð Þ
�CP � �SBR PHð Þ
SSP�CPðqÞ; ð16Þ
where the partial scattering functions are weighted by a
contrast factor. In this equation, �SP, �CP and �SBR correspond
to the neutron scattering length densities of the silica, CB and
SBR phases, respectively: �SP = 3.08� 1010 cm�2, �CP = 6.50�
1010 cm�2 and �SBR = (0.62 + 8.39PH) � 1010 cm�2. Only �SBR
depends on PH, because SBR contains hydrogen. SSP–SP(q),
SCP–CP(q) and SSP–CP(q) are defined by the following equation:
Si�jðqÞ ¼1
V
Z Z�’iðrÞ �’jðr
0Þ exp �iq � ðr� r0Þ½ dr dr0; ð17Þ
where the subscript i or j labels one of the components (SP, CP
or SBR) and �’i(r) indicates the fluctuation in the volume
fraction of component i at position r. We observed the SANS
research papers
J. Appl. Cryst. (2016). 49, 2036–2045 Yohei Noda et al. � Contrast variation by DNP and TOF-SANS 2043
Figure 13(a) Neutron transmission, (b) scattering intensity at low q (0.01 A�1) and (c) scattering intensity at high q (0.3 A�1), all as a function of PH for SBR/SP. Inpanel (a), the circles and crosses denote the results for neutrons with � = 6 A and � = 4 A, respectively. The dotted line is the calculated exp(��tott). Inpanel (c), the dotted and solid grey lines are the calculated �inc/(4�) and [exp(�inct) � 1]/(4�t), respectively.
Figure 14(a) The SANS profiles for SBR/SP/CP. The scattering profiles aftersubtraction of the incoherent scattering are denoted by symbols. (b) Theseparated partial scattering functions (SSP–SP, SCP–CP and SSP–CP). Thegrey curve is the calculated spherical form factor with the parametersdetermined for SBR/SP.
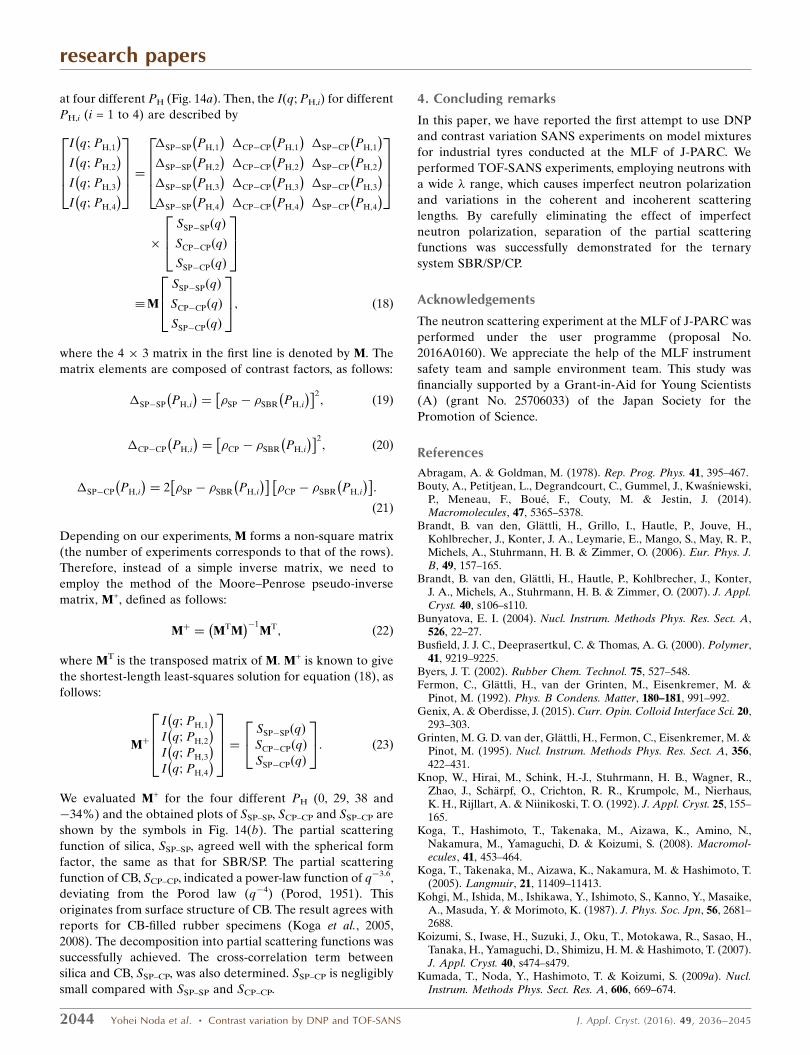
at four different PH (Fig. 14a). Then, the I(q; PH,i) for different
PH,i (i = 1 to 4) are described by
I q; PH;1
� �I q; PH;2
� �I q; PH;3
� �I q; PH;4
� �
26664
37775 ¼
�SP�SP PH;1
� ��CP�CP PH;1
� ��SP�CP PH;1
� ��SP�SP PH;2
� ��CP�CP PH;2
� ��SP�CP PH;2
� ��SP�SP PH;3
� ��CP�CP PH;3
� ��SP�CP PH;3
� ��SP�SP PH;4
� ��CP�CP PH;4
� ��SP�CP PH;4
� �
26664
37775
�
SSP�SPðqÞ
SCP�CPðqÞ
SSP�CPðqÞ
264
375
M
SSP�SPðqÞ
SCP�CPðqÞ
SSP�CPðqÞ
264
375; ð18Þ
where the 4 � 3 matrix in the first line is denoted by M. The
matrix elements are composed of contrast factors, as follows:
�SP�SP PH;i
� �¼ �SP � �SBR PH;i
� � 2; ð19Þ
�CP�CP PH;i
� �¼ �CP � �SBR PH;i
� � 2; ð20Þ
�SP�CP PH;i
� �¼ 2 �SP � �SBR PH;i
� � �CP � �SBR PH;i
� � :
ð21Þ
Depending on our experiments, M forms a non-square matrix
(the number of experiments corresponds to that of the rows).
Therefore, instead of a simple inverse matrix, we need to
employ the method of the Moore–Penrose pseudo-inverse
matrix, M+, defined as follows:
Mþ ¼ MTM� ��1
MT; ð22Þ
where MT is the transposed matrix of M. M+ is known to give
the shortest-length least-squares solution for equation (18), as
follows:
Mþ
I q; PH;1
� �I q; PH;2
� �I q; PH;3
� �I q; PH;4
� �
2664
3775 ¼
SSP�SPðqÞ
SCP�CPðqÞ
SSP�CPðqÞ
24
35: ð23Þ
We evaluated M+ for the four different PH (0, 29, 38 and
�34%) and the obtained plots of SSP–SP, SCP–CP and SSP–CP are
shown by the symbols in Fig. 14(b). The partial scattering
function of silica, SSP–SP, agreed well with the spherical form
factor, the same as that for SBR/SP. The partial scattering
function of CB, SCP–CP, indicated a power-law function of q�3.6,
deviating from the Porod law (q�4) (Porod, 1951). This
originates from surface structure of CB. The result agrees with
reports for CB-filled rubber specimens (Koga et al., 2005,
2008). The decomposition into partial scattering functions was
successfully achieved. The cross-correlation term between
silica and CB, SSP–CP, was also determined. SSP–CP is negligibly
small compared with SSP–SP and SCP–CP.
4. Concluding remarks
In this paper, we have reported the first attempt to use DNP
and contrast variation SANS experiments on model mixtures
for industrial tyres conducted at the MLF of J-PARC. We
performed TOF-SANS experiments, employing neutrons with
a wide � range, which causes imperfect neutron polarization
and variations in the coherent and incoherent scattering
lengths. By carefully eliminating the effect of imperfect
neutron polarization, separation of the partial scattering
functions was successfully demonstrated for the ternary
system SBR/SP/CP.
Acknowledgements
The neutron scattering experiment at the MLF of J-PARC was
performed under the user programme (proposal No.
2016A0160). We appreciate the help of the MLF instrument
safety team and sample environment team. This study was
financially supported by a Grant-in-Aid for Young Scientists
(A) (grant No. 25706033) of the Japan Society for the
Promotion of Science.
References
Abragam, A. & Goldman, M. (1978). Rep. Prog. Phys. 41, 395–467.Bouty, A., Petitjean, L., Degrandcourt, C., Gummel, J., Kwasniewski,
P., Meneau, F., Boue, F., Couty, M. & Jestin, J. (2014).Macromolecules, 47, 5365–5378.
Brandt, B. van den, Glattli, H., Grillo, I., Hautle, P., Jouve, H.,Kohlbrecher, J., Konter, J. A., Leymarie, E., Mango, S., May, R. P.,Michels, A., Stuhrmann, H. B. & Zimmer, O. (2006). Eur. Phys. J.B, 49, 157–165.
Brandt, B. van den, Glattli, H., Hautle, P., Kohlbrecher, J., Konter,J. A., Michels, A., Stuhrmann, H. B. & Zimmer, O. (2007). J. Appl.Cryst. 40, s106–s110.
Bunyatova, E. I. (2004). Nucl. Instrum. Methods Phys. Res. Sect. A,526, 22–27.
Busfield, J. J. C., Deeprasertkul, C. & Thomas, A. G. (2000). Polymer,41, 9219–9225.
Byers, J. T. (2002). Rubber Chem. Technol. 75, 527–548.Fermon, C., Glattli, H., van der Grinten, M., Eisenkremer, M. &
Pinot, M. (1992). Phys. B Condens. Matter, 180–181, 991–992.Genix, A. & Oberdisse, J. (2015). Curr. Opin. Colloid Interface Sci. 20,
293–303.Grinten, M. G. D. van der, Glattli, H., Fermon, C., Eisenkremer, M. &
Pinot, M. (1995). Nucl. Instrum. Methods Phys. Res. Sect. A, 356,422–431.
Knop, W., Hirai, M., Schink, H.-J., Stuhrmann, H. B., Wagner, R.,Zhao, J., Scharpf, O., Crichton, R. R., Krumpolc, M., Nierhaus,K. H., Rijllart, A. & Niinikoski, T. O. (1992). J. Appl. Cryst. 25, 155–165.
Koga, T., Hashimoto, T., Takenaka, M., Aizawa, K., Amino, N.,Nakamura, M., Yamaguchi, D. & Koizumi, S. (2008). Macromol-ecules, 41, 453–464.
Koga, T., Takenaka, M., Aizawa, K., Nakamura, M. & Hashimoto, T.(2005). Langmuir, 21, 11409–11413.
Kohgi, M., Ishida, M., Ishikawa, Y., Ishimoto, S., Kanno, Y., Masaike,A., Masuda, Y. & Morimoto, K. (1987). J. Phys. Soc. Jpn, 56, 2681–2688.
Koizumi, S., Iwase, H., Suzuki, J., Oku, T., Motokawa, R., Sasao, H.,Tanaka, H., Yamaguchi, D., Shimizu, H. M. & Hashimoto, T. (2007).J. Appl. Cryst. 40, s474–s479.
Kumada, T., Noda, Y., Hashimoto, T. & Koizumi, S. (2009a). Nucl.Instrum. Methods Phys. Sect. Res. A, 606, 669–674.
research papers
2044 Yohei Noda et al. � Contrast variation by DNP and TOF-SANS J. Appl. Cryst. (2016). 49, 2036–2045

Kumada, T., Noda, Y., Hashimoto, T. & Koizumi, S. (2009b). Phys. BCondens. Matter, 404, 2637–2639.
Kumada, T., Noda, Y., Koizumi, S. & Hashimoto, T. (2010). J. Chem.Phys. 133, 054504.
Noda, Y., Kumada, T., Hashimoto, T. & Koizumi, S. (2009). Phys. BCondens. Matter, 404, 2572–2574.
Noda, Y., Kumada, T., Hashimoto, T. & Koizumi, S. (2011). J. Appl.Cryst. 44, 503–513.
Noda, Y., Yamaguchi, D., Hashimoto, T., Shamoto, S., Koizumi, S.,Yuasa, T., Tominaga, T. & Sone, T. (2013). Phys. Procedia, 42, 52–57.
Porod, G. (1951). Kolloid Z. 124, 83–114.Schaefer, D. W., Rieker, T., Agamalian, M., Lin, J. S., Fischer, D.,
Sukumaran, S., Chen, C., Beaucage, G., Herd, C. & Ivie, J. (2000). J.Appl. Cryst. 33, 587–591.
Sears, V. F. (1992). Neutron News, 3(3), 26–37.Shibayama, M., Nagao, M., Okabe, S. & Karino, T. (2005). J. Phys.
Soc. Jpn, 74, 2728–2736.
Shinohara, T., Suzuki, J., Oku, T., Takata, S., Kira, H., Suzuya, K.,Aizawa, K., Arai, M., Otomo, T. & Sugiyama, M. (2009). Phys. BCondens. Matter, 404, 2640–2642.
Shinohara, T., Takata, S., Suzuki, J., Oku, T., Suzuya, K., Aizawa, K.,Arai, M., Otomo, T. & Sugiyama, M. (2009). Nucl. Instrum.Methods Phys. Res. Sect. A, 600, 111–113.
Stapf, S. & Kariyo, S. (2005). Acta Phys. Pol. A, 108, 247–259.Stuhrmann, H. B. (2015). J. Optoelectron. Adv. Mater. 17, 1417–
1424.Stuhrmann, H. B., Scharpf, O., Krumpolc, M., Niinikoski, T. O.,
Rieubland, M. & Rijllart, A. (1986). Eur. Biophys. J. 14, 1–6.Takata, S., Suzuki, J., Shinohara, T., Oku, T., Tominaga, T., Ohishi, K.,
Iwase, H., Nakatani, T., Inamura, Y., Ito, T., Suzuya, K., Aizawa, K.,Arai, M., Otomo, T. & Sugiyama, M. (2015). JPS Conf. Proc. 8,036020.
Takenaka, M., Nishitsuji, S., Amino, N., Ishikawa, Y., Yamaguchi, D.& Koizumi, S. (2009). Macromolecules, 42, 308–311.
research papers
J. Appl. Cryst. (2016). 49, 2036–2045 Yohei Noda et al. � Contrast variation by DNP and TOF-SANS 2045