research openaccess subtype-specificcpgislandshore...
TRANSCRIPT
The Author(s) BMC Systems Biology 2016, 10(Suppl 4):116DOI 10.1186/s12918-016-0356-2
RESEARCH Open Access
Subtype-specific CpG island shoremethylation and mutation patterns in 30breast cancer cell linesHeejoon Chae1, Sangseon Lee2, Kenneth P. Nephew3 and Sun Kim2,4,5*
From The 27th International Conference on Genome InformaticsShanghai, China. 3-5 October 2016
Abstract
Background: Aberrant epigenetic modifications, including DNA methylation, are key regulators of gene activity intumorigenesis. Breast cancer is a heterogeneous disease, and large-scale analyses indicate that tumor from normaland benign tissues, as well as molecular subtypes of breast cancer, can be distinguished based on their distinctgenomic, transcriptomic, and epigenomic profiles. In this study, we used affinity-based methylation sequencing datain 30 breast cancer cell lines representing functionally distinct cancer subtypes to investigate methylation andmutation patterns at the whole genome level.
Results: Our analysis revealed significant differences in CpG island (CpGI) shore methylation and mutation patternsamong breast cancer subtypes. In particular, the basal-like B type, a highly aggressive form of the disease, displayeddistinct CpGI shore hypomethylation patterns that were significantly associated with downstream gene regulation.We determined that mutation rates at CpG sites were highly correlated with DNA methylation status and observeddistinct mutation rates among the breast cancer subtypes. These findings were validated by using targeted bisulfitesequencing of differentially expressed genes (n=85) among the cell lines.
Conclusions: Our results suggest that alterations in DNA methylation play critical roles in gene regulatory process aswell as cytosine substitution rates at CpG sites in molecular subtypes of breast cancer.
Keywords: Breast cancer, Subtype, DNA methylation, CpGI shore, Mutation
BackgroundBreast cancer is a diverse disease consisting of multipledifferent molecular subtypes, such as luminal A, luminalB, triple negative/basal-like, HER2-positive, and normalbreast [1]. As these subtypes are associated with differ-ences in clinical outcomes [2], more completely describingthe precise molecular nature of breast cancer may eventu-ally allow for “personalized” clinical decisions, translatingmolecular information into better treatments for patientswith breast cancer [3]. In this regard, gene expression
*Correspondence: [email protected] of Computer Science and Engineering, Seoul National University,Seoul, Republic of Korea4Interdisciplinary Program in Bioinformatics, Seoul National University, Seoul,Republic of KoreaFull list of author information is available at the end of the article
patterns have been widely used not only to identify breastcancer subtypes and but also to develop clinically usefulgene signatures. Microarray-based transcriptional profil-ing identified 50 genes used for a classifier called PAM50(Prosigna) [4]. The 21-gene assay Oncotype DX is predic-tive of breast cancer recurrence and the use of this 21-geneassay has a significant impact on treatment decisions [5].Beyond gene expression profiling, epigenetic modi-
fications, reversible, heritable and includes changes inDNA methylation, modification of histones and alteredmicroRNA expression levels, have received recent atten-tion in breast cancer subtypes [6, 7]. DNA methylationpatterns in particular have been used to distinguish breastcancer phenotypes [8–13], and differentially methylatedregions (DMRs) as prognostic breast cancer biomarkers(patient survival analysis) have been described [14, 15].
© The Author(s). 2016 Open Access This article is distributed under the terms of the Creative Commons Attribution 4.0International License (http://creativecommons.org/licenses/by/4.0/), which permits unrestricted use, distribution, andreproduction in any medium, provided you give appropriate credit to the original author(s) and the source, provide a link to theCreative Commons license, and indicate if changes were made. The Creative Commons Public Domain Dedication waiver(http://creativecommons.org/publicdomain/zero/1.0/) applies to the data made available in this article, unless otherwise stated.

The Author(s) BMC Systems Biology 2016, 10(Suppl 4):116 Page 434 of 548
Furthermore, based on the association of DNA methy-lation with altered gene expression, a number of “inte-grated” DNA methylation/gene expression analyses havebeen performed, including those by Feinberg and co-workers (2009) [16] demonstrating the importance ofmethylation in areas surrounding CpG island (CpGI)shores, Brenet et al. [17] reporting the importance of 1stexon methylation, Sproul et al. (2011) [18] on the role ofaberrant CpGI methylation and transcriptional repressionin breast cancer lineages, our recent reports integratingDNA methylation and gene expression in breast can-cer [19, 20]. However, a comparative analysis of DNAmethylation at CpGI, CpGI promoters, and CpGI shoresregions, more specifically at transcription binding site(TFBS) associated overlapped regions and their impact ongene expression in breast cancer molecular subtypes on agenome-wide level has not been reported.Gene mutations are key events in cancer development,
and recent cancer genome projects have yielded exten-sive comparisons of the mutational landscape in breastcancer subtypes [11] and mutations associated with clin-ical outcomes [21, 22]. In addition, complex relationshipsbetween mutation prevalence and transcription [23], aswell as an association between DNA methylation andgene mutations [24, 25] have been reported. Recently, in[19], we reported that genome-wide methylation profileswere distinct among breast cancer subtypes and therewere methylated sites in the promotor regions of genesthat were down-regulated in a cancer subtype specificallyway, suggesting that the methylated sites interfered inter-actions between transcription factors and the promotorgenomic regions. However, this study did not report sig-natures of methylation in specific genomic regions forbreast cancer subtypes and did not investigate relation-ship between DNA methylation and gene mutation ratesamong breast cancer molecular subtypes. By integrat-ing methylation and mutation patterns, we demonstratedthat:
1. Differential CpGI shore methylation patterns werecharacteristic of the basal B subtype. Furthermore,within CpGI shores, methylation at TFBSs andoverlapping promoter CpGI regions was associatedwith differential gene regulation in basal B comparedto other breast cancer subtypes.
2. Basal A breast cancer cells showed higher mutationrates at CpG sites with low or intermediatemethylation, whereas mutation rates were higher athypermethylated CpG sites in the basal B subtype.
MotivationThis work was motivated by our previous works inmodeling DNA methylation susceptibility [26–28] andconservation of CpG island sequences [29]. We and
many scientists believe that DNA methylation is not ran-dom and probably there is an instructive mechanismsembedded in the genomic sequences [30]. Thus ourmotivation is to investigate where there is any notablecorrelation between mutations (cancer-subtype specificgenomic sequences) and cancer subtype specific methyla-tion patterns. In fact, there is recent article that suggestsassociations between mutations and epigenetic changes[31]. Thus our goal in this study is to look for any associ-ation between genome sequence differences and methyla-tion patterns.
Methods30 breast cancer cell line and subtype difference estimationGenome wide DNA methylation status was measured inour previous work [19] by MBDCap sequencing from 30breast cancer cell lines representing three different molec-ular subtypes; basal A, basal B and luminal obtained from(see Additional file 1: Supplementary Table S1 for moreinformation on cell lines). MBDCap-seq utilizes affinitybetween MBD protein and methylated DNA sequenceand allows cost-efficient measurement of genome wideDNA methylation status. Initial quality trimming is per-formed by Trim Galore [32] to remove bad sequencequality reads, and remained reads were aligned to refer-ence genome (build hg19) by using Bowtie2 [33] with seedlength 22 and allowing zero mismatch in it. Multiple andduplicated reads are then filtered out to mediate the pos-sible PCR amplication bias. Aligned reads were countedthrough genome-wide scanning with 100bp length win-dow by usingMEDIPS, a R package providing fixed-lengthbin methylation estimation from affinity based sequenc-ing data in the form of relative methylation score (RMS)[34]. The RMS value of each 100bp bin was then comparedacross the tumor subtypes to extract DMRs and theirsignificance were tested by t-test with adjusted P-value(Bonferroni) < 0.05.Affymetrix microarray based gene expression data was
downloaded from [35] and expression level is measured byR Limma package [36] in Bioconductor. Background cor-rection and normalization is performed on signal intensityto measure expression, and pair-wise and three classessubtype gene expression comparison was performed toextract differentially expressed genes (DEG)s. For the pair-wise gene expression comparison, linear model basedLimma was used, and for three class comparison, mutualinformation based DEGPack [37] was used.Normal breast control data were obtained from TCGA
data portal (measured by whole genome bisulfite sequenc-ing (WGBS); id: TCGA-A7-A0CE-11A-21D-A148-05)and from genome wide methylome study [14] (measuredby MBDcap sequencing). Initial quality trimming andaligning were performed on both data set, and genomewide methylation status of TCGA WGBS data and

The Author(s) BMC Systems Biology 2016, 10(Suppl 4):116 Page 435 of 548
MBDCap sequencing data was measured by methylKit[38] and MEDIPS [34] respectively.
Targeted bisulfite-treatment sequencingOur previous work [19] used MBDCap sequencing datawithout bisulfite treatment. Thus we performed targetedbisulfite sequencing on 85 gene regions. Among 30 breastcancer cell lines, six samples (two lines representing eachsubtypes; see Additional file 1: Supplementary Table S1)were selected for targeted bisulfite treatment sequencingvalidation. Pre-library preparation utilized 3 μg DNA andall libraries passed a minimum fragment size of 200 to250 bp and ≥147 ng/μl quality control. Hybridization wasperformed using SureSelectTX Methyl-Seq Kit followedby post library generation with targeted genomic regioninformation. Final library concentration was 250>pM.Based on the captured library, bisulfite conversion wasperformed to distinguish methylated and unmethylatedDNA regions.Sequencing was performed on 85 distinct DEG regions
with additional 10 Kbp upstream of transcription start site(TSS) using Illumina HiSeq2500. A total of 300 millionreads were aligned to reference genome (build hg19) withbisulfite conversion by using Bismark [39], and each CpGsite methylation was measured by using methylKit [38].
Correlation between targeted bisulfite-treatmentsequencing andMBDcap sequencingAffinity based MBDcap sequencing captures methylatedreads and number of mapped reads at certain range rep-resents the methylation status on that. On the other hand,bisulfite treatment converts only un-methylated cytosineto uracil and given that information it provides methy-lation level in single base pair resolution. In order toestimate the correlation between methylation levels mea-sured by BS seq and MBDcap seq, genome-wide singlebase pair read coverage was measured from MBDcap seqdata. Then, CpG site read coverage was extracted andintersected with targeted bisulfite treated regions to filterout result from other regions. Lastly, 2 kb bin methyla-tion level were computed on both methods, and Pearson’scorrelation was estimated between them.
Experimentally validated transcription factor binding siteand their methylation statusIn search of the specific transcription factor binding sites(TFBSs) located in CpGI shores and the overlapping pro-moter region, we utilized match algorithm from TRANS-FAC [40]. Promoter sequences were extracted from 2 Kbupstream of the TSS in each DEGs, and TFmotif weightedmatrices were used to scan the TFBSs on the sequenceregions. Once TFBSs were predicted, we computed theTFBS specific methylation level by averaging methylationlevels in all 100 bp bins overlapping the TFBS. Finally,we adopted experimentally validated ChiP-seq databases
(HTRIdb [41], and ChEA [42]) to verify TF binding onpredicted TFBSs. In order to investigate potential down-stream effect caused by methylation difference on TFBS,differential methylation across tumor subtypes was mea-sured on TFBSs by Kruskal Wallis test (FDR < 0.1) andcorrelation with downstream gene was estimated (Spear-man’s rho < -0.5). To remove effect of TFs on gene regula-tion, we considered only TFs with similar gene expressionlevels, allowing us to focus on the role of DNA methyla-tion on downstream genes.
Mutation rate and subtype specific mutationMBDcap-seq is a DNA sequencing technology captur-ing methylated regions by utilizing affinity between MBDprotein and methylated DNA sequence. To investigatethe relationship between methyl-CpG mutation and theirmethylation level, genome wide point mutation discovery(matches short reads to the hg19 build) was performedon MBDcap-seq data by using the mpileup algorithm inthe Samtools suite (version 0.1.19) [43]. Minimum basequality for a base to be considered was set to 13, andmaximum reads per sample was set to 250. By incorpo-rating sequence and quality information and mismatchsharing rates across the samples, every read having mis-matches with the reference genome was statistically testedto determine whether or not the observation was dueto sequencing error. In order to reduce false mutationdetection caused by misaligments and indel, base align-ment quality (BAQ), Phred-scaled probability of a readbased being misaligned, is applied to each base [44]. Inaddition, anomalous read pairs in variant calling wereskipped. Finally, mutation rates within a certain methy-lation range across the tumor subtypes were computed.We defined mutation rate as the ratio of number of cyto-sine substitution occurrence over the number of all CpGsites. In order to estimate statistical significant of com-puted mutation rate within certain methylation range,the mutation rate information is pooled into subtypesand tested by ANOVA with Bonferroni correction. Inaddition to detecting variants from all samples, subtypespecific mutations were also measured. Each detectedmutation was checked as to whether the observation wasfrom all samples or only certain tumor subtype samples.We defined a subtype specific mutations as those thatoccurred in at least 30% of a particular subtype but in lessthan 10% of the other two subtypes.Whole schematic analysis workflow is illustrated in
Fig. 1.
ResultsGenome wide methylation profile and differentiallymethylated regionsGenome wide methylation landscape was determined in30 breast cancer cell lines MBDCap-seq. Methylation

The Author(s) BMC Systems Biology 2016, 10(Suppl 4):116 Page 436 of 548
Fig. 1Workflow for the methylation and mutation analysis of 30 breast cancer cell lines. A total of 30 breast cancer cell lines representing molecularsubtypes of the disease were examined in this study. Analysis starts with quality control and normalization on both MBDcap sequencing data andAffimatrix gene expression data, and methylation and expression level were measured. During integrated analysis, subtype comparison wasperformed to estimate differentially expressed genes (DEG)s and differentially methylated regions (DMR)s. Experimentally validated transcriptionfactor binding site (TFBS) information is used to estimate TFBS specific methylation level in promoter and CpGI shore overlapped region, andcorrelation was measured with downstream gene expression. By utilizing mutation information estimated from MBDcap sequencing, subtypespecific mutation rate over methylation level was measured. Finally, single base pair resolution bisulfite treatment sequencing was performed tovalidated the methylation status measured by MBDcap sequencing
profiling using more than 30 million reads covered23,149,286 CpG sites, 25,974 CpG islands, 54,543 CpGIshores, and 38,208 promoter regions (82, 91, 95, and 99%of the total in the human genome, respectively), and foroverlapped regions, 10,910 promoter-CpGI and 16,227promoter-CpGI shores (90 and 98% of total in humangenome) were covered. A total 4,366 differentially methy-lated 100bp-bins corresponding to 2,055 differentiallymethylated regions (DMRs; MEDIPS package, adjustedP-value (Bonferroni) < 0.05) were determined (see Meth-ods). 126 DMRs were identified in the luminal and basalA pair, 1,136 in the luminal and basal B pair, and 793in the basal A and basal B pair. Statistics of differen-tially methylated bins were further grouped accordingto the genomic regions such as 3′UTR, 5′UTR, exon,intron, promoter, CpGI, CpGI shelf, and CpGI shore.Notably large number of differentially methylated binswere observed in intron and CpGI shore region from Lu-BaB pair and BaA-BaB pair (Fig. 2a). Then, based on thesecomparison results, hypomethylation ratio of each sub-type was further measured. In both intron and CpGI shoreregion, more than 75% (BaA-BaB pair) and 50% (Lu-BaBpair) of differentially methylated bins are hypomethylated
in Basal B subtype (Fig. 2b). Hypomethylation ratioof other regions are in Supplementary Figure S1 (seeAdditional file 1).
Methylation status validation by targeted bisulfitesequencingAffinity-basedMBDCap-seq technology is a cost-efficientmethod to estimate genome-wide DNA methylation.However, it does not measure methylation level at the sin-gle nucleotide resolution, especially in high CpG densityregions. In order to verify the methylation level esti-mated by MBDCap-seq method, we conducted targetedbisulfite-treated sequencing (BS-seq) on the genomeregions around significantly differentially expressed genes(DEGs) (from 10Kbp upstream of the TSS to transcrip-tion end site (TES) including the corresponding promoter;see details in Methods). We compared methylation levelsestimated from MBDcap-seq and BS-seq, and observeda strong average correlation (Pearson’s correlation coef-ficient 0.77) and up to 0.91 between two techniques(see Additional file 1: Figure S2), demonstrating thatMBDCap-seq reliably measured genome wide methyla-tion levels.

The Author(s) BMC Systems Biology 2016, 10(Suppl 4):116 Page 437 of 548
a b
Fig. 2 a Bar plots demonstrate the number of differentially methylated bins for each pair-wise tumor type comparisons. Significance of each binmethylation on each genomic region between two subtypes are tested by t-test and adjusted with Bonferroni correction (P.adj-value < 0.05).b Ratio of hypo methylation in intron and CpGI shore regions. Each color represents hypo methylation ratio of certain tumor subtype amongdifferentially methylated bins. Hypo methylation ratio of other regions are in Supplementary Figure S1 (see Additional file 1)
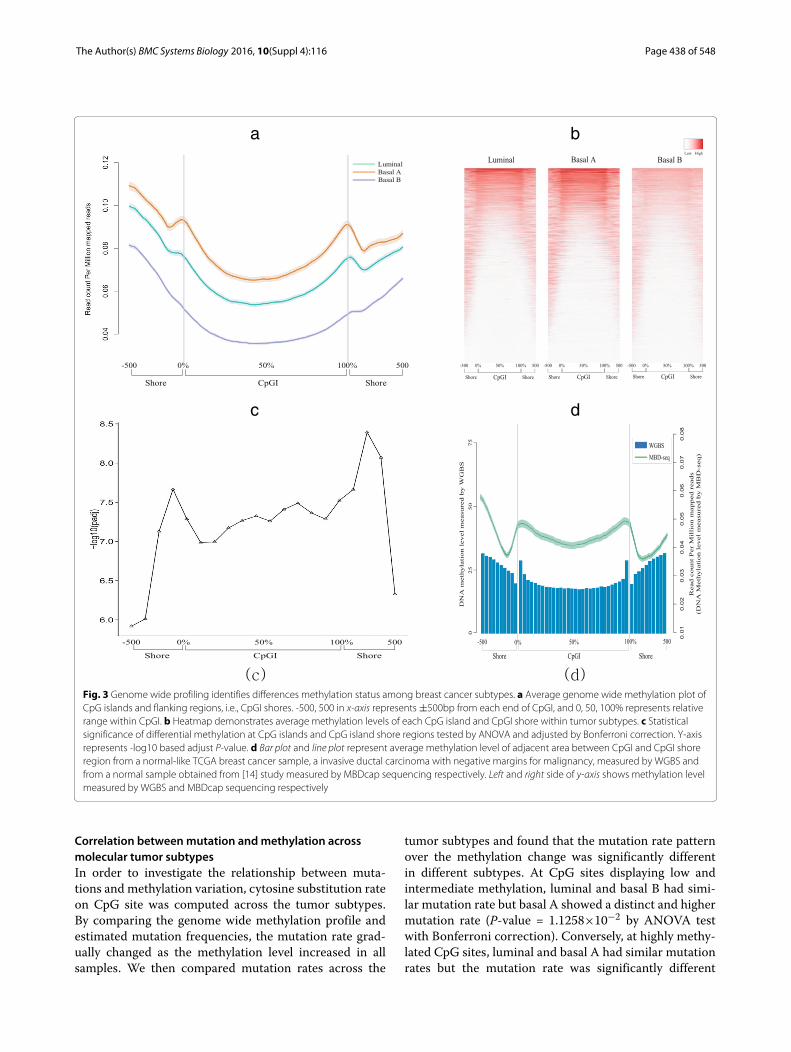
Global CpGI shore hypomethylation specific to basal Btumor typeBased on the genome-wide methylome analysis usingaffinity based MBDcap-seq data, we observed genomewide hypomethylation in the basal B subtype at vari-ous genomic regions. The average methylation levels ingenebody, exon, as well as Dnase I hypersensitive siteswere lowest in basal B (see Additional file 1: Figure S3).In addition, significant differential methylation patternswere observed in boundary areas between CpGI andCpGI shore. Notably, while methylation level peaks wereobserved in luminal and basal A, the steep peaks taperedinto a gentle slope or nearly flattened out in basal B(Fig. 3a). In addition, from heatmap for genome wideCpGI and their flanking area, highly methylated bound-ary region in luminal and basal A are observed, but notfrom basal B (Fig. 3b). Significance of differential methy-lation among subtypes in entire CpGI and their flankingregions was tested by ANOVA and the P-value is adjustedby Bonferroni correction. From the result of statistical sig-nificance estimation, we identified that adjacent regionsbetween CpGI and CpGI shore area have significantly lowadjusted P-value compared to near regions (Fig. 3c).In order to further validate the observed methylation
patterns, we utilized two normal data set; TCGA nor-mal breast data measured by WGBS and normal datafrom genome wide methylome analysis study [14] mea-sured by MBDcap sequencing. Genome wide methylationlevel were estimated through same analysis procedure (see“Methods”) and estimated average methylation in CpGIand CpGI shore regions. From methylation result basedon both normal data, we observed same pattern and foundsteep peaks as well in adjacent region between CpGI andCpGI shore (Fig. 3d).To investigate whether the differences in methyla-
tion patterns in CpGI and adjacent region CpGI shore
potentially involved in gene regulation, we focused onpromoter CpGI shore with transcription factor bindingsite (TFBS). Estimated TFBS specific methylation sta-tus (see “Methods”) in the promoter CpGI shore wascompared with downstream gene expression, and the TFbinding to these TFBS regions was also measured todetermine whether a TF influences gene regulation. Thatis, we investigated whether the differentially methylatedTFBS in promoter CpGI shore regions among breast can-cer subtypes potentially give influence to expression ofdownstream genes that TF regulate.We identified 55 genes with differentially methylated
promoter TFBS regions (Kruskal Wallis test, FDR < 0.1)and inversely correlated (Spearman’s rho < -0.5) geneexpression (see Additional file 1: Table S2). Interestingly,55% of these genes were hypomethylated in basal B,including CAV1 and PTRF (caveolae associated proteincoding genes). Epigenetic modification of these caveolaerelated genes was recently reported to be associated withdisease [45]. Furthermore, a significant influence of CpGIshore methylation on CAV1 in breast cancer was previ-ously reported [20]. We confirmed this finding, detectinga significant DMR within the CpGI shore overlapping theCAV1 promoter (Fig. 4). We then further investigated themethylation status of TFBS located in the CAV1 promoterand the overlapping CpGI shore region. Interestingly, theexperimentally validated TFBS regions showed significantdifferential methylation (KruskalWallis test, FDR < 0.005).In addition to CAV1, promoter and CpGI shore methy-lation with TFBS of PTRF, TGFB1, and GDF15 genes aredepicted in Fig. 4. All these TFBS specific methylationwithin promoter and CpGI shore overlapped had inversecorrelation with downstream gene expression that theTFs associated. Finally, CpGI shore methylation was vali-dated (single base pair resolution) using targeted bisulfitesequencing (see Additional file 1: Figure S4).
The Author(s) BMC Systems Biology 2016, 10(Suppl 4):116 Page 438 of 548
a b
c d
Fig. 3 Genome wide profiling identifies differences methylation status among breast cancer subtypes. a Average genome wide methylation plot ofCpG islands and flanking regions, i.e., CpGI shores. -500, 500 in x-axis represents ±500bp from each end of CpGI, and 0, 50, 100% represents relativerange within CpGI. b Heatmap demonstrates average methylation levels of each CpG island and CpGI shore within tumor subtypes. c Statisticalsignificance of differential methylation at CpG islands and CpG island shore regions tested by ANOVA and adjusted by Bonferroni correction. Y-axisrepresents -log10 based adjust P-value. d Bar plot and line plot represent average methylation level of adjacent area between CpGI and CpGI shoreregion from a normal-like TCGA breast cancer sample, a invasive ductal carcinoma with negative margins for malignancy, measured by WGBS andfrom a normal sample obtained from [14] study measured by MBDcap sequencing respectively. Left and right side of y-axis shows methylation levelmeasured by WGBS and MBDcap sequencing respectively
Correlation betweenmutation andmethylation acrossmolecular tumor subtypesIn order to investigate the relationship between muta-tions and methylation variation, cytosine substitution rateon CpG site was computed across the tumor subtypes.By comparing the genome wide methylation profile andestimated mutation frequencies, the mutation rate grad-ually changed as the methylation level increased in allsamples. We then compared mutation rates across the
tumor subtypes and found that the mutation rate patternover the methylation change was significantly differentin different subtypes. At CpG sites displaying low andintermediate methylation, luminal and basal B had simi-lar mutation rate but basal A showed a distinct and highermutation rate (P-value = 1.1258×10⁻² by ANOVA testwith Bonferroni correction). Conversely, at highly methy-lated CpG sites, luminal and basal A had similar mutationrates but the mutation rate was significantly different

The Author(s) BMC Systems Biology 2016, 10(Suppl 4):116 Page 439 of 548
Fig. 4 Differentially methylated and experimentally validated promotor TFBS in CpGI shore region having negative correlation with downstreamgene expression. The differential methylation of the overlapped region among breast cancer cell subtypes was tested by Kruskal Wallis test with FDR< 0.1, and the methylation status was inversely correlated with downstream gene expression (Spearman rank correlation < -0.5). X-axis showsgenomic location of each genes and Y-axis represents DNA methylation level measured by MBDcap sequencing
(P-value = 6.84×10⁻⁷ by ANOVA test with Bonferronicorrection) for the basal B subtype (Fig. 5).To find possible biological explanation of the observed
mutation rate difference across the tumor subtypes, weinvestigated whether there were any regional genomiceffects. We first divided observed mutations by variousregional groups based on their genomic position infor-mation. We then extracted subtype specific mutations, amutation that occurs frequently in one subtype but rarelyobserved from others, by filtering out common mutationover all subtypes in each regional group (see Methods).Interestingly, in CpGI regions (known as “methyl pro-tected” and thus hypomethylated regions) including CpGIshore and shelf, basal A specific mutations occurredthe most frequently, and CpGI shore and shelf regionshowed significant differential subtype specific mutationoccurrence (tested by ANOVA with adjusted P-value(Bonferroni) < 0.05). On the other hand, basal B spe-cific mutations were significantly more frequent in intronregions (ANOVA, P.adj (Bonferroni) < 0.05) (Fig. 6). Ouranalysis suggests that mutation rate difference may result
from regional subtype specific mutation occurrence andtheir methylation difference across the subtypes.
DiscussionIn this study, we report two novel findings associated withtumor subtype differences in terms of methylation andmutations. For the methylation pattern, we showed thatCpGI shore methylation is a distinct signature for breastcancer subtypes and also that CpGI shore methylation isassociated with subtype specific gene regulation. For thesubtype specific methylation patterns, there are a numberof studies. Previously, Holm et al., showed that unsu-pervised methylation pattern analysis could distinguishmolecular subtypes [9]. Jadhav et al., reported differentialmethylation patterns in promoter CpGI, intragenic andintergenic CpGI as well as non-CpGI promoter regionscompared to normal samples [46] and Kamalakaran etal., reported differential methylation pattern and associa-tion with clinical variable in luminal subtype [47]. Morerecently, Stefansson et al., tried to define additional epige-netic subtypes based on differential methylation patterns

The Author(s) BMC Systems Biology 2016, 10(Suppl 4):116 Page 440 of 548
Fig. 5 Significantly higher mutation rate in low and intermediately methylated CpG sites in basal A (ANOVA test, adjusted P-value (Bonferroni) < 0.05)whereas significantly higher mutation rate in hypermethylated CpG sites in basal B (ANOVA test, adjusted P-value (Bonferroni) < 0.05). X-axisrepresents each methylation level (RMS) value and y-axis represents ratio of mutational CpG site over all CpG site at certain methylation level. Boxplot to the right: extension of red box area
[13]. In agreement with previous studies, we observed sig-nificant differential methylation pattern on CpGI shoreand promoter overlapping regions. Our further analy-sis on TFBS specific methylation revealed strong inversecorrelation to downstream genes. We also detectedmore prevalent hypomethylated DMR bins in intron
region for basal B subtype and this finding is in agree-ment with previously described genebody hypomethyla-tion pattern studied by Yang et al. [48]. This genebodyhypomethylation phenotype is also linked to hormone-receptor negative/basal-like breast cancers as described inHon et al. [49].
Fig. 6 Subtype specific mutation occurrence associated with tumor subtypes across the genomic regions. Significance of difference amongsubtype specific mutation occurrent was tested by ANOVA with Bonferroni correction. (P.adj < 0.05). In intron region significanltly more subtypespecific mutation is occurred in Basal B. On the other hand, In CpGI related regions, significantly more subtype mutation is observed in Basal Atumor subtypes. X-axis represents each genomic regions and y-axis shows number of subtype specific mutation occurred in those regions

The Author(s) BMC Systems Biology 2016, 10(Suppl 4):116 Page 441 of 548
In addition to genome wide differential methylationpattern, our integrated analysis identified genes havingsignificant differential methylation on their TFBS locatedin promoter CpGI shore region, and having inversecorrelation with their gene expression. CAV1 and PTRFare previously reported as cancer-associated caveolaegenes [20]. GDF15 and TGFB1 genes are members oftransforming growth factor beta family, and encode mul-tifunctional proteins associated with proliferation, differ-entiation, adhesion, and migration. Therapeutically, thesegenes are related to response of breast cancer cells to radi-ation, specifically inhibiting radiation-induced cell deathand related cytotoxic action [50] and a direct associationbetween promoter methylation and expression of thesegenes are reported [51]. In addition, integrated analy-sis showed GSTP1 and PALLD genes having low levelgene expression as well as significantly higher methyla-tion level of these gene promoters in luminal phenotypecompared to the other two subtypes. Hypermethylationof the GSTP1 promoter has also been previously reportedas having association with prognostic values [52], andrepression of PALLD gene has been shown to con-tribute to invasive motility [53] and cancer cell migration[54]. Including these genes, a large number of detectedgenes from our analysis have overlapping of promoterregions with DHS region as well as polycom-associatedH3K27me3 marked region, suggesting a potential inter-play with gene transcription and that differential methyla-tion may play important roles across the subtypes.Mutations play an important role in the development of
cancer. Several studies investigated relationship betweenDNA methylation and mutation. Carina et al. reporteda relationship between CpG cytosine mutation rates inintron regions in human genes and variation in methyla-tion levels as well as a positive correlation with non-CpGdivergences, and a negative correlation with GC con-tent [55]. In another study focusing on exonic regions[24], methylation in first exon regions significantly corre-lated with C to T substitution rate in CpG sites. Basedon genome wide mutation rate measurements, CpG siteswith low-to-intermediate methylation level had higherCpG substitution rates compared to other methylatedCpG sites [25]. Our genome wide mutation rate analy-sis shows notable differences in mutation rates across thetumor subtypes, which correlates with methylation status.In summary, our findings on mutation and methylationindicates a trend for higher mutation rates in basal Atype at low to intermediate methylation level CpG siteswhereas in the basal B phenotype, mutation rates arehigher at highly methylated CpG sites.
ConclusionBy utilizing methylome data and gene expression for 30breast cancer cell lines, we report two novel findings.
First, our genome wide integrated analysis shows signif-icant difference in the CpGI shore methylation patternamong breast cancer molecular subtypes. Further inves-tigation of these regions identified 55 genes with differ-entially methylated promoter regions overlapping CpGIshore regions with an inverse correlation of methylationlevel and transcriptional regulation of these 55 genes, butno apparent difference in expression of TFs that couldpotentially interact with their promoter CpGI regions.This consideration of TF and TFBS provides strong evi-dence for the suppressive role of DNA methylation onthe downstream genes. Second, we found a genome-widerelationships betweenmutation rate andmethylation levelin the molecular subtypes. From the integrated analysis,we report that mutation rate gradually increases as methy-lation level increases. We further investigated this patternin relation with the molecular subtypes and found highermutation rates in basal A when the methylation level islow-to-intermediate, but basal B breast cancer cells havehigher mutation rates when the methylation level is high.We believe our findings addresses a timely issue regard-ing the relation between DNA methylation and mutationin terms of gene expression in tumorigenesis.
Additional file
Additional file 1: Supplementary file contains Supplementary Figure S1–4and Table S1–2. (PDF 2170 kb)
AcknowledgmentsNot applicable.
DeclarationsThis article has been published as part of BMC Systems Biology Volume 10Supplement 4, 2016: Proceedings of the 27th International Conference onGenome Informatics: systems biology. The full contents of the supplement areavailable online at http://bmcsystbiol.biomedcentral.com/articles/supplements/volume-10-supplement-4.
FundingThis research was supported by a grant of the Korea Health Technology R&DProject through the Korea Health Industry Development Institute (KHIDI),funded by the Ministry of Health & Welfare, Republic of Korea (grant number :HI15C3224 ), by Collaborative Genome Program for Fostering NewPost-Genome industry through the National Research Foundation of Korea(NRF) funded by the Ministry of Science ICT and Future Planning(2014M3C9A3063541), by the Bio & Medical Technology DevelopmentProgram of the NRF funded by the Ministry of Science, ICT & Future Planning(2012M3A9D1054622), and funding from the Integrated Cancer BiologyProgram of the National Cancer Institute (Awards CA13001). Publicationcharges for this article have been funded by a grant of the KHIDI, funded bythe Ministry of Health & Welfare, Republic of Korea (grant number : HI15C3224).
Availability of data andmaterialsNot applicable.
Authors’ contributionsSK conceived the experiment, SK and HC conducted the experiment, HCdrafted the manuscript, HC and SL processed data and analyzed results, KNprepared samples and reviewed the manuscript. All authors read andapproved the final manuscript.

The Author(s) BMC Systems Biology 2016, 10(Suppl 4):116 Page 442 of 548
Competing interestsThe authors declare that they have no competing interests.
Consent for publicationNot applicable.
Ethics approval and consent to participateNot applicable.
Author details1School of Informatics and Computing, Indiana University Bloomington, IN47405, USA, Waterloo Road, 47405 Bloomington, IN, USA. 2Department ofComputer Science and Engineering, Seoul National University, Seoul, Republicof Korea. 3Indiana University School of Medicine, Department of Cellular andIntegrative Physiology, Medical Sciences Program, Bloomington, USA.4Interdisciplinary Program in Bioinformatics, Seoul National University, Seoul,Republic of Korea. 5Bioinformatics Institute, Seoul National University, Seoul,Republic of Korea.
Published: 23 December 2016
References1. Schnitt SJ. Classification and prognosis of invasive breast cancer: from
morphology to molecular taxonomy. Mod Pathol. 2010;23:60–4.2. Sorlie T, Perou CM, Tibshirani R, Aas T, Geisler S, Johnsen H, Hastie T,
Eisen M, Van de Rijn M, Jeffrey S, et al. Gene expression patterns of breastcarcinomas distinguish tumor subclasses with clinical implications. ProcNatl Acad Sci USA. 2001;98(19):10869–74.
3. Rivenbark AG, O′Connor SM, Coleman WB. Molecular and cellularheterogeneity in breast cancer: challenges for personalized medicine. AmJ Pathol. 2013;183(4):1113–24.
4. Parker JS, Mullins M, Cheang MC, Leung S, Voduc D, Vickery T, Davies S,Fauron C, He X, Hu Z, et al. Supervised risk predictor of breast cancerbased on intrinsic subtypes. J Clin Oncol. 2009;27(8):1160–7.
5. Hornberger J, Cosler LE, Lyman GH, et al. Economic analysis of targetingchemotherapy using a 21-gene RT-PCR assay in lymph-node-negative,estrogen-receptor-positive, early-stage breast cancer. Am J Manag Care.2005;11(5):313–24.
6. Gascard P, Bilenky M, Sigaroudinia M, Zhao J, Li L, Carles A, Delaney A,Tam A, Kamoh B, Cho S, et al. Epigenetic and transcriptionaldeterminants of the human breast. Nat Commun. 2015;6:6351.
7. Smith AK, Conneely KN, Pace TW, Mister D, Felger JC, Kilaru V, Akel MJ,Vertino PM, Miller AH, Torres MA. Epigenetic changes associated withinflammation in breast cancer patients treated with chemotherapy. BrainBehav Immun. 2014;38:227–36.
8. Szyf M. DNA methylation signatures for breast cancer classification andprognosis. Genome Med. 2012;4(3):26.
9. Holm K, Hegardt C, Staaf J, Vallon-Christersson J, Jönsson G, Olsson H,Borg Å, Ringnér M. Research article molecular subtypes of breast cancerare associated with characteristic DNA methylation patterns. BreastCancer Res. 2010;12:R36.
10. Bediaga NG, Acha-Sagredo A, Guerra I, Viguri A, Albaina C, Ruiz Diaz I,Rezola R, Alberdi MJ, Dopazo J, Montaner D, et al. Dna methylationepigenotypes in breast cancer molecular subtypes. Breast Cancer Res.2010;12(5):77.
11. Network CGA, et al. Comprehensive molecular portraits of human breasttumours. Nature. 2012;490(7418):61–70.
12. Conway K, Edmiston SN, May R, Kuan P, Chu H, Bryant C, Tse CK,Swift-Scanlan T, Geradts J, Troester MA, et al. Dna methylation profilingin the carolina breast cancer study defines cancer subclasses differing inclinicopathologic characteristics and survival. Breast Cancer Res.2014;16(5):450.
13. Stefansson OA, Moran S, Gomez A, Sayols S, Arribas-Jorba C, Sandoval J,Hilmarsdottir H, Olafsdottir E, Tryggvadottir L, Jonasson JG, et al. A dnamethylation-based definition of biologically distinct breast cancersubtypes. Mol Oncol. 2015;9(3):555–68.
14. Stirzaker C, Zotenko E, Song JZ, Qu W, Nair SS, Locke WJ, Stone A,Armstong NJ, Robinson MD, Dobrovic A, et al. Methylome sequencing intriple-negative breast cancer reveals distinct methylation clusters withprognostic value. Nat Commun. 2015;6:5899.
15. Fleischer T, Frigessi A, Johnson KC, Edvardsen H, Touleimat N, Klajic J,Riis ML, Haakensen VD, Wärnberg F, Naume B, et al. Genome-wide DNAmethylation profiles in progression to in situ and invasive carcinoma ofthe breast with impact on gene transcription and prognosis. GenomeBiol. 2014;15(8):435–2333349012841587.
16. Doi A, Park IH, Wen B, Murakami P, Aryee MJ, Irizarry R, Herb B,Ladd-Acosta C, Rho J, Loewer S, et al. Differential methylation oftissue-and cancer-specific CpG island shores distinguishes humaninduced pluripotent stem cells, embryonic stem cells and fibroblasts. NatGenet. 2009;41(12):1350–3.
17. Brenet F, Moh M, Funk P, Feierstein E, Viale AJ, Socci ND, Scandura JM.DNA methylation of the first exon is tightly linked to transcriptionalsilencing. PloS one. 2011;6(1):14524.
18. Sproul D, Kitchen RR, Nestor CE, Dixon JM, Sims AH, Harrison DJ,Ramsahoye BH, Meehan RR. Tissue of origin determinescancer-associated CpG island promoter hypermethylation patterns.Genome Biol. 2012;13(10):84.
19. Rhee JK, Kim K, Chae H, Evans J, Yan P, Zhang BT, Gray J, Spellman P,Huang TH-M, Nephew KP, et al. Integrated analysis of genome-wide DNAmethylation and gene expression profiles in molecular subtypes of breastcancer. Nucleic Acids Res. 2013;41(18):8464–74.
20. Rao X, Evans J, Chae H, Pilrose J, Kim S, Yan P, Huang R, Lai H, Lin H,Liu Y, et al. CpG island shore methylation regulates caveolin-1 expressionin breast cancer. Oncogene. 2013;32(38):4519–28.
21. Alexandrov LB, Nik-Zainal S, Wedge DC, Aparicio SA, Behjati S, BiankinAV, Bignell GR, Bolli N, Borg A, Børresen-Dale AL, et al. Signatures ofmutational processes in human cancer. Nature. 2013;500(7463):415–21.
22. Watson IR, Takahashi K, Futreal PA, Chin L. Emerging patterns of somaticmutations in cancer. Nat Rev Genet. 2013;14(10):703–18.
23. Nik-Zainal S, Alexandrov LB, Wedge DC, Van Loo P, Greenman CD, RaineK, Jones D, Hinton J, Marshall J, Stebbings LA, et al. Mutational processesmolding the genomes of 21 breast cancers. Cell. 2012;149(5):979–93.
24. Chuang TJ, Chen FC, Chen YZ. Position-dependent correlations betweenDNA methylation and the evolutionary rates of mammalian codingexons. Proc Natl Acad Sci. 2012;109(39):15841–6.
25. Xia J, Han L, Zhao Z. Investigating the relationship of DNA methylationwith mutation rate and allele frequency in the human genome. BMCGenomics. 2012;13(Suppl 8):7.
26. Kim S, Li M, Paik H, Nephew K, Shi H, Kramer R, Xu D, Huang TH.Predicting DNA methylation susceptibility using CpG flanking sequences.Pac Symp Biocomput. 2008;315–26.
27. Yang Y, Nephew K, Kim S. A novel k-mer mixture logistic regression formethylation susceptibility modeling of cpg dinucleotides in human genepromoters. BMC Bioinform. 2012;13(3):1.
28. An J, Kim K, Rhee SM, Chae H, Nephew KP, Kim S. Genome-wideanalysis and modeling of dna methylation susceptibility in 30 breastcancer cell lines by using cpg flanking sequences. J Bioinforma ComputBiol. 2013;11(03):1341003.
29. Chae H, Park J, Lee SW, Nephew KP, Kim S. Comparative analysis usingmer and k-flank patterns provides evidence for cpg island sequenceevolution in mammalian genomes. Nucleic Acids Res. 2013;41:4783–91.
30. Keshet I, Schlesinger Y, Farkash S, Rand E, Hecht M, Segal E, Pikarski E,Young RA, Niveleau A, Cedar H, et al. Evidence for an instructivemechanism of de novo methylation in cancer cells. Nat Genet. 2006;38(2):149–53.
31. Lee SM, Kim-Ha J, Choi WY, Lee J, Kim D, Lee J, Choi E, Kim YJ. Interplayof genetic and epigenetic alterations in hepatocellular carcinoma.Epigenomics. 2016;8(7):993–1005.
32. Krueger F. Trim galore. A wrapper tool around Cutadapt and FastQC toconsistently apply quality and adapter trimming to FastQ files. 2015.http://www.bioinformatics.babraham.ac.uk/projects/trim_galore/.Accessed 16 Nov 2016.
33. Langmead B, Salzberg SL. Fast gapped-read alignment with bowtie 2.Nat Methods. 2012;9(4):357–9.
34. Lienhard M, Grimm C, Morkel M, Herwig R, Chavez L. MEDIPS:genome-wide differential coverage analysis of sequencing data derivedfrom DNA enrichment experiments. Bioinformatics. 2014;30(2):284–6.
35. Neve RM, Chin K, Fridlyand J, Yeh J, Baehner FL, Fevr T, Clark L, Bayani N,Coppe JP, Tong F, et al. A collection of breast cancer cell lines for the studyof functionally distinct cancer subtypes. Cancer cell. 2006;10(6):515–27.

The Author(s) BMC Systems Biology 2016, 10(Suppl 4):116 Page 443 of 548
36. Smyth GK. Limma: linear models for microarray data In: Gentleman R,Care V, Dudoit S, Irizarry R, Huber W, editors. Bioinformatics andcomputational biology solutions using R and Bioconductor. New York:Springer; 2005. p. 397–420.
37. An J, Kim K, Chae H, Kim S. Degpack: A web package using anon-parametric and information theoretic algorithm to identifydifferentially expressed genes in multiclass rna-seq samples. Methods.2014;69(3):306–14.
38. Akalin A, Kormaksson M, Li S, Garrett-Bakelman FE, Figueroa ME, MelnickA, Mason CE, et al. methylKit: a comprehensive R package for the analysisof genome-wide DNA methylation profiles. Genome Biol. 2012;13(10):87.
39. Krueger F, Andrews SR. Bismark: a flexible aligner and methylation callerfor Bisulfite-Seq applications. Bioinformatics. 2011;27(11):1571–2.
40. Matys V, Fricke E, Geffers R, Gößling E, Haubrock M, Hehl R, HornischerK, Karas D, Kel AE, Kel-Margoulis OV, et al. TRANSFAC®: transcriptionalregulation, from patterns to profiles. Nucleic Acids Res. 2003;31(1):374–8.
41. Bovolenta LA, Acencio ML, Lemke N. HTRIdb: an open-access databasefor experimentally verified human transcriptional regulation interactions.BMC Genomics. 2012;13(1):1–10.
42. Lachmann A, Xu H, Krishnan J, Berger SI, Mazloom AR, Ma’ayan A. ChEA:transcription factor regulation inferred from integrating genome-wideChIP-X experiments. Bioinformatics. 2010;26(19):2438–44.
43. Li H. A statistical framework for SNP calling, mutation discovery,association mapping and population genetical parameter estimationfrom sequencing data. Bioinformatics. 2011;27(21):2987–93.
44. Li H. Improving snp discovery by base alignment quality. Bioinformatics.2011;27(8):1157–8.
45. Low JY, Nicholson HD. Epigenetic modifications of caveolae associatedproteins in health and disease. BMC Genet. 2015;16(1):71.
46. Jadhav RR, Ye Z, Huang RL, Liu J, Hsu PY, Huang YW, Rangel LB, Lai HC,Roa JC, Kirma NB, Huang TH, Jin VX. Genome-wide DNA methylationanalysis reveals estrogen-mediated epigenetic repression ofmetallothionein-1 gene cluster in breast cancer. Clin Epigenetics.2015;7(1):13.
47. Kamalakaran S, Varadan V, Russnes HEG, Levy D, Kendall J, Janevski A,Riggs M, Banerjee N, Synnestvedt M, Schlichting E, et al. DNAmethylation patterns in luminal breast cancers differ from non-luminalsubtypes and can identify relapse risk independent of other clinicalvariables. Mol Oncol. 2011;5(1):77–92.
48. Yang X, Han H, De Carvalho DD, Lay FD, Jones PA, Liang G. Gene bodymethylation can alter gene expression and is a therapeutic target incancer. Cancer Cell. 2014;26(4):577–90.
49. Hon GC, Hawkins RD, Caballero OL, Lo C, Lister R, Pelizzola M, ValsesiaA, Ye Z, Kuan S, Edsall LE, et al. Global dna hypomethylation coupled torepressive chromatin domain formation and gene silencing in breastcancer. Genome research. 2012;22(2):246–58.
50. Schilling-Tóth B, Sándor N, Walter F, Bocsik A, Sáfrány G, Hegyesi H.Role of GDF15 in radiosensitivity of breast cancer cells. Open Life Sci.2014;9(10):982–92.
51. Pan X, Chen Z, Huang R, Yao Y, Ma G. Transforming growth factor β 1induces the expression of collagen type I by DNA methylation in cardiacfibroblasts. PloS one. 2013;8:e60335.
52. Lasabova Z, Tilandyova P, Kajo K, Zubor P, Burjanivova T, Danko J, PlankL. Hypermethylation of the GSTP1 promoter region in breast cancer isassociated with prognostic clinicopathological parameters. Neoplasma.2010;57(1):35.
53. Goicoechea S, Bednarski B, Garcia-Mata R, Prentice-Dunn H, Kim H,Otey C. Palladin contributes to invasive motility in human breast cancercells. Oncogene. 2009;28(4):587–98.
54. Chin YR, Toker A. The actin-bundling protein palladin is an Akt1-specificsubstrate that regulates breast cancer cell migration. Mol cell. 2010;38(3):333–44.
55. Mugal CF, Ellegren H. Substitution rate variation at human CpG sitescorrelates with non-CpG divergence, methylation level and GC content.Genome Biol. 2011;12(6):58.
• We accept pre-submission inquiries
• Our selector tool helps you to find the most relevant journal
• We provide round the clock customer support
• Convenient online submission
• Thorough peer review
• Inclusion in PubMed and all major indexing services
• Maximum visibility for your research
Submit your manuscript atwww.biomedcentral.com/submit
Submit your next manuscript to BioMed Central and we will help you at every step: