research open access molecular and cellular mechanisms of
TRANSCRIPT

Yang et al. Biotechnology for Biofuels 2013, 6:67http://www.biotechnologyforbiofuels.com/content/6/1/67
RESEARCH Open Access
Molecular and cellular mechanisms of neutrallipid accumulation in diatom followingnitrogen deprivationZhi-Kai Yang1, Ying-Fang Niu1, Yu-Han Ma1, Jiao Xue1, Meng-Han Zhang1, Wei-Dong Yang1, Jie-Sheng Liu1,Song-Hui Lu1, Yuanfang Guan2* and Hong-Ye Li1*
Abstract
Background: Nitrogen limitation can induce neutral lipid accumulation in microalgae, as well as inhibiting theirgrowth. Therefore, to obtain cultures with both high biomass and high lipid contents, and explore the lipidaccumulation mechanisms, we implemented nitrogen deprivation in a model diatom Phaeodactylum tricornutum atlate exponential phase.
Results: Neutral lipid contents per cell subsequently increased 2.4-fold, both the number and total volume of oil bodiesincreased markedly, and cell density rose slightly. Transcriptional profile analyzed by RNA-Seq showed that expressionlevels of 1213 genes (including key carbon fixation, TCA cycle, glycerolipid metabolism and nitrogen assimilation genes)increased, with a false discovery rate cut-off of 0.001, under N deprivation. However, most light harvesting complex geneswere down-regulated, extensive degradation of chloroplast membranes was observed under an electron microscope, andphotosynthetic efficiency declined. Further identification of lipid classes showed that levels of MGDG and DGDG, the mainlipid components of chloroplast membranes, dramatically decreased and triacylglycerol (TAG) levels significantly rose,indicating that intracellular membrane remodeling substantially contributed to the neutral lipid accumulation.
Conclusions: Our findings shed light on the molecular mechanisms of neutral lipid accumulation and the key genesinvolved in lipid metabolism in diatoms. They also provide indications of possible strategies for improving microalgalbiodiesel production.
Keywords: Microalga, Nitrogen deprivation, Lipid, Membrane remodeling, Transcriptomics
BackgroundConcerns about global climate change and rises in pricesof fossil fuels have prompted intense interest in the abilityof microalgae to produce lipids that can be easily convertedto biodiesel. Diatoms account for up to 40% of primaryproductivity in marine ecosystems [1] and some species areknown to accumulate neutral lipids. Moreover, diatoms aremetabolically versatile since they can synthesize andaccumulate wide ranges of valuable compounds, such aspolyunsaturated fatty acids (PUFAs), extracellular polymericsubstances and cell coatings [2]. Hence, they have attracted
* Correspondence: [email protected]; [email protected] of Computational Medicine and Bioinformatics, University ofMichigan, Ann Arbor, Michigan, 48109, United States of America1Key Laboratory of Eutrophication and Prevention of Red Tide of GuangdongHigher Education Institute, College of Life Science, Jinan University,Guangzhou, 510632, China
© 2013 Yang et al.; licensee BioMed Central LtCommons Attribution License (http://creativecreproduction in any medium, provided the or
both biological and medical attention. Recently, the marinediatom Phaeodactylum tricornutum has emerged as a po-tential microalgal energy source. It grows rapidly, has ashort life cycle, and accumulates TAGs in late exponentialphase; storage lipids constitute about 20-30% of its dry cellweight under standard culture conditions [3]. Furthermore,it is a model diatom species and its genome has been fullysequenced and available at the JGI (http://genome.jgi-psf.org/Phatr2/Phatr2.home.html) [4].The accumulation of neutral lipids and changes in
lipid profiles under nutrient starvation have been moni-tored in P. tricornutum and another model diatom,Thalassiosira pseudonana [5-7]. Nitrogen is a major con-stituent of proteins and nucleic acids. Accordingly, pig-ment and protein losses have been observed in Antarcticsea ice diatoms under nitrogen limitation [8], and while
d. This is an Open Access article distributed under the terms of the Creativeommons.org/licenses/by/2.0), which permits unrestricted use, distribution, andiginal work is properly cited.
Yang et al. Biotechnology for Biofuels 2013, 6:67 Page 2 of 14http://www.biotechnologyforbiofuels.com/content/6/1/67
N-starved P. tricornutum cells can accumulate high levelsof lipids, their division reportedly ceases and cell densityincreases only marginally [1,9,10]. Furthermore, changesin fatty acid profiles of the green alga Chlamydomonasreinhardtii under N deprivation have been reported re-cently [11], and associated shifts in fluxes through met-abolic pathways have been inferred from changes intranscript abundance in C. reinhardtii [12]. However, thebiochemical and molecular mechanisms involved in dia-tom responses to losses of nitrogen availability are still un-clear. Therefore, in the study reported here P. tricornutumwas cultured under standard laboratory conditions thensubjected to nitrogen deprivation in the late exponentialphase to achieve both high neutral lipid contents and highcell biomass. Then, to assess the holistic effects of Ndeprivation and identify the mechanism involved in thediatoms, we examined changes in their levels of neutrallipids, oil bodies, fatty acid profiles, chloroplast structure,photosynthetic parameters, gene expression patterns andinferred shifts in fluxes through key metabolic pathways.
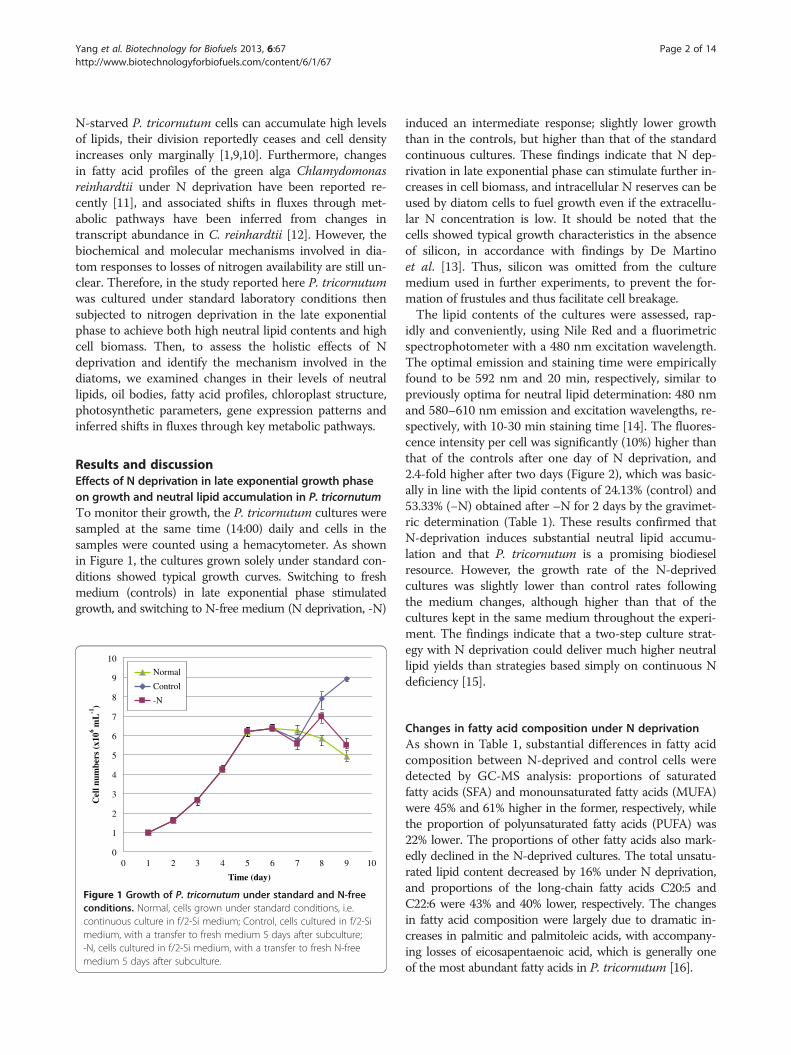
Results and discussionEffects of N deprivation in late exponential growth phaseon growth and neutral lipid accumulation in P. tricornutumTo monitor their growth, the P. tricornutum cultures weresampled at the same time (14:00) daily and cells in thesamples were counted using a hemacytometer. As shownin Figure 1, the cultures grown solely under standard con-ditions showed typical growth curves. Switching to freshmedium (controls) in late exponential phase stimulatedgrowth, and switching to N-free medium (N deprivation, -N)
0
1
2
3
4
5
6
7
8
9
10
0 1 2 3 4 5 6 7 8 9 10
Time (day)
Cel
l num
bers
(x1
06 mL
-1)
Normal
Control
-N
Figure 1 Growth of P. tricornutum under standard and N-freeconditions. Normal, cells grown under standard conditions, i.e.continuous culture in f/2-Si medium; Control, cells cultured in f/2-Simedium, with a transfer to fresh medium 5 days after subculture;-N, cells cultured in f/2-Si medium, with a transfer to fresh N-freemedium 5 days after subculture.
induced an intermediate response; slightly lower growththan in the controls, but higher than that of the standardcontinuous cultures. These findings indicate that N dep-rivation in late exponential phase can stimulate further in-creases in cell biomass, and intracellular N reserves can beused by diatom cells to fuel growth even if the extracellu-lar N concentration is low. It should be noted that thecells showed typical growth characteristics in the absenceof silicon, in accordance with findings by De Martinoet al. [13]. Thus, silicon was omitted from the culturemedium used in further experiments, to prevent the for-mation of frustules and thus facilitate cell breakage.The lipid contents of the cultures were assessed, rap-
idly and conveniently, using Nile Red and a fluorimetricspectrophotometer with a 480 nm excitation wavelength.The optimal emission and staining time were empiricallyfound to be 592 nm and 20 min, respectively, similar topreviously optima for neutral lipid determination: 480 nmand 580–610 nm emission and excitation wavelengths, re-spectively, with 10-30 min staining time [14]. The fluores-cence intensity per cell was significantly (10%) higher thanthat of the controls after one day of N deprivation, and2.4-fold higher after two days (Figure 2), which was basic-ally in line with the lipid contents of 24.13% (control) and53.33% (−N) obtained after –N for 2 days by the gravimet-ric determination (Table 1). These results confirmed thatN-deprivation induces substantial neutral lipid accumu-lation and that P. tricornutum is a promising biodieselresource. However, the growth rate of the N-deprivedcultures was slightly lower than control rates followingthe medium changes, although higher than that of thecultures kept in the same medium throughout the experi-ment. The findings indicate that a two-step culture strat-egy with N deprivation could deliver much higher neutrallipid yields than strategies based simply on continuous Ndeficiency [15].
Changes in fatty acid composition under N deprivationAs shown in Table 1, substantial differences in fatty acidcomposition between N-deprived and control cells weredetected by GC-MS analysis: proportions of saturatedfatty acids (SFA) and monounsaturated fatty acids (MUFA)were 45% and 61% higher in the former, respectively, whilethe proportion of polyunsaturated fatty acids (PUFA) was22% lower. The proportions of other fatty acids also mark-edly declined in the N-deprived cultures. The total unsatu-rated lipid content decreased by 16% under N deprivation,and proportions of the long-chain fatty acids C20:5 andC22:6 were 43% and 40% lower, respectively. The changesin fatty acid composition were largely due to dramatic in-creases in palmitic and palmitoleic acids, with accompany-ing losses of eicosapentaenoic acid, which is generally oneof the most abundant fatty acids in P. tricornutum [16].

Figure 2 Relative fluorescence intensity of diatom cells under Ndeprivation. Triplicate samples of diatom cells were stained with NileRed after 1 and 2 days of N deprivation, their fluorescence was measuredand their relative fluorescence intensity was calculated by subtracting theautofluorescence of non-stained microalgae and Nile red. The left andright columns in each day reprensent the control and –N, respectively.
Table 1 Fatty acid composition of P. tricornutumfollowing N deprivation
Fatty acids Control -N
Total FA% DW% Total FA% DW%
C14:0 (myristic) 5.31 0.22 6.27 0.12
C16:0 (palmitic) 15.89 0.66 25.87 0.49
C18:0 (stearic) 2.67 0.11 2.37 0.04
Sum SFA 23.87 0.99 34.51 0.65
C16:1 (palmitoleic) 23.91 0.99 42.55 0.80
C18:1 (oleic) 2.45 0.10 NT ND
Sum MUFA 26.36 1.09 42.55 0.80
C18:2 (linoleic) NT NT 5.22 0.10
C18:3 (linolenic) 2.69 0.11 1.25 0.02
C20:5 (eicosapentaenoic) 20.33 0.84 11.67 0.22
C22:6 (docosahexaenoic) 1.07 0.04 0.64 0.01
Sum PUFA 24.09 1.00 18.78 0.35
other FA 10.88 0.45 2.71 0.05
Total FA identified 85.20 3.53 98.55 1.85
Unsaturation ratios:
C 16 unsat./C16:0 1.50 0.06 1.64 0.03
C18 unsat./C18.0 1.93 0.08 2.73 0.05
Total unsat./total sat. 2.11 0.09 1.78 0.03
Lipid content (DW) 24.13 53.33
Abbreviations: FA, Fatty acid; DW, Dry weight; SFA, Saturated fatty acid; MUFA,Monounsaturated fatty acid; PUFA, Polyunsaturated fatty acid; ND, not detected.
Yang et al. Biotechnology for Biofuels 2013, 6:67 Page 3 of 14http://www.biotechnologyforbiofuels.com/content/6/1/67
Observation of oil bodies by confocal microscopyThe size and number of oil bodies in sampled cells wereobserved every day during the culture cycle using a laserscanning confocal microscope. Substantially more oilbodies were observed in the N-deprived cells than incontrols, but their sizes were similar (Figure 3), with di-ameters ranging from 0.2 to 2.0 μm. Thus, the total vol-ume of oil bodies was clearly higher in the N-deprivedcultures than in the controls, in accordance with theneutral lipid increase, as shown in Figure 2.
High-throughput analysis of differential gene expressionTo characterize the effects of N deprivation further, weexamined differences in gene expression before and afterN-deprivation, using RNA-Seq. The complete dataset islisted in Additional file 1, and also available at http://guanlab.ccmb.med.umich.edu/data/Yang_N_deprivation/,but briefly 1213 genes were found to be up-regulated, withan FDR cutoff of 0.1%, and 4527 genes were down-regulated, indicating that the deprivation induced wide re-programming of regulation. Distribution of the number ofreads across different mRNA sequence size indicates a sig-nificant correlation (Additional file 2: Figure S1). To vali-date the findings we applied quantitative RT-PCR (qPCR)to a randomly selected set of genes, including β-actin as ahousekeeping marker, to test the differential expression.The RNA-Seq measurements are highly consistent withthe quantitative PCR results, confirming their robustness.
For example, Phatrdraft_27877, encoding an ammoniumtransporter protein, was up-regulated 5.46 (log2)-fold and116-fold under N-deprivation, according to the RNA-Seqand qPCR analyses, respectively (Table 2).
General transcriptional changes under N deprivationTo elucidate the molecular basis of the observed accu-mulation of fatty acids under N deprivation, genes en-coding all known enzymes in the P. tricornutum genomewere mapped in KEGG pathways, together with log2-folddifferences in RNA expression between the control andN-deprived cultures. Global changes in major categoriesof genes involved in various pathways, reflecting generaltranscriptional responses to N deprivation, are depictedin Figure 4 and listed in Additional file 3: Table S1a.Genes encoding photosynthesis, gluconeogenesis, glyoxylatecycle, chrysolaminarin synthesis and sucrose metabolismenzymes were, on average, significantly down-regulatedunder N deprivation, while genes involved in nitrogen fix-ation, carbon fixation, glycolysis and the TCA cycle weregenerally up-regulated.The primary effect of N deprivation is the reduced
availability of nitrogen, an essential nutrient for de novosynthesis of amino acids, nucleic acids and variousother cellular constituents. Unsurprisingly, therefore, itstrongly affected transcript levels of genes involved in

6d control 6d –N 7d control 7d -N
1d 2d 3d 4d 5d
Figure 3 Representative confocal microscope images of the diatoms, showing oil bodies. Cells sampled during a 7-day culture cycle werestained with Nile Red and photographed under the confocal microscope daily. –N, cells subjected to the N deprivation treatment five days aftersubculture; Control, cells grown in f/2-Si medium and switched to fresh medium five days after subculture. Bar = 2 μm.
Yang et al. Biotechnology for Biofuels 2013, 6:67 Page 4 of 14http://www.biotechnologyforbiofuels.com/content/6/1/67
nitrogen assimilation and metabolism (Additional file 3:Table S1b). Notably, marked increases were observed intranscripts encoding five of at least six ammoniumtransporters present in the diatom, which transport am-monium ions across the cell membrane and are knownto be activated by N deprivation [17]. The rise in thelevel of one of them was also confirmed in our qPCR test(Phatrdraft_27877, 45-fold increase). In addition, there wasa 7-fold increase in transcripts of glutamine synthase (GS,Phatrdraft_22357, EC 6.3.1.2), a key enzyme in ammoniaassimilation in both plants and Gram-negative microorgan-isms. GS plays an important role in the efficient use of ni-trogen sources and nitrogen metabolism. Other criticalnitrogen metabolism enzymes, such as nitrate reductase(Phatrdraft_54983, EC1.7.7.2), a molybdoenzyme that re-duces nitrate to nitrite, and ferredoxin-nitrite reductase(Phatrdraft_12902, EC1.7.7.1), which catalyzes conversionof nitrite to ammonia, also showed significant increases(4-fold and 33-fold, respectively) in transcript abundance.These observations indicate that N deprivation induceshomeostatic responses, including activation of the glutam-ine synthesis pathway and increases in the cells’ capacity to
Table 2 qPCR of differentially expressed genes following N d
qPCR
Locus tag Forward (5’-3’) Reverse (5’-3’)
54257 agaatcggtgatgcctgttc atgccgctgctttagtgaat
45012 acgattcggacgaagatcag ccatgcaacaatcgtagtgg
27877 acaccaccgacaagaccttc tccagacagagcgtacaacg
54465 gagcacttcgttctccaagg gtccagaaagccacagcttc
13154 caggaactcgcgaagttagg gcaagaatggaacccactgt
45852 aaggccacaatctcatggac cttttgacggatggcaactt
51183 ctttacaacgccctgatcgt ttgctgtcgtggaaagactg
9794 gcatattggaggctttggaa tctgcatcatcatcccgata
Each value corresponds to the mean of three biological sample performed in duplicsignificant changes are indicated by a p value<0.05 (Z-test).
utilize trace amounts of nitrogen resources, and also thepossible redistribution of intracellular nitrogen such as in-creased amino acid catabolism in accordance with the studyin T. pseudonana [6], ultimately yielding acetyl-CoA orsuccinyl-CoA as the TCA cycle intermediates.
Transcripts of photosynthesis-related genes decreasedAs shown in Additional file 3: Table S1c, levels of mosttranscripts encoding proteins associated with photosyn-thesis decreased under N deprivation, implicating thatphotosynthesis could be inhibited or at a standstill. Notably,only one encoding a light harvesting complex (LHC) com-ponent was up-regulated (Phatrdraft_16481, fucoxanthinchlorophyll a/c protein; up-regulated 10-fold), while mostof the others were down-regulated more than 10-fold.As previously demonstrated in C. reinhardtii, reductionsin the abundance of light-harvesting complexes may re-duce photosynthetic rates [18], in accordance with theo-retical expectations, unless reductions in transcript levelsare balanced by changes at other levels. Transcript levelsof ferredoxin-NADP+ reductase (Phatrdraft_43018), whichcatalyzes the last electron transfer, from photosystem I
eprivation
RNA-Seq
FC(N/Ctr) FC Log2(N/Ctr) Z-test FDR
103.3 5.80 0 0
26.0 5.56 6.71E-14 1.99E-13
116.6 5.46 0 0
−17.1 −8.98 0 0
3.35 7.42 2.46E-5 4.37E-5
23.6 7.41 7.47E-9 1.63E-8
−15.7 −8.65 0 0
1.35 −0.58 7.29E-3 0.010
ates; β- actin is used as house-keeping gene in real-time quantitative PCR;

Figure 4 Proposed general transcriptional changes under N deprivation. Schematic diagram showing the putative localization of centralmetabolic pathways of P. tricornutum. Changes in the transcript abundance of associated genes are indicated with the following symbolsrepresenting fold changes: ++++ > 5; 5 > +++ > 3; 3 > ++ > 1; 1 > + > 0; 0 < − < −1; -1 < −−− < −3; -3 < −−− < −5; −−− < −5. The symbol denotesthe overall changes of predicted isoenzymes. Some co-substrates or co-products of some reactions are omitted for clarity. The one “+” in thefatty acid synthesis in plastids denotes the overall transcriptional changes of the enzymes involved. Detailed fold changes are listed in Additionalfile 3 and Additional file 1. Enzymes were based on the genome annotation and prediction. Locus tags of some ambiguous isoenzymes areindicated. The localization of most of the enzymes are based on prediction and have not been determined experimentally.
Yang et al. Biotechnology for Biofuels 2013, 6:67 Page 5 of 14http://www.biotechnologyforbiofuels.com/content/6/1/67
to NADPH during photosynthesis [19], also decreased(4.6-fold).The reductions in mRNA levels of genes encoding
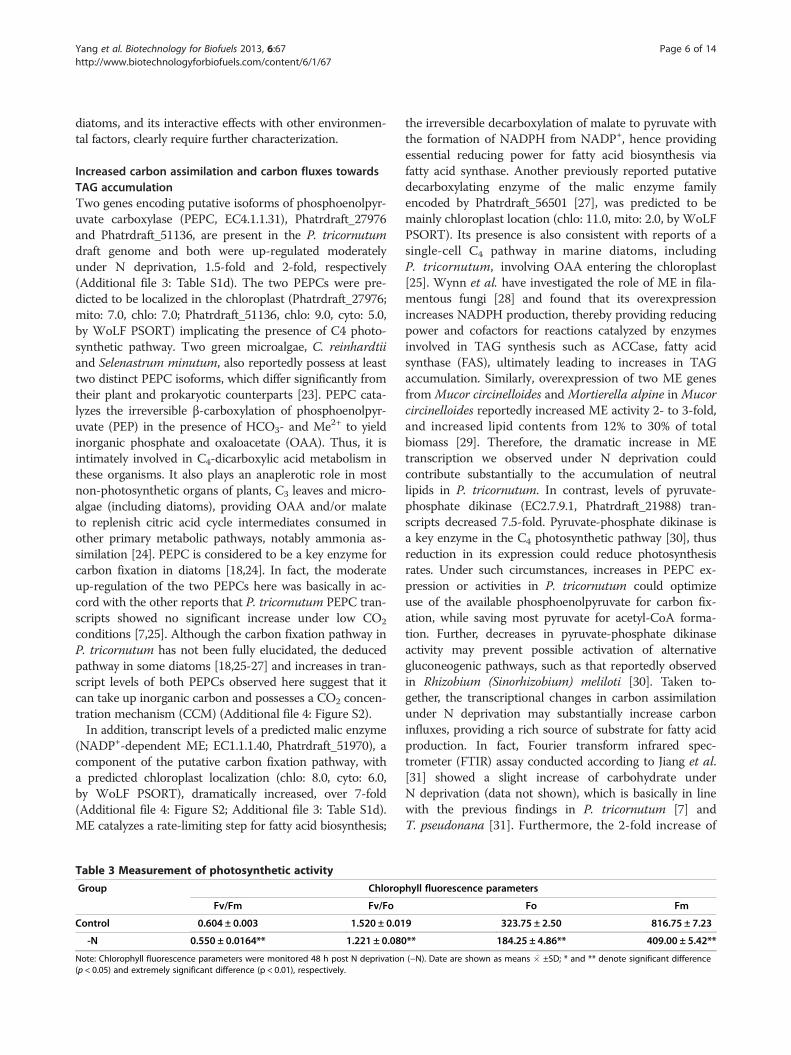
photosynthetic proteins under N deprivation were con-sistent with expectations since various stresses can in-hibit photosynthesis, and upregulated light harvestingcan result in excess production of highly toxic reactiveoxygen species (ROS) [20]. To examine whether the re-duced expression of photosynthetic genes was reflectedin physiological changes, we also measured and calculatedchlorophyll fluorescence parameters of the cultures, in-cluding Fo, Fm, Fv/Fm and Fv/Fo. As shown in Table 3, allof these parameters significantly decreased under Ndeprivation, indicating that the stress impaired PSII reac-tion centers, reduced the chlorophyll fluorescence yield,
and decreased both the primary light energy conversion ef-ficiency and potential photochemical activity of the PSII re-action centers [21]. The inhibition of genes associated withphotosynthesis by N deprivation observed in this study isconsistent with reported responses of P. tricornutum [7]and green alga Chlamydomonas [12,22], and can be con-sidered a generic response to nutrient deficiencies. A prac-tical implication of the findings for industrial biodieselproduction is that light may not be required for neutrallipid accumulation under N deprivation. However, a previ-ous report indicates that polysaccharides are produced athigh rates during light periods and consumed in the dark,while the total lipid contribution to dry weight is positivelyassociated with light intensity in N-deficient P. tricornutum[9]. Thus, the effects of light on lipid accumulation in
Yang et al. Biotechnology for Biofuels 2013, 6:67 Page 6 of 14http://www.biotechnologyforbiofuels.com/content/6/1/67
diatoms, and its interactive effects with other environmen-tal factors, clearly require further characterization.
Increased carbon assimilation and carbon fluxes towardsTAG accumulationTwo genes encoding putative isoforms of phosphoenolpyr-uvate carboxylase (PEPC, EC4.1.1.31), Phatrdraft_27976and Phatrdraft_51136, are present in the P. tricornutumdraft genome and both were up-regulated moderatelyunder N deprivation, 1.5-fold and 2-fold, respectively(Additional file 3: Table S1d). The two PEPCs were pre-dicted to be localized in the chloroplast (Phatrdraft_27976;mito: 7.0, chlo: 7.0; Phatrdraft_51136, chlo: 9.0, cyto: 5.0,by WoLF PSORT) implicating the presence of C4 photo-synthetic pathway. Two green microalgae, C. reinhardtiiand Selenastrum minutum, also reportedly possess at leasttwo distinct PEPC isoforms, which differ significantly fromtheir plant and prokaryotic counterparts [23]. PEPC cata-lyzes the irreversible β-carboxylation of phosphoenolpyr-uvate (PEP) in the presence of HCO3- and Me2+ to yieldinorganic phosphate and oxaloacetate (OAA). Thus, it isintimately involved in C4-dicarboxylic acid metabolism inthese organisms. It also plays an anaplerotic role in mostnon-photosynthetic organs of plants, C3 leaves and micro-algae (including diatoms), providing OAA and/or malateto replenish citric acid cycle intermediates consumed inother primary metabolic pathways, notably ammonia as-similation [24]. PEPC is considered to be a key enzyme forcarbon fixation in diatoms [18,24]. In fact, the moderateup-regulation of the two PEPCs here was basically in ac-cord with the other reports that P. tricornutum PEPC tran-scripts showed no significant increase under low CO2
conditions [7,25]. Although the carbon fixation pathway inP. tricornutum has not been fully elucidated, the deducedpathway in some diatoms [18,25-27] and increases in tran-script levels of both PEPCs observed here suggest that itcan take up inorganic carbon and possesses a CO2 concen-tration mechanism (CCM) (Additional file 4: Figure S2).In addition, transcript levels of a predicted malic enzyme
(NADP+-dependent ME; EC1.1.1.40, Phatrdraft_51970), acomponent of the putative carbon fixation pathway, witha predicted chloroplast localization (chlo: 8.0, cyto: 6.0,by WoLF PSORT), dramatically increased, over 7-fold(Additional file 4: Figure S2; Additional file 3: Table S1d).ME catalyzes a rate-limiting step for fatty acid biosynthesis;
Table 3 Measurement of photosynthetic activity
Group Chlorop
Fv/Fm Fv/Fo
Control 0.604 ± 0.003 1.520 ± 0.01
-N 0.550 ± 0.0164** 1.221 ± 0.080
Note: Chlorophyll fluorescence parameters were monitored 48 h post N deprivation(p < 0.05) and extremely significant difference (p < 0.01), respectively.
the irreversible decarboxylation of malate to pyruvate withthe formation of NADPH from NADP+, hence providingessential reducing power for fatty acid biosynthesis viafatty acid synthase. Another previously reported putativedecarboxylating enzyme of the malic enzyme familyencoded by Phatrdraft_56501 [27], was predicted to bemainly chloroplast location (chlo: 11.0, mito: 2.0, by WoLFPSORT). Its presence is also consistent with reports of asingle-cell C4 pathway in marine diatoms, includingP. tricornutum, involving OAA entering the chloroplast[25]. Wynn et al. have investigated the role of ME in fila-mentous fungi [28] and found that its overexpressionincreases NADPH production, thereby providing reducingpower and cofactors for reactions catalyzed by enzymesinvolved in TAG synthesis such as ACCase, fatty acidsynthase (FAS), ultimately leading to increases in TAGaccumulation. Similarly, overexpression of two ME genesfrom Mucor circinelloides and Mortierella alpine in Mucorcircinelloides reportedly increased ME activity 2- to 3-fold,and increased lipid contents from 12% to 30% of totalbiomass [29]. Therefore, the dramatic increase in MEtranscription we observed under N deprivation couldcontribute substantially to the accumulation of neutrallipids in P. tricornutum. In contrast, levels of pyruvate-phosphate dikinase (EC2.7.9.1, Phatrdraft_21988) tran-scripts decreased 7.5-fold. Pyruvate-phosphate dikinase isa key enzyme in the C4 photosynthetic pathway [30], thusreduction in its expression could reduce photosynthesisrates. Under such circumstances, increases in PEPC ex-pression or activities in P. tricornutum could optimizeuse of the available phosphoenolpyruvate for carbon fix-ation, while saving most pyruvate for acetyl-CoA forma-tion. Further, decreases in pyruvate-phosphate dikinaseactivity may prevent possible activation of alternativegluconeogenic pathways, such as that reportedly observedin Rhizobium (Sinorhizobium) meliloti [30]. Taken to-gether, the transcriptional changes in carbon assimilationunder N deprivation may substantially increase carboninfluxes, providing a rich source of substrate for fatty acidproduction. In fact, Fourier transform infrared spec-trometer (FTIR) assay conducted according to Jiang et al.[31] showed a slight increase of carbohydrate underN deprivation (data not shown), which is basically in linewith the previous findings in P. tricornutum [7] andT. pseudonana [31]. Furthermore, the 2-fold increase of
hyll fluorescence parameters
Fo Fm
9 323.75 ± 2.50 816.75 ± 7.23
** 184.25 ± 4.86** 409.00 ± 5.42**
(−N). Date are shown as means �� ±SD; * and ** denote significant difference

Yang et al. Biotechnology for Biofuels 2013, 6:67 Page 7 of 14http://www.biotechnologyforbiofuels.com/content/6/1/67
C:N ratio during N depletion according to Valenzuelaet al. [7] together with the slight increase of carbohy-drate implicate that the carbon is challenged into theproduction of storage lipid during -N.P. tricornutum appears to possess at least five isoforms
of fructose-1,6-bisphosphatase (FBP, EC3.1.3.11), a keyregulatory enzyme of carbon metabolism (particularlythe Calvin cycle and gluconeogenesis), which catalyzesthe conversion of fructose-1,6-biphosphate to fructose-6-phosphate (Additional file 3: Table S1d). Transcript levelsof genes encoding four of these isoforms, Phatrdraft_2793,Phatrdraft_9359, Phatrdraft_31994 and Phatrdraft_8744,declined under N deprivation, 45-, 17-, 3- and 3.5-fold, re-spectively, while those of the other (Phatrdraft_23247)slightly increased, by 50%. Therefore, gluconeogenesis wasmarkedly inhibited and carbon flux was re-directed to-wards TAG accumulation under N deprivation. In contrast,two genes encoding phosphofructokinase (EC2.7.1.11),which catalyzes the committed step in the glycolytic path-way (conversion of fructose-6-phosphate to fructose-1,6-bisphosphate) were up-regulated: Phatrdraft_55126 andPhatrdraft_16844, by 36% and 50%, respectively. The up-regulation of glycolysis should theoretically direct carbonflux to the formation of pyruvate. Moreover, levels of tran-scripts encoding a precursor of the pyruvate dehydrogen-ase E1 component beta subunit (Phatrdraft_20183, EC1.2.4.1) and the alpha subunit (Phatrdraft_55035) increased3-fold and slightly (by 15%), respectively. These findingspropose that conversion of pyruvate to acetyl-CoA may beactivated under N deprivation, thereby providing substratefor the citric acid (TCA) cycle following the conversion ofacetyl-CoA to citrate as well as building up precursors toACCase for fatty acid biosynthesis. And we found that thepredicted cytosolic isocitrate dehydrogenase (Phatrdraft_14762) increased 16-fold, which is involved in the conver-sion of citrate to α-ketoglutarate. During this process,NADP+ is reduced to NADPH which is a critical cofactorfor many enzymatic reactions in lipid biosynthesis [32].Diatoms do not possess starch-forming enzymes, but
store fixed carbon as a complex, soluble carbohydratecalled chrysolaminarin (β-1, 3-glucan) in vacuoles. Tran-script levels of phosphoglucomutase (Phatrdraft_50445),which catalyzes the rate-limiting step of carbohydratesynthesis, decreased 3.7-fold under N deprivation. Thisis consistent with both the observations of neutral lipidaccumulation and recent reports that N-deprived C.reinhardtii mutants with phosphoglucomutase deficien-cies store neutral lipids in lipid bodies [33,34]. Further-more, since chrysolaminarin and TAG syntheses sharecommon 3-carbon photosynthate precursors, mutationsor reductions in the expression of phosphoglucomutasecould affect chrysolaminarin biosynthesis and redirectcarbon fluxes to TAG accumulation. The decrease incarbohydrate contents under N deprivation is consistent
with previous findings that high lipid contents in P.tricornutum are accompanied by low total carbohydratecontents [9].Almost all of the genes involved in the TCA cycle—
which converts 2-oxoglutarate, coenzyme A and NAD(+)to succinyl-CoA, NADH and carbon dioxide—were acti-vated under N deprivation (Additional file 4: Figure S2;Additional file 3: Table S1e). Levels of transcripts encodingtwo potentially rate-limiting enzymes of the TCA cycle—citrate synthase (Phatrdraft_30145, EC2.3.3.1) and isocit-rate dehydrogenase (EC1.1.1.42, Phatrdraft_30578) in-creased 3- and 22-fold, respectively. In addition, those ofa third TCA cycle enzyme, oxoglutarate dehydrogenase(Phatrdraft_29016, EC1.2.4.2), which converts 2-oxoglutarate to succinyl-CoA [19], slightly increased under Ndeprivation. These findings suggest that TCA cycle geneswere markedly up-regulated under N deprivation, thus in-creases in fluxes through the TCA cycle may compensatefor the loss of assimilatory power for carbon fixation dueto the down-regulation of photosynthesis.The transcript abundance of isocitrate lyase (Phatrdraft_
14401, EC4.1.3.1) and malate synthase (Phatrdraft_54478),two glyoxylate cycle enzymes identified in the P.tricornutum genome, decreased 5- and 2.5-fold, respect-ively. This implies that the metabolic flux through theglyoxylate cycle could be reduced under N deprivation,thereby further inhibiting overproduction of oxaloacetateand gluconeogenesis. Similarly, transcripts encoding phos-phoenolpyruvate carboxykinase (Phatrdraft_55018), whichcatalyzes the committed step of gluconeogenesis, de-creased by 20%.
Multiple sources for TAG accumulation and reductions inlipid catabolismTranscript levels of genes associated with TAG biosynthesiswere up-regulated by N-deprivation (Additional file 3: TableS1f). Notably, mRNA levels of Phatrdraft_9794, encodingdiacylglycerol acyltransferase (DGAT, EC2.3.1.20), increasedby 30%, according to both the RNA-Seq and qPCR analyses(Table 2). DGAT catalyzes the final committed step of TAGbiosynthesis, thus the increase in its mRNA abundanceunder N deprivation may have increased TAG levels some-what, but not as much as the observed increase in neutrallipid contents. Similarly, in C. reinhardtii there are twoDGAT homologs, and transcripts encoding (DGTT2) arereportedly present at consistently low levels under all testedconditions, including N deprivation, while mRNA of theother (DGTT3) is present at low levels and only increasesslightly under N deprivation [12]. The ability of increases inDGAT expression to raise TAG levels has been demon-strated by heterologous expression of P. tricornutum DGAT(PtDGAT1, Phatrdraft_9794) in a Saccharomyces cerevisiaeneutral lipid-deficient quadruple mutant strain, whichrestored TAG and lipid body formation, and promoted

Yang et al. Biotechnology for Biofuels 2013, 6:67 Page 8 of 14http://www.biotechnologyforbiofuels.com/content/6/1/67
incorporation of saturated fatty acids into TAGs [35]. Simi-larly, overexpression of Tropaeolum majus DGAT1 in Bras-sica napus and Arabidopsis thaliana resulted in 11–30%net increases in seed oil content [36].Comparing with the much more increase of neutral lipid
levels in P. tricornutum under N deprivation (2.4-fold), theslight increase of DGAT transcripts could be less effective.We examined further potential sources of substrates forTAG accumulation, and found that mRNA levels of an-other enzyme, responsible for the last step of TAG biosyn-thesis, phospholipid:diacylglycerol acyltransferase (PDAT,Phatrdraft_8860, EC2.3.1.158), increased 2-fold. Interest-ingly, in addition to the DGAT-catalyzed pathway, anotheracyl-CoA independent pathway catalyzed by PDAT forTAG synthesis has been discovered in Arabidopsis, inwhich acyl is directly transferred from phosphatidylcholine(PC) to DAG and thus TAG is synthesized without use ofCoA as an intermediate [37]. Phosphatidate phosphatase(PAP, EC3.1.3.4, Phatrdraft_40261) mRNA levels increasedby 25%, which were responsible for the intermediate DAGfor PDAT-catalyzed TAG accumulation. These findingssuggest that the PDAT-mediated pathway or intracellularmembrane remodeling may have contributed to the ob-served TAG accumulation.The transcript abundance of genes involved in fatty
acid elongation decreased under N deprivation. Delta 6elongase (Phatrdraft_20508) and long chain acyl-CoAelongase (Phatrdraft_34485) levels decreased by 16% and32%, respectively, which is consistent with observed reduc-tions in C20:5 and C22:6 fatty acids, as shown in Table 1.Responses of genes encoding fatty acid desaturases varied.Transcript abundance of two desaturases catalyzing PUFAformation (delta 12 fatty acid desaturase, Phatrdraft_25769,and delta 9 fatty acid desaturase, Phatrdraft_28797) de-creased, by 2.6- and 4-fold, respectively. In contrast, the ex-pression of delta 5 fatty acid desaturase (Phatrdraft_46830),involved in MUFA synthesis, increased dramatically (32-fold). These results are in line with the higher MUFA andlower PUFA proportions of fatty acids under N deprivation(Table 1).In accordance with the general increases in transcript
levels of genes involved in TAG synthesis, levels of thoseinvolved in lipid catabolism generally decreased under Ndeprivation, those of acyl-CoA oxidase (Phatrdraft_19979)and 3-oxoacyl-CoA thiolase (ATO1) most dramatically;11-fold and more than 3-fold, respectively.Lipases are enzymes that de-esterify carboxyl esters,
such as TAGs and phospholipids. More than 28 genes en-coding putative lipases are present in the P. tricornutumgenome (Additional file 3: Table S1g) and their responsesto N deprivation varied markedly. Since TAG accumulatedmarkedly under N deprivation, TAG lipases would beexpected to be down-regulated. Among the putative lipasegenes, eight (28%) showed increased transcript abundance
but mainly only slightly, and transcript levels of mostof the others decreased more than 2-fold. For example:Phatrdraft_44231, which encodes a putative triacylglycerollipase, decreased 5-fold; Phatrdraft_50397 decreased 4-fold; while 43593 increased nearly 4-fold. These lipasegenes may play important roles in membrane turnover,and their overall reduction in transcription may protectthe TAG from degradation, thereby promoting remodelingand TAG accumulation under N deprivation.
Effects of N deprivation on the subcellular ultrastructureSections of cells were observed by transmission electronmicroscopy to assess the impact of N deprivation on theirultrastructure. Numerous oil bodies, of various sizes, werepresent in both the N-deprived and control cells. How-ever, their total volumes were substantially higher in theformer (Figure 5). The oil bodies in the N-deprived cellswere globular, compact, and mostly 0.1 to 0.3 μm in diam-eter, but a few (2 to 5 per section) were much larger, up to2.0 μm. In addition to causing significant changes in oilbody contents, N deprivation strongly affected chloroplastultrastructure. Diatoms are protists that contain typicalsecondary plastids surrounded by four membranes. Thus,they differ strongly from those of the algae sensu stricto(in particular, green algae such as Chlamydomonas) andvascular plants such as Arabidopsis, which contain simpleplastids bounded by two membranes). In the control cells,although the cultures were in stationary phase, the chloro-plast and thylakoid membranes were still highly organized.In contrast, the four enclosing membranes and thylakoidmembrane system tended to be dispersed and poorly or-ganized under N deprivation.The main membrane lipids in plant chloroplasts are
monogalactosyldiacylglycerol (MGDG) and digalactosyl-diacylglycerol (DGDG). In Arabidopsis, these galacto-lipids are critical for the biogenesis of photosyntheticmembranes, and provide sources of PUFA for the wholecell and phospholipid surrogates under phosphorus-limited conditions. Further, dramatic accumulations ofDGDG accompanied by major reductions in membranephospholipids have been observed in phosphorus-limitedArabidopsis, suggesting that the plant can substitute DGDGfor phospholipids during phosphate starvation [38]. Thesegalactolipids are synthesized by MGD and DGD galactosyl-transferases/synthases, which also mediate membrane lipidremodeling [38]. Three genes encoding putative monoga-lactosyldiacylglycerol synthases (EC 2.4.1.46) were detectedin the P. tricornutum genome: Phatrdraft_9619, Phatr-draft_54168 and Phatrdraft_14125, which showed 6-, 6-and 9-fold decreases in transcript levels, respectively, underN deprivation. These results imply that membrane lipidremodeling, mediated by reductions in the expression ofMGDG and/or DGDG galactosyltransferases, occurred inthe N-deprived cells.

Figure 5 Effects of N deprivation on P. tricornutum ultrastructure. Transmission electron micrographs showing subcellular structures ofN-deprived (−N) and control P. tricornutum cells. OB, oil body; Chl, chloroplast; Pg, plastoglobule; boxed areas are magnified and showed to theright, demonstrating the dispersed thylakoid membranes under -N. Bar = 200 nm.
Yang et al. Biotechnology for Biofuels 2013, 6:67 Page 9 of 14http://www.biotechnologyforbiofuels.com/content/6/1/67
To further assess the contribution of membrane re-modeling to lipid accumulation, total lipid extracts wereseparated into various lipid classes (Additional file 5:Figure S3) and analyzed by ESI/MS. The results showedthat there were nine main classes of lipids in the P.tricornutum cells, and peak area measurements indicatedthat the proportions of MGDG and DGDG in the cellsmarkedly decreased 50% under N deprivation, while theproportion of TAG (the major component of neutral lipids,mixed with photosynthetic pigments) appeared doubled.We also analyzed the acquired transcription dataset to
identify down-regulated genes that were annotated to thechloroplast. Out of 50 genes annotated to thylakoids, 45were down-regulated, and only five were up-regulated.Our results demonstrate that lipid remodeling providespotential pathways for converting membrane lipids tosubstrates for TAG accumulation in P. tricornutum’s re-sponses to N deprivation.Moreover, electron-dense osmiophilic globuli previously
reported as plastoglobuli [39] were detected in the stromaof both N-deprived and control cells, but there were fewerin the former (Figure 5). The functions of plastoglobuli andtriggers for their formation are not well understood.
However, protein profiles of plastoglobuli indicate thatmetabolic enzymes accumulate in them and they have dis-tinct lipoprotein structures [39]. In addition, overexpressingthe plastoglobule structural protein fibrillin in plants resultsin increased frequencies of plastoglobuli [40], suggestingthat fibrillin is involved in their formation. Transcriptsencoding fibrillins in P. tricornutum (Phatrdraft_48066and Phatrdraft_55153, encoding PAP-fibrillin-1 and PAP-fibrillin-2) decreased 4- and 5-fold, respectively. This couldat least partially explain the decrease of plastoglobuli inN-deprived cells.
ConclusionThe overall goal of this study was to use genomic infor-mation and various analytical techniques to obtain anoverview of the molecular mechanisms responsible forneutral lipid accumulation in the model diatom P.tricornutum induced by N deprivation. N-deprived cul-tures of the diatom showed up to 2.4-fold increases inneutral lipid contents per cell, slightly higher cell densitythan controls and exhibited ultrastructural changes. Inaddition, the lipid composition of the N-deprived cells

PhotosynthesisTCA cycle
Chrysolaminarinsynthesis
Gluconeogenesis
Lipid catabolism
Carbon assimilation
TAG accumulation
Membrane remodeling PyruvateGlycolysis
TAG neo-synthesis
Figure 6 Schematic diagram indicating effects of N deprivationon processes involved in TAG accumulation based ontranscriptional changes. Square and elliptical boxes indicate up-regulation and down-regulation, respectively. “ѳ” indicates inhibitionof the corresponding process.
Yang et al. Biotechnology for Biofuels 2013, 6:67 Page 10 of 14http://www.biotechnologyforbiofuels.com/content/6/1/67
was more suitable for biodiesel production as they hadhigher proportions of saturated fatty acids.Although the level of transcription is not directly pro-
portional to the enzyme and the catalytic activity, recentstudy on another diatom T. pseudonana has shown agood correlation of proteomic and transcriptomic data[6]. In combination with biochemical investigations, ourresults could provide a global view of biosynthetic meta-bolic fluxes and unraveled significantly altered key meta-bolic pathways in the diatom following N deprivation.As summarized in Figure 6, it induced genes involved incarbon fixation, the TCA cycle and glycerolipid metabo-lism, but inhibited genes involved in light harvesting andphotosynthesis. Energy resources necessary for carbonfixation and energy demand associated with the neutrallipid synthesis could be replenished from other sourcessuch as elevated TCA cycle. A possible catabolism ofcarbohydrate reserves including chrysolaminarin maylargely explain the neo-synthesis of TAG, in accordancewith the up-regulation of glycolysis, coupled with thesuppression of critical enzymes, mostly involved in lipidcatabolism. The gene expression analyses, in combinationwith the ultrastructural and biochemical investigations, in-dicate that additional fatty acids could be produced bymembrane remodeling. Thus, the findings provide indica-tions of several mechanisms that contribute to the highlipid contents of microalgal cells under N deprivation.The results also provide indications of strategies that
could be used to enhance biodiesel production frommicroalgal cultures. The two-step culture method ap-plied here dramatically increased neutral lipid accumula-tion, up to 2.4-fold, more than previous N limitation orcontinuous deficiency strategies. Furthermore, the inhi-bition of light harvesting under N deprivation indicatesthat high light intensity is not required for lipid accumu-lation, and the increase in carbon fixation suggests thatincreasing CO2 supplies during this stage should beadvantageous.In summary, results of this study show that diatom cul-
tures with high levels of neutral lipids and increased cellproliferation rates can be obtained by nitrogen deprivationduring the late exponential phase. They also provide indi-cations of strategies that could be applied to manipulatethe biosynthetic pathways of microalgae to generate cul-tures with high levels of lipids that may be suitable for bio-diesel production.
Materials and methodsAlgal culturesMarine diatom Phaeodactylum tricornutum, with a fusi-form morphotype, was obtained from the Freshwater AlgalCulture Collection of the Institute of Hydrobiology, China(No. FACHB-863), and sub-cultured weekly, using a quar-ter of the preceding cultures as inocula, in Erlenmeyer
flasks containing medium sterilized by passage through0.22-μm filters (Millipore). The growth medium (f/2-Si)contained 75 mg NaNO3, 5.65 mg NaH2PO4 · 2H2O, 4.16mg Na2 EDTA, 3.15 mg FeCl3 · 6H2O, 0.01 mg CuSO4 ·5H2O, 0.022 mg ZnSO4 · 7H2O, 0.01 mg CoCl2 · 6H2O,0.18 mg MnCl2 · 4H2O, 0.006 mg Na2MoO4 · 2H2O, 0.0005mg vitamin B12, 0.1 mg vitamin B1 and 0.0005 mg Biotinper liter in natural seawater, acquired from Daya Bay,Huizhou, China. The synchronized cultures were routinelycultivated in an artificial climate incubator at constant ir-radiance (200 μmol photons · m–2 · s–1) and temperature(21 ± 0.5°C) with 12 h/12 h (1ight/dark) photoperiods.For the experiments reported here, 1.5 L of algal culture
in late-logarithmic growth phase was harvested 5 days aftersubculturing at 14:00 by centrifugation (4400 rpm for 10min at 4°C). The supernatant was discarded, the cell pelletwas washed twice with NaNO3-free f/2-Si medium to com-pletely remove the N. Then the cells were collected by cen-trifugation (4400 rpm for 15 min at 4°C), and the resultingpellet was re-inoculated into 1.5 L N-free f/2-Si medium.The resuspended culture was divided into two aliquots.One aliquot was split into six equal portions, which weretransferred into six flasks, each containing 125 mL N-freemedium, and cultured under the above conditions (desig-nated N-deprived cultures). The other aliquot was also di-vided, transferred to six flasks and similarly treated, exceptthat the medium was supplemented with N, to provide con-trols. To maintain sampling consistency with respect to thediel cycle, cells were sampled at 14:00 every day.
Cell density determinationCell numbers were counted using an Olympus micro-scope and Brightline Hemocytometer at the same timeevery day, in triplicates. Cell density (cell mL-1) was cal-culated as follows:
CD ¼ N=80ð Þ � 400� 104
where CD is cell density and N is the cell number per80 grid cells.

Yang et al. Biotechnology for Biofuels 2013, 6:67 Page 11 of 14http://www.biotechnologyforbiofuels.com/content/6/1/67
To facilitate counting, each sample was diluted 2-foldif the cell density exceeded 4 × 10⁶ cells mL-1.
Neutral lipid content analysisNile red is a soluble phenoxazone lipid dye that parti-tions to cytoplasmic oil bodies in cells, and becomesfluorescent [41], the intensity of the fluorescence provid-ing robust and convenient indications of the amount ofneutral lipids present in various species, including thegreen microalga Chlorella [14,41,42]. In this study, thevalidity of the method for determining cellular lipid con-tents of P. tricornutum was first tested, by staining sam-ples of the cultures with Nile Red (Sigma) followingChen et al., with modifications [14]. Nile red (30 μL of a0.1 mg mL-1 acetone solution) was added to 3 mL por-tions of cell cultures in triplicate, the resulting suspen-sions were mixed by rapid inversion, and incubated indarkness for 20 min at room temperature. The stainedcell cultures were then transferred to cuvettes to deter-mine their fluorescence intensity using a fluorescencespectrophotometer with 480 nm excitation wavelength.The optimal emission wavelength (592 nm) and stainingtime (20 min) were determined empirically, using non-stained cultures as auto-fluorescence controls. The relativefluorescence intensity values reported here reflect the dif-ferences in neutral lipid contents between stained andnon-stained cells.
Fatty acid composition analysisFor fatty acid profiling analysis, total lipids were extractedfrom three independent biological replicates according tothe method of Lepage and Roy [43], with modifications.Portions (250 mL) of the cultures were harvested aftertwo days of N deprivation by centrifugation at 4400 rpmat 4°C for 10 min. Pellets were transferred to 10 mL tubes.Then 5 mL KOH-CH3OH solution was added to eachtube, the cells were lysed by ultrasonication in an ice bath,the tubes were infused with nitrogen for 1 min, tightlysealed, agitated and incubated at 75°C for 10 min. Aftercooling to room temperature the upper phase was trans-ferred to a 50 mL tube. The lower phase was subjectedto two further washes with 5 mL KOH-CH3OH, lysisand incubation, as described above, the resulting upperphases from each sample were pooled in a single tube,then 15 mL of HCl-CH3OH solution was added, the solu-tion was thoroughly mixed and incubated again at 75°Cfor 10 min. N-hexane (4 mL) was added, the mixture wasvortex-mixed, and allowed to settle. The upper phase wasthen transferred to a new 10 mL tube, while the lowerphase was re-extracted with hexane. Then, the upperphases were pooled in a 10 mL tube, dried under a nitro-gen stream in a Nitrogen Evaporator (Organomation,USA) and the residues were weighed and stored at −80°Cuntil analysis. Fatty acids were determined by gas
chromatography–mass spectrometry (GC-MS) at the In-stitute of Microbiology, Guangdong, China. The chroma-tographic column used was a 30 m × 0.25 mm× 0.25 μmDB-5 quartz capillary column. The column temperaturewas held at 60°C for 1 min, raised by 10°C min-1 to 160°C, and to a final temperature of 250°C at 2.5°C min-1.The injector temperature was 280°C, and 1 μL sampleswere injected, splitless. The mass spectrum transmissionline temperature was 200°C, and fatty acids were identi-fied using the equipped NBS spectrum library, andquantitatively analyzed by determining integrated peakareas. Relative (percentage) contents of detected fattyacids were calculated by using the normalizationmethod.For lipid profiling analysis, total algal lipids were
extracted following a protocol for Arabidopsis leaf tissue[44] with modifications. 200 ml algal culture washarvested and the resulting pellets were quicklyimmersed in 3 ml preheated (75°C) isopropanol with0.01% butylated hydroxytoluene (BHT) for 15 min. Thealgal cells were then subjected to 80 rounds (5 s) ofultrasonication in an Ultrasonic Crasher Noise IsolatingChamber, with 200 W output energy and 7 s intervals,during which the samples were placed in an ice bath toprevent lipid degradation. Then, 1.5 ml chloroform and0.6 ml water were added to the cell detritus, and the sus-pensions were vortex-mixed and agitated in a shakingincubator at low temperature at 4°C for 40 min. Themixtures were centrifuged at 4400 rpm for 8 min toseparate phases, and the lower phase was transferred toa new 10 ml centrifuge tube. The remaining debris wasextracted twice with 3 ml chloroform/methanol (2:1)with 0.01% BHT, after which it was white. All extractsfrom samples representing cultures subjected to thesame treatment were pooled, 1 ml of 1 M KCl wasadded, the resulting mixture was shaken and centrifuged,and the upper phase was discarded. Then 2 ml waterwas added to wash the extract, the mixture wascentrifuged (12000 rpm for 10 min) and the upper phasewas removed. Finally, the organic solvents were evapo-rated by nitrogen and the residues were stored in a −80°C refrigerator until analysis. Total lipid extracts wereseparated into lipid classes according to Demandre et al.with modifications [45]. The dried algal lipid extractswere re-dissolved in 1 mL buffer A (isopropanol-hexane,4:3), and the solutions were centrifuged at 14000 rpmfor 10 min to remove solid impurities, then transferredto a glass vial. Lipid classes were subsequently separatedby HPLC using a silica column and a mobile phaseconsisting of a 20-min linear gradient from 100% solu-tion A to 100% B (isopropanol-hexane-water, 8:6:1.5),followed by isocratic solution B for a further 25 min,with the column and sample collection system set at 20°C.The total running time, including a 5 min re-equilibration

Yang et al. Biotechnology for Biofuels 2013, 6:67 Page 12 of 14http://www.biotechnologyforbiofuels.com/content/6/1/67
step, was about 50 min. The flow rate was 1.0 mL min-1
and 10 μL samples were injected. Eluting fractions oflipids were detected spectrophotometrically at 205 nm,manually collected in separate glass tubes, then storedat −20°C. Compounds in the lipid classes fractionatedwere diluted in isopropanol and identified using aMicromass Q-TOF micro system (Waters Co., UK)equipped with a syringe pump, LockSpray and ESI inter-face, operated in positive ionization mode. The massspectrometer conditions were as follows: electrospraycapillary voltage, 3.2 kV; ion source temperature, 110°C;desolvation temperature, 350°C; cone voltage, 15V; coneand collision gases, nitrogen and argon, at 60 L h-1 and600 L h-1 flow rates, respectively. Sodium formate solu-tion was used to calibrate the TOF mass spectrometerin positive electrospray ionization (ESI+) mode, and leu-cine enkephalin (L-EK) was used as an external masscalibration standard. Masses were scanned from 100 to1100 amu at approximately 0.4 scan s-1, and data werecollected from m/z 90 to 1000 in continuum mode, andanalyzed by Micromass MassLynx 4.1 software (WatersCo., USA). Peaks were also qualitatively analyzed bycomparing determined molecular weights with relateddata in the LIPID MAPS Structure Database (LMSD).
Observation of oil bodiesTo visualize oil bodies and assess their morphology,localization and numbers in the cultured cells Nile Redstaining was applied (0.1 mg mL-1 in acetone in a 1:100ratio) in dark conditions, using a similar procedure tothat described for determination of the cells’ neutrallipid contents. The mixtures were thoroughly mixed,applied to a glass slide, covered with a coverslip afterabout 10 min, then observed under an LSM 510 METAlaser-scanning confocal microscope (Zeiss), with 543nm excitation wavelength and 570–610 nm emissionwavelength. Pictures were acquired randomly from atleast 20 cells per sample, and typical images arepresented here.
RNA-Seq analysisAfter 48 hours of N deprivation, total RNA was extractedfrom six replicates of control and N-deprived culturesusing an RNeasy Plant Mini kit (QIAgen) following themanufacturer’s instructions. The RNA samples weretreated with QIAgen RNase-free DNase I during extrac-tion, and the extracted mRNA was enriched using oligo(dT) magnetic beads. After adding fragmentation buffer,the mRNA was fragmented into short sequences (about200 bp), first-strand cDNA was synthesized using randomhexamer-primers and the mRNA fragments as templates,and then second strands were synthesized. The resultingdouble-stranded cDNA was purified with a QIAquickPCR extraction kit and subjected to end repair and single
nucleotide A (adenine) addition. Finally, sequencing adap-tors were ligated to the fragments, the required fragmentswere purified by agarose gel electrophoresis, enriched byPCR amplification, and sequenced using a HiSeq™ 2000(Illumina) instrument, with default quality parameters, atthe BGI (Shenzheng), China.
Validation of RNA-Seq data by quantitative real-time PCRTriplicate portions (2 μg) of total RNA were reverse-transcribed using random hexamer primers and anOmniscript reverse transcription kit (QIAgen). Targetgenes (and β-actin as a housekeeping marker) werethen subjected to quantitative PCR amplification in96-well optical reaction plates in 20 μL mixtures perwell, using a SYBR Green Kit (Takara Bio) following themanufacturer’s instructions and a 7300 Sequence DetectionSystem (Applied Biosystems/Life Technologies). Thethreshold cycle (Ct) for each well was measured, and themRNA levels of the target genes in N-deprived cells, rela-tive to those of controls, were quantified after normalizationto β-actin.
RNA-Seq data processing and metabolic pathway analysisThe draft P. tricornutum reference genome was obtainedfrom http://genome.jgi-psf.org/Phatr2/Phatr2.download.ftp.html. The sequence is composed of “finished chromo-somes” (Phatr2) and “unmapped sequences” (Phatr2_bd),which were annotated separately, and both were includedin this study for comprehensive analysis. We aligned RNAshort reads (11751810 in total) with the reference genomeusing SOAP 2.21 and default parameters. All originaland mapped data are available at http://guanlab.ccmb.med.umich.edu/data/Yang_N_deprivation/. This resultedin 10786429 mapped reads (91.79%). Any gene with one orno reads was discarded as non-confident, and with this con-straint we aligned 12312844 reads obtained from samplesof N-deprived cultures, with 11326275 (91.99%) mappedto the genome. RPKM (Reads Per Kilobase per Millionmapped reads) values were estimated and log2-transformed[46] for each gene defined in the Phatr2 database. Thisallowed us to estimate the fold-change in their transcriptlevels under nitrogen deprivation. We downloaded theKEGG pathway database (a unique set of genes that canbe confidently associated with each protein in the KEGGpathway repository) released on Jun 30, 2011. We com-piled all KEGG-annotated genes for P. tricornutum, and allthose of other species meeting an e-value cutoff constraintof 1e-5 identified by BLAST analysis, retaining the best hits.We then hand-curated these two sets to remove inconsis-tencies and incorrect annotations, which resulted in 3648genes with a KEGG id in total, and transformed the expres-sion fold-change to a color gradient, where red representsup-regulation and green down-regulation. The subcellularlocalization of the enzymes were based on the prediction in

Yang et al. Biotechnology for Biofuels 2013, 6:67 Page 13 of 14http://www.biotechnologyforbiofuels.com/content/6/1/67
the GenBank database, the prediction softwares online in-cluding WoLF PSORT (http://wolfpsort.org/) and SignalP(http://www.cbs.dtu.dk/services/SignalP/), besides relevantreferences.
Measurement of photosynthesis activityChlorophyll fluorescence parameters sensitively reflectthe instantaneous photosynthetic state of diatoms andtheir acclimation to current environmental conditions.Fv/Fm (the variable/maximum fluorescence ratio) indi-cates the maximum photochemical quantum yield ofPSII reaction centers, reflecting the photosynthetic lightenergy conversion efficiency. Thus, it is a widely usedindex of photosynthetic performance and acclimationstatus [21]. Fo is the minimum fluorescence yield whenPSII reaction centers are fully open. Damage to or irre-versible loss of activity of PSII reaction centers will causea decrease in the Fo value. Fm is the maximum fluores-cence yield when PSII reaction centers are completelyclosed, thus it reflects the PSII electron transport cap-acity. Fv is the variable fluorescence (Fv = Fm-Fo),reflecting reduction of the PSII primary electron acceptorQA, thus indicating the photochemical activity of PSII reac-tion centers. To measure these parameters, P. tricornutumcultures were kept in the dark for 20 min, then exposed toa saturating light pulse (3000 mol · m-2 · s-1) for l secwhile the chlorophyll fluorescence intensities weremeasured with a Handy-PEA chlorophyll fluorimeter(Hansatech Instruments Ltd) following the manufac-turer’s recommendations.
Ultrastructural analysis by transmission electron microscopySamples were fixed in 2% v/v glutaraldehyde, 2% w/vparaformaldehyde in 100 mM sodium cacodylatebuffer-NaOH, pH 7.4, for 2.5 h at 4°C and rinsed threetimes (20 min per rinse) with 130 mM sucrose, 10 mM2-mercaptoethanol in 100 mM sodium cacodylatebuffer-NaOH, pH 7.4. They were then post-fixed with1% (w/v) osmium tetroxide in 100 mM sodium cacody-late buffer-NaOH, pH 7.4, rinsed three times (5 min perrinse) with ultrapure (Milli-Q) water and dehydratedthrough a graded series of acetone (20%, 50%, 70%,90%, 100% v/v). After infiltration through a gradedacetone/Epon/Spurr’s epoxy resin series, samples wereembedded in 100% w/v Spurr’s epoxy resin and poly-merized at 60°C for 24 h. Ultrathin sections were pre-pared using a Diatome diamond knife on an 8800Ultratome III (LKB Instruments) and stained with uranylacetate and lead citrate. The stained sections (about 20 pertreatment) were examined under a JEM-1200EX transmis-sion electron microscope (JEOL), and images wererecorded on 4489 film (Eastman-Kodak).
Additional files
Additional file 1: DataSet of gene expression of P. tricornutumfollowing N deprivation.
Additional file 2: Figure S1. Distribution of the number of reads acrossdifferent mRNA sequence size. Each box plot depicts the numbersof reads for each gene (log base 10) in an mRNA sequence size bin(0–5,000 bp, bin size of 500 bp). The line shows the range from minimumto maximum. The box and bar shows the quantiles. All mRNAs of 5,000or more nucleotides are classified as 5,000 and above. A) nitrogendeprived condition. B) normal condition.
Additional file 3: Table S1. Fold changes in the expression of somegenes encoding enzymes involved in various metabolisms following Ndeprivation.
Additional file 4: Figure S2. Expression alteration in some metabolicpathways. A) nitrogen fixation pathway; B) carbon fixation pathway; C)TCA cycle. Genes were mapped to KEGG pathways through annotationrecords in KEGG as well as homology map. Numbers in the boxesrepresent the EC number of the gene. Red indicates increase inexpression level and blue indicates decrease. The intensity of the colorbar is linearly correlated to the expression level change (log2 fold).
Additional file 5: Figure S3. Separation and identification of lipidclasses. Chromatograms showing (A) Total lipids of control cells, (B) Totallipids of N-deprived cells. Peak identifications are described in the text.
AbbreviationsRNA-seq: RNA-sequencing; MGDG: Monogalactosyldiacylglycerol;TCA: Tricarboxylic cycle; TAG: Triacylglycerol; PUFA: Polyunsaturated fattyacid; SFA: Saturated fatty acid; KEGG: Kyoto encyclopedia of genes andgenomes; LHC: Light harvesting complex; PSII: Photosystem II; ROS: Reactiveoxygen species; PEPC: Phosphoenolpyruvate carboxylase; OAA: Oxaloacetate;CCM: Carbon concentrating mechanism; GS: Glutamine synthetase;PEP: Phosphoenolpyruvate; ME: Malic enzyme; ACCase: Adetyl-CoAcarboxylase; FAS: Fatty acid synthase; FTIR: Fourier transform infraredspectrometer; FBP: Fructose-1,6-bisphosphatase; DGAT: Diacylglycerolacyltransferase; PDAT: Phospholipid:diacylglycerol acyltransferase;PC: Phosphatidylcholine; RPKM: Reads per kilobase per million mapped reads;FA: Fatty acid; DW: Dry weight.
Competing interestsThe authors declare that there are no competing interests.
Authors’ contributionsHL and YG designed the research; ZY, YN, YM, JX, MZ, WY, JL, YG and HLperformed research; YG, ZY and HL contributed analytic and computationaltools; ZY, YN, WY, JL, SL, YG and HL analyzed data; ZY, YG and HL wrote thepaper. All authors read and approved the final manuscript.
AcknowledgementsThis work was supported by the National Technologies Program(2011BAD14B03), Science and Technology Project of Guangdong(2010B030600005, 2009B020301002, 2009B050600005), and the FundamentalResearch Funds for the Central Universities. Y.G. is supported by NIH1R21NS082212-01 and EU-FP VII Systems Biology of Rare Disease.
Received: 25 September 2012 Accepted: 1 May 2013Published: 4 May 2013
References1. Falkowski PG, Barber RT, Smetacek V: Biogeochemical controls and
feedbacks on ocean primary production. Science 1998, 281:200–206.2. Lebeau T, Robert JM: Diatom cultivation and biotechnologically relevant
products. Part I: cultivation at various scales. Appl Microbiol Biotechnol2003, 60:612–623.
3. Chisti Y: Biodiesel from microalgae. Biotechnol Adv 2007, 25:294–306.4. Bowler C, Allen AE, Badger JH, Grimwood J, Jabbari K, Kuo A, Maheswari U,
Martens C, Maumus F, Otillar RP, et al: The Phaeodactylum genome revealsthe evolutionary history of diatom genomes. Nature 2008, 456:239–244.

Yang et al. Biotechnology for Biofuels 2013, 6:67 Page 14 of 14http://www.biotechnologyforbiofuels.com/content/6/1/67
5. Yu ET, Zendejas FJ, Lane PD, Gaucher S, Simmons BA, Lane TW:Triacylglycerol accumulation and profiling in the model diatomsThalassiosira pseudonana and Phaeodactylum tricornutum(Baccilariophyceae) during starvation. J Appl Phycol 2009, 21:669–681.
6. Hockin NL, Mock T, Mulholland F, Kopriva S, Malin G: The response of diatomcentral carbon metabolism to nitrogen starvation is different from that ofgreen algae and higher plants. Plant Physiol 2012, 158:299–312.
7. Valenzuela J, Mazurie A, Carlson RP, Gerlach R, Cooksey KE, Peyton BM,Fields MW: Potential role of multiple carbon fixation pathways during lipidaccumulation in Phaeodactylum tricornutum. Biotechnol Biofuels 2012, 40:5.
8. Mock T, Kroon BMA: Photosynthetic energy conversion under extremeconditions—I: important role of lipids as structural modulators andenergy sink under N-limited growth in Antarctic sea ice diatoms.Pytochemistry 2002, 61:41–51.
9. Qian K, Michael AB: Light and nitrogen deficiency effects on the growthand composition of Phaeodactylum tricornutum. Appl Biochem Biotechnol1993, 38:93–103.
10. Larson TR, Rees TAV: Changes in cell composition and lipid metabolismmediated by sodium and nitrogen availability in the marine diatomPhaeodactylum tricornutum (Bacillariophyceae). J Phycol 1996, 32:388–393.
11. James GO, Hocart CH, Hillier W, Chen H, Kordbacheh F, Price GD, DjordjevicMA: Fatty acid profiling of Chlamydomonas reinhardtii under nitrogendeprivation. Bioresour Technol 2011, 102:3343–3351.
12. Miller R, Wu G, Deshpande RR, Vieler A, Gartner K, Li X, Moellering ER,Zauner S, Cornish AJ, Liu B, et al: Changes in transcript abundance inChlamydomonas reinhardtii following nitrogen deprivation predictdiversion of metabolism. Plant Physiol 2010, 154:1737–1752.
13. De Martino A, Meichenin A, Shi J, Pan K, Bowler C: Genetic and phenotypiccharacterization of Phaeodactylum tricornutum (Bacillariophyceae)accessions. J Phycol 2007, 43:992–1009.
14. Chen W, Zhang C, Song L, Sommerfeld M, Hu Q: A high throughput Nilered method for quantitative measurement of neutral lipids inmicroalgae. J Microbiol Meth 2009, 77:41–47.
15. Siron R, Giusti G, Berland B: Changes in the fatty acid composition ofPhaeodactylum tricornutum and Dunaliella tertiolecta during growthand under phosphorus deficiency. Mar Ecol Prog Ser 1989, 55:95–100.
16. Grima EM, Medina AR, Giménez AG, González MJI: Gram-scalepurification of eicosapentaenoic acid (EPA,20,5n-3) from wetPhaeodactylum tricornutum UTEX 640 biomass. J Appl Phycol 1996,359:367.
17. Peltier G, Schmidt G: Chlororespiration: an adaptation to nitrogendeficiency in Chlamydomonas reinhardtii. Proc Natl Acad Sci U S A 1991,88:4791–4795.
18. Roberts K, Granum E, Leegood R, Raven J: Carbon acquisition by diatoms.Photosyn Res 2007, 93:79–88.
19. Tretter L, Adam-Vizi V: Alpha-ketoglutarate dehydrogenase: a target andgenerator of oxidative stress. Philos Trans R Soc Lond B Biol Sci 2005,360:2335–2345.
20. Niyogi KK: Photoprotection revisited: genetic and molecular approaches.Ann Rev Plant Physiol Plant Mol Biol 1999, 50:333–359.
21. Campbell D, Hurry V, Clarke A, Gustafsson P, Oquist G: Chlorophyllfluorescence analysis of Cyanobacterial photosynthesis and acclimation.Microbiol Mol Biol Rev 1998, 62:667–683.
22. Grossman A, Takahashi H: Macronutrient utilization by photosyntheticeukaryotes and the fabric of interactions. Ann Rev Plant Physiol Plant MolBiol 2001, 52:163–210.
23. Rivoal J, Turpin DH, Plaxton WC: In vitro phosphorylation ofphosphoenolpyruvate carboxylase from the green alga Selenastrumminutum. Plant Cell Physiol 2002, 43:785–792.
24. Reinfelder JR, Milligan AJ, Morel FMM: The role of the C4 pathway incarbon accumulation and fixation in a marine diatom. Plant Physiol 2004,135:2106–2111.
25. McGinn PJ, Morel FMM: Expression and inhibition of the carboxylatingand decarboxylating enzymes in the photosynthetic C4 pathway ofmarine diatoms. Plant Physiol 2007, 146:300–309.
26. Hopkinson B, Dupont C, Allen A, Morel F: Efficiency of the CO2-concentrating mechanism of diatoms. Proc Natl Acad Sci U S A 2011,108:3830–3837.
27. Kroth PG, Chiovitti A, Gruber A, Martin-Jezequel V, Mock T, Parker MS,Stanley MS, Kaplan A, Caron L, Weber T, et al: A Model for carbohydrate
metabolism in the diatom Phaeodactylum tricornutum deduced fromcomparative whole genome analysis. PLoS One 2008, 3:e1426.
28. Wynn J, Hamidt A, Ratledge C: The role of malic enzyme in the regulation oflipid accumulation in filamentous fungi. Microbiology 1999, 145:1911–1917.
29. Zhang Y, Adams IP, Ratledge C: Malic enzyme: the controlling activity forlipid production? Overexpression of malic enzyme in Mucorcircinelloides leads to a 2.5-fold increase in lipid accumulation.Microbiology 2007, 153:2013–2025.
30. Osteras M, Driscoll B, Finan T: Increased pyruvate orthophosphatedikinase activity results in an alternative gluconeogenic pathway inRhizobium (Sinorhizobium) meliloti. Microbiology 1997, 143:1639–1648.
31. Jiang Y, Yoshida T, Quigg A: Photosynthetic performance, lipid productionand biomass composition in response to nitrogen limitation in marinemicroalgae. Plant Physiol Biochem 2012, 54:70–77.
32. Minard K, McAlister-Henn L: Sources of NADPH in yeast vary with carbonsource. J Biol Chem 2005, 280:39890–39896.
33. Li Y, Han D, Hu G, Dauvillee D, Sommerfeld M, Ball S, Hu Q: Chlamydomonasstarchless mutant defective in ADP-glucose pyrophosphorylasehyper-accumulates triacylglycerol. Metab Eng 2010, 12:387–391.
34. Wang ZT, Ullrich N, Joo S, Waffenschmidt S, Goodenough U: Algal lipid bodies:stress induction, purification, and biochemical characterization in wild-typeand starchless Chlamydomonas reinhardtii. Eukaryot Cell 2009, 8:1856–1868.
35. Guihéneuf F, Leu S, Zarka A, Khozin-Goldberg I, Khalilov I, Boussiba S:Cloning and molecular characterization of a novel acyl-CoA:diacylglycerol acyltransferase 1-like gene (PtDGAT1) from the diatomPhaeodactylum tricornutum. FEBS J 2011, 278:3651–3666.
36. Xu J, Francis T, Mietkiewska E, Giblin E, Barton D, Zhang Y, Zhang M, TaylorD: Cloning and characterization of an acyl-CoA-dependent diacylglycerolacyltransferase 1 (DGAT1) gene from Tropaeolum majus, and a study ofthe functional motifs of the DGAT protein using site-directedmutagenesis to modify enzyme activity and oil content. Plant Biotechnol J2008, 6:799–818.
37. Stahl U: Cloning and functional characterization of a phospholipid:diacylglycerol acyltransferase from Arabidopsis. Plant Physiol 2004,135:1324–1335.
38. Kobayashi K, Awai K, Nakamura M, Nagatani A, Masuda T, Ohta H: Type-Bmonogalactosyldiacylglycerol synthases are involved in phosphatestarvation-induced lipid remodeling, and are crucial for low-phosphateadaptation. Plant J 2009, 57:322–331.
39. Ytterberg AJ, Peltier JB, van Wijk KJ: Protein profiling of plastoglobules inchloroplasts and chromoplasts: A surprising site for differentialaccumulation of metabolic enzymes. Plant Physiol 2006, 140:984–997.
40. Rey P, Gillet B, Römer S, Eymery F, Massimino J, Peltier G, Kuntz M: Over-expression of a pepper plastid lipid-associated protein in tobacco leadsto changes in plastid ultrastructure and plant development upon stress.Plant J 2000, 21:483–494.
41. Greenspan P, Mayer EP, Fowler SD: Nile red: a selective fluorescent stainfor intracellular lipid droplets. J Cell Biol 1985, 100:965–973.
42. Byrne SL, Foito A, Hedley PE, Morris JA, Stewart D, Barth S: Early responsemechanisms of perennial ryegrass (Lolium perenne) to phosphorusdeficiency. Ann Botany 2010, 107:243–254.
43. Lepage G, Roy C: Improved recovery of fatty acid through directtransesterification without prior extraction or purification. J Lipid Res1984, 25:1391–1396.
44. Li W, Wang R, Li M, Li L, Wang C, Welti R, Wang X: Differential degradationof extraplastidic and plastidic lipids during freezing and post-freezingrecovery in Arabidopsis thaliana. J Biol Chem 2008, 283:461–468.
45. Demandre C, Tremolieres A, Justin A-M, Mazliak P: Analysis of molecularspecies of plant polar lipids by high-performance and gas liquidchromatography. Phytochemistry 1985, 24:481–485.
46. Babu MM: An Introduction to Microarray Data Analysis. In ComputationalGenomics: Theory and Application. Edited by Richard P. United Kingdom:Horizon Bioscience; 2004:225–249.
doi:10.1186/1754-6834-6-67Cite this article as: Yang et al.: Molecular and cellular mechanisms ofneutral lipid accumulation in diatom following nitrogen deprivation.Biotechnology for Biofuels 2013 6:67.