research open access effect of tumor shape, size, and
TRANSCRIPT

Sefidgar et al. Journal of Biological Engineering 2014, 8:12http://www.jbioleng.org/content/8/1/12
RESEARCH Open Access
Effect of tumor shape, size, and tissue transportproperties on drug delivery to solid tumorsMostafa Sefidgar1, M Soltani1,2*, Kaamran Raahemifar3, Hossein Bazmara1, Seyed Mojtaba Mousavi Nayinian1
and Majid Bazargan1
Abstract
Background: The computational methods provide condition for investigation related to the process of drugdelivery, such as convection and diffusion of drug in extracellular matrices, drug extravasation from microvessels orto lymphatic vessels. The information of this process clarifies the mechanisms of drug delivery from the injectionsite to absorption by a solid tumor. In this study, an advanced numerical method is used to solve fluid flow andsolute transport equations simultaneously to investigate the effect of tumor shape and size on drug delivery tosolid tumor.
Methods: The advanced mathematical model used in our previous work is further developed by adding solutetransport equation to the governing equations. After applying appropriate boundary and initial conditions ontumor and surrounding tissue geometry, the element-based finite volume method is used for solving governingequations of drug delivery in solid tumor. Also, the effects of size and shape of tumor and some of tissue transportparameters such as effective pressure and hydraulic conductivity on interstitial fluid flow and drug delivery areinvestigated.
Results: Sensitivity analysis shows that drug delivery in prolate shape is significantly better than other tumorshapes. Considering size effect, increasing tumor size decreases drug concentration in interstitial fluid. This studyshows that dependency of drug concentration in interstitial fluid to osmotic and intravascular pressure is negligible.
Conclusions: This study shows that among diffusion and convection mechanisms of drug transport, diffusion isdominant in most different tumor shapes and sizes. In tumors in which the convection has considerable effect, thedrug concentration is larger than that of other tumors at the same time post injection.
Keywords: Drug concentration, Solid tumor, Tumor shape and size, Tissue transport properties
BackgroundCancer, the main cause of death in developed countries,is the second leading cause of death in developing coun-tries [1]. Solid tumors account for 85% of human can-cers [2]. Chemotherapy is one of the ways widely usedfor cancer treatment. Based on the findings from clinicalapplications, most cancer treatments with drugs fail toeliminate solid tumors completely [3]. The computationalmethod can investigate why systemic administrationcannot distribute drug uniformly in tumors. The drug
* Correspondence: [email protected] of Mechanical Engineering, K. N. T. University of Technology,Tehran, Iran2Division of Nuclear Medicine, Department of Radiology and RadiologicalScience, School of Medicine, Johns Hopkins University, Baltimore, MD, USAFull list of author information is available at the end of the article
© 2014 Sefidgar et al.; licensee BioMed CentraCommons Attribution License (http://creativecreproduction in any medium, provided the orDedication waiver (http://creativecommons.orunless otherwise stated.
exchange between microvessels and extracellular matrices,drug removal by lymphatic system, drug diffusion andconvective transport in extracellular matrices should beincluded by mathematical simulation. Computational fluiddynamics (CFD) can model the whole drug deliveryprocess and clarify the mechanisms of drug delivery fromthe injection site to absorption by a solid tumor.Baxter and Jain, based on the theoretical framework
in their 1D mathematical method, found the effectivefactors on drug delivery such as microvessel perme-ability, interstitial fluid pressure (IFP), and interstitialfluid velocity (IFV) [4-7].Improving the 1D model of Baxter et al. [5,6,8] and
Saltzman et al. [9], Wang et al. [10-12] developed asimulation framework of drug delivery to tumors by
l Ltd. This is an Open Access article distributed under the terms of the Creativeommons.org/licenses/by/4.0), which permits unrestricted use, distribution, andiginal work is properly credited. The Creative Commons Public Domaing/publicdomain/zero/1.0/) applies to the data made available in this article,
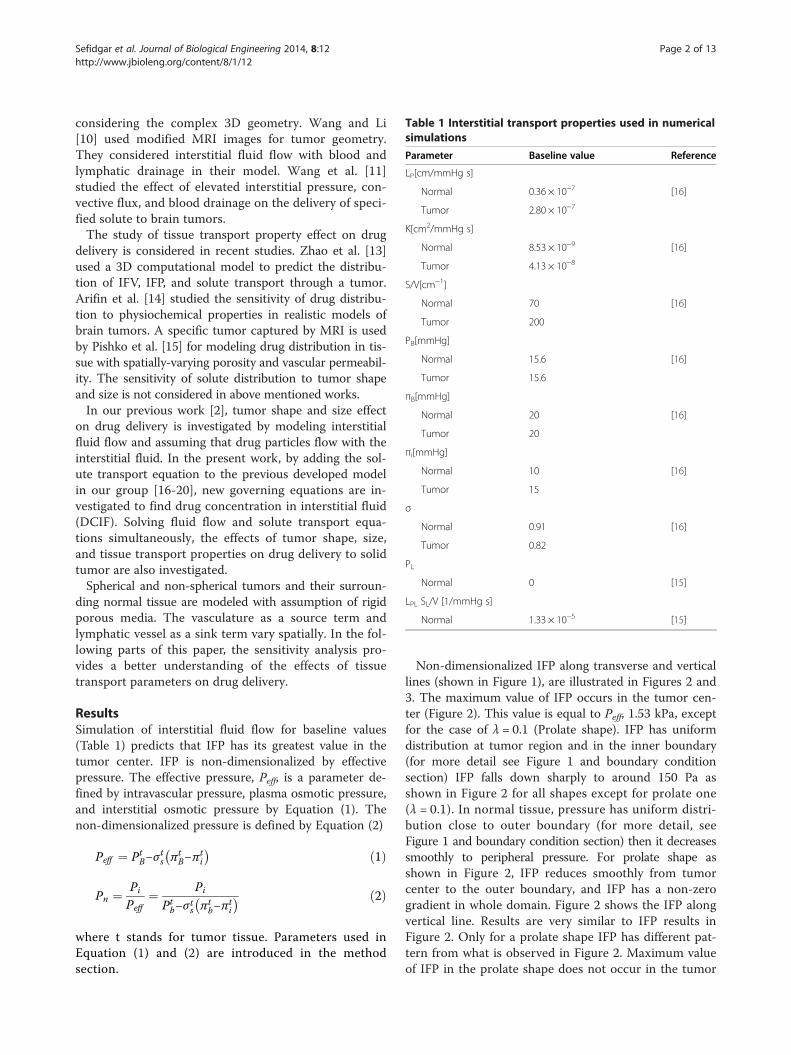
Table 1 Interstitial transport properties used in numericalsimulations
Parameter Baseline value Reference
LP[cm/mmHg s]
Normal 0.36 × 10⁻⁷ [16]
Tumor 2.80 × 10⁻⁷
K[cm2/mmHg s]
Normal 8.53 × 10⁻⁹ [16]
Tumor 4.13 × 10⁻⁸
S/V[cm−1]
Normal 70 [16]
Tumor 200
PB[mmHg]
Normal 15.6 [16]
Tumor 15.6
πB[mmHg]
Normal 20 [16]
Tumor 20
πi[mmHg]
Normal 10 [16]
Tumor 15
σ
Normal 0.91 [16]
Tumor 0.82
PL
Normal 0 [15]
LPL SL/V [1/mmHg s]
Normal 1.33 × 10⁻⁵ [15]
Sefidgar et al. Journal of Biological Engineering 2014, 8:12 Page 2 of 13http://www.jbioleng.org/content/8/1/12
considering the complex 3D geometry. Wang and Li[10] used modified MRI images for tumor geometry.They considered interstitial fluid flow with blood andlymphatic drainage in their model. Wang et al. [11]studied the effect of elevated interstitial pressure, con-vective flux, and blood drainage on the delivery of speci-fied solute to brain tumors.The study of tissue transport property effect on drug
delivery is considered in recent studies. Zhao et al. [13]used a 3D computational model to predict the distribu-tion of IFV, IFP, and solute transport through a tumor.Arifin et al. [14] studied the sensitivity of drug distribu-tion to physiochemical properties in realistic models ofbrain tumors. A specific tumor captured by MRI is usedby Pishko et al. [15] for modeling drug distribution in tis-sue with spatially-varying porosity and vascular permeabil-ity. The sensitivity of solute distribution to tumor shapeand size is not considered in above mentioned works.In our previous work [2], tumor shape and size effect
on drug delivery is investigated by modeling interstitialfluid flow and assuming that drug particles flow with theinterstitial fluid. In the present work, by adding the sol-ute transport equation to the previous developed modelin our group [16-20], new governing equations are in-vestigated to find drug concentration in interstitial fluid(DCIF). Solving fluid flow and solute transport equa-tions simultaneously, the effects of tumor shape, size,and tissue transport properties on drug delivery to solidtumor are also investigated.Spherical and non-spherical tumors and their surroun-
ding normal tissue are modeled with assumption of rigidporous media. The vasculature as a source term andlymphatic vessel as a sink term vary spatially. In the fol-lowing parts of this paper, the sensitivity analysis pro-vides a better understanding of the effects of tissuetransport parameters on drug delivery.
ResultsSimulation of interstitial fluid flow for baseline values(Table 1) predicts that IFP has its greatest value in thetumor center. IFP is non-dimensionalized by effectivepressure. The effective pressure, Peff, is a parameter de-fined by intravascular pressure, plasma osmotic pressure,and interstitial osmotic pressure by Equation (1). Thenon-dimensionalized pressure is defined by Equation (2)
Peff ¼ PtB−σ
ts πt
B−πti
� � ð1Þ
Pn ¼ Pi
Peff¼ Pi
Ptb−σ ts πt
b−πti
� � ð2Þ
where t stands for tumor tissue. Parameters used inEquation (1) and (2) are introduced in the methodsection.
Non-dimensionalized IFP along transverse and verticallines (shown in Figure 1), are illustrated in Figures 2 and3. The maximum value of IFP occurs in the tumor cen-ter (Figure 2). This value is equal to Peff, 1.53 kPa, exceptfor the case of λ = 0.1 (Prolate shape). IFP has uniformdistribution at tumor region and in the inner boundary(for more detail see Figure 1 and boundary conditionsection) IFP falls down sharply to around 150 Pa asshown in Figure 2 for all shapes except for prolate one(λ = 0.1). In normal tissue, pressure has uniform distri-bution close to outer boundary (for more detail, seeFigure 1 and boundary condition section) then it decreasessmoothly to peripheral pressure. For prolate shape asshown in Figure 2, IFP reduces smoothly from tumorcenter to the outer boundary, and IFP has a non-zerogradient in whole domain. Figure 2 shows the IFP alongvertical line. Results are very similar to IFP results inFigure 2. Only for a prolate shape IFP has different pat-tern from what is observed in Figure 2. Maximum valueof IFP in the prolate shape does not occur in the tumor

Figure 1 Schematic of considered geometry and boundaryconditions. The transverse and vertical lines are used to showresults along them.
Figure 3 Interstitial fluid pressure profile along vertical line.The 1 in “x” axis shows the boundary of tumor (inner boundary).
Sefidgar et al. Journal of Biological Engineering 2014, 8:12 Page 3 of 13http://www.jbioleng.org/content/8/1/12
center and takes place somewhere between the tumorcenter and tumor periphery.IFV distribution along the vertical and transverse lines
is presented in Figures 4 and 5. Maximum value of IFVoccurs close to the inner boundary. Also, in normal tis-sue, IFV reaches zero far from the inner boundary. How-ever, for the prolate shape, velocity is not zero, especiallyalong transvers line (Figure 4).DCIF is simulated in two cases of injection. In the first
case, the continuous injection which leads to constantplasma concentration (Cp = constant) is considered andin the second case, the bolus injection in which theplasma concentration decreases with time exponentially(Cp ¼ C0
pe− ln 0:5ð Þt=τ ) is studied, in which τ is the drug
half-life in plasma (Table 2). DCIF are non-dimensionalizedby CP for continuous injection and C0
P for bolus injection,
Figure 2 Interstitial fluid pressure profile along transverse line.The 1 in “x” axis shows the boundary of tumor (inner boundary).
respectively. Average of non-dimensionalized DCIF fortwo injection cases in different times is shown in Figures 6and 7. DCIF of prolate shape (λ = 0.1) has the maximumvalue and DCIF of oblate shape (λ = 10) has the minimumvalue. Other considered shapes show the similar transientbehavior.Non-dimensionalized DCIF along two lines (transverse
and vertical) is illustrated in Figures 8 and 9. The bolusinjection results are presented in 8 hr post injection inwhich the concentration is maximum based on Figure 7and for continuous injection is presented at final time ofsimulation, in 72 hr post injection. The profiles of twotypes of injections are similar in spite of different values ofDCIF. As observed in IFV and IFP profiles, the prolate
Figure 4 Interstitial fluid velocity profile along transverse line.The 1 in “x” axis shows the boundary of tumor (inner boundary).

Figure 6 Average non-dimensionalized DCIF in tumor region induring time for continuous injection.
Figure 5 Interstitial fluid velocity profile along vertical line. The1 in “x” axis shows the boundary of tumor (inner boundary).
Sefidgar et al. Journal of Biological Engineering 2014, 8:12 Page 4 of 13http://www.jbioleng.org/content/8/1/12
shape is different from the other shapes in DCIF distribu-tion. A bump is observed in DCIF curves at the innerboundary of all tumor shapes. The normal tissue has uni-form distribution of DCIF except near the boundaries(inner and outer). DCIF distribution in normal tissue isthe same for all tumor shapes.2D contours of DCIF in tumor region for bolus injection
in 8 hr post injection are shown in Figure 10 for all tumorshapes. Results show that DCIF for tumors with λ = 0.1 andλ = 10 has different distributions. Generally, in the innerboundary, DCIF has its maximum value. In Figures 11 and12, Peclet number distribution along two lines for con-tinuous injection is shown. Peclet number demonstratesthe ratio of convection to diffusion across the microvessel
Table 2 Parameters of solute transport model used innumerical simulations
Parameter Baseline value Reference
σf
Normal 0.9 [8]
Tumor 0.9
Deff [m2/s]
Normal 0.16× 10⁻¹² [8]
Tumor 2.0× 10⁻¹²
P[m/s]
Normal 2.2× 10-10* [8]
Tumor 17.3× 10⁻¹⁰*
τ [hr]**
Plasma 6.1 [8]
*- the microvessel permeability coefficient is 10% of effective permeabilityintroduced in [8].**- the drug half-life in plasma introduced in results section.
wall. Results show that in the tumor region Pecletnumber is zero except for prolate shape. Peclet numberfor the prolate shape especially along short radius(transverse line) is greater than zero.Some of tissue transport parameters mentioned (ef-
fective pressure, hydraulic conductivity, and tumor size)in Table 1 are investigated for sensitivity analysis. Thevalues of these parameters are selected near the rangesreported in the literature [2,15,21].Figure 13 shows the influence of changing effective
pressure, Peff, on numerical results of tumor shapes withthe same volume. Maximum value of IFP in tumor region(Figure 13a) linearly increases when Peff increases. Only in
Figure 7 Average non-dimensionalized DCIF in tumor region induring time for bolus injection.

Figure 8 Non-dimensionalized DCIF profile along transverse line for normal. Left for bolus injection and right for continuous injection. The1 in “x” axis shows the boundary of tumor (inner boundary).
Sefidgar et al. Journal of Biological Engineering 2014, 8:12 Page 5 of 13http://www.jbioleng.org/content/8/1/12
the prolate shape the pressure increases more than othertumor shapes. Average of IFV on inner boundary alsohas the same pattern and linearly changes with Peff(Figure 13b). The changes in average of DCIF in tumorregion for two cases of injection are shown in Figure 13cand d. For these two cases of injection, the prolate shapeis more sensitive to Peff changes than other tumor shapesand DCIF changes around 20% when the Peff changes from500 Pa to 2500 Pa. The other shapes do not show signifi-cant variations in DCIF for these ranges of Peff.Different tumor sizes are studied with changes in their
volume. One of important metric of disease developmentand response to tumor therapy with drug is volume oftumors [22-25]. To quantify response to therapeutic reg-imens and also assess disease progression, tumor volume isused as a metric in many studies, such as Char et al. [26],Jensen et al. [27] and Gass et al. [28].As shown in Figure 14a, IFP has less value than Peff
when the tumor volume is smaller than 1 cm3. When thetumor volume is in the order of 1 cm3, IFP reaches Peff
Figure 9 Non-dimensionalized DCIF profile along vertical line. Left forshows the boundary of tumor (inner boundary).
and by increasing the tumor radius, IFP remains constant.Average of IFV on the inner boundary generally decreaseswith increasing tumor size, Figure 14b. Only in prolateshape in small radii, IFV increases with the tumor size. Asshown in Figure 14c and d, the mean values of DCIF havethe greatest value in the smallest tumor. Also, the prolateshape has the highest value of DCIF in all studied tumors.Figure 15 shows the sensitivity of IFF parameters and
DCIF to hydraulic conductivity changes. Results showthat in all tumor shapes, if hydraulic conductivity in-creases, the maximum value of IFP remains constantand then decreases sharply. Average of IFV increases byincreasing hydraulic conductivity. DCIF increases by in-creasing hydraulic conductivity and then reaches a con-stant value in spite of increasing hydraulic conductivity.
DiscussionThis study presents DCIF, IFP, and IFV in solid tumorssurrounded by normal tissue in two types of injection;bolus and continuous one. The model used in this study
bolus injection and right for continuous injection. The 1 in “x” axis

Figure 10 2D contour of DCIF in tumor region for bolus injection in 8 hr post injection for all tumor shapes.
Sefidgar et al. Journal of Biological Engineering 2014, 8:12 Page 6 of 13http://www.jbioleng.org/content/8/1/12
investigates the effect of two characteristics of tumorson concentration distribution; tumor shape and size.Results of high IFP in tumors are discussed in our previ-
ous studies [2,16,17] and in the experimental results of Ari-fin et al. [29] and Huber et al. [30]. Maximum value of IFPin spherical tumors (1 cm radius) for baseline values inTable 1 is 1529.5 Pa which is close to the studies of Jain et al.[31], Chauhan et al. [32], and Arfin et al. [33]. The currentresults are verified by experimental data of IFP measuredby Nielsen et al. [34]. In their work, the wick-in-needletechnique is used to measure IFP in two types of tumorswith the same volume as tumors in the current study. Theyfound IFP in the range of 1400 Pa to 1600 Pa.IFV on tumor boundary in spherical tumors with base-
line values is around 0.05 μm/s which is at the same order
Figure 11 Peclet number (ratio of convection to diffusionacross the microvessel wall) along transverse line.
of the prediction of Jain et al. [31] and experimental obser-vation of Hompland et al. [35]. Also, the profile of drugconcentration for simulation with baseline values forspherical tumor in different times (Figures 6 and 7) agreeswell with Baxter and Jain’s predictions [8]. Results showthat DCIF for prolate shape (λ = 0.1) always has the great-est value. Results of transient DCIF (Figures 6 and 7) showthat drug delivery is much easier in the prolate tumors.Also, the oblate shape (λ = 10) has the most resistance todrug delivery. Following of this section, the reason of thesephenomena is investigated.The uniform values of IFP for all tumor shapes except
prolate one (Figures 2 and 3) is equal to Peff. Non-uniformIFP in prolate shape results in the maximum value of
Figure 12 Peclet number (ratio of convection to diffusionacross the microvessel wall) along vertical line.

Figure 13 The effect of different values of effective pressure on IFP, IFV and DCIF. a) The variation of maximum IFP in tumor region.b) The variation of averaged IFV at tumor boundary. c) Average of DCIF in tumor region for continuous injection. d) Average of DCIF in tumorregion for bolus injection.
Sefidgar et al. Journal of Biological Engineering 2014, 8:12 Page 7 of 13http://www.jbioleng.org/content/8/1/12
DCIF among other tumor shapes with the same volume.Equation (17) is able to legitimize this behavior of tumorshapes. The source term (the last term in the right handside of Equation (17)) includes diffusion and convectionterms. The convection term depends on the differencesbetween IFP and Peff based on starling’s law. This pressuredifference is close to zero (Figures 2 and 3) for all tumorshapes except for the prolate one and therefore the con-vection term only for prolate shape has non-zero value.Because of the non-zero values of Peclet number for pro-late shape in tumor region (Figures 11 and 12), the con-centration for this shape is affected not only by diffusionrate from vessels but also by convection rate from vessels.The convection rate leads to higher level of DCIF in prolateshape than that of other tumor shapes (Figures 6, 7, 8, 9and 10). The non-zero values of Peclet number for prolateshape are seen in an image based work of Zhao et al. as well[13]. In normal tissue, Peclet number shows that drug de-livery from microvessel to tissue is done by both mecha-nisms of transfer, convection and diffusion.The other effect of uniform pressure is zero pressure
gradients in all tumor shapes except for prolate one. Be-cause of zero IFP gradient and based on Darcy’s equation,IFV is close to zero in tumor tissue except for prolate
shape. The close to zero value of IFV is predicted in a fewnumerical studies such as Welter and Rieger [36]; Roy andRiahi [37]; and experimental results of Hompland et al.[35]. Zero IFV results in a negligible convection transport(the second term of the right hand side of Equation (17))and consequently the convection transport does not affectdrug distribution; and the diffusion transport (the firstterm of the right hand side of Equation (17)) is the onlyreason of drug transport in all tumor shapes except forprolate one. Therefore, non-zero IFV in prolate shape, alsoseen in Zhao et al. [13], is another reason of higher DCIFvalues in this tumor shape with respect to other shapes.The sharp pressure gradient (Figures 2 and 3) and
highest value of IFV (Figures 4 and 5) in the innerboundary for all tumor shapes increases drug transportand make a bump at this boundary for DCIF.The sensitivity analysis of effective pressure shows that
the effective pressure does not have too much effect onDCIF. In all tumor shapes, DCIF for a wide range of ef-fective pressure changes smoothly; however, in prolateshape, this change is sharper and increases by effectivepressure (Figure 13c and d). As mentioned, in the tumorregion for all tumor shapes except for prolate one the con-vection rate, which depends on Peff, has a negligible role

Figure 14 The effect of different values of tumor size on IFP, IFV and DCIF. a) The variation of maximum IFP in tumor region. b) Thevariation of averaged IFV at tumor boundary. c) Average of DCIF in tumor region for continuous injection. d) Average of DCIF in tumor region forbolus injection.
Sefidgar et al. Journal of Biological Engineering 2014, 8:12 Page 8 of 13http://www.jbioleng.org/content/8/1/12
on drug distribution; therefore, Peff cannot have significanteffect on drug concentration. However, in prolate shape,increasing Peff increases pressure difference between IFPand Peff and consequently the convection rate from vesselsin the tumor region; therefore, DCIF in prolate shape issensitive to Peff changes.The tumor volume shows more effects on IFP, IFV, and
DCIF than other investigated parameters such as effectivepressure and hydraulic conductivity. The increasing tumorvolume increases significantly IFP (Figure 14a). The de-pendency of IFP to tumor volume is observed in experi-mental study of Gutmann et al. [38], Hompland et al. [39],and Leguerney et al. [40], as well. When the tumor vol-ume is in the order of 1 cm3, the sensitivity of IFP totumor size decreases. The independency of IFP to tumorvolume in in large tumors is observed in the study ofLeguerney et al. [40], as well. In their work, IFP changesvery slowly with tumor volume. Since the high IFP is in-troduced as the main barrier of drug delivery to tumors,IFP increasing with tumor volume leads to DCIF decreasein these tumors. This reduction of DCIF with tumor sizeis observed in Au et al. [41], as well. Since IFP reachesaround the effective pressure with increasing tumor vol-ume, the convection rate is vanished and the diffusion rate
reaches a constant value, and consequently the sensitivityof DCIF to tumor size reduces. Lower IFP in the smalltumor sizes leads to increase the convection rate of sourceterm in Equation (17). Therefore, it is expected to have abetter drug distribution in small tumors.Results show that IFV, IFP, and DCIF are sensitive to
tissue hydraulic conductivity changes. The hydraulicconductivity is appeared only in Darcy’s law. This par-ameter has a direct effect on IFF and indirect effect onDCIF. Theoretical analysis shows that the Pi
Peffin tumor
region is proportional to 1− 1ffiffiκ
p = sinh 1ffiffiκ
p� �
[8] (κ is hy-
draulic conductivity, see material section). In low values
of κ, the 1ffiffiκ
p = sinh 1ffiffiκ
p� �
is negligible and Pi is close to Peff
(Figure 15a). Increasing κ, increases the 1ffiffiκ
p = sinh 1ffiffiκ
p� �
and leads to sharp decrease in IFP. This dependency isalso observed by McCarty and Johnson [42]. For highvalues of κ, IFP is very low and negligible in comparisonto Peff. IFP reduction from effective pressure increasesIFV around 5 times (Figure 15b). The hydraulic conduct-ivity affects DCIF by convection rate from vessels (asmentioned this value depends on difference between IFPand Peff ). In low values of κ, since IFP is equal to Peff, the

Figure 15 The effect of different values of hydraulic conductivity on IFP, IFV and DCIF. a) The variation of maximum IFP in tumor region.b) The variation of averaged IFV at tumor boundary. c) Average of DCIF in tumor region for continuous injection. d) Average of DCIF in tumorregion for bolus injection.
Sefidgar et al. Journal of Biological Engineering 2014, 8:12 Page 9 of 13http://www.jbioleng.org/content/8/1/12
effect of convection rate is not significant and DCIF re-mains constant. Increasing κ increases the conventionrate and consequently DCIF.When hydraulic conductivity increases two to three or-
ders of magnitude, the mean values of DCIF are two timesgreater than the average of DCIF for baseline values inTable 1. However, after a specific value of hydraulic con-ductivity, DCIF changes smoothly and reaches a constantvalue because IFP is very low and convection rate only de-pends on Peff.
ConclusionsA numerical approach which couples the mathematicalmodel of the lymphatic system and the interstitial flowwith the mathematical model of solute transport demon-strates that DCIF is affected by two transport mecha-nisms, convection and diffusion.Drug convection and drug transport from microvessel
to tumor are blocked by high interstitial pressure (IFP)which is uniformly distributed in most part of thetumor. The large pressure gradient results in an out-ward convective flow that washes out the drug extrava-sated from microvessels at the tumor periphery. This
study shows that when there is IFP gradient in thetumor region instead of uniform IFP distribution whichoccurs in some tumor shapes, DCIF is greater than thatof the uniform one.As the effects of osmotic and intravascular pressure
on convection rate are negligible in most of tumorshapes, the dependency of DCIF to these parameters isvery low.The hydraulic conductivity which is another considered
parameter in sensitivity analysis has significant effect ondrug distribution since it increases the convection ratefrom vessels.
MethodMathematical model of interstitial fluid transportThis section introduces the mathematical model ofinterstitial fluid transport in macroscopic scale [2,16].Since normal and tumor tissue have characteristics thesame as porous media, fluid flow behavior is defined bycoupling the fluid flow governing equations. The massbalance or continuity equation for steady state incom-pressible fluid in the porous media with source andsink of mass is [16]:

Sefidgar et al. Journal of Biological Engineering 2014, 8:12 Page 10 of 13http://www.jbioleng.org/content/8/1/12
∇:vi ¼ ϕB−ϕL ð3Þwherevi: The interstitial fluid velocity,ϕB: The source term, extravasation from microvessels,
andϕL: The drainage term, elimination by lymphatic system.In biological tissues, the fluid source is evaluated through
Starling's law as follows [16]:
ϕB ¼ LPSV
PB−Pi−σ s πb−πið Þð Þ ð4Þ
wherePi : Interstitial fluid pressure,PB : Blood pressure in microvessel,SV : The surface area per unit volume of tissue for
transport in the interstitium,πB: Microvessel oncotic pressure,πi : Interstitial oncotic pressure,Lp : The hydraulic conductivity of the microvessel wall,
andσs: Osmotic reflection coefficient.and the lymphatic system is related to the pressure dif-
ference between the interstitium and the lymphatic ves-sels and is considered only for normal tissues [43]:
ϕL rð Þ ¼LPLSLV
Pi−PLð Þ Normal tissue
0 Tumor tissue
(ð5Þ
whereϕL: The volumetric flow rate into the lymphatic,LPLSLV : The lymphatic filtration coefficient, and
PL: The hydrostatic pressure of the lymphatic.The momentum balance equation in its general form
can be written as Equation (6) [44]:
ρ∂vi∂t
þ vi:∇ð Þvi� �
¼ ∇⋅ −Pi þ μ ∇vi þ ∇við ÞT� �
−2μ3
∇⋅við Þ
−μ
K
� �vi þ F
ð6ÞwhereK: The permeability of the porous medium,ρ : The density,μ: The viscosity, andF: The volume forces.Since interstitial fluid is a Newtonian fluid and has low
velocity through the tissues, Equation (6) in the steadystate condition is simplified to Darcy’s law [16]:
∇Pi ¼ −μ
K
� �vi ð7Þ
The K/μ is defined as hydraulic conductivity of the in-terstitium, κ:
vi ¼ −κ∇Pi ð8Þ
Combination of momentum equation (Equation (8))and the continuity equation (Equation (3)) results in
−∇⋅ κ∇Pið Þ ¼ ϕB−ϕL ð9Þ
When κ is constant, the interstitial pressure can beexpressed by
−κ∇2Pi ¼ ϕB−ϕL ð10Þ
By substituting Equations (4) and (5) into Equation (10):
−κ∇2p ¼LPSV
PB−Pi−σ s πb−πið Þð Þ− LPLSLV
Pi−PLð Þ Normal tissue
LPSV
PB−Pi−σ s πb−πið Þð Þ Tumor tissue
8><>:
ð11Þ
Macroscopic solute transportMolecular transport in tumors is based on the conserva-tion laws for mass and momentum. The interstitial trans-port of drug is governed by the convection diffusionequation; therefore, the general equation for the mass bal-ance of solutes can be written as:
∂C∂t
¼ ∇⋅ Deff ⋅∇C� �
−∇⋅ viCð Þ þ ΦB−ΦLð Þ ð12Þ
whereC : The solute concentration based on tissue volume,ΦB : The rate of solute transport per unit volume from
microvessel into the interstitial space,ΦL : The rate of solute transport per unit volume from
the interstitial space into lymphatic vessels, andDeff : The effective diffusion tensor.For an isotropic and uniform diffusion in tissues, equation
(12) can be written as:
∂C∂t
¼ Deff∇2C−∇⋅ vf C� �þ ΦB−ΦLð Þ ð13Þ
The solute transport rate across the lymphatic vesselscan be considered as [15]
ΦL ¼ ϕLC NormalTissue0 TumorTissue
�ð14Þ
The solute transport rate across the microvessel canbe represented by Patlak equation [45]:
ΦB ¼ ϕB 1−σ f� �
CP þ PSV
CP−Cð Þ PeePe−1
ð15Þ
where

Figure 16 Different shapes of solid tumors considered in this study. The five ellipsoid shapes changed from oblate to prolate are studied.
Sefidgar et al. Journal of Biological Engineering 2014, 8:12 Page 11 of 13http://www.jbioleng.org/content/8/1/12
Pe ¼ ϕB 1−σ f� �
V
PSð16Þ
ϕB: The fluid flow rate per unit volume of tissueacross the microvessel wall,σf : The filtration reflection coefficient,P : The microvessel permeability coefficient,S/V : The microvessel surface area per unit volume of
tissue,Cp : Solute concentration in the plasma.By substituting Equations (15) and (14) in to
Equation (13):
Figure 17 Algorithm of numerical simulation used forcalculating interstitial fluid flow parameter (IFV, IFP) and solutetransport parameter (DCIF).
∂C∂t
¼ Deff∇2C−∇⋅ vifCð Þ
þ ϕB 1−σ f� �
CP þ PSV
CP−C
KAV
0@
1A Pe
ePe−1−ϕLC
0@
1A Normal region
∂C∂t
¼ Deff∇2C−∇⋅ vifCð Þ
þ ϕB 1−σ f� �
CP þ PSV
CP−C
KAV
0@
1A Pe
ePe−1
0@
1A Tumor region
8>>>>>>>>>>>>>>>><>>>>>>>>>>>>>>>>:
ð17ÞBoundary conditionsA tumor surrounded by normal tissue is considered in thisstudy. The tumor shape is considered ellipsoid. A 2D sec-tion of the geometry and boundaries are shown in Figure 1.The three boundaries are indicated for geometry: a) thecenter of tumor, b) the boundary between tumor and nor-mal tissue, named inner boundary, c) the boundary at theouter edge of geometry, named outer boundary. Theappropriate boundary conditions are implemented forEquations (11) and (17). The no flux boundary conditionis applied at the center of the tumor; i.e. [16],
∇Pi ¼ 0 for r ¼ 0 ð18Þ
Deff∇C þ viC ¼ 0 for r ¼ 0 ð19ÞThe continuity of pressure and velocity for Equation
(11) and concentration and its flux for Equation (17) areconsidered as appropriate boundary conditions for innerboundary:
−κt∇PijΩ− ¼ −κn∇PijΩþ
PijΩ− ¼ PijΩþð20Þ

Sefidgar et al. Journal of Biological Engineering 2014, 8:12 Page 12 of 13http://www.jbioleng.org/content/8/1/12
Dteff∇C þ viC
� �jΩ− ¼ Dn
eff∇C þ viC� �
jΩ−
CjΩ− ¼ CjΩþð21Þ
where Ω− and Ω+ indicate the tumor and normal tissueat the inner boundary.For outer boundary, that the interstitial pressure is
constant; the Dirichlet type of boundary condition mustbe applied [16]:
Pi ¼ for outer region ð22ÞAnd for concentration, the open boundary condition is
used in the outer region [46]. The Open Boundary isused to set up mass transport across boundaries whereboth convective inflow and outflow can occur and de-fined by Equation (23):
−n⋅∇C ¼ 0 ð23Þwhere n is the normal vector.
GeometryTo investigate the effect of tumor shape on drug deliv-ery, 5 different shapes are considered. The 3D funda-mental shape of tumors is assumed to be an ellipsoid indifferent studies. The assumption of considering ellips-oid tumor shape is investigated in many research suchas breast cancer [47], prostate cancer [48,49] cervicalcancer [50], glioma cancer [51], and others [52]. Basedon this mentioned reason, ellipsoidal shapes of tumorsare considered in this study. Different shapes are pro-duced by changing ratio of two radii of ellipsoid shownin Figure 1. This ratio (λ = b/a) is changed from 0.1(prolate) to 10 (oblate). In all shapes shown in Figure 16the volume of the tumor is remained constant and equalto the volume of spherical tumor with radius R. Thebaseline value of R is 1 cm. The values of R used in sen-sitivity analysis are changed from 0.1 cm to 2.5 cm. Thisrange is obtained from the literature and is close to theexperimental observations [40].
Model parameterizationThe interstitial transport properties for normal andtumor tissue are listed in Table 1. These values are usedas baseline and some of them are investigated and chan-ged in specified ranges for sensitivity analysis.The parameters of solute transport model taken from
Baxter and Jain [8] are listed in Table 2. Although, the nu-merical model is applicable for any type of solute, inpresent study the properties of Fragment antigen-binding(F(ab’)2) as a sample is used.
Numerical solutionA systematic flow chart is illustrated in Figure 17 to clar-ify the computational techniques involved in this paper.
The criterion for the convergence of iterative solutionbased on element–based finite volume (EB-FV) methodis to reduce the residual by 6 orders of magnitudes. Thedetails of numerical method is mentioned in our previ-ous works [2,16,53].
AbbreviationsCFD: Computational fluid dynamics; IFP: Interstitial fluid pressure;IFV: Interstitial fluid velocity; DCIF: Drug concentration in interstitial fluid;EB-FV: Element based- finite volume.
Competing interestsThe authors declare that they have no competing interests.
Authors' contributionsMS and MS carried out the numerical simulations and drafted themanuscript. HB participated in the numerical simulations. MM and MB andKR helped to draft the manuscript and discussed the results. MS and MSconducted the numerical simulation, discussed the results and reviewed themanuscript. All authors read and approved the final manuscript.
Author details1Department of Mechanical Engineering, K. N. T. University of Technology,Tehran, Iran. 2Division of Nuclear Medicine, Department of Radiology andRadiological Science, School of Medicine, Johns Hopkins University,Baltimore, MD, USA. 3Electrical & Computer Department of RyersonUniversity, Toronto, Ontario.
Received: 24 February 2014 Accepted: 30 May 2014Published: 12 June 2014
References1. Siegel R, Naishadham D, Jemal A: Cancer statistics. A Cancer J Clin 2013,
63:11–30.2. Soltani M, Chen P: Effect of tumor shape and size on drug delivery to
solid tumors. J Biol Eng 2012, 6:4.3. Blakeslee S: Impenetrable tumors found to block even the newest cancer
agents. In [http://www.nytimes.com/1989/06/27/science/impenetrable-tumors-found-to-block-even-the-newest-cancer-agents.html]
4. Baxter LT, Jain RK: Transport of fluid and macromolecules in tumors IV:A microscopic model of the perivascular distribution. Microvasc Res 1991,41:252–272.
5. Baxter LT, Jain RK: Transport of fluid and macromolecules in tumors (II):role of heterogeneous perfusion and lymphatics. Microvasc Res 1990,40:246–263.
6. Baxter LT, Jain RK: Transport of fluid and macromolecules in tumors (iii):role of binding and metabolism. Microvasc Res 1991, 41:5–23.
7. Jain RK, Baxter LT: Mechanisms of heterogeneous distribution ofmonoclonal antibodies and other macromolecules in tumors: significanceof elevated interstitial pressure. Cancer Res 1988, 48:7022–7032.
8. Baxter LT, Jain RK: Transport of fluid and macromolecules in tumors (I): roleof interstitial pressure and convection. Microvasc Res 1989, 37:77–104.
9. Saltzman WM, Radomsky ML: Drugs released from polymers: diffusion andelimination in brain tissue. Chem Engng Sci 1991, 46:2429–2444.
10. Wang CH, Li J: Three-dimensional simulation of IgG delivery to tumors.Chem Eng Sci 1998, 53:3579–3600.
11. Wang CC, Li J, Teo CS, Lee T: The delivery of BCNU to brain tumors.J Control Release 1999, 61:21–41.
12. Tan WHK, Wang F, Lee T, Wang C-H: Computer simulation of the delivery ofetanidazole to brain tumor from PLGA wafers: comparison between linearand double burst release systems. Biotechnol Bioeng 2003, 82:278–288.
13. Zhao J, Salmon H, Sarntinoranont M: Effect of heterogeneous vasculature oninterstitial transport within a solid tumor. Microvasc Res 2007, 73:224–236.
14. Arifin DY, Lee KYT, Wang C-H: Chemotherapeutic drug transport to braintumor. J Control Release 2009, 137:203–210.
15. Pishko GL, Astary GW, Mareci TH, Sarntinoranont M: Sensitivity analysis ofan image-based solid tumor computational model with heterogeneousvasculature and porosity. Ann Biomed Eng 2011, 39:2360–2373.
16. Soltani M, Chen P: Numerical modeling of fluid flow in solid tumors. PLoSOne 2011, 6:1–15.

Sefidgar et al. Journal of Biological Engineering 2014, 8:12 Page 13 of 13http://www.jbioleng.org/content/8/1/12
17. Soltani M, Chen P: Numerical modeling of interstitial fluid flow coupledwith blood flow through a remodeled solid tumor microvascularnetwork. PLoS One 2013, 8:e67025.
18. Soltani M: Numerical modeling of drug delivery to solid tumormicrovasculature. Waterloo, Ontario, Canada: PhD thesis, Chem. Eng.(Nanotechnology); 2012.
19. Sefidgar M, Soltani M, Bazmara H, Mousavi M, Bazargan M, Elkamel A:Interstitial flow in cancerous tissue: effect of considering remodeledcapillary network. J Tissue Sci Eng 2014, 4:1–8.
20. Sefidgar M, Raahemifar K, Bazmara H, Bazargan M, Mousavi SM, Soltani M:Effect of remodeled tumor-induced capillary network on interstitial flowin cancerous tissue. In 2nd Middle East Conf:17-20 February 201;Doha, Qatar.Biomed. Eng. IEEE; 2014:212–215.
21. Netti PA, Berk DA, Swartz MA, Grodzinsky AJ, Jain RK: Role of extracellularmatrix assembly in interstitial transport in solid tumors. Cancer Res 2000,60:2497–2503.
22. Mayr NA, Yuh WTC, Zheng J, Ehrhardt JC, Sorosky JI, Magnotta VA, PelsangRE, Hussey DH: Tumor size evaluated by pelvic examination comparedwith 3-D MR quantitative analysis in the prediction of outcome forcervical cancer. Int J Radiat Oncol Biol Phys 1997, 39:395–404.
23. Kim HJ, Kim W: Method of tumor volume evaluation using magneticresonance imaging for outcome prediction in cervical cancer treatedwith concurrent chemotherapy and radiotherapy. Radiat Oncol J 2012,30:70–77.
24. Ayers GD, Mckinley ET, Zhao P, Fritz JM, Metry RE, Deal BC, Adlerz KM,Coffey RJ, Manning HC: Volume of preclinical xenograft tumors is moreaccurately assessed by ultrasound imaging than manual calipermeasurements. J Ultrasound Med 2010, 29:891–901.
25. Narayan K, Fisher R, Bernshaw D: Significance of tumor volume andcorpus uteri invasion in cervical cancer patients treated by radiotherapy.Int J Gynecol Cancer 2006, 16:623–630.
26. Char D, Kroll S, Phillips T: Uveal melanoma: growth rate and prognosis.Arch Ophthalmol 1997, 115:1014–1018.
27. Jensen PK, Hansen MK: Ultrasonographic, three-dimensional scanning fordetermination of intraocular tumor volume. Acta Ophthalmol 1991,69:178–186.
28. Gass J, Donald M: Comparison of uveal melanoma growth rates withmitotic index and mortality. Arch Ophthalmol 1985, 103:924–931.
29. Arifin DY, Lee LY, Wang C-H: Mathematical modeling and simulation ofdrug release from microspheres: implications to drug delivery systems.Adv Drug Deliv Rev 2006, 58:1274–1325.
30. Huber PE, Bischof M, Heiland S, Peschke P, Saffrich R, Gro H, Lipson KE,Abdollahi A: Trimodal cancer treatment: beneficial effects of combinedantiangiogenesis, radiation, and chemotherapy. Cancer Res 2005,65:3643–3655.
31. Jain RK, Tong RT, Munn LL: Effect of vascular normalization byantiangiogenic therapy on interstitial hypertension, peritumor edema,and lymphatic metastasis: insights from a mathematical model. CancerRes 2007, 67:2729–2735.
32. Chauhan VP, Stylianopoulos T, Martin JD, Chen O, Kamoun WS, BawendiMG, Fukumura D, Jain RK: Normalization of tumour blood vesselsimproves the delivery of nanomedicines in a size-dependent manner.Nat Nanotechnol 2012, 7:383–388.
33. Arifin DY, Wang C, Smith KA: Patient-specific chemotherapeutic drugdelivery to brain tumors. Mimics Innov Award 2007, 1:1–9.
34. Nielsen T, Murata R, Maxwell RJ, Stødkilde-Jørgensen H, Ostergaard L,Ley CD, Kristjansen PEG, Horsman MR: Non-invasive imaging ofcombretastatin activity in two tumor models: association with invasiveestimates. Acta Oncol 2010, 49:906–913.
35. Hompland T, Ellingsen C, Øvrebø KM, Rofstad EK: Interstitial fluid pressureand associated lymph node metastasis revealed in tumors by dynamiccontrast-enhanced MRI interstitial fluid pressure and associated lymphnode. Cancer Res 2012, 72:4899–4908.
36. Welter M, Rieger H: Interstitial fluid flow and drug delivery in vascularizedtumors: a computational model. PLoS One 2013, 8:e70395.
37. Roy R, Riahi DN: Modeling blood flow in a brain tumor treatedconcurrently with radiotherapy and chemotherapy. Appl Math Phys 2013,1:67–77.
38. Gutmann R, Leunig M, Feyh J, Goetz AE, Messmer K, Kastenbauer E, Jain RK:Advances in brief interstitial hypertension in head and neck tumors inpatients: correlation with tumor size. Cancer Res 1992, 52:1993–1995.
39. Hompland T, Ellingsen C, Rofstad EK: Preclinical evaluation of Gd-DTPAand gadomelitol as contrast agents in DCE-MRI of cervical carcinomainterstitial fluid pressure. BMC Cancer 2012, 12:2–10.
40. Leguerney I, Lassau N, Koscielny S, Rodrigues M, Massard C, Rouffiac V,Benatsou B, Thalmensi J, Bawa O, Opolon P, Peronneau P, Roche A:Combining functional imaging and interstitial pressure measurements toevaluate two anti-angiogenic treatments. Invest New Drugs 2012, 30:144–156.
41. Au JL, Jang SH, Zheng J, Chen CT, Song S, Hu L, Wientjes MG:Determinants of drug delivery and transport to solid tumors. J ControlRelease 2001, 74:31–46.
42. Mccarty WJ, Johnson M: The hydraulic conductivity of Matrigel.Biorheology 2007, 44:303–317.
43. Wu M, Frieboes HB, McDougall SR, Chaplain MAJ, Cristini V, Lowengrub J:The effect of interstitial pressure on tumor growth: coupling with theblood and lymphatic vascular systems. J Theor Biol 2013, 320:131–151.
44. Vafai K: Porous Media, Application in Biological systems and biotechnology.Boca Raton: CRC Press; 2011.
45. Curry F: Mechanics and thermodynamics of transcapillary exchange,Handbook of Physiology, Section 2: The Cardiovascular System. Bethesda:Amer Physiol Soc; 1984.
46. Orlanski I: A simple boundary condition for unbounded hyperbolic flows.J Comput Phys 1976, 21:251–269.
47. Wapnir IL, Barnard N, Wartenberg D, Greco RS: The inverse relationshipbetween microvessel counts and tumor volume in breast cancer. Breast J2001, 7:184–188.
48. Sosna J, Rofsky NM, Gaston SM, DeWolf WC, Lenkinski RE: Determinationsof prostate volume at 3-Tesla using an external phased array coil:comparison to pathologic specimens. Acad Radio 2003, 10:846–853.
49. Egorov V, Ayrapetyan S, Sarvazyan AP: Prostate mechanical imaging: 3-Dimage composition and feature calculations. IEEE Trans Med Imaging 2008,25:1329–1340.
50. Mayr NA, Taoka T, Yuh WTC, Denning LM, Zhen WK, Paulino AC, Gaston RC,Sorosky JI, Meeks SL, Walker JL, Mannel RS, Buatti JM: Method and timingof tumor volume measurement for outcome prediction in cervicalcancer using magnetic resonance imaging. Int J Radiat Oncol Biol Phys2002, 52:14–22.
51. Schmidt K, Ziu M, Ole Schmidt N, Vaghasia P, Cargioli T, Doshi S, Albert M,Black P, Carroll R, Sun Y: Volume reconstruction techniques improve thecorrelation between histological and in vivo tumor volumemeasurements in mouse models of human gliomas. J Neurooncol 2004,68:207–215.
52. James K, Eisenhauer E, Christian M, Terenziani M, Vena D, Muldal A, TherasseP: Measuring response in solid tumors: unidimensional versusbidimensional measurement. J Natl Cancer Inst 1999, 91:523–528.
53. Soltani M, Chen P: Shape design of internal flow with minimum pressureloss. Adv Sci Lett 2009, 2:347–355.
doi:10.1186/1754-1611-8-12Cite this article as: Sefidgar et al.: Effect of tumor shape, size, and tissuetransport properties on drug delivery to solid tumors. Journal ofBiological Engineering 2014 8:12.
Submit your next manuscript to BioMed Centraland take full advantage of:
• Convenient online submission
• Thorough peer review
• No space constraints or color figure charges
• Immediate publication on acceptance
• Inclusion in PubMed, CAS, Scopus and Google Scholar
• Research which is freely available for redistribution
Submit your manuscript at www.biomedcentral.com/submit