research on the cadet background and experience form to
TRANSCRIPT

Technical Report 1385 Research on the Cadet Background and Experience Form to Support Army ROTC Personnel Assessment: 2018-2019
Sean Baldwin, Editor Human Resources Research Organization Mark C. Young, Editor U.S. Army Research Institute for the Behavioral and Social Sciences
August 2020
United States Army Research Institute for the Behavioral and Social Sciences
Approved for public release; distribution is unlimited.

U.S. Army Research Institute for the Behavioral and Social Sciences Department of the Army Deputy Chief of Staff, G1 Authorized and approved for distribution: MICHELLE L. ZBYLUT, Ph.D. Director
Research accomplished under contract W911NF-15-C-0064 for the Department of the Army by The Human Resources Research Organization Technical review by Kerry Bolger, U.S. Army Research Institute Alisha Ness, U.S. Army Research Institute
NOTICES
DISTRIBUTION: This Technical Report has been submitted to the Defense Information Technical Center (DTIC). Address correspondence concerning reports to: U.S. Army Research Institute for the Behavioral and Social Sciences, ATTN: DAPE-ARI-ZXM, 6000 6th Street (Bldg. 1464 / Mail Stop: 5610), Fort Belvoir, Virginia 22060-5610.
FINAL DISPOSITION: Destroy this Technical Report when it is no longer needed. Do not return it to the U.S. Army Research Institute for the Behavioral and Social Sciences.
NOTE: The findings in this Technical Report are not to be construed as an official Department of the Army position, unless so designated by other authorized documents.

i
REPORT DOCUMENTATION PAGE
1. REPORT DATE (dd-mm-yy) December 2019
2. REPORT TYPE Final
3. DATES COVERED (from. . . to) May 2018 – December 2019 4. TITLE AND SUBTITLE
Research on the Cadet Background and Experience Form to Support Army ROTC Personnel Assessment : 2018-2019
5a. CONTRACT OR GRANT NUMBER W911NF-15-C-0064
5b. PROGRAM ELEMENT NUMBER 622785
6. AUTHOR(S)
Sean Baldwin and Mark C. Young (Editors)
5c. PROJECT NUMBER A790
5d. TASK NUMBER 311 5e. WORK UNIT NUMBER
7. PERFORMING ORGANIZATION NAME(S) AND ADDRESS(ES) Human Resources Research Organization 66 Canal Center Plaza, Suite 700 Alexandria, Virginia 22314
8. PERFORMING ORGANIZATION REPORT NUMBER
9. SPONSORING/MONITORING AGENCY NAME(S) AND ADDRESS(ES) U.S. Army Research Institute for the Behavioral and Social Sciences 6000 6th Street (Building 1464/Mail Stop: 5586) Fort Belvoir, VA 22060-5586
10. MONITOR ACRONYM ARI
11. MONITOR REPORT NUMBER Technical Report 1385
12. DISTRIBUTION/AVAILABILITY STATEMENT: Distribution Statement A: Approved for public release; distribution is unlimited.
13. SUPPLEMENTARY NOTES
ARI Research POC: Mark C. Young, Selection and Assignment Research Unit
14. ABSTRACT (Maximum 200 words): This report covers research conducted in 2018-2019 for the U.S. Army Research Institute for the Behavioral and Social Sciences that extends an ongoing program of research initiated in 2007. The initial goal was to develop a new non-cognitive measure, the Cadet Background and Experience Form (CBEF), to help inform the award of ROTC four-year scholarships. The operational CBEF continues to be valid for this purpose. This report describes the administration and analysis of CBEF data collected from four-year scholarship applicants and Cadets at the ROTC Advanced Camp. The evidence in these samples suggests that the CBEF is predictive of key outcomes (e.g., Army Physical Fitness Test [APFT], Grade Point Average [GPA], Outcome Metrics Score [OMS]) in both samples, but demonstrates weaker relationships with disenrollment for the 2017 applicant cohort and the 2018 Advanced Camp cohort than have been evidenced in previous large-scale longitudinal validation analyses and evidenced in subsequent evaluations. These patterns as well as others are discussed in context of the current samples and previous research efforts. The appendices of this report additionally report on two special projects, including a long-term validity analysis using an Officer Candidate School (OCS) sample and also a content development effort. 15. SUBJECT TERMS Personnel Testing, Validation, Attrition, ROTC Continuance, Biodata, Personality, ROTC Scholarships
SECURITY CLASSIFICATION OF 19. LIMITATION OF ABSTRACT
Unlimited Unclassified
20. NUMBER OF PAGES 61
21. RESPONSIBLE PERSON (Name and Telephone Number) Tonia Heffner (703) 545-4408
16. REPORT
Unrestricted 17. ABSTRACT
Unclassified 18. THIS PAGE
Unclassified Standard Form 298

ii
Technical Report 1385 Research on the Cadet Background and Experience Form to Support Army ROTC Personnel Assessment: 2018-2019
Sean Baldwin, Editor Human Resources Research Organization
Mark C. Young, Editor
U.S. Army Research Institute for the Behavioral and Social Sciences
Selection and Assignment Research Unit Tonia S. Heffner, Chief
United States Army Research Institute for the Behavioral and Social Sciences 6000 6th Street, Bldg. 1464, Fort Belvoir, VA 22060
August 2020
Approved for public release; distribution is unlimited.

iii
ACKNOWLEDGEMENTS The authors would like to acknowledge the support that the U.S. Army Cadet Command (USACC) has provided for this research program. We dedicate this work to the young men and women in ROTC nationwide who are making considerable sacrifices to become the Army’s leaders of tomorrow.

iv
RESEARCH ON THE CADET BACKGROUND AND EXPERIENCE FORM (CBEF) TO SUPPORT ARMY ROTC PERSONNEL ASSESSMENT (2018-2019) EXECUTIVE SUMMARY Research Requirement:
Reserve Officers’ Training Corps (ROTC) is the primary commissioning source for Army Officers and produces approximately half of its senior leaders who become General Officers. The U.S. Army Cadet Command (USACC) manages the four-year national ROTC scholarship program to encourage highly qualified high school seniors to become Army Officers. The USACC awards approximately 2,000 scholarships to entering ROTC students each year, yet a significant portion of these awardees will eventually leave the program. This disenrollment creates substantial costs to the Army.
In 2007, the U.S. Army Research Institute for the Behavioral and Social Sciences (ARI)
began a series of projects to develop, evaluate, and implement the Cadet Background and Experience Form (CBEF) for improving the selection of four-year ROTC scholarship recipients. The CBEF is a self-report biodata measure of motivational attributes relevant to Cadet/Officer performance and service continuance. Research findings have shown that the CBEF is a valid predictor of key ROTC training outcomes such as disenrollment, school performance, physical fitness, ranking on the ROTC commissioning Outcome Metrics Score (OMS), and performance in the ROTC Summer Advanced Camp. Accordingly, the USACC has used the CBEF operationally in the ROTC scholarship award process for high school students since 2012. Prior to including the CBEF as part of the scholarship assessment, there had been a heavy emphasis on the evaluation of cognitive skills (SAT/ACT scores, high school grade point average). Adding CBEF to the process has allowed for a more holistic assessment by capturing critical motivational attributes important to both continuance and performance in ROTC—as well as the Army.
The current project had two focal goals: To continue the longitudinal evaluation of the
CBEF using both operational and research data, and to explore ways to enhance the performance of CBEF for supporting ROTC personnel assessment needs. This document reports the results of activities conducted in support of these objectives from May 2018 to August 2019. Procedure:
The core tasks occurring between May 2018 and August 2019 included (1) describing the scholarship applicant sample of the 2018/2019 academic year, (2) evaluating the validity of the CBEF on applicants of the 2017/2018 academic year, and (3) the experimental administration of the CBEF to ROTC Cadets attending the 2018 Advanced Camp leadership course. Accordingly, the focus of this report includes the description of the applicable four-year scholarship applicant sample and Advanced Camp sample and the presentation of descriptive and validation analyses. Ancillary tasks during this timeframe included the longitudinal validity analysis of U.S. Army Officer Candidate School (OCS) cohorts and the development of new experimental CBEF scales.

v
Findings:
The results of the May 2018 to August 2019 research cycle confirm most trends in results observed during the previous three years of analysis on the criterion-related validity of the CBEF assessment for high school and ROTC Cadet samples. Our analyses, which we conducted with large scale samples in a high-stakes environment without the benefit of proctoring, evidence incremental validity for the CBEF predicting key outcomes (e.g., Army Physical Fitness Test [APFT], Grade Point Average [GPA]) beyond that of the Whole Person Score. However, unlike previous research efforts, we show only weak incremental validity of the CBEF beyond the Whole Person Score (WPS) in predicting first year disenrollment. These results are nuanced by a clear linear trend in our quintile plots. Nonetheless, our estimates of this linear trend, which correct for range restriction, suggest that the current samples evidence a different pattern than typically seen for four-year applicant samples. These are surprising results, given the sizable amount of previous research efforts that have evidenced incremental validity with larger, multi-cohort samples. All other psychometric properties of the operational high school CBEF continue to hold up over time, and the correlations of individual scales against conceptually related criteria are generally consistent with expectations. The 2018 Advanced Camp cohort provided more promising results, evidencing weak, significant relationships between the CBEF and key outcomes (OMS).
Together, our research demonstrates a functioning, well-needed operational assessment
for selecting four-year scholars. Operationally, even weak, significant incremental gains in predictive validity can have non-negligible improvements to a selection system’s utility (White, Nord, Mael, & Young, 1993; White, Young, & Rumsey, 2001). Utilization and Dissemination of Findings:
From a Talent Management perspective, testing 6,000 to 7,000 ROTC Cadets at the Advanced Camp also permits the validation of the CBEF (and other USACC metrics, such as academic major, course grades, and Professor of Military Science evaluations of the Cadets) against subsequent job performance and career advancement (e.g., achieving battalion command). This research has the potential to help USACC to award scholarships to those most likely to have a successful Officer career instead of to those who merely do well in ROTC. Linking ROTC metrics to long-term Officer outcomes could also provide insights about the most important aspects of pre-commissioning training, which in turn might lead to program improvements through additional emphasis on these elements. This research would also make it possible to revise the calculation of the OMS so that it is a better indicator of future Officer success. As of now, the earliest ROTC cohort to have completed the CBEF during Advanced Camp is reaching the 10-year career mark. Accordingly, the early indicators of career quality (i.e., Command and General Staff College [CGSC] residency) are becoming available for these Officers.

vi
RESEARCH ON THE CADET BACKGROUND AND EXPERIENCE FORM (CBEF) TO SUPPORT ARMY ROTC PERSONNEL ASSESSMENT (2018-2019) CONTENTS
Page
CHAPTER 1: PROJECT BACKGROUND ............................................................................... 1 Sean Baldwin (HumRRO), Mark C. Young, Peter J. Legree, and Robert N. Kilcullen (ARI)
Background ......................................................................................................................... 1 Objectives of the Current Project ........................................................................................ 1 Organization of the Report.................................................................................................. 2
CHAPTER 2: DATA COLLECTION OVERVIEW ................................................................ 3 Christopher R. Graves and Martin Yu (HumRRO)
F17-F18 Four-Year Scholarship Applicant Samples .......................................................... 3 L18 Advanced Camp Sample ............................................................................................. 5
CHAPTER 3: EVALUATION OF THE CRITERION-RELATED VALIDITY EVIDENCE FOR THE HIGH SCHOOL CBEF ....................................................................... 7
Kerrin E. Puente and Jennifer P. Green (HumRRO) Method ................................................................................................................................ 7 Results ................................................................................................................................. 8 Summary ........................................................................................................................... 16
CHAPTER 4: EVALUATION OF 2018 ADVANCED CAMP DATA .................................. 17 Kerrin E. Puente and Jennifer P. Green (HumRRO)
Method .............................................................................................................................. 17 Results ............................................................................................................................... 18 Summary ........................................................................................................................... 21
CHAPTER 5: SUMMARY AND FUTURE DIRECTIONS ................................................... 22 Mark C. Young (ARI), Sean Baldwin (HumRRO), Peter J. Legree, and Robert N. Kilcullen (ARI)
Background ....................................................................................................................... 22 Supporting the Award of Four-Year Scholarships............................................................ 22 Technical Constraints to Validating the CBEF ................................................................. 23 Future Directions .............................................................................................................. 24
REFERENCES ............................................................................................................................ 26
APPENDIX A: VALIDATION OF OBEF AGAINST LONG-TERM CRITERIA AMONG OFFICER CANDIDATE SCHOOL (OCS) CANDIDATES ................................. 30
APPENDIX B: DEVELOPMENT OF NEW CBEF MEASURES......................................... 54

vii
CONTENTS (CONTINUED)
Page
List of Tables Table 1. F17-F18 Applicant Sample Demographics ................................................................................. 4 Table 2. Four-year Scholarships Awarded to the F17-F18 Applicant Samples and Decisions ............. 5 Table 3. 2018 Advanced Camp Sample Demographics ........................................................................... 6 Table 4. Reliability and Descriptive Statistics for WPS and CBEF Scales in the F17 Validation
Sample ....................................................................................................................................... 10 Table 5. Descriptive Statistics for First-Year ROTC Outcomes in the F17 Validation Sample .......... 11 Table 6. Correlations between Predictors and Criteria in the F17 Validation Sample ......................... 12 Table 7. Incremental Validity of CBEF Scores beyond WPS ................................................................ 13 Table 8. Incremental Validity of CBEF Scores beyond WPS (Corrected for Range Restriction)....... 14 Table 9. Descriptive Statistics for CBEF Scales Administered in 2018 ................................................ 18 Table 10. Intercorrelations among CBEF Scales in the 2018 Advanced Camp Cohort ....................... 19 Table 11. OMS Score Descriptives and Correlations with CBEF Scales for 2018 Advanced
Camp Outcomes ........................................................................................................................ 21
List of Figures Figure 1. Relationship between the four-year scholarship applicant screens and first-year
APFT scores for F17 cadets. ............................................................................................... 15 Figure 2. Relationship between the four-year scholarship applicant screens and first-year
GPA for F17 cadets. ............................................................................................................ 15 Figure 3. Relationship between the four-year scholarship applicant screens and first-year
disenrollment for F17 cadets. .............................................................................................. 16

1
RESEARCH ON THE CADET BACKGROUND AND EXPERIENCE FORM (CBEF) TO SUPPORT ARMY ROTC PERSONNEL ASSESSMENT (2018-2019)
CHAPTER 1: PROJECT BACKGROUND
Sean Baldwin (HumRRO), Mark C. Young, Peter J. Legree, and Robert N. Kilcullen (ARI)
Background ROTC is the primary commissioning source for Army Officers, producing approximately
half of its senior leaders who become General Officers. The U.S. Army Cadet Command (USACC) manages the four-year national ROTC scholarship program to encourage highly qualified high school seniors to become Army Officers. Of the approximate 2,000 awarded scholarships, a significant portion of awardees (13-15%) will ultimately leave the program. This disenrollment creates substantial costs to the Army.
In 2007, the U.S. Army Research Institute for the Behavioral and Social Sciences (ARI) began a series of projects to develop, evaluate, and implement the Cadet Background and Experience Form (CBEF) for improving the selection of four-year ROTC scholarship recipients. The CBEF is a self-report biodata measure of motivational attributes relevant to Cadet/Officer performance and service continuance. Previous research findings generally show the CBEF to be a valid predictor of key ROTC training outcomes such as disenrollment, school performance, physical fitness, ranking on the ROTC Outcome Metrics Score (OMS), and performance in the ROTC Summer Advanced Camp. Based upon these findings, the USACC formally integrated the CBEF into the ROTC scholarship award process for high school students beginning in 2012. Adding the high school CBEF to the process allowed for more of a holistic assessment by capturing critical motivational attributes important to both continuance and performance in ROTC—as well as the Army. Previously, the WPS had a heavy emphasis on the evaluation of cognitive skills (SAT/ACT scores, high school grade point average)
The current report documents activities that occurred between May 2018 and August
2019 to support the longitudinal evaluation of the CBEF using both operational and research data and the exploration of ways to enhance the performance of CBEF for supporting ROTC personnel assessment needs.
Objectives of the Current Project
The current project continued three focal efforts: (a) Monitoring and refining the content
and scoring of high school CBEF; (b) testing and evaluating the CBEF at Advanced Camp; and (c) evaluating the validity evidence of the CBEF for four-year and non-four-year scholarship recipients with pre-commissioning outcomes. In addition to our annual evaluation of the criterion-related validity of the CBEF, we also completed an effort to examine the long-term validity of the CBEF for Cadets in Officer Candidate School (OCS) and an effort to develop new CBEF content. We describe these efforts in greater detail below.

2
Long-Term Validity Analysis of Officer Candidate School Cohorts The Officer Background and Experience Form (OBEF) is a version of the CBEF
specifically tailored for use with OCS. It includes measures of temperament, values, and other non-cognitive characteristics thought to be important for predicting Officer retention and performance. We developed the OBEF to supplement the Army’s primary instrument for selecting OCS Cadets —the Armed Services Vocational Aptitude Battery (ASVAB)—a measure of applicants’ knowledge and aptitude in domains such as mathematics and word knowledge. We administered the OBEF to three cohorts of OCS Cadets in 2008, 2010, and 2011 as part of the Select OCS research program. Since conducting the original research, we have collected more mature outcome data than originally reported. Accordingly, we conducted an updated validation analysis to substantiate the relationship between OBEF and post-commissioning continuance among OCS candidates. Appendix A presents a full summary of this work. Development of New CBEF Experimental Scales
In a continual effort to improve the predictive quality and relevance of the CBEF to new
testing samples, we sought to identify new experimental biodata scales with potential to incrementally improve the high school CBEF’s predictive validity for continuance. We identified seven potential constructs for development, five of which we selected for content development, and three of which we included in the 2019 Advanced Camp data collection. Given their 2019 administration, the results of this administration are beyond the scope and time period of the current report. Appendix B presents a full summary of this work.
Organization of the Report
The remaining sections of this report summarize our 2018-2019 efforts, including
(a) descriptions of the 2018 High School Applicant Sample and the 2018 Advanced Camp Sample, hereafter referred to as the Freshman 2018 (F18) and Leadership 2018 (L18) samples; (b) an evaluation of the validity evidence of the CBEF for four-year scholarship recipients in the Freshman 2017 (F17) sample1 with pre-commissioning outcomes; and (c) an evaluation of the validity evidence of the CBEF for Advanced Camp outcomes in the L18 sample. Chapter 2 describes the F18 and L18 data collection efforts. Chapters 3 and 4 report criterion-related validity evidence of the high school CBEF composite for the F17 sample and the L18 samples, respectively. Chapter 5 provides a summary of the research activities conducted during between 2018 and 2019 as well as directions for future research.
1 At the time of drafting this report, first year outcome data was not available for the F18 sample, thus the only sample for which we could examine the validity evidence of the CBEF in the High School Applicant sample was for those who were applying for a scholarship in their freshman year of 2017 (F17).

3
CHAPTER 2: DATA COLLECTION OVERVIEW
Christopher R. Graves and Martin Yu (HumRRO)
Annually, ARI coordinates with the U.S. Army Cadet Command (USACC) to administer the CBEF to two samples: the four-year scholarship applicant sample and the Advanced Camp sample. Below, we first describe and provide sample descriptive statistics for the four-year scholarship applicant sample for those applying for a scholarship as a Freshman in the 2018 academic year (Freshman 2018; F18). Next we provide the same information for the 2018 Advanced Camp cohort (Leadership 2018; L18).
F17-F18 Four-Year Scholarship Applicant Samples
The F17 and F18 scholarship applicant samples consisted of ROTC applicants who had
completed the CBEF between June 2016 and February 2017 and between June 2017 and February 2018, respectively, as a part of the four-year scholarship application package. The USACC administers much of the application, including the CBEF, as an un-proctored, online assessment. In early investigations of the CBEF, prior to its operational administrations, ARI identified several response screening-patterns to flag and remove careless responders. Although many of the response screens used for the CBEF are common to other testing programs (e.g., flagging respondents with identical consecutive responses), the combination of flags for the CBEF are unique to this testing program. Specifically, we removed from substantive analyses any records flagging on the following rules:
• All responses must be valid values in the raw file (1, 2, 3, 4, 5);
• Records with greater than 10% of responses are invalid (missing or outside the 1 to 5 range);
• Records with 50 or more identical consecutive responses (e.g., 2, 2, 2, 2, 2…,2) are invalid;
• Records with at least seven examples of 10 or more identical consecutive responses are invalid;
• Records with the same response option selected more than 70 times; or
• Records with a Mahalanobis distance2 greater than 300, indicating an extreme outlier (Mahalanobis, 1936). Outlier records can affect the mean statistic, which in turn affects several inferential statistics (e.g., effect size estimates). Thus, removing these records mitigates the likelihood of Type I error in subsequent significance tests.
Of the applicants, the above screening rules flagged and screened out 2.66 to 2.69% of
the F17 and F18 records. Table 1 presents the gender and racial demographics of these screened
2 Mahalanobis distance provides an index of whether an individual record is a multivariate outlier. It accounts for the variance of each variable under consideration as well as the correlations between all variables under consideration and calculates each record’s distance in multivariate space from the center. As a rule of thumb, values greater than 300 are flagged as being multivariate outliers.

4
samples. Among these applicants, 4,759 F17 and 5,128 F18 applicants had their application reviewed by the selection board (i.e., boarded applicants) with only 2,296 F17 and 2,681 F18 accepted scholarships. Among those who accepted scholarships, 2,102 accepted a four-year scholarship in F17 and 2,621 accepted a four-year scholarship in F18. The USACC designates the following three scholarships as “four-year scholarship types” and accordingly, selects awardees using the four-year scholarship application process:
• Traditional four-year (4R): A 4R scholarship pays benefits for four years starting with a Cadet’s freshman year.
• Three-year advanced designee (3D): A 3D scholarship is a four-year scholarship that does not pay benefits the first year, pending a one-year validation by the Professor of Military Science (PMS). For benefits to start, a Cadet must (a) be enrolled in ROTC classes during the entire first year and successfully complete the first year of Military Science courses, (b) have achieved a 2.5 or higher college GPA and a 3.0 ROTC GPA at the end of their Military Science courses, (c) qualify, medically and administratively, and (d) pass the APFT prior to contracting.
• Four-year historically black colleges and universities (HBCU; QE3): A QE scholarship is a four-year scholarship given at HBCU.
Although the CBEF is currently a component of the WPS used to award 4R, 3D, and QE
scholarships, ARI originally designed and validated the CBEF on 4R scholarship Cadets. Table 1. F17-F18 Applicant Sample Demographics
F17 F18 Sample n % n % Full Sample 8,875 - 9,870 - Gender
Female 2,610 29 3,079 31 Male 6,170 70 6,786 69 Missing 5 0 5 0
Ethnicity Hispanic 1,134 13 1,336 14 Non-Hispanic 7,448 87 8,534 86
Race African American 1,082 12 1,391 14 American Indian 170 2 283 3 Asian/Pacific Islander 638 7 1,005 10 Hispanic 1,134 13 1,336 14 White 6,731 76 7,918 80
Note. The Full Sample denotes the number of four-year applicants that passed the response screens during data processing. Race was self-report and allowed multiple responses; therefore, the sum of race percentages may exceed 100.
3 According to USACC, it is up to each school to decide what scholarship code they record, and although the QE scholarship code has been used previously at HBCU, currently all HBCU use one of the other codes for four-year scholarships.

5
Table 2. Four-year Scholarships Awarded to the F17-F18 Applicant Samples and Decisions F17 F18
Scholarship Code n % n % 4R
Accepted 1,167 80 1,194 78 Offered and Declined 206 14 238 16 Withdrawn 91 6 100 7
3D Accepted 935 79 1,427 83 Offered and Declined 128 11 119 7 Withdrawn 114 10 181 10
QE Accepted 0 - 0 - Offered and Declined 0 - 0 - Withdrawn 0 - 0 -
Other Accepted 29 91 18 90 Offered and Declined 3 9 2 10 Withdrawn 0 0 0 0
No Award 5,843 - 6,368 - Note. “Withdrawn” indicates scholarship applications that were withdrawn from consideration before an offer decision was made.
L18 Advanced Camp Sample We collected data for the L18 sample from Cadets about to enter their fourth year of
Military Science (MS-IV) coursework at ROTC’s Advanced Camp conducted at Fort Knox, KY. Advanced Camp is a 31-day training event conducted to assess Cadets’ proficiency at basic Officer leadership tasks. The 2018 Advanced Camp occurred in June and July 2018 and included ten regiments, with each rotation including between 600 and 650 Cadets. We collected data separately from each regiment, which necessitated ten data collections. We administered the assessment on Day 1, the first full day, of Advanced Camp following the routine in-processing activities and briefings. Upwards of 95% of Cadets arrive at Camp on Day 0. Administering the assessment early in a rotation allowed us to assess Cadets before the knowledge and experiences gained during camp caused them to respond more like commissioned Officers.
ARI conducted each of the ten data collections in a large auditorium during a 90-minute
session that began at approximately 8 pm, immediately following an in-brief by Cadet Command’s commanding general. We conducted data collections strictly according to the project’s Advanced Camp test administration manual. We began each session by distributing the assessment, a 28-page machine-readable test booklet. After distribution, we asked all active-duty personnel (training cadre members, excluding Medics) to leave the auditorium to avoid potential command influence. We then instructed Cadets to listen carefully to instructions as we described

6
how to complete the Privacy Act Statement, Informed Consent form, and a background information page. We told Cadets that ARI would not use the information they provided unless they completed the informed consent section. ARI then asked Cadets to complete the rest of the assessment and to remain quiet after they finished. Prior to dismissing the Cadets to their next event, researchers ensured all Cadets had turned in their test booklets.
After identifying 252 Cadets who did not consent to participate (4.1% non-participation
rate), the 2018 Advanced Camp sample consisted of 5,861 Cadets. We used the screening rules described above to flag the F18 CBEF response data. Of the 5,861 Cadets, we flagged 323 records due to one or more of these screening rules and excluded them from subsequent analyses. We note that the flagging rate in the Advanced Camp sample is higher than that in the F18 sample. We expected this pattern because we administer the former assessment for research purposes, whereas the latter assessment constitutes a high-stakes test. Table 3 presents the gender and racial demographics of this screened sample.
Table 3. 2018 Advanced Camp Sample Demographics
Sample n %
Full Sample 5,538 - Gender
Female 1,327 24 Male 4,174 75 Missing 37 1
Ethnicity Hispanic 801 14 Non-Hispanic 4,710 85 Missing 58 1
Race African American 700 13 American Indian 83 2 Asian/Pacific Islander 531 10 Hispanic 801 14 White 4,377 79 Missing 118 2
Note. The Full Sample denotes the number of records collected during in-person Advanced Camp data collections that passed the response screens during data processing. Race was self-report and allowed multiple responses; therefore, the sum of race percentages may exceed 100.

7
CHAPTER 3: EVALUATION OF THE CRITERION-RELATED VALIDITY EVIDENCE FOR THE HIGH SCHOOL CBEF
Kerrin E. Puente and Jennifer P. Green (HumRRO)
This chapter presents criterion-related validity evidence regarding the potential of high
school CBEF composite scores and scales to predict (a) disenrollment, (b) cumulative GPA, and (c) APFT scores for four-year scholarship recipients who were Freshman ROTC cadets in 2017 (F17). We also report on the incremental validity of the CBEF beyond the Whole Person Score (WPS). The WPS is a composite score, made-up of physical and cognitive dimensions. As of 2012, the WPS officially incorporated the CBEF as one component of the composite score. We describe the WPS in more detail below. Note that we collect outcome data annually for each four-year scholarship recipient cohort, such that the cohort who began ROTC in 2018 (described in Chapter 2), would have first-year outcome data beginning in 2019. Currently, the most recent four-year scholarship cohort with reported validity analyses is the F17 cohort.
Method
Validation Sample
The validation sample included four-year ROTC scholarship recipients that had complete
CBEF and WPS data, enrolled in ROTC on campus as freshman in 2017, and had first-year ROTC outcomes. The USACC uses the WPS with CBEF to award 4R, 3D, and QE scholarships, however, ARI originally designed and validated the CBEF on 4R scholarship Cadets. Accordingly, we also present and discuss results for 4R Cadets, specifically.
Predictor Measures
The U.S. Army Cadet Command (USACC) uses the WPS composite to rank order
scholarship candidates for the award of four-year scholarships. The discussion in this chapter focuses on the following predictors:
• Whole Person Score: The WPS reflects six components: (a) SAT/ACT scores; (b) Scholar-Athlete-Leader scores, which reflect ROTC’s desire for Cadets who excel at academics, are athletic, and serve in leadership positions; (c) professors of military science (PMS) interview scores; (d) promotion board scores; (e) Physical Fitness Assessment (PFA) scores; and (f) CBEF scores. All components are rescaled and allotted a maximum amount of points. The maximum total WPS an applicant can receive is 1,400 points. For the purposes of our analyses, we compute a WPS that did not include the CBEF scores. This allows us to compare the validity of the WPS components to the CBEF score and examine CBEF’s incremental validity.
• CBEF Composite: The CBEF consists of a set of rationally keyed biodata scales designed to assess temperament constructs hypothesized to relate to Cadet and Officer retention. We calculate the operational CBEF composite as the weighted average of only some individual CBEF scales presented in this report. The individual

8
CBEF scales that make up the composite are “operational” or “scored” and the other individual CBEF scales not included in the operational CBEF composite (i.e., not used to make operational decisions) are “experimental” or “unscored.” In this report, we intentionally omit references to which scales contribute to the operational CBEF Composite Score and which scales are experimental due to the sensitivity of this test information. In lieu of presenting this information, we will present CBEF composite score analyses and analyses for all scales administered on the CBEF (scored and unscored).
Outcome Measures
The ROTC outcome data includes criteria on students that the USACC tracked since they enrolled in ROTC college courses. We capture each of these variables in the fall following a given academic year:
• Disenrollment: Enrollment status is a cumulative variable, coded as 0 (enrolled) or 1 (disenrolled), and identifies whether a Cadet disenrolled prior to starting the next academic year. We identify a Cadet as disenrolled in the first-year cumulative variable disenrolled during their first year but did not start their second year as an ROTC Cadet. Unfortunately, the disenrollment data captured from USACC for this sample does not capture disenrollment reason reliably, thus we cannot disentangle voluntary versus involuntary disenrollment.
• Cumulative Grade Point Average (GPA): We cumulate college GPA across academic years, including grades for both ROTC and regular (non-ROTC) college courses. For example, first year cumulative GPA includes course grades from all classes in a Cadet’s first academic year. Higher scores indicate higher academic achievement.
• Army Physical Fitness Test (APFT): ROTC Cadets complete the APFT at least once annually. The academic year APFT score represents the most recent APFT score captured during that academic year in the ROTC outcomes data extract. Higher scores indicate higher physical ability.
Results
Descriptive Statistics
Descriptive statistics and scale internal consistency (i.e., coefficient alpha, Kuder-
Richardson) reliabilities for the predictor measures appear in Table 4. We also present the standardized mean differences between the 4R and 3D scholarship types. We interpret effect sizes in this report of the magnitude .10, .30 and .50 as small, medium, and large (Cohen, 1988). Of note, scores on the Hostility to Authority, Past Withdrawal Propensity, and Response Distortion scales are negatively valanced, such that higher scores reflect those who are more hostile to authority, have a greater propensity to quit activities, and have a greater propensity to distort responses, respectively. Lower scores reflect less hostile to authority, lower propensity to quit activities, and lower propensity to distort responses.

9
• The CBEF scales show acceptable variance and reliability (operationalized here as greater than or equal to .70). Exceptions include Hostility to Authority, Goal Orientation, Past Withdrawal Propensity, and Tolerance for Injury.
• As anticipated, there were large differences between 4R and 3D Cadets on WPS and WPS plus CBEF composite scores, with 4R Cadets significantly higher than 3D Cadets.
• Across scales, 4R Cadets scored significantly higher on Achievement Orientation, Fitness Motivation, Peer Leadership, Self-Efficacy, and Written Communication scales. The 4R Cadets also scored significantly lower on Hostility to Authority.
Table 5 presents descriptive statistics for the ROTC outcomes.
• The first-year disenrollment rate for the four-year validation sample was 15%.
• 4R and 3D Cadets differ significantly on first-year ROTC outcomes, with 4R Cadets having lower disenrollment and higher GPAs and APFT scores.4
4 When considering differences in first-year ROTC outcomes between 4R and 3D Cadets, it is important to note that 3D Cadets, unlike 4R Cadets, have yet to receive any benefits from their scholarships.

10
Table 4. Reliability and Descriptive Statistics for WPS and CBEF Scales in the F17 Validation Sample
Scale Four-year (4R + 3D)
lid i l (4R d 3D) 4R 3D 4R-3D
k ryy/rxx n M SD n M SD n M SD d CBEF Composite Score 1,821 136.23 34.02 956 141.15 31.91 865 130.80 35.45 0.31 WPS 1,643 868.22 84.04 919 918.13 53.83 724 804.88 71.96 1.81 WPS + CBEF 1,641 1,005.01 83.79 919 1,059.49 53.47 722 935.67 61.10 2.17 WPS Components
Athlete Points 1,785 41.39 10.69 950 43.56 10.51 835 38.93 10.37 0.44 Board Points 1,823 250.09 46.15 956 277.16 32.53 867 220.24 40.17 1.57 Scholar Points 1,704 28.32 8.91 929 30.42 8.88 775 25.80 8.27 0.54 Leader Points 1,770 38.87 9.76 951 41.39 9.60 819 35.93 9.11 0.58 SAT/ACT 1,823 181.50 29.84 956 194.00 25.91 867 167.73 27.76 0.98 PMS Interview Score 1,823 188.80 19.33 956 194.47 11.13 867 182.55 23.97 0.65 Physical Fitness Assessment 1,823 133.44 18.21 956 137.43 15.01 867 129.04 20.30 0.47
CBEF Biodata Scales Achievement Orientation 9 .73 1,821 4.39 0.36 956 4.46 0.33 865 4.32 0.38 0.41 Army Identification 14 .86 1,821 4.17 0.48 956 4.17 0.48 865 4.16 0.47 0.01 Fitness Motivation 8 .79 1,821 4.00 0.54 956 4.07 0.52 865 3.92 0.55 0.28 Goal Orientation 4 .58 1,818 4.38 0.48 956 4.38 0.46 862 4.38 0.49 0.00 Hostility to Authoritya 4 .51 1,821 1.38 0.34 956 1.36 0.33 865 1.41 0.35 -0.15 Past Withdrawal Propensitya 5 .56 1,821 1.74 0.42 956 1.74 0.42 865 1.74 0.43 -0.02 Peer Leadership 6 .82 1,821 3.95 0.56 956 4.02 0.53 865 3.88 0.58 0.26 Response Distortionab 7 .72 1,821 .08 .13 956 .06 .11 865 .09 .15 -0.23 Self-Efficacy 6 .77 1,818 4.38 0.38 956 4.41 0.37 862 4.35 0.39 0.14 Stress Tolerance 11 .68 1,821 3.50 0.39 956 3.50 0.38 865 3.51 0.41 0.00 Tolerance for Injury 3 .56 1,818 3.66 0.59 956 3.67 0.58 862 3.65 0.59 0.03 Written Communication 7 .74 1,821 3.54 0.53 956 3.62 0.52 865 3.45 0.53 0.32
Note. 4R = Traditional four-year scholarship. 3D = 3-year advanced designee scholarship. According to USACC, all HBCU use other scholarship codes (4R, 3D) for four-year scholarships. CBEF = Cadet Background and Experience Form. WPS = Whole Person Score. The CBEF Composite score ranges from 0 to 250. The WPS ranges from 0 to 1,150. The WPS + CBEF ranges from 0 to 1,400. k = number of items/scales in the composite. ryy/rxx = reliability coefficient. Significant Cohen's d values, based on an independent sample t-test between the group means, are bolded (two-tailed, p < .05). a Negatively valanced, such that lower scores indicate more favorable standing on the construct of interest. b Response distortion items have a 0-1 response scale. All other CBEF scales have a 1-5 response scale.

11
Table 5. Descriptive Statistics for First-Year ROTC Outcomes in the F17 Validation Sample
Outcome Four-year scholarship
validation sample 4R 3D 4R-3D
n M SD n M SD n M SD d
APFT 1,569 259.05 33.21 900 265.45 29.60 669 250.45 35.78 0.46
GPA 1,701 3.23 0.54 903 3.30 0.51 798 3.16 0.56 0.26
Disenrollment 1,822 .15 .36 956 .13 .34 866 .18 .38 -0.12
Note. 4R = Traditional four-year scholarship. 3D = 3-year advanced designee scholarship. APFT = Army Physical Fitness Test. GPA = Grade point average. Significant Cohen's d values, based on an independent sample t-test between the group means, are bolded (two-tailed, p < .05).
Bivariate Correlations
Table 6 presents the correlations between the WPS, CBEF, and ROTC outcomes for the
combined four-year scholarship validation sample as well as for the subset of 4R scholarship recipients.
• CBEF composite scores exhibited a small correlation with APFT (r = .07) in the four-year scholarship validation sample, whereas WPS and WPS plus CBEF had relatively larger correlations with APFT (r = .25; r = .29). Among the scales, Physical Fitness Assessment (r = .40) and Fitness Motivation (r = .30) had the strongest correlations with APFT.
• WPS and WPS plus CBEF were modestly correlated with GPA (r = .17; r = .17). This relationship is likely driven by Board Points (r = .21) and SAT/ACT (r = .17) components. CBEF composite scores were not related to GPA (r = -.03).
• All correlations with first-year disenrollment were quite small in both samples, including the CBEF composite (r = -.03). A previous validity investigation covering seven applicant cohorts from 2015 to 2018 showed a significant relationship between the CBEF composite and first-year disenrollment (r = -.07; Bynum & Young, 2020). It is unclear why the F17 sample demonstrates a weaker relationship with first-year disenrollment than that estimated using a larger, more varied set of cohorts, especially in light of the demographic similarities between the F17 and F18 cohorts (see Chapter 2).
• The strongest relationships with first-year disenrollment included Past Withdrawal Propensity (r = .07 in the four-year validation sample; r = -.10 in the 4R sample) and Fitness Motivation (r = -.05 in the four-year validation sample; r = -.04 in the 4R sample).

12
Table 6. Correlations between Predictors and Criteria in the F17 Validation Sample
Scale Four-year
validation sample 4R APFT GPA Disenrollment APFT GPA Disenrollment
CBEF Composite Score .07 -.03 -.03 .05 -.05 -.03 WPS .25 .17 -.02 .18 .15 .04 WPS + CBEF .29 .17 -.04 .22 .11 .02 WPS Components
Athlete Points .13 -.04 -.01 .10 -.11 -.01 Board Points .21 .21 -.03 .12 .19 .04 Scholar Points .01 .04 -.01 -.03 .00 .00 Leader Points .06 .00 .00 -.01 -.03 .04 SAT/ACT .06 .17 .01 -.07 .17 .04 PMS Interview Score .09 .02 -.01 .06 -.04 .00 Physical Fitness Assessment .40 .00 -.06 .42 -.05 -.02
CBEF Biodata Scales
Achievement Orientation .03 .11 .00 .00 .12 -.02 Army Identification .00 -.12 -.04 -.01 -.16 -.04 Fitness Motivation .30 -.03 -.05 .30 -.12 -.04 Goal Orientation -.04 -.11 -.02 -.04 -.13 -.06 Hostility to Authoritya -.01 -.03 .01 -.04 -.05 .01 Past Withdrawal Propensitya .00 .01 .07 .01 .00 .10 Peer Leadership -.05 .03 -.01 -.06 .04 -.02 Response Distortionab -.03 -.01 -.01 .01 -.02 -.01 Self-Efficacy .01 .01 -.01 .01 -.01 -.03 Stress Tolerance .00 -.04 -.01 .00 -.05 .00 Tolerance for Injury .07 -.08 -.02 .06 -.13 .02 Written Communication .03 .10 .00 .02 .10 -.03
Note. CBEF = Cadet Background and Experience Form. WPS = Whole Person Score. k = number of items/scales in the composite. ryy/rxx = reliability coefficient. Four-year n = 1,425 - 1,822. 4R n = 867 - 956. Bolded values indicate statistical significance at p < .05 (two-tailed). a Negatively valanced, such that lower scores indicate more favorable standing on the construct of interest. b Response distortion items have a 0-1 response scale. All other CBEF scales have a 1-5 response scale. Incremental Validity
To evaluate the incremental validity of the CBEF beyond the WPS, we computed a series of
two-step hierarchical regression models with respect to the criteria of interest. Hellevik (2009) suggests comparable inferences for both linear and logistic regression analyses. Thus, for more parsimonious and interpretable results, we report on linear regression models for all criteria. We regressed scores for each criterion measure onto Cadets' WPS, followed by scores on either the (a) CBEF composite or (b) scored CBEF scales in the second step. We estimated all models using Ordinary Least Squares (OLS) regression. We discuss the results of OLS regression analyses with a focus on R values. We computed cross-validity estimates to adjust the observed ∆R for shrinkage using Burket’s (1964) formula for population cross-validity. Table 7 summarizes the incremental validity of the CBEF composite scores above WPS in predicting ROTC outcomes.

13
Table 7. Incremental Validity of CBEF Scores beyond WPS
Outcome WPS Only WPS + CBEF Composite WPS + CBEF Scalesa
n R R ΔRb ΔAdj. Rb R ΔRc ΔAdj. Rc 1st year outcomes
APFT 1,425 .27 .29 .02 .02 .40 .14 .13 GPA 1,538 .19 .19 .00 .00 .24 .06 .04 Disenrollment 1,640 .02 .04 .02 .01 .07 .07 .01
4R 1st year outcomes
APFT 867 .18 .22 .03 .03 .38 .20 .18 GPA 873 .15 .15 .00 -.01 .26 .13 .10 Disenrollment 919 .04 .05 .01 -.01 .07 .06 -.05
Note. 4R = Traditional four-year scholarship. WPS = Whole Person Score. WPS includes ACT/SAT, Scholar-Leader-Athlete, PMS Interview, and Board Points. CBEF = Cadet Background and Experience Form composite. APFT = Army Physical Fitness Test. GPA = Grade point average. Analyses used a correlation matrix corrected for range restriction with outcomes. ∆Adj R = Increment in estimated population cross-validity. Significance is not indicated for ΔAdj. R values. Bolded values indicate statistical significance at p < .05 (two-tailed). a CBEF scales include the individual scored scales of the CBEF composite. b ΔR is based on the difference between the WPS only and the WPS + CBEF composite. c ΔR is based on the difference between the WPS only and the WPS + CBEF scales.
Because of range restriction, the population of four-year scholarship recipients typically
has higher WPS and CBEF scores and a smaller standard deviation of scores compared to the applicant sample. To estimate the validity in the applicant population from the observed validity in the validation sample, we corrected for the effects of range restriction on WPS and CBEF scores. We corrected for indirect range restriction for correlations using the WPS, CBEF, and CBEF scales because the USACC currently awards scholarships using the WPS plus CBEF composite scores.
Table 8 summarizes the incremental validity of the CBEF composite scores above WPS
in predicting ROTC outcomes after correcting for range restriction.
• WPS scores did not predict first-year disenrollment in either sample.
• The CBEF composite score added significant gains in the prediction of first-year APFT, GPA, and disenrollment in the four-year validation sample. In the 4R sample, the CBEF failed to increase the prediction of disenrollment. Similar to the raw, bivariate relationships observed in the previous chapter, the CBEF composite has previously exhibited stronger incremental validity evidence above the WPS than observed here. In a longitudinal examination of the incremental validity in 4R recipients from 2014 through 2016, we evidenced significant gains from using the CBEF composite (ΔR = .076; Bynum & Young, 2020). The discrepant incremental validity observed in this research might be due to non-negligible effects not captured in the current investigation (e.g., sampling error), which were mitigated with the larger, more representative sample used in Bynum and Young’s (2020) investigation.
• Adding the scored CBEF scales to the OLS model resulted in gains for predicting APFT and GPA in both the four-year and 4R validation samples, but the scales did not add to the prediction of disenrollment beyond WPS.

14
Table 8. Incremental Validity of CBEF Scores beyond WPS (Corrected for Range Restriction)
Outcome WPS Only WPS + CBEF Composite WPS + CBEF Scalesa
n R R ΔRb ΔAdj. b
R ΔRc ΔAdj 1st year outcomes
APFT .42 .49 .07 .07 .58 .16 .16 GPA 1,425 .27 .27 .01 .00 .33 .06 .06 Disenrollment 1,538 .05 .07 .02 .02 .09 .04 .04
4R 1,640 1st year outcomes
APFT .48 .69 .21 .21 .78 .30 .30 GPA 867 .30 .35 .06 .05 .43 .13 .13 Disenrollment 873 .06 .06 .00 -.02 .08 .02 .01
Note. 4R = Traditional four-year scholarship. WPS = Whole Person Score. WPS includes ACT/SAT, Scholar-Leader-Athlete, PMS Interview, and Board Points. CBEF = Cadet Background and Experience Form composite. APFT = Army Physical Fitness Test. GPA = Grade point average. Analyses used a correlation matrix corrected for range restriction with outcomes. ∆Adj R = Increment in estimated population cross-validity. Significance is not indicated for ΔAdj. R values. Bolded values indicate statistical significance at p < .05 (two-tailed).
a CBEF scales include the scored scales of the CBEF composite. b ΔR is based on the difference between the WPS only and the WPS + CBEF composite. c ΔR is based on the difference between the WPS only and the WPS + CBEF scales.
Operational Validity
Figure 1, Figure 2, and Figure 3 compare differences in first year APFT, GPA, and
disenrollment for those scoring in different quintiles on the (a) CBEF composite score, (b) the WPS only (i.e., without the CBEF),and (c) WPS plus CBEF. Figures 1-3 present results for the four-year validation sample and the 4R validation sample.
A clear pattern emerged when looking at the WPS including the CBEF component in the
combined validation sample which includes all scholarship subtypes. Individuals in the bottom 20% performed worse than those in higher percentile groups for every performance-related outcome examined. Selecting candidates in the top 80% would result in higher performance on average for APFT and GPA, and also result in less disenrollment. The same patterns emerged when looking at the WPS only (i.e., without the CBEF).
• For APFT and GPA, criterion performance generally improved in a linear fashion by WPS plus CBEF percentile groups (as well as WPS only percentile groups), such that the top 20% were among the highest performers. Conversely, the bottom 20% were always the lowest performing.
• In general, there was less differentiation among Cadets' performance based on the CBEF composite percentile scores.
• When focusing on first-year disenrollment, the CBEF most clearly differentiated Cadets scoring in the bottom 20th percentile from those in higher percentile groups.
Among the 4R Cadet subsample, there was less differentiation between individuals in the bottom 20% compared to those in higher percentile groups for the ROTC outcomes. This may be attributable to greater range restriction on the WPS and CBEF scores for 4R Cadets compared to the combined sample.

15
Figure 1. Relationship between the four-year scholarship applicant screens and first-year APFT scores for F17 cadets.
Figure 2. Relationship between the four-year scholarship applicant screens and first-year GPA for F17 cadets.
4R Validation Sample

16
Figure 3. Relationship between the four-year scholarship applicant screens and first-year disenrollment for F17 cadets.
Summary Overall, the results of the validation analyses suggest that the CBEF adds utility for
selecting four-year ROTC scholarship recipients. It is possible that range restriction is causing attenuation in the correlations between CBEF, WPS, and ROTC outcomes because 4R the USACC uses the WPS with CBEF to award scholarships. When accounting for this, the CBEF score slightly adds to the prediction of first-year disenrollment beyond the WPS. Further, examination of all first-year outcomes and quintile splits of WPS plus CBEF predictor composites showed a clear linear improvement in favor of higher scoring individuals. Although the effects observed in this research show a weak improvement in disenrollment prediction gained by the CBEF composite beyond the WPS, we note that these results reflect a single cohort. Previous longitudinal examinations that span multiple cohorts show stronger bivariate correlations between the CBEF composite and first-year disenrollment as well as stronger incremental validity estimates (Bynum & Young, 2020).
We will continue to monitor the predictive validity of the CBEF for future scholarship
samples as criterion data become available. Future samples will help to provide information on the stability of these results.
4R Validation Sample

17
CHAPTER 4: EVALUATION OF 2018 ADVANCED CAMP DATA
Kerrin E. Puente and Jennifer P. Green (HumRRO) This chapter describes the basic psychometric properties of the Advanced Camp CBEF
scales, as well as the key criteria of interest for the 2018 Advanced Camp cohort (Leadership 2018; L18). In our analyses, we compare results for all Cadets who attended Advanced Camp, as well as for the subset 4R scholarship recipients only. These analyses will ultimately inform the use of CBEF scales in future Advanced Camp data collections.
Method
Sample ROTC Cadets attend Advanced Camp during the summer of their third collegiate year,
prior to their fourth year of military science coursework. The current analyses focus on the L18 cohort. See Chapter 2 for a more detailed description of this sample.
Predictors
Each year we update the Advanced Camp test booklet to include new experimental CBEF
scales and to remove scales that are not performing well. For the L18 cohort, predictors included:
• Scored and Unscored CBEF Scales: The CBEF biodata scales used to compute the CBEF composite score in the high school sample (i.e., “scored” scales) appear alongside experimental scales (i.e., “unscored” scales). In this report, we intentionally omit references to which scales contribute to the operational CBEF Composite Score and which scales are experimental due to the sensitivity of this test information. We administered the CBEF scales from the high school test with minor edits to ensure appropriateness for the Advanced Camp sample. We believe these minor edits did not have any substantive effect on the measurement of the underlying constructs.
• CBEF Composite: We computed the CBEF composite score, which is operational for the high school applicant sample, using the Advanced Camp CBEF data. Evaluating the CBEF composite from the high school test with Advanced Camp data allows us to examine their correlations with newer experimental CBEF scales.
Outcomes
The outcomes of interest for the Advanced Camp cohorts include the Outcome Metrics
Score (OMS) and third-year ROTC outcomes. The OMS is a composite, combining three broad categories of performance: academic outcomes, leadership outcomes, and physical fitness outcomes. The USACC uses the OMS to rank-order Cadets for the Order of Merit List in their senior year within a given cohort. Higher rank (i.e. rank 1) is an indication of higher OMS and higher standing in the cohort. The third-year APFT score represents the Cadet’s most recent APFT score at the completion of their third academic year. Third-year cumulative GPA includes course grades from all classes in a Cadet’s first, second, and third academic years.

18
Results
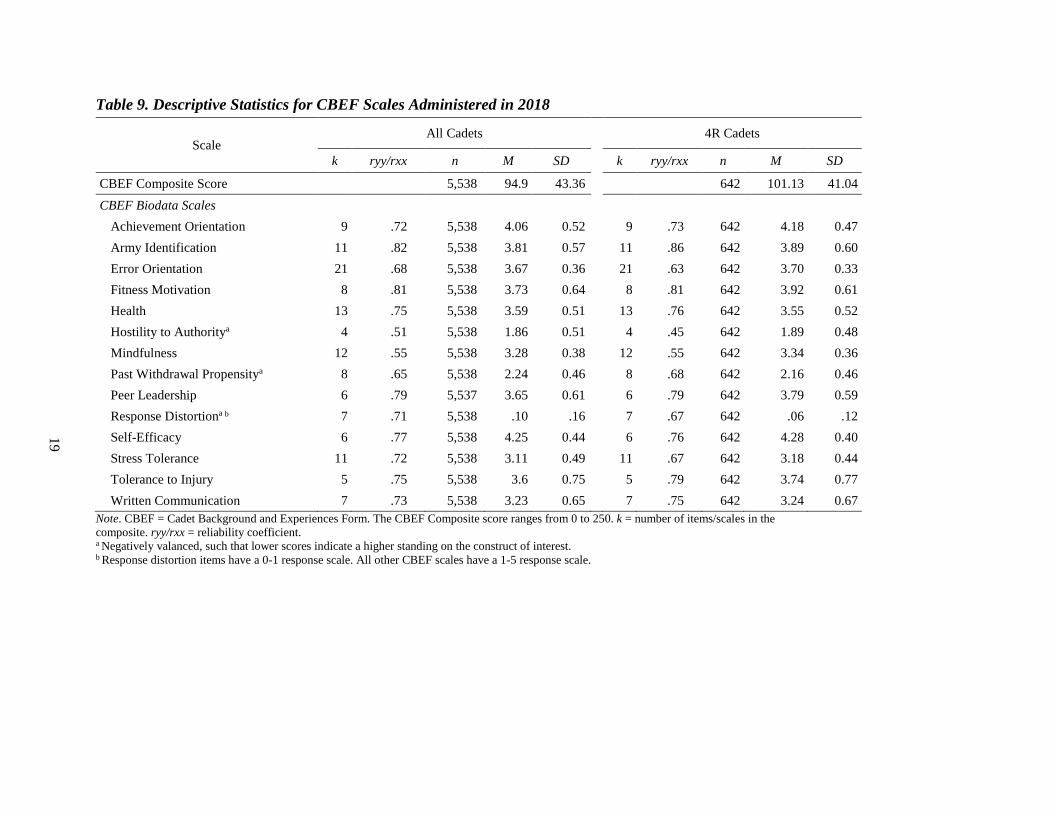
Predictor Descriptive Statistics and Intercorrelations Table 9 includes reliability estimates, sample sizes and distributional properties (means
and standard deviations) for the CBEF scales in the L18 sample. As a reminder, scores on the Hostility to Authority, Past Withdrawal Propensity, and Response Distortion scales are negatively valanced.
• All CBEF scales demonstrated sufficient reliability (defined here as rxx >= .70) with the exception of Error Orientation, Past Withdrawal Propensity, Mindfulness, and Hostility to Authority. Using the 4R sample, which is known to be a less variable sample of high ability respondents, two additional constructs demonstrated reliability estimates lower than .70: Response Distortion and Stress Tolerance.
• As expected, mean scores were generally higher for 4R scholarship recipients compared to the sample of all Cadets.
Table 10 summarizes the intercorrelations among all 14 CBEF scales for all L18 Cadets. The CBEF scales exhibited small to moderate intercorrelations. Self-Efficacy and Error Orientation had relatively strong correlations with Mindfulness, Past Withdrawal Propensity, and Peer Leadership (Min |r| = .39, Max |r| = .47). Other notable relationships included:
• Achievement and Self-Efficacy (r = .45) • Stress Tolerance and Error Orientation (r = .46) • Stress Tolerance and Mindfulness (r = .50) • Tolerance for Injury and Fitness Motivation (r = .45)
Relationship between Predictors and Outcomes
Table 11 presents the descriptive statistics for the OMS outcomes, as well as the
correlations with CBEF scales.
• In the full sample, the CBEF composite score (r = .14) and all CBEF scales (Min r = -.06, Max r = .38) were significantly related to OMS scores in the expected direction. The CBEF composite (r = .14), Achievement Orientation, Fitness Motivation, Peer Leadership, and Self-Efficacy (Min r = .14, Max r = .37) were the only scales significantly related to OMS in the 4R sample.
• Among the scales, Achievement Orientation (r = .29), Fitness Motivation (r = .38), Peer Leadership (r = .18), and Self-Efficacy (r = .17) demonstrated the largest correlations with OMS for the full sample.
19
Table 9. Descriptive Statistics for CBEF Scales Administered in 2018
Scale All Cadets 4R Cadets
k ryy/rxx n M SD k ryy/rxx n M SD
CBEF Composite Score 5,538 94.9 43.36 642 101.13 41.04 CBEF Biodata Scales
Achievement Orientation 9 .72 5,538 4.06 0.52 9 .73 642 4.18 0.47 Army Identification 11 .82 5,538 3.81 0.57 11 .86 642 3.89 0.60 Error Orientation 21 .68 5,538 3.67 0.36 21 .63 642 3.70 0.33 Fitness Motivation 8 .81 5,538 3.73 0.64 8 .81 642 3.92 0.61 Health 13 .75 5,538 3.59 0.51 13 .76 642 3.55 0.52 Hostility to Authoritya 4 .51 5,538 1.86 0.51 4 .45 642 1.89 0.48 Mindfulness 12 .55 5,538 3.28 0.38 12 .55 642 3.34 0.36 Past Withdrawal Propensitya 8 .65 5,538 2.24 0.46 8 .68 642 2.16 0.46 Peer Leadership 6 .79 5,537 3.65 0.61 6 .79 642 3.79 0.59 Response Distortiona b 7 .71 5,538 .10 .16 7 .67 642 .06 .12 Self-Efficacy 6 .77 5,538 4.25 0.44 6 .76 642 4.28 0.40 Stress Tolerance 11 .72 5,538 3.11 0.49 11 .67 642 3.18 0.44 Tolerance to Injury 5 .75 5,538 3.6 0.75 5 .79 642 3.74 0.77 Written Communication 7 .73 5,538 3.23 0.65 7 .75 642 3.24 0.67
Note. CBEF = Cadet Background and Experiences Form. The CBEF Composite score ranges from 0 to 250. k = number of items/scales in the composite. ryy/rxx = reliability coefficient. a Negatively valanced, such that lower scores indicate a higher standing on the construct of interest. b Response distortion items have a 0-1 response scale. All other CBEF scales have a 1-5 response scale.

20
Table 10. Intercorrelations among CBEF Scales in the 2018 Advanced Camp Cohort
Scale 1 2 3 4 5 6 7 8 9 10 11 12 13 14
1 Achievement Orientation 1.00
2 Army Identification .30 1.00
3 Error Orientation .35 .28 1.00
4 Fitness Motivation .18 .25 .26 1.00
5 Health .26 .12 .20 .25 1.00
6 Hostility to Authoritya -.23 -.13 -.24 .00 -.07 1.00
7 Mindfulness .26 .26 .47 .24 .11 -.26 1.00
8 Past Withdrawal Propensitya -.31 -.44 -.43 -.24 -.06 .30 -.35 1.00
9 Peer Leadership .38 .30 .39 .24 .15 -.02 .29 .29 1.00
10 Response Distortiona b .18 .16 .28 .08 .10 -.35 .25 -.25 -.16 1.00
11 Self-Efficacy .45 .39 .54 .39 .24 -.17 .42 -.42 .47 .27 1.00
12 Stress Tolerance .12 .18 .46 .27 -.01 -.26 .50 -.41 .20 .26 .35 1.00
13 Tolerance to Injury .05 .37 .20 .45 .01 .14 .19 -.25 .22 -.03 .26 .17 1.00
14 Written Communication .37 .12 .22 .06 .15 -.09 .20 -.13 .36 .13 .21 .14 .00 1.00 Note. CBEF = Cadet Background and Experiences Form. n = 4,051 - 5,221. Bolded values indicate statistical significance at p < .05 (two-tailed). a Negatively valanced, such that lower scores indicate a higher standing on the targeted construct. b Response distortion items have a 0-1 response scale. All other CBEF scales have a 1-5 response scale.

21
Table 11. OMS Score Descriptives and Correlations with CBEF Scales for 2018 Advanced Camp Outcomes
All Cadets 4R Cadets
OMS Score Descriptives n 4,052 492
M 55.13 62.37
SD 14.84 14.10
Predictor-OMS Score Correlations CBEF Composite Score .14 .14
Achievement Orientation .29 .37 Army Identification .08 .07 Error Orientation .11 .04
Fitness Motivation .38 .33
Health .08 .08 Hostility to Authoritya -.06 -.08 Response Distortiona b -.06 -.03
Stress Tolerance .11 .05 Mindfulness .11 .06
Past Withdrawal Propensitya -.09 -.07
Peer Leadership .18 .14 Self-Efficacy .17 .14
Tolerance to Injury .13 .06 Written Communication .12 .08
Note. CBEF = Cadet Background Experience Form. WPS = Whole Person Score. k = number of items/scales in the composite. All Cadets n = 1,425 - 1,822. 4R n = 867 - 956. Response distortion items have a 0-1 response scale. All other CBEF scales have a 1-5 response scale. Bolded values indicate statistical significance at p < .05 (two-tailed). a Negatively valanced, such that lower scores indicate a higher standing on the targeted construct. b Response distortion items have a 0-1 response scale. All other CBEF scales have a 1-5 response scale.
Summary Overall, the results of the Advanced Camp analyses suggest that the CBEF demonstrated
acceptable distributional properties and reliability, with some exceptions. Similarly, the OMS demonstrated acceptable distributional properties. Both scored and unscored CBEF scales were significantly related to the OMS.

22
CHAPTER 5: SUMMARY AND FUTURE DIRECTIONS
Mark C. Young (ARI), Sean Baldwin (HumRRO), Peter J. Legree, and Robert N. Kilcullen (ARI) In this final chapter, we summarize key findings and lessons learned from ARI’s ROTC
research effort for the May 2018 to August 2019 cycle. Next, we describe some promising future directions for the program. Although our discussion focuses primarily on the testing program for four-year scholarships, the issues raised will largely generalize to other applications.
Background
ROTC is a core commissioning source for Army Officers, producing a significant portion of
individuals who ultimately serve in senior leadership positions. Thus, the four-year national ROTC scholarship program, managed by the USACC, in an integral program to the US Army for encouraging highly qualified high school seniors to become Army Officers. Each year, the USACC awards approximately 2,000 scholarships to entering ROTC students. Of these, a significant portion will eventually leave the program, especially within the first two years. Disenrollment from the scholarship program creates a significant cost to the Army in terms of lost scholarship money, lost training time/resources, and lost opportunities for awarding scholarships to others who might have otherwise completed the program and become successful Officers.
The current effort described in this report extends an ongoing program of research which
began in 2007. Our initial focus was to develop a new non-cognitive motivational measure (now called the CBEF) to help inform the award of four-year ROTC scholarships. The goal was to identify applicants who were more likely to successfully complete the ROTC program and become commissioned Officers. Prior to including the CBEF in the scholarship assessment process, there had been a heavy emphasis on the evaluation of cognitive skills (SAT/ACT scores, high school grade point average). Such skills have been consistently related to program performance outcomes (e.g., GPA and APFT), but are not predictive of program completion. Adding CBEF to the process allowed for more of a holistic assessment by capturing critical motivational attributes important to both continuance and performance in ROTC—and possibly to the Army as well.
Supporting the Award of Four-Year Scholarships
The validity evidence presented for the L18 and F17 samples show that the CBEF is
predictive of valuable outcomes to the USACC (e.g., OMS, APFT, GPA); however, we only evidenced weak incremental validity in the prediction of first-year disenrollment for four-year scholars. This is a difficult finding to reconcile, given the pervasive evidence in larger, longitudinal samples that has demonstrated stronger validity evidence for predicting disenrollment (Bynum & Young, 2020). One possible explanation of this pattern of results is sampling error. The extant research on the CBEF shows an occasional cohort whose results do not follow trends exhibited more pervasively by the across cohort group. Indeed, this very pattern is what led the current research team to construct a multi-cohort data file to examine evidence that was less susceptible to cohort idiosyncrasies. Yet, proportionally, the demographics of the F17 sample is similar to F18, suggesting that any substantive differences are

23
on metrics we currently do not gather. We suggest continuing to monitor this pattern and verifying its presence in at least one more cohort prior to examining alternate scoring methods that might improve the measure’s predictive validity.
Notwithstanding these results, the present research confirmed many of the psychometric
properties evidenced in prior research, such as acceptable estimates of scale reliability and meaningful relationships with other measures in the nomological network and criterion space. This is an impressive finding, given that the testing is taking place on such a large scale, in a very high-stakes environment, and without the benefit of proctoring (i.e., online administration). In addition, the key outcomes we are predicting (e.g., GPA, APFT, OMS) occur years after applicants complete the CBEF as a part of the scholarship application package. There are long delays between the point at which the CBEF scores are captured (during the four-year scholarship application process), the time that a Cadet begins his/her first year of college ROTC, and the maturation of the outcomes that emerge over the subsequent one, two, three, and four years of the Cadet’s pre-commissioning career.
As documented in earlier chapters, the psychometric properties of scored and unscored scales
administered on the CBEF align with previous trends. Most CBEF scales evidence adequate estimates of reliability and theoretically meaningful relationships with other related scales. Notably, some of the reliability estimates presented in this report are for experimental, unscored scales that do not contribute to the assignment of four-year ROTC scholarships. The zero-order correlation of the CBEF composite with key outcomes for the high school applicant sample and the Advanced Camp sample are weak and some are non-significant. However, incremental validity analyses show the utility of using the CBEF to predict APFT and GPA above and beyond the WPS, and to a lesser extent, continuance. Indeed, quintile plots provide some evidence of the CBEF’s utility, showing notable differences between the top and bottom percentile group’s performance and disenrollment rate. Nonetheless, the weaker incremental validity for continuance evidenced in this research has instigated efforts to re-examine the CBEF composite to improve the prediction of continuance and achieve validity coefficients comparable to those of previous, large-scale investigations. Together, the current research effort evidences a valuable selection tool for selecting ROTC four-year scholars, albeit one that we can improve upon with future research. Below, we discuss limitations of the current research and directions for future effort.
Technical Constraints to Validating the CBEF
There are several factors that constrain the observed validities of the CBEF for predicting
ROTC continuance and provide incremental validity beyond the WPS (without CBEF). One validity limitation is a function of the available applicant samples with CBEF data.
Only a small subset of newly enrolled Cadets entered ROTC under a four-year scholarship (about 2,000 out of 11,000). Out of approximately 6,000 applicants, the USACC awards approximately 2,000 scholarships each year to those with the highest WPS (with CBEF) scores. Accordingly, there is considerable range restriction on the predictor measures for those highly vetted applicants/Cadets—which constrains our validation findings. To account for the known range restriction in our prediction model, we report validity coefficients corrected for range restriction. Further, our model development has generally focused on the subset of scholarship awardees

24
(about 1,000 Cadets per academic year) who receive funding throughout the entire four years of ROTC. These are the awardees that USACC considers to be the most competitive and desirable.
A second limitation relates to the disenrollment data provided by USACC. Currently, the
Cadet disenrollment data allows us to only partially disentangle voluntary from involuntary (e.g., due to illness, death, extreme personal hardship, or academic failure) separation among Cadets. We believe that the undesired but necessary inclusion of both separation categories in our disenrollment criterion contributes to validity attenuation. This is consistent with past findings from U.S. Air Force Cadets - suggesting that weaknesses in cognitive ability have a greater impact on involuntary separation than low motivation/commitment (Mowday & Lee, 1986). In the future, we will continue to work with USACC to obtain more detailed ROTC separation codes and comments. This would provide us greater granularity in distinguishing between voluntary and involuntary separations.
Future Directions
The anticipated future directions for ARI’s ROTC research program include both
advances in assessment implementation as well as avenues for future research. The operational CBEF used in the four-year scholarship award process is not optimally
weighted relative to the WPS-without CBEF. To better leverage the valid predictive variance in the CBEF composite, we are considering a multiple hurdle approach. In the first step, the USACC would administer the CBEF without other assessments as an initial attrition screen. For example, the USACC would eliminate from further consideration applicants scoring in the lowest 20-25% of the sample. In the second step, USACC could use CBEF in combination with the remaining WPS components to compute an overall candidate order of merit score, as is currently done. This approach to selection would likely have a more positive impact on the continuance rates of scholarship awardees who later go on to become Cadets. In addition, by reducing the number of candidates who qualify in the first step, the USACC might save significant resources by reducing the number of interviews and applications required for review by the selection boards.
ARI has recently supported the USACC in their preparation to implement the On-
Campus CBEF nationwide. Each year, the USACC awards approximately 2,000 two- and three-year scholarships to freshman and sophomore Cadets who have already enrolled in ROTC, and this new CBEF version informs that award decision process. The On-Campus CBEF is similar to the one used to award four-year scholarships but designed to predict performance in ROTC. This instrument became operational in 2019. Our scoring algorithm combines applicants’ scores on this CBEF with other information currently used in the scholarship award process (e.g., selection board scores, GPA, interview, physical fitness test scores), contributing to a “whole person” assessment. We anticipate that the On-Campus CBEF might support other Cadet assessment needs (e.g., determining whether a student attends Basic Camp or informing branch assignment).
Broadly speaking, there are three avenues for future research that might help to
significantly exceed the validity limitations currently experienced in our ROTC research. In addition, there is an emerging opportunity to begin examining the relationship between CBEF scores and long-term outcomes well beyond the point of Officer commissioning.

25
Among the approaches for enhancing validity, one involves using the existing CBEF, but applying a new scoring approach. This avenue of investigation has demonstrated that the use of profile similarity metrics (PSMs) can significantly increase the criterion-related validity of CBEF scales relative to the currently used conventional scoring approach (Legree, Ness, Kilcullen & Koch, 2019; Legree, Purl, Kilcullen, & Young, 2019). In this method, analysts optimally weight individual difference scores (against a key) for each applicant to create scale and composite scores for predicting targeted criteria. These investigations have involved ROTC Cadets, and the prediction of training and school performance outcomes (OML, APFT scores, and GPA), which are of great importance to USACC. This research is continuing and shows promise for our ability to significantly boost the operational validity of the CBEF.
A second avenue for our investigations is expanding the number of constructs assessed
by the CBEF. For example, we have begun the process of developing items that capture military knowledge and military commitment propensity among several other scales created in the current contract period and proposed for further development and evaluation. We administered three such constructs in 2019, and validation analyses of their utility are forthcoming. Other constructs will be slated for administration in future Advanced Camp sessions. Together, we recognize the promise of new content for enhancing the prediction of ROTC continuance. We anticipate that the exploration and testing of new constructs will be ongoing.
Third, we are also considering alternative measurement approaches for future research.
For example, we might consider an implicit approach to predictor measurement (e.g., a conditional reasoning test) to improve the measurement of some scales, which are otherwise fairly transparent to respondents.
While the initial focus of our research program was to investigate the validity of the
CBEF against relatively short-term outcomes (e.g., ROTC continuance and performance) it is now becoming possible to examine CBEF’s validity against relatively long-term post-commissioning outcomes. These include Officers’ continuance to and beyond their Active Duty Service Obligation (ADSO),5 as well as performance outcomes such as promotion rates and awards.6 Because CBEF testing of scholarship applicants under operational conditions began in 2010 (for the 2011/2012 academic year), applicants who were originally tested at that time could now have reached the point of their four-year ADSO. In addition, Cadets who (as rising seniors) we first tested under our annual Summer Advanced Camp testing program in 2010, will have had the opportunity to have served up to 9 years as junior Officers. This is well beyond the point of their ADSO, and some within this cohort will have already reached the rank of Major (O4). We are in the process of validating the CBEF against these critical post-commissioning outcomes (including supervisor performance ratings) under a related project focused on the Officer branching process (Legree, Purl, Kilcullen, & Young, 2019). The objective is to extend and expand the utility of the CBEF by creating scales that are more centered on predicting Officer performance across and within the Army Officer branches. The findings will better inform the optimal use of this measure for enhancing the Army’s future Officer corps.
5 This obligation is four years for those receiving the four-year national ROTC scholarship. 6 Army personnel data files capture such outcomes on an ongoing basis.

26
REFERENCES
Allen, M. T., Bynum, B. H., Erk, R. T., Babin, N. E., & Young, M. C. (Eds.). (2014). Selecting soldiers and civilians into the U.S. Army Officer Candidate School: Developing empirical selection composites (ARI Technical Report 1343). U.S. Army Research Institute for the Behavioral and Social Sciences.
Allen, M. T., & Young, M. C. (Eds.). (2012). Longitudinal validation of non-cognitive officer selection measures for the U.S. Army Officer Candidate School (OCS) (ARI Technical Report 1323). U.S. Army Research Institute for the Behavioral and Social Sciences.
Ashford, S. J., & Tsui, A. S. (1991). Self-regulation for managerial effectiveness: The role of active feedback seeking. Academy of Management Journal, 34(2), 251-280. http://www.jstor.org/stable/256442
Bynum, B. H., & Young, M. C. (Eds.). (2020). Validation of the Cadet Background and Experience Form (CBEF) to support Army ROTC personnel assessment (2015-2018) (ARI Technical Report 1383). U.S. Army Research Institute for the Behavioral and Social Sciences. DTIC No AD1107158.
Burket, G. R. (1964). A study of reduced rank models for multiple prediction. Psychometric Monograph (No. 12). doi:10.21236/ad0441337
Charbonnier-Voirin, A., El Akremi, A., & Vandenberghe, C. (2010). A multilevel model of transformational leadership and adaptive performance and the moderating role of climate for innovation. Group & Organization Management, 35(6), 699-726. doi: 10.1177/1059601110390833
Chase, J. A. (2010). The additive effects of values clarification training to an online goal-seeing procedure on measures of student retention and performance. (Doctoral dissertation). Retrieved from ProQuest Dissertations & Theses Global (744298996).
Cohen, J. (1988). Statistical power analysis for the behavioral sciences (2nd ed.). Hillsdale, NJ: Erlbaum.
NJ: Erlbaum.Credé, M., Tynan, M. C., & Harms, P. D. (2017). Much ado about grit: A meta-analytic synthesis of the grit literature. Journal of Personality and Social Psychology, 113(3), 492-511. https://doi.org/10.1037/pspp0000102
Duckworth, A., Peterson, C., Matthews, M., & Kelly, D. (2007). Grit: Perseverance and passion for long-term goals. Journal of Personality and Social Psychology, 92(6), 1087-1101. doi: 10.1037/0022-3514.92.6.1087
Eskreis-Winkler, L., Shulman, E. P., Beal, S. A., & Duckworth, A. L. (2014). The grit effect: Predicting retention in the military, the workplace, school and marriage. Frontiers in Psychology, 5, 1-12. https://doi.org/10.3389/fpsyg.2014.00036

27
Fraley, R. C., & Brumbaugh, C. C. (2004). A dynamical systems approach to conceptualizing and studying stability and change in attachment security. In W. S. Rholes & J. A. Simpson (Eds.), Adult attachment: Theory, research, and clinical implications (pp. 86–132). New York: Guilford Press
Fraley, R. C., Hudson, N. W., Heffernan, M. E., & Segal, N. (2015). Are adult attachment styles categorical or dimensional? A taxometric analysis of general and relationship-specific attachment orientations. Journal of Personality and Social Psychology, 109(2), 354–368. doi: 10.1037/pspp0000027
Friedman, B. A., & Mandel, R. G. (2009). The prediction of college student academic performance and retention: Application of expectancy and goal setting theories. Journal of College Student Retention: Research, Theory & Practice, 11(2), 227-246. DOI: 10.2190/CS.11.2.d
Geller, D., & Bamberger, P. (2009). Bringing avoidance and anxiety to the job: Attachment style and instrumental helping behavior among co-workers. Human Relations, 62(12), 1803-1827. doi: 10.1177/0018726709337524
Harms, P. D. (2011). Adult attachment styles in the workplace. Human Resource Management Review, 21(4), 285-296. https://digitalcommons.unl.edu/managementfacpub/81
Hellevik, O. (2009). Linear vs logistic regression when the dependent variable is a dichotomy. Qual Quant., 43(1), 59-74. doi:10.1007/s11135-007-9077-3
Karabenick, S. A. (2003). Seeking help in large college classes: A person-centered approach. Contemporary Educational Psychology, 28, 37-58. https://doi.org/10.1016/S0361-476X(02)00012-7
Latham, G., Seijts, G., & Slocum, J. (2016). The goal setting and goal orientation labyrinth: Effective ways for increasing employee performance. Organizational Dynamics, 45, 271-277. doi: 10.13140/RG.2.1.2692.4888
Legree, P. J., Ness, A. M., Kilcullen, R. N., & Koch. A. J. (2019). Enhancing the validity of rating-based tests (ARI Technical Report 1371). U.S. Army Research Institute for the Behavioral and Social Sciences. DTIC No ADA1066057.
Legree, P. J., Purl, J., Kilcullen, R. N., & Young, M. C. (2019, April). Cadet training and personality metrics predict officer performance ratings: R = .33. Paper presented at the 34th Annual Conference of the Society for Industrial Organizational Psychology, Washington, DC, United States.
Locke, E. A., & Latham, G. P. (1990). Theory of goal setting and performance. Prentice Hall.
Mahalanobis, P. C. (1936). On the generalized distance in statistics. Proceedings of the National Institute of Sciences (Calcutta), 2, 49–55.

28
Morisano, D., Hirsh, J. B., Peterson, J. B., Pihl, R. O., & Shore, B. M. (2010). Setting, elaborating, and reflecting on personal goals improves academic performance. Journal of Applied Psychology, 95(2), 255-264. doi: 10.1037/a0018478
Morrison, E. W. (1993). Newcomer information seeking: Exploring types, modes, sources, and outcomes. Academy of Management Journal, 36(3), 557-589. doi: 10.2307/256592
Morrison, R. F., & Hall, D. T. (2002). Career adaptability. In D. T. Hall (Ed.), Careers in and out of organizations (pp. 205-234). Sage.
Mowday, R. T., & Lee, T. W. (1986, August). The influence of propensity to become committed in the development of commitment and prediction of turnover during organizational entry. Academy of Management Proceedings, 193-197.
Ployhart, R. E., & Bliese, P. D. (2006). Individual ADAPTability (I-ADAPT) theory: Conceptualizing the antecedents, consequences, and measurement of individual differences in adaptability. In C. S. Burke, L. G., Pierce, & E. Salas (Eds.), Understanding adaptability: A prerequisite for effective performance within complex environments (pp. 3-40). Amsterdam, London: Elsevier.
Putka, D. J., Beatty, A. S., & Reeder, M. C. (2018). Modern prediction methods: New perspectives on a common problem. Organizational Research Methods, 21(3), 689-732. https://doi.org/10.1177/1094428117697041
Rauch, L. (2016). Stigma, negative attitudes, and help-seeking behaviors among military service members. (Doctoral dissertation). Retrieved from ProQuest Dissertations & Theses Global (1964842296).
Reed, H. (2016). Goal setting and engagement: An exploration of vigor, dedication, and absorption in the workplace. (Doctoral dissertation). Retrieved from ProQuest Dissertations & Theses Global (1767779403).
Russell, T.L., Allen, M.T., & Babin, N.E. (2011). Measures for selecting Soldiers for the Officer Candidate School (OCS): Phase II (FR-10-66a). Human Resources Research Organization.
Russell, T.L., & Tremble, T.R. (Eds.) (2011). Development and validation of measures for selecting soldiers for the Officer Candidate School (Study Note 2011-02). U.S. Army Research Institute for the Behavioral and Social Sciences.
Schunk, D. H. (2004). Learning theories: An educational perspective. Pearson.
Urdan, T., & Mestas, M. (2006). The goals behind performance goals. Journal of Educational Psychology, 98(2), 354. doi: 10.1037/0022-0663.98.2.354
Wang, M., Zhan, Y., McCune, E., & Truxillo, D. (2011). Understanding newcomers’ adaptability and work-related outcomes: Testing the mediating roles of perceived P-E fit variables. Personnel Psychology, 64, 163-189. doi: 10.1111/j.1744-6570.2010.01205.x

29
White, L. A., Nord, R. D., Mael, F. A., & Young, M. C. (1993). The assessment of background and life experiences (ABLE). In T. Trent & J. H. Laurence (Eds.), Adaptability screening for the armed forces. Office of Assistant Secretary of Defense (Force Management and Personnel).
White, L. A., Young, M. C., & Rumsey, M.G. (2001). Assessment of Background and Life Experiences (ABLE) implementation issues and related research. In J. P. Campbell (Ed.), Exploring the Limits in Personnel Selection and Classification. Erlbaum.
Zorzie, M. (2012). Individual adaptability: Testing a model of its development and outcomes. (Doctoral dissertation). Retrieved from ProQuest Dissertations & Theses Global (1011330146).

30
APPENDIX A
VALIDATION OF OBEF AGAINST LONG-TERM CRITERIA AMONG OFFICER CANDIDATE SCHOOL (OCS) CANDIDATES
Jennifer P. Green, Timothy Burgoyne, and Michael Wilmot (HumRRO)
Background The U.S. Army Research Institute for the Behavioral and Social Sciences (ARI) has a
broad effort to identify, develop, and validate personnel tests for use in the selection of Officers. Officer Candidate School (OCS) is an important commissioning source for Army Officers. Historically, the Army has used OCS to fill accession gaps in Officer requirements when other commissioning sources were unable to meet force structure needs. Compared to ROTC and the U.S. Military Academy (USMA), OCS is flexible enough to increase or decrease its rate of commissioning Officers on short notice.
The Officer Background and Experience Form (OBEF) is a parallel form of the CBEF
and includes measures of temperament, values, and other non-cognitive characteristics thought to be important for predicting Officer continuance and performance. The OBEF was developed to supplement the Army’s primary instrument for selecting Cadets for OCS—the Armed Services Vocational Aptitude Battery (ASVAB)—a measure of applicants’ knowledge and aptitude in domains such as mathematics and word knowledge. The OBEF was administered to three cohorts of OCS Cadets in 2008, 2010, and 2011, and these samples have been tracked longitudinally over time.
The primary goal of this chapter is to conduct validation analyses to evaluate the
relationship between the OBEF and post-commissioning continuance and performance among OCS candidates and Officers. Because it has required several years for OCS samples to mature and move through the Officer career lifecycle, the long-term career outcomes sought for this longitudinal research have only recently reached fruition. Results of these validation analyses are summarized and could be used to inform the refinement of the CBEF to predict long-term continuance and performance among ROTC commissioned Officers. Results are important for supplementing the validation findings from ROTC Cadets and Officers, because many of these ROTC research samples have not yet reached the same level of maturity in their military careers.
OCS Longitudinal Data Sample
Phase 1 of the OCS research began in 2008 and involved developing the OBEF and
collecting data from 1,349 Officer candidates from 10 OCS classes (Russell & Tremble, 2011). Follow-up work conducted in Phase 2 expanded on Phase 1 results (Russell, Allen, & Babin, 2011). Modifications were made to the OBEF and it was administered to 807 candidates in five OCS classes in 2010. Phase 3 mirrored procedures of Phase 2 and the OBEF was further updated (e.g., adding five scales) and administered to 459 candidates in five OCS classes in 2011.

31
Consistent with Phase 1, Phase 2, and Phase 3, we report results and conduct the analyses separately on in-service and enlistment option samples. We classified candidates who indicated that they were “an enlisted Army Soldier” prior to starting OCS as in-service, and those who indicated that they were “a civilian with no prior military service” as enlistment option. Candidates that indicated they were “an enlisted Service member from another branch of the Armed Services,” “a civilian with prior military service,” or “a civilian who was previously enrolled in ROTC or at West Point” were classified as hybrid. Consistent with prior reports, results for continuance analyses are only reported for the enlistment and in-service samples. When continuance outcomes are analyzed by sub-groups (by cohort, by attrition time), the sample size for the hybrid group becomes too small to make meaningful interpretations. Thus, we do not report continuance analyses for the hybrid group. Due to a greater coverage of performance outcome data, performance analyses are presented for all three options. The current compiled data file contained a total of 2,500 cases. Sample sizes by cohort and sample type are presented in Table A-1. Table A-1. Sample Sizes and Data Sources by Cohort and Sample
Cohort In- Service
Enlistment Option
Hybrid or Unknown Total
2008 557 520 272 1,349
2010 200 417 117 734
2011 29 304 84 417
Total 786 1,241 473 2,500
Predictors of Officer Continuance and Performance
Officer Background and Experience Form (OBEF) Scales One purpose of our validation analyses is to refine the CBEF; as a result, we focused on
OBEF measures, which parallel the ROTC operational and experimental CBEF scales. OBEF constructs and their CBEF equivalents are presented in Table A-2, along with the OCS cohorts to which these OBEF scales were administered.
In addition, we calculated two composites focused on predicting continuance and
predicting performance. These composites were developed in Phase 3 of the OCS research to balance prediction of key criteria and parsimony (for more information on the composite development, see Allen, Bynum, Erk, Babin, & Young, 2014).7 Given the small in-service sample size in Phase 3 (n = 29), and that the initial composite formation analyses were conducted for the enlistment option only (Allen et al., 2014), the composites were created for the enlistment option only. However, given the small proportion of the enlistment option sample that had
7 These composites include two other RBI scales (Tolerance for Ambiguity, Goal Expectations) not listed in Table 1, as these OBEF scales did not have parallel CBEF scales. All of the RBI scales included in the composites were administered to only the Phase 3 sample, and thus, the composite scores could not be calculated for samples from other phases.

32
composites and continuance data, these composites were only included in the correlational analyses.
Table A-2. OBEF and CBEF Scale Comparison across Cohorts
Cohorts
OBEF Scale CBEF Scale 2008 2010 2011
Achievement Achievement x x
Army Affective Commitment Army Identification x x x
Equity Sensitivity Equity Sensitivity x x
Fitness Motivation Fitness Motivation x x x
Hostility to Authority Hostility to Authority x x x
Interest in Leadership Interest in Leadership x x
Peer-Leadership Peer-Leadership x x x
Response Distortion Response Distortion x x x
Self-Efficacy Self-Efficacy x x x
Stress Tolerance Stress Tolerance x x x
Tolerance for Injury Tolerance for Injury x x
Continuance Composite x
Performance Composite x
Armed Forces Qualification Test (AFQT) OBEF predictors that add validity beyond the prediction already afforded by Armed
Forces Qualification Test (AFQT; a composite derived from the ASVAB) are more likely to prove useful for selection purposes. Accordingly, the AFQT was also included in the descriptive statistics of predictors and the validation analyses.
The descriptive statistics and intercorrelations among the AFQT and OBEF scales for all
cases in the Officer Master File (OMF), regardless of whether they have continuance data, are found in Tables A.3, A.4, and A.5. Results for in-service, enlistment, and hybrid options are presented in Tables A.3, A.4, and A.5 respectively.

33
Table A-3. Sample Descriptive Statistics and Intercorrelations for Scales in the In-Service Sample
Descriptive Statistics Intercorrelations
n M SD 1 2 3 4 5 6 7 8 9 10 11 12 13
1 AFQT 727 70.31 19.56 1.00
Core RBI Scales
2 Achievement 224 4.13 .58 -.15 1.00
3 Army Affective Commitment 626 3.79 .64 -.18 .46 1.00
4 Equity Sensitivitya 224 2.35 .64 .07 -.32 -.35
5 Fitness Motivation 626 3.65 .62 .07 .34 .18 -.20 1.00
6 Hostility to Authoritya 626 1.71 .45 .10 -.40 -.21 .47 -.01 1.00
7 Interest in Leadership 224 3.90 .73 -.08 .44 .34 -.16 .41 -.23 1.00
8 Leader Self-Efficacy 224 4.14 .47 -.19 .59 .47 -.20 .41 -.44 .65 1.00
9 Peer Leadership 626 3.86 .58 -.07 .63 .35 -.04 .29 -.14 .50 .58 1.00
10 Response Distortiona 775 .14 .18 -.30 .16 .19 -.23 .20 -.31 .17 .28 .15 1.00
11 Self-Efficacy 626 4.37 .47 -.16 .61 .38 -.20 .31 -.27 .53 .68 .53 .25 1.00
12 Stress Tolerance 626 3.17 .54 .16 .14 .17 -.38 .20 -.36 .25 .22 .09 .17 .21 1.00
13 Tolerance for Injury 224 3.54 .64 .16 .26 .34 -.12 .39 -.01 .28 .31 .28 -.11 .27 .21 1.00 Note. Bolded values indicate statistical significance at p < .05 (two-tailed). a Negatively valanced, such that lower scores indicate a higher standing on the targeted construct.

34
Table A-4. Sample Descriptive Statistics and Intercorrelations for Scales in the Enlistment Option Sample
Descriptive Statistics Intercorrelations
n M SD 1 2 3 4 5 6 7 8 9 10 11 12 13 14 15
1 AFQT 1,236 88.14 9.70 1.00
Core RBI Scales
2 Achievement 708 4.19 .47 .06 1.00
3 Army Affective Commitment 1,078 3.90 .62 -.10 .35 1.00
4 Equity Sensitivitya 708 2.38 .58 -.02 -.23 -.29 1.00
5 Fitness Motivation 1,078 3.83 .62 -.01 .23 .22 -.16 1.00
6 Hostility to Authoritya 1,078 1.83 .49 .01 -.23 -.18 .39 -.07 1.00
7 Interest in Leadership 708 3.88 .71 -.04 .37 .28 .01 .23 -.03 1.00
8 Leader Self-Efficacy 708 4.07 .44 -.06 .45 .33 -.05 .29 -.12 .65 1.00
9 Peer Leadership 1,078 3.97 .55 -.07 .45 .26 -.06 .30 -.09 .56 .66 1.00
10 Response Distortiona 1,222 .10 .16 -.17 .20 .15 -.23 .11 -.31 .16 .25 .20 1.00
11 Self-Efficacy 1,078 4.32 .49 -.04 .45 .28 -.17 .37 -.18 .47 .63 .51 .24 1.00
12 Stress Tolerance 1,078 3.30 .53 .02 .06 .19 -.38 .22 -.35 .13 .21 .15 .29 .32 1.00
13 Tolerance for Injury 708 3.73 .63 -.03 .17 .37 .00 .42 .00 .28 .26 .21 .12 .35 .22 1.00
RBI Composites
14 Continuance Composite 295 .19 .73 -.07 .37 .96 -.12 .28 -.15 .35 .44 .37 .20 .45 .24 .50 1.00
15 Performance Composite 295 .24 .68 -.06 .30 .32 -.15 .95 -.20 .30 .45 .37 .20 .44 .36 .51 .44 1.00 Note. Bolded values indicate statistical significance at p < .05 (two-tailed). a Negatively valanced, such that lower scores indicate a higher standing on the targeted construct.

35
Table A-5. Sample Descriptive Statistics and Intercorrelations for Scales in the Hybrid Sample
Descriptive Statistics Intercorrelations
n M SD 1 2 3 4 5 6 7 8 9 10 11 12 13
1 AFQT 348 81.68 11.58 1.00
Core RBI Scales
2 Achievement 184 4.09 0.55 .12 1.00
3 Army Affective Commitment 357 3.87 0.64 .06 .41 1.00
4 Equity Sensitivitya 184 2.25 0.62 .01 -.31 -.31 1.00
5 Fitness Motivation 357 3.78 0.63 .09 .24 .19 -.20 1.00
6 Hostility to Authoritya 357 1.74 0.47 .04 -.29 -.15 .47 -.09 1.00
7 Interest in Leadership 184 3.92 0.67 -.02 .42 .27 -.19 .17 -.03 1.00
8 Leader Self-Efficacy 184 4.09 0.47 -.07 .52 .36 -.25 .28 -.12 .66 1.00
9 Peer Leadership 357 3.90 0.62 .00 .55 .25 -.28 .29 -.09 .57 .66 1.00
10 Response Distortiona 415 0.11 0.14 -.08 .07 .02 -.10 .15 -.39 -.07 .07 .11 1.00
11 Self-Efficacy 357 4.30 0.53 -.05 .67 .33 -.28 .35 -.24 .50 .65 .57 .15 1.00
12 Stress Tolerance 357 3.32 0.52 .03 .06 .15 -.29 .12 -.34 .07 .13 .05 .24 .21 1.00
13 Tolerance for Injury 184 3.62 0.67 .21 .23 .25 -.07 .35 .14 .31 .31 .32 -.15 .38 .10 1.00 Note. Bolded values indicate statistical significance at p < .05 (two-tailed). a Negatively valanced, such that lower scores indicate a higher standing on the targeted construct.

36
Criteria of Officer Continuance and Performance Continuance is most analogous to turnover in the civilian sector. Alongside continuance,
performance is an important criterion of interest to the Army. To evaluate the relationship between the OBEF and post-commissioning continuance among OCS candidates, we created a separation reason variable, a dichotomous separation variable, and a set of attrition variables specific to separation at certain time points. To evaluate the relationship between the OBEF and post-commissioning performance, we created variables based on two performance outcomes: awards received and time to promotion to 1st Lieutenant and Captain.
Archival Data Extracts
In a previous longitudinal validity project (Allen & Young, 2012), administrative data
was collected from four sources: (a) Defense Manpower Data Center (DMDC), (b) Human Resources Command (HRC), (c) the Officer Master File (OMF), and (d) Army Training Requirement & Resource System (ATRRS). We used data from these four sources to examine relationships to the criteria of Officer continuance and performance.
Concerning continuance, we used the administrative data to identify whether an Officer
had (a) joined active duty service or went directly to the Army National Guard or Army Reserves after commissioning from OCS, and (b) separated from active duty service. If an Officer had separated from active duty service, we also used these data to identify the reason for separation.
Concerning performance, we used administrative data from the OMF, which includes key
performance information on Officer accessions, promotions, assignments, and changes in status. For our validation analyses, we focused on two key performance outcomes: (a) awards received and (b) days to promotion to the rank of 1st Lieutenant and, when relevant, Captain.
In 2014, we requested an additional extract of data to continue to track separation of the
OCS Officers in the 2008, 2010 and 2011 cohorts. Upon review of the data sources from 2012, we determined that the HRC data added minimal additional information that was not already provided by DMDC and OMF, and given the administrative constraints of requesting and receiving HRC data, we decided to only request DMDC and OMF data for the 2014 extracts. We requested a third extract in 2018, but we were unable to obtain DMDC data; thus, we used only OMF data and created a third set of separation variables for the 2008, 2010, and 2011 cohorts.
Separation Reason Variable
To create the separation variables, we used variables from the OMF data that included the
separation date and separation program designators (SPDs). SPD codes include the reason for which an Officer separated from active duty service; we used these codes to create a separation reason variable. However, due to differences in sources of administrative data across the three extracts (2012: DMDC, HRC, OMF; 2014: DMDC, OMF; 2018: OMF), the separation reason variables were not always consistent. In response, we created a separation reason variable that reconciled separation reasons across the three extracts.

37
Accordingly, this procedure resulted in eight possible separation reasons: 1. Attrition – Officer separated from the Army prior to completing their ADSO for
moral (e.g., violation of Uniformed Code of Military Justice), performance (e.g., not meeting fitness standards), or other pejorative reasons.
2. Injury – Officer separated from the Army prior to completing their ADSO for a non-pejorative reason, usually an injury sustained while on active duty.
3. Did Not Commission – Records indicate that the individual never received their commission, but remains in the Army as an enlisted soldier.
4. End of ADSO – Officer separated from the active duty service after completing their ADSO.
5. Army Guard or Reserve at OCS – Some individuals in our sample attended OCS, but were sponsored by a National Guard unit or the U.S. Army Reserve.
6. Currently Army Guard or Reserve. 7. Retired from the Army. 8. Separation Reason Unknown.
Table A-6. provides the frequency of separation reasons for the in-service and enlistment
option samples. Dichotomous Separation Variable
The separation reason variable was used to set a dichotomous separation variable for
analyses: (a) separated from active duty (scored as “1”) and (b) current active duty Officer (scored as “0”). Some separation reasons were excluded because the reason for separation was outside of the Officer’s control (e.g., injury) and/or the Officer was not active duty (e.g., Army Guard or Reserve). The base rates for the in-service and enlistment option samples for the dichotomous separation variable are in Table A-6. One in-service case and five enlistment option cases had separation dates, but also had active duty status. Due to the conflicting nature of these cases, we filtered them out of validation analyses; they are not presented in any tables or results. Attrition by Time Variables
We also created attrition by time variables to provide snapshots of separation at various
time points after an Officer was commissioned. To do this, we took the difference between the date an Officer was commissioned as a 2nd Lieutenant and the date the Officer separated. Officer separation was operationalized as the date of separation provided in the extract. The attrition variables were created at six-month increments and represent whether an Officer separated by that time, accounting for the length of possible service time given an Officer’s commission date. For example, if the difference between an Officer’s commission and separation dates was 18 months, then that Officer would be considered as “not separated” at 6- and 12-month time points, but as “separated” at 18-months. The Officer would be considered as “separated” up until their possible time in service. Possible time in service was operationalized as the difference between when an Officer was commissioned as a 2nd Lieutenant and the data extract date. Again, using

38
the previous example, if the Officer’s possible time in service was 26 months, that Officer would be considered as “separated” at both the 18- and 24-month intervals.
OCS commissioned Officers are required to complete an 8-year service obligation, with a
3- to 4-year ADSO. Traditionally, few Officers separate before the end of their ADSO (Allen & Young, 2012). Because of the small number of separations after 6-years, validation analyses focus on attrition between 3- and 6-years, with yearly increments. The attrition rates for the in-service and enlistment option samples between 3-years and 6-years are presented in Table A-7.

39
Table A-6. Separation Status and Dichotomous Separation Variables by Sample
In-Service (n = 785) Enlistment (n = 1,236)
Separation Reason Variable n % n %
Current Active Duty Officer 458 58.34 476 38.51
Separated: Attrition 71 9.04 148 11.97
Separated: Injury 55 7.01 56 4.53
Separated: Did not Commission as Officer/NCO 6 0.76 4 0.32
Separated: End of ADSO 41 5.22 296 23.95
Army Guard or Reserve at OCS 18 2.29 30 2.43
Currently Army Guard or Reserve 31 3.95 158 12.78
Separated: Retired 41 5.22 -- --
Separated: Reason Unknown 54 6.88 63 5.10
Missing: No Status 10 1.27 5 0.40
Dichotomous Separation Variable In-Service (n = 785) Enlistment (n = 1,236)
Current Active Duty Officer 458 58.34 476 38.51
Separations: Attrition, Did not commission, End of ADSO, or Reason Unknown 172 21.91 511 41.34
Missing or Other (Injury, Army Guard, Reserve, or Retired) 155 19.75 249 20.15 Note. Separation status as of data extraction date of May 2018. One in-service case and five enlistment option cases had separation dates but also had active duty status. Due to the conflicting nature of these cases, these cases were filtered out of analyses and are not presented in the results

40
Table A-7. Separation Status by Attrition Times 36 months 48 months 60 months 72 months
n % n % n % n %
In-Service (N = 785)
Current Active Duty Officer 586 96.2 558 91.6 532 87.6 515 86.1 Separated: Attrition, Did not commission, End of ADSO, or Reason Unknown 23 3.8 51 8.4 75 12.4 83 13.9
Missing: Separation reason not included in analyses (Injury, Army Guard, Reserve, or Retired) 145 -- 145 -- 145 -- 145 --
Missing: Cases do not have promotion date and/or separation date 21 -- 21 -- 21 -- 21 --
Missing: No status 10 -- 10 -- 10 -- 10 --
Missing: Time in Service is less than the given number of months 0 -- 0 -- 2 -- 11 --
Total 785 100 785 100 785 100 785 100
Enlistment Option (N = 1,236)
Current Active Duty Officer 853 90.9 713 76.0 597 66.6 547 67.9 Separated: Attrition, Did not commission, End of ADSO, or Reason Unknown 85 9.1 225 24.0 299 33.4 259 32.1
Missing: Separation reason not included in analyses (Injury, Army Guard, Reserve, or Retired) 244 -- 244 -- 244 -- 244 --
Missing: Cases do not have promotion date and/or separation date 49 -- 49 -- 49 -- 49 --
Missing: No status 5 -- 5 -- 5 -- 5 --
Missing: Time in Service is less than the given number of months 0 -- 0 -- 42 -- 132 --
Total 1,236 100 1,236 100 1,236 100 1,236 100 Note. Separation status as of data extraction date of May 2018.

41
Awards Variables To determine in-unit Officer performance, first, we used the total number of medals each
Officer received. Officers can be awarded medals for several reasons, including deploying (e.g., Afghanistan Campaign Medal), serving on active duty (e.g., National Defense Service Medal), and meritorious service (e.g., Army Commendation Medal). Nevertheless, only medals awarded for meritorious service and valor were “counted” towards the awards variables for our validation analyses (cf. Allen & Young, 2012).
We constructed the awards variables in two ways. First, we created a variable that was
the total sum of the number of qualifying medals that an Officer received. Second, recognizing that some medals are more difficult to achieve than others, we created a second variable that differentially weighted these qualifying awards. To compute the award weights, we consulted the Promotion Points Worksheet for Non-Commissioned Officers (Army Regulation 600-8-19). The awards, along with their associated weights, are presented in Table A-8 (for more information about these medals, consult Army Regulation 600-8-22).
Table A-8. Valor and Merit Awards with Associated Weights
Valor Merit
Award Weight Award Weight Distinguished Service Cross 35 Meritorious Service Medal 25
Silver Star 35 Defense Meritorious Service Medal 25
Medal of Honor 35 Army Commendation Medal 30
Distinguished Flying Cross 35 Distinguished Service Medal 35
Bronze Star Medal with Combat Distinguishing Device V
30 Defense Distinguished Service Medal 35
Army Commendation Medal with Combat Distinguishing Device V
20 Joint Service Achievement Medal 15
Joint Service Commendation Medal with Combat Distinguishing Device V
20 Joint Service Commendation Medal 20
Next, to facilitate comparisons across accession options, we standardized these two raw
award variables within branch. Standardization was necessary because some branches offer more awards than others. For example, Officers in combat-oriented branches (e.g., Infantry) are more likely to receive medals than those in more support-related branches (e.g., Signal Corps and Finance Corps). Although there are multiple ways to classify Army branches (see Army Regulation 600-3), for the purposes of our analyses, we standardized the raw awards variables by the three traditional branch categories: (a) Combat Arms, (b) Combat Support, and (c) Combat Service Support (see also Allen & Young, 2012). Promotion Variables
Second, in unit-performance was also determined based on Officers’ time to promotion to ranks of 1st Lieutenant and, when relevant, Captain. To create promotion variables, we took the

42
difference between the date an Officer was commissioned as a 2nd Lieutenant and the date the Officer was promoted. Raw time to promotion variables were created for ranks of 1st Lieutenant and Captain.8 To control for the potential confounding effects of branch, the two raw promotion variables were standardized within branch. After standardizing within branch, we standardized within commissioning years to account for the force increase that took place between 2003-2010, because time to promotion was likely shorter during that time period.
Table A-9 provides descriptive statistics for the awards and promotion performance
variables by accession options. Table A-9. Performance Variables by Accession Option
In-Service Enlistment Hybrid n M SD n M SD n M SD
Awards Raw Total Awards 786 1.96 1.81 1241 1.04 1.43 423 1.27 1.54 Raw Weighted Awards 786 40.55 38.54 1241 21.37 30.25 423 26.17 32.67 Std. Total Awards 786 .22 1.26 1241 -.12 .85 423 -.06 .81 Std. Weighted Awards 786 .20 1.27 1241 -.11 .86 423 -.06 .76
Promotions Raw Promotion to 1LT 705 551.39 34.91 993 550.12 20.85 316 549.26 46.26 Raw Promotion to CPT 633 787.08 107.85 745 824.73 98.46 260 810.12 116.98 Std. Promotion to 1LT 705 -.02 .86 993 .02 .84 316 -.01 1.61 Std. Promotion to CPT 633 -.06 .95 745 .03 .98 260 .04 1.17
Note. "Std." = Standardized; standardization was completed by branch category (Combat Arms, Combat Support, Combat Services Support) for awards and promotions. Promotion variables were then standardized by cohort.
Results
Correlations with Continuance Outcomes Tables A.10 and A.11 present correlations of the AFQT, OBEF scales, and continuance
outcomes for in-service and enlistment option samples, respectively. Because the continuance outcomes are dichotomous, with 1 representing Separation and 0 representing No separation/ Currently active duty, these coefficients are point-biserial correlations. Positive correlations indicate that higher values on the predictor are associated with Officer attrition whereas negative correlations are associated with Officer continuance/retention.
For both the in-service and enlistment option samples, Army Affective Commitment
showed strong correlations across several continuance outcomes. Specifically, for the in-service sample, Army Affective Commitment correlated negatively with the dichotomous separation variable (r = -.15) and with separation at all points in time (i.e., attrition at 36, 48, 60, and 72
8 Due to differences in sources of administrative data across the three extracts (2012: DMDC, HRC, OMF; 2014: DMDC, OMF; 2018: OMF), the promotion dates were not always consistent. In response, we reconciled promotion dates across the three extracts, using the earliest extract in which a promotion date was provided for each Officer.

43
months). Similarly, for the enlistment option, Army Affective Commitment correlated negatively with the dichotomous separation variable (r = -.10) and separation at 72 months (r = -.09).
By comparison, Equity Sensitivity showed positive relationships with separation for the
in-service sample (r = .18), with significant correlations at 48, 60, and 72 months. Equity Sensitivity is negatively valenced, such that lower scores indicate more favorable standing. That is, lower scores on the equity sensitivity scale were associated with fewer separations. However, caution should be taken when interpreting these correlations because the Equity Sensitivity scale was only administered to the 2010 and 2011 cohorts. As a result, the number of Officers in these cohorts who separated were minimal for the in-service sample (e.g., out of the sample of 170-181 individuals, only 9-28 individuals separated, and the rest remained on active duty).
For the in-service sample, higher AFQT scores correlated positively with separation
(r = .15), particularly at 48 months (r = .12), and after. However, these relationships were not as strong within the enlistment option sample. Table A-10. Correlations between Predictors and Separation Outcomes for In-Service Sample across Cohorts
Dichotomous
Separation Variable
Attrition: 36 months
Attrition: 48 months
Attrition: 60 months
Attrition: 72 months
n = 609 n = 589 n = 589 n = 587 n = 578 AFQT .15 .08 .12 .10 .11 n = 182-622 n = 181-602 n = 181-602 n = 179-600 n = 170-591
OBEF Scales
Achievement -.08 -.08 -.03 -.08 -.10 Army Affective Commitment -.15 -.14 -.21 -.20 -.16 Equity Sensitivitya .18 .11 .21 .22 .21 Fitness Motivation .09 -.01 -.04 .01 .03 Hostility to Authoritya .00 .04 .03 .07 .03 Interest in Leadership -.04 -.04 -.04 -.01 -.10 Leader Self-Efficacy -.02 -.11 -.04 -.03 -.06 Peer Leadership -.04 -.01 .02 -.01 -.04 Response Distortiona -.03 .01 -.05 -.04 -.01 Self-Efficacy -.04 .00 .00 -.03 -.05 Stress Tolerance -.05 .00 -.07 -.09 -.08 Tolerance for Injury -.09 -.01 -.06 -.08 .00
Note. Bolded values indicate statistical significance at p < .05 (two-tailed). a Negatively valanced, such that lower scores indicate more favorable standing on the construct of interest.

44
Table A-11. Correlations between Predictors and Separation Outcomes for Enlistment Option Sample across Cohorts
Dichotomous Separation Variable
Attrition: 36 months
Attrition: 48 months
Attrition: 60 months
Attrition: 72 months
n = 987 n = 938 n = 938 n = 896 n = 806 AFQT .03 .01 .04 .06 .07 n = 523-973 n = 502-925 n = 502-925 n = 463-885 n = 377-799
RBI Scales Achievement -.03 .08 .00 .01 -.01 Army Affective Commitment -.10 .01 -.06 -.07 -.09 Equity Sensitivitya -.01 -.01 .01 .01 .06 Fitness Motivation -.04 .01 .02 .00 -.02 Hostility to Authoritya .01 .02 .03 .00 .01 Interest in Leadership .01 .02 -.07 .00 -.01 Leader Self-Efficacy -.04 .02 -.07 -.06 .00 Peer Leadership .00 .07 .01 -.04 -.01 Response Distortiona .02 .00 .02 .02 .01 Self-Efficacy -.02 .01 -.01 -.01 .00 Stress Tolerance -.01 -.07 -.04 -.01 -.02 Tolerance for Injury .02 .02 .00 -.02 -.02 n = 186 n = 177 n = 177 n = 138 n = 117
RBI Composites Continuance Composite -.14 -.01 -.04 -.08 .00 Performance Composite -.04 .03 .04 -.07 .04
Note. Bolded values indicate statistical significance at p < .05 (two-tailed). a Negatively valanced, such that lower scores indicate more favorable standing on the construct of interest. Correlations with Performance Outcomes
Tables A.12 to A.14 present the correlations between the AFQT, OBEF scales, and performance outcomes for in-service, enlistment, and hybrid option samples, respectively.
For the in-service sample, the AFQT correlated negatively to standardized total awards
and standardized weighted awards (r = -.08 and -.07, respectively). Among OBEF constructs, Achievement and Leadership Self-Efficacy were moderate-to-strong, positive predictors of standardized total awards (r = .14 and .18, respectively) and standardized weighted award (r = .14 and .21, respectively). By comparison, the only significant predictor of promotion variables was Hostility to Authority (r = .17), which indicated that Officers scoring higher on this construct were likely to take longer to be promoted to 1st Lieutenant.
For the enlistment sample, no significant relationships were found for performance variables.

45
Finally, for the hybrid sample, Tolerance for Injury showed a sizable positive relationship with standardized weighted awards (r = .16). Concerning promotions, Self-Efficacy and Stress Tolerance showed moderate positive relationships to standardized promotion to 1st Lieutenant (both rs = .14), meaning Officers scoring higher on these constructs were likely to take longer to be promoted to 1st Lieutenant.
These significant relationships between OBEF constructs and awards in the in-service
and hybrid samples should be interpreted with caution. Officers in the in-service and hybrid sample had significantly more qualifying awards than their enlistment option counterparts. One reason for this difference is that the OMF award fields reflect awards received during enlisted and commissioned service. Thus, Officers from the in-service and hybrid samples had awards prior to take the OBEF scales, and there may be a confounding effect of time in service. Table A-12. Correlations between Predictors and Performance Outcomes for In-Service Sample across Cohorts
Std. Total Awards
Std. Weighted Awards
Std. Promotion to
1LT
Std. Promotion to
CPT AFQT -.08 -.07 .03 -.01
RBI Scales
Achievement .14 .14 -.11 -.02 Army Affective Commitment -.01 -.01 .02 .04 Equity Sensitivitya -.09 -.10 .11 -.05 Fitness Motivation -.02 -.01 .04 .06 Hostility to Authoritya -.02 -.03 .17 .08 Interest in Leadership .06 .09 -.07 -.06 Leader Self-Efficacy .18 .21 -.09 -.07 Peer Leadership .02 .02 -.01 -.04 Response Distortiona .00 .01 -.01 -.06 Self-Efficacy .02 .02 -.02 -.06 Stress Tolerance .05 .05 .03 -.02 Tolerance for Injury .08 .10 -.09 -.05
Note. n = 170 - 775. Bolded values indicate statistical significance at p < .05 (two-tailed). a Negatively valanced, such that lower scores indicate more favorable standing on the construct of interest.

46
Table A-13. Correlations between Predictors and Performance Outcomes for Enlistment Sample across Cohorts
Std. Total Awards
Std. Weighted Awards
Std. Promotion to
1LT
Std. Promotion to
CPT AFQT .01 .01 .01 .00
RBI Scales
Achievement .05 .04 -.04 -.01 Army Affective Commitment -.04 -.05 -.02 -.01 Equity Sensitivitya -.01 .01 -.01 .09 Fitness Motivation .01 .00 .05 .04 Hostility to Authoritya -.01 .00 .01 -.02 Interest in Leadership .04 .04 .02 .01 Leader Self-Efficacy -.04 -.05 .02 .04 Peer Leadership .03 .03 .01 .05 Response Distortiona -.01 -.01 -.03 .03 Self-Efficacy .03 .02 .03 -.02 Stress Tolerance .01 .01 -.04 .05 Tolerance for Injury .05 .04 .02 .04
RBI Composites Continuance Composite -.06 -.06 -.05 -.04 Performance Composite .03 .02 -.02 .00
Note. n = 136 - 1,236. Bolded values indicate statistical significance at p < .05 (two-tailed). a Negatively valanced, such that lower scores indicate more favorable standing on the construct of interest. Table A-14. Correlations between Predictors and Performance Outcomes for Hybrid Sample across Cohorts
Std. Total Awards
Std. Weighted Awards
Std. Promotion to
1LT
Std. Promotion to
CPT AFQT .03 .02 -.07 .11
RBI Scales Achievement .04 .04 -.01 -- Army Affective Commitment .00 -.01 -.06 .04 Equity Sensitivitya .00 .00 -.06 -- Fitness Motivation .06 .06 .11 .13 Hostility to Authoritya .12 .13 .06 -- Interest in Leadership -.04 -.06 .11 -- Leader Self-Efficacy .02 .01 .04 -- Peer Leadership -.04 -.03 .03 .06 Response Distortiona -.03 -.02 .10 .00 Self-Efficacy -.01 .01 .14 .09 Stress Tolerance -.07 -.08 .14 .00 Tolerance for Injury .14 .16 -.05 --
Note. n = 126 - 419. Relationships with n < 100 not reported (i.e., --). Bolded values indicate statistical significance at p < .05 (two-tailed). a Negatively valanced, such that lower scores indicate more favorable standing on the construct of interest.

47
Incremental Validity Analyses The OBEF scales were examined as predictors of ADSO continuance, as measured by the
dichotomous separation variable and the attrition by time variables. Scales were also examined as predictors of ADSO performance, as measured by standardized total awards, standardized weighted awards, and standardized promotions to 1st Lieutenant and Captain, respectively.
To assess the criterion-related validity of the OBEF, we conducted OLS regression
analyses to examine the incremental validity the OBEF core scales, as well as the OBEF core + experimental scales, over the AFQT.9 Incremental validity is an estimate of the change in the multiple correlation (ΔR) when a new predictor, or set of predictors, is added to a regression equation. New predictors that add validity beyond the prediction already afforded by AFQT are more likely to prove useful for selection purposes.
Our analyses involved two steps. First, each criterion variable was regressed on AFQT.
Next, we added the OBEF scales to the model. In one version of the analyses, we added the core OBEF scales in the second step. In the second version of the analyses, we added all the OBEF scales, including core and experimental scales, in the second step after the AFQT. The difference between the correlation (r) of the AFQT-only model and the multiple correlation (R) produced by the AFQT-plus-predictors model was then calculated to determine incremental validity. To determine whether the OLS incremental validity coefficients were statistically significant, we used the F-test associated with the change in R-square over the AFQT-only model. Continuance Outcomes Tables A.15 and A.16 present incremental validity results of continuance outcomes for in-service and enlistment option samples, respectively, using OBEF core and experimental scales administered to all three cohorts. For the in-service sample, results show the OBEF core scales provided incremental prediction for separation (dichotomous separation variable: ΔR = .10), particularly at 48, 60, and 72 months (ΔR = .11-.14). When the two experimental scales were included along with core scales, the OBEF provided incremental prediction over the AFQT (ΔR = .10-.16), which was similar to, or slightly greater than, that provided by the core OBEF scales.
For the enlistment option sample, OBEF core and experimental scales did not provide
significant improvement to the prediction of separation outcomes beyond the level of prediction afforded by the AFQT.
Several OBEF scales were added for the 2010 and 2011 cohorts; thus, separate analyses were conducted for the 2010 and 2011 cohorts only. These analyses added Achievement, Equity Sensitivity, Interest in Leadership, Leader Self-Efficacy, and Tolerance for Injury scales. Due to the small number of Officers who had separated in the 2010 and 2011 cohorts (28 total) for the in-service sample, results are reported for the enlistment option sample only. The OLS regression results for the enlistment option sample are reported in Table A-17. Overall, the OBEF core and experimental scales did not provide incremental prediction over the AFQT.
9 The OBEF core scales consisted of the scales that parallel the high school CBEF composites.

48
Table A-15. Incremental Validity Results of Separation Outcomes for In-Service Sample (All Cohorts)
AFQT Only AFQT + Core
Scalesa AFQT + Core Scalesa + Experimental Scalesb
Outcome Variable n R R Δ Rc R Δ Rc Dichotomous separation variable 485 .13 .23 .10 .23 .10
Attrition: 36 months 471 .08 .16 .08 .17 .09 Attrition: 48 months 471 .10 .23 .13 .26 .16 Attrition: 60 months 469 .09 .22 .14 .23 .15 Attrition: 72 months 460 .10 .22 .11 .22 .11
Note. Bolded results indicate significance at p < .05 (two-tailed). a OBEF core scales include the scales at are operationally scored for the high school CBEF. b OBEF experimental scales include scales that are not scored on the high school CBEF. cΔR is based on the difference between the AFQT only model and the AFQT+ predictor model. Table A-16. Incremental Validity Results of Separation Outcomes for Enlistment Option Sample (All Cohorts)
AFQT Only AFQT + Core
Scalesa AFQT + Core Scalesa + Experimental Scalesb
Outcome Variable n R R Δ Rc R Δ Rc Dichotomous separation variable 848 .02 .11 .09 .11 .10
Attrition: 36 months 804 .01 .08 .07 .11 .10 Attrition: 48 months 804 .04 .10 .06 .10 .06 Attrition: 60 months 764 .04 .08 .05 .09 .05 Attrition: 72 months 678 .06 .12 .06 .12 .06
Note. Bolded results indicate significance at p < .05 (two-tailed). a OBEF core scales include the scales at are operationally scored for the high school CBEF. b OBEF experimental scales include scales that are not scored on the high school CBEF. cΔR is based on the difference between the AFQT only model and the AFQT+ predictor model. Table A-17. Incremental Validity Results of Separation Outcomes for Enlistment Option Sample (2010 and 2011 Cohorts Only)
AFQT Only AFQT + Core
Scalesa AFQT + Core Scalesa + Experimental Scalesb
Outcome Variable n R R Δ Rc R Δ Rc Dichotomous separation variable 523 .03 .13 .10 .16 .13
Attrition: 36 months 502 .03 .11 .08 .13 .10 Attrition: 48 months 502 .01 .13 .11 .17 .15 Attrition: 60 months 463 .00 .15 .14 .17 .17 Attrition: 72 months 377 .03 .13 .10 .17 .14
Note. Bolded results indicate significance at p < .05 (two-tailed). Relationships with n < 100 not reported (i.e., --). a OBEF core scales include the scales at are operationally scored for the high school CBEF. b OBEF experimental scales include scales that are not scored on the high school CBEF. cΔR is based on the difference between the AFQT only model and the AFQT+ predictor model. Adjusted ΔR values in excess of 1 are omitted.

49
Performance Outcomes Tables A.18 to A.20 present incremental validity results of performance outcomes for in-service, enlistment, and hybrid option samples, respectively. The OBEF core and experimental scales were administered to all three cohorts. For the in-service sample, results indicate that the only significant increment in variance across performance outcomes was observed for standardized promotion to Captain. Specifically, though the AFQT was not a significant predictor, when the two experimental scales of the OBEF were included along with core scales, there was a sizable increment in prediction (ΔR = .17).
For the enlistment option sample, neither did the AFQT provide significant prediction for
any performance outcome, nor did the OBEF core and experimental scales provide significant incremental improvement to prediction. For the hybrid sample, results indicate that the only significant increment in variance across performance outcomes was observed for standardized promotion to 1st Lieutenant. That is, though the AFQT was not a significant predictor, the addition of the OBEF core scales provided a significant improvement in prediction (ΔR = .16). Likewise, addition of the two experimental scales and the core scales showed slightly more prediction beyond the AFQT alone (ΔR = .17).
As mentioned earlier, several OBEF scales were added for the 2010 and 2011 cohorts; accordingly, separate analyses were conducted for 2010 and 2011 cohorts only. OLS regression results for in-service, enlistment, and hybrid option samples are reported in Tables A.21 to A.23, respectively. Across samples and performance outcomes, the only two significant improvements in prediction over and above the AFQT, which itself was not a significant predictor, was the OBEF core and experimental scales for predicting standardized total awards (ΔR = .18) and standardized weighted awards (ΔR = .19) for the enlistment sample. With that said, caution is recommended when interpreting these results, both significant findings as well as non-significant ones, because the sample sizes were smaller for these 2010 and 2011 cohorts only samples.
Table A-18. Incremental Validity Results of Performance Outcomes for In-Service Sample (All Cohorts)
AFQT Only AFQT + Core
Scalesa AFQT + Core Scalesa + Experimental Scalesb
Outcome Variable n R R Δ Rc R Δ Rc
Std. Total Awards 581 .08 .13 .05 .13 .06
Std. Weighted Awards 581 .07 .13 .05 .13 .06
Std. Promotion to 1LT 542 .01 .06 .05 .08 .07 Std. Promotion to CPT 484 .01 .14 .14 .18 .17
Note. Bolded results indicate significance at p < .05 (two-tailed). a OBEF core scales include the scales at are operationally scored for the high school CBEF. b OBEF experimental scales include scales that are not scored on the high school CBEF. cΔR is based on the difference between the AFQT only model and the AFQT+ predictor model. Adjusted ΔR values in excess of 1 are omitted.

50
Table A-19. Incremental Validity Results of Performance Outcomes for Enlistment Sample (All Cohorts)
AFQT Only AFQT + Core
Scalesa AFQT + Core Scalesa + Experimental Scalesb
Outcome Variable n R R Δ Rc R Δ Rc
Std. Total Awards 1,074 .01 .08 .06 .09 .07 Std. Weighted Awards 1,074 .01 .08 .07 .09 .08 Std. Promotion to 1LT 848 .01 .08 .06 .08 .07 Std. Promotion to CPT 638 .01 .07 .05 .10 .09
Note. Bolded results indicate significance at p < .05 (two-tailed). a OBEF core scales include the scales at are operationally scored for the high school CBEF. b OBEF experimental scales include scales that are not scored on the high school CBEF. cΔR is based on the difference between the AFQT only model and the AFQT+ predictor model. Adjusted ΔR values in excess of 1 are omitted. Table A-20. Incremental Validity Results of Performance Outcomes for Hybrid Sample (All Cohorts)
AFQT Only AFQT + Core
Scalesa AFQT + Core Scalesa + Experimental Scalesb
Outcome Variable n R R Δ Rc R Δ Rc
Std. Total Awards 291 .04 .13 .09 .16 .12 Std. Weighted Awards 291 .03 .15 .12 .17 .14 Std. Promotion to 1LT 229 .11 .27 .16 .28 .17 Std. Promotion to CPT 189 .12 .19 .07 .20 .08
Note. Bolded results indicate significance at p < .05 (two-tailed). a OBEF core scales include the scales at are operationally scored for the high school CBEF. b OBEF experimental scales include scales that are not scored on the high school CBEF. cΔR is based on the difference between the AFQT only model and the AFQT+ predictor model. Adjusted ΔR values in excess of 1 are omitted.
Table A-21. Incremental Validity Results of Performance Outcomes for In-Service Option Sample (2010 and 2011 Cohorts Only)
AFQT Only AFQT + Core
Scalesa AFQT + Core Scalesa + Experimental Scalesb
Outcome Variable n R R Δ Rc R Δ Rc
Std. Total Awards 199 .13 .19 .06 .31 .18 Std. Weighted Awards 199 .12 .19 .08 .32 .20 Std. Promotion to 1LT 178 .02 .20 .19 .22 .20 Std. Promotion to CPT 160 .07 .25 .19 .29 .22
Note. Bolded results indicate significance at p < .05 (two-tailed). a OBEF core scales include the scales at are operationally scored for the high school CBEF. b OBEF experimental scales include scales that are not scored on the high school CBEF. cΔR is based on the difference between the AFQT only model and the AFQT+ predictor model. Adjusted ΔR values in excess of 1 are omitted.

51
Table A-22. Incremental Validity Results of Performance Outcomes for Enlistment Option Sample (2010 and 2011 Cohorts Only)
AFQT Only AFQT + Core
Scalesa AFQT + Core Scalesa + Experimental Scalesb
Outcome Variable n R R Δ Rc R Δ Rc
Std. Total Awards 707 .02 .13 .12 .20 .18 Std. Weighted Awards 707 .02 .13 .11 .21 .19 Std. Promotion to 1LT 527 .01 .08 .07 .10 .09 Std. Promotion to CPT 388 .02 .11 .09 .20 .18
Note. Bolded results indicate significance at p < .05 (two-tailed). a OBEF core scales include the scales at are operationally scored for the high school CBEF. b OBEF experimental scales include scales that are not scored on the high school CBEF. cΔR is based on the difference between the AFQT only model and the AFQT+ predictor model. Adjusted ΔR values in excess of 1 are omitted. Table A-23. Incremental Validity Results of Performance Outcomes for Hybrid Option Sample (2010 and 2011 Cohorts Only)
AFQT Only AFQT + Core Scalesa AFQT + Core Scalesa +
Experimental Scalesb Outcome Variable n R R Δ Rc R Δ Rc
Std. Total Awards 134 .07 .18 .11 .25 .19 Std. Weighted Awards 134 .06 .18 .12 .28 .23 Std. Promotion to 1LT -- -- -- -- -- -- Std. Promotion to CPT -- -- -- -- -- --
Note. Bolded results indicate significance at p < .05 (two-tailed). Relationships with n < 100 not reported (i.e., --). a OBEF core scales include the scales at are operationally scored for the high school CBEF. b OBEF experimental scales include scales that are not scored on the high school CBEF. cΔR is based on the difference between the AFQT only model and the AFQT+ predictor model. Adjusted ΔR values in excess of 1 are omitted.
Summary The OBEF scales that parallel the ROTC CBEF scales showed evidence of some useful,
significant relationships, as well as incremental prediction over the AFQT, for some continuance and performance outcomes. Regarding relationships with continuance outcomes, for both in-service and enlistment options, Army Affective Commitment was negatively correlated with separation from active duty and separation measured at different points in time (specifically, 36, 48, 60, and 72 months for the in-service option; 72 months for the enlistment option). Equity Sensitivity was also positively correlated with separation for the in-service sample only. Regarding relationships with performance outcomes, Achievement and Leadership Self-Efficacy were positive predictors of awards variables in the in-service sample; likewise, Tolerance for Injury was a positive predictor in awards variables in the hybrid sample. Hostility to Authority was a significant predictor of promotion to 1st Lieutenant in the in-service sample, meaning Officers higher in Hostility to Authority took longer to be promoted. Finally, Self-Efficacy and Stress Tolerance were also significant predictors of promotion to 1st Lieutenant in the hybrid sample, where Officers scoring higher in these scales took longer to be promoted.

52
Regarding incremental validity for continuance outcomes, for the in-service option sample, OBEF scales afforded predictive value, beyond the AFQT, for separation from active duty and attrition at 48, 60, and 72 months. Unlike the in-service sample, the OBEF scales did not afford any additional variance beyond the AFQT to the prediction of the continuance criteria for those entering OCS through the enlistment option. Although caution should be taken when interpreting results with low separation base rates, results could be used to inform the refinement of the operational CBEF for predicting continuance among ROTC commissioned Officers. Regarding incremental validity for performance outcomes, OBEF scales provided significant increments in variance for predicting promotion to 1st Lieutenant, in the hybrid sample, and Captain, in the in-service sample. Further, for the more restricted sample of 2010 and 2011 cohorts wherein additional experimental scales were included, the OBEF battery predicted awards in the enlistment sample. Again, caution should be taken when interpreting these results, because of comparatively smaller sample sizes. Nevertheless, in general, the OBEF, especially the version with the fuller predictor battery, shows promise for predicting critical performance outcomes for ROTC commissioned Officers.
Limitations
The predictive value of the OBEF scales for the in-service sample compared to the
enlistment option sample should be considered with caution, as the base rate of separation (27.3%) for the in-service sample was lower than the base rate of separation (approximately 51.8%) for the enlistment option. The separation base rates were even smaller when considering separation at particular time points (e.g., only 3.8% of Officers separated after 36 months of service for the in-service sample). Figures A.1. and A.2. illustrate the separation base rates for the dichotomous separation variable and attrition by time variables for the two samples.
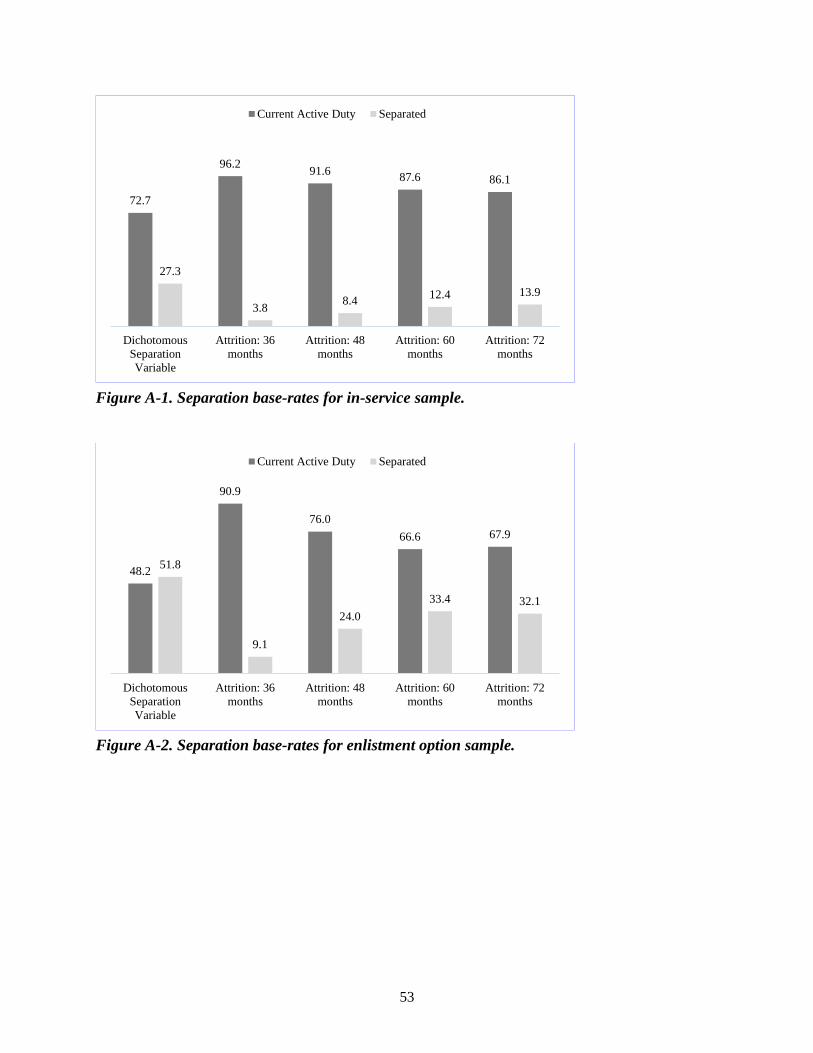
53
Figure A-1. Separation base-rates for in-service sample.
Figure A-2. Separation base-rates for enlistment option sample.
72.7
96.2 91.6 87.6 86.1
27.3
3.8 8.4 12.4 13.9
DichotomousSeparationVariable
Attrition: 36months
Attrition: 48months
Attrition: 60months
Attrition: 72months
Current Active Duty Separated
48.2
90.9
76.066.6 67.9
51.8
9.1
24.033.4 32.1
DichotomousSeparationVariable
Attrition: 36months
Attrition: 48months
Attrition: 60months
Attrition: 72months
Current Active Duty Separated

54
APPENDIX B
DEVELOPMENT OF NEW CBEF MEASURES
Emily Medvin and Matt Allen (HumRRO)
To improve the prediction of ROTC continuance, we identified additional constructs for which to develop biodata items and include in the Advance Camp CBEF. Altogether, seven potential constructs were identified, five were selected for item development, and three were included in the 2019 Advanced Camp data collection (which occurred beyond the time period covered by this report).
Literature Review
To identify potential new constructs for the CBEF, we conducted a literature review that
focused on (1) predictors of college dropout/retention, for both civilian populations and military populations, and (2) predictors of organizational turnover/retention. For any predictor that was theoretically and/or empirically supported in the literature, the predictor was compared against the list of constructs that have previously been included on the CBEF and constructs with significant theoretical overlap were removed from consideration. we also considered each construct’s proposed relevance to the ROTC context and appropriateness for the creation of biodata items.
Additionally, we examined previously administered experimental CBEF scales to identify
any that would be interesting to re-visit. First, we identified scales that were added and subsequently removed from the CBEF. Then, we examined the data for the CBEF administrations that included these scales, paying particular attention to the correlations between these scales and key criteria. For constructs that showed significant correlations or had a compelling theoretical rationale, we examined the individual items that were used in their measurement to investigate alternative methods/items to capture the construct of interest.
As a result of this investigation, seven constructs were proposed as potential new
constructs for biodata item development and inclusion in the Advanced Camp CBEF. A summary of the seven proposed scales, listed alphabetically, is provided in Table B-1.

55
Table B-1. Summary of Proposed Constructs
Definition Potential Subscales
New Constructs
Attachment Style Personality trait affecting the way we relate to ourselves and others
Anxiety Avoidance
Goal-Setting Deciding on challenging and
specific goals to help accomplish a task
Specificity Challenge Clarity Participation Peer Competition
Grit Trait-level perseverance and passion for long-term goals
Perseverance Consistency of Interest
Help-Seeking Behaviors Getting help when having difficulty successfully completing a task
Help-Seeking Decision Points
Constructs Similar to or Adapted from Previously Administered CBEF Constructs
Adaptability Ability to adjust to new and changing situations
Emergency/Crisis Work Stress Creativity Uncertainty Learning Interpersonal Cultural Physical
Multitasking
Ability to switch between multiple tasks that require a conscious shift of attention over a short time span
Dual Tasking Task Switching Task Interruption
Narcissism
A grandiose yet fragile sense of self and entitlement, as well as a preoccupation with success and demands for admiration
Leadership/Authority Self-absorption/Self-admiration Superiority/Arrogance Exploitiveness/Entitlement
Construct Choice Five constructs were selected for subsequent item development. The decision for which
items and corresponding dimensions to pursue was largely based on the perceived unique value of each construct, when compared to both the other constructs under consideration as well as constructs that had been included on the CBEF in the past. We outline the five constructs selected for item development, along with their dimensions, in Table B-2.

56
Table B-2. Constructs Selected for Item Development
Construct Dimensions
Adaptability Emergency/Crisis Interpersonal
Attachment Style Anxiety Avoidance
Goal-Setting Goal-Setting Activities Peer Competition
Grit Perseverance of Effort Consistency of Interest
Help-Seeking Help-Seeking Activities Threat/Avoidance
A brief description of each construct, dimension, and empirical/theoretical relation to the
ROTC context is provided next.
Adaptability Adaptability refers to an individual’s ability to adjust to new and changing situations
(Morrison & Hall, 2002). As an individual difference, adaptability has been defined as “an individual’s dispositional tendency to make active attempts to adjust him or herself to fit new tasks and new environments” (Wang, Zhan, McCune, & Truxillo, 2011, p. 165). Ployhart and Bliese (2006) proposed and validated an eight-dimension model of individual adaptability, which they conceptualize as a trait-like factor made up of the following dimensions:
• Emergency/Crisis: Reacting to urgent, life-threatening, and dangerous situations
• Work Stress: Dealing with the stressful circumstances at work.
• Creativity: Solving novel problems using atypical solutions.
• Uncertainty: Handling change and unpredictable situations.
• Learning: Acquiring new skills, knowledge, and approaches
• Interpersonal: Demonstrating flexibility and open-mindedness when interacting with others
• Cultural: Interacting with individuals from various and diverse cultures.
• Physical: Working in physically demanding and changing conditions. Adaptability has been shown to be predictive of performance, particularly in situations
where adaptability is necessary for success (Ployhart & Bliese, 2006). For example, Zorzie (2012) examined the adaptability of first-semester college students and found that learning adaptability was predictive of task performance. Additionally, learning adaptability and cultural adaptability were both significant predictors of contextual performance. Finally, work stress adaptability was shown to be a significant predictor for the outcome of emotional adjustment.

57
Adaptability has also been shown to relate to turnover intentions in an organization.
Wang and colleagues (2011) looked at new employees at a large corporation in China and found cultural, work stress, learning, and interpersonal adaptability to be positively related to perceptions of person-organization fit and person-group fit, which then predicted increased job satisfaction and decreased turnover intentions.
Both the transition to college and the transition to a new job are contexts in which many
changes occur and, thus, for which adaptability will be particularly relevant. Because the ROTC context involves the transition to college with the addition of an extra stressor and context change, it is expected that the predictive value of adaptability for college student and new employee outcomes will be similar in the ROTC context.
• Because cognitive flexibility, a construct similar to the learning and creativity dimensions of adaptability, was previously included in the CBEF, two additional dimensions of adaptability conceptually relevant to the ROTC context were selected for item development: Emergency/Crisis and Interpersonal. Emergency/Crisis adaptability refers to reacting with appropriate and proper urgency in life-threatening and dangerous situations. This includes quickly analyzing options for dealing with danger or crises, making split-second decisions based on clear and focused thinking, maintaining emotional control and objectivity, and stepping up to take action to handle danger or emergencies as necessary (Charbonnier-Voirin, El Akremi, & Vandenberghe, 2010).
• Interpersonal adaptability refers to demonstrating flexibility and open-mindedness when interacting with others. This includes adapting one’s ways of thinking based on others’ perspectives and facilitating positive relationships with new and different individuals (Charbonnier-Voirin et al., 2010).
Attachment Style
Attachment style refers to relatively stable personality traits (Fraley & Brumbaugh, 2004)
that affect the way we relate to ourselves and others and, subsequently, result in differing types of relationship behaviors enduring from infancy into adulthood. Anxiety about and avoidance of relationships are the two continuous dimensions that characterize the underlying differences in attachment styles (Fraley, Hudson, Heffernan, & Segal, 2015). Research has shown that adult attachment styles are best represented as varying along these two continuous dimensions (Fraley et al., 2015), which can then be combined into a higher order continuous secure/insecure score. Secure attachment styles have been linked to workplace outcomes such as leadership, trust, satisfaction, and performance (Harms, 2011).
Per Fraley and colleagues’ (2015) recommendation to consider the two dimensions as
continuous, items were written to target either the avoidance or anxiety dimension of attachment. Attachment-related avoidance refers to the extent to which a person distrusts others’ goodwill and is uncomfortable with emotional closeness to others. Avoidant individuals tend to have more negative models of others, and their relationships with others are driven by concerns about intimacy and dependency (Geller & Bamberger, 2009). Attachment-related anxiety refers to the

58
degree to which a person’s concerns about being rejected serve as the basis of their relationships with others. Anxious individuals tend to have more negative models of self and worry that relationship partners will not be available in times of need (Geller & Bamberger, 2009).
Though adult attachment style is often conceptualized in the context of romantic
relationships, it can be applied to other relationships, such as those with family, friends/peers, and coworkers. Friends/peers and family were the referents used in the current item-writing efforts, as they are most relevant for an ROTC/college context and are most likely to be applicable to the entire test-taking population.
Goal Setting
Goal-setting theory is a theory of motivation that explains what causes some people to
perform better on some tasks than others (Locke & Latham, 1990). The overarching premise of goal-setting theory is that individuals who set goals are more likely to perform at higher levels than individuals who do not set goals.
Goal-setting is related to the personality trait of goal-orientation, which was previously administered on the CBEF. However, while goal-orientation focuses on the personality traits that drive the motivation behind setting goals (Latham, Seijts, & Slocum, 2016), goal-setting itself focuses on the behavior of setting goals. Research has demonstrated that the behavior of setting goals and the content of the goals themselves have a stronger relationship with outcomes (e.g., performance) than goal orientation does (Latham et al., 2016).
Goal-setting behaviors are related to goal/task achievement and retention in a variety of
contexts, including academia/college as well as organizations. Focusing on goals is thought to improve performance, as individuals become better able to direct their attention to the tasks at hand, mobilize their efforts, increase their persistence, and replace unhelpful strategies with new ones. Specific and challenging goals generally lead to increased retention, as individuals who set specific goals tend to persist in their efforts until the goal is attained, and challenging goals tend to lead to prolonged effort. In relation to performance, goal specificity, relevancy, challenge, commitment, participation, goal feedback, and peer competition are all factors that enhance performance (Friedman & Mandel, 2009; Locke & Latham, 1990).
In an academic/college setting, retention of students beginning college was shown to be
predicted by SAT scores, high school GPA, and goal achievement competition with peers (one facet of goal-setting behaviors; Friedman & Mandel, 2009). Additionally, goal setting was found to increase both semester and cumulative GPA in college students (Chase, 2010). Academic goal intervention programs have been found to improve student performance (e.g., Morisano, Hirsh, Peterson, Pihl, & Shore, 2010). In an organizational context, research has shown that goal setting increases employee engagement, which then has a positive relationship with retention (Reed, 2016).
Biodata items were written to target two dimensions of goal setting: (1) goal-setting
activities and (2) peer competition. The dimension of goal-setting activities is a broader dimension referring to the behavior, both past and present, of setting goals. It includes factors

59
related to the nature of goals themselves that have been shown to predict performance and retention, such as goal specificity, plausibility, challenge, and publicity. Peer competition is a narrower dimension referring to the underlying motivation behind setting goals as wanting to do better than others (Urden & Mestas, 2006). In a project measuring freshmen college students’ goal-setting behaviors, peer competition was the only facet of goals found to predict retention (Friedman & Mandel, 2009). Therefore, a full set of items was written to target this dimension.
Grit
Grit is defined as “trait-level perseverance and passion for long-term goals” (Duckworth,
Peterson, Matthews, & Kelly, 2007, p. 1087). This trait involves working toward challenges and maintaining effort and interest despite failures, adversity, and plateaus in progress. Grit is a higher-order construct with two facets—perseverance of effort and consistency of interest.
Grit is conceptually related to, yet distinct from, the current CBEF construct of
achievement, defined as “the willingness to give one’s best effort and to work hard toward achieving difficult objectives.” Both constructs focus on the achievement of goals; however, while achievement orientation focuses on short-term intensity toward goals, grit focuses on long-term stamina (Duckworth et al., 2007). Additionally, grit emphasizes the long-term pursuit of goals, especially when faced with plateaus and obstacles. Continued enrollment in ROTC, followed by the fulfillment of one’s active duty service obligation (ADSO), represents a long-term goal, the achievement of which will likely require the overcoming of various forms of adversity.
Duckworth and colleagues (2007) used data from the Military Academy at West Point to
examine if grit could predict retention during Cadet Basic Training. They found that Cadets scoring more than one standard deviation above the norm for grit were 60% more likely to complete summer training. Importantly, the Academy-specific Whole Candidate Score, which includes measures of SAT scores, high school rank, leadership scores, community engagement scores, and physical scores, did not predict summer retention, though it did better predicting first year GPA and military performance scores. Conscientiousness also predicted Cadet Basic Training retention and was strongly correlated with grit. However, grit predicted retention better than conscientiousness.
Similarly, Eskreis-Winkler, Shulman, Beal, and Duckworth (2014) examined the extent
to which grit predicted completion of a 24-day Army Special Operations Forces (ARSOF) selection course. They found that candidates who scored one standard deviation higher in grit were 32% more likely to complete the course after controlling for general intelligence and physical fitness. In other words, grit showed incremental validity in the prediction of course completion. Due to the similarity in contexts between the military settings used in previous research and the current ROTC context (e.g., high stress, new environment), a similar predictive value is expected.
A meta-analysis of grit (Credé, Tynan, & Harms, 2017) with outcomes including
performance and retention found, across various contexts, that grit is moderately correlated with both outcomes. A closer investigation of the facets of grit indicated that the perseverance facet of

60
grit adds to the prediction of outcomes, while the consistency facet does not. However, these researchers also concluded that an assessment of grit as a higher-order construct may be especially useful in settings where retention is problematic. Thus, given the attrition rate in the ROTC context, items were written to target both dimensions of grit.
Help-Seeking Behaviors
Help-seeking is defined as getting help when having difficulty successfully completing a
task (Schunk, 2004). In a variety of psychology disciplines (e.g., clinical, developmental, educational, organizational), help seeking has been suggested as an adaptive behavior. Educational psychologists have found certain types of help seeking by students to be positively related to classroom/academic performance. For example, Karabenick (2003) found that instrumental help seeking (i.e., help sought to aid in understanding) was positively related to the academic performance of students in grades K-12 as well as college students. On the other hand, the avoidance of help seeking was negatively related to academic performance. Similarly, organizational psychologists have found help seeking to be necessary for organizational learning and related to job satisfaction and organizational tenure (e.g., Ashford & Tsui, 1991; Morrison, 1993).
College is a new and often stressful experience for young adults, likely made increasingly
stressful with the addition of ROTC requirements and training. Thus, Cadets beginning college and ROTC may likely experience stressors for which seeking help has been shown to be adaptive (e.g., academic, mental health). However, there are perceived costs associated with help-seeking behaviors that have been identified in the literature. These costs include public acknowledgement of ineptitude, inferiority compared to others, and a dependence on others. These costs may be particularly salient for those in a military context, as military cultural values are often described as privacy, independence, and high self-efficacy (Rauch, 2016). Thus, the frequency of help-seeking behavior may be low. However, this does not negate the positive, adaptive effects of this behavior.
Biodata items were written to target two dimensions of help-seeking behaviors: (1) help-
seeking activities and (2) help-seeking threat. The dimension of help-seeking activities refers to the behavior of seeking help for task completion. It includes the specific activities of recognizing the need for help, deciding to seek help, and knowing who and how to ask for help. The help-seeking threat dimension targets the avoidance of seeking help due to the perceived costs and threats associated with this behavior. Such costs include public acknowledgement of ineptitude, inferiority compared to others, and dependence on others. Because these costs are salient in a military context, a full subset of items was devoted to this dimension.
Item Development
A team of four experienced item writers was assembled to draft and review biodata items.
Each item writer was trained on biodata development best practices, such as using observable behaviors or reactions that are theoretically verifiable and attempting to reduce social desirability to the extent possible. Writers were asked to write items that reflected situational choice, reactions to a situation, others’ reactions to situations, or outcomes associated with situational

61
exposure. Additionally, writers were presented with characteristics of biodata items that have been shown to be predictive in an ROTC context. These characteristics include objectivity, job-relevancy, contextualization, behavioral basis, and a current temporal focus (Putka, Beatty, & Reeder, 2018).
Two writers were assigned to each dimension of a construct. Before drafting an item to
target a dimension, writers read a foundational article about the dimension and conducted searches for additional articles and references as necessary to develop a thorough understanding. Writers also referenced existing, non-biodata, scales for relevant constructs to spark ideas for items.
Each writer individually drafted between four and six items to tap a particular dimension,
then exchanged items with the other writer assigned to the same dimension to review and revise iteratively. Once all items for a particular construct were finalized by a dimension team, items were swapped across dimensions. For example, after Emergency/Crisis Adaptability items were finalized by the Emergency/Crisis writers, these items were provided to the Interpersonal Adaptability team to review. As a final internal step, all items for a construct were discussed in a working meeting with the entire team to identify and resolve any issues before being passed along to ARI for review. Feedback from ARI was implemented into the final versions of the items.
Because a greater number of items was developed than was planned to be administered,
we then recommended the specific items for each construct to include in data collection. These recommendations were based on the following factors:
• Balance of reverse to standard scoring.
• Dimension coverage (i.e., tapping different portions of each dimension).
• Balance of scale types (e.g., agreement, extent, frequency).
• Reducing redundancy across items.
• Reducing overlap across constructs.
• Due to space and time constraints for the 2019 Advanced Camp data collection (which occurred beyond the time frame covered by this report), only items written to target Goal Setting, Grit, and Help-Seeking Behaviors, were administered.
Table B-3 shows a summary of the number of items developed, recommended, and
ultimately administered.
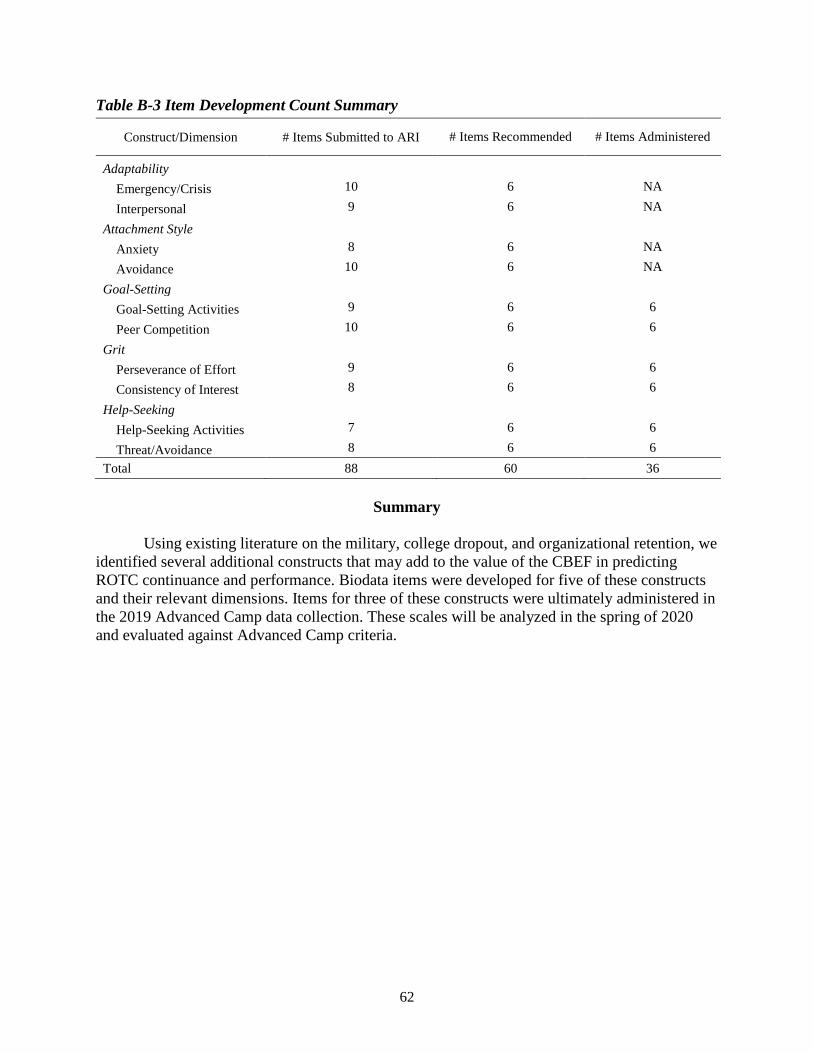
62
Table B-3 Item Development Count Summary
Construct/Dimension # Items Submitted to ARI # Items Recommended # Items Administered
Adaptability
Emergency/Crisis 10 6 NA
Interpersonal 9 6 NA
Attachment Style
Anxiety 8 6 NA
Avoidance 10 6 NA
Goal-Setting
Goal-Setting Activities 9 6 6
Peer Competition 10 6 6
Grit
Perseverance of Effort 9 6 6
Consistency of Interest 8 6 6
Help-Seeking
Help-Seeking Activities 7 6 6
Threat/Avoidance 8 6 6 Total 88 60 36
Summary
Using existing literature on the military, college dropout, and organizational retention, we
identified several additional constructs that may add to the value of the CBEF in predicting ROTC continuance and performance. Biodata items were developed for five of these constructs and their relevant dimensions. Items for three of these constructs were ultimately administered in the 2019 Advanced Camp data collection. These scales will be analyzed in the spring of 2020 and evaluated against Advanced Camp criteria.