research of the equipment self-calibration methods for
TRANSCRIPT
symmetryS S
Article
Research of the Equipment Self-Calibration Methodsfor Different Shape Fertilizers Particles Distributionby Size Using Image ProcessingMeasurement Method
Andrius Laucka, Vaida Adaskeviciute and Darius Andriukaitis *
Department of Electronics Engineering, Kaunas University of Technology, Studentu St.50-438,LT-51368 Kaunas, Lithuania* Correspondence: [email protected]
Received: 4 June 2019; Accepted: 24 June 2019; Published: 27 June 2019�����������������
Abstract: The fourth digital revolution of industry makes substantive changes to the rate andmethodology of work performance. Machines and robots do the majority of work in robotized andautomated factories, while people only supervise them. After an increase of production efficiency,quality control became a critical point. Therefore, quality control systems of computer visions areincreasingly installed. The branch of chemical industry requires measurements of quality at asgreat a frequency as possible. Consequently, indirect measurements are effectively used at thispoint. This research presents the method of indirect particle measurement. Particles are measuredusing digital image processing. The algorithm is used for particle measurement to automaticallyadjust the measurement results. Numerical intelligence is added to the algorithm to increase theaccuracy of correction results. The research deals with the problem of matching the results ofindirect measurements and the results of the control equipment. For data analysis, fertilizer diameter,mean diameter, aspect ratio, symmetry, sphericity, convexity and some other parameters are used.The mismatch of the artificial neural network results with the control equipment results is slightlyhigher than 1%.
Keywords: image processing; particle; distribution
1. Introduction
The fourth industrial revolution has already become the present-day reality; the development isgreatly influenced by the concept of the internet of things. As technologies interconnect physical anddigital worlds together, changes are observed in all living spheres of the state. The largest changesoccur in those industries where smart factories are established. Robots, which are replacing employeesin production, do not get tired, which allows them to fulfill larger orders. It is essential to ensurerequired qualitative parameters of production together with productivity growth. It is not enough toprovide production in series to quality control anymore. Volumes of quality production increase onlyby using continuous control and by checking every product [1].
The branch of chemical industry, fertilizer production, requires performance of quality checks asfrequently as possible because production capacity amounts to hundreds and thousands of tons perhour. Decreasing utilized agricultural areas and the increase of population determines an increasingdemand for fertilizers. Hence the growth of larger and more qualitative harvest requires balancedfertilization of plants. The most optimal result of fertilization is facilitated not only by chemicalsubstances but also their physical parameters—the shape, size, and density of fertilizer granules.
Symmetry 2019, 11, 838; doi:10.3390/sym11070838 www.mdpi.com/journal/symmetry

Symmetry 2019, 11, 838 2 of 16
Therefore, one of the most significant indicators in the process of fertilizer production is distribution ofgranules in accordance with their diameter.
Every product, whatever industrial branch it belongs to, is characterized by tens or even hundredsof parameters. Due to increasing capacity of production equipment, human resources are not enoughfor the periodic inspection of production. Parameters of quality are checked by using indirectmeasurements, for which measurement errors usually are a typical deviation of the measurementresult from the fair value.
Direct measurements of fertilizer granules, which are still widely used, are not effective due to theinterval of their performance, which is very long. Measurement intervals are reduced by involvingindirect measurements carried out alongside the production line. Different indirect methods areused for the measurement of granule distribution: laser diffraction [2–4], acoustic spectroscopy [5–7],infrared spectroscopy [8], dimensional filtering [9,10], radar [11], technique of sedimentation [12],transmission electron microscopy [13,14], X-rays diffractive spectrum [15], and digital image processing(one of the modern methods based on multistage entropy [16]). The processing of visual informationprovided additional details about particles. It also assesses the roundness of the product; its distributionis in accordance with its quantity and volume. Not to mention that certain information about thecolor [17,18] or porosity [19] of the product is received by applying an appropriate system of lighting.Systems of computer vision are applied to establish the distribution of participles in liquids [20] byusing microscopes (SEM and TEM) [21,22] applying a three-dimensional technique of measurementby analyzing the surface of the granule sample [23,24] or approximating the segmented image ofparticiples [25–27]. The selection of measurement methodology is influenced by the size of an object.The analysis of digital images is applied to assess participles within the interval of 0.01 to 20 mm.Quality control systems of computer vision are increasingly installed in factories due to their largecapacity, reliability, mobility, and ability to process additional information. Of course, image processingresults strongly depends on granules roundness. In most cases it is needed to recalculate results.
The results of indirect measurements are strongly influenced by the composition of analyzedsample. Different measurement methods are used to obtain reliable results in comparison with controlequipment data. Results of the received distribution could be adjusted according to the distributionaverage coefficient [28] or compared with several other measurements [29,30]. The light reflectionis used for the evaluation of larger particles [31]. The surface shape of particles is evaluated moreaccurately by three-dimensional images obtained with two cameras [32] or the reflection in mirrors [33].A laser is often used to obtain the optimal result in conjunction with the image system [34,35].
Most methodologies of particle measurement provided in scientific publications make correctionsto the measurement of a specific material alongside different production lines. The results are influencedby the temperature and humidity of a granule mix, including some other factors as well. Granulesforming equipment is clogged during production. This affects the size and shape of the granules.Following the changes in the shape of the particles, these processes can be precisely identified, and theline stopped for equipment washing. Correction parameters of the results are established one timeby carrying out equipment calibration. A significant change in the production process causes aproblem—the noncompliance of measurement results exceeds the allowable errors determined by theinternational standards. An automated algorithm for result correction can make improvements bytaking geometric changes in particles and the results of previous measurements into consideration.The universal algorithm may be applied to a wider spectrum of products. Consequently, the key goalof the research analyzed in the article is to develop an automated methodology of result correction toprepare assessment equipment for granule distribution in accordance with their size. The main aimof this research is to achieve a better correlation results between indirect measurements and controlequipment. The goal is achieved by improving computer vision system.

Symmetry 2019, 11, 838 3 of 16
2. Materials and Methods
One of the essential features of the fourth industrial revolution is the installation of computervision systems for the inspection of industrial production quality parameters. The shape of fertilizergranules in the chemical industry has more advantages over the powder shape. The transportationand storage of granules are more convenient, segregation of the product is avoided, and production ofhomogenous mixes is more effective, as well as the process of fertilization. The measuring of granulesby using a computer vision system is based on the geometric shape of particles, which, in an idealsituation, is a sphere.
Digital image processing within an indirect measurement is the primary source of informationinput. By using a video camera, morphological operators set the outlines of particles in the capturedimages of granule shadows (part of the researchers use image segmentation [36] by solving the problemof particle overlaying [37]). A precisely accurate result of the measurement is received by usingwell-calibrated equipment (hardware). To optimize the work of the system, it is important to optimizethe computer resources for parallel image processing [38]. Optimal exposure duration ensures theidentity of the distinguished granule outline with its real outline. The outlines of particles depend onthe binarization of the images [39].
The outlines of granule shadows are approximated by an ellipse [40] because this geometric formmost precisely assesses roundness of granules. The outline of an ellipse provides certain informationabout longitudinal and transverse dimensions of a particle, the ratio of which is the meaning ofroundness. The results of particle distribution in accordance with their quantity correspond to theresults attained by using the control equipment only in the events when the shape of granules isclose to the ideal circle (an interval of roundness of 0.95 to 1.00). That depends on the product type,e.g., ammonium nitrate or carbamide constitutes solid round granules. However, such a product asmonocalcium phosphate is small, frail and the shape of its particle is distinguished as anisotropic.Consequently, the image processing algorithm must assess an uneven surface of the granule.
The correlation of the results of the digital image analysis with the results of the control equipmentis obtained by evaluating the volume of particle. The latter distribution corresponds to the massdistribution. In the production process, the density of the production in the interval of 4–6 hours variesby 5–7%. However, in the sample for the analysis, this difference is abnormally low (<0.1%), so thedistribution must be calculated on the total volume of all particles.
The quality of physical features of fertilizer granules is evaluated by the following factors;an average diameter of granules d50, Uniformity Index, SGN (Size Guide Number), and an averagesquare deviation of the granule size. After the sieve correction factor has been applied for the correctionof d50 index, the diameter of every analyzed particle is divided by the latter factor. A more effectivecorrection result is obtained by using the advantage of visual particle information, i.e., distributionof roundness. Then, the sieve correction factor is applied to the particles of an irregular shape onlybecause the diameter of the latter ones depends on the position of falling particles in respect of thecamera. The diameter of the granules, which is close to the ideal circle, does not require any correction.
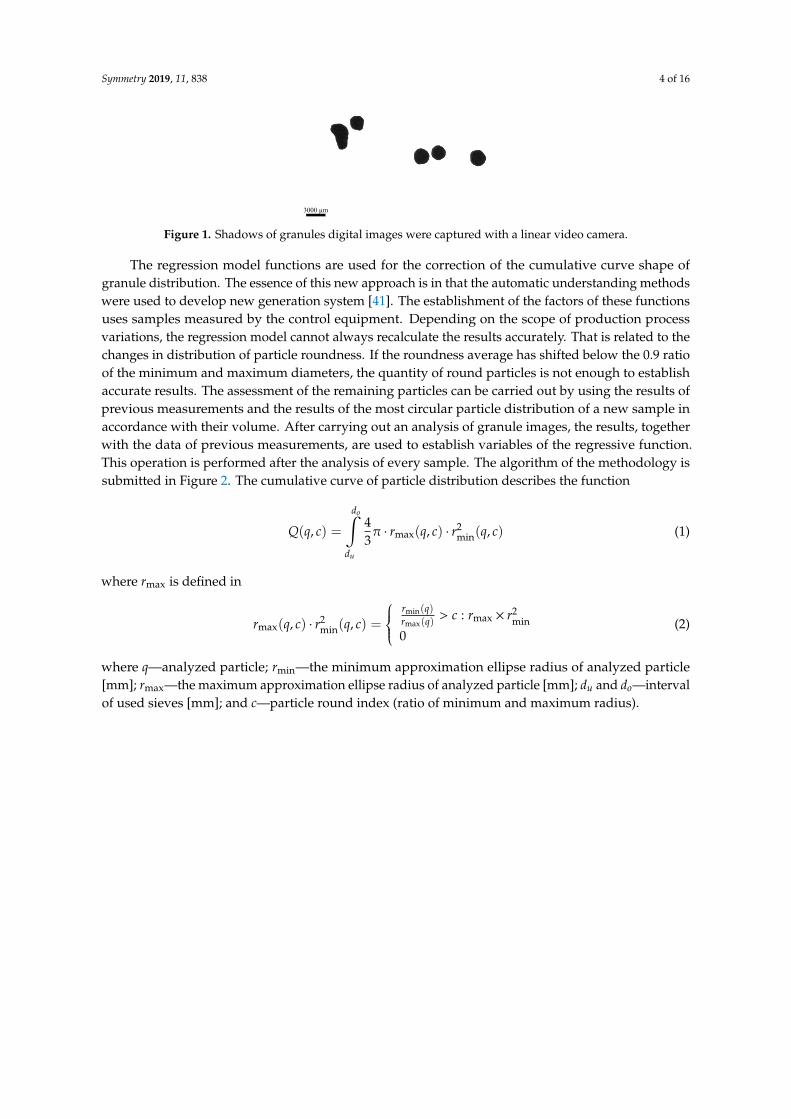
By analyzing the visual information of the granules, it was found that the cumulative particlevolume distribution curve accurately reproduces the results of the distribution obtained by the controlequipment. Only the shadow of the granules close to the ideal circle was evaluated (an example of animage captured by the camera is provided in Figure 1). Such coincidence of the results depends onthe roundness of the analyzed particles (higher rounding index), their mechanical resistance, and thenumber of granules.
Symmetry 2019, 11, 838 4 of 16
Symmetry 2019, 11, x FOR PEER REVIEW 3 of 16
granules in the chemical industry has more advantages over the powder shape. The transportation and storage of granules are more convenient, segregation of the product is avoided, and production of homogenous mixes is more effective, as well as the process of fertilization. The measuring of granules by using a computer vision system is based on the geometric shape of particles, which, in an ideal situation, is a sphere.
Digital image processing within an indirect measurement is the primary source of information input. By using a video camera, morphological operators set the outlines of particles in the captured images of granule shadows (part of the researchers use image segmentation [36] by solving the problem of particle overlaying [37]). A precisely accurate result of the measurement is received by using well-calibrated equipment (hardware). To optimize the work of the system, it is important to optimize the computer resources for parallel image processing [38]. Optimal exposure duration ensures the identity of the distinguished granule outline with its real outline. The outlines of particles depend on the binarization of the images [39].
The outlines of granule shadows are approximated by an ellipse [40] because this geometric form most precisely assesses roundness of granules. The outline of an ellipse provides certain information about longitudinal and transverse dimensions of a particle, the ratio of which is the meaning of roundness. The results of particle distribution in accordance with their quantity correspond to the results attained by using the control equipment only in the events when the shape of granules is close to the ideal circle (an interval of roundness of 0.95 to 1.00). That depends on the product type, e.g., ammonium nitrate or carbamide constitutes solid round granules. However, such a product as monocalcium phosphate is small, frail and the shape of its particle is distinguished as anisotropic. Consequently, the image processing algorithm must assess an uneven surface of the granule.
The correlation of the results of the digital image analysis with the results of the control equipment is obtained by evaluating the volume of particle. The latter distribution corresponds to the mass distribution. In the production process, the density of the production in the interval of 4–6 hours varies by 5–7%. However, in the sample for the analysis, this difference is abnormally low (<0.1%), so the distribution must be calculated on the total volume of all particles.
The quality of physical features of fertilizer granules is evaluated by the following factors; an average diameter of granules d50, Uniformity Index, SGN (Size Guide Number), and an average square deviation of the granule size. After the sieve correction factor has been applied for the correction of d50 index, the diameter of every analyzed particle is divided by the latter factor. A more effective correction result is obtained by using the advantage of visual particle information, i.e., distribution of roundness. Then, the sieve correction factor is applied to the particles of an irregular shape only because the diameter of the latter ones depends on the position of falling particles in respect of the camera. The diameter of the granules, which is close to the ideal circle, does not require any correction.
By analyzing the visual information of the granules, it was found that the cumulative particle volume distribution curve accurately reproduces the results of the distribution obtained by the control equipment. Only the shadow of the granules close to the ideal circle was evaluated (an example of an image captured by the camera is provided in Figure 1). Such coincidence of the results depends on the roundness of the analyzed particles (higher rounding index), their mechanical resistance, and the number of granules.
3000 µm Figure 1. Shadows of granules digital images were captured with a linear video camera. Figure 1. Shadows of granules digital images were captured with a linear video camera.
The regression model functions are used for the correction of the cumulative curve shape ofgranule distribution. The essence of this new approach is in that the automatic understanding methodswere used to develop new generation system [41]. The establishment of the factors of these functionsuses samples measured by the control equipment. Depending on the scope of production processvariations, the regression model cannot always recalculate the results accurately. That is related to thechanges in distribution of particle roundness. If the roundness average has shifted below the 0.9 ratioof the minimum and maximum diameters, the quantity of round particles is not enough to establishaccurate results. The assessment of the remaining particles can be carried out by using the results ofprevious measurements and the results of the most circular particle distribution of a new sample inaccordance with their volume. After carrying out an analysis of granule images, the results, togetherwith the data of previous measurements, are used to establish variables of the regressive function.This operation is performed after the analysis of every sample. The algorithm of the methodology issubmitted in Figure 2. The cumulative curve of particle distribution describes the function
Q(q, c) =
do∫du
43π · rmax(q, c) · r2
min(q, c) (1)
where rmax is defined in
rmax(q, c) · r2min(q, c) =
rmin(q)rmax(q)
> c : rmax × r2min
0(2)
where q—analyzed particle; rmin—the minimum approximation ellipse radius of analyzed particle[mm]; rmax—the maximum approximation ellipse radius of analyzed particle [mm]; du and do—intervalof used sieves [mm]; and c—particle round index (ratio of minimum and maximum radius).

Symmetry 2019, 11, 838 5 of 16Symmetry 2019, 11, x FOR PEER REVIEW 5 of 16
Last distribution by volume (all particles)
Last distribution by volume (the roundest particles)
Results database
CompareDistribution with Database
results
High deviation?
Database average Last distribution by volume (the roundest particles)
Yes No
Calculatepolynomial roots
Recalculate results: Last distribution by volume (all
particles)
Figure 2. The algorithm to results correction using the function of polynomial.
An artificial neural network can be used to increase the efficiency of the particle correction algorithm. In scientific articles about particle measurement using image processing, authors use the neural network [42] for approximation of individual particles [43]. However, to achieve that, more resources are needed for calculations. Also, supporting vector machines (SVM) are used for particle measurement for the characterization of digital image classification [44]. In this research an artificial neural network is used to correct the cumulative curve. The general formula of the artificial neural network results in the function of activation:
)(0
=
=n
jjj xwy ϕ
(3)
where wj—input weights; xj—inputs; and y—output [45].
Figure 2. The algorithm to results correction using the function of polynomial.
An artificial neural network can be used to increase the efficiency of the particle correctionalgorithm. In scientific articles about particle measurement using image processing, authors usethe neural network [42] for approximation of individual particles [43]. However, to achieve that,more resources are needed for calculations. Also, supporting vector machines (SVM) are used forparticle measurement for the characterization of digital image classification [44]. In this research anartificial neural network is used to correct the cumulative curve. The general formula of the artificialneural network results in the function of activation:
y = ϕ(n∑
j=0
w jx j) (3)
Symmetry 2019, 11, 838 6 of 16
where wj—input weights; xj—inputs; and y—output [45].The results of particle image analysis together with the control equipment data of the previous
measurement are used for the formation of the regression model function.Linear video camera was used for particle measurement in the research. Due to their high-speed
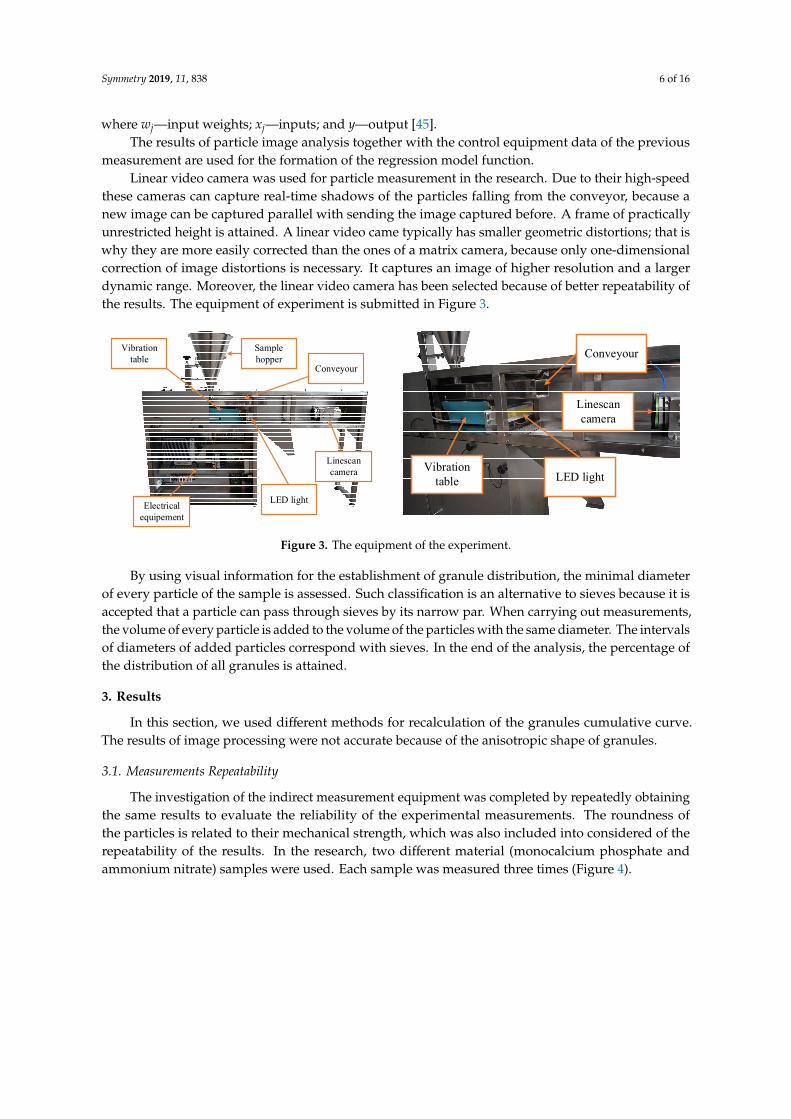
these cameras can capture real-time shadows of the particles falling from the conveyor, because anew image can be captured parallel with sending the image captured before. A frame of practicallyunrestricted height is attained. A linear video came typically has smaller geometric distortions; that iswhy they are more easily corrected than the ones of a matrix camera, because only one-dimensionalcorrection of image distortions is necessary. It captures an image of higher resolution and a largerdynamic range. Moreover, the linear video camera has been selected because of better repeatability ofthe results. The equipment of experiment is submitted in Figure 3.
Symmetry 2019, 11, x FOR PEER REVIEW 6 of 16
The results of particle image analysis together with the control equipment data of the previous measurement are used for the formation of the regression model function.
Linear video camera was used for particle measurement in the research. Due to their high-speed these cameras can capture real-time shadows of the particles falling from the conveyor, because a new image can be captured parallel with sending the image captured before. A frame of practically unrestricted height is attained. A linear video came typically has smaller geometric distortions; that is why they are more easily corrected than the ones of a matrix camera, because only one-dimensional correction of image distortions is necessary. It captures an image of higher resolution and a larger dynamic range. Moreover, the linear video camera has been selected because of better repeatability of the results. The equipment of experiment is submitted in Figure 3.
Vibration table
Conveyour
LED light
Linescan camera
Sample hopper
Electrical equipement
Conveyour
Linescan camera
Vibration table LED light
Figure 3. The equipment of the experiment.
By using visual information for the establishment of granule distribution, the minimal diameter of every particle of the sample is assessed. Such classification is an alternative to sieves because it is accepted that a particle can pass through sieves by its narrow par. When carrying out measurements, the volume of every particle is added to the volume of the particles with the same diameter. The intervals of diameters of added particles correspond with sieves. In the end of the analysis, the percentage of the distribution of all granules is attained.
3. Results
In this section, we used different methods for recalculation of the granules cumulative curve. The results of image processing were not accurate because of the anisotropic shape of granules.
3.1. Measurements Repeatability
The investigation of the indirect measurement equipment was completed by repeatedly obtaining the same results to evaluate the reliability of the experimental measurements. The roundness of the particles is related to their mechanical strength, which was also included into considered of the repeatability of the results. In the research, two different material (monocalcium phosphate and ammonium nitrate) samples were used. Each sample was measured three times (Figure 4).
Figure 3. The equipment of the experiment.
By using visual information for the establishment of granule distribution, the minimal diameterof every particle of the sample is assessed. Such classification is an alternative to sieves because it isaccepted that a particle can pass through sieves by its narrow par. When carrying out measurements,the volume of every particle is added to the volume of the particles with the same diameter. The intervalsof diameters of added particles correspond with sieves. In the end of the analysis, the percentage ofthe distribution of all granules is attained.
3. Results
In this section, we used different methods for recalculation of the granules cumulative curve.The results of image processing were not accurate because of the anisotropic shape of granules.
3.1. Measurements Repeatability
The investigation of the indirect measurement equipment was completed by repeatedly obtainingthe same results to evaluate the reliability of the experimental measurements. The roundness ofthe particles is related to their mechanical strength, which was also included into considered of therepeatability of the results. In the research, two different material (monocalcium phosphate andammonium nitrate) samples were used. Each sample was measured three times (Figure 4).

Symmetry 2019, 11, 838 7 of 16Symmetry 2019, 11, x FOR PEER REVIEW 7 of 16
Figure 4. Repeatability of indirect measurement results (particle distribution is estimated by volume).
Additionally, the use of impurities in the production of ammonium nitrate gives better mechanical strength of particles, and therefore they have a better repeatability. Monocalcium phosphate particles crystals are irregular and brittle. This causes the sample deviation after each measurement. A correction of the results is necessary due to the different composition of the particles measurements.
3.2. Cumulative Curve Correction
The coefficient of sieve correction affects the indicator d50 of the average of particle diameter. The diameters of particles are magnified or reduced by moving the cumulative curve. The coefficient of the correction does not affect the shape of cumulative curve. The results of measurement corrections are provided in Figure 5. The latter method is not reliable, especially with small diameter (<1 mm) particle measurements.
0.00
0.10
0.20
0.30
0.40
0.00 - 0.10 0.10 - 0.20 0.20 - 0.50 0.50 - 1.00 1.00 - 1.40 1.40 - 2.00 2.00 - 3.00 3.00 - 20.00
Qua
ntity
, %
Sieve size, mm
Distribution by volume (monocalcium phosphate)
I attempt II attempt III attempt
0.00
0.10
0.20
0.30
0.40
0.00 - 1.00 1.00 - 2.00 2.00 - 2.50 2.50 - 3.15 3.15 - 4.00 4.00 - 5.00 5.00 - 20.00
Qua
ntity
, %
Sieve size, mm
Distribution by volume (ammonium nitrate)
I attempt II attempt III attempt
Figure 4. Repeatability of indirect measurement results (particle distribution is estimated by volume).
Additionally, the use of impurities in the production of ammonium nitrate gives better mechanicalstrength of particles, and therefore they have a better repeatability. Monocalcium phosphate particlescrystals are irregular and brittle. This causes the sample deviation after each measurement. A correctionof the results is necessary due to the different composition of the particles measurements.
3.2. Cumulative Curve Correction
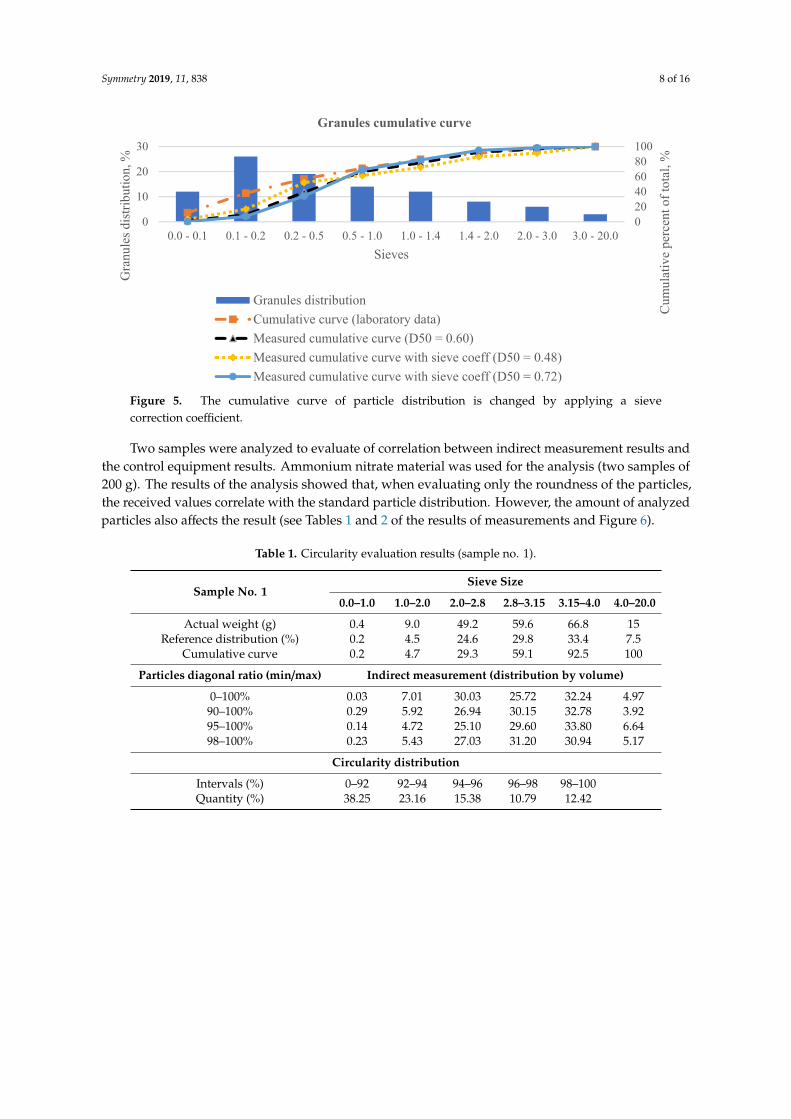
The coefficient of sieve correction affects the indicator d50 of the average of particle diameter.The diameters of particles are magnified or reduced by moving the cumulative curve. The coefficientof the correction does not affect the shape of cumulative curve. The results of measurement correctionsare provided in Figure 5. The latter method is not reliable, especially with small diameter (<1 mm)particle measurements.
Symmetry 2019, 11, 838 8 of 16Symmetry 2019, 11, x FOR PEER REVIEW 8 of 16
Figure 5. The cumulative curve of particle distribution is changed by applying a sieve correction coefficient.
Two samples were analyzed to evaluate of correlation between indirect measurement results and the control equipment results. Ammonium nitrate material was used for the analysis (two samples of 200g). The results of the analysis showed that, when evaluating only the roundness of the particles, the received values correlate with the standard particle distribution. However, the amount of analyzed particles also affects the result (see Tables 1 and 2 of the results of measurements and Figure 6).
020406080100
0
10
20
30
0.0 - 0.1 0.1 - 0.2 0.2 - 0.5 0.5 - 1.0 1.0 - 1.4 1.4 - 2.0 2.0 - 3.0 3.0 - 20.0
Cum
ulat
ive
perc
ent o
f tot
al, %
Gra
nule
s dist
ribut
ion,
%
Sieves
Granules cumulative curve
Granules distributionCumulative curve (laboratory data)Measured cumulative curve (D50 = 0.60)Measured cumulative curve with sieve coeff (D50 = 0.48)Measured cumulative curve with sieve coeff (D50 = 0.72)
0
10
20
30
40
0.0 - 1.0 1.0 - 2.0 2.0 - 2.8 2.8 - 3.15 3.15 - 4.0 4.0 - 20.0
Qua
ntity
, %
Sieve size, mm
Indirect measurement of sample no. 1 (distribution by volume)
Reference distribution All granules 10% of most circular granules
5% of most circular granules 2% of most circular granules
Figure 5. The cumulative curve of particle distribution is changed by applying a sievecorrection coefficient.
Two samples were analyzed to evaluate of correlation between indirect measurement results andthe control equipment results. Ammonium nitrate material was used for the analysis (two samples of200 g). The results of the analysis showed that, when evaluating only the roundness of the particles,the received values correlate with the standard particle distribution. However, the amount of analyzedparticles also affects the result (see Tables 1 and 2 of the results of measurements and Figure 6).
Table 1. Circularity evaluation results (sample no. 1).
Sample No. 1Sieve Size
0.0–1.0 1.0–2.0 2.0–2.8 2.8–3.15 3.15–4.0 4.0–20.0
Actual weight (g) 0.4 9.0 49.2 59.6 66.8 15Reference distribution (%) 0.2 4.5 24.6 29.8 33.4 7.5
Cumulative curve 0.2 4.7 29.3 59.1 92.5 100
Particles diagonal ratio (min/max) Indirect measurement (distribution by volume)
0–100% 0.03 7.01 30.03 25.72 32.24 4.9790–100% 0.29 5.92 26.94 30.15 32.78 3.9295–100% 0.14 4.72 25.10 29.60 33.80 6.6498–100% 0.23 5.43 27.03 31.20 30.94 5.17
Circularity distribution
Intervals (%) 0–92 92–94 94–96 96–98 98–100Quantity (%) 38.25 23.16 15.38 10.79 12.42
Symmetry 2019, 11, 838 9 of 16
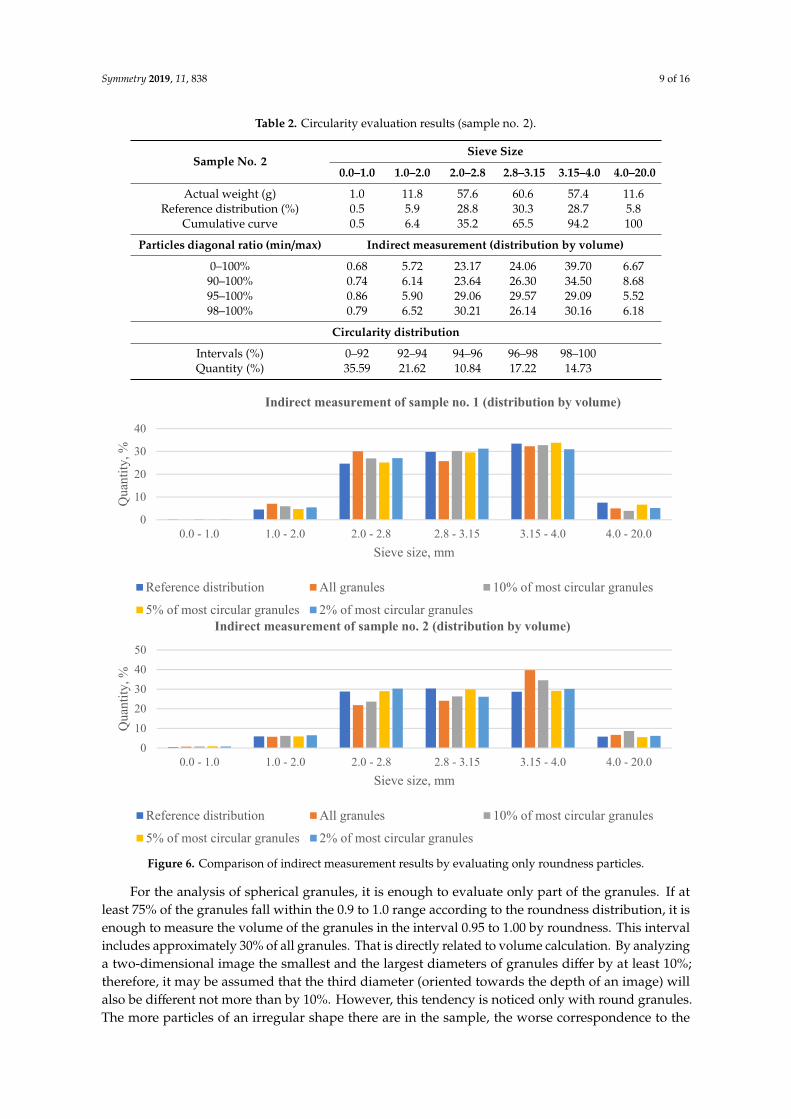
Table 2. Circularity evaluation results (sample no. 2).
Sample No. 2Sieve Size
0.0–1.0 1.0–2.0 2.0–2.8 2.8–3.15 3.15–4.0 4.0–20.0
Actual weight (g) 1.0 11.8 57.6 60.6 57.4 11.6Reference distribution (%) 0.5 5.9 28.8 30.3 28.7 5.8
Cumulative curve 0.5 6.4 35.2 65.5 94.2 100
Particles diagonal ratio (min/max) Indirect measurement (distribution by volume)
0–100% 0.68 5.72 23.17 24.06 39.70 6.6790–100% 0.74 6.14 23.64 26.30 34.50 8.6895–100% 0.86 5.90 29.06 29.57 29.09 5.5298–100% 0.79 6.52 30.21 26.14 30.16 6.18
Circularity distribution
Intervals (%) 0–92 92–94 94–96 96–98 98–100Quantity (%) 35.59 21.62 10.84 17.22 14.73
Symmetry 2019, 11, x FOR PEER REVIEW 8 of 16
Figure 5. The cumulative curve of particle distribution is changed by applying a sieve correction coefficient.
Two samples were analyzed to evaluate of correlation between indirect measurement results and the control equipment results. Ammonium nitrate material was used for the analysis (two samples of 200g). The results of the analysis showed that, when evaluating only the roundness of the particles, the received values correlate with the standard particle distribution. However, the amount of analyzed particles also affects the result (see Tables 1 and 2 of the results of measurements and Figure 6).
020406080100
0
10
20
30
0.0 - 0.1 0.1 - 0.2 0.2 - 0.5 0.5 - 1.0 1.0 - 1.4 1.4 - 2.0 2.0 - 3.0 3.0 - 20.0
Cum
ulat
ive
perc
ent o
f tot
al, %
Gra
nule
s dist
ribut
ion,
%
Sieves
Granules cumulative curve
Granules distributionCumulative curve (laboratory data)Measured cumulative curve (D50 = 0.60)Measured cumulative curve with sieve coeff (D50 = 0.48)Measured cumulative curve with sieve coeff (D50 = 0.72)
0
10
20
30
40
0.0 - 1.0 1.0 - 2.0 2.0 - 2.8 2.8 - 3.15 3.15 - 4.0 4.0 - 20.0
Qua
ntity
, %
Sieve size, mm
Indirect measurement of sample no. 1 (distribution by volume)
Reference distribution All granules 10% of most circular granules
5% of most circular granules 2% of most circular granules
Symmetry 2019, 11, x FOR PEER REVIEW 9 of 16
Figure 6. Comparison of indirect measurement results by evaluating only roundness particles.
Table 1. Circularity evaluation results (sample no. 1).
Sample no. 1 Sieve size
0.0–1.0 1.0–2.0 2.0–2.8 2.8–3.15 3.15–4.0 4.0–20.0 Actual weight (g) 0.4 9.0 49.2 59.6 66.8 15
Reference distribution (%) 0.2 4.5 24.6 29.8 33.4 7.5 Cumulative curve 0.2 4.7 29.3 59.1 92.5 100
Particles diagonal ratio (min/max) Indirect measurement (distribution by volume) 0–100% 0.03 7.01 30.03 25.72 32.24 4.97
90–100% 0.29 5.92 26.94 30.15 32.78 3.92 95–100% 0.14 4.72 25.10 29.60 33.80 6.64 98–100% 0.23 5.43 27.03 31.20 30.94 5.17
Circularity distribution Intervals (%) 0–92 92–94 94–96 96–98 98–100 Quantity (%) 38.25 23.16 15.38 10.79 12.42
Table 2. Circularity evaluation results (sample no. 2).
Sample no. 2 Sieve size
0.0–1.0 1.0–2.0 2.0–2.8 2.8–3.15 3.15–4.0 4.0–20.0 Actual weight (g) 1.0 11.8 57.6 60.6 57.4 11.6
Reference distribution (%) 0.5 5.9 28.8 30.3 28.7 5.8 Cumulative curve 0.5 6.4 35.2 65.5 94.2 100
Particles diagonal ratio (min/max) Indirect measurement (distribution by volume) 0–100% 0.68 5.72 23.17 24.06 39.70 6.67
90–100% 0.74 6.14 23.64 26.30 34.50 8.68 95–100% 0.86 5.90 29.06 29.57 29.09 5.52 98–100% 0.79 6.52 30.21 26.14 30.16 6.18
Circularity distribution Intervals (%) 0–92 92–94 94–96 96–98 98–100 Quantity (%) 35.59 21.62 10.84 17.22 14.73
For the analysis of spherical granules, it is enough to evaluate only part of the granules. If at least 75% of the granules fall within the 0.9 to 1.0 range according to the roundness distribution, it is enough to measure the volume of the granules in the interval 0.95 to 1.00 by roundness. This interval includes approximately 30% of all granules. That is directly related to volume calculation. By analyzing a two-dimensional image the smallest and the largest diameters of granules differ by at
01020304050
0.0 - 1.0 1.0 - 2.0 2.0 - 2.8 2.8 - 3.15 3.15 - 4.0 4.0 - 20.0
Qua
ntity
, %
Sieve size, mm
Indirect measurement of sample no. 2 (distribution by volume)
Reference distribution All granules 10% of most circular granules
5% of most circular granules 2% of most circular granules
Figure 6. Comparison of indirect measurement results by evaluating only roundness particles.
For the analysis of spherical granules, it is enough to evaluate only part of the granules. If atleast 75% of the granules fall within the 0.9 to 1.0 range according to the roundness distribution, it isenough to measure the volume of the granules in the interval 0.95 to 1.00 by roundness. This intervalincludes approximately 30% of all granules. That is directly related to volume calculation. By analyzinga two-dimensional image the smallest and the largest diameters of granules differ by at least 10%;therefore, it may be assumed that the third diameter (oriented towards the depth of an image) willalso be different not more than by 10%. However, this tendency is noticed only with round granules.The more particles of an irregular shape there are in the sample, the worse correspondence to the
Symmetry 2019, 11, 838 10 of 16
results is attained by the control equipment. The relative error of the first sample cumulative curvebetween the control equipment and 5% of round particles is
δ1 = 0.58% (4)
The relative error of the second sample between cumulative curves:
δ2 = 0.57% (5)
The first sample (measurement results is provided in Table 1) is consisted of 29322 granules,of which the circular ones were ranked in the interval 0.95 to 1.00 according to the ratio of the smallestand the largest diameters. The number of particles used to find the distribution:
Quantity1 = 29322×12.42 + 10.79 + 10.16
100= 9784 (6)
The second sample (measurement results is provided in Table 2) is consisted of 30054 particles.The roundest particles from this sample were used to find the distribution by volume:
Quantity2 = 30054×14.73 + 17.22 + 3.19
100= 10560 (7)
The unplanned changes in production conditions determined problems in the measurement.At that time, it is not possible to rely only on the results of the distribution of a part of the most roundedparticles, because the average of the circularity falls below the 0.9 limit. In this case, a correctionof results is necessary. One of the most widely used methods is the use of a linear or nonlinearregression model.
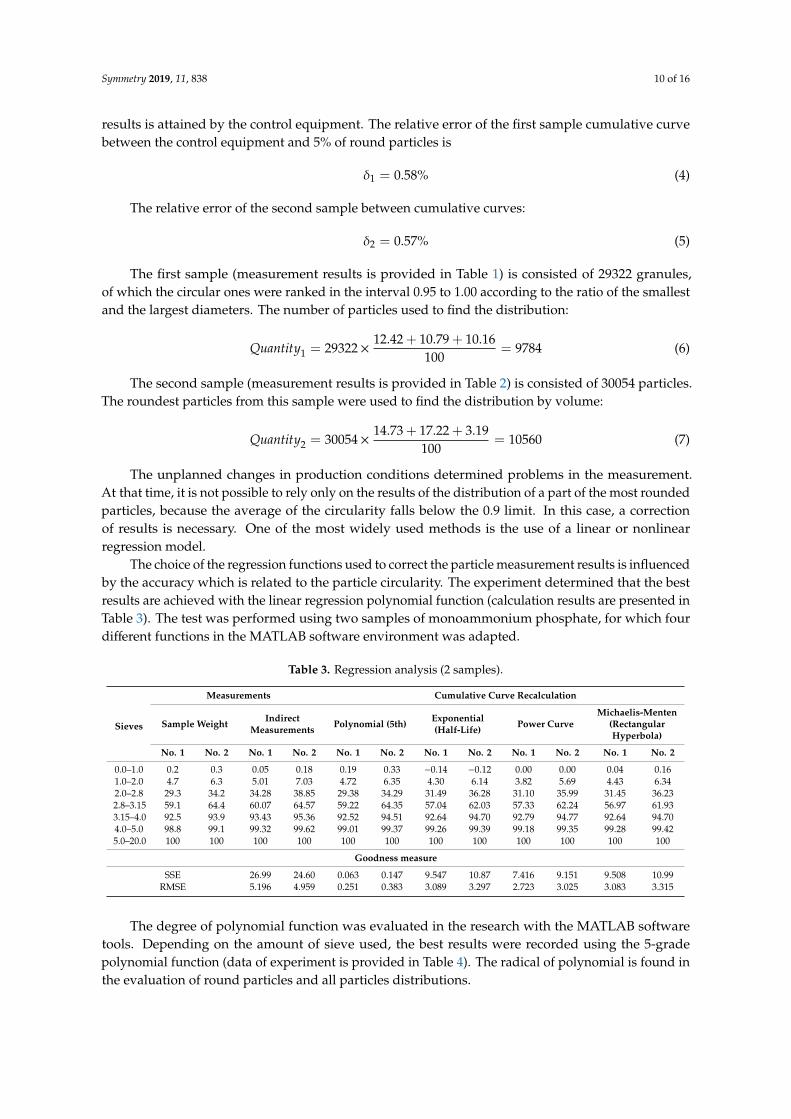
The choice of the regression functions used to correct the particle measurement results is influencedby the accuracy which is related to the particle circularity. The experiment determined that the bestresults are achieved with the linear regression polynomial function (calculation results are presented inTable 3). The test was performed using two samples of monoammonium phosphate, for which fourdifferent functions in the MATLAB software environment was adapted.
Table 3. Regression analysis (2 samples).
Sieves
Measurements Cumulative Curve Recalculation
Sample Weight IndirectMeasurements Polynomial (5th) Exponential
(Half-Life) Power CurveMichaelis-Menten
(RectangularHyperbola)
No. 1 No. 2 No. 1 No. 2 No. 1 No. 2 No. 1 No. 2 No. 1 No. 2 No. 1 No. 2
0.0–1.0 0.2 0.3 0.05 0.18 0.19 0.33 −0.14 −0.12 0.00 0.00 0.04 0.161.0–2.0 4.7 6.3 5.01 7.03 4.72 6.35 4.30 6.14 3.82 5.69 4.43 6.342.0–2.8 29.3 34.2 34.28 38.85 29.38 34.29 31.49 36.28 31.10 35.99 31.45 36.232.8–3.15 59.1 64.4 60.07 64.57 59.22 64.35 57.04 62.03 57.33 62.24 56.97 61.933.15–4.0 92.5 93.9 93.43 95.36 92.52 94.51 92.64 94.70 92.79 94.77 92.64 94.704.0–5.0 98.8 99.1 99.32 99.62 99.01 99.37 99.26 99.39 99.18 99.35 99.28 99.425.0–20.0 100 100 100 100 100 100 100 100 100 100 100 100
Goodness measure
SSE 26.99 24.60 0.063 0.147 9.547 10.87 7.416 9.151 9.508 10.99RMSE 5.196 4.959 0.251 0.383 3.089 3.297 2.723 3.025 3.083 3.315
The degree of polynomial function was evaluated in the research with the MATLAB softwaretools. Depending on the amount of sieve used, the best results were recorded using the 5-gradepolynomial function (data of experiment is provided in Table 4). The radical of polynomial is found inthe evaluation of round particles and all particles distributions.

Symmetry 2019, 11, 838 11 of 16
Table 4. The calculation of polynomial degree (2nd sample).
Sample No. 2Sieve Size
0.0–1.0 1.0–2.0 2.0–2.8 2.8–3.15 3.15–4.0 4.0–20.0
Actual weight (g) 1.0 11.8 57.6 60.6 57.4 11.6Reference distribution (%) 0.5 5.9 28.8 30.3 28.7 5.8
Cumulative curve 0.5 6.4 35.2 65.5 94.2 100
Particles diagonal ratio (min/max) Indirect measurement (distribution by volume)cumulative curve
95–100% 0.86 6.76 35.82 65.39 94.48 100
Conversion of results with 3rd degree polynomial
Recalculated cumulative curve 0.28 7.39 36.50 64.70 96.70 100SSE 1 6.6351
Conversion of results with 4th degree polynomial
Recalculated cumulative curve 1.08 6.41 36.10 65.20 94.60 100SSE 1 0.2919
Conversion of results with 5th degree polynomial
Recalculated cumulative curve 0.86 6.75 35.80 65.30 94.30 100SSE 1 1.739 × 10⁻²⁷
1 SSE—sum of squared errors of predictions.
Recalculated results of all sample particles and the results of control equipment correlate well.The relative error between these measurements is
δ = 0.53% (8)
The 5-degree polynomial function results and those of the control equipment correlate well.The changes in the production can lead to a change of results, but not the precise mismatch of it (theremay be significant differences between the results and results of the control equipment).
Changed conditions of the production highlight the shortages of the polynomial function.When the standard deviation of individual measurement results changes more than 5% together withthe decrease in the average of roundness, the results recalculated in accordance with the polynomialfunction do not correspond to the standard measurement results. Interconnecting measurements ofthe particles having the largest roundness with the remaining ones, it is possible to carry out therecalculation of polynomial function radical after every analysis (algorithm is shown in Figure 2 andmeasurement results are presented in Table 5).
Table 5. The results according to the proposed algorithm.
Sieves(mm)
Sample Measurements Result Indirect Measurement
Weight(g)
Distribution(%)
CumulativeCurve
Last 3 Results from DB CumulativeCurve
Last Meas.Cumulative
Curve
10% of mostCircular
Granules
PolynomialRecalc.
No. 1 No. 2 No. 3 AVG
0.0–1.0 8 4 4 3.19 3.47 4.06 3.57 1.48 2.41 3.521.0–2.0 14 7 11 10.52 12.27 11.45 11.41 2.53 9.88 11.472.0–2.8 32 16 27 29.74 27.82 27.94 28.50 18.44 25.95 28.54
2.8–3.15 44 22 49 51.20 50.77 51.08 51.02 47.29 48.18 50.853.15–4.0 52 26 73 73.63 73.19 74.26 73.69 70.97 74.46 72.694.0–5.0 32 16 91 93.32 93.15 92.45 92.97 92.68 92.17 90.36
5.0–20.0 18 9 100 100 100 100 100 100 100 99.63
In the experiment an average of distribution results of last three measurements was used.According to the current measurement data, distribution of the particles with the largest roundness is

Symmetry 2019, 11, 838 12 of 16
assessed. When carrying out the experiment, 10% of the granules with the largest roundness wereassessed. Distribution of the last measurement of all granules is used to establish polynomial radicalstogether with an average of the measurements from the database. The recalculated result is comparedwith the distribution of the granules having the largest roundness and with the database average.The distribution of the best result is obtained with the lowest relative error:
δrecalc = 1.22% (9)
δ10%_circ = 2.73% (10)
After calculating the estimated errors, the selected particle distribution is recalculated with thepolynomial function (calculation results are presented in Table 5 and Figure 7). The received resultsand the results of control equipment correlate well (distribution by weight).
Symmetry 2019, 11, x FOR PEER REVIEW 12 of 16
2.8–3.15 44 22 49 51.20 50.77 51.08 51.02 47.29 48.18 50.85 3.15–4.0 52 26 73 73.63 73.19 74.26 73.69 70.97 74.46 72.69 4.0–5.0 32 16 91 93.32 93.15 92.45 92.97 92.68 92.17 90.36
5.0–20.0 18 9 100 100 100 100 100 100 100 99.63
In the experiment an average of distribution results of last three measurements was used. According to the current measurement data, distribution of the particles with the largest roundness is assessed. When carrying out the experiment, 10% of the granules with the largest roundness were assessed. Distribution of the last measurement of all granules is used to establish polynomial radicals together with an average of the measurements from the database. The recalculated result is compared with the distribution of the granules having the largest roundness and with the database average. The distribution of the best result is obtained with the lowest relative error:
1.22%recalcδ = (9)
10%_ 2.73%circδ = (10)
After calculating the estimated errors, the selected particle distribution is recalculated with the polynomial function (calculation results are presented in Table 5 and Figure 7). The received results and the results of control equipment correlate well (distribution by weight).
Figure 7. Recalculated indirect measurement results by the average from last 3 measures from database.
3.3. Neural Network Simulation
The Artificial intelligent method was applied to the development of intelligent system [46]. A simulation of the artificial neuron network has been performed using the software MATLAB (structure is provided in Figure 8). The two-layer feed-forward network with sigmoid hidden neurons and linear output neurons was used in the research. The ANN was trained with Levenberg–Marquardt backpropagation algorithm. The results of optical measurement have been recalculated using the samples analyzed by the control equipment in advance. The first sample provided in the table is an average of the last three measurements from the database, which is acknowledged as the standard. In accordance to these measurements, polynomial radicals are calculated and the neuronal network is trained (measurement results are provided in Table 6). Other two measurements use the algorithm provided in Table 5. Distribution of the granules with the largest roundness is presented to the neuron network as well as to the polynomial function. After significant noncompliance has been established between the curves, the cumulative curve of distribution of all particles is presented to the artificial neuron network. The attained results correlate with the mass distribution of the sample.
0
10
20
30
0.0 - 1.0 1.0 - 2.0 2.0 - 2.8 2.8 - 3.15 3.15 - 4.0 4.0 - 5.0 5.0 - 20.0
Qua
ntity
, %
Sieve size, mm
Recalculated indirect measurement results by the average from database (distribution by volume)
Average 10% of most circular granules Polynomial recalc.
Figure 7. Recalculated indirect measurement results by the average from last 3 measures from database.
3.3. Neural Network Simulation
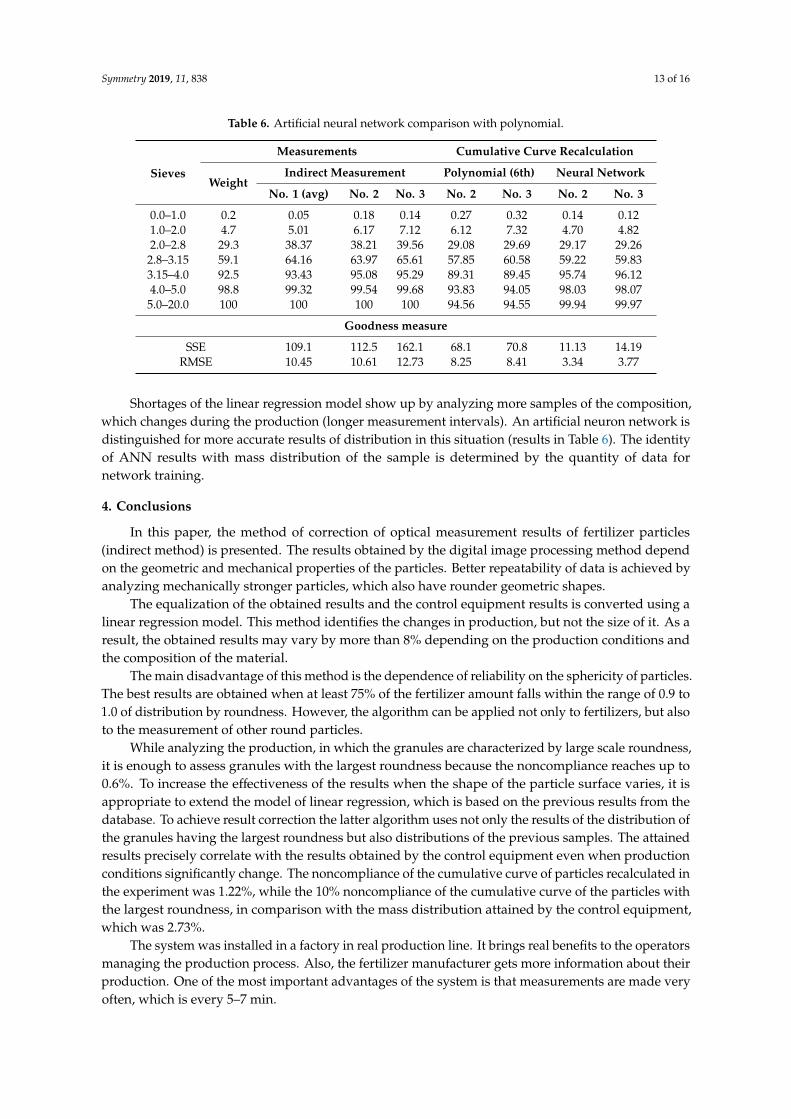
The Artificial intelligent method was applied to the development of intelligent system [46].A simulation of the artificial neuron network has been performed using the software MATLAB(structure is provided in Figure 8). The two-layer feed-forward network with sigmoid hidden neuronsand linear output neurons was used in the research. The ANN was trained with Levenberg–Marquardtbackpropagation algorithm. The results of optical measurement have been recalculated using thesamples analyzed by the control equipment in advance. The first sample provided in the table is anaverage of the last three measurements from the database, which is acknowledged as the standard.In accordance to these measurements, polynomial radicals are calculated and the neuronal network istrained (measurement results are provided in Table 6). Other two measurements use the algorithmprovided in Table 5. Distribution of the granules with the largest roundness is presented to the neuronnetwork as well as to the polynomial function. After significant noncompliance has been establishedbetween the curves, the cumulative curve of distribution of all particles is presented to the artificialneuron network. The attained results correlate with the mass distribution of the sample.Symmetry 2019, 11, x FOR PEER REVIEW 13 of 16
Figure 8. The artificial neural network for the recalculation of fertilizer particles distribution.
Table 6. Artificial neural network comparison with polynomial.
Sieves Measurements Cumulative curve recalculation
Weight Indirect measurement Polynomial (6th) Neural network
No. 1 (avg) No. 2 No. 3 No. 2 No. 3 No. 2 No. 3 0.0–1.0 0.2 0.05 0.18 0.14 0.27 0.32 0.14 0.12 1.0–2.0 4.7 5.01 6.17 7.12 6.12 7.32 4.70 4.82 2.0–2.8 29.3 38.37 38.21 39.56 29.08 29.69 29.17 29.26 2.8–3.15 59.1 64.16 63.97 65.61 57.85 60.58 59.22 59.83 3.15–4.0 92.5 93.43 95.08 95.29 89.31 89.45 95.74 96.12 4.0–5.0 98.8 99.32 99.54 99.68 93.83 94.05 98.03 98.07 5.0–20.0 100 100 100 100 94.56 94.55 99.94 99.97
Goodness measure SSE 109.1 112.5 162.1 68.1 70.8 11.13 14.19
RMSE 10.45 10.61 12.73 8.25 8.41 3.34 3.77
Shortages of the linear regression model show up by analyzing more samples of the composition, which changes during the production (longer measurement intervals). An artificial neuron network is distinguished for more accurate results of distribution in this situation (results in Table 6). The identity of ANN results with mass distribution of the sample is determined by the quantity of data for network training.
4. Conclusions
In this paper, the method of correction of optical measurement results of fertilizer particles (indirect method) is presented. The results obtained by the digital image processing method depend on the geometric and mechanical properties of the particles. Better repeatability of data is achieved by analyzing mechanically stronger particles, which also have rounder geometric shapes.
The equalization of the obtained results and the control equipment results is converted using a linear regression model. This method identifies the changes in production, but not the size of it. As a result, the obtained results may vary by more than 8% depending on the production conditions and the composition of the material.
The main disadvantage of this method is the dependence of reliability on the sphericity of particles. The best results are obtained when at least 75% of the fertilizer amount falls within the range of 0.9 to 1.0 of distribution by roundness. However, the algorithm can be applied not only to fertilizers, but also to the measurement of other round particles.
While analyzing the production, in which the granules are characterized by large scale roundness, it is enough to assess granules with the largest roundness because the noncompliance reaches up to 0.6%. To increase the effectiveness of the results when the shape of the particle surface varies, it is appropriate to extend the model of linear regression, which is based on the previous results from the database. To achieve result correction the latter algorithm uses not only the results of the distribution of the granules having the largest roundness but also distributions of the previous samples. The attained results precisely correlate with the results obtained by the control equipment even when production conditions significantly change. The noncompliance of the cumulative curve
Figure 8. The artificial neural network for the recalculation of fertilizer particles distribution.
Symmetry 2019, 11, 838 13 of 16
Table 6. Artificial neural network comparison with polynomial.
Sieves
Measurements Cumulative Curve Recalculation
WeightIndirect Measurement Polynomial (6th) Neural Network
No. 1 (avg) No. 2 No. 3 No. 2 No. 3 No. 2 No. 3
0.0–1.0 0.2 0.05 0.18 0.14 0.27 0.32 0.14 0.121.0–2.0 4.7 5.01 6.17 7.12 6.12 7.32 4.70 4.822.0–2.8 29.3 38.37 38.21 39.56 29.08 29.69 29.17 29.26
2.8–3.15 59.1 64.16 63.97 65.61 57.85 60.58 59.22 59.833.15–4.0 92.5 93.43 95.08 95.29 89.31 89.45 95.74 96.124.0–5.0 98.8 99.32 99.54 99.68 93.83 94.05 98.03 98.07
5.0–20.0 100 100 100 100 94.56 94.55 99.94 99.97
Goodness measure
SSE 109.1 112.5 162.1 68.1 70.8 11.13 14.19RMSE 10.45 10.61 12.73 8.25 8.41 3.34 3.77
Shortages of the linear regression model show up by analyzing more samples of the composition,which changes during the production (longer measurement intervals). An artificial neuron network isdistinguished for more accurate results of distribution in this situation (results in Table 6). The identityof ANN results with mass distribution of the sample is determined by the quantity of data fornetwork training.
4. Conclusions
In this paper, the method of correction of optical measurement results of fertilizer particles(indirect method) is presented. The results obtained by the digital image processing method dependon the geometric and mechanical properties of the particles. Better repeatability of data is achieved byanalyzing mechanically stronger particles, which also have rounder geometric shapes.
The equalization of the obtained results and the control equipment results is converted using alinear regression model. This method identifies the changes in production, but not the size of it. As aresult, the obtained results may vary by more than 8% depending on the production conditions andthe composition of the material.
The main disadvantage of this method is the dependence of reliability on the sphericity of particles.The best results are obtained when at least 75% of the fertilizer amount falls within the range of 0.9 to1.0 of distribution by roundness. However, the algorithm can be applied not only to fertilizers, but alsoto the measurement of other round particles.
While analyzing the production, in which the granules are characterized by large scale roundness,it is enough to assess granules with the largest roundness because the noncompliance reaches up to0.6%. To increase the effectiveness of the results when the shape of the particle surface varies, it isappropriate to extend the model of linear regression, which is based on the previous results from thedatabase. To achieve result correction the latter algorithm uses not only the results of the distribution ofthe granules having the largest roundness but also distributions of the previous samples. The attainedresults precisely correlate with the results obtained by the control equipment even when productionconditions significantly change. The noncompliance of the cumulative curve of particles recalculated inthe experiment was 1.22%, while the 10% noncompliance of the cumulative curve of the particles withthe largest roundness, in comparison with the mass distribution attained by the control equipment,which was 2.73%.
The system was installed in a factory in real production line. It brings real benefits to the operatorsmanaging the production process. Also, the fertilizer manufacturer gets more information about theirproduction. One of the most important advantages of the system is that measurements are made veryoften, which is every 5–7 min.

Symmetry 2019, 11, 838 14 of 16
The most accurate results of indirect measurements for work with many sieves are attained forcorrection by using an artificial neuron network. The accuracy of the latter results depends on thequantity of the data accumulated for training. Carrying out more accurate measurements requires anassessment of more variables of the production process. In the further investigation, the involvementof humidity and temperature measurements in the artificial neuron network is planned.
Author Contributions: A.L. and V.A. wrote the paper; A.L. and D.A. gave guidance in experiments anddata analysis.
Funding: This research received no external funding.
Acknowledgments: The system was created and all researches were made in JSC “Elinta”. The owner ofintellectual property is JSC “Elinta”. We thank JSC “Elinta” and its director Vytautas Jokuzis for the opportunityto publish this research.
Conflicts of Interest: The authors declare no conflict of interest.
References
1. Laucka, A.; Andriukaitis, D. Research of the Defects in Anesthetic Masks. Radioengineering 2015, 24, 1033–1043.[CrossRef]
2. Stojanovic, Z.; Markovic, S. Determination of Particle Size Distributions by Laser Diffraction. Tech. NewMatter 2012, 67, 11–20.
3. Witt, W.; Heur, M.; Schaller, M. In-line particle sizing for process control in new dimensions. China Particuol.2004, 2, 185–188. [CrossRef]
4. Cornillault, J. Particle size analyser. Appl. Opt. 1972, 11, 265–268. [CrossRef] [PubMed]5. Coghill, P.J.; Millen, M.J.; Sowerby, B.D. On-line measurement of particle size in mineral slurries. Miner. Eng.
2002, 15, 83–90. [CrossRef]6. McClements, D.J. Ultrasonic Measurements in Particle Size Analysis. Encyclopedia of Analytical Chemistry:
Applications, Theory and Instrumentation; John Wiley Sons: Hoboken, NJ, USA, 2006; pp. 88–127. Availableonline: 10.1002/9780470027318.a1518 (accessed on 3 June 2019).
7. Wan, Q.; Jiang, W.K. Near field acoustic holography (NAH) theory for cyclostationary sound field and itsapplication. J. Sound Vib. 2006, 290, 956–967. [CrossRef]
8. Findlay, W.P.; Peck, G.R.; Morris, K.R. Determination of fluidized bed granulation end point usingnear-infrared spectroscopy and phenomenological analysis. J. Pharm. Sci. 2005, 94, 604–612. [CrossRef]
9. Petrak, D. Simultaneous measurements of particle size and particle velocity by the spatial filtering. Part. Part.Syst. Charact. 2002, 19, 391–400. [CrossRef]
10. Dieter, P.; Stefan, D.; Gunter, K. In-line particle sizing for real-time process control by fibre-optical spatialfiltering technique (SFT). Adv. Powder Technol. 2011, 22, 203–208. [CrossRef]
11. Shiina, T.; Muramoto, K. Z-R relation for snowfall using two small doppler radars and snow particle images.In Proceedings of the 2010 IEEE International Geoscience and Remote Sensing Symposium, Honolulu, HI,USA, 25–30 July 2010; pp. 4122–4125. [CrossRef]
12. Kammermeyer, K.; Binder, J. Particle Size Determination by Sedimentation. Ind. Eng. Chem. Anal. Ed. 1941,13, 335–337. [CrossRef]
13. Hossain, M.A.; Mori, S. Determination of Particle Size Distribution of Used Black Tea Leaves by ScanningElectron Microscope. Dhaka Univ. J. Sci. 2013, 61, 111–115. [CrossRef]
14. Ray, O.; Banik, B.; Pani, C. Computational Size Measurement & Study of Nanoparticle Using TransmissionElectron Microscopy Data by Image-Processing. In Proceedings of the 2017 IEEE 7th International AdvanceComputing Conference (IACC), Hyderabad, India, 5–7 January 2017; pp. 656–658. [CrossRef]
15. Gontard, L.C.; Ozkaya, D.; Dunin-Borkowski, R.E. A Simple Algorithm for Measuring Particle SizeDistributions on an Uneven Background from TEM Images. Ultramicroscopy 2011, 111, 101–106. [CrossRef][PubMed]
16. Yantong, Z.; Guoying, Z.; Yu, G. Particle Size Measurement Based on Image Multivariate Multiscale Entropy.In Proceedings of the 2017 IEEE Trustcom/BigDataSE/ICESS, Sydney, Australia, 1–4 August 2017; pp. 973–977.[CrossRef]
Symmetry 2019, 11, 838 15 of 16
17. Jorgensen, T.; Reinholt, F.; Johnsen, O.M. Automatic Particle Analyzing System. US Patent 7154600, 2001.Available online: https://www.google.lt/patents/US7154600 (accessed on 3 June 2019).
18. Freiherr von Hodenberg, M. Device for Determining Parameters of a Bulk Material Particle Flow. WO Patent2008046914, 2008. Available online: https://www.google.lt/patents/WO2008046914A1?cl=en (accessed on3 June 2019).
19. Jorgensen, T.K. Online Sampling Apparatus and Method for Online Sampling. WO Patent 2012083966, 2012.Available online: https://www.google.lt/patents/WO2012083966A1?cl=en (accessed on 3 June 2019).
20. Maaß, S.; Rojahn, J.; Emmerich, J.; Kraume, M. On-line monitoring of fluid particle size distributions in agitatedvessels using automated image analysis. In Proceedings of the 14th European Conf. on Mixing, Warsaw,Poland, 10–13 September 2012; pp. 257–262. Available online: http://mixing14.eu/p/mixing14eu_39.pdf(accessed on 3 June 2019).
21. Lu, Z.; Hu, X.; Lu, Y. Particle Morphology Analysis of Biomass Material Based on Improved Image ProcessingMethod. Int. J. Anal. Chem. 2017, 2017, 1–9. [CrossRef] [PubMed]
22. Hijazi, B.; Cool, S.; Vangeyte, J.; Mertens, K.; Cointault, F.; Paindavoine, M.; Pieters, J. High speed stereovisionsetup for position and motion estimation of fertilizer particles leaving a centrifugal spreader. Sensors 2014,14, 21466–21482. [CrossRef] [PubMed]
23. Närvänen, T.; Seppälä, K.; Antikainen, O.; Yliruusi, J. A New Rapid On-Line Imaging Method to DetermineParticle Size Distribution of Granules. AAPS PharmSciTec. 2008, 9, 282–287. [CrossRef] [PubMed]
24. Kumari, R.; Rana, N. Particle size and shape analysis using Imagej with customized toolsfor segmentation of particles. Int. J. Eng. Res. Technol. 2015, 4, 247–250.Available online: https://www.ijert.org/download/14339/particle-size-and-shape-analysis-using-imagej-with-customized-tools-for-segmentation-of-particles (accessed on 3 June 2019).
25. Watano, S.; Numa, T.; Miyanami, K. On-line Monitoring of Granule Growth in High Shear Granulation by anImage Processing System. Int. J. Chem. Pharm. Bull. 2000, 48, 1154–1159. [CrossRef]
26. Mazzoli, A.; Favoni, O. Particle size, size distribution and morphological evaluation of airbone dust particlesof diverse woods by Scanning Electron Microscopy and image processing program. Int. J. Powder Technol.2012, 225, 65–71. [CrossRef]
27. Watano, S.; Numa, T.; Miyanami, K. A fuzzy control system of high shear granulation using image processing.Int. J. Powder Technol. 2001, 115, 124–130. [CrossRef]
28. Sakamoto, Y.; Tamura, Y.; Kawaguchi, K. Measuring Particle Size Distribution. U.S. Patent 4288162, 1981.Available online: https://www.google.lt/patents/US4288162 (accessed on 3 June 2019).
29. Penumadu, D.; Zhao, R.; Steadman, E.F. Particle Size and Shape Distribution Analyser. U.S. Patent 6960756,1981. Available online: https://www.google.lt/patents/US6960756 (accessed on 3 June 2019).
30. Lieber, K.J.; Browne, I.B.; Tuttle, J. Control Feedback System and Method for Bulk Material IndustrialProcesses Using Automated Object or Particle. U.S. Patent 6885904, 2005. Available online: https://www.google.lt/patents/US6885904 (accessed on 3 June 2019).
31. Nase, T.F.; Vourisalo, Y.R. Procedure and Apparatus for Determining Size and/or Shape Distribution.WO Patent 1990012310, 1990. Available online: https://www.google.lt/patents/WO1990012310A1?cl=en(accessed on 3 June 2019).
32. Ettmuller, J.; Reindel, K.; Schafer, M. Sample‘s Particle Individual, Three Dimensional form e.g. PowderForm, Automated Determining Method, Involves Observing Particles from Two Observation Directions,Where Particle Axis is Aligned along Line Transverse to Observation Direction. DE Patent 102005055825,2007. Available online: https://www.google.lt/patents/DE102005055825A1?cl=en (accessed on 3 June 2019).
33. Canty, T.M.; O’Brien, P.J.; Marks, C.P. Granular Product Inspection Device. U.S. Patent 7009703, 2006.Available online: https://www.google.lt/patents/US7009703 (accessed on 3 June 2019).
34. Niwa, T. Particle Size Measuring Device. U.S. Patent 5379113, 1995. Available online: https://www.google.lt/patents/US5379113 (accessed on 3 June 2019).
35. Schumann, M. Procedure for the Determination of Particle Size Distribution in Particle Mixtures. U.S. Patent5309215, 1994. Available online: https://www.google.lt/patents/US5309215 (accessed on 3 June 2019).
36. Wang, Y.; Lin, C.L.; Miller, J.D. 3D image segmentation for analysis of multisize particles in a packed particlebed. Powder Technol. 2016, 301, 160–168. [CrossRef]
Symmetry 2019, 11, 838 16 of 16
37. Priadarsini, S.; Ganesan, S.; Shanthi, C.; Pappa, N. Model based object recognition for particle size distribution.In Proceedings of the 2014 IEEE International Conference on Advanced Communications, Control andComputing Technologies, Ramanathapuram, India, 8–10 May 2014; pp. 1365–1368. [CrossRef]
38. Atasoy, H.; Yildirim, E.; Yildirim, S.; Kutlu, Y. A Real-Time Parallel Image Processing Approach on RegularPCs with Multi-Core CPUs. Elektronika ir Elektrotechnika 2017, 23, 64–71. [CrossRef]
39. Lech, P.; Okarma, K. Prediction of the Optical Character Recognition Accuracy based on the CombinedAssessment of Image Binarization Results. Elektronika ir Elektrotechnika 2015, 21, 62–65. [CrossRef]
40. Kumara, J.J.; Hayano, K.; Ogiwara, K. Fundamental Study on Particle Size Distribution of Coarse Materialsby Image Analysis. Available online: https://www.researchgate.net/publication/301692754_Fundamental_study_on_particle_size_distribution_of_coarse_materials_by_image_analysis (accessed on 3 June 2019).
41. Tadeusiewicz, R.; Ogiela, L.; Ogiela, M.R. Cognitive Analysis Techniques in Business Planning and DecisionSupport Systems. In Proceedings of the Artificial Intelligence and Soft Computing, Zakopane, Poland,12–16 June 2006; pp. 1027–1039. [CrossRef]
42. Vrbancic, G.; Podgorelec, V. Automatic Classification of Motor Impairment Neural Disorders from EEGSignals Using Deep Convolutional Neural Networks. Elektronika ir Elektrotechnika 2018, 24, 3–7. [CrossRef]
43. Ferrari, S.; Piuri, V.; Scotti, F. Image processing for granulometry analysis via neural networks. In Proceedingsof the 2008 IEEE International Conference on Computational Intelligence for Measurement Systems andApplications, Instanbul, Turkey, 14–16 July 2008; pp. 28–32. [CrossRef]
44. Zhang, Z. An estimation of coal density distributions by weight based on image analysis and MIV-SVM.In Proceedings of the 2015 IEEE Advanced Information Technology, Electronic and Automation ControlConference (IAEAC), Chongqing, China, 19–20 December 2015; pp. 1110–1113. [CrossRef]
45. White, H. Artificial Neural Networks: Approximation and Learning Theory; Blackwell Publishers, Inc.: Cambridge,MA, USA, 1992.
46. Ogiela, L.; Tadeusiewicz, R.; Ogiela, M.R. Cognitive Analysis in Diagnostic DSS-type IT Systems.In Proceedings of the Artificial Intelligence and Soft Computing, Zakopane, Poland, 12–16 June 2006;pp. 962–971. [CrossRef]
© 2019 by the authors. Licensee MDPI, Basel, Switzerland. This article is an open accessarticle distributed under the terms and conditions of the Creative Commons Attribution(CC BY) license (http://creativecommons.org/licenses/by/4.0/).