research methods and skills module - internet archive
TRANSCRIPT

Research Methods and Skills
Module
Dr. Mussaret Anwar Sheikh
Shaista Bibi

Table of content
A. Introduction.......................................................................................................................1
B. Aim.....................................................................................................................................2
C. Module Objectives.............................................................................................................2
Theme One: Perception of research types...............................................................................3
Session I: Introduction of Research..........................................................................................3
1. Session Learning Outcomes...............................................................................................3
2. Key Concepts and Content................................................................................................3
2.1 Key Concept: Research...............................................................................................3
3. Teaching Approaches........................................................................................................6
4. Learning Activities..............................................................................................................6
5. Summary and transition....................................................................................................8
6. Assessment........................................................................................................................8
Theme Two: Planning and Designing a Research Study...........................................................9
Session II: Literature review: Why and How.............................................................................9
1. Session Learning Outcomes...............................................................................................9
2. Key Concepts and Content................................................................................................9
2.1 Key Concept: Literature Review.................................................................................9
3. Teaching Approaches......................................................................................................16
4. Learning Activities............................................................................................................16
5. Summary and transition..................................................................................................17
6. Assessment......................................................................................................................17
Session III: Identifying and Formulating a Research Problem................................................18
1. Session Learning Outcomes.............................................................................................18
2. Key Concepts and Content..............................................................................................18
2.2 Key Concept: Variables.............................................................................................18
3. Teaching Approaches......................................................................................................20
4. Learning Activities............................................................................................................20
5. Summary and transition..................................................................................................20
6. Assessment......................................................................................................................21
Session IV: Research Study Design.........................................................................................22
1. Session Learning Outcomes.............................................................................................22
2. Key Concepts and Content..............................................................................................22
2.1 Key Concept: Research Design.................................................................................22
3. Teaching Approaches......................................................................................................25
4. Learning Activities............................................................................................................25
5. Summary and transition..................................................................................................26
6. Assessment......................................................................................................................26
Session V: Research tools.......................................................................................................28
1. Session Learning Outcomes.............................................................................................28
2. Key Concepts and Content..............................................................................................28
2.1 Key Concept 1: Research Tools for Data Collection.................................................28
2.2 Key Concept 2: The Questionnaire...........................................................................29
2.3 Key Concept 3: The Interview...................................................................................29
2.4 Key Concept 4: The Observation..............................................................................30
2.5 Key Concept 5: Observational Checklist...................................................................30
2.6 Key Concept 6: Scales...............................................................................................31
2.7 Key Concept 7: Tests.................................................................................................31
3. Teaching Approaches......................................................................................................33

4. Learning Activities............................................................................................................33
5. Summary and transition..................................................................................................33
6. Assessment......................................................................................................................34
Session VI: Selecting Samples.................................................................................................35
1. Session Learning Outcomes.............................................................................................35
2. Key Concepts and Content..............................................................................................35
2.1 Key Concept 1: Population.......................................................................................35
2.2 Key Concept 2: Sample.............................................................................................36
3. Teaching Approaches......................................................................................................37
4. Learning Activities............................................................................................................37
5. Summary and transition..................................................................................................38
6. Assessment......................................................................................................................39
Session VII: Writing a Research Proposal...............................................................................40
1. Session Learning Outcomes.............................................................................................40
2. Key Concepts and Content..............................................................................................40
2.1 Key Concept: Research Proposal..............................................................................40
3. Teaching Approaches......................................................................................................44
4. Learning Activities............................................................................................................45
5. Summary and transition..................................................................................................45
6. Assessment......................................................................................................................45
Theme Three: Conducting a Research Study..........................................................................48
Session VIII: Research Ethics...................................................................................................48
1. Session Learning Outcomes.............................................................................................48
2. Key Concepts and Content..............................................................................................48

2.1 Key Concept: Ethics Concerning Research Participants in the Procedure of Data
Collection/Fieldwork........................................................................................................48
3. Teaching Approaches......................................................................................................49
4. Learning Activities............................................................................................................50
5. Summary and transition..................................................................................................50
6. Assessment......................................................................................................................50
Session IX: Processing and Analyzing Data.............................................................................51
1. Session Learning Outcomes.............................................................................................51
2. Key Concepts and Content..............................................................................................51
2.1 Key Concept 1: Data Analysis...................................................................................51
2.2 Key Concept 2: Quantitative and Qualitative Research...........................................51
2.3 Key Concept 3: Statistical Analysis...........................................................................52
2.4 Key Concept 4: Descriptive Statistics.......................................................................52
2.5 Key Concept 5: Categorical Data..............................................................................53
2.6 Key Concept 6: Frequency Distribution....................................................................53
2.7 Key Concept 7: Graphs.............................................................................................54
2.8 Key Concept 8: Numerical Data................................................................................55
2.9 Key Concept 9: Inferential Statistics.........................................................................56
3. Teaching Approaches......................................................................................................56
4. Learning Activities............................................................................................................57
5. Summary and transition..................................................................................................57
6. Assessment......................................................................................................................58
Session X: Processing and Analyzing Qualitative Data...........................................................59
1. Session Learning Outcomes.............................................................................................59
2. Key Concepts and Content..............................................................................................59

2.1 Key Concept: Qualitative Data Analysis...................................................................59
3. Teaching Approaches......................................................................................................62
4. Learning Activities............................................................................................................62
5. Summary and transition..................................................................................................63
6. Assessment......................................................................................................................63
Theme Four: Research Writing...............................................................................................64
Session XI: Academic Research Writing..................................................................................64
1. Session Learning Outcomes.............................................................................................64
2. Key Concepts and Content..............................................................................................64
2.1.1 Key Concept 1: Plagiarism......................................................................................64
2.1.3 Key Concept 2: Ethics of Research..........................................................................66
2.1.4 Key Concept 3: Intellectual Property Rights...........................................................66
3. Teaching Approaches......................................................................................................72
4. Learning Activities............................................................................................................72
5. Summary and transition..................................................................................................72
6. Assessment......................................................................................................................73
Theme Five: Supervising Academic Research.........................................................................74
Session XII: Academic Supervision..........................................................................................74
1. Session Learning Outcomes.............................................................................................74
2. Key Concepts and Content..............................................................................................74
2.1 Key Concept 1: The Role of the Supervisor..............................................................74
2.2 Key Concept 2: The Role of the Supervisees............................................................77
2.3 Key Concept 3: The Viva/Thesis Defense.................................................................78
2.5 Key Concept 4: Publication.......................................................................................79
3. Teaching Approaches......................................................................................................82

4. Learning Activities............................................................................................................82
5. Summary and transition..................................................................................................82
6. Assessment......................................................................................................................82
D. Materials..........................................................................................................................84
E. References and Bibliography.........................................................................................120

A. Introduction
Research in our universities has become an indispensable component of eligibility for
a degree. The education programmes in the universities in social sciences and natural
sciences may vary, but practically in all such programs there is a requirement of research.
In the world of academia, there are some new terms used with knowledge, such as,
knowledge economy, knowledge arts, etc. Research also comes under knowledge.
Therefore, mastering knowledge of research methods or basics of research is not only a
necessity, but also very essential and useful for universities.
The Research Methods and Skills Module is written primarily for you to teach your
graduate students. At this level they will, probably for the first time, encounter formal
training in conducting research.
In this module, you are first introduced to the concept of research along with
definitions of, the reasons for conducting research, where it is conducted, how it is done,
and by whom. It is followed by an important question 'why research' and finally it addresses
the attributes of quality research. Furthermore, you will have an overview of the kinds of
research under the qualitative and quantitative paradigm. Additionally, the research
process has to adhere to some ethics that you have to keep in mind.
You cannot undertake research until you have read and reviewed literature. A
thorough reading of related literature helps you select a research
problem. Based on the literature, you formulate your research
question/problem for building your logical framework. Here you are
also briefed as to how to access resources and use them for your
research with proper citations and references.
The research outcomes have to be measured for which you need reliable and valid
tools for collecting data from your sample selected from the population. After your data
collection you are ready for its analysis using either descriptive or inferential statistics with
or without the statistical package of SPSS. In the course of data collection you will need to
write various letters for which we give you exposure to forms of academic writing. Putting
everything together is the final activity of research where you learn to prepare the research
report/manuscript. The finale session of the module is how to perform your role as a
supervisor.
1
B. Aim
The primary aim of this module is to introduce the faculty participants to the
concept of research and key elements involved in the research process.
C. Module Objectives
Participants will demonstrate knowledge of
the concept of research
the reasons for conducting research, where it is conducted, how it is done,
and by whom.
why research
the attributes of quality research.
qualitative and quantitative research.
ethics of research
2

THEME ONE PERCEPTION OF RESEARCH TYPES
Session I: Introduction of Research (1.5 hours)
1. Session Learning Outcomes
After the completion of this session the participants will be able to:
explain the meanings of research and its functions
compare types of research from different view points
employ the appropriate research type to their respective discipline
2. Key Concepts and Content
2.1 Key Concept: Research
Research has different meanings to different people. If you understand the concept
of research at an early stage, it would be easy for you to deal with more concepts in the
research process. The following definitions will help you in understanding the research
concept.
According to Oxford English Dictionary (2002), research is defined as “the systematic
study of materials and sources in order to establish facts and reach new conclusions.”
McMillan and Schumacher (1997) define research as “a systematic process of
collecting and analysing information (data) for some purpose.”
Kerlinger (1986) defines scientific research as, “Systematic, controlled, empirical, and
critical investigation of natural phenomena guided by theory and hypotheses about the
presumed relations among such phenomena.”
2.1.1 Why do research?
We conduct research because we want to explore ideas
and find solutions that make sense. In doing so a person thinks,
constantly assesses, reassesses and makes decisions about the
best possible means of obtaining information that is trustworthy.
We may like to call this process a person’s thinking game or
3

whole brain activity and the psychologists call it right and left brain attributes (Cherry et.al.
1993).
2.1.2 Where does research occur?
Research is conducted in many settings: educational institutes, laboratories,
classrooms, libraries, the city streets, foreign cultures, etc. Some research is of short
duration. Other research is spread over a long period of time. Research is usually done at
universities at graduate or undergraduate levels as a required course. It can be done in
various formats which fall under the categories of qualitative and quantitative research, the
details of which will follow later in the module. Research is done by researchers, who are
professors from education, natural sciences or social sciences, experts, and students of
graduate or undergraduate programmes from related and multiple disciplines.
2.1.3 What do researchers use?
The information gathered through research recommendations provides an insight to
the researchers for future course of action to be taken for better implementation and
application. Some businesses, industry and Departments of Education spend vast amounts
of money for research activity for improvement and advancement in their programs.
2.2 Research Types
When carrying out research, our purposes are different. Therefore research types
will vary according to our purposes. The major research types will fall under application,
objectives, inquiry mode, and sometimes we may use mixed method research.
2.2.1 Application (Pure and applied research)
Applied research is "hands-on", which means that the researcher is actually working
with the topic/subjects while conducting the research. Generally, applied research focuses
on "practical problems" such as climate change in order to come up with solutions to better
or improve an existing condition.
Basic research is often considered researching for the sake of increasing knowledge
as opposed to applied where the research truly is intended to solve a problem. Basic
Research is often called "pure" research and is considered the foundation for applied
research.
4

2.2.2 Objectives (Descriptive, Co-relational, Exploratory and Explanatory)
Descriptive research is also called statistical research. The main goal of this type of
research is to describe the data and characteristics about what is being studied. The idea
behind this type of research is to study frequencies, averages, and other statistical
calculations. Although this research is highly accurate, it does not gather the causes behind
a situation.
Correlation research measures the relationship between two or more variables or
gives an indication of how one variable may predict another.
Exploratory research is a type of research conducted because a problem has not
been clearly defined. Exploratory research helps determine the best research design, data
collection methods, and selection of subjects. Given that it is fundamental in nature,
exploratory research often concludes that a perceived problem does not actually exist.
Explanatory research explores "why," and attempts to explain as the purposes of
explanatory research. It builds on exploratory and descriptive research and further identifies
the reasons for something that occurs. It looks for causes and reasons.
2.2.3 Inquiry mode (qualitative and quantitative)
The inquiry mode of research can be categorized as qualitative and quantitative:
Qualitative research is research undertaken to gain insights concerning attitudes,
beliefs, motivations and behaviours of individuals, to explore a social or human problem.
Qualitative research methods include focus groups, in-depth interviews, observation
research, and case studies. You can use qualitative research to study past events or current
events. When you use it for past events, it is specifically called historical research. The
salient features of qualitative research are:
Conducted to have an insight and better understanding of not only about the
current situation is but also why it is so.
More open and responsive to the research participants.
Uses a variety of methods and data collection strategies,
Offers opportunities for descriptive and exploratory studies.
Quantitative research is research concerned with the measurement of attitudes,
5

behaviours and perceptions. It includes interviewing methods such as telephone, intercept,
and door-to-door interviews, as well as self-completion methods such as mail outs and
online surveys. Quantitative research:
Means the data is analyzed in terms of numbers.
Involves the collection of numerical data.
Predicts and explains data in the form of statistical analysis.
Uses the numerical method to analysis and interpret the results.
Finds out the relationship among quantifiable variables and the results are
inferred.
3. Teaching Approaches
The introductory part of Research Methods and Skills will be delivered through:
Ice breaking activity, which engages the participants
Lectures based on PowerPoint presentations designed on key points of the
content
Participant discussions and activity based worksheets
4. Learning Activities
4.1 Activity 1: Ice-breaking Activity
Objectives of the activity:
The activity aims at making participants feel comfortable about research in
Pakistan in general. Introduction to research is an entry into an alien world.
The activity will also enable the participants to see how they can relate
research to their daily lives; and will help them understand that it is a systematic
process that involves certain steps.
As an ice-breaking activity, the facilitator can ask the participants to think and
plan for buying something such as a car, a dress or a television. Let us suppose
6

that the facilitator asks participants to plan for buying a car, the facilitator would
give directions and set the limits for this planning. For example:
You have 5 lacs to buy a car
You can buy only one car; and have to spend all the money but can not over
spend.
You may buy a new or an old car.
Now ask the participants to think of their personal and social context, personal and
family needs, likings /choices, limitations etc. and ask them to rationally plan the process.
Give them ten minutes to plan.
Now ask them how they planned it. As some of the participants share how they
planned it, through this discussion establish that the planning involves a complete research
process. One has to see the problem and needs. One has to do literature review by
gathering information from relatives, friends, or family who have already bought car. The
process also involves research methodology. For instance, some participants will directly go
to the market and survey; some would contact a dealer in cars; and some would go for the
newspaper advertisements.
Ask them in the same way how they would analyze gathered information and share
that it is their data analysis that leads to their conclusions and decision making.
4.2 Activity 2: Identify the Research Types from the Following
After the introductory lecture on types of research, the facilitator will provide the
participants with a worksheet which contains the following statements:
1. If you are going to study the relationship between job satisfaction and career
development of secondary school teachers, this is an example of
_________________________________.
2. If you are going to find out causes of dropouts in primary schools of Rawalpindi,
this is an example of ____________________________.
The facilitator will ask the participants to fill in the blanks with appropriate
statements about the types of research.
7

5. Summary and Transition
In this introductory session of the module, you have learned about the different
definitions of research, why research is done, where it is conducted and what researchers
use. At the end of the section, you have acquired basic knowledge about research methods
and skills based on your educational background and professional experiences. You can
easily differentiate among perspectives on and approaches for classifying different research
types. The classification will help you understand different concepts related to research
described in later sessions.
6. Assessment
Match the research types with the descriptions.
8
Applied research
to describe the data and characteristics about what is being studied
Basic research
looking at the past events
Descriptive research
to gain insights concerning attitudes, beliefs
Correlational research
predicts and explains data in the form of statistical analysis
Exploratory research
helps determine the best research design and data collection method is pure research
earch
often concludes that a perceived problem does not actually exist
Historical research
Qualitative research
Quantitative research
researching for the sake of knowledge as opposed to applied

THEME TWO PLANNING AND DESIGNING A RESEARCH
STUDY
Session II: Literature Review: Why and How (1.5 hours)
1. Session Learning Outcomes
After the completion of this session, the participants will be able to:
identify and formulate a research problem using literature review as sources
of information
construct research hypotheses on the basis of knowledge of the research
area through literature review
access resources and use the proper citations and references
construct reliable research tools for data collection on the basis of how other
researchers in the field worked
2. Key Concept and Content
2.1 Key Concept: Literature Review
Literature review is an important part of any research. It provides an underpinning
for the research by enlightening the researcher about the process.
2.1.1 Literature review as sources of information and its procedure
Any research, no matter at what scale, requires reading about what other people
have done in the area of your interest, how they have done it, and what are the gaps in the
research in that area. Any new production of knowledge is necessarily based on previous
and existing knowledge. You need information to support or refute your arguments and
write about your findings. You need to provide evidence that you are aware of the current
trends and issues in your area of interest and are cognisant of the current state of
knowledge on the subject.
Ideally this reading should form the basis for choosing your research methodology.
However, this is usually not possible in practice. After some preliminary reading, the
research topic is finalized. Reading continues and spills over into the stage of data collection
9
and analysis. Some reading is naturally required at the stage of interpretation of the
qualitative or quantitative data to embed your research in its milieu. Moreover, every new
article/book you read will have a cumulative effect on the existing body of knowledge in
your mind, pushing to you reinterpret or rethink some of your previous assumptions or
ideas. But there is a limit to the changes you can make in your literature review. The best
way is to prepare a first draft and then polish it at the stage of data interpretation when you
will be reading your literature review again to present your analysis in a coherent manner
with cross-references related to your literature review.
2.1.2 Why review literature?
Some reasons for including a literature review in your research paper/thesis are:
1. The basic reason for literature review is to contextualize your research. Every
academic research project is related to a particular area and is a link in a chain of
similar research taking place in the area. This contextualization shows your
awareness of the work going on in your field and also identifies the niche you
wish to occupy.
2. It gives you ideas about how to classify and present your data. When you read
critically, you can sees how writers explore the relationships between facts and
how facts and relationships are explained. Methods used by other writers may
not be suitable for your purposes, but they may give you ideas about how you
might categorize your data.
3. Literature review helps you to distinguish what has been done from what needs
to be done and how it should be done. Readings in an area reveal gaps in the
literature and this fine tunes your research question and subsequent research
methods.
4. Literature review assists you to synthesize your ideas and gain perspectives to
look at your research problem with different lens. Other researchers may have
looked at a similar issue but from different angles. This knowledge can fortify you
to find your own angle.
10

2.1.3 Sources of literature review
One important question that new researchers always ask is “Where do we find the
material for doing a literature review?” The following are the primary and secondary
sources for finding the material that you need to read:
Articles in Journals
Books
Internet
Research Reports
Government Documents
Abstracts
Reviews
Unpublished Theses
Electronic Research Information Center/Social Sciences Citation
Index/Dissertation Abstracts Index
Most of this material is now available on the Internet. Libraries in established higher
education institutions are another rich resource for locating the required materials.
2.1.4 Managing the literature
The bibliography at the end of a recent article or book can provide you with an
adequate reading list of most of the relevant material related to that topic. Once the
relevant literature has been located and found through the sources suggested, the next
step is to manage it. This requires efficient and selective reading. Once you try locating the
relevant literature, you will discover that it is available in vast quantities. Now the primary
task is to pick out the material that is actually related and relevant to your research area.
This requires you to be a proficient reader who can get the gist of things quickly as you will
have to go through a lot of reading.
In an article published in a journal, the first thing to do is look at the abstract or
summary of the article. This will give you an idea whether it is relevant for you. In the case
of a book you should look at the list of contents, the blurb, the summaries usually given at
11
the end of the chapters and the introduction. This will tell you quickly if any part is pertinent
for you.
The next step is to follow a clear system of keeping track of your reading references.
You need to create a management system that will incorporate your sources with all
relevant details including a note about where you found that article or book. This means
that you put down that the article/book was on the shelf of your supervisor or in the library
of the Institute of Business Administration. This will save a lot of hassle and futile finger-
biting at the end when you desperately need a page number for a quote and cannot
remember where you had found the material. The convenient traditional way was to write
down the complete bibliographical reference (based on the style you will follow) on a 6x4
inch Index Card. These cards are much better than papers as they are hardier, will not fly
away under the fan, can be stored alphabetically in shoe boxes, and can be spread like deck
of cards with respect to the notes that are written. Today, a number of computer programs
like Endnote, Procite, or Reference Manager are available to keep track of your references.
These programs can automatically format references in any number of styles once the basic
details have been entered.
It is also useful to annotate your references. You can write brief notes on the Index
Cards. This will provide you with a methodical and organized review of materials that you
have read. It is a record of the accuracy, relevance, and quality of the sources you have
consulted. Your critical comment, that is your informed and considered evaluation, can also
be added. These annotations can be varying in length and content depending on the
pertinence of the material reviewed. It will minimize the time when you have to incorporate
them in your writing.
2.1.5 Brief Sample Annotation
Sample from O’Leary, 2004: 75O’Leary, Z (2001) ‘Conversations in the Kitchen’, In A.
Bartiett and G. Mercer (eds). Postgraduate Research Supervision:
Transforming Relations. New York: Peter Lang.
Citation
(Harvard
reference)The author is a senior lecturer at the University of Western
Sydney who has written a chapter in a book targeting
postgraduate research students and supervisors.
Author /
Audience
This is basically an anecdote that discusses, and attempts to Summary
12

normalize the emotional and intellectual hardships many research
students can go through when trying to juggle family obligations
and study.The anecdote is quite short and written in a warm and
personal style that makes it very easy to relate to. It is not,
however, a research study backed up by any data/rigour and
therefore does not allow one to assess the extent of the issues
raised to whether the concerns she raises are widespread. That
said it does not seem to relate well to the more rigorous research
studies conducted by Field and Howard (2002) and Dreicker (2003)
on similar issues.
Critical
Comment
This relates quite well to my chapter on ‘coping
mechanisms and strategies for managing roles and workloads’ and
may be good for a quote or two especially if I feel my text is too
dry.
Relevance
2.2 Presenting the Literature Review
The formal literature review is a very specific piece of writing
designed to inform your readers of your topic, establish your credibility
as a researcher, and argue the need for, and relevance of, your work.
Most find it difficult task that takes patience, practice, drafts, and
redrafts. (O’Leary, 2004:84)
O’ Leary’s quote encapsulates the essence of the literature review. You have to be
certain that the review is adequate and sufficient. It should not be a shopping list or a
catalogue of books and articles that you have read, but should help in making a case for
your study.
Clarity is essential in presenting your ideas. The literature review should have a
definite structure based on the arguments that you want to make or the task that you want
to accomplish through it. Prepare a blue print of the structure of your research. This can be
revised as your thinking evolves but a basic outline would help you to begin writing. You can
also use it to fill in the bits and pieces as your reading advances or your theoretical
perspectives develop.
Use empirical evidence to substantiate your argument (Gay, 2000). This will
authenticate your stance. Citing opinions only can weaken the review. Moreover, be careful
13

to be recent and up to date in citing. With the Internet revolution, the pace of knowledge
generation and meaning making has multiplied manifold and access to the Internet is also
within reach. Be judicious in the selection of relevant literature and avoid the temptation to
include every single source that you have accessed.
One valid suggestion for writing a good literature review is to read a few well-
written literature reviews. This will give you an idea about how to go about it. At the end, I
would like to say again what was said earlier; let the literature review be an ongoing process
that overlaps other stages of your research. It will then support your arguments and
contribute to your analysis and interpretation of the data.
In social sciences, literature review is usually a separate chapter. Sometimes it is
built into the introduction and chapters related to methodology and analysis. However, in
sciences, the literature review is usually part of the introduction. The role of literature
remains the same both in sciences and social sciences.
A note of caution: Be valiant and get feedback from your peers and supervisor. Be
prepared to redraft and revise.
2.3 Sample of Literature Review
If you are doing action research, a good way to begin your literature review would be
to define what it is.
Action Research
Action research can be defined as the process of studying a
real school or classroom situation to understand and improve the
quality of actions or instruction…. It is a systematic and orderly way
for teachers to observe their practice or to explore a problem and a
possible course of action…. Action research is also a type of inquiry
that is pre-planned, organized, and can be shared with others.
(Johnson, 2005: 21)
Action research in fields other than education involves studying a real problem in its
authentic setting such as in industry, in agriculture in a community setting. Etc. Nunan (1992:
18) suggests that for ‘Kemmis and McTaggart the essential impetus for carrying out action
research is to change the system’. Cohen and Manion (1985: 219), however, suggest that
action research may in fact be ‘concerned with innovation and change and the way in which
these may be implemented in ongoing systems’ (authors' italics). They have a more
14

integrative approach compared to the more revolutionary one of Kemmis and McTaggart.
This approach is more appropriate for our indigenous locale.
Lieberman (1986) has defined collaborative action research as a tool for staff
development and an opportunity for teachers and university researchers to work together to
investigate and solve school and classroom challenges. This research practice is encouraged
in the departments of education in the universities in Pakistan.
Finnan (1992) states that interventions can succeed if they are designed to help
members of the school community (culture) make the changes they have identified as
important. As most of their school teachers are trained in research, academics from Higher
Education Institutions collaborate with them to plan successful interventions for facilitating
teaching and learning. This is not our scenario. We have externally prepared curriculaI
imposed on us. All that we can do is may be graft an innovation onto an 'ongoing system
which normally inhibits innovation and change' (Cohen and Manion, 2003, p. 220) to
facilitate learning across the curriculum. This is a process that can be initiated and practiced
by classroom practitioners individually and collectively.
McCarthy and Riner (1996) argue that the obvious strength of action research is that
it creates an environment where assumptions are opened for questioning. They reiterate Oja
and Pine (1989 as cited in Webb, 1990) by stating that teachers participating in action
research become more critical and reflective about their own practice and attend more
carefully to their methods, their perceptions and their approach to teaching process. The
research of Qadir (1996) is a proof of this.
It is a participatory process in which teachers are … ‘creating new data and new
interpretations as they struggled to understand each other’ (Johnston, 1990: 180). Teachers
involved in collaborative action research ‘usually feel empowered both professionally and
personally and there is a decrease in their feeling of frustration and isolation. … These
outcomes are typically attributed to the collaborative nature of teacher research’ (Henson,
2001: 821). Firestone and Pennell (1993) also reiterate that collaboration becomes an
intrinsically reinforcing activity that builds commitment to teaching. It is therefore a
preferred mode of research at school and tertiary level for classroom practitioners.
3. Teaching Approaches
The session on literature review will be delivered through:
15

Lectures based on PowerPoint presentations (The facilitator should use all
the headings in 2. Key Concepts and Content of this session and should write
the main points under each heading by using bullets.)
Handouts are to be used. Provide 'Brief Sample Annotation' given in 2. Key
Concepts and Content to the participants as a handout.
'Sample of Literature Review' given in 2. Key Concepts and Content can also
be provided as a handout that participants can carry as a future reference. Or,
show this sample on the PowerPoint and generate a discussion based on it.
Group work of the Participants
4. Learning Activities
4.1 Objective of the Activity
To give the participants a practical experience of how to do a literature review.
4.2 Activity
After the facilitator has delivered the lecture, if possible, take the participants to the
library; if not possible, arrange for almost 30 books. Make 5-6 sets of these books; each set
of books should be related to one general theme. Use 5-6 themes such as higher education
in Pakistan, gender issues, primary education, and teaching of English etc.. Give these sets
to different groups. Ask each participant to develop a research topic for himself/herself and
then do a brief literature review using the set of books provided to his or her group.
If they are using a library, they can use journals and Internet as well. Ask them to
consult 5 to 7 sources to write their literature review. Content of the session will serve as
the resource.
16

5. Summary and Transition
In the literature review session of the module, you have learned what a literature
review is, and why review of literature is necessary for any research. You have also been
introduced to various sources for conducting literature review. It is also discussed how
literature review can be managed well. To facilitate learning, a brief sample of annotation
and a sample literature review are also provided.
6. Assessment
Assessment would be done through the outcome of the activity of writing literature
review as provided in '4. Learning Activities'.
17

Session III: Identifying and Formulating a Research Problem (1.5 hours)
1. Session Learning Outcomes
After the completion of this session, the participants will be able to:
identify and formulate a research problem using literature review as sources
of information
identify research variables
construct research hypotheses
write a statement of the research problem
formulate research questions
2. Key Concepts and Content
2.1 Define a Research Problem
This is a fact that research starts from some problem. The research journey starts
from the identification of the problem. To work on that specific problem only the
identification is not sufficient. It is necessary for the researcher to define that problem in
more practical terms. Literature review helps the researcher in defining the research
problem so that it can be measured in its true sense.
2.2 Key Concept: Variables
A variable is a characteristic that takes on different values or conditions for different
individuals. Variables are of different types:
Dependent variables are the variables that we measure to determine if the
independent variable has an effect, such as science achievement. The dependent variable is
what is affected by the independent variable.
Independent variables often simply are classifying variables, classifying the
individuals of the research study. For example, if we are looking at the student’s
achievements in science using some new teaching methods, then the teaching method
would be an independent variable and the achievement of the student is an independent
variable.
18

Controlled variables are independent variables. They are controlled variables only if
their effects are determined, i.e., controlled. In the example of science achievement, the
learning style of the students is an organismic variable, as it would probably appear as an
intervening variable. For example: a treatment of program or cause.
Extraneous variable is related to the dependent or independent variable, but is not
part of the experiment.
Moderator variable is related to the independent and dependent variable and has
an impact on dependent variable. In such a situation, it becomes an interacting variable
also.
2.3 Constructing Hypothesis
A hypothesis is a specific statement of prediction, which is also called an academic
guess. It describes in concrete (rather than theoretical) terms what you expect will happen
in the research. Not all studies have hypotheses. Sometimes research is designed to be
exploratory. In such a case, there is no formal hypothesis. A single study may have one or
many hypotheses:
Null hypothesis is the hypothesis in which there is no relationship between two or
more variables. It is symbolized as H0.
Research hypothesis or the alternate hypothesis proposes a relationship between
two or more variables and is symbolized as H1.
Directional hypothesis is one tailed. You assume that by manipulating the
independent variable the dependent variable will change in a specific direction. You can
predict if this change will be positive or negative.
Non-directional research hypothesis is two tailed. You assume that by manipulating
the independent variable there will be a change in the dependent variable. You cannot
predict if this change will be positive or negative.
2.4 Writing a Statement of Research Problem
A good research statement makes clear to the reader what issue the research
is dealing with.
Ideally a research statement should be presented in one sentence.
A research problem statement is to the point, focused, and measurable; it is
not ambiguous and abstract.
19

Now select a research topic and try to write the research problem.
3. Teaching Approaches
The session on identifying and formulating a research problem will be delivered
through:
Lectures based on PowerPoint presentations
Participatory activities
Discussion
Practical experience through exercises
4. Learning Activities
To introduce the topic and deliver the contents, the facilitator should use all
the headings in 2. Key Concepts and Content of this session and should write
the main points under each heading by using bullets. Mainly it would be lecture
based. However, asking questions, sharing examples, and giving comments can
help engage participants.
While the participants are introduced to what a research problem is, what
variables are, how a good hypothesis can be constructed, and how a research
problem is stated, the facilitator should give the participants two to three
examples of each topic at different stages in research; and should ask the
participants to apply this knowledge to practical instances.
The content of the session will serve as resources.
5. Summary and Transition
In this session of the module, you have learned what a research problem is, what is
the definition of a variable, what are different types of variables, and how the research
problem is stated, what is a hypothesis, and what are the characteristics of a good
hypothesis.
20

6. Assessment
Assessment would be activity based. Prepare a handout of the following to use it for
assessment:
Activity 1
Identify the independent and dependant variables in the following situation:
A university teacher is interested in determining the best way to teach introductory
technology course, and ensure that her students have learned the material.
Activity 2
Formulate hypotheses for the following two situations:
Situation 1
What effects does viewing violence on television have on boys?
Situation 2
A sanitation department is nearby and the smell is coming from the same direction.
The sanitation department does a series of steps to process the sewage and wastewater.
Hypothesis: If __________________________then___________________________.
21

Session IV: Research Study Designs (1.5 hours)
1. Session Learning Outcomes
After the completion of this session, the participants will be able to:
define different research designs and their functions
adopt appropriate approach for selecting a study design
differentiate among different study designs according to the characteristics
2. Key Concept and Content
2.1 Key Concept: Research Design
We cannot conceptualize a research design until we are sure what we want to do.
Therefore it is very important that we exactly know what we mean by the terms and
language we use. It should not be vague or unspecified. Conceptualization is to specify
exactly what we mean and don’t mean by the terms we use in our research.
You may call the research design a plan for addressing the research question you
have posed. Your question points to a particular type of study: Is it going to be an
exploratory or explanatory study? Your question points to the target population: The group
of people you would study for your question. Your question also points to the kinds of
questions you would ask and how you would go about asking the questions.
2.2 Different Study Designs
The research is not restricted to one single design. The researcher can adopt any of
the design according to the requirements of the research. Following are most commonly
used research designs:
2.2.1 Based on the number of contacts
Based on the number of contacts following are the most commonly used research
study designs:
the longitudinal study design
the cross-sectional study design
22

2.2.2 The longitudinal study design
The longitudinal research design employs the following characteristics:
Longitudinal research design is to track participants over an extended
amount of time (5 years, 10 years, 15 years etc).
Same people are studied at more than one time to record the developments
in growth etc.
People hesitate to become the sample of these studies due to the long
duration.
2.2.3 Cross sectional study design
The cross sectional research design employs the following characteristics:
Involves studying many people at one point in time.
Involves less time period and cost as compared to the longitudinal method.
Describes the linear relationship (positive or negative) between the variables.
2.2.4 Based on the reference period
The historical study design is a commonly used design under the category of
reference period:
2.2.5 Historical study design
Following are its main features:
Historical research, also known as “Historiography”, is related to the
interpretation of the events which can be in the form of issues or the
movements that have occurred in the past and factual analysis.
It is longer than other types of research because the researcher has to search
for the documents and has to do a deep analysis of these documents.
After the identification of issue, data is collected through:
o primary sources which can be the original documents or the people who
have themselves experienced that particular event.
23

o secondary sources which can be the second-hand documents or the people,
who did not experience themselves but they know about that event.
Material is studied, information is synthesized, facts are analyzed, and the
results are drawn.
The researcher is more responsible in selecting the documents as the
accuracy of these documents counts a lot in producing the authentic results.
2.2.6 Based on the nature of investigation
According to the nature of the investigation, research designs have following
categories:
the experimental study design
the non-experimental study design
the quasi-experimental design
2.2.7 The experimental study design
Experimental designs involve the control and the treatment groups to check the
cause and effect relationship. In experimental design, the researcher chooses some element
to try it out and to check its effect on something else. Both the treatment technique and its
effect on the specific subjects on which the treatment is applied are termed as the
Independent and dependent variables respectively.
2.2.8 The non- experimental study design
Non-experimental research includes a variety of different methods that describe
relationships between variables. They do not set out or test, any causal relationship
between variables.
Non-experimental research methods are descriptive, historical, or correlational.
2.2.9 The quasi-experimental study design
In the quasi-experimental research you assign the participants to groups based on
some characteristics or quality that these people bring to the study. It is also called post hoc
research or after the fact research.
24

2.2.10 Case study
The study of an individual or an institution in a unique setting or situation in
an intense and detailed manner for long period of time.
Several techniques can be used within a case study i.e. Interviews,
Observations or Experiments
Data collected through case studies lead to the formation of the theories.
The results may be affected by researcher’s own perceptions and the results
cannot be generalized.
2.2.11 Action research
Action research is a methodology that combines action and research to examine
specific questions, issues or phenomena through observation and reflection, and deliberate
intervention to improve the practice.
3. Teaching Approaches
The content of the session will be delivered using the following approaches:
Lectures on each of the research designs clarify the meaning of
conceptualization. PowerPoint presentations can be designed to highlight the
bullet points
Discussion of participants on differences and similarities among research
designs
Involve the participants through activity based tasks
4. Learning Activities
4.1 Activity 1
The ML will present n interactive lecture on the content of this session noted
above.
4.2 Activity
25

The objective of this activity is o enable the participants to identify the research
study design used in research articles. In this activity, the facilitator will bring some research
articles according to the field of specialization of the participants or take the participants to
the library. According to the number of available research articles the groups of the
participants will be made. The participants will be asked to:
Read these research articles
Identify the research study design used in the research
Define the procedure of study design used in the research study
Share with other groups
5. Summary and Transition
In this session, you have learned about different research designs and important
functions involved in each research design. Approaches for selecting the research designs
will help you select appropriate research design for conducting research in the social setting.
The concepts described here will help you in your professional life while conducting your
own research or as resource persons for teaching research methods and skills as a subject.
6. Assessment
The learning of the participants will be assessed through the following activity:
Carefully read the statements given below and answer the following questions:
What is the design used in the research study?
What do you say to support your argument?
Statements
1. If you were to test a group working women to assess coping strategies in
their workplace in 1995 again the same group in 2000 and again in 2005, this is an
example of ________________________________.
Justification/Argument for your answer
___________________________________________________________________
___________________________________________________________________
26

2. Effectiveness of cognitive behaviour therapy for the treatment of aggression
in adolescents, this is an example of ______________________.
Justification/Argument for your answer
___________________________________________________________________
___________________________________________________________________
3. The speech problem of a hearing impaired child in school, this is an example
of ________________________________.
Justification/Argument for your answer
___________________________________________________________________
___________________________________________________________________
27

Session V: Research Tools (2 hours)
1. Session Learning Outcomes
After the completion of this session, the participants will be able to:
understand the characteristics of the valid and reliable research tools
define the procedure for the construction of different research tools
construct reliable research tools for data collection
2. Key Concepts and Content
2.1 Key Concept 1: Research Tools for Data Collection
Tools of research are basically used for data collection. These tools vary from one
research type to another. Qualitative and quantitative researchers use different tools of
measurement according to the purposes. Before proceeding further, let us look at the term
“data” and understand its application in research.
Data include:
Facts and principles used in finding the answers.
Characteristics of people i.e. ages and income etc.
Scores in tests and anecdotal records of the students.
Answers to questions whether in questionnaires or in interviews etc.
Measures of scales and statements of the beliefs and opinions.
Laws and descriptions of the social set-up in which the research is being
conducted etc.
The following are the most commonly used tools for the collection of data:
Questionnaires
Interviews
Observations
Tests (achievement, aptitude, personality, vocational and personality etc.)
28

Scales (nominal, ordinal, interval, ratio, likert etc.)
2.2 Key Concept 2:The Questionnaire
Questionnaires are the most commonly used tool for the collection of data, which
involve the following details:
Questionnaire: a written document based on different open and close-ended
questions with different purposes, sizes and appearances.
It is used for descriptive research studies to get information from the
research participants or target population.
It is used when the straightforward information is required and the
respondents of the study are large in number.
Time and cost is involved in getting the print and postage.
Can be group administered (if the respondents are illiterate, the research can
ask the questions directly from the respondents and record their answers) and it
can be self-administered (when the respondents themselves answer the
questions).
2.3 Key Concept 3: The Interview
A less technical tool for the collection of data in the form of formal
conversation i.e. in surveys.
Can be structured, unstructured and semi-structured:
o Structured: tight control over the questions and answers.
o Unstructured: Interviewee is free to share his/her thoughts and the
interviewer can change the next question in the light of what has answered
the interviewee.
o Semi-Structured: Although tightly controlled yet a bit of flexibility for the
interviewee in answering the questions.
Can be:
o One to One: meeting between one researcher and one respondent.
29

o Group Interviews: meeting between one researcher and more than one
respondent.
o Focus Group: collection of information on non-sensitive issues by arranging
a discussion of experts.
Can be conducted face to face, or through telephonic or other electronic
sources i.e. e-mail etc.
Notepad, tape recorder, video recorder are the equipment used to record
and save the data.
2.4 Key Concept 4: The observation
Observation is the recording of the behaviour of the sample.
Relies on what the researcher has witnessed rather than on what people say
or think about issues.
Observation can be of two types:
o Participant Observation: When you as a researcher become part of some
social set-up and people know that they are being observed.
o Non-participant or Systematic Observation: When you do not interfere in
the social set-up, or do not disturb the natural settings of the sample to be
observed.
Behaviour is recorded through observational checklist.
2.5 Key Concept 5: Observational Checklist
There are a lot of techniques, which can be used for observing the behavior of the
sample i.e. field notes, tape and video recording, and the observation checklists.
Observational checklist is prepared by the researcher. Observation checklist is based on
rating scales and the coding systems. Different forms of rating scales are present in
observation checklists and you must know the proper coding system. There can be different
techniques for preparing the observation checklist according to the requirement of the topic
and the perception of the observer. But most observational checklist can be based on
following categories:
30

Duration Recording: length of time involved in occurrence of some
behaviour.
Frequency Recoding: number of occurrence of behaviour.
Interval Recording: observation of one subject during a fixed period of time.
Continuous Recording: each and every happening is recorded.
2.6 Key Concept 6: Scales
Measurement scales are used to collect the different forms of data and quantify the
response of the respondents to measure the variables. The type of measurement scale will
depend upon the type of data i.e. nominal, ordinal, interval and ratio. Scales can also be part
of a questionnaire.
(See Learning Material for Session V for Details)
2.7 Key Concept 7: Tests
Test is a measurement tool, which is used to measure the performance of an
individual in some specific areas of interest. There are two main types of tests:
Norm Referenced or Standardized Tests and Criterion Referenced Tests.
In norm referenced tests, the norms are used relatively to measure the
performance of some individuals. Norms are basically the standard with which
the performance is compared. Following are the most commonly used types of
norm referenced tests:
o Achievement Tests: to measure the performance of an individual in
different subjects which they have learned and interpreting this
performance in the form of grades to compare with the performance and
learning of others.
o Aptitude Tests: to measure the potential of some individual in learning
about what s/he can learn not about what s/he has already learned.
o Intelligence Tests: to measure the mental abilities i.e. to analyze the
situations, to create meaning and to organize the ideas and to measure the
abstract intelligence of an individual.
31
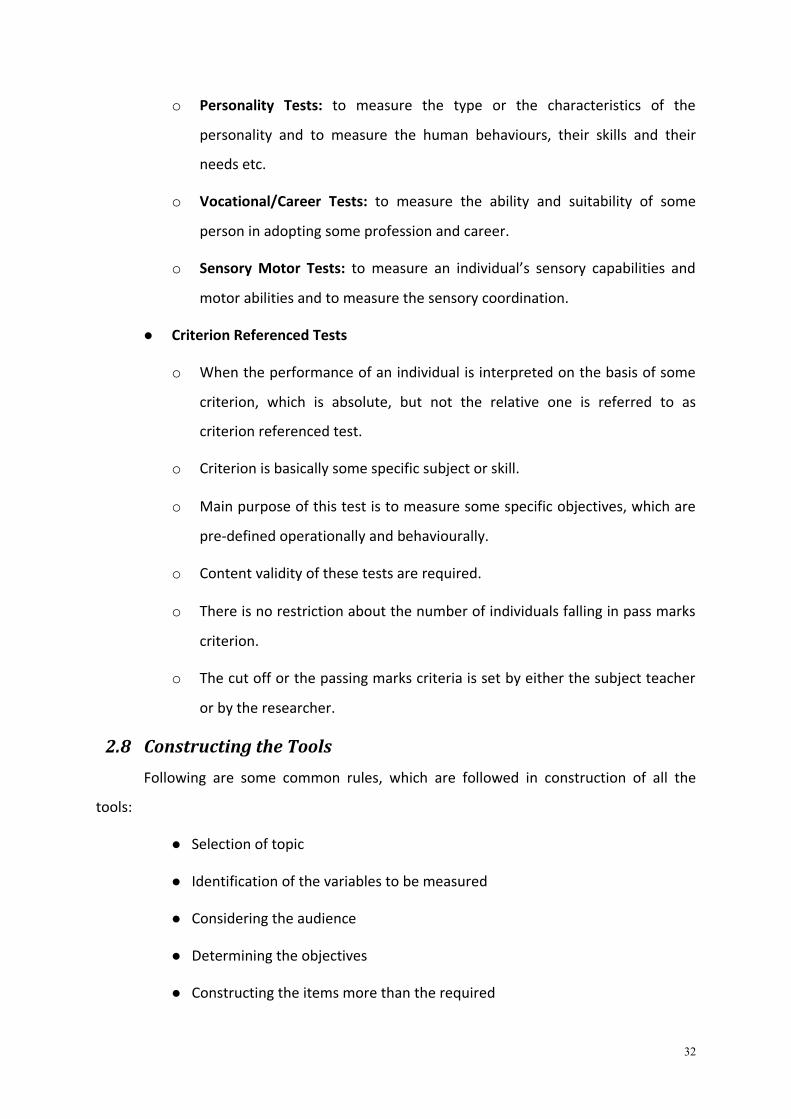
o Personality Tests: to measure the type or the characteristics of the
personality and to measure the human behaviours, their skills and their
needs etc.
o Vocational/Career Tests: to measure the ability and suitability of some
person in adopting some profession and career.
o Sensory Motor Tests: to measure an individual’s sensory capabilities and
motor abilities and to measure the sensory coordination.
Criterion Referenced Tests
o When the performance of an individual is interpreted on the basis of some
criterion, which is absolute, but not the relative one is referred to as
criterion referenced test.
o Criterion is basically some specific subject or skill.
o Main purpose of this test is to measure some specific objectives, which are
pre-defined operationally and behaviourally.
o Content validity of these tests are required.
o There is no restriction about the number of individuals falling in pass marks
criterion.
o The cut off or the passing marks criteria is set by either the subject teacher
or by the researcher.
2.8 Constructing the Tools
Following are some common rules, which are followed in construction of all the
tools:
Selection of topic
Identification of the variables to be measured
Considering the audience
Determining the objectives
Constructing the items more than the required
32

Selecting of the most appropriate items
Development of Keys (If necessary)
Assigning Codes (If necessary)
Pilot testing of the tools
Determining the Validity and the Reliability of the tests
o Reliability: Consistency of the results of the test
o Validity: Does the test measure what it is actually supposed to measure?
3. Teaching Approaches
The content of the session can be delivered through following approaches:
Lectures on the characteristics of each tool and how to design these tools
through PowerPoint presentations based on important points
Group work of the participants in performing activities
4. Learning Activities
The facilitator is required to perform any one or two of the three activities in D1.
Learning Material of Session V by involving the participants after the content is delivered.
The objective is to enable the students to work on already designed tools and get a better
understanding of the construction of these tools.
5. Summary and Transition
Collection of data is the most important part of all the studies, whether qualitative or
quantitative. Data cannot be collected without a measurement tool. If you are using any
standardized or pre-established tool, it will guide you in the process of administering the
tool and coding the data. If you are using the tool constructed by yourself, you have to have
a thorough study of the details about the tools given in this section. You have leaned about
different tools, their purposes, and their uses. It can be certainly said that all the tools are
similar to a great extent. You can combine two or more than two tools for the collection of
33

data. You can include different scales into your questionnaires and interviews as well. So if
you are able to design a good research tool, you will collect authentic data based on it.
34

6. Assessment
The facilitator will ask the participants to do the following activities in the light of the
learned materials:
List the types of measurement tools.
Compare the use of measurement scales.
Differentiate between the norm referenced and criterion referenced tests.
Consult the recommended readings and find out how to determine the
validity and the reliability of the tools.
35

Example of Population:
All the private schools of Rawalpindi
All the seventh grade students of Islamabad
All the primary school teachers All the slum areas of the city
Session VI: Selecting Samples (1 hour)
1. Session Learning Outcomes
After the completion of this session, the participants will be able to:
define the population and sample
differentiate between the probability and non probability sampling
apply procedures involved in different sampling techniques
2. Key Concepts and Content
2.1 Key Concept 1: Population
Population is a large group of people, which you specify to conduct the research and
to answer the research question. Population is the area where the results of the study are
generalized. Population is the whole or the entire group; the research study is being
conducted to get information about the population, whose properties are analyzed to find
the answer or the solution to the research question and the results are drawn from the
analysis. Population is referred to as “Whole” or “All”.
36

Example of Sample:
Fifty students of fifth grade
Sixty primary school teachersHundred students studying in private school
2.2 Key Concept 2: Sample
Sample is a smaller group, which is selected from the population to be observed and
included in the research. Results are drawn from the sample and generalized to the entire
population. Sample size depends upon the requirement of the research. To get the concept
of the sample, look at the following example:
2.3 Need for Sampling
A question may arise in your mind, “why to select the sample if the population is
there to be studied and to get information?” There can be many answers to this question:
Impossibility of studying each and every individual in the whole population.
Studying the whole population requires more time and efforts of the
researcher.
Large amount of money is involved in studying the whole population
2.4 Steps involved in Selecting the Appropriate Sample
Following are the steps involved in the selection of an appropriate sample:
Defining the population
Selection of specified group from population referred to as accessible
population (Salkind, 1997).
Selection of the sample from that accessible population.
2.5 Types of Sampling
Now what will you do to get a representative and unbiased sample? So the research
offers following two sampling techniques to select the sample for the study:
Probability Sampling
Non-Probability Sampling
37

2.5.1 Probability sampling
In probability sampling, every individual in the population has a non-zero chance to
be included in the sample of the study. It provides the researcher with a more
representative sample, so it is a more reliable sampling procedure.
There are four types of probability sampling:
1. Simple Random Sampling
2. Stratified Sampling
3. Cluster Sampling
4. Systematic Sampling
2.5.2 Non-probability sampling
In non probability sampling the sample is not selected randomly. It is used where the
population is widely spread and it is difficult to use any sampling frame for such a great
population.
Following are the most commonly used techniques of non-probability sampling:
1. Purposive Sampling
2. Quota Sampling
3. Convenience Sampling
4. Snowball Sampling
(See Learning Material for Session VI for Details)
3. Teaching Approaches
The content in this session will be taught through the following approaches:
Lectures based on PowerPoint presentations
Group work based on activities after the lecture
4. Learning Activities
After the completion of lecture, the facilitator will arrange some research articles or
take the participants to the library. Then the groups of 4-5 members will be formulated. 2
articles will be given to each group. The group members will be asked to do the following:
Identify the population and sample of the researches in article
38

_________________________________________________________________
___________________________________________________________
If you conduct a research and select a sample, what will you use in the
following situations?
o If you use the simple random sampling, what will be the procedure?
______________________________________________________________
______________________________________________________________
o If you use the systematic sampling, what will be the procedure?
______________________________________________________________
______________________________________________________________
o If you use the cluster sampling, what will be the procedure?
______________________________________________________________
______________________________________________________________
o If you use the stratified sampling, what will be the procedure?
______________________________________________________________
______________________________________________________________
Resources: (See Learning Material for Session VI for Details)
5. Summary and Transition
Results of a research are generalized if they have been taken from a representative
sample. The whole process of identifying the population and selecting the sample from this
population has been explained in this section. Different sampling procedures have been
highlighted in this section. If you apply these procedures to your own researches, you will be
able to produce the authentic and more generalizable results from the sample of your
research.
39

6. Assessment
Based on the work done in lecture and the activities, the assessment will be done
through the following activity.
The facilitator will ask the participants to answer the following questions:
Differentiate between the population and sample.
Briefly discuss the need for sampling.
Write down the procedure for selecting the appropriate sample.
If you conduct a research, which sampling type you will use, probability or
non probability? Why will you select this type, discuss?
40

Session VII: Writing a Research Proposal (1.5 hours)
1. Session Learning Outcomes
After the completion of this session, the participants will be able to:
understand what the important components of a research proposal are
write a research proposal
2. Key Concept and Content
2.1 Key Concept: Research Proposal
Writing a research proposal is a different experience than any other types of writing.
It involves more clarity of mind as well as a more systematic approach towards the writing
process itself. A research proposal is an outline, a sketch, or a blueprint of a building that
you want to build. In fact you can divide your whole research work into three stages:
Stage i - Thinking About the Research
Stage ii - Preparing the Research Proposal
Stage iii - Conducting the Research
This chapter mainly deals with the first two stages. It addresses the issues of thinking
systematically, identifying a research problem, defining the topic, preparing a title, forming
a hypothesis, and making research questions.
2.1.1 Where to start from?
Do not abruptly start writing your research proposal; think well before you write.
Thorough and detailed thinking would reduce the number of attempts to revise the
proposal. At the ‘Thinking about it Stage’ it can be helpful if you:
are inclusive with your thinking
write down your ideas
are not overly influenced by others- it’s your research
try and set a realistic goal
set appropriate time lines
41

Once you start thinking, your line of thought should be in the following sequence:
Idea ↓
Topic ↓
Problem statement ↓
Hypothesis ↓
2.1.2 Defining the topic
A well-defined research topic gives focus, sets boundaries, and provides direction. It:
1. Defines and identifies the focus of the research.
2. Defines the nature of the research endeavour- whether the aim is to discover,
explore, explain, describe, or compare.
3. Defines the areas of interest- whether the interest is why, when, where, what,
or how.
4. Indicates if a relationship is foreseen between concepts being explored- whether
looking for impacts, decreases, causes, correlations, etc.
2.1.3 Including a title on your proposal
Title of your research is the first introduction of the reader to your work which
implies it should clearly convey the intended message. Preparing a good title means:
having the most important words appear toward the beginning of your title
limiting the use of ambiguous or confusing words
looking for unnecessary words when you have too many words, and
including key words that will help researchers in the future.
2.1.4 Selection of a research problem
At the outset of your research, make sure you have identified a worthwhile problem
which has not been previously answered. Since research is always about some problem/s,
identification and selection of this problem is most crucial in designing a research proposal.
According to Tuckman (1994), “Although selecting the research problem is one of the most
difficult steps in the research process, it is unfortunately the one for which the least
42

guidance can be given”. However, According to Tuckman (1994), a problem statement must
have the following characteristics:
It should ask about a relationship between two or more variables.
It should be clearly and unambiguously stated.
It should be stated in question form (or, alternatively, in the form of an
implicit question such as, the purpose of this study was to determine
whether…).
It should be testable by empirical methods; that is, it should be possible to
collect data to answer the question(s) asked.
It should not represent a moral or ethical position.
Apart from these guidelines provided by Tuckman (1994), it can also be useful if
ensure that the problem that you have identified is of some theoretical or practical
significance. It can also be helpful if from the wide range of potential problems for study, at
the initial stage, you narrow the range to problems that are relevant to your academic/
professional interest and current level of research skills. Later on, considering other factors
such as available resources, time etc. you can select a problem for your research. Tuckman
(1994) has presented various models that can be helpful in the selection of a problem; for
instance, the following three-dimensional model:
43

2.1.5 Statement of the problem: examples
A problem can be stated in the form of an explicit or an implicit question. For
example:
The study examined whether students taught by direct method achieved higher
reading scores than those taught by the communicative approach. (Implicit question)
Or, What is the relationship between motivation and achievement? (Explicit
question)
2.1.6 What is a hypothesis?
Once you have identified and stated a problem, the next step is to create a
hypothesis. Putting it in a simple way, a hypothesis is a wise or educated guess. It is an
assumed answer to the question posed in a research problem statement. However, it is only
an ‘assumed’ answer or an expectation that is tested in the study later on. You must bear in
mind that a hypothesis differs from an observation, which represents outcomes actually
found.
44

2.1.7 How to form a hypothesis?
Focusing on your research problem, you can create the hypothesis. Simply try to give
a direct answer to the question posed in the problem statement. For example:
Research Q1: What is the relationship between motivation and achievement?
Hypothesis1a: Motivation and achievement are positively related.
However, this is not the only possible guess you can make. You may assume that:
Hypothesis 1b: Motivation and achievement are negatively related.
Thus, a hypothesis shows some (positive or a negative) relationship between the
variables. As far as the question of structuring a hypothesis is concerned, there can be
varieties of ways for instance:
Research Q2: Do students learn more from a directive or nondirective teacher?
Hypothesis 2: Directive teachers give more effective instruction than non-directive
teachers.
It is also important here to introduce you to the ‘Null Hypothesis’. It is a small little
creature who says: ‘I represent no relationship between the variables that you are studying’.
Example: There is no relationship between motivation and achievement.
2.1.8 Where do hypotheses come from?
Given a problem statement- Are A and B related? A researcher can construct three
possible hypotheses:
1. Yes, as A increases, so does B.
2. Yes, as A increases, B decreases.
3. No, A and B are unrelated.
The number of possible hypotheses may possibly increase as the number of variables
increases.
3. Teaching Approaches
This session will be delivered through:
Lectures based on PowerPoint presentations which will be designed on the
key points of the content
Activity based tasks
45

4. Learning Activities
To introduce how to write research proposal, the facilitator needs to make a
PowerPoint presentation from the contents, especially using the points that are
given in the form of bullets under various headings in the contents.
The facilitator will take the participants through
o Idea ↓
o Topic ↓
o Problem statement ↓
o Hypothesis
At every stage of delivery, ask participants to practically do it that is ask each
participant to choose an idea, then to develop a topic out of it, and finally write
the problem statement and finally make the hypothesis.
Resources: The content will serve as resource.
5. Summary and Transition
In this session of the module, you have learnt the important components of a
research proposal: problem statement, research question, and hypothesis.
6. Assessment
6.1 Exercise 1: Self Test Items
1. Which of the following statements is phrased as a research problem?
The purpose of this study is to determine
a. whether the promotion policy should be changed.
b. the truth of the proposition that American education has encouraged a social class
system in the United States.
c. how students can overcome test anxiety.
d. whether there is a difference in the mean gain scores in reading achievement
between comparable students taught word attack skills and those taught comprehension
skills.
46
2. The statement of the research problem provides
a. the educational context of the study.
b. the framework for reporting the results.
c. the importance of the study.
d. All of the above are correct.
3. Quantitative problem formulation requires
a. the use of deductive logic for the problem.
b. selection of a construct, variables, and operational definitions.
c. selection of a population and/or sample.
d. All of the above are correct.
4. Quantitative research questions may be phrased to indicate
a. a descriptive study of current status of a group.
b. a relationship study predicting the influence of one variable on another variable.
c. a comparative study between two or more data sets.
d. All of the above are correct.
5. A statement of the expected relationship or difference between two or more
variables is called a
a. concept.
b. hypothesis.
c. definition.
d. construct.
6. Which is an incorrect statement regarding a research hypothesis? A research
hypothesis
a. is supported or not supported.
b. relates variables that can be measured, manipulated, or categorized.
c. is more specific than the problem statement.
d. is the same as a statistical hypothesis.
7. Which of the following criteria for a good research hypothesis is violated most in
the following hypothesis: Students in an exploratory vocational educational program will
make more contributions to society than those not enrolled in the program.
a. A hypothesis is concise.
b. A hypothesis is worthy of testing.
47

c. A hypothesis can be stated operationally.
d. A hypothesis is logically precise.
6.2 Exercise 2: Application Problems
Answer the questions for each research problem.
1. The following are examples of research topics. Indicate the decisions necessary
in order to conduct the study, and restate each as a useful research question.
a. effects of different ways of learning social studies
b. effects of cooperative versus competitive instruction on attitudes toward learning
c. opinions of parents toward education
d. family characteristics and school attendance
e. validity of WISe for school performance
2. Write a directional hypothesis for the following problem statement, and identify
the type of variables in the hypothesis. "Low-achieving students frequently respond
positively to behaviour modification programs. Is there any relationship between the type
of reward (tangible or intangible) and the amount of learning?"
3. State a hypothesis based on each of the research questions listed below:
a. What is the effect of individualized and structured social studies on high school
students?
b. Is there any difference in students' engagement in tasks when a teacher uses a
positive introduction and when a teacher uses a neutral introduction to tasks?
c. Does non-promotion of elementary pupils improve their personal adjustment?
d. Do middle school children produce more narratives when taught in an academic
teacher's class or when taught in a cognitive-development teacher's class?
e. Do teachers' perceptions of job stress differ among teachers of mildly retarded,
moderately retarded, and non-retarded children?
48

THEME THREE CONDUCTING A RESEARCH STUDY
Session VIII: Research Ethics (1 hour)
1. Session Learning Outcomes
After the completion of this session, the participants will be able to:
understand the ethics involved in conducting research
recognize the three research ethics concerning the research participants
2. Key Concept and Content
2.1 Key Concept: Ethics Concerning Research Participants in the
Procedure of Data Collection/Fieldwork
Recognize the three main research ethics related to research participants. In
research ethics, you have to follow the application of fundamental ethical principles to a
variety of topics in scientific research. Different disciplines and professions have norms for
behavior that suit their particular aims and goals. Some of the norms promote the aims of
research, such as pursuit of knowledge and truth as well as avoidance of error. The research
ethics maintain prohibitions against fabricating, falsifying, or misrepresenting research data.
It helps to promote the truth and avoids error. The ethical standards promote the values
that are essential to collaborative work, because research often involves a great deal of
cooperation and coordination among different participants, disciplines, and institutions. The
ethical norms such as patenting policies, data sharing policies, and confidentiality rules in
peer review are designed to protect intellectual property interests while encouraging
collaboration.
2.2 Information for Participants
In context of all research, there is the need for cooperation and collaboration from
the participants who may belong to different disciplines and institutions. The first and
foremost thing is to seek their cooperation. They have rights and they cannot be forced into
participation. It is their voluntary participation that is needed. This will only happen on the
assurance of honouring and upholding their rights.
49

2.3 Informed Consent
The second research ethic is to get information from the people, who are going to be
your participants. You cannot work with them unless you have their consent. You get their
consent by informing them about what you are going to do. You give this information
through an informed consent form, which is on the official letter pad and carries the
following:
the purpose of the research
who you are
what you are doing
how long will the participants be involved
an offer to withdraw from the experiment at any time for any reason
potential benefits to the individual as well as to society
potential harm or risks for discomfort to the individual
an assurance that the results will be kept in strict confidence
how to get a copy of the results
how can you be reached should anyone have questions
a place for the participants to sign to confirm their willingness
Informed consent form is to inform and not to force people into participating.
2.4 Maintaining Confidentiality
The third very important research ethic is the participants right of privacy through
our assurance of confidentiality. The participants need the assurance that their information
will not be made available to anyone who is not directly connected with the research. The
information provided by the participants should in no way reveal their identity. This means
they will remain anonymous through out the study.
3. Teaching Approaches
The research ethics will be taught by the following method:
Lecture with a PowerPoint presentation.
50

Group discussion on the three research ethics related to the participants
4. Learning Activities
The facilitator will introduce the theme by brainstorming the term ethics and
how it is being used in daily life.
From the responses, picking out the terms that relate to research ethics.
Discuss the importance of ethics in conducting research.
Make a concept map of the three research ethics related to participant
information, informed consent and confidentiality
Discuss the informed consent format.
Share Resources
Online Resource: Research Methods: Knowledge Base Online. Available<
http://www.socialresearchmethods.net/kb/contents.php
5. Summary and Transition
In this session we have discussed the importance of research ethics in all context of
research. Research cannot be conducted unless we ensure collaboration and cooperation of
different participants, disciplines, and institutions. The three major ethics principles related
to participants information, informed consent and confidentiality were addressed
specifically.
6. Assessment
Answer the following questions:
1. How do you observe ethics in your day to day interaction with your colleagues?
2. You want to get information on the students of your class through a survey of
their parents’ background and socio economic status. How will you get this
information? What research ethics related to the participants will you address
and how will you deal with it?
51

Session IX Processing and Analyzing Data (2 hours)
1. Session Learning Outcomes
After the completion of this session, the participants will be able to:
understand the concepts of descriptive and inferential statistics
differentiate between the qualitative and quantitative research
apply simple procedures of descriptive statistics to a data set
2. Key Concepts and Content
2.1 Key Concept 1: Data Analysis
After the data is collected from the participants of the research, there is the need to
organize and analyze data into a meaningful form to generate results. Qualitative and
quantitative studies follow different procedures for the analysis of data.
2.2 Key Concept 2: Quantitative and Qualitative Research
Quantitative research deals with the numbers and the qualitative research deals
with the text. Although the qualitative and the quantitative studies share some common
feature, they differ in following ways:
52

Quantitative Qualitative
Measures the Quantity
Deals with the numbers
Can be conducted in short time
span
More Objectivity
Can be restricted to limited
variables
Sample is selected randomly
Researcher has control over the
variables
Results are inferred through
hypothesis testing
Measures the Quality
Deals with the text, coding and
generating the meaning from the
text
Extended over long period of time
More Subjectivity
Involves many variables
Purposive sampling
Researcher does not have control
over variables
Results are based on
interpretation of the researcher
2.3 Key Concept 3: Statistical Analysis
The process of compilation and interpretation of quantitative data is called statistical
analysis. There are many procedures involved in statistical analysis but the most commonly
used procedures are:
Descriptive Statistics
Inferential Statistics
2.4 Key Concept 4: Descriptive Statistics
Descriptive statistics involve such procedures that are used to describe the data
meaningfully and summarize it. The following two types of data are analyzed through
descriptive statistics:
Categorical Data
Numerical Data
53

2.5 Key Concept 5: Categorical Data
Categorical data involves categories or groups.
These can be made without the fear of their order to be disturbed i.e. sex,
age, marital status.
It covers the following topics:
o Frequency Distribution
o Graphs
2.6 Key Concept 6: Frequency Distribution
It is used to highlight the number or frequency of the occurrence of variables. Look
at the following example of frequency distribution:
54
Example
Make a frequency distribution from these observations:
65, 98, 55, 62, 79, 59, 51, 90, 72, 56, 70, 62, 66, 80, 94, 79, 63, 73, 71, 84
Steps in making a frequency distribution:
1. Arrange the observations in ascending order
51, 55, 56, 59, 62, 62, 63, 65, 66, 70, 71, 72, 73, 79, 79, 80, 84, 90, 94, 98
2. Estimate “K (number of classes)”
3. K = 2 (if “K” raise to the power) >n
4. So the number of classes will be 5 for example is “5” is raised to the
power of 2, it will be (2x2x2x2x2) = 32 which is > number of the
observations. If the number of the classes are 50, K will be 6 as
(2x2x2x2x2x2) = 64 which is greater than 50 (total number of classes)
5. Determine the size of the classes (how many numbers will be present in
one class). It will be done according to the formula which is (maximum
number-minimum number/no. of classes)
(98-51/5 = 9). Each class will be comprises of “9” items
6. So there will be “5” classes based on “9” items

Frequency Distribution of the marks of the 6th grade students in Science
Classes Frequency (f)
51-59 IIII 460-68 IIII 569-77 IIII 478-86 IIII 487-95 II 296-104 I 1Total 20
2.7 Key Concept 7: Graphs
A percentage is the absolute figure required to interpret the data. Graphs are used
when a large number of data is presented. Following are the important types of graphs i.e.
pie charts, bar charts and line graph etc:
2.7.1 Pie charts
Pie chart is a circular shape, presenting different percentages. It is also known as the
sector graph.
Example:
Percentage of Marks Obtained by aStudent in Diffrent Subjects
20.4
27.4
90
20.4Science
Maths
English
Social Stdies
2.7.2 Bar chart
Bar chart is a most commonly used type of graphs, in bar chart, the reader can have
a quick overview of the data. The data is presented in the form of percentages. You can put
one variable on the x-axis or the horizontal axis and the other on y-axis or the vertical axis.
55

Example:
0
20
40
60
80
100
Percentages
2004 2005 2006
Years
Comparison of Two Values in ThreeYears
Vlue 1
Value 2
2.7.3 Line graph
Line graphs are used to compare the two or more variables. They have two axes
“X axis, which is horizontal” and “Y axis, which is vertical”. If you want to show the
performance of a student at different times, you will write the time on x-axis and the
percentage on y-axis.
Example:
020406080
100120140160180
2000 2001 2002 2003
Variable 3
Variable 2
Variable 1
2.8 Key Concept 8: Numerical Data
Numerical data involves the numbers and it covers the following categories:
1. Measures of Central Tendency
2. Measures of Dispersion
3. Normal Curve
4. Measures of Relationship
5. Measures of Relative Position
(See Learning Material for Session IX for Details)
56

2.9 Key Concept 9: Inferential Statistics
The inferential statistics infer or conclude something through the behaviour of the
sample which can be generalized for the entire population. The inferential statistics deal
with the following topics:
Standard Error
The Null Hypothesis
The Research Hypothesis
Test of Significance
Type I & Type II Errors
Level of Significance
Two Tailed and One Tailed Tests
Degree of Freedom
(See Learning Material for Session IX for Details)
3. Teaching Approaches
The content of this session comprises statistical measures, so the following teaching
approaches will be used for the delivery of this content:
The facilitator will first clarify the concepts of the participants through
lecturing the differences between descriptive and inferential statistics.
PowerPoint presentation can be designed by highlighting the main points.
The facilitator will use the procedures for descriptive data analysis with the
help of given examples in the content or by consulting the material in appendix
The facilitator will engage participants in activity based group work.
57

4. Learning Activities
4.1 Activity Objective
To enable the participants to apply the knowledge about data analysis
4.2 Activity
After the whole content is delivered through the lecture, the facilitator will arrange a
few research articles. Then the groups of the participants will be formed. Articles will be
given to the participants and they will be asked to identify the following from research
articles:
The null hypothesis
The research hypothesis
Which type of data analysis is used?
What is the total number of sample?
Highlight the conclusion of the study about the acceptance or rejection of
hypothesis.
Share the findings with other groups
5. Summary and Transition
Results of the research let the researcher know whether the hypothesis of the study
is accepted or not and which variable is affecting the other. If the data is used just to
describe the responses of the sample, it comes under the descriptive statistics; if it is further
used to draw conclusions about the population it comes under inferential statistics. Both
the descriptive and the inferential statistics offer alternatives to the researcher to analyse
the results and to draw conclusions. These further help the researcher to certainly conclude
that to which extent the results are significant. The session and the learning material will
help you further clarify your concepts in a practical way.
58

6. Assessment
The facilitator will ask the participants to do the following activity for assessment:
Answer the following questions:
1. What is descriptive statistics?
2. What are the important types of categorical data?
3. What are the important types of numerical data?
4. What is the difference between the descriptive and inferential statistics?
59

Session X: Processing and Analyzing Qualitative Data (1.5
hour)
1. Session Learning Outcomes
After the completion of this session, the participants will be able to:
understand the qualitative data analysis process
use the computer in analyzing the data
2. Key Concept and Content
2.1 Key Concept: Qualitative Data Analysis
Following are the most commonly used methods for data collection in qualitative
studies:
Ethnography
Case Studies
Document or Content Analysis
Naturalistic Observation
Focused Interview
Phenomenological Studies
Grounded Theory
Analyzing qualitative data involves the coding of the data and production of a
coherent verbal synthesis in the form description. Qualitative data analysis involves the
following stages:
2.1.1 Observing the data or noticing
Writing about happenings
Taking notes
Recording interviews
Gathering documents and reading
60

Coding different observations after a deep study of all the collected material.
2.1.2 Classification of the Data
Selecting the most appropriate material
Sorting out the connection between facts
Comparing and contrasting ideas
2.1.3 Analyzing the Data
Thinking about the Data and focusing on the research question
Managing the data
Categorizing the data
Synthesizing: Making connections within the categories and across the
categories
Linking the ideas
Making sense of each category
Inferring the meanings
Interpreting the meanings and making the discovery about the research
question.
2.1.4 Methods for qualitative analysis
Following are the most commonly used methods for qualitative analysis:
Typology – a system for classification or categorization of the data
Taxonomy- a system of classification or categorization as typology but it
involves higher and lower levels
Constant Comparison/Grounded Theory- deeply studying the collected data,
coding the data and finding the differences and similarities among the codes
(Coding can be done with the help of the computer)
61
Analytic Induction- Using inductive approach, compare the gathered
material, and compare it with the hypothesis. If it fits the hypothesis, accept it
otherwise revise the hypothesis.
Logical Analysis/Matrix Analysis: Giving logical reasoning to present some
concepts. Information and the concepts can be visualized also.
Quasi-statistics: In observation checklists or the field notes, counting the
number of occurrence of some variable or making its frequency.
Event Analysis/Microanalysis: Analysing the events by separating different
events from one another.
Metaphorical Analysis: Using metaphors to analyse the observed facts and
finding the similarities between them. Try on various metaphors and see how
well they fit what is observed.
Domain Analysis: Interpretation and analysis of social situations to find out
semantic relationship among entities.
Hermeneutical Analysis: Making meanings and interpretations from the
written text not in its real meanings but how people perceive it in some
situation.
Discourse Analysis: Doing linguistic analysis of the situation not by some
individual but among different people within a flow of communication.
Semiotics: Finding out the meanings from the language of signs and symbols.
Document/Content Analysis: Reading the written materials or the
documents to find out the meaning and interpret them.
Phenomenology/Heuristic Analysis: Analysing the individual experiences not
the shared one.
2.2 The Use of Computer software in Data Analysis
2.2.1 Use of SPSS
62

Statistical Package for Social Sciences (SPSS) is software, which provides a wide range
of statistical analysis applications to its user. Any type of quantitative and qualitative
analysis can be done through this software.
For quantitative researches, it offers the following statistical analyses techniques:
Chi-Square test
T-test
Spearman and Pearson Correlation
One-way ANOVA (Lessons attached in Appendix)
For qualitative research, computer does not perform the conceptual tasks such as
synthesizing ideas, analyzing, and testing hypothesis, but it performs mechanical tasks as
follows:
AskSam
NUD*IST
(See Learning Material for Session X for Details)
3. Teaching Approaches
The session content will be delivered through:
Lecture based on PowerPoint presentations which comprise the main points
Computer based activities using SPSS
4. Learning Activities
4.1 Activity Objective
To enable the participants to apply the knowledge learned in the session practically.
4.2 Activity 1
After the lecture, the facilitator will arrange some research articles based on
qualitative research and ask the participants to do the following:
Identify from the article:
Issues about which the research is conducted.
63

_________________________________________________________________
___________________________________________________________
Methods of the data collection.
_________________________________________________________________
___________________________________________________________
Techniques for the data analysis which have been used in that research.
_________________________________________________________________
___________________________________________________________
4.3 Activity 2
The facilitator will take the participants to computer lab and use the computer for
data analysis with the help of the material given in the learning material.
5. Summary and Transition
In this session you have learned about the procedure for qualitative data analysis.
This material opens a new way for you to consult more readings and books to get expertise
in qualitative data analysis. In modern times, the computer is facilitating the researcher and
makes it easy to analyse the data using different types of software. This introductory
material can help you in learning deeper concepts of data analysis.
6. Assessment
The assessment of this session will be based on participants’ performance of assigned tasks
on computer.
64
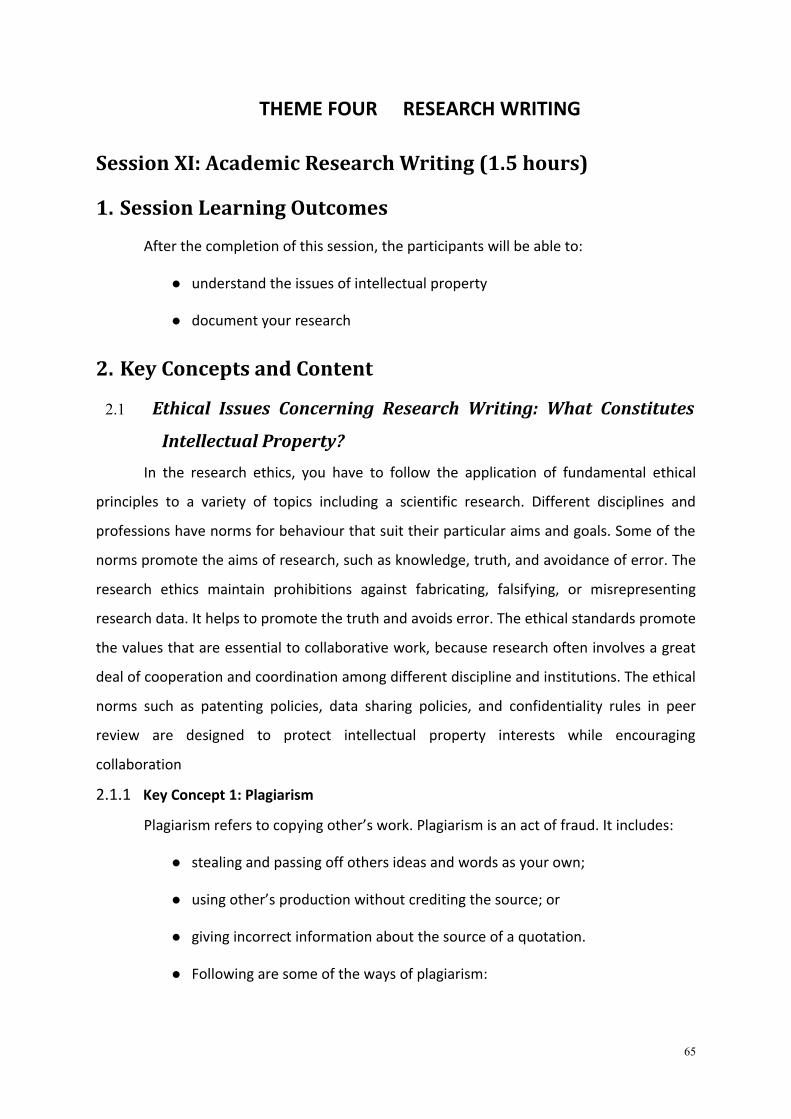
THEME FOUR RESEARCH WRITING
Session XI: Academic Research Writing (1.5 hours)
1. Session Learning Outcomes
After the completion of this session, the participants will be able to:
understand the issues of intellectual property
document your research
2. Key Concepts and Content
2.1 Ethical Issues Concerning Research Writing: What Constitutes
Intellectual Property?
In the research ethics, you have to follow the application of fundamental ethical
principles to a variety of topics including a scientific research. Different disciplines and
professions have norms for behaviour that suit their particular aims and goals. Some of the
norms promote the aims of research, such as knowledge, truth, and avoidance of error. The
research ethics maintain prohibitions against fabricating, falsifying, or misrepresenting
research data. It helps to promote the truth and avoids error. The ethical standards promote
the values that are essential to collaborative work, because research often involves a great
deal of cooperation and coordination among different discipline and institutions. The ethical
norms such as patenting policies, data sharing policies, and confidentiality rules in peer
review are designed to protect intellectual property interests while encouraging
collaboration
2.1.1 Key Concept 1: Plagiarism
Plagiarism refers to copying other’s work. Plagiarism is an act of fraud. It includes:
stealing and passing off others ideas and words as your own;
using other’s production without crediting the source; or
giving incorrect information about the source of a quotation.
Following are some of the ways of plagiarism:
65

Deliberate miscues: providing inaccurate information regarding the sources
making it impossible to find them.
Accidental plagiarism: where students do not understand what document is
and how to do it
Intentional plagiarism: i.e., cutting/pasting, or presenting other’s work as
their own.
2.1.2 How to avoid plagiarism?
Most cases of plagiarism can be avoided by:
citing the proper sources and acknowledging the original material.
providing the sustainable model developed by the institutions in order to
detect and prevent plagiarism.
teaching students about plagiarism and how to avoid it helps to minimize
plagiarism.
creating a culture of research rather than detecting and punishing for
plagiarism.
introducing laws against plagiarism.
66

Activities
2.1.3 Key Concept 2: Ethics of research
A few other research ethics are described below:
Honesty: It includes reporting of the data, results, methods, procedures and
publication of data.
Objectivity: It strives to avoid bias in experimental design, data analysis and
interpretation, peer review, personal decisions, grant writing and expert testimony etc.
Carefulness: It is important to avoid careless errors and negligence and to critically
and carefully examine the research work.
2.1.4 Key Concept 3: Intellectual property rights
Honor patents, copyrights, and other forms of intellectual property. Do not use
unpublished data, method or results without permission. Give proper acknowledgement.
67
Provide instruction and resources that teach students the skills of
paraphrasing, summarizing, critical analysis, etc.
Direct students to reference and guidelines relevant to their area of
research.
Make the task so specific that students are unable to simply download
from the web, or copy from the book.
Ask students to relate particular theories, concepts, issues in current
newspaper articles.
Get students to integrate theory and experience (e.g., field trips,
practicum, and reflective writings).
Critically analyse the given articles.
Ask students to regularly hand in samples of their classroom notes and
use these to give them feedback on their identification of key issues and
their integration of these into their work.
Ask students to keep a logbook of their learning throughout the
project/thesis.

2.2 Referencing
You have learned how to conduct the research. Now you are at a stage to present
your research. This section of the module is based on writing of research report and the
essentials of a good research report.
2.3 Documenting Research
Once your research proposal has been approved and you have started doing the
practical research, the question of documenting or writing it starts appearing as a threat.
Writing of academic research demands a lot of homework. Without ensuring the availability
of required materials, texts, data etc., if you would plunge into the deep sea of academic
research writing, your survival would be quite doubtful. So, to learn a few swimming strokes
before plunging into the sea is a good idea. However, you also need to be careful about
what Bodgan and Biklen (1982) assert:
Novice writers are big procrastinators. They find countless reasons not to get
started. Even when they finally get themselves seated at their desks, they always
seem to find diversions: make the coffee, sharpen the pencil, go to the bathroom,
thumb through more literature, sometimes even get up and return to the field.
Remember that you are never ‘ready’ to write; writing is something you must make
conscious decision to do and then discipline yourself to follow through.
(Bodgan and Biklen, 1982: 172)
When you sit to start writing an academic research work, remind yourself that unlike
in creative writing, you cannot enjoy the freedom of making partial judgments, passing
subjective comments, giving sweeping, and generalized statements. Academic research
writing is a very methodical and controlled process. It involves more clarity of mind as well
as a more systematic approach towards the writing process itself. As an academic research
writer you need to be conscious and cautious that
1. You are systematic
2. You are logical
3. You authenticate what you say
4. You synthesize materials, citations, examples etc.
68
Research writing, be it a report or a dissertation, calls for self- discipline and self-
control. According to Bell (1999: p199-200) it will be crucial for you as an academic research
writer to:
Set deadlines
Write regularly
Create a rhythm of work
Write up a section as soon as it is ready
Stop at a point from which it is easy to resume writing
Leave space for revisions
Publicize your plans
2.4 Standard Report Format
There can be slight variations as per institutional needs, or as per field or area of
research, however, generally and broadly speaking you would follow the same outline and
format. Following is a general basic format for the writing of academic research:
1: Introduction
1.1 Background
1.2 Identification of the Problem/ Research Problem
1.3 Significance of the Research
1.4 Hypothesis
1.5 Aims / Objectives
1.6 Delimitation
1.6.1 Scope/Range in Time and Space
1.6.2 Population/Sample
1.6.3 A Specific Class, Group, Gender, Age etc.
2: Literature Review
3: Research Methodology
3.1 Population and Sample
3.2 Instruments of Data Collection
Tests/ Questionnaires/ Interviews etc.
69

4: Data Presentation and Analysis
4.1 Presentation and analysis
4.2 Tabulation etc.
5: Conclusion
5.1 Suggestions
5.2 Recommendations
5.3 Lesson Plans
5.4 Other Alternatives
6: References and Bibliography
(Note: Apart from these sections/chapters, at the out set of your work you would
give the Title Page, Acknowledgements, Contents, and Abstract.)
2.4.1 Introduction
The introduction section is important as it provides the reader of your research with
the basic information about your research work. It serves as an underpinning for the whole
work. Clarity of thought should be clearly reflected at this stage through the problem
statement, research question/s, hypothesis, and aims and purpose of the study. Do not
forget to draw attention to any limitations of your study at this stage. It is not possible that a
small study would cover everything; so it is better to make the reader conscious of this fact.
2.4.2 Literature review
Make sure your proposal has a comprehensive review of the literature included. See
the session on “Literature Review” for guidance. If while reading the material, you have
sorted it out and recorded under various headings, at the writing stage, you will be able to
work faster and better.
2.4.3 Research methodology
This section explains how the problem was investigated and why particular methods
and techniques were used. The population and sample of the research should be clearly
stated. Choice of variables should be manifest. Instruments of data collection such as tests/
questionnaires/ interviews etc. should be mentioned. Also, the reason and justification for
choosing these instruments should be given. All important terms used in the research work
should be defined precisely at this stage.
70

It is important to provide a complete list of every source that you have used in you
research. It provides the information necessary for a reader to locate and retrieve any
sources cited in your research. Use of references allows readers to cross-reference your
sources easily, and it provides a consistent format to writing. It also gives you credibility as
a writer, and protects you from plagiarism. Cross-referencing allows the readers to locate
the publication information of source material. This is of great value for researchers who
may want to locate your sources for their own research projects. Use a consistent format of
citations and referencing. Using a consistent format helps your reader understand your
arguments and the sources they’re built on. It also helps you keep track of your sources as
you build arguments.
2.4.4 Data presentation and analysis
For guidance see the section on ‘Data Analysis’.
2.4.5 Conclusion
The conclusion of your research deals with the summary of findings of your research.
If the nature of the research requires any suggestions, recommendations, lesson plans etc.
you can give at this stage.
2.4.6 Bibliography
The purpose of a bibliography is to authenticate your work. You should be clear
about the difference in:
Endnotes
References
Bibliography
Also make yourself familiar to what are different styles of citation and references.
The most common ones are:
APA (American Psychologists Association)
MLA (Modern languages Association)
2.4.7 Referencing
There are formal accepted ways of referencing, such as the APA Format of
Referencing. Examples of how to use APA format are as follows:
71
Book reference
Rosenthal, R. (1987) Meta-analytic procedures for social research. New York:
McGraw-Hill.
Article reference
Mellers, B.A. (2000) Choice and the relative pleasure of consequences. Psychological
Bulletin, 126, 910-924.
Daily newspaper article
Schwartz, J. (1993, September 30) Obesity affects economic, social status. The
Washington Post, p. A1, A4.
Encyclopaedia or dictionary
Sadie, S. (Ed.) (1980) The new Grove dictionary of music and musicians (6th ed., Vols.
1-20). London: Macmillan
Reference from book reviews
Kraus, S. J. (1992) Visions of psychology: A video of classic studies [Review of the
motion picture Discovering Psychology]. Contemporary Psychology, 37, 1146-
1147.
Motion picture
Scorese, M. (Producer), & Longern, K. (Writer/Director) (2000)
You can count on me [motion picture] United States: Paramount Pictures.
Reference from Internet
Fredrickson, B. L. (2000, March 7) Cultivating positive emotions to optimize health
and well-being. Retrieved November 20, 2000 from http:// journals. Apa.
Org/ prevention/volume3/pre0030001a.html
(Note: For further clarity consult APA 5th Edition).
2.5 Academic Writing for other Purposes
Material is provided in the Learning Material for Session XI and can be used if
required. (Optional)
72

3. Teaching Approaches
The content of this session will be delivered through:
Lectures based on PowerPoint presentations highlighting the main points of
writing the research
Participant discussions
4. Learning Activities
4.1 Activity
Deliver the lecture first. Almost all the content need to be shifted to the PowerPoint.
Specially, the parts of contents that are given in bullets are to be used on PowerPoint. The
facilitator would generate discussions based on these contents.
After the lecture, give the participants an activity. To practice in 'in-text citation' and
'reference writing', provide the participants some books, journals, and magazines. Ask
them to cite one direct and one indirect quote from them. Then ask them to write reference
of the source.
4.2 Resources
(See Learning Material for Session XI for Details)
The content will serve as resources
5. Summary and Transition
This session provides you an introductory material on research writing. You can
consult some other books or writing material to have a more clear idea about some other
forms of academic writing as this material provides you a basis for attaining further
knowledge.
73

6. Assessment
6.1 Exercise 1
Write references following APA/ MLA or any other authentic standard reference
format.
1:
Writer- Spitzer, L.,
Year of publication-2000,
Chapter- The Individual Factors in Linguistic Innovations,
Book- Routledge Language and Culture Theory Reader
Editor- L. Burke, T. Crowley, and A. Girvin,
Press- Routledge,
Place- London.
2:
Writer- Spolsky, B.
Year of publication-1998,
Book- Sociolinguistics
Press- Oxford University Press
Place- Oxford,
3:
Writer- Richards, Jack. C.
Year of publication 1974
Book- Error Analysis: Perspectives on Second Language Acquisition
Press- Longman
Place- London
6.2 Exercise 2
Q 1: How would you write the reference of the material that you have taken from
television? Give one example according to MLA format.
Q 2: How would you write the reference of the material you have taken from an
unpublished thesis? Give one example according to the APA format.
74

THEME FIVE SUPERVISING ACADEMIC RESEARCH
Session XII: Academic Supervision (1.5 hour)
1. Session Learning Outcomes
After the completion of this session, the participants will be able to:
perform your role as a supervisor at three stages: before the research, during
the research and the writing stage.
sensitize the supervisees to the expected role.
2. Key Concepts and Content
Generally, the higher education institutions are engaged in performing three
functions: teaching, research and administration. Recently with the strong push of the
Higher Education Commission a lot of universities and Degree Awarding Colleges in Pakistan
have made research a mandatory part of qualifying for a degree at both the undergraduate
and graduate level. A research culture is beginning to evolve among academic community.
This has given rise to a number of queries and quandaries about the process of supervision
and the roles of the supervisor and supervisee. This part of the module will deal with these
issues. We will also briefly discuss the place of research in one’s own career.
2.1 Key Concept 1: the Role of the Supervisor
Most supervisors learn how to supervise by trial and error. Sometimes the junior
faculty gets the opportunity to observe the senior faculty and they can be taken as
apprentices in joint supervision arrangements. This helps the junior faculty to learn the rules
of the game before being thrown into the deep end. Some institutions are following these
practices. This intellectual support can create a critical mass of researchers who can ably
supervise valuable research.
The role of the supervisor can be divided into three stages:
1. Selection of the topic (before the research has begun)
2. During the research
3. At the writing stage
Now we will discuss each in some detail.
75

2.1.1 Selection of the topic
The importance of a suitable research topic for the timely and successful completion
of research thesis is self-evident. The supervisors can guide the students in choosing a topic
by:
Discussing with the students areas of general interest.
Asking the students to read theses and dissertations in the field to get ideas.
Asking students to read articles in journals and books and book reviews.
It is recommended that a topic be selected after negotiation and interaction
between the supervisor and the student, based on the interest of the student and expertise
of the supervisor.
Before the topic is finalized the supervisors need to consider the feasibility of the
completion of the research in the given time frame. They need to ensure that adequate
resources are available and the student can access them for carrying out the research.
Students need to know if any ethical issues are involved and if they need to get clearance
from the relevant authorities/bodies to collect data. Supervisors can facilitate them in
getting institutional support for this purpose.
The supervisors should discuss with the students the value of the research, whether
the findings will extend the knowledge in the field or have practical implications. The scope
of the research should also be considered in terms of its suitability for the degree. (Moses,
1995)
Sometimes the research topic requires the students to learn some special skills like
learning to work with a new software or language. The supervisors should take account of
these pre-requisites and consider if this is possible in the given time frame. The enthusiasm
of the student cannot overcome the time constraint.
2.1.2 During the Research
The supervisor should guide the student in choosing a theoretical frame of reference
that is most appropriate. Sometimes this requires acting just as a sounding board and
sometimes a gentle nudge is needed to move the student in a particular direction. The
rapport between the supervisor and the student can help in determining what strategy is
76

required at what time. Supervisors can refer the students to relevant sources including
people.
A structured program of progress needs to be maintained. This is to oversee if
deadlines are being met and the time management is satisfactory. Initially a weekly meeting
of half an hour at undergraduate and graduate level research is adequate. This frequency
can be reduced as students gain confidence in doing their work. However, a fortnightly
meeting is still advisable to maintain a smooth pace. The supervisor should provide timely
information to the student if a scheduled meeting is to be postponed, delayed or cancelled.
The new meeting schedule should be negotiated explicitly. This structured meeting pattern
would facilitate both the supervisor and the student. This does not mean that the
supervisors should not be available for the students for problem-solving at other times.
They should be generally available for brief sessions but have a contract for detailed
meetings. Nowadays the email is one mode of communication that provides ready access.
This may be used if face to face impromptu meetings are difficult to manage. Some sort of
notes should be maintained of each meeting.
Supervisors should guard against too much control. Let the students come up with
queries; assist them in finding solutions or answers. Recommend readings and discuss them.
Keen research students are usually future colleagues. Encourage them to become a part of
the academic community by attending/ presenting at colloquia/seminars/conferences.
Make them a part of a research group if it exists.
2.1.3 At the writing stage
Encourage the students to start writing at an early stage. Give rapid feedback on
written work. Persuade them to follow the standard format of thesis writing as required by
their institution. Make sure that the discourse conventions of academic writing are being
followed. This is possible when the initial drafts give critical feedback regarding style,
structure, argument, analysis, etc.
The supervisors need to ensure that the language is of high academic standing.
Assessing the overall coherence and logic in the structure of the thesis is also the
responsibility of the supervisors. Students tend to get enthusiastic about issues that are not
77

directly related to their main argument. Supervisors need to see that they keep on track and
do not digress from their research question.
Redrafting and revision of writing should not be considered as negative endeavour.
Rather it should be treated as polishing of the product. The supervisors may have seen and
commented on parts of the thesis at different times but they need to see the completed
draft for final criticism. This has to done well in advance of the date of submission of the
thesis to incorporate any changes that are required. (Moses, 1992)
So far we have talked about the role of the supervisors. We also need to consider the
role of the students or supervisees.
2.2 Key Concept 2: Role of the Supervisees
The students need to choose a supervisor who is easily accessible and is related to
their field. If they are part of an institution they would be familiar with the area of expertise
of their teachers. They should choose judiciously according to the academic standing of the
supervisor and not based on the ease of manner of the person. In our situation an academic
on the list of HEC recognized supervisors is a recommendation of academic worth of the
person.
Doing research is an intense and lonely experience. Support, both emotional and
academic, is needed from the supervisor. But self-reliance is also very important. Supervisor
may help to locate the signposts but the supervisee has to travel down the road. This
becomes easier by following the guidelines and schedules set up with the supervisor. Any
deviance has to be duly reported and negotiated. Tasks set have to be completed within the
given time frame.
It is important that you deal with the feedback from the supervisor in a calm and
professional manner. Usually when students get a lot of comments on their written work for
the supervisor, they feel frustrated and devastated. They need to know that a lot of time
has been spent by an expert in the field to give the comments. Look at them positively and
not personally and start redrafting (O’Leary, 2004). Bell (1999) has emphasized the need for
redrafting and rewriting in writing research. ‘No one, however gifted, can make a passable
first draft. Writing means rewriting’ (Barzun and Graff, 1977: 31).
If the scheduled meetings with the supervisor are repeatedly cancelled and new
times not set up, the matter becomes sticky. In such a situation you need to consult the
78

thesis/research committee or advisor. Maybe the head of the department can sort out the
situation. You need to bring the matter to the attention of the authorities as it may lead to a
delay in the completion of the thesis.
In case of conflict of interest between the supervisor and the supervisee, the best
course is to request for a change of supervisors ‘… even at a late stage, or to supplement
with a second supervisor, rather than getting into complex interpersonal engagement …’
(Leonard, 2001: 243). However, this step should only be taken if all attempts at negotiation
and positive interaction have proved futile. It is a course of action that should be avoided at
the best.
2.3 Key Concept 3: The Viva/Thesis Defense
Research, its documentation and writing up is a complex and extended process. Its
culmination is the external evaluation and interview or the viva voce (by word of mouth). ‘It
is a pretty daunting experience but also often stimulating, interesting and, in retrospect,
enjoyable’ (Leonard, 2001: 249). However, most of the students are quite unsure about
what to expect and what to provide in the viva. The textbooks usually deal with how to
prepare for the viva but have no clues about the event itself. So familiarize yourself with the
routine of viva in your department. If possible attend a viva as an observer so that you can
understand the practice. If this is not possible ask the recent graduates to get an idea.
However, each viva is a unique experience in itself and the stories of others should neither
demoralize you nor make you think that it is a walkover.
Read your thesis thoroughly before the viva. Discuss any points that you are under-
confident about with your supervisor. Your external examiners would have read your thesis
with care. They would ask you questions about your research, your methodology, the
contribution of the research in the existing pool of knowledge and how or where you will
publish it. Think about your responses. Structure your views carefully. Listen to the
questions carefully before responding. Do not hesitate to request for a repetition if you
have not understood clearly. Try not to get into a confrontational mode and do not be over-
assertive. Defend your ideas without getting defensive. Do not give very long answers that
push the examiners to interrupt. If you get rattled then admit that you are nervous and take
a deep breath to compose yourself. If you do not know the answers to a question then do
not bluff. Admit your ignorance and assure that you will read the related literature to get
79

the required information. If you cannot answer all the questions brilliantly do not fret as
long as you have answered adequately. Sometimes the objections of the examiners on your
work can be adequately explained during the viva so that they revise their opinion or ask
you to add the verbal explanation to your written work. (We have added a chapter on this
aspect in the reading package for detailed information.)
Best of luck with your viva.
2.4 Place of Research in One’s Own Career
Research culture is beginning to evolve in our academic community. Teachers,
especially in universities, know that career advancement and professional development are
linked to research and its publication. ‘Research and research reputation bestow peer
recognition within the disciplinary field, both nationally and internationally’. It is important
that we provide our teachers with adequate research training so that they can then create
research projects that will not only bring name and fame to their institution but also
funding. Collaborative research1 projects can be generated in departments where senior
teachers take the young faculty under their wing and introduce them to the network of
scholars working in the same or similar fields. This would prepare them to be independent
researchers who can then apply for research grants using the same skills. This academic
activity is highly valued by the faculty and the administrators.
These are extrinsic reasons for pursuing research. However, for a lot of academics,
research is an intrinsically valued activity.
Curiosity-driven research is stimulating and highly satisfying.
Being able to add to knowledge building and meaning making, being part of a
community of scholars, locally, nationally and internationally is rewarding.
Applied research, which contributes to solve social, industrial, environmental
or economic problems, is most satisfying.
For many academics conducting research is also a form of self-development:
they remain intellectually alive and stay at the cutting edge of research through
their reading. Such academics are usually better teachers and colleagues.
1 This is a genre that needs to be studied carefully so as not to infringe the intellectual and other property rights of any participant.
80

Within universities, research is supported through an organizational infrastructure
that may have a research office to accept applications and disburse research grants
obtained form different sources. These offices should also disseminate information about
publishing research in recognized journals of established academic standing. We need to
inculcate this research culture in our academia to compete successfully in a world where
information is available at our fingertips through the Internet.
In our academic environment conference culture is now becoming common.
Academics are beginning to understand the importance of attending and participating in
conferences. However, mostly papers that are presented at conferences sometimes become
a part of conference proceedings (if there is budget for printing) or they just fizzle out after
presentation. Experience shows that after sending the abstract, a rough draft of the paper is
sent and a good presentation prepared for participating in the conference. This presentation
then never gets translated into a document that fulfils the criteria for publication in a
journal of good academic standing.
This was a little spiel to make you think carefully about your career and locate a
place for research in it.
2.5 Key Concept 4: Publication
Usually the end of the viva is devoted to discussion about publication of the
research. It is a moot question. Science students usually have the opportunity to publish as a
team by the time they are in a position to defend their research. However, social sciences
have fewer opportunities of doing so. But when you are writing up your research you should
be thinking about publication as well. Ask you supervisor and even your external examiners
about adequate sources that may be explored for publication. Publication is important as:
Publication contributes to the scholarly literature in the field. All the reasons
that are given for the place of research in your career apply here.
It reaches a wide international audience.
It identifies your area of research and facilitates contact with other
professionals.
Establishes academic credibility as thinkers and not retailers of others ideas
81

Enhances your academic reputation, that of your department and of your
organization.
Publication in journals is economical
Publication is FUN.
Just a word of caution here! Publication in a good journal is not an overnight
process. It can take up to a couple of years to get published. The article/paper is sent for a
blind review to the referees who give their comments. These comments are communicated
to the writer for incorporation. The revised article is again reviewed and then sent to the
press if all is as it should be.
2.6 Ethics of Responsible Publications
Plagiarism is a plague that we have to guard against. Published work assumes
authenticity therefore it should be undertaken with a sense of responsibility. This requires
that:
All research and its publication should conform to accepted ethical standards.
Plagiarism is illegal and breach of the copyright laws.
All sources have to be acknowledged.
Minimum requirement for authorship is participation in conceiving, executing
or interpreting at least part of the research reported. Due recognition should be
given to it.
Publication of the multiple papers based on the same set(s) or sub-set(s) of
data is improper unless fully cross-referenced.
Some disciplines have special needs of research e.g animal and human
experimentation. Should go through the Ethics Committee.
82

3. Teaching Approaches
Lecture with PPT presentation
Discussion
Role Play
4. Learning Activities
4.1 Activities
The facilitator will brain storm the terms supervisor and supervisee
Write on board the roles under both the terms evolving from the brain storm
session.
Introduce the role of supervisor under three stages
Do the role play of the three stages with the two participants as Supervisor
and supervisee.
4.2 Resources:
Content will serve as resource
Book on Supervisor’s role
5. Summary and Transition
In this session we have discussed issues related to academic supervision and what
follows from it. The role of the supervisor is important not only during the research but also
during the viva and after it.
6. Assessment
Answer the following questions:
1. What is role of the supervisor in the selection of a topic?
2. What kind of feedback is required on the drafts given by the students?
3. Though we have not talked about it, what are the advantages or disadvantages
of joint supervision?
83

4. What would you describe as a good viva?
5. What is the importance of publication of research in the career of an academic?
What is role of the supervisor in the selection of a topic?
84

D. Materials
D.1 Learning Material of Session V
1) Activities
Activity 1
The facilitator will arrange some sample questionnaires. Then the participants will be
divided into different groups. Each group will be a given a questionnaire and the groups will
be asked to answer the following questions:
What is the questionnaire about?
_________________________________________________________________
_________________________________________________________________
________________________________________________________
Write down your opinion about the items and construction of the
questionnaire, is it well constructed or not? Support your response with
arguments.
_________________________________________________________________
_________________________________________________________________
________________________________________________________
Do you want to give any suggestion regarding the further improvement of
the questionnaire?
_________________________________________________________________
_________________________________________________________________
________________________________________________________
Activity 2
The facilitator will give the participants the issue, “Curriculum of English Language
for”:
Primary Level
Secondary Level
85

Undergraduate Level
In the next step, the participants will be asked to select one issue from the above
issues and plan for an Interview. The interview will be conducted in groups. The groups will
be comprised of three members. One person will perform the roles of the Interviewer, the
Interviewee and the Observer. The facilitator will give 20 minutes to the participants to
conduct the interview and then 10 minutes to share the findings. Before conducting the
interview, the participants will be asked to do the following:
Decide who will be the interviewee?
_________________________________________________________________
___________________________________________________________
Decide the type of Interview (one to one, Group interview, Focus Group)
_________________________________________________________________
___________________________________________________________
Decide the method (face to face, telephonic, electronic)
_________________________________________________________________
___________________________________________________________
Prepare the structure/outline for the interview
_________________________________________________________________
___________________________________________________________
Write down the method for keeping the record of the respondents’ words
_________________________________________________________________
___________________________________________________________
Prepare 4-5 sample questions and conduct a role play in the group of two
members
_________________________________________________________________
___________________________________________________________
86
Activity 3
The facilitator will ask the participants to do the following:
Review what you have learned about the observational checklists and do the
following:
Consult the recommended books and search for the observational checklists
If you are going to observe the students during microteaching, how will you
prepare a checklist for it?
Resources: (See Learning Material for Session V for Details)
2) Questionnaire and Interview
2.1) Example of a Questionnaire
Imagine that you had to explain what a good citizen is or what a good citizen ought
to do. Please read each sentence, then put a tick (√ ) under the heading ‘Good Citizen’ if that
is what you mean by a good citizen. If the sentence does NOT help to explain what you
mean by a good citizen, put a tick under ‘Other’ if you are not sure, put a tick under the
question-mark (?)
A GOOD CITIZEN: Good Citizen ? Other
1
. Obeys the law
2
. Is always Polite
3
. Loves his /her parents
4
. Votes in every election
5
. Is loyal to his / her family
6 Goes to church regularly
87

7
. Is loyal to his /her country
8
. Cares about other people’s troubles
9
. Is good at sports
1
0
.
Takes an interest in the way the country
is run
1
1
.Works hard
1
2
.Joins a political party
1
3
.
Knows a good deal about how our tax
money is spent
1
4
.Has good table manners
1
5
.Studies hard to pass an examination
88

1
6
.Pays his/her taxes regularly
1
7
.Minds his / her own business
1
8
.
Keeps up with what is happening in the
world
1
9
.Tries to change things in the government
2
0
.Gets other people to vote in elections
2.2) Some other Important Points in Constructing the Questionnaires and
Planning for the Interview
Questionnaires: Dos and Don’ts
Take consent from the author of the questionnaire in case of using
standardized questionnaires.
A research questionnaire must be different from the questionnaire of a
marketing product or the term paper.
Ask direct questions about the point concerned in the research.
Directions about how to answer the questions must be provided.
Questions should be in easy and understandable language.
89
Give examples to answer the questions while necessary.
Piloting is necessary.
Pre-coded answers should be prepared in case of close-ended questions.
Provide the coding boxes so that the respondents can be aware of what they
are answering.
Questionnaire must accompany the cover letter.
Interview: Dos and Don’ts
Interview should be planned in selection of:
o topics
o respondents
o place
o time for the interview
o questions to be asked
Interviewer must have the complete list of the respondents, with their
addresses and other contact details.
Decide the type of the interview (face to face, electronic, telephonic or focus
group).
Decide the method for recording the interview (field notes, tape/video
recording or any other).
Data is based on emotions, experiences and feelings, so it is necessary to take
record of each.
Questions should be well prepared before taking the interview.
Do not behave in a threatening way.
Practice to ask the questions before the actual interview session.
90

Questions and the interviews share some common features and these are almost
similar because both involve taking people’s opinion about different issues. Common
features are as follows:
91

Common features of Interview and the Questionnaires
Consent to take part in the study
Make the sample aware of the research purpose
Objectives of the research must be kept in mind
Confidentiality of participants’ words
Your purpose is to get information, but not to provide
information
Should not be very lengthy
Unbiased approaches
Brief questions
Easily scoreable coding
Question Formats
Following are the different types of questions, which can be included in interviews
and questions:
Direct questions may be asked with one appropriate answer.
Questions may be asked indirectly.
Statements can be given with which the respondent can agree or disagree.
Questions about the facts can be asked, which the respondent answers
according to his/her experience.
Questions to take the opinions or the preferences of the respondents about
some objects.
Predetermined questions can be asked in which the respondent is supposed
to answer each and every question.
Response Keyed are also a type of questions in which the respondent is
allowed to skip some questions which does to apply to him/her.
92

3) Scales for Measurement
3.1) Nominal Scale
The term means “to name”.
The categories differ in quality rather that quantity.
Each value belongs to only its own category but can be more than or less
than the other.
Nominal scales are based on categories which must be mutually exclusive,
exhaustive and uni-dimensional.
Most elaborating scale.
There is no chance of addition, multiplication, subtraction or other
mathematical operations with the categories
It provides the ratio or the frequency and provides the definite information.
Can be used to measure gender, or preferences of respondents.
Discipline:
Arts
Humanities
Pure Sciences
Social Sciences
Gender:
Male
Female
3.2) Ordinal Scale
The term means “to order”.
In ordinal scale, the data is organized in some order (high-low or low-high).
This scale does not specify how much different the categories are from each
other.
Categories can be presented in the form of a continuum.
Categories are given in a logical or a rank order
93

Height, weight, income and the ranks can be measured.
Your income is:
□ Below 30,000
□ 30,100 to 50,000
□ 50,100 and above
3.3) Interval Scale
Interval scale is used to tell the order of the objects.
It tells how much distant the categories are from each other.
All types of mathematical operations can be performed on this data.
Rating scales are considered the interval scales also.
The difference between the ages of people can be identified with the help of
this scale.
Kindly mention the number of employees at
your organization from year 1997 to 2001:
Year Number of Employees19971998199920002001
3.4) Ratio Scale
Ratio scale is a scale with true value “0”.
Used to get quantitative data.
Salary, quantities purchased and market share are all expressed on a ratio
scale.
Most sophisticated scale of all.
3.5) Likert Scale
A uni-dimensional scale usually with five points.
94

All the points have equal interval between each other.
Records the agreement or disagreement of respondent about some
particular variable.
Options are pre-coded.
Options are: Strongly Agree, Agree, Undecided, Disagree, Strongly Disagree.
3.6) Rating Scales
A scale used in observational studies.
It is used to record the behavior or activity of the respondents.
Descriptive statements are used with infinite points on a line.
Point or line to record the behaviour is termed as rater.
Can be subjected to human error.
95
Rating Scale
___5___, ___4___, ___3___, ___2___, ___ 1___
Students used Students did not use
teaching aids teaching aids

D.2 Learning Material of Session VI
1) Probability Sampling Techniques
1.1) Simple Random Sampling
In simple random sampling:
Chance for every member of the population to be included in the sample is
equal and independent.
Chance of researcher’s own bias is nowhere.
Procedure of Simple Random Sampling:
Need for sampling frame, which contains information about each individual
of the population.
Using the table of random numbers so that the numbers may be assigned to
the population.
Numbers in the table must be according to the population size (i.e. if total
population is 1,000, the directory must be comprised of the numbers from 0000
to 0999).
In the following figure, you can see some random numbers. These numbers can be
assigned to every member in the population. The researcher can select any number
randomly, and the person corresponding to that number will be selected in sample.
96
Example:
Table of Random Numbers
0371 0632 0845
0862 0539 0206
0932 0761 0937
0865 0903 0438

1.2) Stratified Sampling
In stratified sampling:
Sample is not selected directly from the population.
Population is divided into subgroups, referred to as strata.
Sample is selected from these strata, proportionally.
Proportions are prior set by the researcher.
1.3) Cluster Sampling
Cluster sampling:
is the Identification and study of the sample in the form of groups.
is done when the researcher cannot find the required sample due to some
specific reason.
So, it involves identifying groups and studying them.
1.4) Systematic Sampling
In systematic sampling:
Sample is selected with the help of sampling frame or the list containing
information about each and every member of the population.
The kth number is determined.
1.5) Procedure for Determining Kth Number
For determining the kth number, the total number of population (N) is
divided by the desired number of sample (n) and the value is determined as the
kth number.
Then every kth number from the list is included in the sample.
Look at the procedure to determine the kth number in the following example:
97

In the above
example, “5” is the Kth
number, so in the list of
population, every 5th
number will be included in
the sample. Look at the
following example:
Example:
List of the Names in Population
1. A 7. G 13. M
2.B 8. H 14. N
3.C 9. I 15. O
4.D 10. J 16. P
5.E 11. K 17. Q
6.F 12. L 18. R
2) Non Probability Sampling Techniques
2.1) Purposive Sampling
In purposive sampling, the researcher includes the people in sample
according to his/her own choice
It is called Judgment Sampling also.
2.2) Quota Sampling
Quota sampling is used in face to face interviews
The researcher fixes a quota and then according to that quota the sample is
selected.
98
Example:
Procedure for Determining Kth number
Total No. of Population (N) = 1000
Desired Sample (n) = 200
K = 1000/200 = (N/n) = 5
Kth number = 5
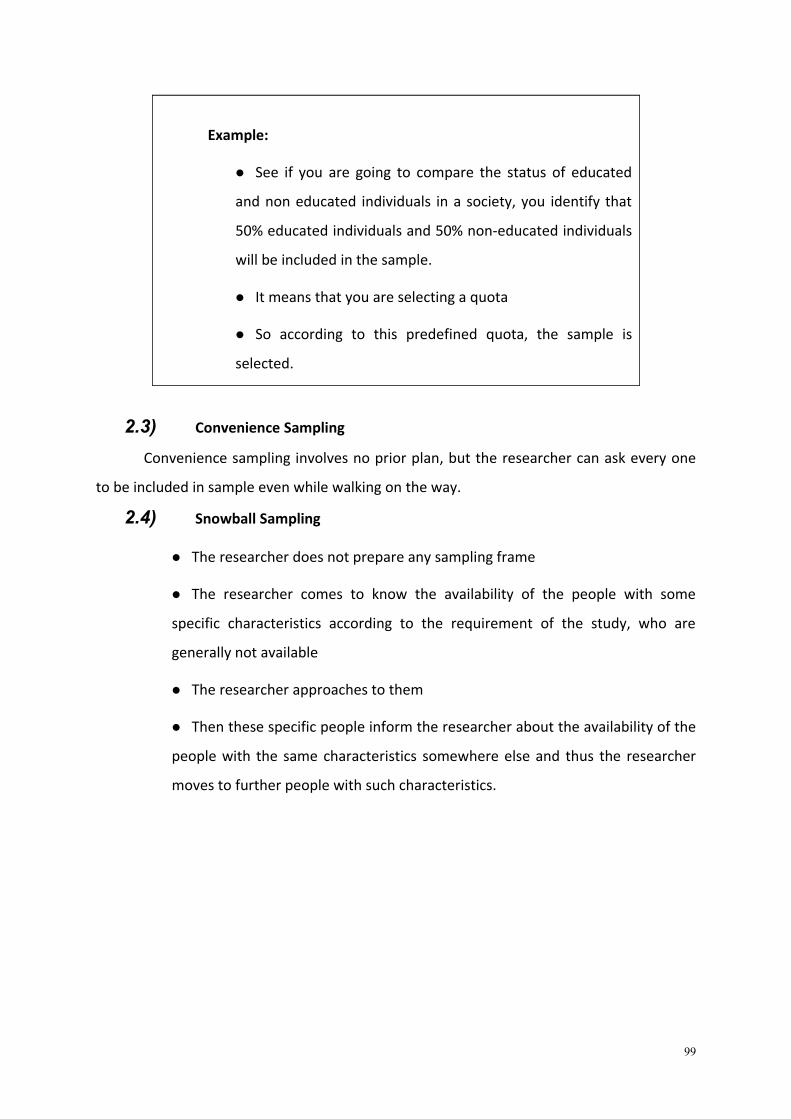
Example:
See if you are going to compare the status of educated
and non educated individuals in a society, you identify that
50% educated individuals and 50% non-educated individuals
will be included in the sample.
It means that you are selecting a quota
So according to this predefined quota, the sample is
selected.
2.3) Convenience Sampling
Convenience sampling involves no prior plan, but the researcher can ask every one
to be included in sample even while walking on the way.
2.4) Snowball Sampling
The researcher does not prepare any sampling frame
The researcher comes to know the availability of the people with some
specific characteristics according to the requirement of the study, who are
generally not available
The researcher approaches to them
Then these specific people inform the researcher about the availability of the
people with the same characteristics somewhere else and thus the researcher
moves to further people with such characteristics.
99

D.3 Learning Material for Session IX
NUMERICAL DATA
1) Measures of Central Tendency
The Mean
The Median
The Mode
1.1) The Mean/Average
Mean is the average of scores.
It is the most appropriate value when the data is acquired from the interval
or the ratio scale.
Example:
Calculate the mean of these values: 20, 26, 24, 37, 39, 58, 62, 70
Steps to calculate the mean of above observation:
1) Add all the observations (Xi) which is 336
2) Divide the sum of all the observations by total number of the observations
(n) which is 8
3) Mean = 336/8 (∑Xi/n) = = 42
Mean is X in statistical language
1.2) The Median
Median is the mid-point or middle value of the observations.
It does not take any account of each and every observation but it ignores
highest or lowest values.
Appropriate measure for the data acquired through ordinal scale.
Look at the following example and learn about the calculation of the median:
100

101

Example 1 (in case of Odd Values)
Calculate the median of these observations: 8, 10, 7, 70, 9, 6, 9, 3, 1, 2, 5
Steps in calculating the median
1) Arrange these values in descending order (70, 10, 9, 9, 8, 7, 6, 5, 3, 2, 1)
2) 7 is the middle value, so it is the median in these observations
Example 2 (in case of Even Values)
Calculate the median of these observations: 8, 10, 7, 9, 6, 9, 3, 1, 2, 5
Steps in calculating the median
1) Arrange these values in descending order (10, 9, 9, 8, 7, 6, 5, 3, 2, 1)
2) Now these observations are even but 7 & 6 are two middle values
3) Take the average of these two values ((6+7)/2 = 6.5)
4) 6.5 will be the median
1.3) The Mode
Mode is the most frequent value of the recorded observations.
The value which has been attained by more than one subject.
Most appropriate measure in case of nominal data.
All the three measures of Central Tendency have been identified in the following
example:
102

Example:
Marks of 7th grade students in Mathematics are 82, 87, 90, 92, 94, 94 and
98. For these observations, the three measures of central tendency are:
1) Median = 92 (the mid-point or the middle value)
2) Mode = 94 (the most frequent value)
3) Mean = 91 (the average of the values calculated by adding all the values
and dividing there sum by total number of observations)
2) Measures of Dispersion
The Range
The Standard Deviation
The Quartile Deviation
2.1) The Range
Range is the deviation of the lowest value from the highest value.
It is calculated by subtracting the lowest value from the highest value.
The focus is only on two extreme values: A major disadvantage.
2.2) The Standard Deviation
Square root of the variance is called “The Standard Deviation”.
Variance is actually the mean of the variation.
It tells how much the values are distant from their center which is actually
the mean or average of the values.
2.3) Steps to calculate the Standard Deviation
The teacher will calculate the standard deviation by using the procedure described in
the following example:
Look at the following example in which the process of calculation of the Standard
Deviation is highlighted.
103

Example:
1) The mean of all the observations is taken
2) Then the mean is subtracted from all the values
3) Then all the deviations are added and the sum of all the deviations
from mean is always “0”
4) The square of all the values is taken
5) All the squares are added and divided by the total number of values to
get the variance
6) After the variance has been calculated, its square root is taken that is
called Standard deviation
2.4) The Quartile Deviation
Quartile deviation is the one-half of the difference between the upper
quartile and the lower quartile.
The upper quartile is actually the 75th percentile and the lower quartile is
actually the 25th percentile.
The lower quartile is deviated from the upper quartile and calculated value is
divided by two, thus the quartile deviation is taken.
3) Normal Curve
The normal curve is actually the bell-shaped curve in which the data is normally
distributed. There are two types of distribution:
Normal Distribution
Skewed Distribution
3.1) Normal Distribution
Normal distribution is to form a curve where the mean, the median and the
mode lie in the centre of the curve and all are equal.
104

It is also known as symmetrical distribution as the curve formed by this
distribution is bell-shaped.
Normal Distribution
3.2) Skewed Distribution
A distribution which is not normal is called skewed distribution.
It is not symmetrical or bell-shaped.
The mean, the median and the mode are not the same or equal.
Skewed distribution can be of two types; positively skewed distribution and
negatively skewed distribution.
In negatively skewed distribution:
Mean < Median < Mode
Negatively Skewed Distribution
In positively skewed distribution:
Mean > Median > Mode
Positively Skewed Distribution
4) Measures of Relationship
The Pearson Correlation
105

The Spearman Rank-Order Correlation
4.1) The Pearson Correlation
The Pearson Correlation is used when the data about the variables is ratio or
interval scale.
After calculating the correlation the status of relationship can be determined
whether it is positive or negative.
4.2) The Spearman Rank-Order Correlation
If the data is in the form of ranks or it has been taken from the ordinal scale,
the Spearman Correlation is used.
It does not permit the several subjects to have the same rank. If several
subjects receive the same score, the Spearman Correlation gives a technique to
average their ranks.
In both the above correlation measurements, the value of correlation coefficient is
somewhere between -1 and + 1. If it is towards + 1, the relationship is positive and if it is
towards – 1, the relationship is negative and if the value is 0, it means that there is no
relationship.
5) Measures of Relative Position
Percentile Ranks
Standard Scores
5.1) Percentile Ranks
The percentile rank is used to measure the position of some score as
compared to the others.
Tells the percentage of the scores that lie below a given value.
Although these are used for the interpretation of the data of interval scale
data but this is very much appropriate for interpreting ordinal data.
Look at the following example, which shows how to calculate the Percentile
Rank:
106

Example:
82, 84, 56, 51, 58, 90, 76, 78, 66, 68, 72, 69, 50, 48, 86, 88, 60, 54, 98, 95 are
the marks of 20 people in a test. If a person has got 78 marks, what will be the
percentile?
Steps in calculating the Percentile Rank
1) Arrange the marks in ascending order
2) 48, 50, 51, 54, 56, 58, 60, 66, 68, 69, 72, 76, 78, 82, 84, 86, 88, 90, 95, 98
3) If a person has got 78 marks, it means that 12 people have got marks
less than him/her and he or she is at 13th number
4) We will divide the number of people who have got marks less than
him/her which is 12 by the total number of the people appeared in the
test which are 20 and multiply by 100
5) (12/20 x 100 = 60)
6) The person is at 60th percentile
5.2) Standard Scores
There are three type of standard scores which are most commonly and
widely used, T Scores, Z Scores and stanines.
It depicts that how far a raw score is from a reference point which can be the
mean.
107
INFERENTIAL STATISTICS
1) Standard Error
The natural difference between the means of samples of same population,
which is not due to the fault or mistake of the researcher is called sampling
error.
The main characteristic of these means is this that they all are normally
distributed and are very close to the population mean.
The distribution of all the sample means will have its mean as well as its own
standard deviation.
So the standard deviation of the sampling error is called the standard error,
which highlights the difference between all the sample means.
2) The Null Hypothesis
The null hypothesis is the statement of equivalence.
It usually states that there is no difference and no relationship between the
two variables or between the means of two samples from the same population.
In the language of research the null hypothesis is written as:
__ __
H0: X1 = X2 (There is no difference between the means, both are equal)
3) Research hypothesis
Research hypothesis can be directional or not-directional
It provides the clear direction to the researcher that there is difference or the
relationship (positive/negative) between the means of the samples.
In the language of research, the research hypothesis is written as:
Non-directional
__ __
H1: X1 ≠ X2 (Mean of one sample is greater than that of the other)
Directional
108
__ __
H1: X1 > X2 (Mean of one sample is greater than that of the other)
__ __
H1: X1 > X2 (Mean of one sample is smaller than that of the other)
4) Tests of Significance
After finding out the difference between the variables, the researcher can not make
the decision upon his/her own choice that how much significant the difference is. Inferential
statistics offer the tests of significance which help the researcher to conclude or infer that
the difference is not natural but it is due to the treatment. Following are the most
commonly used tests of significance:
1) T- Test
2) Analysis of Variance
3) Multiple Regression
4) Chi Square
4.1) T- Test
T-test is used to compare the means of two samples to determine that there is
difference between them which is not a chance error. There are following two types of T-
test:
Independent Samples t-test
o Independent samples neither do have similar characteristics and nor do
they depend upon each other.
o The only similarity between them is that they are taken from the same
population.
o Independent samples t-test is used to judge the difference between two
means.
o It lets the researcher know that the difference is not natural but is the result
of treatment which has been applied to one of them.
o The researcher can infer that the difference is significant.
Dependent Samples t-test
109

o The dependent samples are matched samples
o Scores of the same group in two different tests at two different times can be
the independent samples.
o Even the samples can be the same group to be assessed at two different
times.
o The dependent samples t-test is used to determine that the difference is not
due to the sampling error.
4.2) Analysis of Variance
Analysis of Variance (ANOVA) is used to interpret more than two variables
simultaneously.
It offers multiple applications: Simple analysis between the two or more than
two variables to find the difference.
If there is difference, to determine where the difference lies.
Is used to determine which means are significantly different from which
means.
Is used to analyse the variables of factorial research design with the
dependent, the independent and the moderator variables.
4.3) Multiple Regression
Multiple regression is the prediction equation to predict about the variables.
The use of multiple regression is increasing.
It can be used with the data attained through any of the scale.
It can also be used in experiments, correlational and causal-comparative
studies.
4.4) Chi-Square
Chi-square is a test of significance which is applied when the data is in the
form of frequencies of two or more than two mutually exclusive or different
groups.
110

Not for the data in the form of test scores.
It compares the proportions which have been observed in some study and
the proportions which are expected and finds out the difference between them.
If the difference between the observed and expected values increases, the
value of the chi square also increases but how significant is it, will be determined
by consulting the chi square table.
5) Type I & Type II Errors
There are two types of errors at the time of acceptance of the hypothesis:
Rejecting the null hypothesis when it is true is a type of error and in the
language of research it is called Type I Error.
Accepting the null hypothesis when it is not true is called Type II error”.
6) Level of Significance
When the hypothesis is tested to be rejected or accepted, it is tested against
standard criteria, called the level of significance.
It determines how large the difference between the mean must be in order
to be declared significantly different.
The Most commonly used level of significance is .05”.
7) Two Tailed and One Tailed Tests
One and two tailed tests are used to test the hypothesis highlighting the
relationship between the variables i.e. positive, negative or no relationship. Two
tailed tests specify no direction or say A ≠ B. It shows that the relationship can
be either positive or negative.
One tailed test specifies the exact direction that A has positive relation with
B, or A has negative relation with B.
8) Degree of Freedom
Degree of the freedom is the last stage in inferring or concluding the results.
111

Degree of freedom is actually the total number of observations, values or the
sample from which 1 is subtracted to reduce the bias and is denoted by (n-1).
Degree of freedom is given in the table of significance tests against the level of
significance.
The acceptance or rejection of the hypothesis depends upon the value of
table to be consulted against the degree of freedom.
112
D.4 Learning Material for Session X
1) How to Create Data Set in SPSS?
Let us start to create data set in SPSS. When you open SPSS, there is a window in
front of you. At the bottom left side of the window there are two options: “Data View” and
“Variable View”. You have to first click the variable view. This is the first step to enter data in
the SPSS and to analyze it. When you click on the Variable View, a window with different
columns opens. You have to write the names of all your variables in the column of “Name”
one by one. It is not necessary to write the full name, but you can write the name of your
variable in the form of an abbreviation. In most of the old versions of SPSS, the column of
Name is limited to only eight characters. If it does not allow inputting the full name of your
abbreviation, do not get worried and just write the short name. Fill the column according to
the number of your variables when this column is completed, move to the other columns
which have been automatically filled, but fill the other columns according the requirement
of your study.
In the second column, “Type”, you have to write the type of your variable.
“Numeric” is the default setting, because in most of the cases the variables are numerical. If
the variables are not numerical such as “educated” which consists of words. This is known
as the String Variable in the language of SPSS (Connolly, 2007). To change the numeric
variable to the string variable, click on the word “numeric” in the column of “Type”, another
small window of “Variable Type” will appear in front of you. From this window, select the
word “string” and the characters as required and then click “OK”. Now the variable type
matches your variable.
In the column of “Width”, write the number or characters for the variable that you
have assigned to the options of your tool. For example, one variable is Gender (male and
female), and the other one is Age. Age is numerical and it does not need any code to be
assigned. If your variables are not numerical, you assign codes to them (i.e. male and
female, (male = 1) and (female = 2)). Then in the column of width you write “1” for Gender
because the codes that you assign to Gender are one-digit numbers: “1” or “2”. For your
second variable, which is age, the width will be “2”, because the number of characters for
Age is always two (i.e. 20, 30, 40, 50, etc.) If your variable is salary, its number of characters
113

can be more than one digit and the width can be written according to the package, which
the researcher is finding out.
In the column of “Decimals”, write “0” if the decimals are not required, but if the
decimals are required according to the variable such as birth rate 66%, then write the
number of decimals required.
In the next column, “Label”, write proper names of your variables which will appear
in the tables or the charts at the end.
Then in the column of “Value”, you double click it and another window “Value
Labels” opens in front of you. In this window, you have to write the codes which you have
assigned to your variable and this is in the case of nominal variables as there are three types
of variables used in SPSS, nominal; ordinal and scale. (For details, please see Quantitative
Data Analysis in Education! A Critical Introduction Using SPSS by Paul Connolly). For
example, you have assigned “1” as a code to “male” and “2” for “female”, so write “1”
before “Value” and write “Male” before “Value Label”. It’s the same for female. Write “2 =
“Female”” and click “Add” as shown in the figure. Then click “OK”.
The next column “Missing Value” is used for missing data of some variables. If
someone had skipped the question from a 100 items questionnaire and had not answered,
you can write “-1” for that question. In other case, if someone had answers as he/she was
not supposed to answer, you can write “99” (Connolly, 2007).
The next two columns are “Columns” and Align”. It is not necessary to enter any data
in these columns because the just define the width and alignments of the columns in data
view.
The last column “Measurement” is about the type of variables i.e. nominal, ordinal
or scale variables. Select one type according to the variable. The Variable View is complete
now, and once gain click on the bottom left of the window on Data View. The window is
open in front of you. Now enter data according to the variables.
114

After the data has been entered, SPSS offers all types of statistical analysis which
have been discussed above. It follows a common procedure for almost all types of analysis.
After entering the data in Data View, the window of Data View is open in front of you.
115

From the top menu, click “Analyze”, you will see a drop list of statistical analysis (i.e.
Reports, Descriptive Statistics, Compare Means, General Linear Model, Correlate,
Regression, Loglinear, Classify, Data Reduction, Scale, Nonparametric Tests, Survival and
Multiple Response). You can choose any of the options according to your study.
116
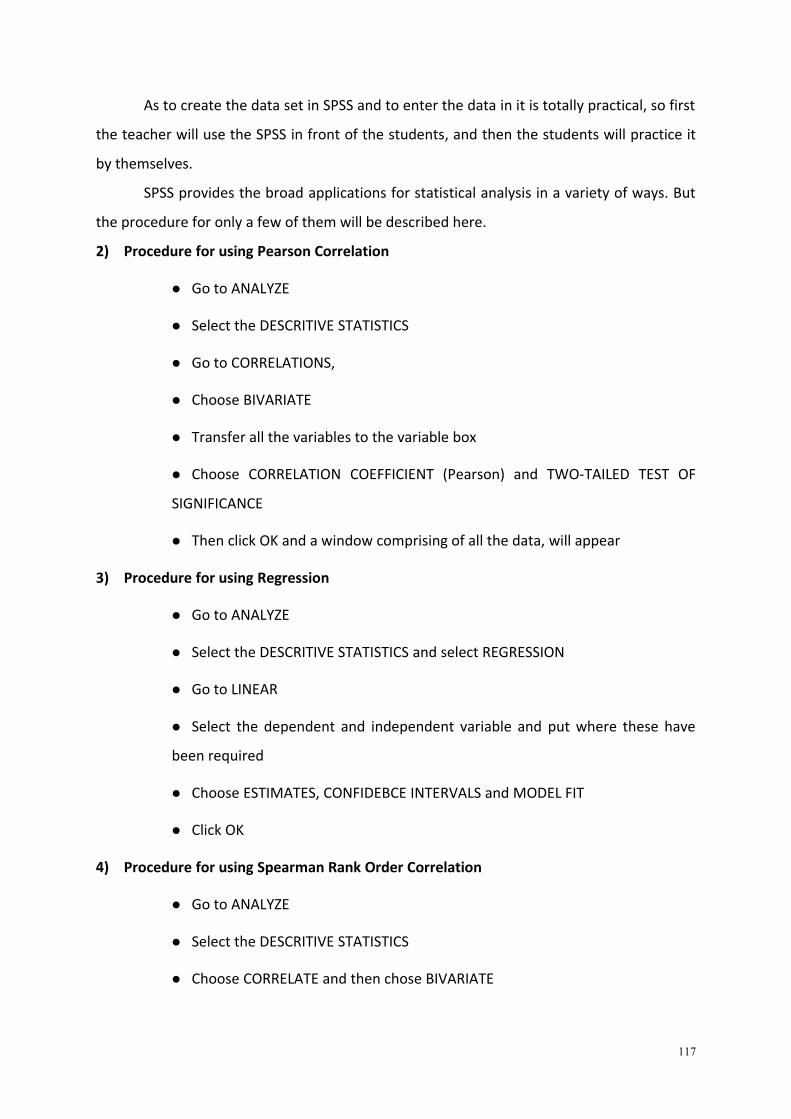
As to create the data set in SPSS and to enter the data in it is totally practical, so first
the teacher will use the SPSS in front of the students, and then the students will practice it
by themselves.
SPSS provides the broad applications for statistical analysis in a variety of ways. But
the procedure for only a few of them will be described here.
2) Procedure for using Pearson Correlation
Go to ANALYZE
Select the DESCRITIVE STATISTICS
Go to CORRELATIONS,
Choose BIVARIATE
Transfer all the variables to the variable box
Choose CORRELATION COEFFICIENT (Pearson) and TWO-TAILED TEST OF
SIGNIFICANCE
Then click OK and a window comprising of all the data, will appear
3) Procedure for using Regression
Go to ANALYZE
Select the DESCRITIVE STATISTICS and select REGRESSION
Go to LINEAR
Select the dependent and independent variable and put where these have
been required
Choose ESTIMATES, CONFIDEBCE INTERVALS and MODEL FIT
Click OK
4) Procedure for using Spearman Rank Order Correlation
Go to ANALYZE
Select the DESCRITIVE STATISTICS
Choose CORRELATE and then chose BIVARIATE
117

Under variable box, chose SPEARMAN
Choose TWO-TAILED test
Click OK
5) Procedure for using Chi-Square test
Go to ANALYZE
Select the DESCRITIVE STATISTICS
Then select CROSSTABS
In CROSSTBAS window, in the field of “ROW(S)” put the variables which you
want to compare, and in the field of “COLUMN(S)” put the characteristics which
you want to compare between the variables.
Then select STATISTICS in the same window and another window
CROSSTABS: STATISTICS will open
In this new window, select Chi-square and Phi and Cramer’s V
Then select CONTINUE and then OK
6) Procedure for using Independent Samples t-test
Go to ANALYZE
Select COMPARE MEANS
Select INDEPENDENT SAMPLES T-TEST
A window will open. Put both variables that you want to compare in the
fields, “TEST VARIABLE (S) and GROUPING VARAIABLE”
In the same window, click DEFINE GROUPS
Another small window will open, and here you have to put the codes which
you have assigned to your variables
Then click CONTINUE
Click OK to complete the procedure
118

7) Procedure for using One-way ANOVA
Go to ANALYZE
Select COMPARE MEANS
Select One-way ANOVA
A window appears before you; put the scale variables in the field of
“Dependent List”
Put the nominal variables in the field of “Factors”
In the same window click on POST HOC button
Another window will appear, click on HOCHBERG’S GT2
Then click CONTINUE
You are once again in the window of ONE-WAY ANOVA
In this window, click on OPTIONS button
This will open another window
In the OPTIONS window, select DESCRIPTIVE and HOMOGENIETY of VRIANCE
TEST
Then click CONTINUE
And finally click OK
119
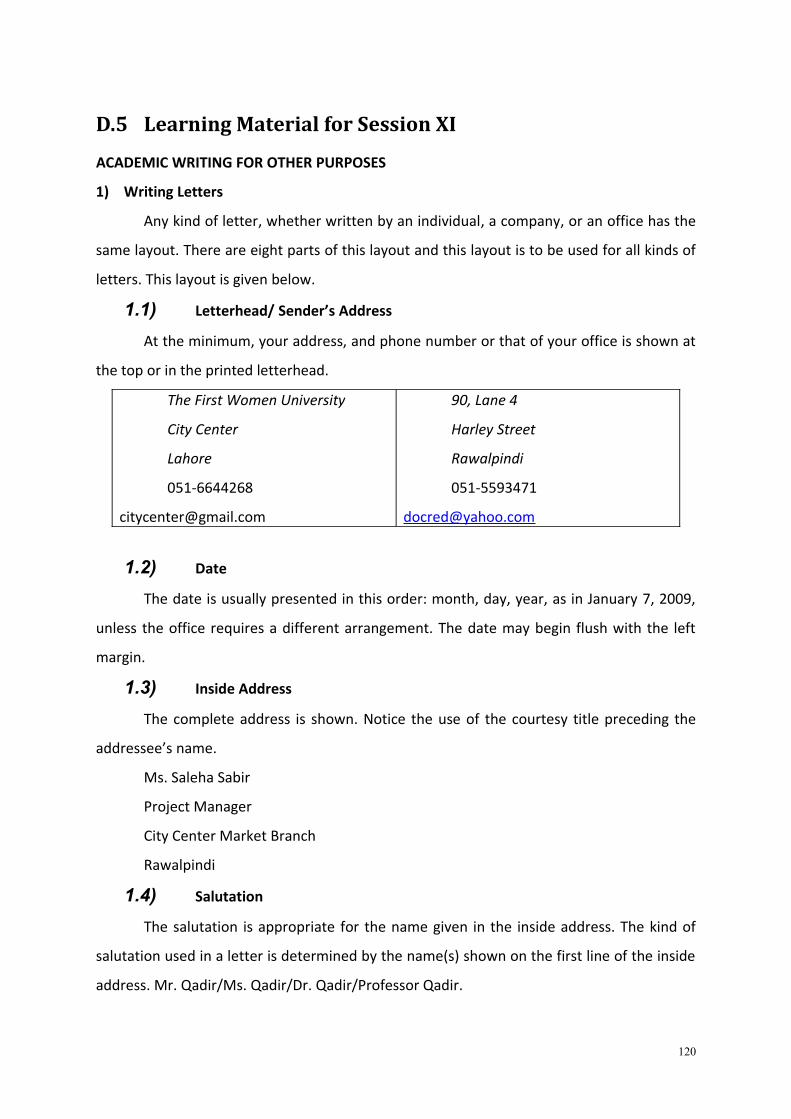
D.5 Learning Material for Session XI
ACADEMIC WRITING FOR OTHER PURPOSES
1) Writing Letters
Any kind of letter, whether written by an individual, a company, or an office has the
same layout. There are eight parts of this layout and this layout is to be used for all kinds of
letters. This layout is given below.
1.1) Letterhead/ Sender’s Address
At the minimum, your address, and phone number or that of your office is shown at
the top or in the printed letterhead.
The First Women University
City Center
Lahore
051-6644268
90, Lane 4
Harley Street
Rawalpindi
051-5593471
1.2) Date
The date is usually presented in this order: month, day, year, as in January 7, 2009,
unless the office requires a different arrangement. The date may begin flush with the left
margin.
1.3) Inside Address
The complete address is shown. Notice the use of the courtesy title preceding the
addressee’s name.
Ms. Saleha Sabir
Project Manager
City Center Market Branch
Rawalpindi
1.4) Salutation
The salutation is appropriate for the name given in the inside address. The kind of
salutation used in a letter is determined by the name(s) shown on the first line of the inside
address. Mr. Qadir/Ms. Qadir/Dr. Qadir/Professor Qadir.
120
1.5) Body
The body is single-spaced with a double space between paragraphs. The paragraphs
begin justified to the left margin.
1.6) Complimentary Closing
The complimentary closing is appropriate for a formal letter from an
individual/business/office to an individual/ business/office. Example:
Yours truly,
Yours sincerely,
1.7) Signature Element
The writer’s name and title are shown. If the addressee needs to respond to a letter,
the information in the signature element will be used in the inside address of the letter.
Example:
Ms. Sabiha Syed
Assistant Professor
1.8) Enclosure
Often enclosures accompany a business letter. The number of enclosures may be
shown, or the enclosures may be listed. A variety of styles may be used to identify the
enclosures.
Encls: 08
1.9) Format of Letters
2) Routine/pleasant letters: Deductive
Begin directly with the main idea (easy to write)
Details or explanations
Closing thought
Dear Registrar:
Please send a replacement copy of the Application Form that is attached. When it
was delivered in the post (see copy attached), pages 8-10 were missing.
I shall appreciate your sending a complete form in exchange.
121

3) Unpleasant letters: Inductive
Begin with a neutral statement that leads to the reasons for refusing the
request.
Present the facts, an analysis, and the reason for refusal. Major portion of
the letter to be an explanation. Before the refusal to prevent negative reaction.
State the refusal. De-emphasize it.
Close with a related idea that shifts emphasis away from the refusal. Offer
counterproposal. Shows your confidence in the addressee.
Dear Ms. Siddiquii:
Your efforts to build the scholarship fund for the Association’s needy children are
most commendable. We wish you good success in your efforts for this worthy cause.
We here at Popular Traders are always willing to assist worthy causes whenever we
can. That is why every January we budget for the year the maximum amount we feel we are
able to contribute to worthy causes. Then we distribute this amount among the various
deserving groups as far as it will go. As our budgeted contributions for this year already have
been made, the best we can do is to place your organization on our list for consideration
next year.
We wish you the best of luck in your efforts to help educate the deserving children
of the Association members.
4) Special Letters
1. Congratulatory letters --- Deductive
2. Letters of persuasion: Inductive
o Get attention
o Introduce the topic to arouse attention
o Give evidence
o Encourage action
3. Letters of recommendation --- Deductive for positive ones and Inductive for the
not so positive ones.
4. Letters of Invitation and responses --- Deductive
122

5. Letters of Sympathy or Condolence:
o Start with a statement of sympathy
o Follow with sentences about mutual experiences or relationships
Close with some words of comfort and affection
123

E. References and Bibliography
Baker, T. L. (1994). Doing Social Research (2nd Ed.). Singapore: McGraw Hill.
Babbie, E., & Rubin, A. (2001). Research Methods for Social Work (4th Ed.). USA: Wadsworth
Thomas Learning
Barzun, J. and Graff, H. E. (1977) The Modern Researcher, 3rd edition. New York: Harcourt
Brace Jovanovich.
Bell, J. (1999). Doing Your Research Project. Buckingham, UK: Multilingual Matters.
Best, J. W. & Khan, J. V. (2006). Research in Education (9th Ed.). Lahore: Mayo Art Press
Cohen, L. & Manion, L. (1985). Research Methods in Education. Bedeenham: Croom Helm
Cohen, L., Manion, L. and Morrison, K. (2003) Research Methods in Education (5th Edition).
Hampshire: Routledge
Connolly, P. (2007). Quantitative Data Analysis in Education: A Critical Introduction Using
SPSS. New York: Routledge Publishers.
Creswell, John (2003). Research Design: Qualitative, Quantitative, and Mixed
Methods Approaches. 2nd ed. Thousand Oaks, California: SAGE
Denscombe, Martin. (1998). The Good Research Guide: For Small Scale Social Research
Projects. Buckingham: Open University Press
Dey, Ian. (1993). Qualitative Data Analysis. London: Routledge, 11 New Fetter Lane
Finnan, C. 1992 Becoming an Accelerated Middle School: Initiating School Culture Change.
Palo Alto, CA: The Accelerated Schools Project, Stanford University.
Firestone, W. and Pennell, J. 1993 Teacher Commitment, Working Conditions, and
Differential Incentive Policies. Review of Educational Research, 63, 489-525.
Gay, L.R. 2000 Educational Research (5th Edition) Islamabad: National Book Foundation.
Goddard, Wayne and Melville, Stuart (2001) 2nd ed. Research Methodology: An
Introduction. Lansdowne: Juta and Company Limited
Henson, K.T. 1996 Teachers as researchers. In J. Sikula, (ed.) Handbook of research on
teacher education. (2nd edition.) New York, NY: Macmillan.
Johnson, A. P. 2005 A Short Guide to Action Research. Boston: Pearson Education Inc.
Johnston, M. 1990 Experience and Reflection on Collaborative Research. International
Journal of Qualitative Studies in Education. Vol. 3, No. 2, pp 172-183
124

Kumar, Ranjit. (2005). Research Methodology: A step-by-step guide for beginners. 2nd ed.,
London: SAGE
Leary, Z. O. (2004). The Essential Guide to Doing Research. New Delhi: Vistar Publications
Leonard, D. (2001) A Woman’s Guide to Doctoral Studies. Buckingham, UK: Open University
Press.
Lieberman, A. (1986). Collaborative research: Working with, not Working on - Educational
Leadership, 43 (5), 28-32.
Linn, R. L. & Gronlund, N. E. (1999). Measurement and Assessment in Teaching. USA:
Prentice Hall Publishers
Lodico, M. G., Spaulding, D. T. & Voegtle, K. H. (2006). Methods in Educational Research:
From Theory to Practice. San Francisco: Jossey-Bass Publishers
McCarthy, J. and Riner, P. 1996 The Accelerated Schools Inquiry Process: Teacher
Empowerment through Action Research. Education v 117, n2, 223-230.
McMillan, J. H. and Schumacher, S (1989) Research education- a conceptual introduction
(2nd Ed) UK: Harper Collins
Mertler, C.. A. (2006). Action Research: Teachers as Researchers in the Classroom. USA: Sage
Publications
Moses, I. 1995 Supervising Postgraduates, HERDSA Green Guide No. 3.
Moses, I. 1992 Research Training and Supervision, AVCC and NBEET: Canberra
Nunan, D. (1992) Research Methods in Language Learning. Cambridge: Cambridge
University Press
Oja, S. and Pine, G. 1989 Action Research on Change in Schools (ARCS) Project. In Webb, R.
(ed.) 1990 Practitioner Research in the Primary School. London: The Falmer Press
O’Leary, Z. (2004) The Essential Guide to Doing Research. New Delhi: Vistaar Publications
Qadir, S. A 1995 ‘Implementation of a reading Innovation in the classrooms of Multan’.
Journal of Research (Humanities). Vol.XXIX No. 1-2. Universirty of the Punjab, Lahore.
Salkind, N. J. (1997). Exploring Research, New Jersey: Prentice Hall.
Serlin, R. C., & Conrad, C. F. (2006). The Sage Handbook for Research in Education: Engaging
Ideas and Enriching Inquiry. Thousand Oaks: The Sage Publications
Trochim, W. M. K. (2006). Research Methods Knowledge Base. Last Revised: 01/20/2006.
Retrieved January 05, 2009 from
http://www.socialreserach.methods.net/kb/order.php.
125

Tuckman, B. W. (1994). Conducting Educational Research (4th Ed). USA: The Ohio State
University
Wiersma, William. (2000). Research Methods in Education: An Introduction. USA: Allyn &
Bacon, A Pearson Education Company
Wolcott, F. H. (2001). Writing Up Qualitative Research 2nd Edition. California: Sage
Publications
Online sources:
Day and Brown, The role of the educational supervisor, Psychiatric Bulletin (2000), 24: 216-
18. Online. Available HTTP: http://pb.rcpsych.org/cgi/reprint/24/6/216.pdf
Green, J.J. (2005). Sampling for Research: Non-probability and Probability Techniques.
Institute for Community-Based Research, Delta State University: Division of Social
Sciences/Center for Community and Economic Development. Retrieved January 5,
2009 from
http://ntweb.deltastate.edu/vp_academic/jgreen/Sampling_for_Research_Green_2
005_Presentation.ppt.
Guiding Principles for Graduate Student Supervision, Canadian Association of Graduate
Studies (CAGS) 2008. Online. Available HTTP:
http://www.cags.ca/Portals/34/pdf/Guiding%20Principles%20for%20Graduate%20St
udent%20Supervision%20in%20Canada%20-%20rvsn7.pdf
International Development Research Centre: Module 10B: Design Of Research Instruments;
Interview Guides and Interview Skills. Online. Available HTTP:
http://www.idrc.ca/en/ev-56614-201-1-DO_TOPIC.html
Ratcliff, Donald. 15 Methods of Data Analysis in Qualitative Research. file
http://qualitativeresearch.ratcliffs.net/15methods.pdf Retrieved on 09-01-09
Research Methods: Knowledge Base. Online. Available HTTP:
http://www.socialresearchmethods.net/kb/contents.php
Siedel, John. V. (1998). Qualitative Data Analysis ftp://ftp.qualisresearch.com/pub/qda.pdf.
Retrieved on 04-01-09
University of North Carolina at Chapel Hill. (2009). Literature Reviews. Online. Available
HTTP: http://www.unc.edu/depts/wcweb/handouts/literature_review.html
126