research mentoring community ewth,wind ,seas, … 2014.pdf · 30-year timeframe. ... effects of...
TRANSCRIPT

EWSSEarth,Wind,Sea, andSky
R E S E A R C H M E N TOR I N G C OMMUN I T Y
20 1 4 SOARS, NEON, AND PRECIP ABSTRACTS

SOARS protégé Ma'Ko'Quah Jones preparing samples
for phytolith analysis using centrifuging and wet chemical
methods at the LacCore laboratories at the University
of Minnesota -Minneapolis.

We are very pleased to share with you the 2014 edition of Earth, Wind, Sea, and Sky, showcasing the summerresearch of students from our three internship programs, Significant Opportunities in Atmospheric Researchand Science (SOARS), the Undergraduate Internship Program at the National Ecological Observatory Net-work (NEON) and the Pre-College Internship Program (PRECIP) at the National Center for AtmosphericResearch (NCAR).
We hope that you will enjoy this volume of abstracts. Please join us in congratulatingour 2014 SOARS, NEON and PRECIP interns!
We are very proud of our interns and the projects they managed to complete this summer.Their success would not be possible without the support and dedication of a number of peopleand organizations. The biggest thank you goes to our funders, our many partnering laborato-ries, and of course to our mentors.Thank you for your careful guidance of the interns, andfor modeling what an exciting science or engineering career looks like! Without you theseprograms would not be possible.
These internship programs are designed to broaden participation in the science, technology, engineer-ing and math (STEM) fields. Our country faces a chronic discrepancy between the demographic make-up of the STEM workforce and the country as a whole.We need a scientific workforce representativeof the U.S. population, especially including members of groups who are already and will be dispropor-tionally impacted by current and future environmental change. Our internships engage students inreal-world projects at world-class science facilities, pair them with scientists and engineers who are atthe cutting edge of their fields, and build community to support these future STEM professionals.We encourage students from groups that are historically under-represented to enter the ecological,atmospheric and related sciences, and help prepare them to succeed in graduate school and theprofessional workplace, often with advanced degrees.
LIZ GOEHRING Undergraduate Internship Program Director, NEON
REBECCA HAACKER-SANTOS SOARS Director, UCAR Center for Science Education
SCOTT LANDOLT PRECIP Director, NCAR
Earth,Wind,Sea, andSky

UCAR/NCARThe University Corporation for AtmosphericResearch (UCAR) serves as a national hub forresearch, education, and advanced technologydevelopment for the atmospheric and relatedEarth sciences. On behalf of the National ScienceFoundation (NSF) and the university community,UCAR manages the National Center for Atmospheric Research (NCAR) and the UCARCommunity Programs (UCP), the organizationalhomes of the PRECIP and SOARS programs.UCAR’s mission is to support, enhance and ex-tend the capabilities of the university community,nationally and internationally; understand the behavior of the atmosphere and related systems andthe global environment; and foster the transfer of knowledge and technology for the betterment of life on Earth. There are currently 103 memberinstitutions that offer education and researchprograms in the atmospheric or related sciences,including virtually all of the major research universities of North America.
NCAR is a federally funded research and devel-opment center, conducting a wide range ofweather, climate, and solar science and relatedapplications research. At the heart of this work isimproving predictions about our atmosphere—how it behaves from moment to moment, day today, and decade to decade, and the risks and opportunities associated with these changes.Eachyear, hundreds of people from universities, labs,and the weather enterprise collaborate withNCAR staff, and rely on NCAR resources, inorder to carry out vital research and applications.
NCAR and UCAR have been supporting theSOARS Program since its inception in 1996, andthe PRECIP Program since 2010. Institutionalsupport and the mentoring of their scientists, engineers and staff have been a key to the successof these programs.
The NCAR-based CommunityEarth System Modelis one of the world’s most sophisticated models of globalclimate. Created by scientistsat NCAR, the Department of Energy, and collaborators, thispowerful model simulates themany processes in our climatesystem, ranging from cloudsand atmospheric chemicals toice to marine ecosystems. ©UCAR
Other components� Atmospheric chemistry� Evaporation� Outgoing heat

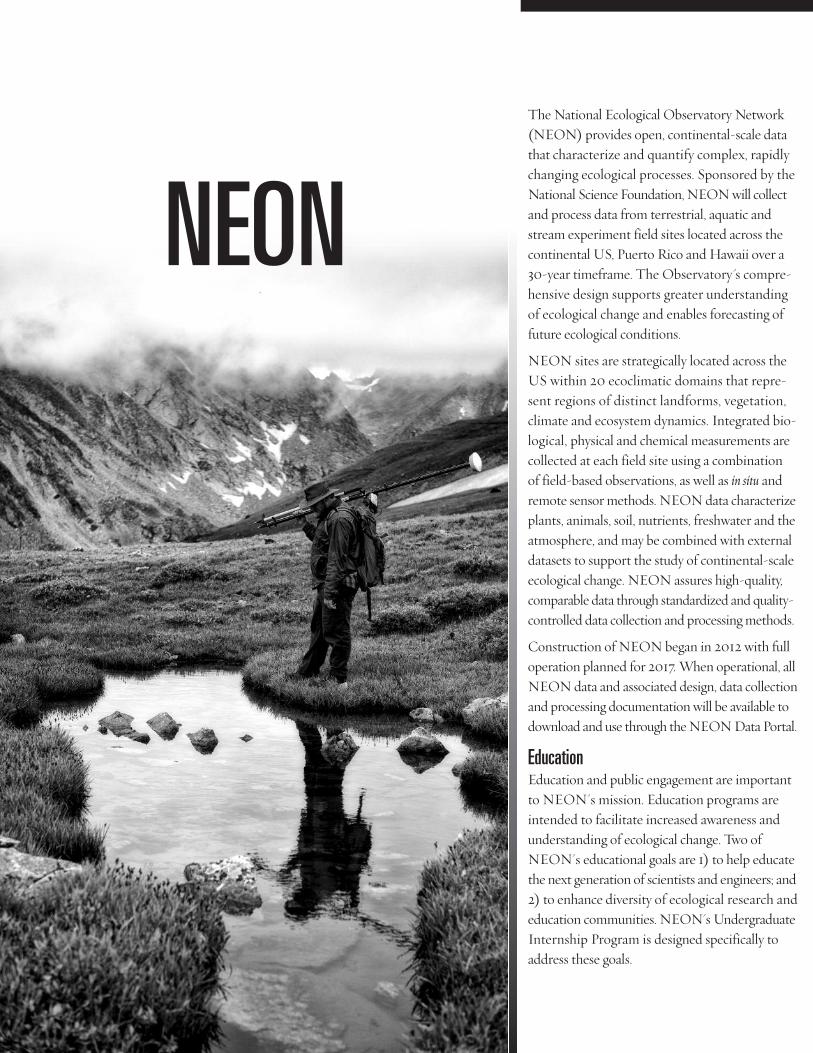
The National Ecological Observatory Network(NEON) provides open, continental-scale datathat characterize and quantify complex, rapidlychanging ecological processes. Sponsored by theNational Science Foundation, NEON will collectand process data from terrestrial, aquatic andstream experiment field sites located across thecontinental US, Puerto Rico and Hawaii over a30-year timeframe. The Observatory's compre-hensive design supports greater understandingof ecological change and enables forecasting offuture ecological conditions.
NEON sites are strategically located across theUS within 20 ecoclimatic domains that repre-sent regions of distinct landforms, vegetation,climate and ecosystem dynamics. Integrated bio-logical, physical and chemical measurements arecollected at each field site using a combination of field-based observations, as well as in situ and remote sensor methods. NEON data characterizeplants, animals, soil, nutrients, freshwater and theatmosphere, and may be combined with externaldatasets to support the study of continental-scaleecological change. NEON assures high-quality,comparable data through standardized and quality-controlled data collection and processing methods.
Construction of NEON began in 2012 with fulloperation planned for 2017. When operational, allNEON data and associated design, data collectionand processing documentation will be available todownload and use through the NEON Data Portal.
EducationEducation and public engagement are importantto NEON's mission. Education programs areintended to facilitate increased awareness and understanding of ecological change. Two ofNEON's educational goals are 1) to help educatethe next generation of scientists and engineers; and2) to enhance diversity of ecological research andeducation communities. NEON's UndergraduateInternship Program is designed specifically toaddress these goals.
NEON

NEON’s Open-Access ApproachNEON’s open-access approachto data and informationproducts will enable scientists,educators, planners, decisionmakers and the public to map,understand and predict theeffects of human activities onecologyand effectively addresscritical ecological questionsand issues.

04
05
06
07
09
10
12
13
14
15
16
17
18
19
20
21
11
08
SOARS Protégé Abstracts 2014
Understanding the 2013 Boulder flood: Assessing extreme precipitation events and future climates in theCommunity Earth System Model (CESM)
Ryan Adams
Examining in-cloud convective turbulence in relation to total lightning and the 3D wind field of severethunderstorms
Sarah A.Al-Momar
Skill of the WRF model’s wind speed, direction, and shear forecasts for an Iowa wind farm Meghan Applegate Mitchell
Identifying long-range sources of ozone utilizing an adjoint methodAlicia C.Camacho
Three-dimensional variation of atmospheric CO2: A comparison of aircraft measurements with inverse modelsimulations
Eugene D.Cody
Links between oxygen minimum zones and the Hadley circulationGabriela De La Cruz Tello
Observations of wind asymmetries in Atlantic tropical cyclonesErin Dougherty
Using GLOBE student cloud type and contrail data to complement satellite observationsCandace Hvizdak
A tribal story written in silica: Using phytoliths to research the effects of mining on past wild rice (Zizania palustris) abundance in Sandy Lake, Minnesota
Ma’Ko’Quah Jones
North Atlantic atmospheric blocking and Atlantic Multidecadal Oscillation: Analysis through climate models, reanalysis, and datasets
Carlos Martinez
Examining the link between tropical cyclone radial structure and intensification using the FLIGHT+ aircraft flight level dataset
Jonathan Martinez
Innovating the future: Engineering sustainable cooking technologies in Northern Ghana for improved air quality
Jenine N. McKoy
Sensitivity of a simulated squall line to the microphysical representation of graupelSteven M. Naegele
Developing optimal transport and dispersion climatologies for nuclear deposition mappingEliza Nobles
Evolution of phytoplankton in a changing climate Zoraida P. Pérez Delgado
Utilizing portable air quality monitors to assess the patterns of ozone along the Northern Front Range Brandt Scott
Using the Mesoscale Model Evaluation Testbed to test physics options in the Weather Research & Forecasting model
Anthony Torres
Effects of large volcanic eruptions on climate in the Community Earth System ModelArianna Varuolo-Clarke
TABL
E OF C
ONTE
NTS

NEON Intern Abstracts 2014
A comparative analysis of Landsat, AVIRIS, and NIS normalized difference vegetation indices in Domain 17, the Pacific Southwest
Madeleine A. Z. Ball
Interpreting canopy phenology using an automatic image analysis algorithm to process Phenocam imagesStephanie Cortés
Implementation, visualization, and output analysis of time series algorithms for NEON tower sensorsAriel Kaluzhny
Herbaceous plant and carabid beetle diversity relationships among three different eco-climatic domainsusing NEON provisional data
Victor Baldemar Leos
Determining the optimal spatial resolution of measurements for mapping stream geomorphology using land surveying
Rose Petersky
Determining snow depth using an automatic image processing algorithmKevin Sacca
Comparison of common lilac (Syringa vulgaris) phenophase timing between historical data and current Project BudBurst citizen science data: Challenges and lessons learned
Caleb Shaw
PRECIP Abstracts 2014
The efficiency of the heating system technique in the NCAR snow precipitation gauge (GEONOR)Derek C. Champlin
Accuracy of precipitation measurements using tipping bucket rain gaugesJosé C. Cruz Ayala
Variability in the measurement of two models of tipping bucket rain gaugesGian Carlo Di Cristina
Calibrating the Manus profiler using TRMM satellite bright band reflectivities Paola S. Esteban Pérez
Comparing calibrated radar precipitation estimates based on measurements from ground instrumentsIlya Fedorchuk
Investigating the relative accuracy of weather instrumentation through comparisons with calibrated sensors at the NCAR Marshall Field Site
Justin Martyr
Comparing optical-based sensors with precipitation gauges for measuring snowfall and rainfall intensity Luana M. Paredes Sanchez
Calibrating the Manus Island wind profiler by comparing profiler and surface rain measurementsValerie M. Rodríguez Castro
Improving the current icing potential algorithm through improved reports of METAR precipitation type Ricardo J. Rodríguez García
Identifying surface and elevated nocturnal thunderstorms in the Southern Great Plains Lauren Sharpe
Developing a prototype of a Java-based display for icing hazard risk level Rachel Sharpe
Improving the snowfall distribution pattern inside the NCAR snow machine Lucas Szewczyk
Comparison of automated and human accuracy at data collection: When does freezing drizzle really occur?Andrea Vázquez
25
27
26
28
29
30
31
35
35
36
36
37
37
38
38
39
39
40
40
41

01
Significant Opportunities in Atmospheric Research and Science
Degrees Earned in STEM byYearDegrees earned in science, technology,
engineering or mathematics (STEM) by SOARS
protégés and alumni, as of September 1, 2014.
SOARS is an undergraduate-to-graduate bridge program hosted at NCAR and designed to broadenparticipation in the atmospheric and related sciences. SOARS complements our partnering academicinstitutions’ efforts in preparing students for careers in academia, research and industry by combininga summer internship with year-round mentoring, conference travel and career support. During thesummer, SOARS protégés work at NCAR, partnering laboratories and universities to gain experiencewith what a career in atmospheric sciences could look like for them. In addition to this authentic researchexperience, guided by scientific mentors, the program includes a weekly communication workshop,seminars about graduate school and career choices, and end-of-summer poster and oral presentationsby the students. Topics of research span the broad field of climate and weather, including computingand engineering in support of the atmospheric sciences. After the summer, protégés stay engaged throughwebinars, one-on-one career counseling, and conference travel.
Protégés are able to participate in SOARS for up to four years, gaining additional independence insubsequent years to select, focus, and direct their research. By the time SOARS protégés move ontograduate school, they are well prepared to succeed in independent research. Many use SOARS as anopportunity to expand their research through contacts and facilities available at a national laboratory, andit is common for students and their advisors to collaborate and publish with mentors beyond theirSOARS research experiences. In addition, SOARS provides publishing and grant-writing support totheir protégés and alumni, helping them stay connected with the wider community.
SOARS is proud of their alumni, the vast majority of whom go on to excel in graduate school and moveon to careers in atmospheric science or related STEM fields. They remain connected to the SOARScommunity, committed to the SOARS mission of increasing diversity in the sciences, and play animportant role in increasing the strength and diverseness of the STEM workforce.

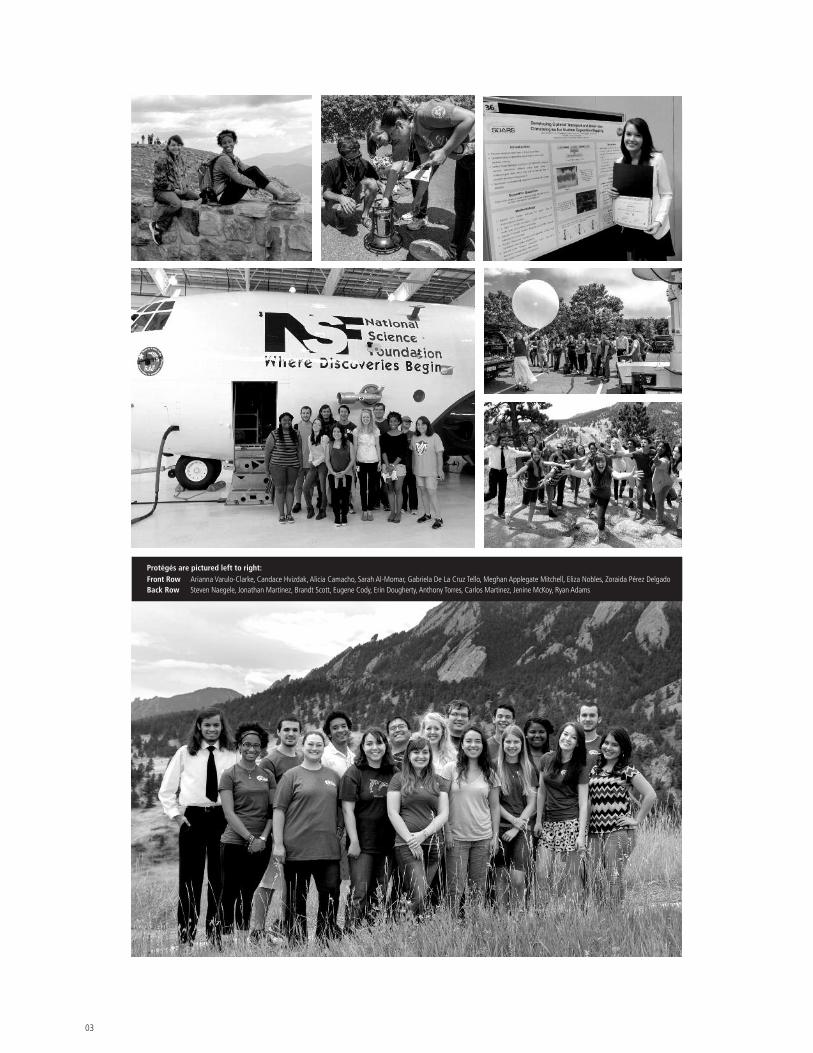
Protégés are pictured left to right: Front Row Arianna Varulo-Clarke, Candace Hvizdak, Alicia Camacho, Sarah Al-Momar, Gabriela De La Cruz Tello, Meghan Applegate Mitchell, Eliza Nobles, Zoraida Pérez Delgado Back Row Steven Naegele, Jonathan Martinez, Brandt Scott, Eugene Cody, Erin Dougherty, Anthony Torres, Carlos Martinez, Jenine McKoy, Ryan Adams
03
04
2014 SOARS Abstracts Significant Opportunities in Atmospheric Research and Science
1st-year Protégé SeniorCalifornia University of PennsylvaniaEarth Science – Meteorology
mentorsresearch Richard Neale, NCAR
writing & communicationB.J.Smith, NCAR
coach Becca Hatheway, UCP
peerBrandt Scott, SOARS
Ryan Adams
Understanding the 2013 Boulder flood: Assessing extreme precipitation events and future climates in
the Community Earth System Model (CESM)
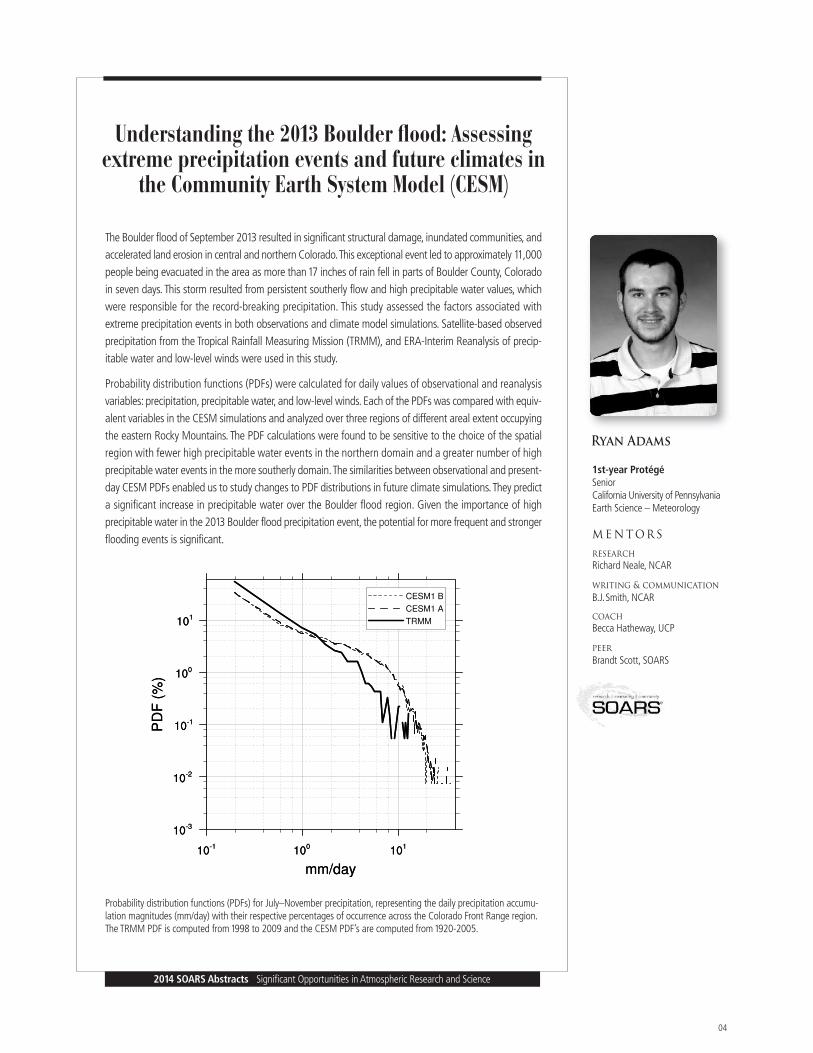
The Boulder flood of September 2013 resulted in significant structural damage, inundated communities, andaccelerated land erosion in central and northern Colorado. This exceptional event led to approximately 11,000people being evacuated in the area as more than17 inches of rain fell in parts of Boulder County, Coloradoin seven days. This storm resulted from persistent southerly flow and high precipitable water values, whichwere responsible for the record-breaking precipitation. This study assessed the factors associated withextreme precipitation events in both observations and climate model simulations. Satellite-based observedprecipitation from the Tropical Rainfall Measuring Mission (TRMM), and ERA-Interim Reanalysis of precip-itable water and low-level winds were used in this study.
Probability distribution functions (PDFs) were calculated for daily values of observational and reanalysisvariables: precipitation, precipitable water, and low-level winds. Each of the PDFs was compared with equiv-alent variables in the CESM simulations and analyzed over three regions of different areal extent occupyingthe eastern Rocky Mountains. The PDF calculations were found to be sensitive to the choice of the spatialregion with fewer high precipitable water events in the northern domain and a greater number of highprecipitable water events in the more southerly domain. The similarities between observational and present-day CESM PDFs enabled us to study changes to PDF distributions in future climate simulations. They predicta significant increase in precipitable water over the Boulder flood region. Given the importance of highprecipitable water in the 2013 Boulder flood precipitation event, the potential for more frequent and strongerflooding events is significant.
Probability distribution functions (PDFs) for July–November precipitation, representing the daily precipitation accumu-lation magnitudes (mm/day) with their respective percentages of occurrence across the Colorado Front Range region.The TRMM PDF is computed from1998 to 2009 and the CESM PDF’s are computed from1920-2005.

3rd-year ProtégéGraduate StudentPlymouth State UniversityApplied Meteorology
mentorsresearch Wiebke Deierling and John K. Williams, NCAR
writing & communicationAmy Stevermer, UCP
graduate advisorEric Hoffman, Plymouth State University
peer Eliza Nobles, SOARS
2014 SOARS Abstracts Significant Opportunities in Atmospheric Research and Science
05
Sarah A.Al-Momar
Time-height plots for Lightning Mapping Array (LMA) very high frequency (VHF) sources (left) and NCAR/NEXRADTurbulence Detection Algorithm (NTDA) moderate or greater turbulence (right) for a severe thunderstorm in Coloradoon 7 June 2012. Moderate or greater turbulence is defined as an eddy dissipation rate ≥ 0.22 m2/3 s-1. For each timeand altitude, the plots show the number of times a VHF source or moderate or greater turbulence grid point occursin the storm volume, normalized by dividing by the size of the storm's domain.
1 25 50 75 100 150 200 250 300 350 400 500 1000 1500 2000 # Occurrence 1 2 250 500 1000 1500 2000 2500 3000 3500 4000 4500 5000 6000 8000 # Occurrence
Examining in-cloud convective turbulence in relation to total lightning and the 3D wind field
of severe thunderstorms
Convectively induced turbulence (CIT) is commonly listed as a cause or factor in weather-related commercialaviation accidents. In-cloud CIT is generated in part by shears between convective updrafts and downdrafts.Total lightning is also dependent on a robust updraft and the resulting storm electrification. The relationshipbetween total lightning and turbulence could prove useful in operational aviation settings with the use of futuremeasurements from the geostationary lightning mapper (GLM) onboard the GOES-R satellite. Providing nearlyhemispheric coverage of total lightning, the GLM could help identify CIT in otherwise data-sparse locations.
For a severe thunderstorm case on 7 June 2012, in-cloud eddy dissipation rate estimates from the NCARTurbulence Detection Algorithm were compared with cloud electrification data from the Colorado LightningMapping Array and radar products from the Denver, Colorado WSR-88D (KFTG). These comparisons showedthat high very high frequency (VHF) source densities emitted by lightning occurred near and downstream of thestorm’s convective core. Severe turbulence was also shown to occur near this area, extending near the meltinglevel of the storm and spreading upward and outward. Additionally, increases in VHF sources and turbulencevolumes occurred within a few minutes of each other. More research on the spatial and temporal relationshipsbetween total lightning and thunderstorm kinematics (i.e. updrafts and downdrafts) are needed to solidifythese results. A dual-Doppler analysis using KFTG and CSU-CHILL radars and/or a Variational Doppler RadarAssimilation System (VDRAS) analysis will aid in this research by providing the storm’s 3D wind field.

06
2014 SOARS Abstracts Significant Opportunities in Atmospheric Research and Science
2nd-year Protégé SeniorIowa State UniversityMeteorology
mentorsresearch Eugene Takle and Renee Walton,ISU
writing & communicationRebecca Batchelor, SOARS
peerZoraida Perez-Delgado, SOARS
Meghan ApplegateMitchell
Skill of the WRF model’s wind speed, direction, and shear forecasts for an Iowa wind farm
Wind energy is a leading alternative energy source, however changes in power output in a wind farm canoccur due to changes in wind direction and wake-turbine interactions. Forecasting wind direction changescan help forecast fluctuations in wind farm power output. Wind direction, speed, and shear observations fromtwo meteorological towers at an Iowa wind farm were compared to the Weather Research and Forecasting(WRF) model to determine the WRF model’s skill in forecasting for this farm. Two 6-hour cases were selectedwhen the two towers agreed and the farm was producing substantial power, with wind speeds above 6 ms-1 and under 20 m s-1. Forecasted wind direction, speed, and shear from a 48-h WRF model run were com-pared with observations from the towers to assess model skill for these cases. Yaw angle data from 5 tur-bines were additionally compared to 80-m hub height observations to analyze the wind directions of theturbines. Yaw angle analysis suggested surface level convergence, though further research is needed to testthis. The mean wind speed and direction biases were 1.01 m s-1 and 9 degrees for Case 1 and the 0.53 ms-1 and17 degrees for Case 2, when averaged over all heights. Since these biases were relatively small, themodel proved skillful in forecasting wind speed and direction , however biases in the wind shear were foundto be larger. Further cases studies are needed to better quantify these results.
Wind speeds observed (solid lines) over the 6 hr period of Case1 for each height of interest, 40 m (squares), 80 m(triangles), and120 m (circles) with the WRF forecasted wind speeds (dashed lines) for each of the heights over thesame period.

1st-year ProtégéSeniorValparaiso UniversityMeteorology & Mathematics
mentorsresearch Daven Henze, Kateryna Lapina,Yanko Davila, CU
writing & communicationVu Nguyen, CU
coachAdrianna Hackett, CU
peerArianna Varuolo-Clarke, SOARS
2014 SOARS Abstracts Significant Opportunities in Atmospheric Research and Science
07
It has been observed that local ozone concentrations can be impacted by both local emissions and by emis-sions that were transported from distant source regions. Thus, changes in ozone concentration in a particularregion can only be understood by analyzing the precursor emission sources, such as nitrogen oxides (NOx),carbon monoxide (CO), and volatile organic compounds (VOC), over multiple regions. In this study, theprimary sources of ozone concentration in seven receptor regions within North America were quantitativelydescribed by employing the GEOS-Chem model and its adjoint. The model results across all regions show thatthe mean contribution of natural emissions to ozone concentration is 57% less than the contribution ofanthropogenic emissions. It is also observed that local emissions have a larger contribution (at least 60%)to ozone concentrations than long-range transport in all observed regions except for eastern Canada.Further results show that peak ozone concentration and transport between regions in the model mostlyoccur during the spring and summer months. The exception to this trend is seen in Mexico, which has itslargest ozone concentration and intake of transported emissions during Northern Hemisphere winter. Overall,this study concludes that ozone concentration and transport depend on a number of factors includingemission type, season and geographical location.
Alicia C.Camacho
Identifying long-range sources of ozone utilizing an adjoint method
Anthropogenic (solid) vs natural (dashed) emissions from seven regions in North and Central America’s contributionto the 6 month mean daily 1hour maximum surface ozone concentration in the Southeast United States in 2010.
08
Three-dimensional variation of atmospheric CO2: A comparison of aircraft measurements with
inverse model simulations
2014 SOARS Abstracts Significant Opportunities in Atmospheric Research and Science
1st-year ProtégéSeniorHaskell Indian Nations UniversityAmerican Indian Studies
mentorsresearch Abhishek Chatterjee, NCAR
writing & communicationNan Rosenbloom, NCAR
coachJeff Weber, UCP
peerJonathan Martinez, SOARS
Eugene D.Cody
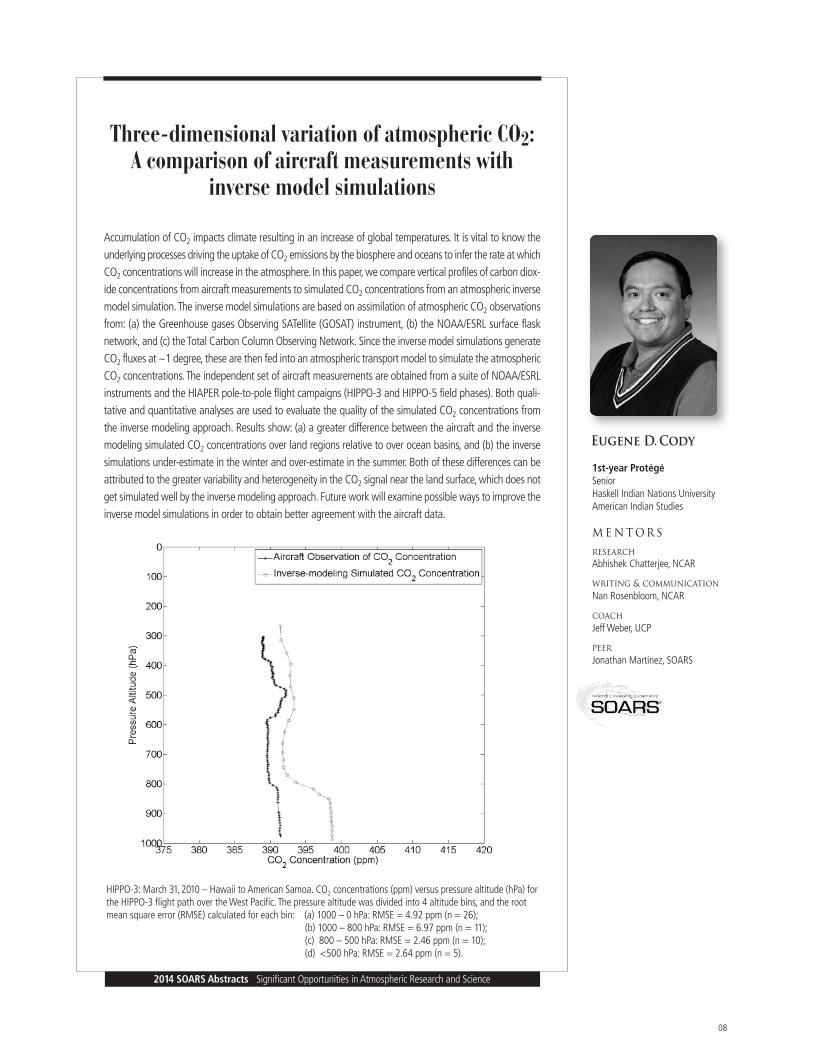
HIPPO-3: March 31,2010 – Hawaii to American Samoa. CO2 concentrations (ppm) versus pressure altitude (hPa) forthe HIPPO-3 flight path over the West Pacific. The pressure altitude was divided into 4 altitude bins, and the rootmean square error (RMSE) calculated for each bin: (a) 1000 – 0 hPa: RMSE = 4.92 ppm (n = 26);
(b) 1000 – 800 hPa: RMSE = 6.97 ppm (n = 11); (c) 800 – 500 hPa: RMSE = 2.46 ppm (n = 10); (d) <500 hPa: RMSE = 2.64 ppm (n = 5).
Accumulation of CO2 impacts climate resulting in an increase of global temperatures. It is vital to know theunderlying processes driving the uptake of CO2 emissions by the biosphere and oceans to infer the rate at whichCO2 concentrations will increase in the atmosphere. In this paper, we compare vertical profiles of carbon diox-ide concentrations from aircraft measurements to simulated CO2 concentrations from an atmospheric inversemodel simulation. The inverse model simulations are based on assimilation of atmospheric CO2 observationsfrom: (a) the Greenhouse gases Observing SATellite (GOSAT) instrument, (b) the NOAA/ESRL surface flasknetwork, and (c) the Total Carbon Column Observing Network. Since the inverse model simulations generateCO2 fluxes at ~1 degree, these are then fed into an atmospheric transport model to simulate the atmosphericCO2 concentrations. The independent set of aircraft measurements are obtained from a suite of NOAA/ESRLinstruments and the HIAPER pole-to-pole flight campaigns (HIPPO-3 and HIPPO-5 field phases). Both quali-tative and quantitative analyses are used to evaluate the quality of the simulated CO2 concentrations fromthe inverse modeling approach. Results show: (a) a greater difference between the aircraft and the inversemodeling simulated CO2 concentrations over land regions relative to over ocean basins, and (b) the inversesimulations under-estimate in the winter and over-estimate in the summer. Both of these differences can beattributed to the greater variability and heterogeneity in the CO2 signal near the land surface, which does notget simulated well by the inverse modeling approach. Future work will examine possible ways to improve theinverse model simulations in order to obtain better agreement with the aircraft data.

Links between oxygen minimum zones and the Hadley circulation
2nd-year ProtégéSeniorSan Jose State UniversityMeteorology and Climate Science
mentorsresearch Caroline Ummenhofer and Kris Karnauskas, WHOI
peerManuel Hernandez, WHOI
2014 SOARS Abstracts Significant Opportunities in Atmospheric Research and Science
09
The purpose of this research is to find links between the projected changes in oceanic oxygen minimum zones(OMZs) and the Hadley Circulation (HC). OMZs are regions of very low oxygen concentrations. Recent researchsuggests that the HC circulation is composed of three regional cells instead of the two globe-encircling cellspreviously thought to be the case. These three cells are co-located with OMZs along the eastern edges of oceanbasins. The HC and OMZs are expected to expand in concert with global warming, which will have many conse-quences. The National Center for Atmospheric Research (NCAR) Community Earth System Model 1.0 (CESM),Representative Concentration Pathways 8.5 experiment with a resolution of 0.9 by 1.25 degrees was used forthis analysis. It was run via the Coupled Model Intercomparison Project phase 5 (CMIP5), and the data wasretrieved from the Woods Hole Oceanographic Institution (WHOI) community storage server. Analysis was per-formed using the NCAR Command Language (NCL). Meridional winds and oceanic oxygen concentrations werethe primarily analyzed variables. Meridional winds overlaid with oxygen concentration confirm that surfaceHadleywise flow and OMZs are linked. Latitudinal ocean oxygen slices place the OMZs in the eastern edges of oceanbasins. Area-averaged time series spanning historical through RCP 8.5 confirm that future changes in OMZs andthe HC may be connected. Further research could lead to improved understanding of the forces that drive changesin both, which could help anticipate and mitigate the consequences discussed previously.
Gabriela De La CruzTello
Area-averaged oxygen concentrations varying from1850 to 2100, for the historical and Representative Concentration Pathways (RCP) 8.5 experiments, just off the west coast of South America. Darker colors show lower oxygen concentrations. Expansion and shoaling of the lower oxygen concentrations is visible through time.

10
Observations of wind asymmetries in Atlantic tropical cyclones
2014 SOARS Abstracts Significant Opportunities in Atmospheric Research and Science
Most major cities are located on coastlines, vulnerable to the direct impacts of tropical cyclones. Therefore, it iscritical to understand and improve prediction of these storms in order to make communities more resilient.Though hurricane warning systems have improved in recent years, these warnings are still insufficient, as theyfail to account for an indication of tropical cyclone wind asymmetry, or the radial extent of maximum winds indifferent locations within the cyclone. This study explored the wind asymmetry (defined by magnitude and ori-entation) among 337 Atlantic tropical cyclones from1988–2012, utilizing the National Hurricane Center’s (NHC)Extended Best Track Dataset (EBT) and Statistical Hurricane Intensity Prediction Scheme (SHIPS). Asymmetrywas defined as the magnitude of the largest difference in the radius of gale-force wind across opposing quad-rants, normalized by the average of the four wind radii. The asymmetry orientation pointed along the axis ofmaximum asymmetry toward the quadrant with the greater gale radius. Relationships between wind asymmetryand various storm characteristics such as geographical location, storm life cycle, intensity, size, storm motion, andvertical wind shear were examined. The magnitude of asymmetry increased in higher latitudes and along coast-lines, particularly in smaller storms. Asymmetry was higher at the beginning of a storm’s life, possibly owing toa less well-organized structure, and higher near the end of a storm’s life, coinciding with an increase in verticalwind shear and translation speed. Results from this study may allow for improved tropical cyclone forecasts andwarnings to help protect seaside communities.
1st-year ProtégéSeniorUniversity of VirginiaEnvironmental Science
mentorsresearch Chris Davis, NCAR
writing & communicationKate Young, NCAR
coachTeresa Eastburn, UCP
peer Anthony Torres, SOARS
Erin Dougherty
The life cycle of tropical cyclone asymmetry, starting at the beginning of a storm’s life (normalized time=0), to theend of a storm’s life (normalized time=2), with the storm’s maximum intensity located in the middle of the life cycle(normalized time=1). The magnitude of asymmetry is the maximum difference in the radial extent of gale-force windsbetween any two diagonal quadrants when the storm is split up into four quadrants and is a normalized value toaccounts for storm size. Circles outside of the box-and-whisker plot denote outliers during each stage.

Using GLOBE student cloud type and contrail data to complement satellite observations
1st-year ProtégéSeniorUniversity of Texas at El PasoEnvironmental Science-Hydroscience
mentorsresearch Julie Malmberg, Travis Andersen, Gary Randolph, Kristin Wegner, UCP
writing & communicationDavid Ahijevych, NCAR
coachChristopher Williams, NCAR
peerSteven Naegele and Carlos Martinez, SOARS
2014 SOARS Abstracts Significant Opportunities in Atmospheric Research and Science
11
The GLOBE Program is a community program of students, teachers, and scientists who collect and analyzeEarth Science data to help sustain, understand and improve the earth. In one of the GLOBE projects, studentsfrom around the world record and submit cloud type and contrail data online. The purpose of this study wasto compare the student data with cloud data obtained from weather satellites, specifically the cloud type andcontrails recorded by the students, and visible imagery from the GOES-13 and Meteosat 7 satellites. Visiblesatellite images only show tops of cloud cover and nothing underneath. However, there are many layers tocloud cover. GLOBE student cloud observation data for Ripton, Vermont and Mantasoa, Madagascar weredownloaded and compared with satellite observations obtained through NOAA’s CLASS system and theEUMETSAT data center to determine whether there could be more cloud layers than previously thought. Theagreement between the student and satellite observations in this study was very good, however two ofthe twenty images studied revealed that due to cloud layering, some lower clouds were present but hiddenfrom satellite view. The results suggest that GLOBE student cloud type observations and contrail data couldprovide supplemental information to visible satellite observations. Candace Hvizdak
Ripton, Vermont, cloud observations reported by GLOBE students (dark grey) showed that of the ten direct comparisons, multiple types of clouds were observed in clear, broken and scattered skies, while the observationsfrom satellites (light grey) showed fewer clouds.

12
A tribal story written in silica: Using phytoliths to research the effects of mining on past wild rice
(Zizania palustris) abundance in Sandy Lake, MN
2014 SOARS Abstracts Significant Opportunities in Atmospheric Research and Science
Wild rice (Zizania palustris, manoomin) is an emergent aquatic plant that grows annually in the northern GreatLakes region of North America. This region is also rich in iron ore deposits and correspondingly has an exten-sive history of mining activities. Wild rice no longer grows in some areas where it was previously abundant.Sandy Lake, located in St. Louis County on federally protected lands that are ceded territory of the Fond duLac Band of Lake Superior Chippewa in Minnesota and downstream of the nearby U.S. Steel Minntac mine,was selected as a test site. This lake has a history of ricing activities by the Ojibwe (Chippewa) People, forwhom manoomin has cultural importance. Lake cores were taken on June17,2014 by LacCore and FDLRMstaff and samples were obtained. This project used phytolith analysis to answer the question of past wild ricepresence and abundance in Sandy Lake. Phytoliths are microscopic opal silica deposits produced in someplants. Zizania palustris produces phytolith morphotypes that are unequivocally diagnostic of this species inthis region. Microscopic slides were prepared and analyzed for wild rice phytoliths. Concentration valuesranged from 25 to 4379 phytoliths per cm3/year, and wild rice accumulation figures ranged from 7 to 789phytoliths/cm2/year, the maximum values of which occurred in the1920s and generally declined to thecurrent lowest levels observed. Mining has likely impacted wild rice populations by causing increased sulfatelevels and possibly contributing to higher lake levels.
2nd-year ProtégéGraduate StudentVermont Law SchoolEnvironmental Law and Policy
mentorsresearch Ida Clarke, BHSUChad L.Yost, U of AChrista Drake, U of MJammi Ladwig, U of MAmy Myrbo, U of MThomas Howes, FDLRM
Ma’Ko’Quah Jones
Wild rice phytolith influx compared to other siliceous microfossils. Wild rice phytolith influx is a proxy for wild riceabundance. The ratio of planktonic to benthic diatoms is a proxy for relative lake level depth. Chrysophytes preferoligotrophic waters and freshwater sponges thrive in slightly alkaline waters.

North Atlantic atmospheric blocking and Atlantic Multidecadal Oscillation: Analysis through
climate models, reanalysis, and datasets
1st-year ProtégéJuniorTexas A&M UniversityMeteorology
mentorsresearch Hyodae Seo and Young-Oh Kwon,WHOI, Justin Small, NCAR
writing & communicationMelissa Bukovsky, NCAR
coachEileen Carpenter, UCP
peer Candace Hvizdak and Steven Naegele, SOARS
2014 SOARS Abstracts Significant Opportunities in Atmospheric Research and Science
13
Atmospheric blocking is an unusual weather phenomenon that is often associated with severe weather eventssuch as heat waves, cold spells, and droughts. Improved understanding of the long-term variability of atmos-pheric blocking thus has important societal implication, as its mechanisms are not well understood. Thisproject investigates the variability of atmospheric blocking in the North Atlantic and its relationship withmulti-decadal oceanic variability represented by the Atlantic Multidecadal Oscillation (AMO) using observa-tion data and the Community Earth System Model (CESM). The mean number of blocking days in the NorthAtlantic is examined in the 20th Century Reanalysis (20CR) and the 30 member CESM Large Ensemble(CESM1LE) simulations. The AMO index is examined in the Hadley Centre Sea Ice and Sea Surface Temperaturedata set version one (HADISST) and the CESM1LE. In the observations, the two primary maxima of atmosphericblocking occurrence are found over the Greenland and the British Isles. CESM1LE underestimates the meannumber of blocking days in these two locations, but the time-scale of variability in each region is comparableto that in the observations. CESM1LE also shows a reasonable AMO with similar amplitude and periodicity tothe observations. In the observations, preliminary results show some correlation between the blocking in theNorth Atlantic and the AMO on decadal time-scales when the AMO leads the blocking by 4 to 8 years. Thissuggests that atmospheric blocking and the associated extreme weather variability in the North Atlantic mightbe modulated by the multi-decadal oceanic variability associated with the AMO.
Carlos Martinez
This figure shows the number of blocking days captured by the 20th Century Reanalysis (20CR). The box indicates theNorth Atlantic Sector, and the greyscale bar displays the average number of blocking days.

14
Examining the link between tropical cyclone radial structure and intensification using the
FLIGHT+ aircraft flight level dataset
2014 SOARS Abstracts Significant Opportunities in Atmospheric Research and Science
Radial structure differences between groups of tropical cyclones (TCs) with similar intensities and intensitychanges are examined using flight level data recorded between 2000 and 2013. Data were collected fromthe National Oceanic and Atmospheric Administration (NOAA) WP-3D aircraft and the United States AirForce (USAF) 53rd Weather Reconnaissance fleet of WC-130 aircraft. Tropical cyclone intensity and intensitychange were determined using the National Hurricane Center’s Best Track (BT) dataset for TCs in the Atlanticbasin. Data from radial legs flown through the center of the TCs were then categorized based on the inten-sity and previous 12 h intensity change determined from the BT dataset. Radial legs were sorted into binsbased on seven different intensity and intensity change thresholds. The radial wind data were then normal-ized by the radius of maximum winds (RMW) and maximum storm-relative wind speed for each leg, providinga non-dimensional analysis that facilitated comparisons with the radial structure of ideal vortex profiles.Composites of the radial legs were also created for each bin. This non-dimensional analysis revealed thewind structure of the majority of radial legs decaying rapidly outside the RMW up to a normalized radiusof two, and then a shallow decay of wind speeds thereafter. Analyses of the radial wind structure in fullydimensional coordinates revealed a tighter RMW for radial legs flown at the 700 hectopascal (hPa) levelcompared to those flown at the 850 hPa level and a steeper decay of winds outside the RMW for radial legsflown at the 700 hPa level.
2nd-year ProtégéGraduate StudentUniversity of Hawaii Atmospheric Sciences
mentorsresearch Jonathan Vigh, NCAR, Michael M.Bell, UH
writing & communicationJoseph Wakefield, NOAA/ESRL
Jonathan Martinez
Probability distribution function of the number of Best Track fixes in the Atlantic Basin, 2000–2013, binned bytheir intensity and previous 12 h intensity change.

15
Innovating the future: Engineering sustainable cooking technologies in
Northern Ghana for improved air quality
2nd-year Protégé JuniorUniversity of MichiganEnvironmental Engineering
mentorsresearch Michael Hannigan, CU, Christine Wiedinmyer, NCAR
writing & communicationAnne Smith, NCAR
2014 SOARS Abstracts Significant Opportunities in Atmospheric Research and Science
Over half of the world’s population in developing nations heats their homes and cooks using open fire orcookstoves fueled by solid biofuels. The emissions generated from the burning of biofuels have the potentialto have a significant impact on human health, air quality, and the regional and global climate. To investigatethis, the REACCTING Project (Research of the Emission, Air Quality, Climate and Cooking Technologies inNorthern Ghana) includes the implementation of a stove intervention among 200 households in NorthernGhana and an evaluation of the environmental and health impacts. The evaluation of the success of thestove intervention and the development of an emissions inventory, key goals of the project, are highlydependent on stove usage. Stove usage is measured qualitatively through self-reporting household surveysand quantitatively with stove use monitors (SUMs). In this study, we simulated realistic cooking experiencesduring which we measured stove temperatures with SUMs and the fuel used. In the simulated cookingexperiences, we conducted multiple control cooking tests (CCTs) using three stoves used in the interventionthat are currently deployed in Ghana; the traditional three stone, a Ghanaian-made Gyapa stove, and thePhilips gasifier stove. The CCTs gave quantitative measures of the relationship between the different stoves,including factors such as temperature variability, changes in cooking times, and heat efficiencies. We foundthat the placement of the SUMs on each stove is significant and creates artificially high temperature vari-ability profiles of the stove. We found that additional technology should be adopted in future in order toproduce more accurate temperature profiles. The conclusions drawn regarding cooking practices, ultimatelylead to understanding how cooking practices affect emissions from the cookstoves used in the study.
Jenine N. McKoy
SUMs Data from CCT on June 26, 2014. The temperature profile shows two different temperature variability profilesthat were taken during a cooking experience on the Ghanaian-made Gyapa stove. The bold profile is representativeof the temperature variability of the SUMs that was placed in the sun. The dotted profile is representative of thetemperature variability of the SUM that was placed in the shaded area on the stove.

16
Sensitivity of a simulated squall line to the microphysical representation of graupel
2014 SOARS Abstracts Significant Opportunities in Atmospheric Research and Science
In order to accurately simulate storms and their precipitation within atmospheric models, we need to ensurethat atmospheric processes are well parameterized. In the case of the Thompson microphysics parameterization,the vapor, rain, snow, cloud ice and graupel/hail hydrometeor categories have their particle densities set to aconstant value. This is a good assumption for particles where the density doesn’t vary much, like rain or ice,but it is not very realistic for the graupel/hail category since the density of graupel and hail is known to varygreatly between and within storms. This study assessed the sensitivity of an idealized simulated squall line tothe prescription of graupel density using the Weather Research and Forecasting (WRF) model. The range ofgraupel density was varied from 200 kg m-3 to 800 kg m-3, representing particles more characteristic of grau-pel than to those of hail, respectively. As the density of graupel particles was decreased from being hail-liketo graupel-like, simulations showed a faster squall line with less graupel and more ice. There was a notableincrease in the graupel melting rate, which resulted in more latent cooling and therefore a more intense coldpool in the lower density cases. This led to the faster storm propagation speed, indicating a sensitivity of thissimulated storm to the prescription of graupel density. These results provide motivation to use graupeldensity as a predicted variable when modeling storm formation characteristics such as precipitation, cold poolformation, and subsequent storm evolution.
1st-year Protégé SeniorUniversity of Illinois at Urbana-ChampaignAtmospheric Sciences
mentorsresearch Sarah Tessendorf, Greg Thompson,Trude Eidhammer, NCAR
writing & communicationRachel McCreary, NCAR
coach Bob Wiley, UCAR
computingSherrie Fredrick, NCAR
peerCarlos Martinez
Steven M.Naegele
Melting rate of graupel for the original case where the density of graupel is set to 500 kg m-3 (ORIG, displayed asthe solid line) and four experimental cases where the density of graupel was changed to 200 kg m-3 (RHO_G2, thedashed line), 350 kg m-3 (RHO_G35, the darker dotted line), 650 kg m-3 (RHO_G65, the lighter dotted line), and800 kg m-3 (RHO_G8, the dashed-dotted line).
01:00 02:00 03:00 04:00 05:00 06:00 07:00 08:00 09:000
0.02
0.04
0.06
0.08
0.1
0.12
0.14
0.16
0.18
0.2Time series of ORIG, RHO__G2, RHO__G35, RHO__G65, and RHO__G8 Graupel Melting Rate
Hours since model initialization
Tota
l Gra
upel
Melt
ing R
ate
(kg/
kg/s)
ORIGRHO__G2RHO__G35RHO__G65RHO__G8

Developing optimal transport and dispersion climatologies for nuclear deposition mapping
1st-year ProtégéSophomoreDrexel UniversityEnvironmental Engineering
mentorsresearch Luna Rodriguez, Andrew J. Annunzio, and Paul E. Bieringer, NCAR
writing & communicationDan Marsh, NCAR
coachIan C.Colón Pagán, Georgia’s Department of Natural Resources
peerSarah Al-Momar
2014 SOARS Abstracts Significant Opportunities in Atmospheric Research and Science
17
An understanding of the probable movement of nuclear material through the atmosphere is of interest tothe United States government, and is also crucial for the well-being of society in the scenario that a nuclearattack or accident occurs. The United States Strategic Command (STRATCOM) is responsible for the man-agement of and response to nuclear weapon use. To analyze likely deposition patterns of nuclear materialfollowing a nuclear attack, STRATCOM conducts analyses that utilize past meteorological events fromclimate datasets to investigate the medium range atmospheric transport and dispersion (AT&D) of airbornematerials. A limiting factor of these analyses is the computational and data storage burden; significantcomputational resources are necessary to compute thousands of transport and dispersion simulations usinga climate dataset, and the climate datasets and transport and dispersion solutions require significant datastorage capabilities. This study examined simulated nuclear strikes using the Hazard Prediction and Assess-ment Capability and Second-order Closure Integrated PUFF (SCIPUFF) tools. The goal was to amelioratecomputational and data storage costs by identifying the smallest meteorological record length required tosufficiently capture the full distribution of AT&D solutions. While a final conclusion has not yet been reached,programs were created to initialize and run SCIPUFF with various dataset lengths to generate AT&Dsolutions. The most efficient data subset length for nuclear deposition mapping will hence be the outcomeof future work.
Eliza Nobles
A typical distribution of radioactive material (right) produced from the SCIPUFF transport and dispersion modelusing one sample from a wind climatology (left).

18
Evolution of phytoplankton in a changing climate
2014 SOARS Abstracts Significant Opportunities in Atmospheric Research and Science
Anthropogenic emissions of greenhouse gases have led to an increase in CO2 and temperature in theatmosphere, as well as an increase in the sea surface temperature (SST). It has been suggested that a rise inSST leads to an increase in ocean stratification, surface nutrient limitation, and a possible decrease in theabundance of phytoplankton in the surface ocean. Here, we investigate long-term changes in surface phyto-plankton, specifically diatoms, diazotrophs, and small plankton abundance using monthly output from ahindcast (1958–2007) simulation of the Community Earth System Model. We find that annual-mean modeledphytoplankton chlorophyll concentration is similar to that observed from satellites, and that small phyto-plankton dominate the surface ocean chlorophyll field at most locations. Seasonal evolution of thephytoplankton shows small plankton and diatoms peak in the summer months, while diazotroph abundancepeaks in the spring season. Linear trends in the abundance of the three groups reveals the response of eachgroup to past climate change. Small plankton and diatoms exhibit similar trends: increasing concentrationwith time in the Arctic and Southern Ocean, but decreasing concentration with time in the subtropics, whilediazotrophs show a decrease in concentration with time in the subtropical regions.
1st-year ProtégéSeniorUniversidad MetropolitanaEnvironmental Science
mentorsresearch Nicole Lovenduski, CU
writing & communicationMcArthur Jones, CU
coachRobert Stillwell, CU
computerNatalie Freeman, CU
peer Jenine N. McKoy and Meghan Applegate Mitchell
Zoraida P. Pérez Delgado
Annual-mean surface chlorophyll concentration from1958 to 2007, as estimated by theCommunity Earth System Model.

Utilizing portable air quality monitors to assess the patterns of ozone along
the Northern Front Range
1st-year ProtégéJuniorUnion CollegeGeology
mentorsresearch John Orlando and Julia Lee-Taylor,NCAR, Michael Hannigan, CU
writing & communicationCarl Drews, NCAR
computingKeith Maull, NCAR
communityRebecca Hornbrook, NCAR
peerRyan Adams, SOARS
2014 SOARS Abstracts Significant Opportunities in Atmospheric Research and Science
19
High levels of ozone in the troposphere are known to produce a myriad of harmful effects on human health.Due to a significant interest in the quality of air along the Front Range in Colorado, the Front Range AirPollution and Photochemistry Éxperiment (FRAPPÉ) launched a field campaign utilizing both ground andairborne instruments to monitor air pollution during the summer of 2014. This study contributes to the FRAPPÉcampaign by using newly developed portable air quality monitors (Mpods) in conjunction with stationaryground instruments to monitor air quality. The Mpods were calibrated co-location style: they were placed neara regulatory monitor at the Continuous Air Monitoring Project (CAMP) site in Denver to record data. Acalibration curve was then created using the data from the regulatory monitor as a standard. For this study,four Mpods were distributed to hikers and deployed twice a week over a period of four weeks. Deploymentlocations varied to cover a large extent of the Front Range. Ozone concentrations recorded by the Mpodsexhibited strong correlations to the relative humidity and temperature recorded. It was concluded that thiscorrelation was due to the way in which they were calibrated and had the potential to skew the ozone meas-urements recorded. Future studies can use this data to further explore the use of cost-effective personal airquality monitors.
Brandt Scott
Spatial ozone concentrations (gray line) and elevation (black line) recorded by Mpod17 along the 1st Flatiron inBoulder, Colorado between 3:34pm–4:47pm on July 17th,2014. Ozone concentrations exhibited a relative increaseover time with a maximum value of 81ppb. Several of these values exceed the EPA standard for ozone.

20
Using the Mesoscale Model Evaluation Testbed to test physics options in the
Weather Research & Forecasting model
2014 SOARS Abstracts Significant Opportunities in Atmospheric Research and Science
The Mesoscale Model Evaluation Testbed (MMET) has been set up by the Developmental Testbed Center(DTC) to assist the research community in efficiently testing and evaluating newly developed model tech-niques aimed to more accurately predict the weather and to potentially be implemented into operations. Forthis project, datasets available through the MMET were utilized to test the forecast performance of severalconfigurations of the Weather Research & Forecasting model (WRF v3.5.1) using the Advanced Research WRFdynamical core for different physical parameterization schemes and grid-spacing. A significant derecho eventthat occurred on 29 June 2012 over the U.S. Midwest and Mid-Atlantic states was chosen for this case study.Statistical analysis of each WRF configuration was conducted using the Model Evaluation Tools (MET) andresults were plotted using R, a statistical package. Standard verification metrics were calculated for surfaceand upper-air temperature, dew point temperature, and wind speed, as well as precipitation. In addition, amore advanced spatial verification technique, known as the Method for Object-based Diagnostic Evaluation(MODE), was utilized to diagnose errors in forecast precipitation placement, coverage, and orientation. Resultsindicated that model performance was sensitive to grid-spacing and physics options. Adjusting the grid-spacing from15- to 5-km while utilizing the same physics options allowed for strong convective developmentthat otherwise did not occur. Substituting different microphysics and radiation options at the 5-km grid-spacing had significant effects on developing the storm and resulting storm structure, while changing theplanetary boundary layer scheme positively impacted the storm placement. The synoptic environment depictedby the WRF configurations that were able to simulate strong convective development is consistent withresearch on derecho formation.
1st-year ProtégéSeniorUniversity of MichiganEarth Systems Science and Engineering
mentorsresearch Michelle Harrold, Cody Phillps,Jamie Wolff, NCAR
writing & communicationWendy Abshire, UCP
coachMarcus Walter, WKYC-Cleveland
peerErin Dougherty, SOARS
Anthony Torres
Example illustrating MODE objects created from WRF 3-h accumulated precipitation fields and the associated Stage IIanalysis fields for the 39 hour forecast from the 28 June 2012 12 UTC initialization. In this example, the configurationbeing evaluated is using the RRTMG long- and short-wave radiation schemes. A convolution threshold of 0.254 mmwas used to define the objects; the shaded regions represent objects in the forecast field, and outlined areas representobjects in the observed field.

Effects of large volcanic eruptions on climate in the Community Earth System Model
1st-year ProtégéJuniorLyndon State CollegeAtmospheric Sciences
mentorsresearch Brian Medeiros, NCAR
writing & communicationBrian Bevirt, NCAR
coachLuna Rodriguez, NCAR
peerAlicia C.Camacho, SOARS
2014 SOARS Abstracts Significant Opportunities in Atmospheric Research and Science
21
This research investigates the climate system’s response to large volcanic eruptions in simulations of a globalatmosphere model called the Community Earth System Model-Large Ensemble (CESM-LE). This is importantfor developing better predictions of how volcanic eruptions affect the atmosphere, oceans, cryosphere, andbiosphere, and to help people and communities develop mitigations and adaptations to volcanic impacts.Using 29 CESM-LE global simulations with each ensemble member making unique predictions about howthe weather and climate will change, the climate system’s response to large volcanic eruptions can be betterunderstood. This analysis involved examining three large 20th century eruptions, Mount Agung, El Chichón,and Mount Pinatubo and their effect on CESM-LE ensemble members. Anomalies and standard deviationswere distinguished and calculated from the ensemble means of three climate variables: surface temperature,precipitation, and surface pressure. The analysis focused on surface temperature anomalies to look for twoclimate responses: Northern Hemisphere (NH) winter warming and changes in El Niño Southern Oscillation(ENSO) events. The first task was to determine whether the observed response of NH winter warmingappears in the climate model. The second task involved assessing the likelihood of a volcanic eruptiontriggering an ENSO event in the CESM-LE. Initial model results indicate that volcanic eruptions were notfound to trigger northern hemispheric winter warming or an increased probability of an ENSO event in theeastern Pacific Ocean.
Arianna Varuolo-Clarke
Global surface temperature anomaly for the 29 member CESM-LE. The black line traces the ensemble mean temperature anomaly. The dark gray band shows the +/- 1� envelope and the light gray band shows the full ensemble spread. The major volcanic eruptions are labeled.

NEON Internship ProgramNEON's Internship Program is designed to help undergraduate students in science, engineering, andcomputing build successful work experiences and prepare for future STEM careers.
Intern projects span the breadth of NEON's endeavors - from programming algorithms that automatefield sensor data and image analyses to testing protocols and analyzing complex data sets for signals ofenvironmental change. A cornerstone of our program is mentoring. Each intern receives support fromhis/her own team of mentors who guides the work and provides insights on career options and careerpaths. NEON interns also receive training in scientific communications, a critical skill for STEMprofessionals, and are given multiple opportunities to practice sharing their work in a variety of formatsincluding scientific or technical papers, posters and oral presentations. Our goal is for interns to leaveNEON with completed projects they are proud to include on their resume along with workplace skillsthat position them as future leaders in their field.
Because NEON is committed to broadening participation in science and engineering fields, reflectedin the mission of the internship program, we are particularly interested in working with students fromhistorically under-represented groups in science and engineering. NEON uses best practices forrecruitment and intern support, and provides career exploration seminars and advanced technologyworkshops. We also collaborate with SOARS on cross-program student activities such as leadershiptraining and scientific poster sessions that strengthen all students'experiences.
NEON is proud of its newest cohort of interns, and of their significant contributions towards buildingour national ecological observatory from the ground up.
22

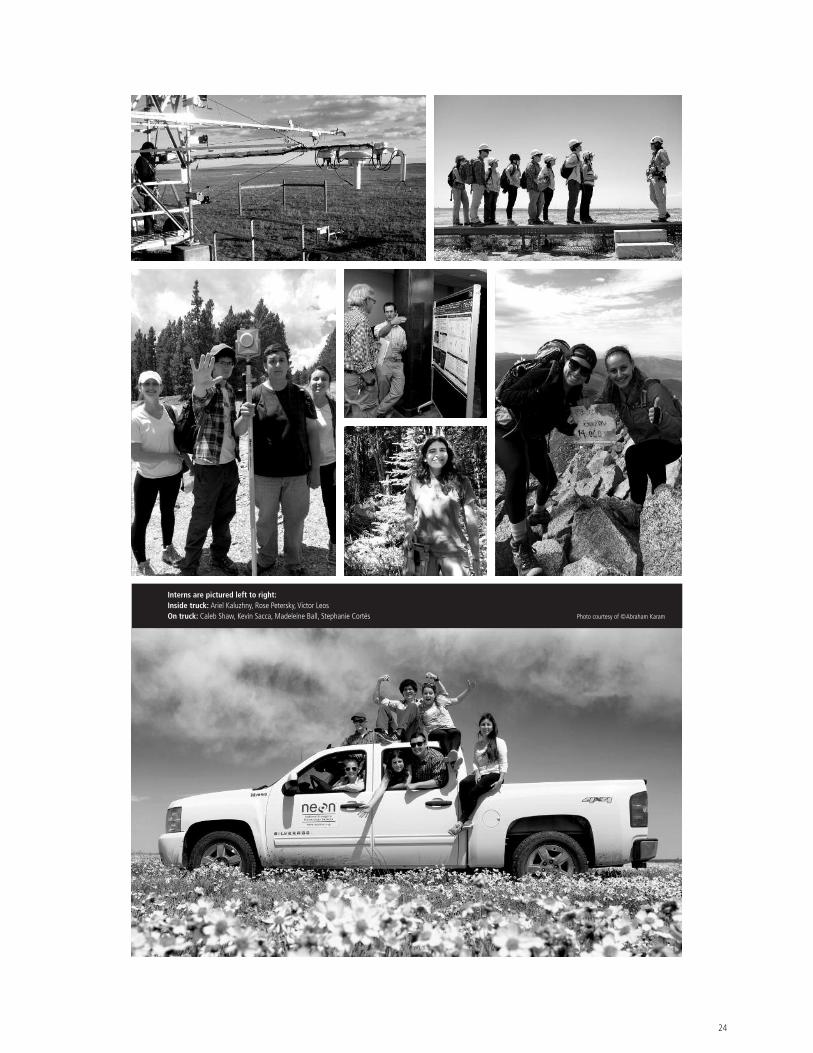
Interns are pictured left to right: Inside truck: Ariel Kaluzhny, Rose Petersky, Victor Leos On truck: Caleb Shaw, Kevin Sacca, Madeleine Ball, Stephanie Cortés Photo courtesy of ©Abraham Karam
24

25
A comparative analysis of Landsat, AVIRIS, and NIS normalized difference vegetation indices
in Domain 17, the Pacific Southwest
SeniorTufts UniversityEnvironmental Studies and Earth and Ocean Sciences
mentorsresearch Nathan Leisso, Shelley Petroy
writing & communicationLeah Wasser
communityKat Bevington
2014 NEON Abstracts National Ecological Observatory Network
The National Ecological Observatory Network (NEON) is constructing an Airborne Observation Platform (AOP)to provide high resolution LiDAR, aerial, and hyperspectral data for NEON sites across the United States. Thisplatform includes the NEON imaging spectrometer (NIS) that provides >420 bands of high resolution dataacross a spectral range of 380 nm to 2,510 nm. AOP will provide normalized difference vegetation indices(NDVIs) that use data in the red and near infrared portions of the electromagnetic spectrum to estimatevegetation density and health. Deriving NDVIs using NIS is challenging given the large volume of bands.Further, to allow scaling to larger regions, NIS products must be comparable to lower resolution products fromother sensors such as Landsat and AVIRIS (Airborne Visible / Infrared Imaging Spectrometer). The goals ofthis study were to (1) determine NDVI sensitivity to NIS spectral band selection and (2) compare NIS NDVIsto Landsat and AVIRIS. Using 2013 NIS data collected from the San Joaquin Experimental Range near Fresno,CA, results indicated that NIS NDVIs are sensitive to band selection. Low wavelengths both in the red andnear infrared show the greatest contrast between high and low values and should be used for visualizationof vegetation. If comparing NIS NDVIs with Landsat or AVIRIS, it is best to spectrally and spatially resamplebefore analysis. As NEON transitions to operations in 2017, it is important to understand optimal methodsof creating data products so the scientific community has access to data that best meets its needs.
Madeleine A.Z.Ball
Differences in spatial resolution between 1) Landsat (30 m resolution), 2) AVIRIS (20m resolution), and 3) theNEON Imaging Spectrometer (1 m resolution) in the San Joaquin Experimental Range. Note the road, cars, andindividual trees are distinguishable in NEON Imaging Spectrometer.

26
Interpreting canopy phenology using an automatic image analysis algorithm to
process Phenocam images
2014 NEON Abstracts National Ecological Observatory Network
The National Ecological Observatory Network (NEON) plans to provide data on climate change impacts. Datawill be collected from sites in different ecosystems across the nation and this requires high quality and stan-dardized methods to gather reliable data. Plant phenology is highly sensitive to climate change and can giveinformation about its impacts. Also, changes in the plant cycle affect the time when plants act as a source orsink of carbon dioxide (CO2). Stardot cameras are standardized and cost effective, and can be used to studyplant phenology. An automated algorithm was prototyped to analyze plant phenology on images from thePhenocam Network. Six phenology metrics were used to summarize green and red color values in a selectedarea of the image. The area was divided into a grid and statistical analysis was applied to the phenometricvalues per zone in the grid. The results were plotted versus the day of the year (DOY). A curve fit was appliedto calculate the representative function of the plot and by calculating the corresponding derivatives set tozero, the algorithm calculated the DOYs when the phenometrics were maximum, minimum or inflection points.The derivative results were related to green-up or brown-down in the plant phenology cycle. This algorithmwas applied to 5 different ecosystems to find the different timing in the plant phenology cycles. This analysis,applied over the thirty years of NEON’s data gathering, will give information on the changes in plant phenology.
SeniorUniversidad de los AndesBogotá, Colombia Environmental Engineering andIndustrial Engineering
mentorsresearch Michael SanClements, Sarah Elmendorf
writing & communicationMichael SanClements, Sarah Elmendorf
communityLaura Sutton Aeling
Stephanie Cortés
Plots with a 6-degree polynomial fit of two ecosystems. A clear increase in the excess of green (EG) phenology metric during spring and summer is seen, even though both ecosystems have different vegetation, demonstratingthat the algorithm can be standardized and automated for different ecosystems.

Implementation, visualization, and output analysisof time series algorithms for NEON tower sensors
JuniorWesleyan UniversityComputer Science and Economics
mentorsproject François Pradeau, Jim Arnow
writing & communicationLiz Goehring
communityDee Dahanayake
2014 NEON Abstracts National Ecological Observatory Network
27
The National Ecological Observatory Network (NEON) has a distribution of instrument towers across 20 eco-climatic domains in the United States, each equipped with variety of sensors to study long term, ecologicalchange. These sensors collect atmospheric data, referred to as Level 0 (raw data), on a continuous basis, butthe data are not readily comprehensible. NEON’s Cyber Infrastructure Data Processing and Monitoring System(DPMS) transforms Level 0 data to higher level data products that will be made available to scientists,educators, and the public through NEON’s Data Portal. The DPMS team implements algorithms provided byNEON scientists while assuring quality and accuracy in the data. This project involved (1) early stages ofimplementation of the 2D Sonic Wind Anemometer transition algorithms, and (2) creation of regressiontests comparing outputs of algorithmic transitions before and after a code change for various atmosphericmeasurements. These regression tests are necessary to monitor outcomes after any code changes, ensuringconsistency and accuracy of Level1data. The regression tests generate graphs of the data, summary statis-tics, and graphical displays of the differences between expected and current data. The regression tests wererun on seven existing Level 0 to Level 1data transitions and will be run on more as they become available.Both the regression test code and the algorithm implementations are essential to NEON’s preparation tobecome fully operational in 2017.
Ariel Kaluzhny
Overall process and deliverables (tangible products) involved in the transition from a science AlgorithmicTheoretical Basis Document (ATBD) to preliminary data in the NEON Data Portal. Project components arehighlighted by shaded outer boxes.

Exploring vascular plant and carabid beetle diversity across three different ecoclimatic domains
using NEON provisional data
2014 NEON Abstracts National Ecological Observatory Network
The measurement of biodiversity to interpret population and ecosystem dynamics and structure is increas-ingly used in ecosystem research. The National Ecological Observatory Network (NEON) is a nationwide,30-year project aimed at collecting data on long-term ecological change. This study explored two data setsobtained from NEON’s 2013 provisional data, carabid beetle richness and vascular plant composition acrossmultiple plots occurring in five sites that represent three eco-climatic domains. There were no statisticallysignificant correlations between inverse Simpson diversity for beetles and plants at the plot, site, or domainlevel. This may be a result of marked overlap between beetle composition and vegetation type among somedomains. An analysis of variance, however, indicated that there were significant differences in plant diversitybetween vegetation types at some of the domains. Further studies are needed to explore the influence thatthis may have on localized beetle community composition and diversity. This work demonstrates the poten-tial capability of NEON-collected data to identify patterns that may be useful for informing managementstrategies that support biodiversity in a wide variety of ecosystems.
JuniorBowdoin CollegeEnvironmental Studies and Biology
mentorsresearch David Hoekman, Katie Jones, Natalie Robinson
writing & communicationKatie Jones, Natalie Robinson
communityMaxwell Mathews
Victor Baldemar Leos
An ordination of 2013 carabid beetle community composition data for Domain 01 on two axes. Points onthe graph represent plots within the domain and are placed using Bray-Curtis dissimilarities. Polygons rep-resent different vegetation type groupings, and the area of the polygon represents the strength of beetlespecies similarities between plots; a smaller polygon representing greater similarity between plots. Theoverlapping of polygons suggests that some beetle species can be found in multiple vegetation types.
28

Determining the optimal spatial resolution of measurements for mapping
stream geomorphology using land surveying
SeniorSUNY-ESFEnvironmental Science
mentorsresearch Ryan Utz, Michael Fitzgerald
writing & communicationRyan Utz
communityDustin Whittemore
2014 NEON Abstracts National Ecological Observatory Network
29
Digital elevation models (DEMs) are commonly used to illustrate and model geospatial information relatedto riparian channels. However, determining the exact elevation of every location in a stream reach is logisti-cally impossible. DEMs therefore use interpolation to approximate elevation values. Surveying is time-consuming and therefore, minimizing the number of surveyed locations while accurately capturing thetopographic features is important. High-resolution stream cross-section surveys were compared against aninterpolated surface generated from field survey data obtained following NEON’s initial draft Protocol forStream Geomorphology. Points were collected using NEON’s current protocol in a reach of the Arikaree River,a shortgrass prairie stream in Colorado, for geomorphological features and five cross sections. An inversedistance weighted (IDW) interpolation was performed with100 random selections of 50, 60, 70, 80, and 90percent of the points and the cross section measurements excluded. For each sample density, the root meansquared error (RMSE) values of the cross sections were found by comparing the measured elevation values tothe interpolated values. The RMSE values were then compared with the cross section of origin and the sampledensity as predictor variables. Sample density did not have a statistically significant effect on accuracy. There-fore, theoretically, fewer points can be collected without negatively impacting the accuracy of the map.Accuracy may be impacted by other factors, such as where data is being collected, more than sample density.Future surveys should focus on the quality of sampling, and should reduce the amount of area withoutmeasured data.
Rose Petersky
Geomorphological map of the Arikaree river site with Cross Sections #1-5, benchmarks and thalweg in-cluded. Contours and elevation gradient created using an inverse distance weighted (IDW) interpolationwith 100 percent of the data collected.

Determining snow depth using an automated image processing algorithm
2014 NEON Abstracts National Ecological Observatory Network
The National Ecological Observatory Network (NEON) collects standardized ecological data from106 sitesdistributed throughout the continental United States. Because snow is a common form of precipitation in theU.S., it needs to be measured accurately, which is challenging to do. The amount of snowfall in an ecosystemis important due to the insulating effects of snow cover, snow’s effects on surface energy balance, and theamount of water it adds to the environment. Snow water equivalent (SWE) is the product of snow depth andsnow density, and represents the amount of water entering the soil if the snowpack melts. NEON’s towersare equipped with static phenology cameras for automatically collecting understory images remotely, butthese same images can also be used to determine snow depth through robust image processing techniques.The challenge is collecting consistently accurate measurements on a continental scale. Instead of manuallyreading the lines on a staff gauge in an image, pixel data can be automatically analyzed. A line profile collectsthe intensities of pixels that fall on a designated line, and from their relative intensities, designated pixels canbe classified as snow. The depth of snow on a staff gauge in pixel units translates to a depth in meters, and thedepth is recorded with the time and location, allowing for long time series data. After testing this algorithmwith simulated datasets, the accuracy of the measurements was within approximately 1cm, meeting theproject’s requirements. This data will be freely available via NEON’s web portal.
JuniorRochester Institute of TechnologyImaging Science
mentorsresearch Michael SanClements, Sarah Elmendorf
writing & communicationMichael SanClements, Sarah Elmendorf
communityMatt Ventimiglia
Kevin Sacca
Image A shows a cropped region of interest of a staff gauge with the lines to be profiled. Graph B shows the lineprofiles of the staff gauge in the red (R), green (G), blue (B), and greyscale composite (K) channels. Note the reg-ular oscillations of pixel intensity in the region of the staff gauge not covered by snow.
30

Comparison of common lilac (Syringa vulgaris)phenology timing between historical data and current Project BudBurst citizen science data:
Challenges and lessons learned.
2014 NEON Abstracts National Ecological Observatory Network
Observing the timing of plant phenology provides a way to monitor and predict effects of ecological changeon plants. This study compared historical phenology data for common lilac dating from 1956–2003 withrecent lilac phenology data collected by Project BudBurst citizen scientists from 2007–2013. Due to the lack ofaccessible growing degree day data, it was not possible to directly examine climate effects on phenology timing.Instead, we compared geographic distribution patterns between historical and Project BudBurst data toexplore what factors might contribute to the timing of phenophase dates between data sets. T-tests wereperformed on latitude, longitude, and day of year of observation for the first flower and first leaf between thetwo data sets. Differences between latitudes of observation sites were not significant for first flower and firstleaf (p = 0.789, p = 0.489, respectively) but there was a difference between longitudes for both variables(p<0.001). Mean observation dates for Project BudBurst data were 9.5 days earlier for first flower (p = 0.0001)and 2.3 days earlier for first leaf (p = 0.063) but the longitudinal difference of observation sites between datasets and the small sample size of the Project BudBurst data set make these findings inconclusive. Because ofthe differences of longitude, we suggest future analyses of data by geographic regions. Additional ProjectBudBurst observations in the western U.S. would allow better comparisons in that region and encouragingobservations near historic sites would take advantage of a long, rich data set.
STAR Teacher ResearcherUniversity of New Hampshire, 2012
mentorsresearch Sarah Newman, Sandra Henderson,Tom Stohlgren (CSU)
writing & communicationSarah Newman, Liz Goehring
educationLiz Goehring
Caleb Shaw
Two-Sample T-tests for first flower: A) observation day of year (historical: M =124.2, SD = 22.3, Project BudBurst: M = 114.7, SD = 20.2), t = 6.8, p = 0.0001, B) longitude (historical: M = -106.6, SD = 15.3, Project BudBurst: M = -90.5, SD = 16.2), t = -14.53, p = 0.0001. The left sides of the figures are historical data and the right sides are Project BudBurst data.
31
PRE-College Internship Program at NCAR The NCAR/RAL PRECIP program, now in its fifth year, is designed to provide high school studentswith an opportunity to gain experience with real-world scientific research and engineering projects andto engage them in STEM-related fields. Eight Puerto Rican students attended the program througha partnership with the Ana Méndez University System's Pre-college summer research internshipprogram. Five others from four local Colorado high schools were funded by RAL. For eight weeks, all 13students worked closely with engineers and scientists on projects ranging from testing snow gauges andvalidating tipping bucket rain gauges, to comparing aircraft icing monitoring techniques. Studentsparticipated in a PRECIP Writing Workshop to help them develop scientific writing and posterdevelopment skills, including writing a scientific abstract and analyzing their data.They presented posterson their research at the conclusion of the summer program at a formal poster session open to all NCARscientists, engineers, and other internships.The PRECIP program is proud of this year's students andour past students, almost all of whom have gone on to pursue college degrees in STEM-related fields.
PRECIP
32


Clockwise from top left: Derek Champlin, Gian Carlo Di Cristina, Valerie Rodríguez Castro, Lucas Szewczyk, Forrest Eppler (not PRECIP), Justin Martyr, Ilya Fedorchuk, Paola Esteban Pérez, Luana Parades Sanchez, Lauren Sharpe, Rachel Sharpe, and Ricardo Rodríguez García (not pictured: José Cruz Ayala, Andrea Vásquez).
34

35
SeniorJosefina Leon Zayas High School
mentorsresearch John Mickey, NCAR
José C. Cruz Ayala
Accuracy of precipitation measurements using tipping bucket rain gauges
When dealing with precipitation gauges, there is a lot of variability in the measurements. In the case oftipping bucket rain gauges, some of this variability can be related to the different models of gauges. Thisresearch looked at the differences between two types of tipping bucket rain gauges. To get a clear view ofthe difference between them,15 tipping bucket gauges were placed in NCAR’s Sandlot, a local test site inBoulder, Colorado, to collect data during five days in July of 2014. These consisted of two models; six with acapacity of 7ml and nine with a capacity of 8.5ml. Tripods and bases were optimized for these precipitationgauges, giving them better stability. During the five-day period, the 7ml tipping bucket collected an averageof19 ml of rain per bucket and the 8.5 ml tipping bucket collected an average of 19.4 ml of rain per bucket.Analysis of the data showed that the different styles of tipping buckets provide consistent measurements andhad a really strong correlation between them. Scientists can therefore be confident in using these two stylesof tipping bucket rain gauges in future research.
Senior, Josefina Leon Zayas High School
mentorsresearch Scott Landolt, NCAR
Derek C. Champlin
The efficiency of the heating system technique in the NCAR snow precipitation gauge (GEONOR)
Accurate snowfall measurements are very difficult measurements to make, primarily due to variables suchas wind velocity and temperature. The objective of this investigation is to determine whether the GEONORheating system is impacting the snowfall measurements of the gauge, which is used in various precipitationnetworks around the world. During some snowfall events, snow will stick to the inner sides of the gauge, whichcan lead to snow capping and affect measurement accuracy. A series of18 tests, nine with the heater on andnine with the heater off, was conducted to determine the effects of the heating on the gauge performance.The tests were made in a cold room laboratory using different air temperatures and snowfall rates in anartificial snowmaking machine. Additionally, this investigation focused on determining if there were actualheatplumes that could affect the precipitation measurements. The hardware used include thermocouples tomeasure heatplumes that may emerge from the GEONOR, a data logger to store the data from the thermo-couples, and a solid state relay that provides the power to the GEONOR heater. The data collected confirmthat the heating system prevents snow build-up in the orifice, even when the temperature was -25°C. It wasalso observed that the colder the ambient temperature, the more snow accumulates on the gauge shoulders,regardless of heating being applied. When analyzing the thermocouple data to determine if heatplumescould be detected above the gauge opening, no significant heatplumes were observed above the gauge.
2014 PRECIP Abstracts PRE-College Internship Program at NCAR

36
SeniorColegio San José
mentorsresearch Leslie M. Hartten and Paul E. Johnston, CIRES/NOAA ESRL
Paola S. Esteban Pérez
2014 PRECIP Abstracts PRE-College Internship Program at NCAR
Calibrating the Manus profiler using TRMM satellite bright band reflectivities
A wind profiler is a type of weather observing instrument that uses radio waves to detect the wind speedand direction at different elevations above the ground. The Manus profiler was a 915-MHz radar, sensitiveto precipitation and clear air, that operated on Manus Island in northeastern Papua New Guinea from1992to 2001. However this radar was not calibrated, and meteorologists need a calibration factor in order to usethe radar to get more accurate measurements of the structure and strength of turbulence and precipitationin the lower atmosphere. To calibrate the profiler, average bright-band reflectivity at 2°S from the TRMM(Tropical Rainfall Measurement Mission) satellite is compared with the uncalibrated maximum reflectivitiesmeasured by the profiler when it observed bright bands. The analysis and comparison from the Manusprofiler data through the years 1992–1994 will provide the information required to get the calibrationfactor. The calibration differs from Rodríguez Castro’s calibration, which was based on surface rain data, by7.16 dBZ (a factor of 5.2). Comparing resulting profiler rain estimates with surface rain measurements willtest the profiler calibration and after the calibration constant is verified, data from this profiler may be usedin a wider range of applications.
SeniorCentro de Desarrollo Integral
mentorsresearch John Mickey, NCAR
Gian Carlo DiCristina
Variability in the measurement of two models of tipping bucket rain gauges
There are many ways to measure precipitation, each with its own strengths and weaknesses. The variabilitybetween these methods can lead to false measurements that produce unreliable data. The essence of thisproject is to compare two models of tipping bucket rain gauges, using a Parsivel as an unbiased way ofcomparing their data. The difference between the two models is in the capacity of precipitation that they hold;one style holds 7mL before tipping and the other 8.5 mL. Six 7mL and nine 8.5 mL buckets were deployed atNCAR in Boulder,Colorado. Although the parsivel malfunctioned, our readings indicate that, compared to oneanother, we see a very strong correlation with an r2 value of 0.997. Additionally, both models recorded tipsat nearly identical times over a seven day period during July 2014, which indicates the instruments are precise.

37
SeniorLongmont High School
mentorsresearch Scott Landolt, NCAR
Justin Martyr
Investigating the relative accuracy of weather instrumentation through comparisons withcalibrated sensors at the NCAR Marshall Field Site
The relative accuracy of weather instruments and sensors is a common concern among meteorologistsbecause of the impact on weather forecasting. This study investigates the accuracy of a selection of activeweather instruments, which measure temperature, humidity, wind speed, and wind direction. The instru-ments chosen for the investigation have been deployed for one year at the National Center for AtmosphericResearch (NCAR) Marshall Field Site and have not been removed for recalibration to prevent interruptionsto infield measurements. A second set of instruments utilized in the infield comparison were first calibratedin a lab then set up on a weather tower at Marshall Field Site for comparison to the existing instruments.Weather conditions were observed by both sets of instruments for the period between July21 and July25,2014. These data were plotted to observe how well the data from the tower instruments correlated with datafrom the field instruments. The results reveal that the infield temperature/humidity sensor needs to berecalibrated as the calibrated sensor showed different measurements than the infield sensor. Wind speed andwind direction on the tower and in the field were very similar to one another indicating those sensors don’trequire calibration.
JuniorFairview High School
mentorsresearch Scott Landolt, NCAR
Ilya Fedorchuk
Comparing calibrated radar precipitation estimates based on measurements
from ground instruments
The Weather System to Deicing Decision Making (WSDDM) operated by the National Center for AtmosphericResearch (NCAR) receives data from the Front Range radar and surface precipitation gauges to derive anestimate of rainfall rates that are then applied to the entire radar scan. The purpose of this research is todetermine the accuracy of the rainfall estimations by examining estimated rainfall rates from WSDDM andcomparing them to four different surface precipitation gauge field sites in the Front Range area. There aretwo locations at Denver International Airport, one at Front Range Airport, and one at Greeley. The data setsanalyzed were from the September 9th through September 12th, 2013 flood event. This time period wasused due to the occurrence of heavy rainfall giving more data instances for the radar and precipitationgauges. The rates from the precipitation gauges show a weak positive correlation with the WSDDM system,indicating that the radar-derived estimates were not good for this particular case.
2014 PRECIP Abstracts PRE-College Internship Program at NCAR

38
JuniorColegio Colombo Británico
mentorsresearch Scott Landolt, NCAR
Luana M.ParedesSanchez
Comparing optical-based sensors with precipitation gauges for measuring snowfall
and rainfall intensity
New weather sensors with the ability to automatically identify present weather types have been introducedrecently, and scientists are beginning to use these weather sensors and precipitation monitors to comparedata and make weather forecasts. However, these devices have never been calibrated against standard pre-cipitation gauges to assess their accuracy. This research will analyze precipitation data that has been collectedover the past year by three different present weather sensors at the NCAR Marshall Field Site in Broomfield,CO: the Thies OP Laser Monitor, the Campbell PWS100, and the Vaisala PWD22. These three optical sensorsare capable of measuring precipitation rate and intensity. Data from these sensors were compared to datafrom a co-located GEONOR precipitation gauge at the Marshall site. The three laser sensors can differenti-ate between rain and snow, which allowed for data to be analyzed for both types of precipitation. Resultsindicate that data from the GEONOR precipitation gauge for rainfall intensity are most poorly correlatedwith the Vaisala PWD22 laser monitor data. The Thies OP Laser Monitor data was the most highly correlatedwith the precipitation gauge data. Snowfall intensity measurements from all three laser-based sensors cor-related poorly with the data from the GEONOR. This indicates that there is some success in these instrumentsmeasuring rainfall, but very little success in measuring snowfall. Therefore, anyone using these sensors shouldbe aware that there are significant discrepancies between the precipitation gauge and the optical sensors.
FreshmanUniversity of Puerto Rico at Mayagüez
mentorsresearch Leslie M. Hartten and Paul E. Johnston, CIRES/NOAA ESRL
Valerie M.RodríguezCastro
Calibrating the Manus Island wind profiler by comparing profiler and surface
rain measurements
Wind profilers are radars used to gather wind information using gradients of the index of refraction in theair. These radars are not usually calibrated because the relative reflectivity is sufficient to get the wind infor-mation. This creates a problem if these data are used in other types of research that require absolute values,such as studies of atmospheric turbulence. This study used relative reflectivity from the 915-MHz wind profilerlocated on Manus Island, Papua New Guinea, along with surface rain measurements to find the profilercalibration constant. A six-hour period of stratiform rain, identified by the presence of a bright band inreflectivity, was selected for analysis. The profiler reflectivity was converted to accumulated rain; a Z-R rela-tionship appropriate for stratiform rain was used to establish the relationship between the radar reflectivityand the rain rate. The profiler radar constant was changed iteratively, based on comparisons of the estimatedprofiler rain accumulation and the rain gauge amount, to obtain the calibration constant for the radar. Acalibration constant was identified for the wind profiler. It differs by a factor of 5.2 (7.16 dB) from thecalibration obtained in a parallel study by Esteban using satellite bright-band reflectivity. After the calibrationis verified, data from this profiler can be used in a wider range of applications.
2014 PRECIP Abstracts PRE-College Internship Program at NCAR

39
2014 PRECIP Abstracts PRE-College Internship Program at NCAR
SeniorEscuela Secundaria de la Universidad de Puerto Rico
mentorsresearch Daniel Adriaansen, NCAR
Ricardo J. RodríguezGarcía
Improving the current icing potential algorithm through improved reports of
METAR precipitation type
Icing is a phenomenon that can affect aircraft performance. It occurs when liquid water in subfreezing tem-peratures (Supercooled Liquid Water, SLW) quickly freezes upon contact with the aircraft’s surface and restrictsits maneuverability. In order to aid pilots in better detecting and avoiding areas of potential icing ahead of time,the National Center for Atmospheric Research’s (NCAR) Aviation Applications Program (AAP) developed theCurrent Icing Potential (CIP) algorithm. This algorithm utilizes infrared satellite data, aviation routine weatherreports (METARs) and other datasets to create a three dimensional product that diagnoses the icing probabilityduring flight. However, sometimes the CIP algorithm calculates a high icing probability in areas where snow, aless significant threat than freezing rain or other Supercooled Large Drop (SLD) precipitation types, was occurring.This has been traced to an error in the METARs, which sometimes incorrectly report snow as rain in subfreezingtemperatures. This research seeks to identify trends in the METARs to create a set of rules that will allow thealgorithm to differentiate between correct and incorrect reports. It is anticipated that there will be a correlationbetween the reported wind speed and/or wind gusts and incorrectly reported precipitation type due to anaccelerated hydrometeor fall speed under high wind conditions. The new rules will allow the CIP algorithm topredict icing hazards more accurately, thus allowing for more informed flight plans and efficient flying.
SeniorNiwot High School
mentorsresearch Rita Roberts, NCAR
Lauren Sharpe
Identifying surface and elevated nocturnal thunderstorms in the Southern Great Plains
Warm season thunderstorms and precipitation in the Southern Great Plains of the U.S. often occur after sunsetand tend to develop into mesoscale convective systems that track across large regions of the country.Wilson and Roberts (2006) found that approximately fifty percent of these nighttime storms are initiated bycold air outflows known as gust fronts that are produced from downdrafts and outflows of nearby thun-derstorms. The cause of the other nocturnal storms are not well understood, but are believed to be generatedby elevated forcing. This research is being done in preparation for the Plains Elevated Convection at Night(PECAN) field campaign that will be conducted in 2015 in the Southern Great Plains region. Data collectedfrom a network of radars in the same domain as the PECAN region during the two-week period of June 2through June12, 2014, were analyzed in order to identify where nighttime thunderstorms formed and moved.For the period of study, we identified the percentage of storm systems that originated in each state andthose that tracked into other states. In addition, the presence of initiators such as bores and gust fronts weredocumented to determine which storms were surface-based. The objective of this research is to documentthe percentage of storms that were elevated versus near the surface based; on the presence of bores andgust fronts. This information will assist in examining only the elevated storms to understand what caused themto form and if their locations have been predicted.

40
SeniorNiwot High School
mentorsresearch Jenny Sun, NCAR
Rachel Sharpe
A study of predictors of convective initiation across Colorado’s Front Range
Predicting a storm is not straightforward as there are many factors in the environment that affect and con-tribute to its production. When using weather radar and software, it is crucial that forecasters understandwhich indicators best correlate with storms. To better understand these predictors, the pre-storm environmentwas studied along the Colorado Front Range area from June 23rd to July 23rd, 2014. Data from the VariationalDoppler Radar Analysis System (VDRAS) were collected between 2:00 and 7:00 pm on those days when radarreflectivity reached 30dBZ or above, indicating a storm. The VDRAS data were viewed by the software CIDD(Configurable Interactive Data Display) which allowed us to find the storms and record maximum values ofrelative humidity, CAPE (convective available potential energy), CIN (Convective Inhibition), wind conver-gence, wind shear, and vertical wind velocity in and surrounding the storm (within a square box of 50kmapproximately). These data were then used to determine which parameters best indicated a storm. Statisticallysignificant correlations were found between reflectivity and relative humidity, CIN, wind convergence andvertical wind velocity, but no significant correlation with CAPE or wind shear. One reason for the lack ofcorrelation with CAPE or wind shear may be that these two parameters represent the larger scale environ-ment and thus the 50km box is too small to find statistically meaningful correlations. These results will givescientists and forecasters an improved sense of which variables to focus their attention on in order to makethe most accurate predictions.
JuniorFairview High School
mentorsresearch Scott Landolt, NCAR
Lucas Szewczyk
Improving the snowfall distribution pattern inside the NCAR snow machine
Aircraft deicing is critical for winter airport operations and currently there is no reliable way of testing deicingfluids year-round to establish failure times. One approach is to create an indoor artificial snow making systemthat accurately simulates winter conditions. The Research Applications Laboratory’s (RAL) Aviation ApplicationsProgram (AAP) has been developing such a system. Many challenges exist related to artificial snowmaking,including creating a consistent distribution pattern of snow over test areas. As part of an effort to improvethe indoor simulations, testing has been done on several prototype snow distribution devices. The current pro-totype utilizes a rectangular acrylic funnel with a hydrophobic coating to help prevent snow buildup to bettercontrol the distribution of the snow. Preliminary tests showed that the acrylic shroud was not sufficient byitself; therefore, fans were added to the top of the acrylic funnel to agitate the air within the system to betterdistribute the snow. Subsequent tests utilizing the fans have shown promising results. While smaller fansproved insufficient, larger fans were able to make a more adequate distribution of the snow. Accuratelysimulating winter conditions and allowing year-round testing of deicing fluid failure times will prove invalu-able in validating the effectiveness of new deicing fluids and will improve aircraft safety in winter conditions.
2014 PRECIP Abstracts PRE-College Internship Program at NCAR

Key to Mentors’ Affiliations
BHSU Black Hills State UniversityCIRES Cooperative Institute for Research in Environmental SciencesCSU Colorado State UniversityCU University of Colorado at BoulderESRL Earth System Research LaboratoryFDLRM Fond du Lac Band of Lake Superior Chippewa Resource
Management Division ISU Iowa State UniversityNCAR National Center for Atmospheric ResearchNCED National Center for Earth-surface Dynamics
NEON National Ecological Observatory NetworkNOAA National Oceanic and Atmospheric AdministrationSOARS Significant Opportunities in Atmospheric Research and SciencesSTAR STEM Teachers and ResearchersUCAR University Corporation for Atmospheric ResearchUCP UCAR Community ProgramsU of A University of ArizonaU of M University of MinnesotaUH University of HawaiiWHOI Woods Hole Oceanographic Institution
FreshmanUniversidad Metropolitana
mentorsresearch Scott Landolt, NCAR
Andrea Vázquez
Comparison of automated and human accuracy at data collection:
When does freezing drizzle really occur?
Freezing drizzle is a known hazard for aircraft, which can lead to significant engine damage if not properlydetected. Currently, contract weather observers identify freezing drizzle using only visual observations and itis unclear how accurate they are when collecting that data. The Automated Surface Observing Systems(ASOS) have B. F. Goodrich Ice Detectors that identify freezing rain, but NCAR scientists have developed analgorithm to identify freezing drizzle using the same sensor. This investigation evaluates data that wascollected visually and compares it to the data that was detected by automated sensors, in order to assessthe accuracy of the manual measurements. The data chosen was from the years 2000 to 2009 for the Denver(CO), Des Moines (IA), Akron (OH) and Juneau (AK) ASOS locations using the Goodrich Ice Detectors. Themedian annual hours of freezing drizzle were calculated for each site and the results were compared againstthe results found in Cortinas et al., 2004. Cortinas et al. (2004) also plotted occurrences of freezing drizzleas a function of time of day. This study duplicated that technique, which required converting local time of theobservation to Normalized Solar Time (NST). The results show that the automated measurements identifiedmany more hours of freezing drizzle at each station than what the manual observations showed. In addition,the peak occurrence of freezing drizzle during the day was similar between the manual and the automatedmeasurements.
41

NEON Intern Madeleine Ball is measuring tarp reflectance for use in airborne spectrometer calibration.

NEON Undergraduate Internship Program
National Science FoundationThe STEM Teacher and Researcher Program (STAR)
SOARS
National Science Foundation, Directorate for Geosciences, Atmospheric Sciences
National Oceanographic and Atmospheric Administration
National Center for Atmospheric Research
Center for Multi-scale Modeling of Atmospheric Processes at Colorado State University
University of Colorado at Boulder
University Corporation for Atmospheric Research
Woods Hole Oceanographic Institute
Iowa State University
National Center for Earth-surfce Dynamics
PRECIP
National Center for Atmospheric Research
National Science Foundation
Sistema Universitario Ana G. Méndez
University Corporation for Atmospheric Research
STAFF
NEON: Liz Goehring, Kellie Bush
SOARS: Laura Allen, Rebecca Batchelor, Rebecca Haacker-Santos
PRECIP: Scott Landolt, Valerie Sloan, Laura Allen
Authors: NEON, SOARS and PRECIP students and staff
Editors: NEON, SOARS and PRECIP mentors and staff
Photography: UCAR, NCAR, NEON, and Abraham Karam
Design: Eugene Malowany, Malowany Associates
Printing: B&B Printers
The material is based upon work supported by the National ScienceFoundation under Grants No. ATM-0618847(SOARS), and Grant No. EF-1029808 (NEON). On the cover: The cover photo was taken off the Pacific Coast of Mexico
during the North American Monsoon Experiment by NCAR scientists whichstudies the large-scale dynamics of the atmosphere and oceans.
2 0 1 4 S P O N S O R S A N D A C K N O W L E D G E M E N T S
Opinions, findings, conclusions, and recommendations expressed in thispublication do not necessarily reflect the views of any SOARS, NEON, orPRECIP sponsors or managing organizations. UCAR and NEON are EqualOpportunity/Affirmative Action employers.
SOARS is part of the UCAR Center for Science Education and a registeredtrademark of the University Corporation for Atmospheric Research.
Earth, Wind, Sea, and Sky is a joint publication of UCAR and NEON.
This publication has been printed on recycled-content paper by an environmentally-friendly printer.
43
PRECIP


Significant Opportunities in Atmospheric Research and Science
University Corporation for AtmosphericResearch (UCAR)
www.soars.ucar.edu
Undergraduate Internship Program
National Ecological Observatory Network(NEON)
www.neoninc.org/learn-experience/internships
Pre-College Internship Program
National Center for Atmospheric Research(NCAR)
R E S E A R C H M E N TOR I N G C OMMUN I T Y