research journal of commerce & behavioural science - rjcbs
TRANSCRIPT


Volume:01, Number:03, Jan-2012 : RJCBS Page 1 www.theinternationaljournal.org
Table of Contents
Articles E-S-QUAL: MEASURING QUALITY OF E-TAILING SERVICES IN RURAL MARKET
Kannan Paul, SARAVANAN R
EI at Work Place
MONICA M, Dr. Vijayashree LAKSHMAN
Professor’s choice: Factors effecting pre purchase behavior of Private Health Insurance, an empirical analysis
Soumik Gangopadhyay
INVESTOR ATTITUDE ON RISK AND INVESTMENT GOALS AMONG EXPATRIATE - INDIANS IN OMAN
MOHAMMED RAFIQ
Technical Analysis of Selected Indian Banks
N R Benjamin Franklin
PRE AND POST ACQUISITION PERFORMANCE OF PUBLIC AND PRIVATE SECTOR BANKS IN INDIA
shanmugam venkatesan, krishnan reddiyar Govindarajan
Book Review Book Review 99 Thoughts on Ganesha
Mrs Deepali Nilesh Pulekar
Volume:01, Number:03, Jan-2012 : RJCBS Page 1 www.theinternationaljournal.org
E-S-QUAL: MEASURING QUALITY OF E-TAILING SERVICES
IN RURAL MARKET
Dr. R.Saravanan,
Director, School of Management,
V.L.B.Janakiammal College of Engineering & Technology,
Kovaipudur, Coimbatore- 641 042,
P.Kannan, Asst.,
Prof., & HOD, Department of Management Studies,
N.P.R. College of Engineering & Technology,
Natham and Research Scholar,
Anna University of Technology Coimbatore,
Coimbatore.
Abstract
The present study focuses the behavior and activities of the rural people in using e-tailing. In
the research work (Parasuraman et al., 2005), E-S-QUAL 11 dimension measuring tools was
used to measure the perception and expectation of the rural people in Dharmapuri district at
the sample size of 310. This study also analyses the preference and behavior of the rural
people in their internet usage. The result of this study suggests that the E-tailing services
providers will have to improve their services in the area of design and order confirmation and
also field and age of the customer determine their behavior of spending time and choice of
websites in their internet usage.
Key words: E-S-QUAL, Perception, Expectation, Rural, Preference

Volume:01, Number:03, Jan-2012 : RJCBS Page 2 www.theinternationaljournal.org
1. Introduction:
E-tailing is the largest marketing activity in the rapidly growing field of electronic commerce
and, logically, perceived service quality would seem to be the key success factor that lifts this
new form of retailing above traditional retailing because the products the two types of
retailers sell are the same. However, e-retailing service quality must be validly measured if its
actual role is to be demonstrated empirically. Moreover, a valid measure of service quality at
each stage of e-retailing is required if e-retailers seek to improve their service quality.
1.1 E-tailing:
E-tailing is ―retailing conducted online, over the internet‖ (Turban et al. 2006, p. 83); it is
also called B2C e- commerce which refers to retail transactions of products or services from
businesses to individual customers. In this study e-tailing and B2C e-commerce are viewed as
equivalent, and these two terms are used interchangeably. Even though the most common use
of e-tailing is the sale of products or services online, but online retailing businesses do not
only undertake simple sales, they also include other applications, as do physical retailing
outlets. Some of those applications include:
1. Selling goods and testing new products: Many giant retailers use the internet as a tool to
test new products and services. This strategy is useful to reduce risks in the early stages of
new product marketing and sales (Mullaney 2004).
2. Market research: Retailers can use their online presence to gain valuable customer
information for predication of future customer demand. In the offline environment, such data
are difficult and expensive to collect and analyse (Rao 1999). Online market research has
some powerful advantages, such as monitoring real-time buying decision with more accurate
and reliable data (Baker 2005).
3. Promotional tool: Following on from market research, valuable customer data can be
used to conduct pricing and promotional experiments. A website can be used as a tool to
conduct promotional experiments, due to the wide reach of the internet and its cost-
effectiveness (Rao 1999).
4. Marketing tool: A website can also be an effective channel to communicate with
customers (Peterson et al. 1997). The internet has made businesses dream of interactivity,
personalization, customization and 24/7 availability a reality.
5. Online customer service: Many new services (i.e., delivery status information and
personalised products) can be available uninterrupted online, which is almost impossible or
too expensive to have in the physical world.
2. E-TAILING SUCCESS FACTORS
E-commerce system can be measured in four dimensions: system quality, content quality,
trust and support & services (Molla & Licker 2001). Findings from researchers such as
Chiger (1997), Nielsen (1998) and Lohse and Spiller (1998) point out that poor e-commerce
system quality of websites will have a negative influence on the customers‘ online shopping
experience and their satisfaction with the sites. Due to the nature of the virtual environment,
customers cannot physically touch the products before purchasing from websites. The
website is the only channel to understand a product. As a result the content on the site should
be functional and attractive. Some researchers (i.e., Von Dran et al. 1999; Zhang et al. 2000)
argue that content quality may be more important than system quality. In content quality as
well as in system quality, research findings have suggested that trust (including attributes of
security, privacy, and product quality) has an important effect on the use of e-commerce and
user satisfaction, due to the high uncertainty of the online environment (Gefen et al. 2003;
Urban et al. 2000). Another important factor of website quality is support & services

Volume:01, Number:03, Jan-2012 : RJCBS Page 3 www.theinternationaljournal.org
(including FAQs section on the website, online customer services facilities, search function
within the site, online feedback & review facilities, online payment and delivery services,
online customization tools, escrow & insurance services, etc) provided by a website. Service
quality is increasingly recognised as an important aspect of e-commerce (Santos 2003). Past
studies (i.e., Aberg & Shahmehri 2000; Chen et al. 2004; Genfen & Devin 2001; Madeja &
Schoder 2003; Page & Lepkowska-White 2002; Parasuraman et al. 1988; Santos 2003) have
suggested that service quality is positively related to the success of e-commerce. In the
meantime, many previous research (e.g. Barnes et al. 2004; Gibbs 2002; Leonard et al. 2003;
Sabherwal et al. 2004; Gibbs et al. 2002; Molla 2004) also has investigated the factors
affecting the adoption of e-commerce from different perspectives, including senior
management factor, organisational factor, e-commerce strategy, consumer factor, and
external factor.
According to the discussion above, a theoretical framework (see Figure-1) was developed
from the literature review, and served as theoretical foundation of the following empirical
case study research. Six factors are included in the framework, namely, (1) organizational
factor; (2) senior management factor; (3) e-commerce strategies; (4) external factor; (5)
consumer factor; and (6) e-commerce system measurement.
3. Review of Literature:
J. J. Cronin, et al., (2000) their study shows that online service quality may impact e-tail
success through online customer satisfaction and loyalty. Although the SERVQUAL is a
valuable analytical tool for IS managers, the SERVQUAL metrics needs continued
development and validation.
Tobias gunnesson and Klas sodelund (2001) study tries to go beyond how an e – retailer can
create competitive advantages with regards to existing retailers of how they can improve its
competitive positioning through e-retail. Quality management systems are needed to provide
a consistent way to select, evaluate, prioritize and plan the right e-services. The increasing
use of e-services has raised the need to define standards and means to assess and assure
quality. Investment in e-services is an important step to improve the quality of life in our
dynamic society.
Childers et al. (2001), Erogolu et al. (2003), Mummalaneni (2005) study within the e-retail
literature support the notion that flow-like experiences occurring during e-service encounters
are primarily driven by Web-based characteristics (such as the presence of multimedia, Web
atmospherics, interactivity, product-related information content) and when the consumer has
a high degree of perceived control during the process of Website navigation.
Rossiter‘s (2002) C-OAR-SE construct measurement theory is then applied to develop a new
and more valid measure, called ER-SERVCOMPSQUAL. This new measure seeks potential
customers‘ and current customers‘ judgments about the quality of the components of e-retail
service (thus ensuring high item-content validity), which are rated in terms of behavioral
answer categories (which have high answer-scale validity).
Srini S. Srinivasana et al., (2002) investigated the antecedents and consequences of customer
loyalty in an online business-to-consumer (B2C) context. They identified eight factors (the
8Cs—customization, contact interactivity, care, community, convenience, cultivation, choice,
and character) that potentially affect e-loyalty and developed scales to measure these factors.

Volume:01, Number:03, Jan-2012 : RJCBS Page 4 www.theinternationaljournal.org
R. E. Anderson and S. S. Srinivasan, (2003), H. E. Yang and K. H. Yeh, (2006), in their
research work pin point that the measure of perceived quality, satisfaction, and loyalty on
behalf of customers have been used to assess firm‘s productivity and its marketing
performance in the service industry.
Specifically, when the items were used to assess the IS success, the wordings and the validity
assessment of the SERVQUAL scales are required (Y. S. Wang and T. I. Tang , 2003). Based
on D&M IS Success Model, the authors of reference (W. Rodgers, S. Negash, and K. Suk,
2005) proposed a general model of online satisfaction including three dimensions of e-quality
– system quality, information quality, and service quality. System quality describes measures
of the information processing system, such as ease of access to and interaction with the
system. Information quality represents measures of information system output, such as
informativeness and entertainment of the information provided by the online service.
Vargo and Lusch‘s (2004) argued against this distinction. It is a distinction that necessitates
some differences in the measurement items. ER-SERVCOMPSQUAL has separate sections
to accommodate this distinction and, also, the questionnaire is easily adapted to fit different
categories of e-retailers within products and services.
Parasuraman et al.‘s (2005) E-S-QUAL (and E-RecS-QUAL) multiple-item scale, is shown
to be based on an inadequate conceptual definition. Their definition of the E-RETAILING
object of the construct identifies only two stages of e-retailing whereas the definition for the
new measure, ER-SERVCOMPSQUAL, identifies six stages in the overall e-retailing
process. Nor does E-S QUAL distinguish e-retailers who sell products from those who sell
services.
H. E. Yang and K. H. Yeh, (2004) studied that consumer satisfaction has been the subject of
much attention in the literature because of its potential influence on consumer behavioral
intention and customer retention.
Orit and Ilan (2005), in their study found a conceptual model of the decisions households
make with regard to information gathering, purchase transactions and delivery mode. Data on
revealed behavior and various socio-demographic and economic characteristics of shoppers
was collected in the Tel-Aviv Metropolitan area in the summer of 2004. Their study focused
on the consumers‘ purchase and delivery (PD) choices, as part of a broader effort to
understand consumers‘ shopping behavior.
The present article begins by criticizing the content validity of E-S-QUAL (Parasuraman,
Zeithaml, and Malhotra 2005), the principal academic measure of e-retailer service quality,
which is probably the most important construct in contemporary services research.
Joel E. Collier et al., (2006) in their article extended the work on e-service quality to
encompass not only Web site interactivity or process quality but also outcome quality and
recovery quality. A conceptual framework of e-service quality is proposed and empirically
tested that combines process, outcome, and recovery dimensions. Contrary to previous
service quality studies, formative instead of reflective indicators are used to conceptualize e-
service quality. Their study found empirical support for the use of formative indicators and
the three-dimensional approach to conceptualizing e-service quality.

Volume:01, Number:03, Jan-2012 : RJCBS Page 5 www.theinternationaljournal.org
Liao.C, et al., (2006) evaluated using structural equation modeling. Results show that
consumers‘ behavioral intentions to continue using a B2C web site are determined by all
three key drivers: perceived usefulness, trust, and habit. Furthermore, not all dimensions of
web quality have a significant effect on perceived usefulness and trust.
Hao-erl Yang,s (2007), study stated that e-quality metric needs continued development and
validation when measuring customer‘s satisfaction and loyalty in e-shopping environment.
Adding the newly developed service quality scales E-S-Qual to the D&M IS Success Model
to assess a website loyalty model.
Jamie Carlson, Aron O‘Cass (2009), study examined that impact of e-service quality
attributes on the development of flow, and further investigates the impact flow has on
consumers‘ Website loyalty and word-of-mouth behavior. Most companies try their best to
continually satisfy their customers because customer satisfaction seems to be an important
barometer of customer‘s behavioral intentions and has been regarded as an important
antecedent of loyalty.
Eduard Cristóbal Fransi and Frederic Marimon Viadiu, paper analyzed various elements that
influence the purchasing behaviour of online consumers. These elements include the aesthetic
aspects of a website and the interactive processes that take place at the time of purchase. The
study analyses the expectations and perceptions of a sample of Spanish online customers. On
the basis of these attitudes, the sample of respondents is segmented. In addition, the main
factors that determine online service satisfaction are identified. The analysis thus allows
differentiation of both customers and service quality. The paper concludes with
recommendations for online retailers who wish to operate a successful ‗virtual‘ retail outlet.
Noor et al., (2007), study explored the internet service quality in service industry
particularly in e-ticketing for transportation services. The primary data for this study was
collected through web observation. Result shows that appearance and linkages are among
the two most important determinants that should be used when measuring the quality of
internet services. Through the findings, a guideline of the transportation websites regarding
the important features could be developed. The findings show that e-ticketing websites would
be an advantage to have all these features in order to increase user satisfaction in
doing online transactions.
Nittana Sukasame focused on the e-service quality dimensions in successfully
establishing e-commerce ventures. Consequently, success is measured in terms of growth
rate. The following factors selected from previous studies on e-service quality linked
to successful e-commerce entrepreneurs are proposed: content, accessibility, ease of
use, reliability, responsiveness, and security. Additionally, the factor linked specifically
to e-service domain enhancing automatic tasks such as self-service technology is
examined. His study could generate different views on the e-service quality paradigms
associating with the competitive success of the e-commerce entrepreneurs.
Juan‘s study reviewed the quality of customer service (E-S-QUAL) model and the quality of
service recovery (E-RecS-QUAL) model and applied them to the African American and
Chinese cultural settings.

Volume:01, Number:03, Jan-2012 : RJCBS Page 6 www.theinternationaljournal.org
Objectives of the study:
The primary objective of the study is to measure the quality of e-tailing services among rural
people in Dharmapuri district. The secondary objectives are
To compare the rural people perception and expectation of e-tailing in Dharmapuri
district.
To analyze the demographic profile of the rural people.
To measure the behavior of the internet user in rural people.
Hypothesis Testing
Ho: There is no significance relation between age group of the respondents and On average
number of internet visits per week
Ho: There is no significance relation between age group of the respondents and On average
Minutes of web site visit
Ho: There is no significance relation between age group of the respondents and On average
Minutes spend with specific web site
4. Research Methodology:
Descriptive research design was used with 310 respondents. Finally, the researcher filtered
and selected 300 valid responses out of 310. The primary data and secondary data are
collected. Primary data is collected from E-S-QUAL, a 50 item scale used to collect the
primary data. The secondary data are collected from the articles, newspaper, books and
internet. Five point scales was used in measuring the perception of rural customers. The
percentage method and Weighted mean values of E-S-QUAL Score are used to measure the
quality of e-tailing. SPSS package was also used to measure the mean value and cross
tabulation of Service quality of e-tailing. The scope of the study is to know the perception
and expectation of rural people. Another one is to measure the quality of e tailing services in
among rural people.
5. Result and Discussion
Figure 5.1shows that 23.3% of the respondents are from the age group of 35 and above and
15% of the respondents come under 31 to 35 age frame. Figure 5.2 shows that 18% of the
respondents are from Medical field and 11% of the respondents from Management field.
Fig. 5.3 Different website Visiting habits of the Respondents
< 21 20%
21-25 20%
26-30 22%
31-35 15%
35 < 23%
Fig. 5.1 Age wise Calssifcation
Engineering
15%
Medical 18%
Marketing
17%
Management 11%
Social science
15%
Accounting
12%
Law & others
12%
Fig. 5.2 Field of the Respondents

Volume:01, Number:03, Jan-2012 : RJCBS Page 7 www.theinternationaljournal.org
19%
17%
20%
23%
21%
Book Store
20%
21%
19%
20%
20%
Movie Store
22%
20%
16%
21%
21%
Music Store
23%
24%
15%
17%
21%
Second Hand Products
18%
20%
22%
23%
17%
Search Engines
19%
19%
21%
20%
21%
E shop
Never day once a year once a month once a week once a or more

Volume:01, Number:03, Jan-2012 : RJCBS Page 8 www.theinternationaljournal.org
Figure 5.3 shows that 22.3% of the respondents visit book store once in a week, 23.7% of
rural people Never visit Music store in a day, 23% of the respondents never visit second hand
products sale website due to the reason that they have habit of buying second hand products
personally. 22 % of the respondents are using search engines for their multiple purposes once
a month and 20% of the respondents are have the habit of visiting e shopping website once a
week
The above figure 5.4 indicates that 23.7% of the respondents spent 31 to 40 minutes in a
week and 17% of the respondents spent below 10 minutes and 21 to 30 minutes in a week.
Figure 5.5 indicates that 21.3% of the respondents stay below 10 minutes in a website and
20% of the respondents stay for 31 to 40 minutes in a website. These habits show that people
have interest to visit website and stay in very minimum time. Since they are using internet
and visiting some website they had compulsion to go to a browsing centre. The browsing
centre‘s are normally charging Rs. 15/- to Rs.30/- Per hour.
TABLE 5.1 Correlation Values of Perception and Expectation of Rural people
Dharamapuri District
Sl.No SERVQUAL Dimension Correlation value
1 Clarity of purpose -0.99
2 Design 0.14
3 Communication -0.80
4 Assurance 0.19
5 Service and Frequently Asked Questions 0.54
6 Accessibility and speed 0.91
7 Product or service choice 0.86
8 Order confirmation -0.36
9 User recognition -0.65
10 Extra service 0.24
11 Frequent buyer incentives 1.00
The above table clearly explains the correlation of perception and expectation of rural people
in Dharmapuri District an e-tailing services. Clarity of purpose, communication, order
Confirmation, and user recognition got negative correlation. The service providers
concentrate on these dimensions. The rural people have different opinion on the e tailing
Below 10
17%
11 to 20 20%
21 to 30 17%
31 to 40 23%
41 above 23%
Fig. 5.4 Time Spend on a Website
Below
10 21%
11 to 20 21%
21 to 30 20%
31 to 40 20%
41 above 18%
Fig.5.5 Time do they Stay in a WebSite

Volume:01, Number:03, Jan-2012 : RJCBS Page 9 www.theinternationaljournal.org
services in the area of purpose and communication. Some of the website and e tail service
provider are using wage English. It creates some misunderstanding and confusion. At the
same time they had confusion on order confirmation. They ask too much of details to
confirm the order. The rural people don‘t like it. The service providers can reduce some
details in the order confirmation form. The same problem happens in user recognition.
Above figure 5.6 indicates that rural people from Dharamapuri District have variation in their
perception and expectation. They had some amount of mismatch between their perception
and expectation of Clarity of purpose, Communication, Order confirmation and User
recognition. The reason these dimensions got negative correlation.
Table No. 5.2 Correlation Analysis Field of the respondents and visiting different
website
S.No Particulars Spearman Correlation
R
Value
Asymp.
Std.
Errora
Approx.
Tb
Approx.
Sig
1 Correlation between respondents Field and
habits of visiting Book store Website
.050 .058 .857 .392c
2 Correlation between respondents Field and
habits of visiting Music store Website -.064 .056 -1.102 .271
c
3 Correlation between respondents Field and
habits of visiting Search engine store Website
.073 .059 1.266 .206c
4 Correlation between respondents Field and
habits of visiting Second hand products sale
Website
.096 .058 1.662 .098c
5 Correlation between respondents Field and
habits of visiting Movies store Website
.062 .057 1.074 .284c
6 Correlation between respondents Field and
habits of visiting E shop Website
.053 .059 .911 .363c
Table 5.2 clearly shows the relation between field of the respondents and visiting habits of
different website like Book store, Music store, search engine, second hand products, movies
store and e shop. All the category of website got positive correlation Out of music store. The
reason is that hearing and downloading music never considers the field. Everyone have
habits of hearing music and interest to download new songs.
D1 D2 D3 D4 D5 D6 D7 D8 D9 D10 D11
Dharmapuri -0.99 0.14 -0.80 0.19 0.54 0.91 0.86 -0.36 -0.65 0.24 1.00
-1.50
-1.00
-0.50
0.00
0.50
1.00
1.50
Val
ue
Fig. 5.6 Correlation Value Analysis

Volume:01, Number:03, Jan-2012 : RJCBS Page 10 www.theinternationaljournal.org
Table No. 5.3 Hypothesis testing
S.No Hypothesis Testing Pearson
Chi-
Square
value
Asymp.
Sig.
(2-sided)
Results
1 There is no significance relation between age
group of the respondents and On average number
of internet visits per week
13.974 .601 Rejected
2 There is no significance relation between age
group of the respondents and On average Minutes
of web site visit
16.441 .423 Rejected
3 There is no significance relation between age
group of the respondents and On average Minutes
spend with specific web site
10.294 .851 Rejected
Table 5.3 describes that there is a significance relation between age group of the respondents
and an average number of internet visits per week, an average minutes of website visit and
time spent with specific website. Because age is the main force to determine the duration to
spend with particular website and frequency of using internet. Based on the age level the
categories of website also vary.
Table 5.4 E-S-QUAL dimension Descriptive Value (Mean and Standard Deviation):
S.no Particulars Perception Expectation P-E
GAP Clarity of purpose Mean S.
D
Mean S.D
1 The purpose is clear 3.05 1.44 2.95 1.43 0.1
2 Finding your way on the web site is easy. 2.97 1.36 3.02 1.40 -
0.05*
3 Instructions are directly available 3.02 1.46 2.97 1.45 0.05
Design
4 The number and type of links are meaningful 3.02 1.45 3.02 1.44 0
5 Navigation is consistent and standardized 3.05 1.40 3.06 1.36 -
0.01*
6 A standard navigation bar, a home button and
back/forward button are available on every page
3.04 1.41 3.05 1.37 -
0.01*
7 Opening of new screen is kept to a minimum 2.94 1.48 3.06 1.46 -
0.12*
8 It is easy to print from the web 3.02 1.37 2.99 1.42 0.03
9 Information is found with a minimum of click 3.18 1.40 3.07 1.42 0.11
10 There are well programmed search options 3.04 1.44 2.89 1.42 0.15
11 Forms to enter personal details are self-
explanatory
3.02 1.43 2.99 1.36 0.03
Communication
12 Scrolling through pages and text is kept to a
minimum
2.98 1.40 3.11 1.34 -
0.13*
13 Colors, pictures and images are consistent,
relevant and clear
3.03 1.35 2.89 1.42 0.14
14 Web sites animations are meaningful 2.86 1.40 3.13 1.43 -
0.27*

Volume:01, Number:03, Jan-2012 : RJCBS Page 11 www.theinternationaljournal.org
Assurance
15 The security policy is accessible 2.99 1.36 2.81 1.42 0.18
16 The privacy policy is accessible 2.95 1.40 2.99 1.43 -
0.04*
17 The web sites contains company details 2.92 1.42 2.98 1.41 -
0.06*
18 External validation of trustworthiness is
important
3.24 1.43 3.00 1.43 0.24
19 Brand images is important 2.93 1.44 2.94 1.45 -
0.01*
Service and Frequently Asked Questions
20 An email address for queries and complaints is
provided
3.13 1.44 3.07 1.46 0.06
21 Queries or complaints are resolved within 24
hours
2.96 1.43 2.88 1.44 0.08
22 User feedback is sought to measure customer
satisfaction
3.11 1.37 3.06 1.39 0.05
23 Information is provided to Frequently Asked
Questions and answers
3.04 1.39 3.02 1.39 0.02
24 The Frequently Asked Questions and answers
contain links that take the user to the relevant
page
3.10 1.46 2.86 1.41 0.24
Accessibility and speed
25 24*7*365 user accessibility 3.02 1.44 3.03 1.46 -
0.01*
26 Page availability information is given on entry 3.23 1.43 3.15 1.38 0.08
27 Access is fast 2.96 1.42 2.94 1.47 0.02
28 Graphics and animations do not detract from use 2.95 1.47 2.84 1.44 0.11
Product or service choice
29 Full product or service characteristics are
available
3.18 1.45 3.04 1.41 0.14
30 Full detail of product or service pricing are
available
2.98 1.42 3.04 1.44 -
0.06*
31 Required stock information is available
throughout the buyingprocess
2.84 1.37 2.97 1.39 -
0.13*
Order confirmation
32 Tax and/or other charges are clearly detailed 3.00 1.38 2.99 1.38 0.01
33 Terms and conditions of sales are accessible 3.05 1.42 3.04 1.42 0.01
34 Access to anticipated delivery times is available
at all times Product purchase
2.92 1.39 3.08 1.36 -
0.16*
35 The user can make a purchase without web site
registration
3.06 1.43 2.94 1.38 0.12
36 Different payment options are stated clearly 3.02 1.38 2.95 1.42 0.07
36 A complete overview of the order is presented
before final purchase decision
3.00 1.41 3.04 1.53 -
0.04*
38 All relevant order confirmation details are sent by
email within 24 hours
3.01 1.45 2.95 1.34 0.06
39 Order tracking details are available until delivery 3.00 1.40 3.04 1.43 -

Volume:01, Number:03, Jan-2012 : RJCBS Page 12 www.theinternationaljournal.org
0.04*
40 Order cancellation and return details are confirm
within three days
2.83 1.40 3.01 1.41 -
0.18*
User recognition
41 The registration process is simple 3.00 1.43 3.05 1.40 -
0.05*
42 Registration process details are retained 3.03 1.45 3.15 1.44 -
0.12*
43 The home page features options for new and
registered users
3.07 1.47 2.90 1.43 0.17
Extra service
44 A customer platform is provided for exchange of
ideas
2.94 1.44 2.84 1.41 0.1
45 Links are provided to pages on related products
and services
3.04 1.38 3.01 1.47 0.03
46 Search on related sites are provided (e.g. a
hotel/flight search on travel sites)
3.02 1.38 2.99 1.40 0.03
47 The user can customized the web sites and the
information is retained
2.82 1.37 3.01 1.45 -
0.19*
48 Web sites that focus on brand awareness have a
store locator
3.01 1.40 3.14 1.40 -
0.13*
Frequent buyer incentives
49 The user is invited into a frequent buyer program 2.93 1.41 3.25 1.38 -
0.32*
50 The web site offers free shipping and handling
within a set of rules
2.86 1.39 3.08 1.45 -
0.22*
N-300 Min-1 Max-5
*Negative Gap Score
The above table shows the mean variances between rural people perception and exception.
Assurance, design, Product or service choice and order confirmation got more negative score.
The e tailing service providers should concentrate on these dimensions to provide better
service in future.
6. Conclusion:
E-tailing is a fast growing service in recent days. Rural people have more knowledge about
internet and they spend more or less equal time like urban people. In present days the rural
literate rate is increasing gradually. So, they have more knowledge about the e-commerce and
e-tailing. Today, farmers know new variety of seed and fertilizer from internet. The
Government provides more facility to learn updates in agriculture related information. Rural
people‘s expectations have increased not only in the e-tailing but also in all services. The
main problem of the rural people of Dharmapuri Dt., is using internet and visiting some
website they had compulsion to go browsing centre. The browsing centres are normally
charging Rs. 30 to 50 on hour// looks contradictory to your previous statement. Field and age
is a factor to determine the choices of spending time to related website expect music stores.
The e tailing service providers need to care about order confirmation and design area.

Volume:01, Number:03, Jan-2012 : RJCBS Page 13 www.theinternationaljournal.org
Reference:
1. Bell, R., Davis, R., Howard, E., 1997. The changing structure of food retailing in Europe:
the implications for strategy. Long Range Planning 30 (6), 853–861.
2. Chiang, K.P., Dholakia, R.R., 2003. Factors driving consumer intention to shop online: an
empirical investigation. Journal of Consumer Psychology 13 (1–2), 177–183.
3. Childers, T.L., Carr, C., Peck, J. and Carson, S. (2001). Hedonic and Utilitarian
Motivations for Online Retail Shopping Behavior. Journal of Retailing. 77 (Winter), 511-
535.
4. D. Weathers and I. Makienko, ―Assessing the relationships between e-tail success and
product and web site factors,‖ Journal of interactive marketing, vol.20, no. 2, pp. 41-54,
2006.
5. Eduard Cristóbal Fransi and Frederic Marimon Viadiu, E-retailing Management:
Analysing the Spanish E-Consumers Behaviour, IADIS International Journal on
WWW/Internet, Vol. 5, No. 1, pp. 98-112 , ISSN: 1645 – 7641
6. Eroglu, S.A., Machleit, K. and. Davis L. (2003). Empirical Testing of a Model of
Online Store Atmospherics and Shopper Responses. Psychology & Marketing 20 (2),
139-150.
7. H. E. Yang and K. H. Yeh, ―The role of service quality and mediating factors in a
customer behavioral intentions model,‖ Int. J. Services Operations and Informatics, vol.
1, no. 1/2, pp. 38-53, 2006.
8. Hao-erl Yang, (2007), Assessing the effects of e-quality and e-satisfaction on website
loyalty, international Journal of mathematics and computers simulation, issue 3, volume
1, 2007, 288 - 294.
9. J. J. Cronin, Jr., Brady, M. K., and Hult, G. T., ―Assessing the effects of quality, value,
and customer satisfaction on consumer Behavioral intentions in service environments,‖
Journal of Retailing, vol.76, pp.193-218, 2000.
10. J. J. Jiang, G. Klein, and C. L. Carr, ―Measuring information systems service quality:
SERVQUAL from the other side,‖ MIS Quarterly, vol.26, no.2, pp. 145-166, 2002.
11. J.E. Collier and C.C. Bienstock (2006), Measuring service quality in e-retailing, Journal
of Service Research, vol. 8, no. 3, pp. 260-275, 2006.
12. Jamie Carlson, Aron O‘Cass, (2009), Creating Compelling e-Service Encounters:
Examining e-Service Attributes and Flow, ANZMAC 2009
13. Joel E. Collier , Carol C. Bienstock (2006), Measuring Service Quality in E-Retailing,
Journal of Service Research, 2006; 8; 260 DOI: 10.1177/1094670505278867.
14. Juan (Gloria, Measurement Equivalency of Web Service Quality Instruments: A Test on
Chinese and African American Consumers.
15. Klein, L.R., 1998. Evaluating the potential of interactive media through new lens: search
versus experience goods. Journal of Business Research 41 (3), 195–203.
16. Liao, C., Palvia, P., and Lin, H-N. (2006) ―The Roles of Habit and Web Site
Quality in E-Commerce, International Journal of Information Management. 26(6), 469-
483
17. Lorena Batagan, Adrian Pocovnicu, Sergiu Capisizu (2009), E-Service Quality
Management, Journal of Applied Quantitative Methods, Vol.4 N0.3, Fall, 2009.
18. M. Cortinas, M. Elorz, and M. L. Villanueva, ―Retail store loyalty management via an
analysis of heterogeneity of the service elements,‖ Int. Rev. of Retail, Detail, Distribution,
and consumer Research, vol.14, no.4, pp.407-436, 2004.
19. Mummalaneni, V. (2005). An Empirical Investigation of Web Site Characteristics,
Consumer Emotional States and On-Line Shopping Behaviors, Journal of Business
Research 58, 526-532.

Volume:01, Number:03, Jan-2012 : RJCBS Page 14 www.theinternationaljournal.org
20. Nittana Sukasame, E-Service Quality: A Paradigm for Competitive Success of E-
Commerce entrepreneurs, E-service.
21. Noor Habibah Arshad, Fauziah Ahmad, Norjansalika Janom, Azlinah Mohamed, (2007),
Service Quality in Internet Retailing: A Study on Land, Transportation Services, 6th
WSEAS International Conference on E-Activities, Tenerife, Spain, December 14-16,
2007 PP 108- 114.
22. Orit Rotem-Mindali, Ilan Salomon (2005), The impacts of E-retail on the choice of
shopping tripsand delivery: Some preliminary findings, Transportation Research, Part A
41 (2007) 176–189, Received 22 November 2005; received in revised form 22 November
2005; accepted 26 February 2006
23. Parasuraman, A., V.A. Zeithaml, A. Malhotra. 2005. E-S-QUAL: A Multiple-Item Scale
for Assessing Electronic Service Quality. Journal of Service Research 7(3) 213-233.
24. R. E. Anderson and S. S. Srinivasan, ―E-satisfaction and e-loyalty: A contingent
framework,‖ Psychology & Marketing, vol.20, pp.123–138, 2003.
25. Rossiter (2009), ER-SERVCOMPSQUAL: A Measure of E-Retailing Service
Components Quality Service Science 1(4), pp. 212-224, © 2009 SSG
26. Rossiter, J.R. 2002. The C-OAR-SE Procedure for Scale Development in Marketing.
International Journal of Research in Marketing 19(4) 305-335.
27. Salomon, I., Koppelman, F.S., 1992. Teleshopping or going shopping? An information
acquisition perspective. Behaviour and Information Technology 11 (4), 189–198.
28. Srini S. Srinivasana, Rolph Andersona, Kishore Ponnavolu (2002), Customer loyalty in
e-commerce: an exploration of its antecedents and consequences, Journal of Retailing 78
(2002) 41–50
29. Vargo, S.L., R.F. Lusch. 2004. Evolving to a New Dominant Logic for Marketing.
Journal of Marketing 68(1) 1-17.
30. W. H. DeLone and E. R. McLean, ―The Delone and McLean Model of information
systems success: A ten-year upgrade,‖ Journal of Management Systems, vol.19, no.4, pp.
9-30, 2003.
31. W. Rodgers, S. Negash, and K. Suk, ―The moderating effect of on-line experience on the
antecedents and consequences of on-line satisfaction,‖ Psychology & Marketing, vol.22,
no. 4, pp. 313-331, 2005.
32. Y. S. Wang and T. I. Tang, ―Assessing customer perceptions of Website service quality in
digital marketing environments,‖ Journal of End User Computing, vol.15, no 3, pp. 14-
31, 2003.
***

Volume:01, Number:03, Jan-2012 : RJCBS Page 15 www.theinternationaljournal.org
“A STUDY OF EMOTIONAL INTELLIGENCE AT A PUBLIC SECTOR
UNIT IN BANGALORE”
Monica. M
Research Associate,
Acharya Institute of Technology,
Bangalore
Dr. L.Vijayashree
Associate Professor,
Department of MBA,
PES School of Engineering,
Hosur Road, Bangalore- 560100
Abstract:
Emotional intelligence refers to the ability to recognize and regulate emotions in ourselves
and others. Emotional Intelligence (EI) is considered to be a very powerful tool to an
employee to manage relationships and achieve success at work. The aim of this research was
to study the role of emotional intelligence among the employees at Karnataka State Remote
Sensing Application Centre (KSRSAC) and further this study investigates the relationships of
demographic factors (Gender, age, Education level, marital status and Income) and emotional
intelligence.
The census method was adopted which includes all 120 employees at KSRSAC as sample.
To assess the emotional intelligence, Researchers used Goleman’s method, which includes 25
questions. In addition, some personal and social demographic data was gathered from the
employees. Data were analyzed using SPSS-17 and descriptive and inferential statistics.
The study explores the relationship of factors of EI within and also concludes that when age
increases the social skills decreases. The result proves that the males have more EI compared
to females at KSRSAC but the variation among the gender groups is less.
KEY WORDS: Emotional intelligence, Self awareness, Self management, Self motivation,
Empathy and Social skills.

Volume:01, Number:03, Jan-2012 : RJCBS Page 16 www.theinternationaljournal.org
Introduction:
Emotional Intelligence (EI) refers to the ability to recognize and regulate emotions in
ourselves and others (Goleman, 2001). Peter Salovey and John Mayer, who originally used
the term "Emotional Intelligence" in published writing, initially defined emotional
intelligence as:
A form of intelligence that involves the ability to monitor one's own and others' feelings and
emotions, to discriminate among them and to use this information to guide one's thinking and
actions (Salovey & Mayer, 1990).
Evolution of EI:
Goleman: A Mixed Model of Emotional Intelligence
Daniel Goleman, a psychologist and science writer who has previously written on
brain and behavior research for the New York Times, discovered the work of Salovey and
Mayer in the 1990's. Inspired by their findings, he began to conduct his own research in the
area and eventually wrote Emotional Intelligence (1995), the landmark book which
familiarized both the public and private sectors with the idea of emotional intelligence.
Figure-1: HR Activity

Volume:01, Number:03, Jan-2012 : RJCBS Page 17 www.theinternationaljournal.org
Goleman identified the five 'domains' of EI as:
1) Self-awareness: Self awareness (SA) concentrates on one’s vision, values &
belief. SA examines one’s emotions towards their performance and helps in decision
making by using their values. SA also helps to identify one’s strength and weakness
& learn from experience, finally SA makes person to become more confident.
2) Self-management: Self management (SM) able to manage their stress by having
positive attitude towards self and also others. Self managed people try to control their
temper and able to perform under pressure and these persons can be trusted.
3) Self-Motivation: Self motivation (SMo) helps to increase the commitment in
work. Self Motivated people are capable to take initiative to achieve the goals by
taking up the new challenges at work place.
4) Empathy: Empathy (E) helps to understand the others behaviour and feeling and
they will be open in their thoughts and try to be aware of their culture and work
in diversified workforce. .
5) Social skills: Social skills (SS) indicate that people are capable of listening to
others and also communicate effectively. SS influence, lead others and manage
change and adapt to the situation by dealing with others emotions.
Figure-2: EI Components

Volume:01, Number:03, Jan-2012 : RJCBS Page 18 www.theinternationaljournal.org
Review of literature:
1. Michael Gosling (2006) explains in his PhD Thesis “Measuring emotional
intelligence of managers in Singapore and the application of emotional intelligence
for individual and organization effectiveness. An exploratory study” that male
respondents scored higher than did their female counterparts. And also proves that the
EI abilities were independent of age by considering 3 age groups.
2. Pandey Hari Shankar (2010) in his journal paper “Evaluating Characteristics &
Emotional Intelligence among workers in organizations in the state of Rajasthan”
investigated the relationship between demographic variables and emotional
intelligence among workers and shows the result that there was also significant
difference in the emotional intelligence mean scores of male and female.
3. Mary Jo Jackson and Sharon Larisa Segrest Research in Higher Education Journal
“The effects of emotional intelligence, age, work experience, and academic
performance” paper found that the emotional intelligence was found to be positively
associated with work experience and also emotional intelligence was not significantly
associated with age and academic achievement.
4. Souvik Ghosh and Suvarna Chakraborty (The Journal of Business Perspective l
Vol. 12 l No. 1 l January–March 2008) in their journal paper “Emotional intelligence:
the next step in knowledge process outsourcing” has done a comparative study
between two companies. And shows that there exists a relationship between efficient
synergistic determinants of emotional intelligence of knowledge employees and
sustained competitive edge. This is proved by the level of importance attached to
emotional intelligence in Company B where a more integrated and synergistic HR
strategy was able to adapt to the expectations of knowledge employees faster than
Company A. This journal paper also shows the importance of information sharing and
communication among collaborators and business partners to handle the emotions of
the employees better. And proves that flexible emotionally intelligent and mature
leadership helps achieve faster growth rate.
5. Blair Kidwell, David M. Hardesty, Brian R. Murtha, & Shibin Sheng (Journal of
Marketing Vol. 75 (January 2011),) in their research work “Emotional Intelligence
in Marketing Exchanges” examined how sales professionals use emotions in
marketing exchanges to facilitate positive outcomes for their firms, themselves, and
their customers. The authors conduct three field studies to examine the impact of EI in
marketing exchanges on sales performance and customer relationships. They find that
EI is positively related to performance and finally the results indicated a
complementary relationship between EI and cognitive ability in that EI positively
influences performance at higher levels of cognitive ability.
6. The Emotional Intelligence and Leadership Study was conducted by Dottie Brienza
(Consortium for Research on Emotional Intelligence in Organizations Leadership &
EI at J&J). In his research, results showed that the highest performing managers have
significantly more emotional competence than other managers. There was strong
inter-rater agreement among Supervisors, Peers, and Subordinates that the
competencies of Self-Confidence, Achievement Orientation, Initiative, Leadership,
Influence and Change Catalyst differentiate superior performers. The high potential
managers received higher scores in the emotional competencies by Peers and
Supervisors, but not by Subordinates. Some gender difference was found, with
Supervisors rating Females higher in Adaptability and Service Orientation, while
Peers rated Females higher on Emotional Self-Awareness, Conscientiousness,

Volume:01, Number:03, Jan-2012 : RJCBS Page 19 www.theinternationaljournal.org
Developing Others, Service Orientation, and Communication. Direct reports scored
Males higher in Change Catalyst.
7. Samuel O. Salami (2008) in his research paper “Demographic and Psychological
Factors Predicting Organizational Commitment among Industrial Workers”
investigated the relationships of demographic factors (age, marital status, gender, job
tenure, and educational level), emotional intelligence, work-role salience,
achievement motivation and job satisfaction to organizational commitment of
industrial workers.
8. Cary Cherniss Graduate School of Applied and Professional Psychology Rutgers
University” Emotional Intelligence: What it is and Why it Matters” Cary Cherniss,
Ph.D. October 7, 1998 Bringing Emotional Intelligence To The Workplace
The EI concept is a psychological one, it is important for I/O psychologists to
understand what it really means and to be aware of the research and theory on which
it is based. So in this presentation it brief about the history of the concept as an area of
research and describe how it has come to be defined and measured. The research links
emotional intelligence with important work-related outcomes such as individual
performance and organizational productivity.
9. Fabio Sala, Ph.D Consortium for Research on Emotional Intelligence in Organizations
EI Program Eval. “Do Programs Designed To Increase Emotional Intelligence At
Work?”
The recent and widespread interest in the importance of emotional intelligence (EI) at
work (Goleman, 1995) has led to the development of programs that are designed to
(1) educate people about the relevance of emotional intelligence in the workplace, (2)
assess their relative strengths and weaknesses, and (3) provide a framework to
develop and enhance their ability to interact with others with greater emotional
intelligence (Boyatzis, 1999). This research will attempt to provide some evidence for
the effectiveness of an emotional intelligence training program; specifically, whether
participants scores on a measure of EI improve after exposure to a program designed
to increase emotional intelligence at work. Increases in EI scores with both samples
suggest that workshop interventions are effective at improving EI
10. Kathleen Cavallo, PsyD, Corporate Consulting Group and Dottie Brienza, MA The
Emotional Intelligence and Leadership Study at J&J
A study was conducted on three hundred and fifty-eight Managers across the Johnson
&Johnson Consumer & Personal Care Group (JJC&PC Group) globally to assess if
there are specific leadership competencies that distinguish high performers from
average performers. Participants were randomly selected, then coded for performance
rating, potential code, gender, functional group and regional area. Results showed that
the highest performing managers have significantly more “emotional competence”
than other managers. There was strong inter-rater agreement among Supervisors,
Peers, and Subordinates that the competencies of Self-Confidence, Achievement
Orientation, Initiative, Leadership, Influence and Change Catalyst differentiate
superior performers. The high potential managers received higher scores in the
emotional competencies by Peers and Supervisors, but not by Subordinates. Some
gender difference was found, with Supervisors rating Females higher in Adaptability
and Service Orientation, while Peers rated. Females are higher on Emotional Self-
Awareness, Conscientiousness, Developing Others, Service Orientation, and
Communication. Direct reports scored Males higher in Change Catalyst.
11. Steven B. Wolff, DBA*November 205, Emotional Competence Inventory (ECI)

Volume:01, Number:03, Jan-2012 : RJCBS Page 20 www.theinternationaljournal.org
The ECI is a 360-degree tool designed to assess the emotional competencies of
individuals and organizations. It is based on emotional competencies identified by Dr.
Daniel Goleman in Working with Emotional Intelligence (1998), and on competencies
from Hay/McBer’s Generic Competency Dictionary (1996) as well as Dr. Richard
Boyatzis’s Self-Assessment Questionnaire (SAQ).ECI has shown strong evidence for
the assessment, development, and training of emotional intelligence. The Emotional
Competence Inventory 2.0 (ECI) measures 18 competencies organized into four
clusters:
Self-Awareness, Self-Management, Social Awareness, and Relationship Management
etc.The ECI is supported by very good reliability and validity evidence from research
from a variety of worldwide organizational contexts.
12. Samuel Olayinka Salami Ph.D., senior lecturer, head of Department of Guidance and
Counseling, Kampala International University; research fields: counseling
psychology, personnel psychology and career development - SEPTEMBER 2010,
“Gender as a moderator of relation between emotional intelligence and career
development”
The purpose of this study is to examine the relationship of emotional intelligence with
career development and the moderating role of gender in the relationship. This study
adopted a survey research design. Questionnaires were used to obtain data on
emotional intelligence, career development and demographic factors from 485
secondary school students (male=255, female=230) randomly selected from 5 states
in south western Nigeria. Data analysis included regressing career decision-making
self-efficacy and career maturity on emotional intelligence and gender. Results
indicated that emotional intelligence and gender predicted career development
and gender moderated the relationship between emotional intelligence and career
development. The implication of the findings is that counseling psychologists should
assess the emotional intelligence of the male and female students when conducting
career counseling. In addition, the findings suggest that the students need to be
exposed to counseling interventions for enhancing their emotional intelligence.
13. Hossein Namdar, Mohammad Sahebihagh, Hossein Ebrahimi, Azad Rahmani-2008
IJNMR Autumn 2008; Vol 13, No 4. “Assessing emotional intelligence and its
relationship with demographic factors of nursing students.”
The aim of this research was to assess the emotional intelligence of nursing students
and its relation with some personal and social. To assess the emotional intelligence,
the research has used BarOn EQ-i, which includes 90 questions in 5 categories and 15
scales scoring in a range between 90 and 450. In addition, some personal and social
demographic data were gathered from the students' educational files. Data were
analyzed using SPSS-13 and descriptive and inferential statistics. The students' mean
score of emotional intelligence was 332.08 ±39.08. The research shows that there was
no significant relation between emotional intelligence score and sex, education, and
students' interest in nursing. However, there was a significant relation between
emotional intelligence score and the students' satisfaction of their family socio-
economic status.
14. Mallika Dasgupta, Research Scholar, Department of Applied Psychology, University
of Calcutta “Emotional Intelligence emerging as a significant tool for Female
Information Technology professionals in managing role conflict and enhancing
quality of Work Life and Happiness” ASIAN JOURNAL OF MANAGEMENT
RESEARCH- 2010

Volume:01, Number:03, Jan-2012 : RJCBS Page 21 www.theinternationaljournal.org
Studying the role of Emotional Intelligence in managing Role Conflict and enhancing
Quality of Work Life and happiness among female IT Professionals, female IT
professionals have been found to be benefiting from their level of EI in achieving a
work family life balance and experiencing a higher Quality of Work Life and
experiencing an enhanced level of happiness. The research shows that that EI does
bear a negative relationship with Work Family Role Conflict and a positive
relationship with QWL and Happiness. the fact that Emotionally Intelligent people are
highly motivated and thus, meet their role demands without experiencing much stress.
15. Neerpal Rathi and Renu Rastogi, Journal of the Indian Academy of Applied
Psychology October 2009 “Assessing the Relationship between Emotional
Intelligence, Occupational Self-Efficacy and Organizational Commitment”
The purpose of this study is to explore the relationship among Emotional Intelligence
(EI), occupational self-efficacy, and organizational commitment. Data were collected
120 employees working in various organizations in India. A positive and significant
correlation is observed between EI and occupational self-efficacy (p< 0.01), whereas
a positive relationship (not significant) is observed between EI and organizational
commitment. Moreover, a low positive association is found between occupational
self-efficacy and organizational commitment. The research implies that EI and
occupational self-efficacy are related with a variety of organizationally desirable
outcomes. The results of this study indicate that EI significantly predicts occupational
self-efficacy in such a way that employees with a high level of EI exhibit a high level
of occupational self efficacy.
16. K.V.Petrides Adrian Furnham, Department of psychology, University college,
London, The Journal of social psychology 2004, “Estimates of Emotional and
Psychometric Intelligence: Evidence for Gender- Based Stereotypes”
The research has considered the hypothesis that men would give higher IQ but lower
EI self estimates than the women and that participant, regardless of gender would rate
their father as higher on IQ but lower on EI than their mothers. The result in this
research paper confirmed that the hypothesis view that people perceive psychometric
intelligence as a primarily masculine attribute in contrast with EI, which they perceive
as a primary feminine attribute. The result also showed that the intensity of the
stereotypical perception of 9 attribute diminished when the authors asked participants
to estimates their score.
Research Methodology Questionnaire method has adopted to collect data from the respondents. Descriptive
research was adopted for the sample size of 120. The data was collected from all the
120 employees in the given time frame at KSRSAC. Census survey was used to
collect data. Primary data was collected from the employees working at KSRSAC,
Bangalore, using well structured questionnaires. Likert scale was adopted in designing
the questionnaire & both open and closed ended questions were used. Secondary data
has collected from the company websites, journals, white papers etc.
The Objectives of the Study
The purpose of this study was to investigate the relationship of some demographic
factors (age, gender, education level, and Income) and emotional intelligence
The ability to manage feelings, generate confidence and trust among the workers
during the process of developing them in order to achieve the organization’s

Volume:01, Number:03, Jan-2012 : RJCBS Page 22 www.theinternationaljournal.org
objectives and goals is one of the other aspects of EI that has been found to be
important. In this context, the objectives are as follows.
1. To find relationship between the factors/dimension of EI.
2. To find relationship between the factors of EI and Demographic factors.
3. To find the impact of various demographic factor with EI Factors.
The following three hypotheses have been formulated for this study:
Hypothesis1: There is a significant relationship among the factors of EI
Hypothesis2: There is a significance relationship between the factors of EI and
Demographic factors
Hypothesis3: There is a variation among demographic factors and factors of EI
Analysis:
Objective1: “To find relationship between the factors of EI”
Hypothesis1: “There is a significant relationship among the factors of EI”
Result: Table 1: Correlations
Self
Awareness
Self
Management
Self
Motivation Empathy
Social
Skills
Self
Awareness
Pearson
Correlation 1 .044 .224
* .050 .117
Sig. (2-tailed) .630 .014 .588 .202
N 120 120 120 120 120
Self
Management
Pearson
Correlation .044 1 .331
** .114 .035
Sig. (2-tailed) .630 .000 .215 .703
N 120 120 120 120 120
Self
Motivation
Pearson
Correlation .224
* .331
** 1 .107 .102
Sig. (2-tailed) .014 .000 .244 .269
N 120 120 120 120 120
Empathy Pearson
Correlation .050 .114 .107 1 .169
Sig. (2-tailed) .588 .215 .244 .066
N 120 120 120 120 120
Social Skills Pearson
Correlation .117 .035 .102 .169 1
Sig. (2-tailed) .202 .703 .269 .066
N 120 120 120 120 120
*. Correlation is significant at the 0.05 level (2-tailed).
**.Correlation is significant at the 0.01 level (2-tailed).
From the above table: 1, There is a correlation between self awareness and self
motivation with significance level of 0.014 and correlation between self motivation
and self management with significance level 0.00
The 2 factors of EI are highly positively correlated. I.e. there is significance
relationship between self motivation and self management (0.00) and self awareness

Volume:01, Number:03, Jan-2012 : RJCBS Page 23 www.theinternationaljournal.org
and self motivation (0.014). The most of the factors are positively correlated with out
significance. The research proves that all the factors of emotional intelligence are
positively correlated with one another.
Self awareness and Self management are positively correlated with Self motivation,
this means once a person is fully aware of one’s own self and cam manage him/her,
and it increases the level of motivation inside the person too.
Social skills are positively significant correlated with empathy. The research proves
that if a person increases Social skills then viewing the problems of others in others
point also increases (Empathy). Refer the table no. 1, on the whole all the factors of
EI are positively to one another.
Objective2: “To find relationship between the factors of EI and Demographic
factors”
Hypothesis2: “There is a significance relationship between the factors of EI and
Demographic factors (Age and income)”
Result: Self awareness is negatively correlated with age and significantly positively
correlated with income. The result proves that when is less, KSRSAC employees have
more awareness level towards them self and when they grow old this awareness
decreases. The result proves that people might be fully aware of their strength and
weaknesses when they are old. In case of income, the result of the study proves that
when the income increases, self awareness significantly increases; the income factor
is associated with employees experience and gets more income. He/she needs to know
more about their strengths and weaknesses and also need to be self confident. The
research concludes that as the employees’ income increases there self confidence
increases and they will try to assess themselves by knowing their strengths and
weakness. This study proves the concept that income and self awareness are
positively correlated.
The Self management is positively correlated with age and income but with no
significance, likewise the result also shows that self motivation is positively correlated
with age and income but with no significance.
The empathy is negatively correlated with age but there is no significance and
empathy is positively correlated with income factor with no significance.
The social skill is negatively correlated with age with 5% level significance. The
result proves that as age increases the social skills among the employee’s decreases.
Aged persons have experience in their work life. So people try to learn from their
experience rather from others. The social skill is negatively correlated with income
with no significance. (Refer table no 2) This means that people with more age are less
communicative and they are not able to manage the changes and least bother about the
others emotions.
Table 2: Correlation
Correlation Age Income
Self Awareness--Pearson Correlation
Significance
-.130
.158
.205*
.025
Self Management--Pearson Correlation
Significance
.112
.223
.040
.664

Volume:01, Number:03, Jan-2012 : RJCBS Page 24 www.theinternationaljournal.org
Self Motivation--Pearson Correlation
Significance
.054
.560
.022
.812
Empathy --Pearson Correlation
Significance
-.073
.427
.030
.746
Social Skill--Pearson Correlation
Significance
-.158
.085
-.038
.684
*->Significant Correlation
Objective3: “To find the impact of various demographic factors (Gender, age,
Education qualification, marital status and Income) with the EI factors”
Hypothesis3: “There is a variation among demographic factors and factors of EI”
Result:
Self Awareness: Gender, education qualification level groups do not have variation
with respect to self awareness factors, in case if marital status there is a significant
variation across marital groups. This means between married, unmarried there is
variation when asked about self awareness. Usually married person have a control on
their emotions and examine their values when they need to take decision compared to
unmarried. This concept is proved here.
Self Management: Gender, education qualification level and marital groups do not
have variation with respect to self management factors. The levels of temper, being
positive, thinking capacity in pressure situation do not vary across the demographic
groups in KSRSAC.
Self Motivation: Between gender groups (male and female) there is no variation with
respect to self motivation, which means that both take up challenges equally and take
initiative, but in case of marital status, education level there is a no variation with
respect to self motivation (refer table 5) we can understand that married have more
self motivation than unmarried and widowed. This can be understood that married
face more challenges in their life that unmarried and widowed.
Table 7 shows that, UG employees have more self motivation that PG and others,
which proves that young people love to take up challenges and are optimistic in their
actions.
Empathy: There is significant variation between education level groups with
empathy factor (Refer table no: 3). between the education level (PG & above and UG)
there is a slight variation, which means the understanding about others is more for UG
people compared to PG & above people. There behaviours in the work place also vary
and cultural awareness will also have slight variation between PG& above and UG
groups which is also viewed in table no: 7
Social Skills: There is a significant variation between the education levels with that of
social skills factor (Refer table no: 3). which means that the variation is there in
communication and listening skills among the education levels. The conflict avoiding
and managing the changing situation will be more for UG compared to PG & above
employees at KSRSAC (Refer table no: 7)The UG employees are capable to work in
teams. And manage their emotions in group.
Table 3: Anova

Volume:01, Number:03, Jan-2012 : RJCBS Page 25 www.theinternationaljournal.org
Anova Gender Education level Marital status
Self Awareness – Sig
F- Value
0.240
1.392
0.401
0.922
0.002
6.502
Self management -- Sig
F- Value
0.496
0.466
0.140
2.001
0.515
0.668
Self motivation -- Sig
F- Value
0.867
0.028
0.028
3.672
0.013
4.473
Empathy -- Sig
F- Value
0.358
0.852
0.006
5.426
0.887
0.120
Social skills -- Sig
F- Value
0.320
0.995
0.038
3.357
0.620
0.480
Table 4: Mean and SD
Gender * Emptional intelligence factors
Gender:
Self
Awareness
Self
Management
Self
Motivation Empathy Social Skills
Female Mean 2.85 2.55 2.03 2.02 2.08
N 60 60 60 60 60
Std.
Deviation
.732 .622 .610 .676 .530
Male Mean 3.02 2.63 2.02 1.92 2.18
N 60 60 60 60 60
Std.
Deviation
.813 .712 .469 .497 .567
Total Mean 2.93 2.59 2.03 1.97 2.13
N 120 120 120 120 120
Std.
Deviation
.775 .667 .542 .593 .549
Table 5: Marital Status*emotional intelligence factors
Marital Status:
Self
Awareness
Self
Management
Self
Motivation Empathy Social Skills

Volume:01, Number:03, Jan-2012 : RJCBS Page 26 www.theinternationaljournal.org
Table 7: Educational Qualification*Emotional Intelligence factors
Educational qualification:
Self
Awareness
Self
Management
Self
Motivation Empathy Social Skills
PG&Above Mean 3.03 2.43 1.92 1.78 2.03
Std.
Deviation
.897 .603 .595 .479 .499
UG Mean 2.84 2.62 2.00 1.97 2.25
Std.
Deviation
.718 .724 .471 .470 .535
Findings
The research proves that all the factors of emotional intelligence are positively
correlated with or less significant
There is a significant relationship between the self awareness and the income factors,
this shows that higher the income more will be the self awareness.
The result proves that when there is increase in education level among the employees
of KSRSAC, then there is increase in the self management and empathy in them.
The result proves that the increase in the level of education increases the self
motivation, which makes employee to be committed to work and take initiative
without the supervision of others and will be achievement oriented, which is required
to improve the performance of the employees at KSRSAC.
The research concludes that the increase in the age decreases the social skills since the
aged persons try to learn from their experience.
The result proves that the males have more EI compared to females at KSRSAC but
the variation is among the gender groups is less.
Single Mean 3.08 2.55 2.00 1.95 2.14
Std. Deviation .777 .688 .527 .621 .585
Married Mean 2.76 2.64 2.11 2.00 2.11
Std. Deviation .679 .645 .532 .564 .487
Widowed Mean 1.50 3.00 1.00 2.00 2.50
Std. Deviation .707 .000 .000 .000 .707

Volume:01, Number:03, Jan-2012 : RJCBS Page 27 www.theinternationaljournal.org
There is no variation among the age groups and the factors of EI lie between the age
group of 20-35.
The increases in the income factor increase the factors of EI like self management,
self motivation and empathy.
Conclusion: Emotional Intelligence is more critical for employees at work place.
From the research, The research conclude that there is a positive correlation among
the factors of EI (Self management, motivation, awareness, social skills and empathy)
Gender: From the analysis, research concludes that there is a correlation between the
factors of EI and Gender. The research proves that the males have more EI compared
to females at KSRSAC. But the there is no much significant variation among the
gender groups and EI. The female can improve their EI by managing personal and
work life better. The male need to work on the few factors like self motivation and
empathy to improve overall EI and The female can improve their social skills by
interacting more with the colleagues and try to avoid shyness.
Age: There is a significant relationship between EI factors and age factor. From the
research, as the age increases the social skills decreases since aged people try to learn
from their experience rather than from others. So the social skills can be improved by
involving more in social gathering and team development activities. The research says
that the overall EI factors lie between the age group of 20-35 so the person above the
age of 35 can improve their EI by undergoing training on EI and involving in the team
development activities.
Education qualification: There is a significant relationship between the education
qualification and EI factors. The higher the education higher the self management,
self motivation and empathy. This gap can be filled by learning from the well
educated employees. The highly educated employees can give the feedback and
suggestions so that even less educated employees can improve the EI factors.
Suggestion:
• To Organization: The organization should arrange for maximum numbers of team
development activities in order to improve the social skills among the employees at
KSRSAC.
• The organization should adopt the two way communication by accepting the
suggestions and feedback from the employees.
• EI Training can be used to improve the EI among the employees.
• To Individuals: The individuals should be open minded and should be willing to
learn from others so that the empathy among the male employees will increases.
• Females should try to balance the work life.
• Females should interact more with colleagues, so that the social skills among them
can be improved.
• People should accept the feedback from the senior employees.
References:
Articles:
1. Cary Cherniss Graduate School of Applied and Professional Psychology Rutgers
University” Emotional Intelligence: What it is and Why it Matters” Cary Cherniss, Ph.D.
October 7, 1998, Bringing Emotional Intelligence To The Workplace.
Volume:01, Number:03, Jan-2012 : RJCBS Page 28 www.theinternationaljournal.org
2. Kathleen Cavallo, PsyD, Corporate Consulting Group and Dottie Brienza. “Emotional
Competence and Leadership Excellence at Johnson & Johnson” Consortium for Research on
Emotional Intelligence in Organizations Leadership & EI at J&J
3. Fabio Sala, Ph.D. “Do Programs Designed To Increase Emotional Intelligence At Work?”
Consortium for Research on Emotional Intelligence in Organizations EI Program Eval.
Reports: 1.Mike Gosling, “Measuring emotional intelligence of managers in Singapore and the
application of emotional intelligence for individual and organisation effectiveness”, an
exploratory study. PhD Thesis 2006. University of South Australia in 2006.
2. Steven B. Wolff, DBA*November 2005, “Emotional Competence Inventory (ECI)”
Technical Manual, Hay Group, McClelland Centre for Research and Innovation, Updated
November 2005.
3. Samuel Olayinka Salami, Ph.D., senior lecturer, head of Department of Guidance and
Counseling, Kampala International University; research fields: counseling psychology,
personnel psychology and career development.- SEPTEMBER 2010 US-China Education
Review, ISSN 1548-6613, USA, “Gender as a moderator of relation between emotional
intelligence and career development”
Journals: 1. Blair Kidwell, David M. Hardesty, Brian R. Murtha, & Shibin Sheng, “Emotional
Intelligence in Marketing Exchanges”. Journal of Marketing. Vol. 75 (January 2011).
2. Hossein Namdar, Mohammad Sahebihagh, Hossein Ebrahimi, Azad Rahmani-2008
“Assessing emotional intelligence and its relationship with demographic factors of nursing
students.” IJNMR Autumn 2008; Vol 13, No 4.
3. Pandey Hari Shankar. Evaluating Characteristics & Emotional Intelligence among Workers
In Organizations In The State Of Rajasthan. International Research Journal. July 2010.
4. Mary Jo Jackson and Sharon Larisa Segrest, “The effects of emotional intelligence, age,
work experience, and academic performance” Research in Higher Education Journal
5. Mallika Dasgupta, Research Scholar, Department of Applied Psychology, University of
Calcutta “Emotional Intelligence emerging as a significant tool for Female Information
Technology professionals in managing role conflict and enhancing quality of Work Life and
Happiness”. Asian journal of management research- 2010 .
6.Neerpal Rathi and Renu Rastogi, Journal of the Indian Academy of Applied Psychology
October- 2009. “Assessing the Relationship between Emotional Intelligence, Occupational
Self-Efficacy and Organizational Commitment”.
7. Petrides. K.V., Adrian Furnham, Department of psychology, University College, London
and G.Neil Martin, Department of psychology, Middlesex University, London, The Journal
of social psychology, “Estimates of Emotional and Psychometric Intelligence: Evidence for
Gender- Based Stereotypes” .
8. Samuel O. Salami. “Demographic and Psychological Factors Predicting Organizational
Commitment among Industrial Workers. 2008. Department of Guidance and Counselling,
University of Ibadan, Ibadan, Nigeria. Emotional Intelligence: The Next Step In Knowledge
Process Outsourcing”, The Journal of Business Perspective l Vol. 12 l No. 1 l January–March
2008.
***

Volume:01, Number:03, Jan-2012 : RJCBS Page 29 www.theinternationaljournal.org
PROFESSOR’S CHOICE: FACTORS EFFECTING PRE PURCHASE
BEHAVIOR OF PRIVATE HEALTH INSURANCE, AN EMPIRICAL
ANALYSIS
Soumik Gangopadhyay
Research Scholar
West Bengal State University
Dept. of Commerce and Management
Berunanpukuria, Malikapur, Barasat,
West Bengal, India, Pin- 700126
Abstract
With the increasing number of population of India, it has been predicted that 70% of them
will be confined to the urban setup. Acceleration of life style related diseases of urban society
is augmenting business opportunity for the private hospitals by leaps and bounds. Disease
pattern is showing a change by shifting its dimension from infectious to non-infectious
dominance in Indian urban society. A field survey has done on 300 faculties of 10 self-
financing colleges of West Bengal to identify the motivation of purchase of health insurance
products. The result is surprisingly indicating that accessibility and awareness have an
important role in the motivation process of choosing health insurance brands. The study also
explores an immense potentiality of Indian health insurance market with ample opportunity.

Volume:01, Number:03, Jan-2012 : RJCBS Page 30 www.theinternationaljournal.org
Introduction – Insurance is a reliable source of security, freedom from anxiety, fear and
peace of mind. For a premium, a person can avail medical and surgical services. Indian
insurance industry is becoming consumer driven and a timid response has initially been given
by Indian customers. With the changing need of customers perception regarding healthcare,
Indian insurance market is offering its different product through versatile packages.
Innovative offers are on the nail. Fundamentals of these are highlighting on return to
reciprocate investment. Lucrative income is highlighted to promote these brands. Indian
social structure has shown dramatic changes influenced by versatile reasons i.e.
industrialization, heterogeneous needs of people influenced by globalization, accelerated
disability/inability conditions created by life style related diseases are forcing people to
consistently increase the epistemic value of healthcare related products. People can feel the
impulse of pathetically unpredictable consequences performed by these diseases. They are
becoming paranoid regarding these situations. Hence a business avenue is being generated
and an incredible opportunity for the Indian insurance companies to explore their business
into a related dimension has incidentally happened. The urban Indian society is haunted by
fear of unknown lifestyle diseases, whose sudden attack silently creates short / long term
disability. However, health uncertainity (Death / permanent disability) is becoming an
affluent cause of motivation of investment in health insurance.
Health insurance, being a contract of health risk purports certain criticality to market it
among customers,
A. Structural weakness -
1. Intangible dimension of health insurance as a product is maximum. Health is a free product
as traditionally received by Indians. Health crisis is an emergency phenomenon as perceived
by people.
2. People can‟t foresee future. A single premium fails to cover all major arrays of disease.
3. People invest on the basis of current trend.
4. Doesn‟t offer least income opportunity. So the motivation of investment is poor.
5. Epistemic value is less.
6. Problems of growth as the competition are increasing.
7. Cost of service / clarity in cost of service as varied from one hospital to other.
8. Problems in innovation as the issue is delicate (life and death situation). People purchase
the product as generic not as a brand.
10. Difficulty in recognition of a good or poor quality service.
B. Operational weakness –
1. Absence of product differentiation due to various degree of offer.
2. Problem of describing the process of service. Difficulty in describing the content of a
service.
3. Clustered/diffused demand as customer can approach from any part.
4. Accelerating complexities of health related problems due to incorporation of newer
diseases.
5. Barriers of direct communication.
6. Restrictive regulations incorporate more difficulties to handle variation from one case with
the other.
C. Outcome weakness –

Volume:01, Number:03, Jan-2012 : RJCBS Page 31 www.theinternationaljournal.org
1. Difficulty in convincing the customer about the fairness of the price charged.
2. Hardship in controlling patient interface. Emergency help and feedback system respond
slowly.
3. Irregular service quality and absence of supervision of implementation of standards in
different hospitals.
4. Barriers of direct communication.
5. Due to poor knowledge associated with awareness it is difficult to define the justification
of complexities related to reimbursement.
Health insurance has been classified in two categories namely family floater‟s policy (family
coverage) and individual policy (single coverage). Some firms have differentiated their
brands on the basis of accessibility of number of hospital coverage, variation of premium on
number of diseases, tenure of insurance coverage.
In the early 1990s, the floodgate of liberalization & globalization was opened in India that
forces the economy in a competitive market. Hospital occupies 50 per cent of Indian
healthcare market, whereas, pharma, diagnostic, insurance and medical equipments holds 25
per cent, 10 per cent and 15 per cent respectively [6]. According to RNCOS – 2009, 70 per
cent of all hospitals and 40 per cent of beds in the country are controlled by the private sector.
Broadly speaking, 80-85% Indian hospital market is dominated by private investors (IBEF –
Oct, 2010). 75% of expenditure on healthcare in India is still being met by “out of pocket”
consumers. 10% of total indian population today has health insurance coverage [3]. Health
insurance coverage among urban, middle upper class indians, however is significantly higher
and stands at approximately 50%. IRDA (insurance regulatory development authority) is the
governing body responsible for promoting insurance business and introducing insurance
regulations in India. In 2001 the IRDA introduced provisions for Third Party Administrators
(TPA) to support the administration & management of health insurance products offered by
insurance companies. TPAs are facilitators in the coordination process between the health
insurance provider and the hospital.
Table 1 : Current trend of Indian health insurance market.
Indian health insurance market
2008-2009 2009-2010
Health Insurance as non-life insurance 6088 cr.(20.66%) 7311 cr. ( 21.12 %)
Standalone health insurance (premium ) 535.09 cr. 1072.08 cr.
Source: IRDA annual report 2009-10 (market share of the total insurance market)
Importance of the study - The prospect of this research was created based on the report of
Government of India-Ministry of health and family welfare September 2010, 42% of all
deaths of urban India are accountable for non communicable diseases compared to 38% for
communicable diseases. Rural India is showing a reverse scenario where 41% death is
communicable and 40% is responsible for non communicable diseases. These diseases don‟t
have any preventive therapy other than treatment. Sudden attacks of these diseases are
creating the crucial need of acute cashless hospitalization. Health insurance can function as
an important instrument to cope up the emergency attack of these lifestyle related diseases.
Objective of the study –
1. Pre purchase behavior of a group of faculties regarding the purchase of private health
insurance products.

Volume:01, Number:03, Jan-2012 : RJCBS Page 32 www.theinternationaljournal.org
2. To identify the factors influencing the motivation of purchase of private health
insurance products.
3. To specify the factors affecting the design of private health insurance products.
Survey of literature – Through different plethora of studies, it has been widely concurred by
different researchers that, need of healthy life varies with difference in demography,
mortality, crude birth rate and nutritional deficiency (WHO, 1998). Inequality in
affordability, imbalance in accessibility to quality healthcare and discrimination of health
expenditure are the vital reason that creates health inequality among different community of a
civilization [9]. Social factors like dissociation of family, isolated geriatrics etc. are
responsible for lifestyle related diseases which requires hospitalisation. With improved
literacy and better employment opportunities now available, many of the health problems
confronting the less developed countries have been erased. However, sedentary lifestyle an
overambitious outlook, excessively aggressive competition, lack of regular exercise,
excessive consumption of alcoholic beverages and smoking, etc., have brought
noncommunicable diseases like obesity, diabetes, hypertension, myocardial infarction, etc. to
the forefront. Similarly, mental health has also been compromised [5]. In West Bengal the
dominance of life style related diseases are dominating over infectious diseases [7].
Individual food, nutrient and dietary pattern affect the mortality related to cardiovascular
diseases and cancer [13]. Anyway, these diseases are creating a business dimension for the
healthcare market which is also an important reason of accelerating the private corporate
hospitals. Life style related diseases are more of personal choice rather than public health
[10]. People are now demanding for a better quality of life that are forcing the government to
get concerned about the quality of life of their people by reducing morbidity and mortality
[11]. Poor knowledge of health insurance and lack of knowledge regarding this are the main
causes of poor motivation of purchase of health insurance (HI). Knowledge of insurance and
awareness of benefit of health insurance is the effective influencer of health insurance
customer [8]. Awareness regarding health caused by disability influenced by physical ailment
is a hidden factor of motivation of purchasing HI products and perseverance of health is
better understood by chronically ill patients [12]. Bourne 2010 has shown that, old age group
purchase health insurance more than other age group as curative measures [2]. This is a
health risk averter instrument. Increased dependence on private healthcare, high level private
health expenditure, increased cost of out-of-pocket are creating extra financial burden on
Indian‟s shoulder [1, 4].
Research methodology - The whole study is based on the primary field survey data
collected from ten privately owned colleges located in different cities of West Bengal. In total
300 faculties (150 males and 150 females) were surveyed during July-September 2011 and
after screening of all the questionnaires, 289 filled up questionnaire have been finally used.
Health insurance motivation is a“5-Factor” model i.e. Accessibility, Awareness, Cost burden
(monetary costs & non-monetary costs such as searching cost, queuing cost, temporal loss,
risk of anxiety, loss of earning time etc.), Return on investment (ROI), Involuntary reasons.
The relationship between the customer interest and the „5-factors‟ such as Accessibility,
Awareness, Cost burden and Return on investment (ROI), Involuntary reasons can be
measured by the following model,
Y = a + b X1 + c X2 + d X3 + e X4 + f X5
Where, X1 = Accessibility

Volume:01, Number:03, Jan-2012 : RJCBS Page 33 www.theinternationaljournal.org
X2 = Awareness
X3 = Cost burden (cost which includes direct cost like doctor‟s fees, medicine cost,
additional investigation cost, travelling cost and other indirect cost like searching cost,
queuing cost, cost of temporal loss, cost of risk of anxiety and cost of loss of earning time).
X4 = Return on investment (ROI)
X5 = Involuntary reasons like previous experience, peers guidance etc.
Y= Motivation of investment in health insurance (HI) which is dichotomous qualitative
variable. i.e., Y=1 if the interested and 0, otherwise.
As the dependent variable is a binary variable we cannot apply OLS method to estimate the
model. A logit model is accordingly used to estimate the above model. Thus, the dependent
variable is binary taking a value of 1 for the interested respondent and 0, otherwise.
P = Probability that the customer will purchase a health insurance (HI).
All the statistical calculations have been done by using the computer software STATA.
Data analysis and interpretation – 81% males and 19% females out of 300 have health
insurance (90% cases are employer based scheme). Younger people, Person with chronic
illness are more prone to HI. Result emanated from the field survey has revealed that both the
gender doesn‟t symbolize Health insurance as status symbol and concurs about the poor
penetration of health insurance in the society they belong. Moreover, as a whole, faculties
observe health insurance as tax averter not as risk averter and consider this instrument as
savings option. Interestingly, male respondents prefer HI as a legitimate exchange of health
risk and money as they are more sufferers of degenerative diseases. The mass opinion
supports that paying premium should be a burden to be taken by the employers only.
Compared to males, females consider HI as cost burden. Overall the target audience has
given a mixed response regarding the approach of the health insurance companies that
indicates poor accessibility of this product. During designing, insurance companies must
design product separately fulfilling the versatile need of both male and female.
Present coverage of the market have targeted only the cream of the market i.e. people who
belong to the high income group and aware about the health insurance products. To grab
more market share, insurance companies have to design product that offers minimum
investment but maximum coverage of diseases through wide number of hospitals. By doing
so in the days to come, a price war will create between these companies who are required to
innovate their product by offering individual customer oriented service. Recent example is of
a mobile telephone service company who offer their customer just one call at zero balance.
Table : 3 Result of opinion of respondents on the basis of personal justification
% of Female respondents
(150)
% of Male respondents
(150)
Yes No Yes No
Health insurance is a symbol
of rich status
39 % 61 % 33 % 67 %
Health insurance poorly
penetrate our society
47 % 53 % 32 % 66 %
HI is a income tax averter
instrument
86 % 14 % 87 % 13 %
HI is a savings option 71 % 29 % 61 % 39 %
HI is a justified exchange of
health risk & money
26 % 74 % 64 % 36 %

Volume:01, Number:03, Jan-2012 : RJCBS Page 34 www.theinternationaljournal.org
HI premium mandatorily be
paid by employer
82 % 18 % 87 % 13 %
HI help to support a costly
treatment
79 % 21 % 78 % 22 %
HI company approached
during last 3 yeras
45 % 55 % 48 % 52 %
Health insurance is a cost
burden
87 % 13 % 60 % 40 %
Respondents with chronic
illness (Degenerative disease)
12 % 35 %
Monthly income status Rs. 10000-15000 – 10 %
Rs. 15001-25000 – 70 %
Rs. 25001 and above – 20 %
Rs. 10000-15000 – 17 %
Rs. 15001-25000 – 60 %
Rs. 25001 and above – 23
%
Age group 25-35 yrs – 23 %
36-45 yrs – 65 %
>46 - 12 %
25-35 yrs – 32 %
36-45 yrs – 43 %
>46 - 25 %
Source : Based on author‟s analysis as data received from field survey.
Table : 2 Logit analysis
Coefficient Std. Error t value Slope
(Evaluated at the
mean)
Constant -138.153 45.3764 -3.0446
Accessibility 2.52052 0.838913 3.0045 1.27699e-05
Cost Burden 2.34997 0.795974 2.9523 1.19058e-05
Awareness 2.31973 0.80964 2.8651 1.17526e-05
Involuntary 2.3025 0.834583 2.7589 1.16653e-05
ROI 2.1269 0.716116 2.9700 1.07756e-05
Source: Based on author‟s analysis using software STATA
Mean dependent var 0.790698 S.D. dependent var 5.07e-06
McFadden R-squared 0.821752 Adjusted R-squared 0.731092
Log-likelihood -11.79660 Akaike criterion 35.59321
Schwarz criterion 52.75208 Hannan-Quinn 42.56521
Likelihood ratio test: Chi-square(5) = 108.769 [0.0000]
All the independent variables have strong positive impact on the respondent‟s motivation.
McFadden's pseudo- R-squared = 0.821752 signifies that 82% of the dependent variable are
explained by the data which is highly significant. For all the factors such as treatment,
quality, care and cost, the p-value are tested at i.e., 10 per cent level of significance which
signifies that all the independent variables are statistically significant in explaining the
dependent variable, i.e., health insurance purchase motivation (MHI). As the coefficients of
all the explanatory variables are positive and statistically significant, it implies that
accessibility, cost burden, awareness, involuntary reason and Return on investment all play
significant role in satisfying a patient. The derived model is as follows,
MHI = - 138.153 + 2.520 *Accessibility + 2.349 *Cost burden + 2.319* Awareness + 2.302
*Involuntary reasons + 2.126 *ROI

Volume:01, Number:03, Jan-2012 : RJCBS Page 35 www.theinternationaljournal.org
Conclusion – The study indicates that there is a transition phase is happening as the
insurance market is showing a tradition of dimensional shift from customer market to
business market and hence, individual care is absolutely in need of the hour. Even in an urban
setup, for a group of educated people accessibility of health insurance is a big concern. Any
health insurance company can promote this problem as their opportunity area of business and
design their distribution system to reach maximum prospective customer. The result also
indicate that health support is still considered categorically as emergency product even by the
majority of educated people emanated from reluctance shown by the studied population.
Further it is a concern that respondents are also price sensitive as they are not confident about
the benefits featured by the product. Although, it is a matter of great dispute about the
intensity of accessibility to a value added product which can fulfill their demand adhering
with their perseverance. Being a highly intangible product, the brands offered to the
customers should be designed from customer‟s point of view not on the basis of profitability
to attract maximum customers and in that case premium charged can be decreased in quantity
which will further be beneficial as it will be affordable to a large group of people. But, only
garnishing the existing brands of health insurance will never give mileage to sustain in the
competitive market. Rather, customer friendly brands are more acceptable. It is a big
challenge for the insurance company to design a brand offers low premium but covering a
treatment for a large no of diseases and eventually it will cover maximum number of
prospective customer. Health insurance companies must design the advertisement of these
products that will provide a help line which is customer friendly and will provide ample
information. However, Health insurance is an acute solution of chronic health problem.
Reference –
[1] Berman P, Ahuja R, Bhandari L,2010, “The impoverishing effect of healthcare payments
in India: new methodology and findings”, Econ Polit Wkly 2010, 45(16),65-71.
[2] Bourne A, Paul,2010, “Modelling social determinants of self-evaluated health of poor
older people in a middle-income developing nation”,Journal of Biomedical Science and
Engineering,Vol.3(July),700-710.
[3] Gangopadhyay, Soumik and Ghosh, Bidyut,2011, “Factors Effecting Patient
SatisfactionIn Private Sector Hospitals: A Case Study Of West Bengal”, Indian Journal of
Commerce and Management Studies,Vol.2(6), 102-106.
[4] Garg CC, Karan AK,2009, “Reducing out-of-pocket expenditures to reduce poverty: a
disaggregated analysis at rural-urban and state level in India”, Health Policy Plan,
Vol.24(2),116-128.
[5] Gupta C M; Mahajan K. B,2005, “Textbook of Preventive and Social Medicine”, Jaypee
Brothers Medical Publishers (P) Ltd. New Delhi (Revised third reprint), pp-4-10.
[6] Hazarika, I, 2010, “Medical tourism: its potential impact on the health workforce and
health systems in India”, Health Policy and Planning, Vol.25(3),248-251.
[7] Hazra Jayati,1990, “The changing pattern of diseases in West Bengal, India”, Singapore
Journal of tropical geography,Vol. 10(2),144-159.
[8] Mohammed Shafiu; Sanmbo, N, Mohammad; Dong, Hengjin, 2011, “Understanding
client satisfaction with a health insurance scheme in Nigeria: factors and enrollees
experiences”, Health Research Policy and Systems, 9(1),20-27.
[9] Mukherjee, Subrata; Haddad Slim; Narayana, Delampady,2011, “Social class related
inequalities in household health expenditure and economic burden:evidence from Kerala,
south India”, International Journal for Equity in Health, 10(1),1-13.
[10] Okamoto Etsuji,2007, “Is health a right or an obligation”, International journal of
integrated care,Vol.7 (Jan-Mar),1-12.

Volume:01, Number:03, Jan-2012 : RJCBS Page 36 www.theinternationaljournal.org
[11] Park, K,2010, “Preventive and Social Medicine”, Banarasidas Bhanot Publishers,
Jabalpur, India, pp- 302-340.
[12] Rooijen Reitsma-van Margreet; Jong, D de, Judith; Rijken, Mieke,2011, “Regulated
competition in health care: Switching and barriers to switching in the Dutch health insurance
system”, BMC Health Services Research 2011, 11 (May),95-104.
[13] Tourlouki E, Matalas AL, Panagiotakos DB, (2009). “Dietary habits and cardiovascular
disease risk in middle-aged and elderly populations: A review of evidence”, Clinical
Interventions in Aging, Vol.4,319–330.
[14] WHO, (1998) “The world health report, 1998. Life in the 21st century”. A vision for all.
WHO, Geneva.
[15] http://www.ibef.org/industry/healthcare.aspx (accessed on 06.10,2011)
[16]http://www.irda.gov.in/ADMINCMS/cms/frmGeneral_Layout.aspx?page=PageNo984&f
lag=1&mid=Annual reports >> Annual reports of the Authority (accessed on 06.10,2011)
[17] http://www.ibef.org/artdispview.aspx?in=29&art_id=28453&cat_id=119&page=1
(accessed on 06.08.2010)
[18] http://www.ibef.org/artdisplay.aspx?cat_id=161&art_id=27865 (accessed on
06.08.2010)
***

Volume:01, Number:03, Jan-2012 : RJCBS Page 37 www.theinternationaljournal.org
Book Review --- 99 Thoughts of Ganesha
Mrs Deepali Nilesh Pulekar
Thakur Institute of Management Studies and Research
India
Every chapter of this book has a unique thread of thought for Shree Ganesha. The 99 meditations or
chapters written by the author are well researched and draws us more closure to our much beloved and
favorite God – Ganpati Bappa.
The chapters in this book are well crafted into categories of Creation, Family, Representations,
Stories, Symbols, Temples, Festivals, Rituals, Literature, History, Spread, Wisdom. The book is
descriptive and narrates the bifurcation of 99 meditations starting from creation of Ganesha through a
mythological puzzle. This mythological puzzle communicates the profound truth. The belief of
Ancient Hindus that wisdom should never be given rather has to be taken is well written. The
approaches to understand the Lord through gyan yoga, bhakti yoga and karma yoga is what we human
beings could adapt to when we get ourselves too lost in materialism and the rat race.
The idea of evolution of Ganesha and its birth talks about one being a hermit, or a household wherein
the former withdraws from life and latter faces life fearlessly is a lesson to be learned. The old long
story of how Vinayaka i.e. a child created without the help of man to Ganesha is still carved through
various acts too. Thus, Ganpati as is formerly known the head of ganas, the name so came up after he
was guarding the mother’s cave as she was taking bath.
There is another explanation to the birth of Ganesha which talks about how, he too was different than
his father which is why he was given the elephant head. Ganesha here marks the point when human
consciousness stops being indifferent and willingly engages with the material world. The
transformation of goddess Kali to Gauri. The life taking form and life giving form. Re birth of
Ganesha symbolizes harvest and prosperity. This birth also helps the celebration of India’s two
agricultural cycles rabi and the kharif in autumn. The mythological importance of northern direction
and the qualities of stability and stillness should be looked forward too.
This direction is also ruled by Lord Kubera who is the lord of treasurer. This direction was soughted
by Shiva to get the animal head for Lord Ganesha. The Ganesha’s human body and animal head
reminds us that we have the ability in ourselves to overpower the beast within us that is always afraid.
Lord Ganesha’s celebration is closely associated with wealth and fertility. That’s why he was closely
associated to Airavat, Lord Indra’s elephant. The author has explained the meaning of swastika i.e su
–asti which mean let good things happen. We follow the ritual of writing Shri on wedding cards, key
documents and contracts till date.
The meaning of Shri writing is wonderfully written down. The 99 chapter talks about 2 principles of
certainty and uncertainty. How? if one has to come out of uncertainty remember Ganesha for
acquisition of intellect and wealth and prosperity is very beautifully connected. The scared of the
sound Omkar and its explanation leaves in no doubts. The immediate connect of Ganesha’s feet which
were equal to sound a, Ganesha’s stomach which was equal to y and Ganesha’s head was equal to m.
The turning point of Parshuram’s harsh behaviour towards Ganesh when he guarded the door talks
about a behavioral change from angry warrior to a sage who meditates.
The story of the race between the 2 brothers Lord Ganesha and Karthikeya gives a good moral of
intellect over power. It also conveys the strong value based system that Shiv Parvati and the two sons
possessed. Though the race was won by Shri Ganesh his appreciation of brotherly love by naming
Karthikeya the winner was true spirit of brotherhood. The importance of offering prayers to Lord

Volume:01, Number:03, Jan-2012 : RJCBS Page 38 www.theinternationaljournal.org
Ganesha is highly notified through the incidence when Vyas muni was entangled in his thoughts of
writing the Great Epic of Maharabharat. He was advised to offer prayers to Lord Ganesha and invoke
him for his blessings.
The history, segment, of the book talks about the widespread meteoric rise and increase in
worshippers of Ganesha. The 19th century Ganesh Upanishad has talked about Ganesha being
Syambhu. The other highlight in this segment is that Ganpati is the title that comes in the most of the
Vedas and Hindu Epic.
The analysis done by the author in the segment of wisdom gives us a room to raise appreciate inquiry
about the 2 forms of Ganesha The act of analysis where one focuses on the parts is called Shankya.
The act of analysis where one focuses on the whole is called Yoga.
Morya Gosavi played a key role in making Lord Ganesha a popular god of everyone. In fact,Ganpati
Bappa Morya has evolved after his name. The popularity of Ganesha was very well uphelded by the
Maratha dominance.
The book talks about how one can then finally draw a learning between Shankya – were one starts
recognizing what one actually is and what one is actually not.
***

Volume:01, Number:03, Jan-2012 : RJCBS Page 39 www.theinternationaljournal.org
INVESTOR ATTITUDE ON RISK AND INVESTMENT GOALS
AMONG EXPATRIATE - INDIANS IN OMAN
MOHAMED RAFIQ
Lecturer in Accounts & Finance
Business Studies Department
Nizwa College of Technology
Nizwa Sultanate of Oman
Abstract
The study is exploratory and empirical in nature attempts to understand the mobilization of
savings and levering of the Investment among the expatriates in a multi-cultural environment
like the Oman, utilizing the results of an attitude survey, analyses the motivations of
Expatriate-investors and their attitudes in the participation across a range of the investment
initiatives. It examines the influence of investment education and investment knowledge
in the pattern of their Investment. By using statistical tools the study attempts to evaluate the
association between variables such as investment goals, investor willingness to take risk,
attitude towards Investment portfolio construction etc.
Key words: Investor attitude, Investment goals, risk taking attitude and Investment stress
Volume:01, Number:03, Jan-2012 : RJCBS Page 40 www.theinternationaljournal.org
1.1 Introduction
The present study attempts to understand Mobilization of savings and levering of the
Investment among the Expatriates in a multi-cultural environment like the Oman, utilizing
the results of an attitude survey, analyses the motivations of Expatriate-investors and their
attitudes in the participation across a range of the investment initiatives, enables us to gain an
enhanced understanding of how an individual investor uses Investment education to make
useful Investment decisions. The study also covers the Investor stress, factors causing the
same, attitude over the alternate investment opportunities, the market cycle, reasons for
holding an investment portfolio etc., among expatriate investors in Oman.
2.1. Statement of the Problem
Most of the expatriates in Oman have financial goals but not many of them know how to go
about achieving the same. They lack investment knowledge or expertise to design an
investment plan that maximizes their savings. Consequently, they adopt the default approach
of leaving all the savings in bank deposits. This results in an asset allocation decision, one
that is very conservative. This conservative investment plan is simply not working as the
savings are not compounding fast enough to keep up with inflation. The investor need to
invest more wisely so that the savings earn sufficient returns to pay for essentials, holiday
trips, as well as their retirement plans.
2.1.1 Research Objectives
The specific objectives of this study are listed below:
1. To understand and review the existing literature on the significance of Investor
attitude, factors influencing the attitudes, investment stress and Investor risk taking
behaviour etc.,
2. To study the investor attitude among expatriate investor in Oman and examine the
factors influencing the same.
3. To examine the individual investors’ Investment education and Investment knowledge
in deciding their pattern of Investment.
2.2 Methodology
The study is exploratory and empirical in nature; primary data have been employed for the
study. The study consists of 50 samples, which are collected from the investors in Oman. The
data set include, primary data were collected through a method using structured questionnaire
and secondary data was collected from relevant publications and websites. The data collected
was converted into readable data and was tabulated and analyzed for logical status using
Microsoft-Excel spread-sheets and other appropriate statistical method. In this study, Chi-
square test has been employed to interpret. Suitable hypothesis framed and analyzed to
predict the preference of the investors.
2.2.1 Hypothesis of the study
Hypotheses are set for Chi-square analysis to check whether there was any association
between variables. The variables identified for analysis include; investment goals, investor
willingness to take risk, attitude towards Investment portfolio construction etc.

Volume:01, Number:03, Jan-2012 : RJCBS Page 41 www.theinternationaljournal.org
2.2.2 Data collection
Duration of 6 months was spent for the completion of the research topic and research activity,
carried out mainly in the city of Muscat, Oman among Indian expatriates. This period was
directed towards data gathering and analysis, as well as towards the drafting of reports on the
various phases of the research. The researcher selected samples to represent all segments in
the data. Keeping this fact in view, after identifying the factors influencing the attitude, a
questionnaire was prepared and it was pre tested and necessary modifications were
incorporated in the final draft which was administered for the collection of primary data. By
virtue of data obtained from the research survey, descriptive and analytical tests were carried
out.
2.2.3 Statistical Tools
The questionnaires are entered, verified, and edited using Microsoft-Excel spread-sheets.
Completed questionnaires were analyzed and the tests were calculated by using Microsoft-
Excel 2007 version as the tools of the study. Further, the chi-square test has been employed to
test the relationship between the socio-economic background and the level of attitude of the
respondents.
2.3 Positive and Negative Investor Attitude
An investor with a positive (optimistic) attitude is more likely to make money than one with a
negative (pessimistic) attitude.
Investor with an optimistic attitude
Realizes that not all choices are winners, that over the long run, with patience and
discipline, he will make money.
Sets aside his pride and let’s himself learn valuable investing lessons.
Understands that everyone makes mistakes, including himself and realizes that if you
learn from a mistake, it can be a good thing.
More likely to make money, given the same recommendations than someone who has
a negative attitude.
Likely to be happy at the end of each day, and more likely to start investing with a
positive attitude the next day.
Investor with a pessimistic attitude
Is more likely to give up hope and abandon a successful system and emotions,
More likely to focus on bad investments rather than good ones.
He is more likely to think he is always right, rather than others.
More likely to lose money, given the same recommendations than someone who has a
positive attitude.
More likely to be mad or upset or stressed out at the end of the day and more likely to
bring that back the next morning.
These cycles continue on and on and on...
That is why most successful people are optimists and most unsuccessful people are
pessimists. Investors must learn the value of this quality and always look on the bright side of
life!
2.4 Factors influencing Investment attitude
Everyone experience setbacks from time to time with his/her investments. Sometimes these
setbacks can put one down to the point that one loses the confidence in his/her ability to make
sound investment decisions.
Following factors influence investment attitude and contribute to regain investor confidence

Volume:01, Number:03, Jan-2012 : RJCBS Page 42 www.theinternationaljournal.org
1. Taking full responsibility for one’s own investment decisions and avoid making excuses or
justifying one’s actions is the most important attitude expected of a successful investor.
Excuses are indicators of hidden fears and some time prevent the investor from looking out
for such cases where some one else successfully overcome the situation that the investor is
using as an excuse.
2. Investors must be in the group of associates with positive investment attitude. In doing so,
they develop the supportive habits that attract abundance into your life. Building an excellent
support network of like-minded investors who share a similar investment philosophy or
approach is very essential for positive investment attitude.
3. Investor must focus on what he can change in the moment, not on what has already passed
or could happen in the future. Live your life to the fullest in joy and gratitude one day at a
time. Life should be fun and so should investing.
4. Investor must be busy in stress releasing activities every day, whether physical or mental.
Relieving stress has a positive impact on both mental and physical health. It clears ones’
mind, facilitate better investment decisions.
5. Investor must take positive steps towards changing his/her attitude. Actions speak louder
than words. Identify and focus on those actions that bring about increasing confidence in
his/her abilities. In addition to reading the stock investment book that help improve one’s
investment knowledge, spending more time researching potential stocks gives greater
confidence to his/her investing abilities.
6. Investor ability to learn from failures determines whether or not he will become successful.
He must not take his/her failures personally and let him/her down.
7. Establish short-term goals that one can accomplish within a week or month. Consider goals
that entail networking online more with other investors, finding and connecting with a
mentor, or checking out an investment course to improve a specific gap in one’s investment
knowledge.
Once becoming more confident and better investor, the success stories of investment
continues
2.5 Leveraging the stress of investment
Inevitably people tend to get caught up in the potential returns of an investment and forget to
assess how to deal with the downside risk. And more often than not the problem stems from
their failure to understand the essence of what they are investing in and whether managing
such a strategy would suit their personality, their lifestyle and their risk profile. However this
could and is unnecessary and completely avoidable.
If people actually considered an investment from the point of whether they have the right
equity, time, experience, tenacity or knowledge to learn and manage the investment, then
most investors will find themselves thriving towards their dreams. On top of this in many
cases a poorly structured finance facility adds to a person's problems because they're unable
to gain access to more equity or exit earlier than expected incurring prohibitive costs and
penalties.
In most cases its just time that they need to buy for the situation to remedy itself and well
structured lending facilities will do this provided allowances have been made when the loan
was first established. Experiencing a loss through investment foul, causes a person's
confidence to be shot to shreds so severely that they may never attempt investing again of any
type, all because they were not given the right advice and information.
The road to financial freedom is filled with many lessons to learn so knowing what type of
investment suits you and your personality and having the right lending structure in place, will

Volume:01, Number:03, Jan-2012 : RJCBS Page 43 www.theinternationaljournal.org
not only save you a great deal of heartache, it will enhance your life the way investing is
intended to.
Individuals have different risk tolerances. Investor risk tolerance is the ability and
willingness to assume risk. Ability to assume risk is based on Investor’s chosen asset base,
investment time horizon, and his/her liquidity needs. In other words, investor’s ability to take
investment risks is limited by how much he/she have to invest, how long to invest it, and their
need for portfolio to provide cash—for use rather than reinvestment—in the meantime. Also
willingness to take risk is shaped by his/her ―personality,‖ investment experiences,
knowledge and education. Attitudes are shaped by life experiences, and attitudes toward risk
are no different. Figure 2.5.1, ―Risk Tolerance‖ shows how investor level of risk tolerance
develops.
Figure 2.5.1. Risk Tolerance
3.1 Review of Literature
Before undertaking the study on the motivations of Omani-Expatriate investors, an
exhaustive review of existing literature on the analysis of investor attitudes, in the
participation across a range of urban investment initiatives, enables us to gain an enhanced
understanding of how an individual investor uses information contained in analyst and
management forecasts, reasons for holding an urban regeneration investment portfolio,
evaluate factors and perspectives concerning the attraction of private finance into urban
investment.
In their study, Dhar & Zhu (2006) used investor trading records to investigate individual
differences in the disposition effect. They found that a fifth of the sample exhibited behavior
contrary to the disposition effect. They attributed this to investors' information quality and
ability to analytically process information. Interestingly they found that wealthier, older and
professional investors exhibited less of the disposition effect. They also found that trading
Volume:01, Number:03, Jan-2012 : RJCBS Page 44 www.theinternationaljournal.org
experience reduced the tendency for investors to commit the disposition effect. Individual
behavioral examination of methods to alleviate the disposition effect is a new direction in the
literature. Krishnan & Booker (2002) observed the characteristics which influenced investor
decision making when using analyst recommendations to make a short-term decision to hold
or sell a stock. They found that the 'strength' of the forecasts, which was determined by the
level of detail in the forecast, was a contributing factor in reducing the disposition effect.
When a weak analyst forecast was provided (i.e. no supporting information was provided to
support the analyst recommendation), it was found that it reduced the disposition effect for
gains, but it had no impact on losses. However, when an analyst forecast was strong, it
reduced the disposition effect for both gains and losses. Krishnan &Booker found that
investors had a tendency for regret aversion' consistent with Shefrin & Statman (1985). In
this respect, investors preferred to follow the analysts' recommendations rather than to do the
opposite. This was especially apparent for the strong analyst recommendations for a paper
loss, which is also consistent with loss aversion theory (Odean 1998) where investors were
reluctant to realize their losses. Krishnan & Booker (2002) is significant because it examines
a plausible solution to reduce the disposition effect with the use of detailed analyst forecasts.
More recently, the interrelationship between disclosures provided by management and
analysts has received considerable attention where the latter have been labeled as
accomplices in management's earnings guidance in situations where they have been
manipulated by management in their effort to improve perceived performance (Mittendorf
&Zhang 2005).The central theme of attribution theory is that individuals 'interpret behavior
in terms of its causes and that these interpretations play an important role in determining
reactions to the behavior' (Kelley & Michaela 1980, p. 458). We draw on this framework to
explain our prediction that news that is contrary to investors' expectations will have a greater
influence on their decisions.
Consumer behavior research began in the 1960s but there have been few studies on consumer
decision-making under risk about financial service industry. Financial products investors
often purchase investment products by drawing on experience or through the investment
appraisal process (Harrison, 2003). Therefore, past investment experience and expertise of
investors provides them with risk awareness and so have become important commodity risk
assessment factors in future. Some personal traits such as risk preference, and personal
experience affect risk assessment and awareness.
The propensity to build up risk can further affect actual behavior, where risk refers to how far
decision makers are prepared to extend their exposure to risk . Risk perception forms the
basis of risk communication which means that people facing uncertainty and ambiguity in the
available information, construct inferences and draw conclusions for them. These faculties
determine people’s attitude to risk and their behavior in risk related decisions. Risk
perception is determined from the questions investors ask, their familiarity with
organizational and management systems etc. all of which are important factors. Risk
perception and propensity to risk have a strong negative correlation. In fact, prospect theory
does not deal with the effects of past investor experience on future investment behavior.
Sitkin and Pablo (1992) developed a model of determinants of risk behavior. In this model,
personal risk preferences and past experiences form an important risk factor in which to
frame the problem, and social influence also affects the individual’s perception. Sitkin and
Weingart (1995) extend the Sitkin-Pablo model leading to the definition that risk perception
and propensity are the mediators in risk behaviours of uncertainty decision-making. In this

Volume:01, Number:03, Jan-2012 : RJCBS Page 45 www.theinternationaljournal.org
hypothesis, past investment establishes the frame for the propensity to risk, risk transfer, and
risk awareness which impact decision-making behaviour. Thus risk orientation and risk
perception are reduced to antecedent variables in decision-making behaviour under risk.
Investment experience is an important factor influencing behaviour. Investors with more
experience have relatively high risk tolerance and they construct portfolios of higher risk
(Corter and Chen, 2006). The success or failure of past investor experience influences the
tendencies of investors towards risk and risk perception, and further affects decision-making
behaviour. Kathleen Byrne (2005) shows that risk and investment experience tend to indicate
a positive correlation and past experience of successful investment increases investor
tolerance of risk. Inversely, unsuccessful past experience leads to reduced tolerance to risk.
Therefore past investment behaviour affects future investment behaviour.
The impact of behavioural differences by gender is also an important variable. Female
investors more of often than their male counterparts tend towards risk aversion which is
demonstrated by their more conservative investment behaviour. This claim is evidenced by a
smaller number of market enquiries, lower trading volume and lower frequency of
transactions attributable to females (Fellner and Maciejovsky, 2007). Ronay and Kim (2006)
have pointed out that there is no difference in risk attitude between individuals of different
gender, but between groups of such, males indicate a stronger inclination to risk tolerance.
That is, no gender difference was found at an individual level, but in groups, males expressed
a stronger pro-risk position than females.
Investor perception of risk affects the expected return on investment. In traditional concepts
of finance, it is understood that investors do not welcome risk but that investments with
higher expected rates of return are also understood to bear higher levels of risk. Thus risk and
reward are in positive correlation. However, not all investors possess this knowledge. Despite
a wealth of literature and trained professional opinion supporting the existence of a positive
correlation between risk and return, some novice traders and unskilled investors perceive
expected return to be in negative correlation to risk (Muradoglu, 2005) (Byrne, 2005).
Despite risk perception and the tendency of such to be transmitted and influence the decision
making behaviour, people continue to make investments in the face of uncertainty. This
decision making under risk is reflected in the individual investor’s portfolio construction.
That is, risk perception affects return expectations and asset allocation behaviour
simultaneously. Therefore the expected utility theory based on a traditional finance
perspective cannot explain the anomalous investment behavior of irrational people. Since this
incongruity was noticed, Kahneman and Tversky have proposed prospect theory as a
reasoned theoretical explanation for this phenomenon.
Normal investors are affected by cognitive bias and emotions in decision-making behaviours,
rational investors are not (Statman, 2005). Behavioural Finance scholars have already proven
that the act of engaging in risky decision-making in uncertain circumstances cannot be
considered ―rational‖ and that this descriptor should best be replaced with the more
appropriate ―heuristic‖ in that such decisions are by rule of thumb (they are experience
based). Thus decision-making in such circumstances may be understood without cognitive
bias. Heuristics is an important feature of the individual decision-making process which may
be considered to include thought representativeness heuristics (Tverversky and Kahnemen,
1972, 1973, 1974 and 1982) and availability heuristics (Tversky and Kahneman, 1973 and

Volume:01, Number:03, Jan-2012 : RJCBS Page 46 www.theinternationaljournal.org
1979). It is important here to understand that there is anchoring bias in the decision-making
process which arises due to factors such as overconfidence, loss aversion, status quo bias,
mental accounting, framing and so on. Investors in the process of assessing the risks and
returns are influenced by this anchor effect (Tversky and Kahneman, 1974). Kahneman and
Tversky claim that in the process of assessment, people use certain starting values as
reference points, and that these reference points may be volatile values to which subjects add
necessary adjustments. The KT experiment demonstrates that this adjustment is usually not
reliable and people confronted with different situations produce different anchor values.
Perceptions of risk are affected by anchors, which lead investors to raise their returns
expectations when given a bias/anchor of a higher value.
Behaviour Finance scholars believe in objective consideration of investment risk and return
because these factors can be strongly impacted by subjective framing influences. Decision-
making processes relying on frames often cause problems to be viewed in different ways,
which leads to different choices. Investors in financial markets receive a spectrum of reports
which can be interpreted differently making cognition a factor in the final decision-making
response. Shefrin and Statman (1994) found that noise traders have a greater cognitive bias
than informed traders.
Overconfidence and optimism are further forms of bias. De Bondt (1993) found that
individuals rely on their personal past experience as a foundation and it is from this that
excessive self-confidence in decision-making can originate. Such investors make
inappropriate decisions with insufficient information due to this personal trait (Shefrin and
Statman, 1994). In addition to Overconfidence bias, optimism is an Achilles heel leading to
investment losses. Individuals with this failing often feel they possess an innate talent and in
their optimism, over-rate their own assessment ability (Kahneman and Riepe, 1998). Having
overconfidence and optimism causes people to further overestimate their own knowledge,
underestimate risk, and it even reduces risk recognition.
4.1 Analysis and Interpretation
The data set include, primary data were collected through a method using structured
questionnaire. The respondents include 50 Oman based Indian expatriates of whom 30 were
male and 20 female. The respondents were questioned for their opinion on Investment habit,
saving pattern, period/frequency of investment, preferred investment areas, knowledge of
investments perception on Risk and Return, attitude towards Risk etc.,
The major findings include:-
Investment Knowledge:-
62% of the respondents agreed to have limited to nil knowledge of investment. More
than 50% of the male respondents possess limited to nil knowledge of investment.
28% of the female and 18% of the male respondents with less than AED 5000
monthly income possess limited to nil knowledge of investment.26% of the male and
12% of the female respondents possess good/extensive knowledge of investment.
Investment Goals:-
44% of the respondents have Inflation protection as their investment goal, followed
by significant growth of capital (24%) /capital preservation (20%).Only 12% of the
respondents preferred aggressive growth as their investment goal. Investor with

Volume:01, Number:03, Jan-2012 : RJCBS Page 47 www.theinternationaljournal.org
aggressive growth as their investment goal has Islamic securities /national bonds
/structured products as preferred areas of investment.
Investor risk taking nature:-
82% of the respondents were either average risk takers or low risk takers. 18% of the
respondents who were high risk takers have their investment goals evenly distributed
between - Aggressive growth, Capital preservation, Inflation protection and Sig.
growth of capital. Inflation protection was the most common investment goal among
all categories of risk takers.
Investor attitude:-
66% of the respondents – (42% male and 24% female) were having ―aggressive
investor attitude‖ whereby they would feel worse -Being in the stock market and
seeing their account go down substantially in value.34% of the respondents – (18%
male and 16% female) were having ―conservative investor attitude‖ whereby they
would feel worse - Not being in the stock market and seeing it (index) go up
substantially in value. Of the respondents -60% with average-to-low risk taking nature
were having ―aggressive investor attitude‖ whereby they would feel worse -Being in
the stock market and seeing their account go down substantially in value.
Investor expected return on investment:-
64% of the respondents were expecting return in less than 1 year; out of which 52%
were averages to low risk takers and 12% were high risk takers. 36% of the
respondents were expecting return only after 1 year; out of which 30% were averages
to low risk takers and 6% were high risk takers. Over all only 2 % of the respondents
were expecting return within 3 months and none of the female respondents were
expecting return within 3 months. Maximum number of respondents (62%) had
expected return in 6-12 months. Maximum number of respondents (82%) was either
low or average risk takers.
4.2 Hypothesis testing
Hypotheses are set for Chi-square analysis to check whether there was any association
between the variables investment objectives, investor willingness to take risk, attitude
towards Investment portfolio construction etc
1. Testing for association between investment goals and Risk taking categories of the
respondents: - (Ref: Annexure Table-1)
Null HO: There is no significant association between investment goals and Risk taking
category of the investors.
Alternative HO: There is significant association between investment goals and Risk taking
category of the investors.
Table-1 showing investment goals and Risk taking categories of the respondents
Risk taking category
\ Investment Goals
Average risk
taker
High risk
taker
Low risk
taker
Grand
Total
Aggressive growth 3 2 1 6
Capital preservation 4 2 4 10
Inflation protection 11 2 9 22
Significant growth of
capital 3 3 6 12
Grand Total 21 9 20 50

Volume:01, Number:03, Jan-2012 : RJCBS Page 48 www.theinternationaljournal.org
Chi Square Statistic χ2 Absolute Values= 5.9382, Degree of Freedom= 6.
Table value @ 95% confidence (for 6 degrees of freedom) = 12.59.
The calculated chi-square value, 5.9382 is lower than the critical value at 0.05 and 0.01
significant levels. Hence, we accept the NULL hypothesis and conclude that there is no
relationship between investment goals and Risk taking category of the investors.
2. Testing for association between investment attitude and Risk taking categories of the
respondents Ref: Annexure Table-2)
Null HO: There is no significant association between investment attitude and Risk taking
category of the investors.
Alternative HO: There is significant association between investment attitude and Risk taking
category of the investors.
Table-2 showing investment attitude and Risk taking categories of the respondents
Investment
attitude\ Risk
taking category
Being in the stock
market and seeing my
account go down
substantially in value.
Not being in the stock
market and seeing it
(index) go up
substantially in value Grand Total
Average risk taker 14 7 21
High risk taker 3 6 9
Low risk taker 16 4 20
Grand Total 33 17 50
Chi Square Statistic χ2 Absolute Values=6.0309.Degree of Freedom= 2
Table value @ 95% confidence (for2 degrees of freedom) = 5.99147.
The calculated chi-square value, 6.0309 is higher than the critical value at 0.05
significant levels. Hence, we reject the NULL hypothesis and conclude that there is a
significant relationship between investment attitude and Risk taking category of the
investors.
3. Testing for association between education and investment knowledge and Risk taking
categories of the respondents Ref: Annexure Table-3)
Null HO: There is no significant association between Education and Investment knowledge
of the investors.
Alternative HO: There is significant association between Education and Investment
knowledge of the investors.
Table-3 showing associate Relationship exist between Education and Investment
knowledge
Investment knowledge
Education Extensive Good Limited None
Grand
Total
Graduate 3 8 7 5 23
Post Graduate & Above 2 6 15 4 27
Grand Total 5 14 22 9 50
Chi Square Statistic χ2 Absolute Values=3.21. Degree of Freedom=3
Table value @ 95% confidence (for 3 degrees of freedom) =7.8147.
The calculated chi-square value, 3.21 is lower than the critical value at 0.05 and 0.01
significant levels. Hence, we accept the NULL hypothesis and conclude that there is no
relationship between Education and investment knowledge of the investors.

Volume:01, Number:03, Jan-2012 : RJCBS Page 49 www.theinternationaljournal.org
5.0 Conclusion
Positive attitude enhances the capabilities of Investors. They are able to focus on
opportunities, not obstacles, and are persistent in finding solutions to investment challenges.
Most of the investments of Omani-Expatriates involve investments that are completely
unsuited to them. The reason being is that executives investing in property, stock or
derivative strategies that require a degree of diligence that becomes completely
unmanageable when combined with the day to day demands of their careers. Consequently
they make hasty decisions or fail to act when required and lose significant proportions of
their portfolios. The survey analysis had given clear conclusions that because of the
expatriate investors have limited to nil knowledge of investment and they have Inflation
protection followed by significant growth of capital and capital preservation as their
investment goal and no other aggressive investment goals they can aim at. This was justified
by the fact that 82% of the respondents were either average risk takers or low risk takers. The
age-old fact that that Education coupled with investment knowledge are the essential factors
decides the investment attitude of any Investor, was proved correct once again in the study.
BIBLIOGRAPHY
Web-sites visited:-
1. http://realbusiness.co.uk/news/investor-confidence-on-the-rise
2. http://www.todayonline.com/Commentary/EDC111203-0000040/Charting-your-
financial-goals
3. http://stockinvestingsimplified.com/2011/seven-tips-to-improving-your-investment-
attitude
4. http://www.greekshares.com/pessimistic_optimistic.php
Literatures Reviewed:-
1. Corter,James and Chen Yuh-Jia. ―Do Investment Risk Tolerance Attitudes Predict
Portfolio Risk? ― Journal of Business & Psychology 20, no.3 (Spring 2006): 369-381.
2. De Bondt, Werner F M. ―Betting on trends: Intuitive forecasts of financial risk and
return‖ International Journal of Forecasting 9, no.3 (1993): 355.
3. Dhar, R. & Zhu, N. 2006, 'Up close and personal: Investor sophistication and the
disposition effect'. Management Science, vol. 52, pp. 726-40.
4. Fellner, Gerlinde and Maciejovsky, Boris ―Risk Attitude and Market Behaviour:
Evidence from Experimental Asset Markets.‖ Journal of Economic Psychology 28,
no.3 (June 2007): 338-350.
5. Harrison, Tina. ―Understanding the behaviour of financial services consumers: A
research agenda‖ Journal of Financial Services Marketing 8, no.1 (2003): 6-9.
6. Kahneman, D. and Riepe M. W. ―Aspects of investor psychology‖ Journal of
Portfolio Management, (Summer 1998):52-65. Muradoglu, Yaz Gulnur, Aslihan
Altay-Salih, and Mercan, Muhammet ―A Behavioral Approach to Efficient Portfolio
Formation‖ Journal of Behavioral Finance 6, no.4 (2005): 202-212.
7. Kelley, H. & Michaela, J.L. 1980, 'Attribution theory and research'. Annual Review of
PjycÄo/ogy, vol. 31, pp. 457-501.
8. Krishnan, R. & Booker, M. 2002, 'Investors' use of analysts' recommendations'.
Behavioral Research in Accounting, vol. 14, pp. 129-56.
9. Mittendorf, B. & Zhang, Y. 2005, 'The role of biased earnings guidance in creating a
healthy tension between managers and analysts'. Accounting Review, vol. 80, pp.
1193-209.

Volume:01, Number:03, Jan-2012 : RJCBS Page 50 www.theinternationaljournal.org
10. Shefrin, H. & Statman, M. 1985, 'The disposition to sell winners too early and ride
losers too long: Theory and evidence'. Journal of Finance, vol. 40, pp. 777-92.
11. Shefrin, Hersh and Statman, Meir. ―Behavioral Capital Asset Pricing Theory.‖ Journal
of Financial and Quantitative Analysis 29, no.3, (Sep. 1994): 323-349.
12. Sitkin, S. B. and Pablo, A. L. ―Reconceptualising the Determinants of Risk
Behaviour‖ Academy of Management Review 17, no.1 (1992):9-39.
13. Sitkin, S. B. and Weingart, L. R. ―Determinants of risky decision-making behaviour:
A test of the mediating role of risk perceptions and propensity‖ Academy of
Management Journal 38,no.6 (1995):1573-1582.
14. Tversky, A. and Kahneman, D. ―Judgment under uncertainty: Heuristics and biases‖
Science 185, (1974):1124-1131.
***

Volume:01, Number:03, Jan-2012 : RJCBS Page 51
www.theinternationaljournal.org
TECHNICAL ANALYSIS OF SELECTED INDIAN BANKS
N R Benjamin Franklin
Faculty of Management,
EBET Group of Institutions
India
Abstract
This paper describes about the use of Technical Analysis for traders while taking buying and
selling decisions with the technical analysis done for the stocks of few selected Indian Banks.
Technical analysis is the most useful and consistent approach to trading in the markets.
Simply put, Technical analysis is the art and science of putting stock information on a chart
in the form of various kinds of bars and detecting different patterns indicators tosses the
market direction. While a lot of people know a least a little about technical analysis, very few
really know how to use it. Technical analysis is not an astrological science for predicting
prices and market direction. The main function of technical analysis is to show the current
demand-supply position of the market, or the particular stock, define risk and reward of each
particular trade, Technical analysis is not an end in itself; the end is its effective use for
profitable trading

Volume:01, Number:03, Jan-2012 : RJCBS Page 52
www.theinternationaljournal.org
TECHNICAL ANALYSIS
Technical analysis is the most useful and consistent approach to trading in the markets.
Simply put, Technical analysis is the art and science of putting stock information on a chart
in the form of various kinds of bars and detecting different patterns indicators tosses the
market direction.
While a lot of people know a least a little about technical analysis, very few really know how
to use it. Technical analysis is not an astrological science for predicting prices and market
direction. The main function of technical analysis is to show the current demand-supply
position of the market, or the particular stock, define risk and reward of each particular trade,
Technical analysis is not an end in itself; the end is its effective use for profitable trading.
CHARTS
Charts are the working tools of the analyst. They have been developed in a multitude of
forms and style to represent graphically almost anything and everything that take places in
the market, or to plot an “index” derived there form. They may be monthly charts on which
an entire month’s trading record is condensed into a singles entry, or weekly, daily, hourly,
transaction,” point and figure” candlestick etc.
They may be constructed an arithmetic, logarithmic, or square-root scale, or projected as
“oscillators” they may delineate moving averages, proportion of trading volume to prices
movement, averages price of “most active” issues odd-lot transactions the short interest and
an infinitude of others relations, ratios, and indexes-all technically in the sense that they are
derived, directly or indirectly, forms what has actually been transacted on the exchange.
SPECULATION
Contrary to what many people believe, speculation is not gambling. Speculation is the skill of
analyzing data and taking positions on the various market situations to profits from favorable
price movements. In the stock market arena, this activity is also called trading.
OBJECTIVES OF THE STUDY
To study the suitable method of predicting price movement through technical analysis.
To evaluate previous frame to know entry and exit level of trading
To identify the buy signal and sell signal through chart movements with help of indicator
RESEARCH DESIGN
Analytical research design is adopted in this project. The main characteristic of this method is
that the researcher has no control over the variable. In this method the facts or information
are used which are already available, and analyze these to make a critical evolution of the
material.

Volume:01, Number:03, Jan-2012 : RJCBS Page 53
www.theinternationaljournal.org
The shares are chosen from the NSE India site, which are actively and highly traded
industries in the past one year.
No. Of Years : 1 year
No. Of Sectors : Bank
No. Of Companies : 5 companies
One year financial data collected from the bank sectors.
Year taken for study : 2010
SOURCES OF DATA:
The study is based on secondary data. The main sources of data are collected through
websites such as nseindia.com, bseindia.com, money control.com, Indiabulls.com and
Charting Software’s.
TOOLS USED FOR ANALYSIS
Moving average, Support and Resistance level
INTERPRETATION OF MARKET MOMENTUM
The following steps need before making any analyses of stocks. Because in technical
analysis we are concerned with identifying trend reversal at a relatively early stage and
assume that the new trend will continue riding that the new trend will continue riding that
trend until it reversal.
RESISTENCE AND SUPPORT LEVEL
Resistance
In simple words the meaning of resistance is opposition. As the name indicates, it opposes the
share price going in upper direction. It is the level where share price may stop before
continuing its upper journey.
But if the buying starts from all sides then no resistance come into picture the resistance level
is just broken and share price will continue its upward journey. To break the resistance level
volumes also play the major role.
If the share price moves above the resistance level with huge support of volumes then it is
considered as confirm up trend.
Once the resistance is broken then the share moves till its next resistance level or go in
consolidation (share movement with very less price variation) phase and then after getting
appropriate buying with good support of volumes then it tries to break its next resistance
level and will proceed and this continues.
The major bullish resistance is considered as 200 DMA (daily moving average) As long as
the share or index is trading above this level then it is considered as bullish or if share or
index moves from bottom and breaks this level then further upside is confirmed and on the
opposite side if the 200 DMA is broken from above then the down trend will continue and

Volume:01, Number:03, Jan-2012 : RJCBS Page 54
www.theinternationaljournal.org
this is what happened with Nifty and Sensex when they broke their 200 DMA in January
2008. Market has seen more than 60% fall after the broke of 200 DMA support level.
Resistance broken will act as support level (in case of moving average method)
SUPPORT LEVEL
As the name indicates it provides support for to share price to prevent it from falling further.
If the share price starts falling then it is expected that it may take halt at its support level but
if the selling and especially short selling is taking place then no support will comes into
pictures. If the selling pressure is from all sides then it may or may not take halt or wait near
its support level and will continue its downward journey till it finds next support levels.
MOVING AVERAGE
The market indices do not rise or fall in straight line. The upward and downward movements
are interrupted by counter moves. The underlying trend is studied by smoothing of the data.
To smooth the data moving average technique is used. The word moving means that the
body of the data moves ahead to include the recent observation. If it is six months moving
averages.
STOCK PRICES AND STOCK PRICES MOVING AVERAGE
Stock prices and stock prices moving average buy and sell signals are provided by the
moving averages. Moving averages are used along with the price of the scrip. The stock
price may intersect the moving average at a particular point. Downward penetration of the
rising average indices the possibility of a further falls. Upward penetration of a falling
average would indicate the possibility of the further rise and gives the buy signal

Volume:01, Number:03, Jan-2012 : RJCBS Page 55
www.theinternationaljournal.org
DATA ANALYSIS
6 MONTHS MOVING AVAREGE, JULY TO DECEMBER 2011
AXISBANK, ISIN: INE238A01026, Industry: Banks
CHART 1
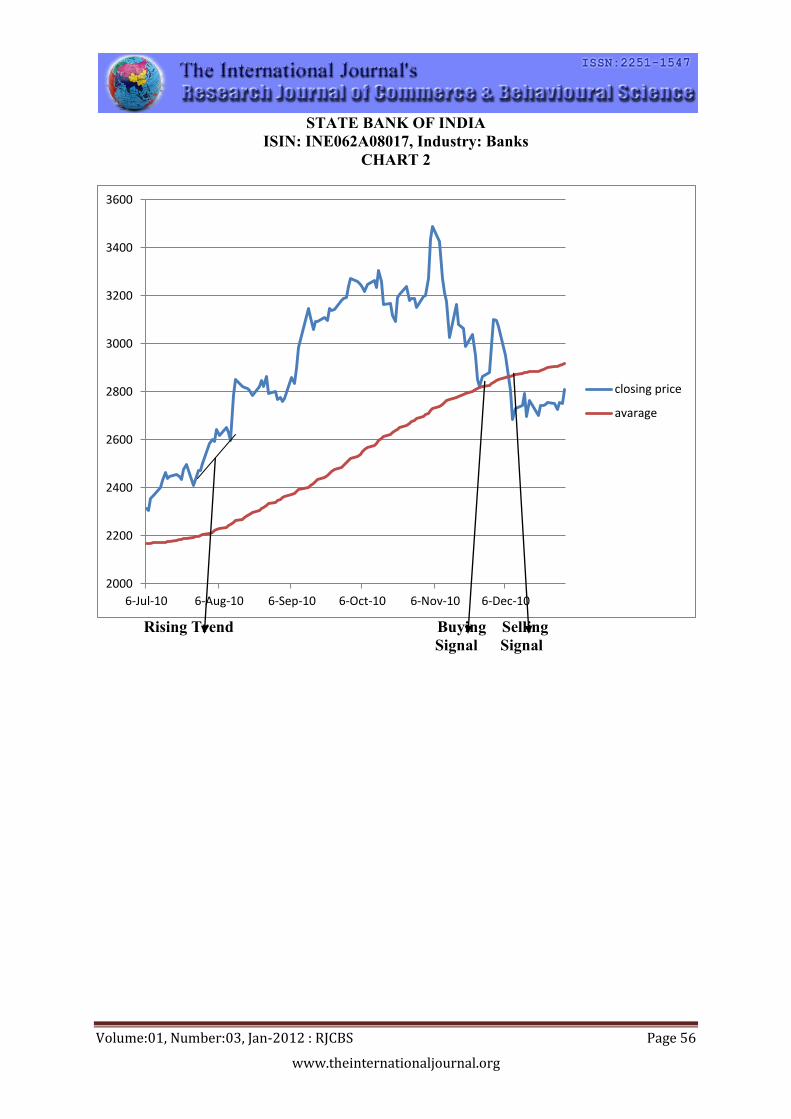
Volume:01, Number:03, Jan-2012 : RJCBS Page 56
www.theinternationaljournal.org
STATE BANK OF INDIA
ISIN: INE062A08017, Industry: Banks
CHART 2
Rising Trend Buying Selling
Signal Signal
2000
2200
2400
2600
2800
3000
3200
3400
3600
6-Jul-10 6-Aug-10 6-Sep-10 6-Oct-10 6-Nov-10 6-Dec-10
closing price
avarage

Volume:01, Number:03, Jan-2012 : RJCBS Page 57
www.theinternationaljournal.org
ICICI BANK
ISIN: INE090A01013 | Industry: Banks
CHART 3
Flat trend line Falling trend line Rising trend line
FINDINGS
STOCK PRICE AND STOCK PRICES AVERAGE
The technical analysis studies the behavior of the price of the stock to determine the future
price of the stock. Stock price and stock price average is a tool for investors.
The moving average of the stock penetrates the stock market index from above; it generates
sell signals, and unfavorable market conditions that prevail for the particular scrip. Investors
have to concentrate on all information of shares. Not in moving average alone.
800
850
900
950
1000
1050
1100
1150
1200
1250
1300
6-Jul-10 6-Aug-10 6-Sep-10 6-Oct-10 6-Nov-10 6-Dec-10
Closing price
average price
Volume:01, Number:03, Jan-2012 : RJCBS Page 58
www.theinternationaljournal.org
BIBLIOGRAPHY
BOOKS
Technical analysis of stock trend - by Robert D. Edward & Magee
Martin Pring on market momentum - by Martin J. Pring
Technical analysis A to Z- by Steven B. Achilles
Business world magazines
Business line news paper
Security analysis and portfolio management - punithavathi pandiyan
WEBSITES
www.nseindia.com
www.bseindia.com
www.trendwatchindia.com
www.technicaltrends.com
www.chartschool.com
***

Volume:01, Number:03, Jan-2012 : RJCBS Page 59 www.theinternationaljournal.org
PRE AND POST ACQUISITION PERFORMANCE OF
PUBLIC AND PRIVATE SECTOR BANKS IN INDIA
Prof. Shanmugam venkatesan
Assistant Professor
Hindustan College of Arts & Science
India
Krishnan reddiyar Govindarajan
Professor, Department of Commerce
Annamalai University
Chidambaram, Tamil nadu
India
Abstract
In this paper we examine performance of public and private banks before and after
their activities acquiring other financial institutions. The merger and acquisitions activities of
the public sector and private sectors banks in India between 1995 and 2006 are considered for
the study. The performance of acquiring banks is undertaken based on ratio analysis. The
ratios pertaining to liquidity, activity, solvency and profitability are used to evaluate the
performance between two periods. Results of the empirical analysis shows that there is a
significant difference in the activity, solvency and profitability between pre and position
acquisition period for public sector banks. For private sectors banks, a strong difference in
liquidity status between two period are found. This study suggests that performance of public
and private sector banks is affected by their M & A activities.
Key Words: Merger and Acquisition (M & A), Interest spread and Parametric t-test

Volume:01, Number:03, Jan-2012 : RJCBS Page 60 www.theinternationaljournal.org
Introduction
Mergers and acquisitions (M&A) within the Indian financial sector have changed the
Indian banking landscape tremendously in the past two decades. The Indian banking sector
has witnessed significant structural changes that resulted in its consolidation through a large
number of mergers and acquisitions (M&As) and increased cross-shareholdings. Also, in
many countries, especially where smaller banks were active, the growth in M&As was
attributed to banks’ desire to increase in size in order to obtain gains in terms of market
power and/or efficiency.
While the bulk of the research on the financial performance of mergers and
acquisitions has focused on stock returns around the merger announcement, there are very
few research work in this area focusing on effect of M & As on firm performance by
comparing the various financial ratios between pre and post event period. In particular,
mergers have had a positive effect on key financial ratios of firms acquiring domestic firms
while a slightly negative impact on the firms acquiring cross-border firms. Therefore here an
attempt is made to evaluate the performance of acquiring banks based on comparing key
financial ratios before and after acquisition period of 5 years. The liquidity ratios, activity
ratio and profitability ratios during pre and post acquisition periods are compared. This study
analyses 11 mergers in the Indian banking sector between 1995 and 2006 to capture the effect
of M & A on firm performance.
Review of Literature
Measuring the performance of M&A deals has been a difficult problem for many
researchers. Scholars have used different techniques in the form of ratio analysis and
comparative analysis to identify the effects of M&A on acquiring companies. Rao and Sanker
(1997) found that there was a significant improvement in liquidity, leverage, and profitability
for acquiring firms. A majority of the acquiring firms were found to have some meaningful
synergies. In addition, the return on capital and return on total assets were increased
significantly. The risks, measured by variability in the earnings, of pre-merger firms were
found to be higher than that of post- merger firms (Kumar and Bansal, 2008). M&A activities
were also identified to improve the overall operational efficiency of acquirers at a significant
level. On the contrary, some studies revealed a mixed or negative impact of M&A deals on
acquirers’ performance. Selvam. M (2007), in his study on stock price reactions to mergers
and acquisitions activities taken place in banking industry with special reference to private
and public sector banks, has observed that M & A activities has affected profitability to some
extent and resulted in unhealthy competition among the players. Pawaskar (2001) found that
M&A did not result in improved performance or excess profit for the acquiring firms.
Instead, the only significant gains were through an increased leverage of the acquired firms.
In another study with ratio analyses, earning to equity ratio, liquidity ratio, and size ratio,
were founded to have positive effect on the for the targets, whereas pre-tax profit turned out
to be significantly negative (Renganathan, 1995).
Statement of the Problem
The Merger and Acquisitions have become one of the crucial strategic issues in the
banking industry in India nowadays. Although acquiring banks have frequently experienced
deteriorated post-acquisition performance that has reduced shareholders’ wealth, the M & A
is still one of the most common strategic instruments for expansion or restructuring. It is
known that acquisitions have a tremendous impact on the industry, but there is a definite lack
of comprehensive and systematic research about the underlying structure of the mergers and

Volume:01, Number:03, Jan-2012 : RJCBS Page 61 www.theinternationaljournal.org
acquisitions (M&A) phenomenon in the banking industry. Particularly there is a lack of
comprehensive research on financial performance combining M & A activities of banks
under public and private sector. So, the present research is undertaken to find out whether
expansion or restructuring of banks through M & A activities has improved the financial
performance or not.
Objectives of the Study
The present research work is carried out with objective of finding out the effect of M
& A activities on financial performance of all banks under public and private sectors by
comparing various ratios between pre and post-event period of five years.
Hypothesis
The following null hypotheses are framed for the present study:
(a) There is no significant difference in pre and post acquisition performance of Public
sector banks.
(b) There is no significant difference in pre and post acquisition performance of Private
sector banks
Methodology
Sample
A sample of bank merger announcements announced during the years between 1996
and 2006 are considered for the study (See Appendix). The merger announcements by banks
in both public and private sectors are taken into account.
Period of the Study
The M & A activities of banks under private and public sectors during the period from
1999 to 2004 are undertaken. However, for evaluating financial performance, the required
data for five years before and after M & A event are collected. Therefore, in respect of data,
the study period is 16 years from 1st April 1994 to 31
st March 2009.
Data
The present study is relied on secondary data, which are the financial statements for
five years before and after the M & A announcement years. The required data were gathered
from PROWESS data base.
Design
In order to evaluate the effect of Merger and acquisition activities of public and
private sector banks on their performance, ratio analysis method is adopted. The ratios
pertaining to liquidity (Current ratio, Quick ratio and Cash asset ratio), activity (Total income
to Net working capital, Total income to Total Assets ratio and Total income to Fixed asset
ratio), Solvency (Proprietary ratio and Credit / Deposit ratio) and profitability (Net profit
margin, Return on net worth and Return on capital employed) are calculated for pre and post
period of five years separately and ratios between two period are compared. A brief
explanation of above ratios are given below:
Current Ratio (CR)
The current ratio is the ratio used for testing the basic liquidity of a company. It
comprises of cash, accounts receivable, marketable securities, prepaid expenses, etc. It

Volume:01, Number:03, Jan-2012 : RJCBS Page 62 www.theinternationaljournal.org
signifies a company's ability to meet its short-term liabilities with its short-term assets. A
current ratio greater than or equal to one indicates that current assets should be able to satisfy
near-term obligations. A current ratio of less than one may mean the firm has liquidity issues.
Current Ratio = (Current Assets) / Current Liabilities
Quick Ratio (QR)
The quick ratio is a tougher test of liquidity than the current ratio. It eliminates certain
current assets such as prepaid expenses that may be more difficult to convert to cash. Like the
current ratio, having a quick ratio above one means a company should have little problem
with liquidity. The higher the ratio, the more liquid it is, and the better able the company will
be to ride out any downturn in its business.
Quick Ratio = (Cash + Accounts Receivable + Short-Term or Marketable
Securities) / (Current Liabilities)
Cash Asset Ratio (CSHRAT)
This ratio indicates a conservative view of liquidity such as when a company has
pledged its receivables and its inventory, or the analyst suspects severe liquidity problems
with inventory and receivables. It is calculated as follows:
Cash Asset Ratio = Cash Equivalents + Marketable Securities / Current
Liabilities
Total Income to Working Capital Ratio (TIWC)
Indicates efficient use of working capital in generating income. A low ratio indicates
inefficiency, while a high level implies that the company's working capital is working too
hard.
TIWC = Total Income / Working capital
Total Income to Total Asset Ratio (TITOAST)
Measures the activity of the assets and the ability of the business to generate income
through the use of the assets.
TITOAST = Total Income / Total Assets
Total Income to Net Fixed Asset Ratio (TITONFA)
Measures the capacity utilization and the quality of fixed assets. It is calculated as
follows:
TITONFA = Total income / Net Fixed Assets
Interest Expended to Interest Earned Ratio (INTEXPEARN)
Indicates the relationship between interest expended on deposits and interest earned
on lending. This ratio is also called interest spread ratio. The formula for this ratio is:
INTEXPEARN = Interest Expended / Interest Earned
Proprietary Ratio
This ratio exposes the relationship between shareholders’ capital and total assets. The
shareholders’ capital consist of equity paid up and reserves less accumulated loss. This ratio
is used by the investors to know how safety a bank against losses and insolvency.
Proprietary Ratio = Shareholders’ Capital / Total Assets * 100

Volume:01, Number:03, Jan-2012 : RJCBS Page 63 www.theinternationaljournal.org
Credit Deposit Ratio
This ratio is used to assess short-term solvency position of a bank. The ratio is nothing
but proportion of advances to deposits. Advances includes loans, cash credit, overdrafts and
bills discounted. This ratio indicates how effectively the deposits of the bank have been
utilized for generating revenue.
Credit Deposits Ratio = Advances / Deposits
Net Profit Margin (NPM)
The profit margin tells you how much profit a company makes for every one rupee 1
it generates in revenue or sales. Profit margins vary by company (firm or industry), but all
else being equal, the higher a company's profit margin compared to its competitors, the better.
It is calculated as:
NPM = Net Profit After Tax / Total Income
Return on Net Worth (RONW)
This ratio is used to analyze the ability of the firm’s management to realize an
adequate return on the capital invested by the owners of the firm. Tendency is to look
increasingly to this ratio as a final criterion of profitability. The formula is:
RONW = Net Profit After Taxes / Net Worth (Shareholders’ Equity)
Return on Capital Employed (ROCE)
Return on capital employed (ROCE) is the rate of return a business is making on the
total capital employed in the business. Capital will include all sources of funding
(shareholders funds + debt). To be consistent with this the return should be taken prior to
interest (the return to lenders) and tax. It is therefore
ROCE = PBIT / (Total Assets – Current Liabilities)
Statistical Tool
The statistical significance of the difference in ratios between pre and post event
period of five years are tested using parametric t-test.
Results and Discussion
It can be seen from Table I that the liquidity position of the public sector banks in
terms of CR, QR and Cash Ratio tend to experience with trivial decline against their deals
associated with acquisition of other banks. The scenario is reverse in the case of turning
working capital into earnings That is, efficient use of working capital do not differ between
periods.
Regarding their activities, in turning their total assets and fixed assets into generating
income, there has been remarkable decline after acquisition activities. That is, the TITOAST,
on an average for five years, 0.0977 times in pre-period has declined to 0.0808 times in post-
period and the difference in these two values is significant at 1 per cent level (t value = 6.58,
p < 0.01). Similarly, the TITONFA on an average for 5 years has significantly declined to
11.8737 times during post-period from 14.2371 times in pre-period (t-value = 1.71, p < 0.10).
At the same time interested expended to interest earned, which is 0.7781 times in pre-period
has declined significantly to 0.6874 times in pre-period (t-value = 2.04, p < 0.05). A
significant increase of proprietary ratio of 0.0489 times in pre-period to 0.0599 times in post-
period (t-value = -3.74, p < 0.01), it is apparent that there has been a remarkable increase in

Volume:01, Number:03, Jan-2012 : RJCBS Page 64 www.theinternationaljournal.org
owners’ equity relative to total assets after acquisition activities of public sector banks.
Similarly, there has also been a notable increase in extending credit to the customers relative
to mobilization of deposits from 0.5189 times in pre-period to 0.5723 times in post-period (t-
value = -2.80, p < 0.01).
As far as the profitability is concerned, RONW and ROCE, on an average for five
years before and after acquisition event remain same. That is, there is no remarkable
difference in these two profitability ratios between two period. However, Net earnings (Net
profitability margin) on the average for five years, which stood at 5.83 per cent in pre-period,
has increased significantly to 8.73 per cent in post-period (t-value = -3.82, p < 0.01). On the
whole, it is concluded that the M & A activities of public sector banks have significant
negative effect on utilization of assets in generating income but there has been a positive and
significant influence on interest spread (interested expended relative to interest earned),
owners’ capital and advances to deposits (solvency) as well as on making profit net of all
expenses.
The financial performance of private sector banks before and after their acquisition
activities are evaluated by comparing various ratios pertaining to liquidity, activity and
profitability between pre and post period 5 years and the results of the analysis are presented
in Table II. It can be observed from the table that the performance of private banks during
five years after acquiring other banks is not attractive. The liquidity position become weak
during post-event period of 5 years. The CR, QR and CSHRAT, which is 4.3040 times,
4.2690 times and 3.2822 times on an average in pre-event period of five years has declined
significantly to 1.3430 times (t-value = 4.29, p < 0.01), 1.2050 times (t value = 4.43, p <
0.01) and 0.9293 times (t-value = 4.12, p < 0.01) on an average during post-event period of
five years respectively.
At the same time, efficiency in utilization of working capital for generating income is
unaffected by the acquisition activities. That is, decline in TIWC from 1.1448 times in pre-
period to 1.0834 times in post-period is trivial. However, efficiency of the private sector
banks in generating income relative to assets has come down significantly from 0.0931 times
in pre-period to 0.0700 times in post-period (t value = 2.09, p < 0.05). It can be seen that ratio
of interest expended to interest earned is 0.7697 times in pre-period has declined to 0.6828
times in post-period, but there is no significant difference in mean ratios. That is there is no
notable change in interest spread due to acquisition activities of private sector banks. At the
same time, owners’ fund in total investments has come down from 0.1780 times in pre-period
to 0.0731 times in post-period. On the other hand, lending credit to the customer against
mobilization of deposits has increased significantly from 0.4638 times to 0.7889 times
between pre and post acquisition periods (t-value = -2.63, p < 0.01).
As far as the effect of acquisition activities on profitability of the private sector banks
is concerned, no notable change in NPM as well as in RONW (t-value is insignificant)
between pre and post period of five years is found. However, the profitability, on an average
for 5 years, relative to capital employed has declined at marginal level from 11.5430 per cent
in pre-period to 7.5140 per cent in post period (t-value = 1.84, p < 0.10). Hence, from the
results comparing the liquidity, activity, solvency and profitability ratios, between pre and
post-acquisition period of five years, it is found that the deals acquiring other limited banks
by private sector banks have significant negative effect on their liquidity position as well as
on their overall financial performance.
Conclusion
Out empirical analysis of financial performance against acquisition activities of public
and private sector banks has led to the finding that the performance of private sector banks is

Volume:01, Number:03, Jan-2012 : RJCBS Page 65 www.theinternationaljournal.org
found to be better in pre-period compared to their performance in post-acquisition period. It
is further found that there is notable change in liquidity position of the public sector banks
due to their acquisition activities whereas there has been significant decline in their activities
in turning their assets for generating income. It is however found that the net earnings of
public sector banks has increased significantly after acquiring other banks likely due to a
notable decline in interest expended relative to interest earned. Overall, the performance of
public sector banks in terms of generating income relative to their investment in fixed assets
is significantly and negatively affected whereas their performance in respect of their net
earnings is positively influenced by acquisition deals due to increase in interest spread. The
deals pertaining to acquiring other (private limited) banks by private sector banks have
significant negative effect on their liquidity position as well as on their overall financial
performance. Hence, both hypotheses are rejected and alternatively it is concluded that there
is impact of M & A on financial performance of both Public and Private sector banks in
India.
Table I
Comparison of Various Ratios between Pre and Post Acquisition Period of 5 Years for
PUBLIC Sector Banks
Financial Ratios Pre Period Post Period t-value
Mean
(SD)
Mean
(SD)
Current Ratio (CR) 4.3106 3.8920 0.81
(2.1958) (2.1057)
Quick Ratio (QR) 4.0520 3.6746 0.77
(2.1019) (1.9829)
Cash Ratio (CSHRAT) 3.1506 2.9334 0.57
(1.6893) (1.4826)
Total Income to Net Working Capital
(TIWC)
0.8686 0.9192 -0.47
(0.4890) (0.4084)
Total Income to Asset Turnover Ratio
(ASTTO)
0.0977 0.0808 6.58***
(0.0077) (0.0131)
Total Income to Fixed Asset Turnover Ratio
(FATO)
14.2371 11.8737 1.71*
(6.9422) (4.3268)
Interest Expended to Interest Earned 0.7781 0.6874 2.04**
(0.1882) (0.1838)
Proprietary Ratio 0.0489 0.0599 -3.74***
(0.0150) (0.0088)
Credit Deposit Ratio 0.5189 0.5723 -2.80***
(0.0640) (0.0929)
Net Profit Margin (NPM) 0.0583 0.0873 -3.82***
(0.0340) (0.0293)
Return on Net Worth (RONW) (%) 14.6846 15.2780 -0.51
(4.7653) (4.9911)
Return on Capital Employed (ROCE) (%) 9.7034 10.4354 -0.68
(4.6332) (4.3074)
Figures in brackets are standard deviation
***Significant at 1% level; **Significant at 5% level; *Significant at 10% level

Volume:01, Number:03, Jan-2012 : RJCBS Page 66 www.theinternationaljournal.org
Table II
Comparison of Various Ratios between Pre and Post Acquisition Period of 5 Years for
PRIVATE Sector Banks
Financial Ratios
Pre Period Post Period
t-value Mean
(SD)
Mean
(SD)
Current Ratio (CR) 4.3040 1.3430 4.29***
(2.1378) (0.4496)
Quick Ratio (QR) 4.2690 1.2050 4.43***
(2.1491) (0.3992)
Cash Ratio (CSHRAT) 3.2822 0.9293 4.12***
(1.7695) (0.3569)
Total Income to Net Working Capital
(TIWC)
1.1448 1.0834 0.09
(1.6130) (1.4728)
Total Income to Asset Turnover Ratio
(ASTTO)
0.0931 0.0700 2.09**
(0.0267) (0.0227)
Total Income to Fixed Asset Turnover Ratio
(FATO)
2.9560 3.9700 -1.64
(1.1944) (1.5405)
Interest Expended to Interest Earned 0.7697 0.6528 1.31
(0.2537) (0.1240)
Proprietary Ratio 0.1780 0.0731 1.51
(0.2188) (0.0109)
Credit Deposit Ratio 0.4638 0.7889 -2.63**
(0.1926) (0.3393)
Net Profit Margin (NPM) 0.1295 0.1296 -0.004
(0.0636) (0.0287)
Return on Net Worth (RONW) (%) 16.5110 16.0950 0.11
(9.2116) (7.5001)
Return on Capital Employed (ROCE) (%) 11.5430 7.5140 1.84*
(4.1188) (5.5644)
Figures in brackets are standard deviation
***Significant at 1% level; **Significant at 5% level; *Significant at 10% level

Volume:01, Number:03, Jan-2012 : RJCBS Page 67 www.theinternationaljournal.org
References
Healy, P.M., Palepu, K.G., and Ruback, R.S. (1992) Do Mergers Improve Corporate
Performance?, Journal of Financial Economics, 31(2), pp. 135-175
Mishra, P. (2005) Mergers and Acquisitions in the Indian Corporate Sector in the Post-
Liberalization Era: An Analysis, Ph.D Dissertation, (West Bengal: Vidyasagar University)
Dickerson, A. P., Gibson, H. D., and Tsakalotos, E. (1997), "The Impact of Acquisitions
onCompany Performance: Evidence from a Large Panel of UK Firms,” Oxford Economic
Papers, 49(3), pp. 344-61.
Selvam, M. 2007. Mergers and Acquisitions in the Banking Sector- The Indian Scenario.
S.Viswanathan (Printers & Publishers) Pvt. Ltd.
Pawaskar, V. (2001) Effect of Mergers on Corporate Performance in India, Vikalpa, 26(1),
pp.19-32
Rao K V and Sanker K R (1997), “Takeover as a Strategy of Turnaround”, UTI Edited book,
pp. 47-56
Renganathan V S (1995), “Takeover of industrial firms in india: an empirical analysis”,
Prajanan, Vol. 24, No. 2, pp.103-110.
Satish Kumar, Lalit K. Bansal, (2008) "The impact of mergers and acquisitions on corporate
performance in India", Management Decision, Vol. 46 Iss: 10, pp.1531 – 1543
Appendix
Particulars of Bank Mergers Between 1996 and 2006
Acquiring Banks Target Banks Event Date
PUBLIC SECTOR BANKS
Bank of Baroda Barelly Corporation Banks Ltd 03.06.1999
Bank Of Baroda Banaras State Bank Ltd 20.07.2002
Bank Of Baroda South Gujarat Local Area Bank Ltd 25.06.2004
Oriental Bank Of Commerce Punjab Co.op Bank and
Bari Doab Bank Ltd 08.04.1997
Oriental Bank Of Commerce Global Trust Bank Ltd 14.08.2004
Punjab National Bank Nedungadi Bank Ltd 01.02.2003
State Bank Of India Kashinath Seth Bank 01.01.1996
PRIVATE SECTOR BANKS
H D F C Bank Ltd. Times Bank Ltd 26.02.2000
I C I C I Bank Ltd. Bank of Madura 10.03.2001
***